Hypsometric analysis of headwater rock basins in the Dolomites (Eastern Alps) using high- 1 resolution topography 2 3 Lorenzo Marchi 1 , Marco Cavalli 1 , Sebastiano Trevisani 2 4 1 IRPI, CNR, Padova, Italy 5 2 Department of Architecture, Construction and Conservation, Università IUAV di Venezia, 6 Venezia, Italy 7 8 Marchi, L., Cavalli, M. and Trevisani, S., 20xx. Hypsometric analysis of headwater rock basins in 9 the Dolomites (Eastern Alps) using high-resolution topography. Geografiska Annaler, Series A: 10 Physical Geography, xx, xxx–xxx. doi:10.1111/j.1468-0459.20xx.xxxxx.x 11 12 ABSTRACT. Hypsometric curves and integrals are effective tools for rapid quantitative 13 assessments of topography. High-resolution digital terrain models derived from airborne LiDAR 14 data have been analysed to study the hypsometry of small headwater rock basins (drainage areas up 15 to 0.13 km 2 ) in three study areas in the Dolomites (Eastern Alps) that have similar lithologies and 16 climatic conditions. Hypsometric curves in the studied rocky headwaters display a variety of shapes 17 and present remarkable differences between neighbouring basins. Hypsometric integrals show 18 generally high values in the three study areas (> 0.42, mean values between 0.51 and 0.65). The 19 extent of the scree slopes located at the foot of rock basins in the three study areas is larger in the 20 area with lower hypsometric integrals and indicates consistency between the development of basin 21 erosion, which is shown by the hypsometric integral, and debris yield, which is represented by the 22 extent of scree slope. No clear relations were observed between the hypsometric integrals and basin 23 area and shape. When extending the analysis to larger basins, which encompass rocky headwaters 24 and downslope soil-mantled slopes, a negative correlation is found between the hypsometric 25 integral and catchment area, suggesting that the scale independency of the hypsometric integral 26 occurs essentially in headwater rock basins. Geomorphometric indices (residual relief and surface 27 roughness) have contributed to interpreting the variability of surface morphology, which is related 28 to the geo-structural complexity of the catchments. 29 30 Key words: hypsometry, hypsometric integral, rock basin, geomorphometry, Dolomites 31 32 Introduction 33 Page 1 of 40 Geografiska Annaler: Series A, Physical Geography

Welcome message from author
This document is posted to help you gain knowledge. Please leave a comment to let me know what you think about it! Share it to your friends and learn new things together.
Transcript

Hypsometric analysis of headwater rock basins in the Dolomites (Eastern Alps) using high-1
resolution topography 2
3
Lorenzo Marchi1, Marco Cavalli
1, Sebastiano Trevisani
2 4
1 IRPI, CNR, Padova, Italy 5
2 Department of Architecture, Construction and Conservation, Università IUAV di Venezia, 6
Venezia, Italy 7
8
Marchi, L., Cavalli, M. and Trevisani, S., 20xx. Hypsometric analysis of headwater rock basins in 9
the Dolomites (Eastern Alps) using high-resolution topography. Geografiska Annaler, Series A: 10
Physical Geography, xx, xxx–xxx. doi:10.1111/j.1468-0459.20xx.xxxxx.x 11
12
ABSTRACT. Hypsometric curves and integrals are effective tools for rapid quantitative 13
assessments of topography. High-resolution digital terrain models derived from airborne LiDAR 14
data have been analysed to study the hypsometry of small headwater rock basins (drainage areas up 15
to 0.13 km2) in three study areas in the Dolomites (Eastern Alps) that have similar lithologies and 16
climatic conditions. Hypsometric curves in the studied rocky headwaters display a variety of shapes 17
and present remarkable differences between neighbouring basins. Hypsometric integrals show 18
generally high values in the three study areas (> 0.42, mean values between 0.51 and 0.65). The 19
extent of the scree slopes located at the foot of rock basins in the three study areas is larger in the 20
area with lower hypsometric integrals and indicates consistency between the development of basin 21
erosion, which is shown by the hypsometric integral, and debris yield, which is represented by the 22
extent of scree slope. No clear relations were observed between the hypsometric integrals and basin 23
area and shape. When extending the analysis to larger basins, which encompass rocky headwaters 24
and downslope soil-mantled slopes, a negative correlation is found between the hypsometric 25
integral and catchment area, suggesting that the scale independency of the hypsometric integral 26
occurs essentially in headwater rock basins. Geomorphometric indices (residual relief and surface 27
roughness) have contributed to interpreting the variability of surface morphology, which is related 28
to the geo-structural complexity of the catchments. 29
30
Key words: hypsometry, hypsometric integral, rock basin, geomorphometry, Dolomites 31
32
Introduction 33
Page 1 of 40 Geografiska Annaler: Series A, Physical Geography

Hypsometric curves and hypsometric integrals are well-known and widely used tools for the 34
analysis of the distribution of elevations, which is an important component of the characterisation of 35
the solid earth surface (e.g., Mark, 1975; Miller et al., 1990; Ohmori, 1993; Brocklehurst and 36
Whipple, 2004; Korup et al., 2005; Cohen et al., 2008). Hypsometric curves represent the fraction 37
of area above a given elevation and are consequently strictly linked to a cumulative frequency 38
distribution of elevation. Hypsometric curves are commonly presented in non-dimensional form, 39
which enables the comparison between different basins. In non-dimensional hypsometric curves, 40
the relative height is the ratio of the height above the lowest point at a given contour to the total 41
relief, and the relative area is the ratio of horizontal cross-section area at that elevation to the total 42
area. The hypsometric integral is the area below the non-dimensional hypsometric curve. Positive 43
features of hypsometric curves and integrals are their robustness against different estimation 44
methods (Singh et al. 2008), and in case of derivation from a Digital Terrain Model (DTM), their 45
low sensitivity to variations in DTM resolution (Hurtrez et al. 1999); this facilitates the comparison 46
of hypsometric parameters computed in different regions and from topographic data of different 47
resolutions. 48
Strahler (1952, 1964) related the shape of hypsometric curves and values of hypsometric integral 49
to the different stages of evolution of drainage basins. A young stage featuring high hypsometric 50
integrals and characterised by disequilibrium conditions is followed by a mature equilibrium stage; 51
a monadnock stage with very low hypsometric integral, when it does occur, is considered temporary 52
and can be followed by a return to equilibrium conditions after the removal of isolated elevated 53
areas of resistant rock. Because of these pioneering studies, this scheme has been widely used for 54
interpreting basin evolution. The hypsometric integral has also been associated with landscape 55
evolution, with basins in young stages having higher hypsometric integrals than mature and 56
monadnock basins. The importance of the hypsometric integral as an indicator of basin evolution 57
has been emphasised in recent studies. Together with other morphometric parameters, the 58
hypsometric integral has been used as an index of basin evolution to compare actual topography 59
with synthetic topography resulting from bedrock development models (De Long et al. 2007). 60
Nevertheless, this morphometric parameter has a relevant limitation, with different hypsometric 61
curves possibly having similar integrals. 62
Several studies have analysed the influence of various factors on hypsometric curves and 63
hypsometric integrals, such as the influence of tectonic activity (Lifton and Chase 1992; Ohmori 64
1993; Hurtrez et al., 1999; Chen et al. 2003; Pérez-Peña et al. 2009), lithology (Miller et al., 1990; 65
Lifton and Chase 1992; Hurtrez et Lucazeau 1999), glacial modifications (Brocklehurst and 66
Whipple 2004; Sternai et al. 2011), and climate (Masek et al. 1994). 67
Page 2 of 40Geografiska Annaler: Series A, Physical Geography

Willgoose and Hancock (1998) interpreted hypsometric curves in transport-limited catchments 68
as an indicator of the shape and scale of drainage basins. Their study was based on the results of a 69
physically-based catchment evolution model (Willgoose et al. 1991) that showed that the shape of a 70
catchment (width to length ratio) has a significant effect on the shape of the hypsometric curve. The 71
dominance of diffusive versus fluvial transport also affects the shape of the hypsometric curve. 72
Because the transition from diffusive to fluvial dominance depends on the catchment size, 73
hypsometric curves are scale-dependent descriptors of the landscape. These results led Willgoose 74
and Hancock (1998) to question the Strahler landform classification scheme as a tool for 75
interpreting catchment evolution, although they recognised its suitability as a “first step towards a 76
general framework for the study of landform hypsometry.” Hurtrez et al. (1999), in a study on small 77
basins in Nepal, Chen et al. (2003), in a study in western Taiwan, and Korup et al. (2005), in a 78
study in the Southern Alps of New Zealand, provided further evidence on the scale dependence of 79
hypsometry. More recently, Cheng et al. (2012) found that the hypsometry of drainage basins in 80
Taiwan is dependent on the steady state conditions of landscape evolution. A hypsometric integral 81
is scale-independent for basins at a steady state and depends on scale for basins at a non-steady 82
state. Walcott and Summerfield (2008) showed that basins in southeast Africa, varying in Strahler 83
order from 2 to 6, had no correlation between hypsometric integrals and indices of catchment scale, 84
such as drainage area or relief. The findings of Walcott and Summerfield (2008), which are not in 85
agreement with the results of some studies cited above (Willgoose and Hancock 1998; Hurtrez et al. 86
1999; Chen et al. 2003) reveal the complexity of controls on hypsometry under different climatic 87
conditions and geological settings. 88
The complexity of the relations between hypsometry and spatial scale of analysis is not 89
surprising because of the main controls on landscape evolution (Tucker and Hancock 2010), such as 90
the geo-structural setting and climate, which show a high variability in their spatial structure in the 91
different regions of the globe. The availability of High-Resolution Digital Terrain Models 92
(HRDTMs) and use of effective geomorphometric tools represent an opportunity for the analysis of 93
basins of limited size with complex morphologies. Moreover, the geo-structural setting and local 94
climatic conditions can be better characterised in the case of small basins. 95
Headwater rock basins are a typical feature of alpine landscapes and other mountainous regions 96
(Sauchyn and Gardner 1983). Hypsometric analyses can effectively compare rocky headwaters with 97
different geological and morphological characteristics and may provide useful insights on 98
hydrological and sediment-transfer processes. This paper analyses the hypsometry of rocky 99
headwater basins of the Dolomites (Italy), where despite similar climatic conditions and a common 100
geological framework, the local and specific geo-structural setting exerts an important control on 101
Page 3 of 40 Geografiska Annaler: Series A, Physical Geography

the evolution of landscape morphology. The study analyses several features related to the 102
hypsometry of rocky headwaters: 103
• influence of geo-structural settings on the shape of non-dimensional hypsometric curves; 104
• possible dependency of hypsometric integrals on basin size and shape; 105
• relations between hypsometric integrals, which are considered an index of catchment erosion, 106
and the extent of scree slopes downslope of rocky headwaters, which are considered an index 107
of sediment yield; 108
• ability of geomorphometric indices of surface morphology (residual relief and surface 109
roughness) to interpret the variability of hypsometric curves and hypsometric integrals; and 110
• influence of local climate on basin evolution (indicated by their hypsometric integrals). 111
112
Study areas 113
The study areas are located in the Dolomites (Eastern Alps, Italy). With summits rising above 3000 114
m, the Dolomites constitute the retrobelt of the Alpine orogeny and represent a spectacular example 115
of its complexity (Bosellini et al. 2003; Castellarin and Cantelli 2000; Doglioni 1987; Doglioni and 116
Carminati 2008). The Dolomites are frequently described from a structural perspective as a large 117
pop-up structure of the Neogene age that was deeply influenced by pre-existing tectonic and 118
sedimentary structures. The Dolomites are limited to the north by the dextral Insubric Lineament, 119
which delimits the transition from the Southern Alps to Northern Alps, and to the south by the 120
Valsugana Line, which is a Neogene overthrust (Fig. 1). The lithology of the area is characterised 121
by a prevalence of Triassic calcareous rocks with characteristic peaks mainly comprised of stratified 122
dolomite rocks (Fig. 2). The main formations outcropping in the study areas are as follows: 123
• Dachstein Formation (Rhaetian), limestone; 124
• Dolomia Principale Formation (Norian), dolomite; 125
• Raibl Formation (upper Carnian), fine graded sandstones, siltstones and claystones; 126
• Dürrestein Formation (lower Carnian), mainly dolomite and sandstones; 127
• Dolomia Cassiana Formation (upper Ladinian-lower Carnian), dolomite. 128
From a geo-mechanical perspective, the most resistant rocks belong to the dolomite formations 129
and limestone of the Dachstein Formation. The rocks of the other formations are weaker, which is 130
manifested by gentler slopes, strong deformation and widespread presence of landslides. An 131
important contribution to shaping the present morphology is ascribed to geomorphic processes, 132
mainly landslides, which were particularly active after the withdrawal of stadial valley glaciers 133
between 14000 and 11000 (cal BP) and had variable intensities most likely related to various 134
climatic phases (Soldati et al. 2004). 135
Page 4 of 40Geografiska Annaler: Series A, Physical Geography

The study areas are located in the upper parts of three catchments: Cordevole, Cordon and 136
Missiaga (Fig. 3). Geological and geomorphological conditions representative of the Dolomites and 137
the availability of high-resolution topographic data were the criteria for selecting the study areas. In 138
each study area, a number of catchments (17 in the Cordevole, 23 in the Cordon, and 21 in the 139
Missiaga) were identified for hypsometric analysis. 140
A common feature of the three areas is the widespread presence of bare rocky outcrops, which 141
form vertical or subvertical cliffs and have slopes strictly linked to their geo-mechanical 142
characteristics. Loose debris covers patchy areas, mostly located in low-gradient upper parts of the 143
basins. Rock slopes are entrenched by steep couloirs, which correspond to lineaments related to 144
fractures and faults. Accumulations of scree slopes at the foot of rockwalls are caused by various 145
geomorphic processes that include rockfall, snow avalanches, debris flows and channelised runoff 146
from upslope couloirs (Marchi et al. 2008). 147
The geo-structural settings show remarkable differences between the three study areas. In the 148
Cordevole, the rock mass is mainly comprised of Dolomia Principale with sub-horizontal 149
stratification, various lineaments related to faults and fractures, and a dominant SSE orientation. In 150
the eastern sector, the geo-structural setting is characterised by the presence of different thrust 151
systems that increase the lithological heterogeneity manifested by the presence of the Dachestein 152
Formation. Wide areas covered by debris and rock fall deposits are also present in this sector. 153
The Cordon is characterised by the presence of the Dolomia Cassiana and Dürrestein Formation 154
dipping toward NE (c. 20°). The Dolomia Cassiana is subdivided into a lower and upper part. The 155
lower part, “massive Dolomia Cassiana”, constitutes the subvertical cliffs and is characterised by 156
massive stratification, whereas the upper part, “stratified Dolomia Cassiana”, is characterised by a 157
thinner stratification. The limit between the massive and stratified Dolomia Cassiana corresponds to 158
upper hedge of the vertical cliff. The main fault lineaments are oriented along a NNW direction. In 159
the steeper part of the study area, different lineaments related to fractures are present with a non-160
preferential orientation and the rock mass appears moderately disturbed. In the higher and flatter 161
part of the study area, the rock mass is less disturbed and shows discontinuities mainly related to 162
stratification. 163
The rock basins in the Missiaga are essentially comprised of Dolomia Principale with the 164
exception of some outcrops of the Raibl Formation near the outlets of rock basins. The lineaments 165
are mainly related to fractures and faults and stratification in some zones with strata mainly dipping 166
toward NE. The lineaments show a wide range of orientations and continuity with a slight 167
predominance along NW and NE directions. The area is characterised by intensive tectonic 168
Page 5 of 40 Geografiska Annaler: Series A, Physical Geography

deformation because it is in the vicinity of the Valsugana thrust system and a secondary thrust 169
crosses the study area from the SW to NE. 170
171
Methods 172
LiDAR data and DTM implementation 173
The topographic data are derived from an airborne LiDAR survey conducted in October 2006 (snow 174
free condition) in the three catchments. The LiDAR and photographic data were acquired from a 175
helicopter using an ALTM 3100 OPTECH laser scanner and Rollei H20 digital camera flying at an 176
average altitude of 1000 m above ground level. The flying speed was 80 knots, the scan angle was 177
20° and the pulse rate was 71 kHz. The raw data were filtered into returns from vegetation and bare 178
ground using the ground classification algorithm implemented in Terrascan software 179
(http://www.terrasolid.fi/); the filtering was performed by the private firm that conducted the 180
flights. The filtered data showed a mean point density of 1.3, 2.7, and 5.9 points/m2 for the 181
Missiaga, Cordon, and Cordevole catchments, respectively. The vertical accuracy, evaluated by a 182
direct comparison between LiDAR data and GPS points acquired in the study areas, is about 0.1 m. 183
The horizontal accuracy computed as 1/1000 of the flying height (Hodgson and Bresnahan, 2004) 184
is about 1 m. 185
A HRDTM with a cell size of 2×2 m was obtained via natural neighbour interpolation, which is a 186
rapid deterministic method that does not require user-defined parameters (Sibson 1981) and is 187
capable of considering sampling geometry characteristics. These characteristics make it suitable to 188
interpolate LiDAR points in the three study areas characterised by different point densities without 189
subjective choices performed by the user. Point density shows a strong spatial variability within the 190
study areas, and 2 m resolution ensured at least one point in each pixel. 191
To obtain a hydrologically corrected HRDTM, which is required for watershed divide extractions, 192
local depressions (pits) were removed from the DTM using the “fill sinks” method and flow 193
directions were determined by the classic D8 algorithm (O’Callaghan and Mark 1984). The original 194
(without depressions removal) HRDTM was used for the geomorphometric analysis. 195
High-resolution orthophotos (pixel size 0.25 m) were acquired during the LiDAR survey; 196
because these orthophotos were limited to Cordevole, Cordon and Missiaga watersheds, lower 197
resolution (0.8 m) orthophotos acquired in 2000 that covered the entire Dolomite region were used 198
for visual purposes to show mountain sectors outside of the study areas in the Figs 3, 9 and 10. 199
200
Basin identification 201
Page 6 of 40Geografiska Annaler: Series A, Physical Geography

The catchments were investigated by means of field surveys and analyses of different geographical 202
thematic layers in a GIS environment that included aerial photos, high-resolution orthophotos and 203
the shaded relief of HRDTM. The watershed divide of each catchment was automatically delineated 204
using the flow direction map computed on the hydrologically corrected HRDTM. 205
For the hypsometric analysis, drainage areas were selected where the flow processes have 206
enough intensity to produce relevant geomorphic effects on the downstream scree slopes. 207
Accordingly, a morphological criterion was adopted: the scree at the interface with the upslope rock 208
basin was inspected, both in the field and from aerial photos, and the sites where water runoff and 209
debris flows from upslope couloirs caused erosion were selected as the outlet of rock basins. Fig. 4 210
presents an example of the definition of rock basins: the orthophoto shows a sharp transition 211
between the rock slope and scree slope, and the scree slope at the outlet of the rock basin is 212
entrenched by debris-flow channels. The scree belts were mapped with a GIS using shaded relief 213
and orthophotos and based on field observations. Because of the lack of sharp transitions between 214
the scree slope and other deposits (Fig. 3c), scree slope mapping in the Missiaga required the 215
complementary analysis of spatial statistical indices of surface texture, such as roughness, 216
anisotropy in spatial variability and integral of variogram (Trevisani et al. 2012). 217
218
Geomorphometric analysis 219
Fine-scale surface morphology is closely linked to geomorphic processes and geo-structural 220
settings. The analysis of HRDTM derivatives (e.g., shaded relief, slope, curvature, etc.) and indices 221
of surface texture (Trevisani et al. 2012) enhances the detection of linear features related to 222
stratification, faults and fractures. In rocky headwaters, sharp changes in surface morphology are 223
mainly related to structural discontinuities (faults, fractures, and stratification), landslides and 224
channelised erosion. Accordingly, the analysis of surface texture can provide indications of the 225
quality of the rock mass. 226
To perform the analysis of surface texture and enhance the detection of linear features, ad-hoc 227
HRDTM derivatives were calculated. Residual HRDTMs (e.g., Volker et al., 2007; Hengl and 228
Reuter, 2008; Hiller and Smith, 2008; Trevisani et al., 2009), also known as residual reliefs or local 229
anomalies, are particularly well suited for the detection of abrupt changes in morphology and to 230
outline linear features. 231
In this study, the residual HRDTM was derived by subtracting a smoothed version of the 232
HRDTM, obtained from moving averages computed on 5x5 cells windows, from the original 233
HRDTM (e.g., Haneberg et al., 2005; Cavalli and Marchi, 2008). The residual HRDTM is the input 234
informative level from which local surface texture indices can be calculated (e.g., Herzfeld and 235
Page 7 of 40 Geografiska Annaler: Series A, Physical Geography

Higginson, 1996). A simple and effective textural index is the surface roughness (e.g. Cavalli et al., 236
2013), which was derived by the standard deviation of residual relief within a 5x5 cells moving 237
window. 238
239
Hypsometric analysis 240
A morphometric analysis was performed in each catchment of the three study areas; the basic 241
morphometric parameters and hypsometric integrals were computed, and the hypsometric curves 242
were drawn using the software AdB Toolbox (http://www.pcn.minambiente.it/GN/adbtoolbox.php). 243
To compute the hypsometric integral (HI), we used the simplified equation by Pike and Wilson 244
(1971): 245
minmax
min
HH
HH=HI m
−
−
(1) 246
where Hm, Hmin and Hmax are the mean, minimum and maximum elevation in the basin, respectively. 247
To analyse the relation between hypsometry and basin shape, we adopted a variant of the 248
elongation ratio (Schumm 1956). In the revised index, the basin length measured along the main 249
drainage line was replaced by the maximum flow length in the catchment, which was computed 250
from the flow paths derived from the flow direction map. The maximum flow length was used 251
because of the difficulty in objectively identifying the “main valley” in small steep rock basins 252
where only a poorly-defined channel network exists consisting of couloirs selectively developed 253
along fractures or faults. The shape factor (SF) is thus defined as: 254
l
dSF = (2) 255
where d is the diameter of a circle with the same area as the basin and l is the maximum flow 256
length, as defined above. 257
258
Results 259
Basin size and shape 260
The main morphometric parameters and basic statistics of hypsometric integrals for the rock 261
catchments are shown in Tables 1 and 2. The studied rocky headwaters show high values of the 262
hypsometric integral (Table 2); if the data from the three study areas are pooled, the median of HI is 263
0.60 and values greater than 0.50 are observed in 79% of the catchments analysed. Lower values are 264
observed in the Missiaga; the application of the Mann-Whitney U test shows relevant differences 265
Page 8 of 40Geografiska Annaler: Series A, Physical Geography

(p-value smaller than 0.01) between the Missiaga and both the Cordevole and Cordon catchments, 266
whereas no significant differences are found between the latter two (p-value = 0.81). 267
Table 3 lists the linear correlation coefficients between catchment area (A), relief (R) and 268
hypsometric integral (HI). For a significance level of 0.05, the correlation between A and HI is 269
significant in the Cordevole and Cordon but with opposite signs. No significant correlation is found 270
between R and HI, although for Cordevole the p-value is only slightly higher than 0.05. No 271
significant correlation is found between shape factor SF and HI. The mean value of all of the 272
average elevations of drainage basins (Hmean) shows large differences between the three study areas 273
but small variability within each of them. A weak positive correlation between Hmean and HI is 274
observed in the Cordon and Missiaga. 275
The contrasting patterns in the relations between A and HI observed in the three study areas 276
(Table 3) are further outlined by Fig. 5. The negative correlation in the Cordevole is essentially a 277
result of lower hypsometric integrals of the two largest basins. The opposite occurs in the Cordon, 278
where the highest values of hypsometric integral are observed in some of the largest basins. The 279
slight decrease of hypsometric integral for increasing basin size observed in the Missiaga is 280
associated with a weak non-significant correlation. 281
The analysis of the relation between A and HI was extended to larger, prevailingly soil-mantled 282
catchments downstream of the studied rock basins in the three study areas. Basins of Strahler order 283
2 and higher having one or more rock basins at their headwaters were considered. The basin outlets 284
were identified at the junction with a stream segment of the same or higher order, i.e., at the passage 285
to a higher order. The largest catchments, with Strahler order 4 or 5, drained areas from 4.5 to 7.0 286
km2 and corresponded to the areas covered by LiDAR data. Fig. 6 shows a decrease of the 287
hypsometric integral when the analysis is extended to larger, soil-mantled basins. 288
A closer inspection of the hypsometric curves (Fig. 7) provides further elements for the 289
comparison between the three study areas. 290
In the Cordevole, the hypsometric curves show moderate variability with most catchments in a 291
narrow range. The two largest catchments (no. 14 and 15, Fig. 3a) display a clearly defined upward 292
concavity in the upper part of the curve and lowest values of the hypsometric integral (Fig. 7a). In 293
these catchments, three morphological units can be recognised: steep unchanneled upper slope, low 294
slope cirques, and cliffs entrenched by steep couloirs. The other catchments in the Cordevole lack 295
upper steep slopes, and their highest parts have a moderate slope that results in a gentle slope of the 296
hypsometric curves. As a consequence, the overall shape of the hypsometric curves for catchments 297
14 and 15 is clearly sigmoid, whereas most of the other catchments have upward convex curves. A 298
feature common to all of the curves in the Cordevole basin is the sharp lower limb outlining the 299
Page 9 of 40 Geografiska Annaler: Series A, Physical Geography

extreme steepness of the lower catchment slopes; approximately 10% of the catchment area 300
includes 30% of the relative elevation. 301
The hypsometric curves in the Cordon have the greatest variability among the three study areas. 302
A plateau is the dominant feature in the upper part of the Cordon drainage basin (Fig. 3b), and the 303
catchments that include the plateau lack an upward concavity and show gentler slopes in the upper 304
part of the curve. Their shape is convex or sigmoid depending on the relative extent of the plateau 305
against the lower parts of the catchment. These features also result in very high values of HI, 306
particularly for catchments 8, 12 and 16 (Figs 3b and 7b) where approximately 80% of the area is in 307
the upper 30% of the elevation range. The catchments that do not attain the plateau lack the upper 308
flat part of the hypsometric curve. In addition, there are hypsometric curves that have a marked 309
sigmoid shape in which three units can be recognised: mild slope in the upper part corresponding to 310
the plateau, steep slope in the intermediate reach corresponding to the cliff, and a moderate slope of 311
the lower part caused by the attenuation of the slope in the lowest sector of the catchment. 312
The distribution of areas at various elevations in the Missiaga lacks both the gentle slope at the 313
upper elevation and sharp lower limb, which is observed in several catchments of the Cordevole and 314
Cordon basins. The rock basins in the Missiaga do not originate from a plateau, which is a relevant 315
feature of several catchments in the Cordon area, and compared to what occurs in most of the 316
catchments of the Cordevole, no attenuation of hillslope steepness is observed toward higher 317
altitudes. As a consequence, the hypsometric curves in the Missiaga are almost linear or slightly 318
sigmoid. 319
320
Scree slopes as an indicator of hypsometric evolution 321
The extent of the scree slopes at the foot of the rocky belt (Fig. 3) can be considered as an index of 322
long-term sediment output from the rock basins for comparison with the values of the hypsometric 323
integral. When using scree slope area as a proxy of scree volume, and therefore of long-term debris 324
yield, a major problem is represented by the mapping of scree slopes. In the Cordevole, debris flows 325
can deliver sediment downstream of the scree belt, whose lower boundary corresponds to a rock 326
cliff (Fig. 3a), and the extent of the mapped scree belt might underestimate the sediment fluxes from 327
the rock basins. Field observations, however, have shown that debris deposited downstream of the 328
scree belt mapped covers limited areas. In the Missiaga, debris eroded from rock cliffs accumulates 329
on sloping valley sides, which likely results in longer downstream travelled distances and 330
deposition areas larger than in the Cordevole and Cordon. Scree slopes are compared in Fig. 8 with 331
the upslope rocky belts, which encompass the rock basins and interbasin areas. Interbasin areas are 332
the rock facets included between the rock basins (outlined in red in Fig. 3) and scree slopes 333
Page 10 of 40Geografiska Annaler: Series A, Physical Geography

(outlined in blue in the same figure) and amount to 11.4% in the Cordevole, 20.8% in the Cordon 334
and 28.5% in the Missiaga. Fig. 8 shows that scree covers a smaller area than the upslope rocky belt 335
in the Cordevole and Cordon, whereas the opposite occurs in the Missiaga. Even taking into 336
account the approximations in scree slope mapping and lack of data on debris thickness, which 337
makes scree slope an approximate surrogate of debris yield, the disproportionately larger extent of 338
scree slopes in the Missiaga is consistent with lower values of the hypsometric integral (Table 2), 339
which indicates more advanced erosion of rock basins. 340
The coalescence of the debris cones does not permit the identification of the extent of scree slope 341
area pertaining to each rock basin. Therefore, it has not been possible to perform analyses on 342
individual catchments to evaluate the relations between rocky headwaters and scree slopes. 343
344
Geomorphometric indices and geo-structural settings 345
Although Cordevole, Cordon and Missiaga share basic lithological and morphological 346
characteristics typical of the Dolomites, they also display relevant differences in geo-structural 347
settings. The analysis of residual relief, complemented by the interpretation of the high-resolution 348
orthophotos, provides homogeneous information in the three studied areas, enabling the detection 349
of the main lineaments of structural or sedimentary origin (Figs 9 and 10). The frequency 350
distributions of log-transformed values of surface roughness (Fig. 11) and basic statistics (not log-351
transformed variable, Table 4) corroborate the visual interpretation and enable comparison between 352
the three study areas. 353
In the Cordevole the analysis of geo-structural conditions shows that two main groups of basins 354
can be differentiated. The first group includes basins located in the western part of the study area in 355
the Dolomia Principale with sub-horizontal strata. These basins show high surface roughness and 356
relevant linear features related to faults and fractures, with a dominant SSE orientation and less 357
marked features related to sub-horizontal stratification. The rock mass appears very blocky with an 358
increasing fracture density towards the basins outlets. The second group of basins is characterised 359
by an elongated and symmetric shape and different patterns of fine scale morphology between the 360
lower and upper parts representing geo-structural variations (Fig. 10a). The lower parts, which 361
mainly developed in the Dolomia Principale with a prevalence of distensive subvertical fractures, 362
resemble the characteristics of the basins of the first group. In the upper part, a high lithological 363
heterogeneity is related to the presence of various thrust systems, the surface morphology is more 364
complex and smooth, and characterised by linear features related to stratification (less marked 365
anomalies) and low angle overthrust surfaces (marked anomalies such as the overthrust with the 366
Dachstein Formation above the Dolomia Principale). In a portion of the basins with lower slopes, 367
Page 11 of 40 Geografiska Annaler: Series A, Physical Geography

the smoother surface morphology corresponds to a scree-covered slope (Fig. 10a). The presence, in 368
the Cordevole study area, of two sectors with distinctively different rock surface characteristics is 369
visible also in the frequency histogram of roughness, which is characterised by two peaks with 370
similar frequencies (Fig. 11a). 371
In the Cordon study site, two main groups of basins can also be differentiated according to the 372
geo-structural settings. A first group of small basins that are primarily located in the subvertical 373
cliffs (massive Dolomia Cassiana) shows the highest roughness and no dominant orientation of the 374
linear features. For these basins, the rock mass appears moderately disturbed. The second group 375
includes larger basins (Fig. 10b) with an elongated and quite asymmetric shape (generally elongated 376
towards WNW and mainly in relation to the directions of the strata, which have a dip of 377
approximately 20° along the NE). These basins show different roughnesses in their upper parts, 378
which are composed of thin-stratified Dolomia Cassiana and Dürrestein Formation, compared to the 379
lower parts, which are composed of massive Dolomia Cassiana. In the upper part, the rock mass 380
appears undisturbed to partially disturbed with less marked linear features related to stratification. 381
The rare lineaments that are more highly marked are related to fault lines and distensive fractures. 382
The lower part is equal to the characteristics of the first group of basins located on the vertical cliff 383
of massive Dolomia Cassiana. The histogram of roughness (Fig. 11b) shows that the bimodality is 384
even more evident in the Cordon site than in the Cordevole. 385
The rock basins in the Missiaga are characterized by general lithological homogeneity (Dolomia 386
Principale) and intense tectonic deformation. The rock mass appears very blocky to blocky 387
disturbed. The linear features that can be detected from the residual relief and orthophotos are 388
mainly related to fractures and faults and stratification in some zones, with the strata mostly dipping 389
towards the NE (Fig. 10c). The lineaments show a wide range of orientations and persistence with a 390
slight predominance along the NW and NE directions. These features result in high and 391
homogeneously distributed surface roughness, which is also reflected by the roughness histogram 392
which is quite symmetric except for a small tail of low values (Fig. 11c), related to a basin partially 393
covered by scree deposits. The comparison with the other two study areas (Table 4) confirms higher 394
values of surface roughness in the Missiaga, which is consistent with the presence of highly 395
disturbed rock masses. 396
To analyse the relations between roughness heterogeneity and hypsometric integral, we 397
calculated the coefficient of variation (CV) of roughness for each basin. Fig. 12 reports a scatter 398
plot of the CV versus hypsometric integral, with the size of the symbols varying with the quartiles 399
of the drainage basin area. An interesting characteristic is that points in the Missiaga and Cordevole 400
study areas define two distinct non-overlapping clusters. The points related to Missiaga form a 401
Page 12 of 40Geografiska Annaler: Series A, Physical Geography

compact and isotropic cluster centred on low values of HI and CV that are independent from the 402
basin area, whereas in Cordevole and Cordon, larger basins are characterised by higher CV. The 403
Cordevole cluster shows higher dispersion and generally higher values of the CV. The Cordon 404
points form a highly dispersed cluster whose points overlap the Cordevole and Missiaga clusters. 405
406
Climate 407
The relations between the climate of the three study areas and values of the hypsometric integral 408
have been analysed; however, the discussion is limited to the present-day climate, which can be 409
evaluated on the basis of quantitative data. Although the three study sites share the same general 410
climatic conditions, the Missiaga catchment, which has lower values of hypsometric integrals, 411
receives higher mean annual precipitation (approximately 1400 mm versus 1100 mm in the 412
Cordevole and Cordon). High-intensity, short-duration precipitation, which usually triggers the 413
most important erosive events also attain higher values in the Missiaga: maximum annual rainfall 414
with durations from 1 to 24 hours are 20% to 40% higher than in the Cordevole and Cordon (Villi 415
and Bacchi 2001). 416
The three study areas are located at different elevations, which may influence the frequency of 417
daily freeze-thaw cycles that cause frost shattering of rocks and influence debris production. The 418
number of freeze-thaw days (FTD) has been analysed as an indicator of elevation on frost 419
shattering. No data on air temperature are available within the three study areas. Data recorded from 420
2000 to 2010 at six meteorological stations in the Dolomites located at elevations above 2000 m and 421
at an average distance of 14 km from the centroid of the study areas were analysed. 422
Fig. 13 plots the number of FTD versus elevation, and the median elevations of the three study 423
areas are also shown. A consistent decrease in the frequency of FTD can be observed for increasing 424
elevation; it should be stressed that the mean number of FTD for the highest station (3256 m) has 425
been computed based on a few years of data because of gaps in the data. A greater number of FTD 426
in the Missiaga could be an index of higher intensity of present-day frost weathering, which is 427
consistent with larger debris yields and a more advanced evolution of the relief. The differences in 428
the number of FTD, however, are small, with the results of linear interpolation versus elevation 429
having values of 101 FTD for Missiaga, 94 FTD for Cordon and 84 FTD for Cordevole. Moreover, 430
the western aspect that prevails in the Missiaga could attenuate the differences in temperature 431
regime from Cordevole and Cordon, which are dominated by southern aspects. 432
433
Discussion 434
435
Page 13 of 40 Geografiska Annaler: Series A, Physical Geography
In the scheme by Strahler (1952, 1964), high values of the hypsometric integral indicate a juvenile 436
stage of basin development. Under this view, several rock basins studied in this paper, especially in 437
the Cordevole and Cordon, would correspond to early phases of development, whereas lower 438
hypsometric integrals, which are associated with smoother, slightly sigmoid hypsometric curves 439
(Missiaga), indicate a more mature stage of development. In the small rock basins under study, the 440
absence of a clear dependence on the basin scale enhances the significance of hypsometry as an 441
indicator of basin evolution. However, the evolution towards more mature forms, which would be 442
attained through an incision of the rock surfaces, is primarily caused by debris flows in couloirs 443
entrenching the rock slopes and might be counter-balanced by other geomorphic processes active in 444
the studied areas. A conceptual sketch of the possible interactions between the geomorphic 445
processes that influence hypsometry in rocky headwater is outlined below. Deposits in the slopes 446
below the rock basins indicate that rockfall plays an important role among the processes that control 447
the evolution of rock headwaters in the Dolomites (Soldati et al. 2004, Doglioni and Carminati 448
2008, Trevisani et al. 2009). Rockfall takes place on the sideslopes of the couloirs within the basins 449
and outer faces of the rocky outcrop. In the second case, the outer rock face retreats and causes a 450
similar reduction of the planimetric area of the catchment at different elevations without a 451
noticeable decrease of the hypsometric integral. These conditions occur in areas where the outer 452
parts of the rocky headwaters are characterised by vertical faces, such as in the Cordevole and 453
Cordon areas. In contrast, rockfall that occurs on the sideslopes of the couloirs within the rock 454
catchments cause the transformation of upland surfaces into valley-slopes and are effective in 455
promoting the transition towards a more mature hypsometry. In this context, rockfall and toppling at 456
the mountain front compete with rockfall and toppling on the sideslopes of the couloirs in 457
controlling the evolution of hypsometry in the rocky headwaters of the Dolomites. 458
Several authors have observed relationships between basin areas and hypsometry. The results 459
obtained in the three study areas show that the correlations between hypsometric integrals and basin 460
area have contrasting patterns in the Cordevole and Cordon and are not significant in the Missiaga 461
(Table 3 and Fig. 5). In the samples analysed in this study, even the largest catchments have a small 462
size (up to approximately 0.13 km2). The scale dependence of hypsometry has been observed for 463
catchments that extend up to 10 km2 (Hurtrez et al. 1999) or hundreds of km
2 (Chen et al. 2003). 464
Extending the analysis to larger basins actually produces a decrease of hypsometric integrals for 465
increasing basin areas, which was also found in our three study areas (Fig. 6). If the entire range of 466
basin areas is considered, we can conclude that basin size influences the hypsometric integral; the 467
decrease of the hypsometric integral for increasing area is especially clear in the Cordevole (Fig. 468
6a), which shows a similar, although less-defined, trend for rock basins. In the studied region, the 469
Page 14 of 40Geografiska Annaler: Series A, Physical Geography

percentage of area with outcropping rocks substantially decreases with increasing basin area, and 470
the lower basin slopes are mostly soil-covered. When focusing on rock basins, which are found to a 471
small extent in the Dolomites and essentially occur at headwaters, no univocal relationship can be 472
found between the catchment area and hypsometric integrals (Table 3 and Fig. 5). 473
Willgoose and Hancock (1998) have stressed that the shape of the catchment has a relevant 474
influence on the shape of the hypsometric curves though little influence on the hypsometric integral. 475
In the study areas in the Dolomites, no significant relationship was found between the shape of the 476
catchment, which was represented by the shape factor computed by Eq. 2, and the hypsometric 477
integral (Table 3). Regarding the shape of the hypsometric curve, no clear relationship can be 478
recognised between their large variability and basin shape. Variations in the shape of the drainage 479
basins could reflect differences in the spatial organisation of the channel network, which might 480
imply differences in the type and intensity of erosion and sediment transport. In the rock basins 481
considered in this study, however, the drainage network consists of steep couloirs corresponding to 482
faults and fractures, and differences in the basin shape do not correspond to differences in the 483
structure of the channel network. Because the channel pattern in the wider catchments is not 484
significantly more branched than in narrow catchments, the basin shape is not a good indicator of 485
the relative role of channelised processes of sediment transport versus hillslope processes. The lack 486
of dependency between hypsometry and basin shape is thus ascribed to the fact that basin shape 487
does not represent the development of channel networks in the studied rocky headwaters of the 488
Dolomites. 489
The possible influence of climate on the differences in hypsometric integral values among the 490
three study areas has been analysed. Higher amounts of precipitation and a higher frequency of 491
daily freeze-thaw cycles could have caused higher erosion in the Missiaga, which might have 492
resulted in the lower hypsometric integrals. The analysis of present-day climatic conditions does not 493
permit evaluating climate variability over the long time spans in which hypsometric evolution 494
occurs. However, the variability of the hypsometric integral within each study area, which is 495
particularly large in the Cordon (Table 2), cannot be ascribed to differences in climate. This 496
suggests that the variability in climatic conditions could be a concurrent cause but not the only 497
factor determining the differences in the hypsometry between the three study sites. 498
The geo-structural setting determines the basic morphological features of the catchments 499
(plateaux, cliffs, couloirs) and exerts a fundamental control on the hypsometric curves and 500
hypsometric integrals in the rock basins of the Dolomites. This is consistent with the findings of 501
Chen et al. (2003), who stress the fundamental influence of geological structures and tectonic 502
activity on hypsometric integrals in small basins in western Taiwan. For headwater rock basins, the 503
Page 15 of 40 Geografiska Annaler: Series A, Physical Geography

control of geological structures on the morphometry has also been outlined by Sauchyn and Gardner 504
(1983) and Sauchyn et al. (1998) in the Canadian Rocky Mountains and Loye et al. (2012) in two 505
basins of the Swiss and French Alps. In two of the study areas (Cordevole and Cordon), rock basins 506
were classified into two groups, based on the heterogeneity of geo-structural settings represented by 507
lithological variations and the presence of overthrusts, whereas more homogeneous conditions were 508
observed in the third study area (Missiaga). Residual relief and surface roughness, which were 509
computed on the HRDTMs, have supported this classification, enabling the recognition of 510
morphological features due to the variability of geological conditions and to rock mass disturbance. 511
The hypsometric curves of the basins with heterogeneous geological conditions differ from those of 512
more homogeneous basins (Fig. 7); the effects of geo-structural heterogeneity, however, result in 513
different patterns of hypsometric curves in the considered study areas with convex curves, which 514
are associated with high hypsometric integrals in the Cordon and sigmoid curves with relatively low 515
hypsometric integrals in the Cordevole. This stresses that the recognition of the heterogeneity of 516
morphological settings of headwater rock basins must be followed by a proper interpretation of the 517
implications for hypsometry. 518
A closer inspection of the relationships between surface roughness and hypsometric integral for 519
individual basins has shown that the Missiaga occupies a distinctive position in the plot of the 520
coefficient of variation of surface roughness versus hypsometric integral, which is characterised by 521
low values of both variables. Relatively low variability and high mean values of surface roughness, 522
which lead to low coefficients of variation, are consistent with disturbed rock masses associated 523
with intense erosion and low hypsometric integrals. 524
525
Conclusions 526
We have examined the hypsometry of rocky headwaters in three study sites of the Dolomites with 527
comparable lithologies and similar climatic conditions. The main outcomes of the study are 528
summarised below. 529
The hypsometric integrals in the rock basins of the Dolomites have high values, although they 530
have remarkable differences between the three study areas and within them. The highest values are 531
observed where the upper parts of the catchments correspond to an undissected plateau, such as in 532
the Cordon, or to slopes with relatively low gradient, which are linked to the basin outlet by steep 533
couloirs entrenching vertical cliffs, such as in the Cordevole. The relations between the extent of 534
rocky headwaters and scree slopes, which are considered an index of basin erosion, are consistent 535
with the values of the hypsometric integral in the three study areas. The lower values in the 536
Page 16 of 40Geografiska Annaler: Series A, Physical Geography

Missiaga are consistent with higher sediment output, which is witnessed by the extent of debris 537
slopes at the outlet of rocky headwater basins (Fig. 8). 538
The shapes of the hypsometric curves (Fig. 7) show large variability. Upward convex curves are 539
common in the Cordevole and Cordon and result from an increase of steepness from the low-slope 540
unchanneled areas at the highest elevations to subvertical couloirs entrenching the lower catchment 541
slopes. 542
Hypsometric integrals do not show clear relations with basin area and shape. Because the climate 543
variability between the study areas is too small to explain the hypsometric differences, it appears to 544
be confirmed that hypsometry in the headwater rock basins under study is mainly controlled by geo-545
structural settings, such as by the extent and intensity of tectonic deformation, characteristics of 546
stratification, or variation in lithology. When extending the assessment of hypsometric integrals to 547
larger, partially soil-mantled basins downstream of rocky headwaters, a decrease of hypsometric 548
integrals is observed for increasing catchment area. Therefore, the lack of scale dependency appears 549
to be limited to rocky headwaters where the structural settings closely control the distribution of 550
elevations. 551
A further comment addresses the topographic data used in the analysis. The increasing 552
availability of LiDAR-derived data for extensive areas at sustainable costs opens the possibility of 553
performing comparative studies of the hypsometry of rocky headwaters using fine-resolution data 554
sets. HRDTMs derived from LiDAR surveys enable the computing of geomorphometric indices that 555
are useful for the qualitative and quantitative analysis of surface morphology. Residual relief and 556
surface roughness have proved useful in comparing the three study areas and exploring the relations 557
between the heterogeneity of geo-structural conditions of the rock basins and hypsometry. 558
559
Acknowledgements 560
Air temperature data have been provided by the Environmental Agency of Veneto Region (Italy). 561
The authors wish to thank Marta Chiarle of CNR IRPI for a useful discussion on the influence of 562
climate on rock slope evolution. The authors would also like to thank Lothar Schrott, Simon 563
Brocklehurst and two anonymous referees for their comments on an earlier version of the paper. 564
565
Lorenzo Marchi, Marco Cavalli, CNR IRPI, Corso Stati Uniti 4, 35127 Padova, Italy. 566
Email: [email protected], [email protected] 567
568
Sebastiano Trevisani, Università IUAV di Venezia, Department of Architecture, Construction and 569
Conservation, Dorsoduro 2206, 30123 Venezia, Italy. 570
Page 17 of 40 Geografiska Annaler: Series A, Physical Geography

Email: [email protected] 571
572
References 573
574
Bosellini, A., Gianolla, P. and Stefani, M. 2003. Geology of the Dolomites, Episodes, 26, 181-185. 575
Brocklehurst, S.H. and Whipple, K.X., 2004. Hypsometry of glaciated landscapes. Earth Surface 576
Processes and Landforms, 29, 907-926. doi:10.1002/esp.1083 577
Castellarin, A. and Cantelli, L. 2000, Neo-Alpine evolution of the Southern Eastern Alps, Journal 578
of Geodynamics, 30, 251-274. 579
Cavalli M., Marchi L., 2008. Characterisation of the surface morphology of an alpine alluvial fan 580
using airborne LiDAR. Natural Hazards and Earth System Science, 8, 323-333. 581
Cavalli M., Trevisani S., Comiti F., Marchi L., 2013. Geomorphometric assessment of spatial 582
sediment connectivity in small alpine catchments. Geomorphology, 188, 31-41. 583
doi:10.1016/j.geomorph.2012.05.007 584
Chen Yen-Chieh, Sung Quocheng and Cheng Kuang-Yu, 2003. Along-strike variations of 585
morphotectonic features in the Western Foothills of Taiwan: tectonic implications based on 586
stream-gradient and hypsometric analysis. Geomorphology, 56, 109-137. doi:10.1016/S0169-587
555X(03)00059-X 588
Cheng Kuang-Yu, Hung Jih-Hao, Chang Hung-Cheng, Tsai Heng and Sung Quo-Cheng, 2012. 589
Scale independence of basin hypsometry and steady state topography. Geomorphology, 171-172, 590
1-11. doi:10.1016/j.geomorph.2012.04.022 591
Cohen, S., Willgoose, G., Hancock, G., 2008. A methodology for calculating the spatial distribution 592
of the area-slope equation and the hypsometric integral within a catchment. Journal of 593
Geophysical Research, 113, F033027, doi: 10.1029/2007JF000820 594
Doglioni, C., 1987. Tectonics of the Dolomites (Southern Alps, Northern Italy). Journal of 595
Structural Geology, 9, 181-193. 596
Doglioni, C. and Carminati, E., 2008. Structural Styles & Dolomites Field Trip. Memorie 597
Descrittive della Carta Geologica d’Italia, vol. 82, pp. 1-293. 598
De Long, S.B., Pelletier, J.D. and Arnold, L., 2007. Bedrock landscape development modeling: 599
Calibration using field study, geochronology, and digital elevation model analysis. Geological 600
Society of America Bulletin, 119, 157–173. doi:10.1130/B25866.1 601
Haneberg, W.C., Creighton, A.L., Medley, E.W., Jonas, D., 2005. Use of LiDAR to assess slope 602
hazards at the Lihir gold mine, Papua New Guinea. Proceedings, International Conference on 603
Page 18 of 40Geografiska Annaler: Series A, Physical Geography
Landslide Risk Management, Vancouver, British Columbia, May–June, 2005, A.A. Balkema, 604
Leiden. 605
Hengl, T. and Reuter, H.I. 2008. Geomorphometry: Concepts, Software, Applications. 606
Developments in Soil Science, vol. 33, Elsevier, Amsterdam. 607
Herzfeld, U.C. and Higginson, C.A.1996. Automated geostatistical seafloor classification –608
principles, parameters, features vectors, and discrimination criteria. Computers & Geosciences, 609
22, 35-52. 610
Hiller, J. K. and Smith, M. 2008. Residual relief separation: digital elevation model enhancement 611
for geomorphological mapping. Earth Surf. Process. Landforms, 33: 2266–2276. doi: 612
10.1002/esp.1659 613
Hodgson, M.E. and Bresnahan, P., 2004. Accuracy of Airborne LiDAR-Derived Elevation: 614
Empirical Assessment and Error Budget. Photogrammetric Engineering & Remote Sensing, 70, 615
331–339. 616
Hurtrez, J.-E. and Lucazeau, F., 1999. Lithological control on relief and hypsometry in the Hérault 617
basin (France). Compte Rendus de l’Academie des Sciences de Paris, 328, 687-694. 618
Hurtrez, J.-E., Sol, C. and Lucazeau, F., 1999. Effect of drainage area on hypsometry from an 619
analysis of small-scale drainage basins in the Siwalik Hills (central Nepal). Earth Surface 620
Processes and Landforms, 24, 799-808. 621
Korup, O., Schmidt, J. and McSaveney, M.J., 2005. Regional relief characteristics and denudation 622
pattern of the western Southern Alps, New Zealand. Geomorphology, 71, 402– 423. 623
doi:10.1016/j.geomorph.2005.04.013 624
Lifton, N.A. and Chase, C.G., 1992. Tectonic, climatic and lithologic influences on landscape 625
fractal dimension and hypsometry: implications for landscape evolution in the San Gabriel 626
Mountains, California. Geomorphology, 5, 77-114. 627
Loye, A., Pedrazzini, A., Theule, J., Jaboyedoff, M., Liébault, F. and Metzger, R., 2012. Influence 628
of bedrock structures on the spatial pattern of erosional landforms in small alpine catchments. 629
Earth Surface Processes and Landforms, 37, 1407–1423. doi:10.1002/esp.3285 630
Marchi, L., Dalla Fontana, G., Cavalli, M., Tagliavini, F., 2008. Rocky headwaters in the 631
Dolomites, Italy: field observations and topographic analysis. Arctic, Antarctic, and Alpine 632
Research, 40 (4), 685-694. 633
Mark, D.M., 1975. Geomorphometric parameters: a review and evaluation. Geografiska Annaler, 634
Series A, 57, 165-177. 635
Masek, J.G., Isacks, B.L., Gubbels, T.L. and Fielding, E.J., 1994. Erosion and tectonics at the 636
margins of continental plateaus. Journal of Geophysical Research, 99 (B7), 13,941-13,956. 637
Page 19 of 40 Geografiska Annaler: Series A, Physical Geography

Massari, F., Rio, D., Serandrei Barbero, R., Asioli, A., Capraro, L., Fornaciari, E. and Vergerio, 638
P.P. 2004. The environment of Venice area in the past two million years, Palaeogeography, 639
Palaeoclimatology, Palaeoecology, 202, 273-308. doi:10.1016/S0031-0182(03)00640-0 640
Miller, J.R., Ritter, D.F., Kochel, R.C., 1990. Morphometric assessment of lithologic controls on 641
drainage basin evolution in the Crawford Upland, south-central Indiana. American Journal of 642
Science, 290, 569-599. 643
O'Callaghan, J.F. and Mark, D.M., 1984. The Extraction of Drainage Networks From Digital 644
Elevation Data. Computer Vision, Graphics and Image Processing, 28, 328–344. 645
Ohmori, H., 1993. Changes in the hypsometric curve through mountain building resulting from 646
concurrent tectonics and denudation. Geomorphology, 8, 263-277. 647
Pérez-Peña, J.V., Azañón, J.M., Booth-Rea, G., Azor, A. and Delgado, J., 2009. Differentiating 648
geology and tectonics using a spatial autocorrelation technique for the hypsometric integral. 649
Journal of Geophysical Research, 114, F02018, doi:10.1029/2008JF001092 650
Pike, R. J. and Wilson, S. E., 1971. Elevation-relief ratio, hypsometric integral, and geomorphic 651
area – altitude analysis. Geological Society of America Bulletin, 82, 1079–1084. 652
Sauchyn, D.J. and Gardner, J.S., 1983. Morphometry of rock basins, Kananaskis area, Canadian 653
Rocky Mountains. Canadian Journal of Earth Sciences, 20, 409-419. 654
Sauchyn, D.J., Cruden, D.M. and Hu, Xian-Qin, 1998. Structural control of the morphometry of 655
open rock basins, Kananaskis region, Canadian Rocky Mountains. Geomorphology, 22, 313-324. 656
Schumm, S.A., 1956. Evolution of drainage systems and slopes in badlands at Perth Amboy, New 657
Yersey. Bulletin of the Geological Society of America, 67, 597-646. 658
Sibson, R., 1981. A Brief Description of Natural Neighbor Interpolation. In: Barnett, V. (ed.), 659
Interpolating Multivariate Data. John Wiley & Sons, Chichester, pp. 21-36. 660
Singh, O., Sarangi, A. and Sharma, M.C., 2008. Hypsometric integral estimation methods and its 661
relevance on erosion status of North-western Lesser Himalayan watersheds. Water Resources 662
Management, 22, 1545-1560. doi: 10.1007/s11269-008-9242-z 663
Soldati, M., Corsini, A. and Pasuto, A. 2004, Landslides and climate change in the Italian 664
Dolomites since the Late glacial, Catena, 55, 141-161. doi:10.1016/S0341-8162(03)00113-9 665
Sternai, P., Herman, F., Fox, M.R. and Castelltort, S., 2011. Hypsometric analysis to identify 666
spatially variable glacial erosion. Journal of Geophysical Research, 116, F03001, 667
doi:10.1029/2010JF001823 668
Strahler, A.N., 1952. Hypsometric (area-altitude) analysis of erosional topography. Bulletin of the 669
Geological Society of America, 68, 1117-1142. 670
Page 20 of 40Geografiska Annaler: Series A, Physical Geography

Strahler, A.N., 1964. Quantitative geomorphology of drainage basins and channel networks. In: 671
Chow, V.T. (ed.), Handbook of applied hydrology, McGraw Hill, New York, 4.39-4.76. 672
Trevisani, S., Cavalli, M. and Marchi, L. 2009, Variogram maps from LiDAR data as fingerprints 673
of surface morphology on scree slopes, Natural Hazards and Earth System Sciences, 9, 129-133. 674
doi:10.5194/nhess-9-129-2009 675
Trevisani, S., Cavalli, M. and Marchi, L., 2012. Surface texture analysis of a high-resolution DTM: 676
Interpreting an alpine basin. Geomorphology, 161-162, 26-39, 677
doi:10.1016/j.geomorph.2012.03.031 678
Tucker, G.E. and Hancock, G.R., 2010. Modelling landscape evolution. Earth Surface Processes 679
and Landforms, 35, 28-50. doi: 10.1002/esp.1952 680
Villi, V. and Bacchi, B., 2001. Valutazione delle piene nel Triveneto. Gruppo Nazionale per la 681
Difesa dalle Catastrofi Idrogeologiche, Pubbl. no. 2511, Rome. [in Italian] 682
Volker H.X., Wasklewicz T.A., Ellis M.A., 2007. A topographic fingerprint to distinguish alluvial 683
fan formative processes. Geomorphology 88, 34–45, doi:10.1016/j.geomorph.2006.10.008 684
Walcott, R.C. and Summerfield, M.A., 2008. Scale dependence of hypsometric integrals: An 685
analysis of southeast African basins. Geomorphology, 96, 174-186. 686
doi:10.1016/j.geomorph.2007.08.001 687
Willgoose, G., Bras, R.L. and Rodriguez-Iturbe, I. 1991. Results from a new model of basin 688
evolution. Earth Surface Processes and Landforms, 16, 237-254. 689
Willgoose, G. and Hancock, G., 1998. Revisiting the hypsometric curve as an indicator of form and 690
process in transport-limited catchment. Earth Surface Processes and Landforms, 23, 611-623. 691
692
693
Manuscript received 16 10, 2013, revised and accepted d mmm., 20yy 694
695
Page 21 of 40 Geografiska Annaler: Series A, Physical Geography
Tables 696
697
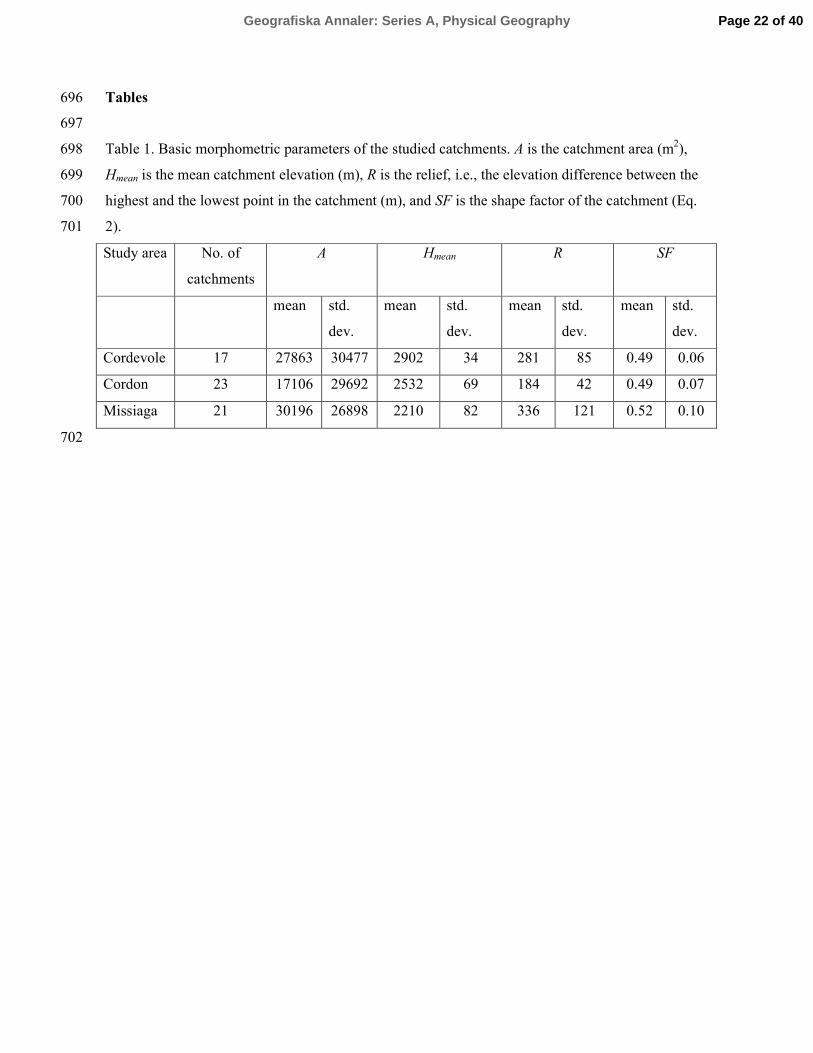
Table 1. Basic morphometric parameters of the studied catchments. A is the catchment area (m2), 698
Hmean is the mean catchment elevation (m), R is the relief, i.e., the elevation difference between the 699
highest and the lowest point in the catchment (m), and SF is the shape factor of the catchment (Eq. 700
2). 701
Study area No. of
catchments
A Hmean R SF
mean std.
dev.
mean std.
dev.
mean std.
dev.
mean std.
dev.
Cordevole 17 27863 30477 2902 34 281 85 0.49 0.06
Cordon 23 17106 29692 2532 69 184 42 0.49 0.07
Missiaga 21 30196 26898 2210 82 336 121 0.52 0.10
702
Page 22 of 40Geografiska Annaler: Series A, Physical Geography
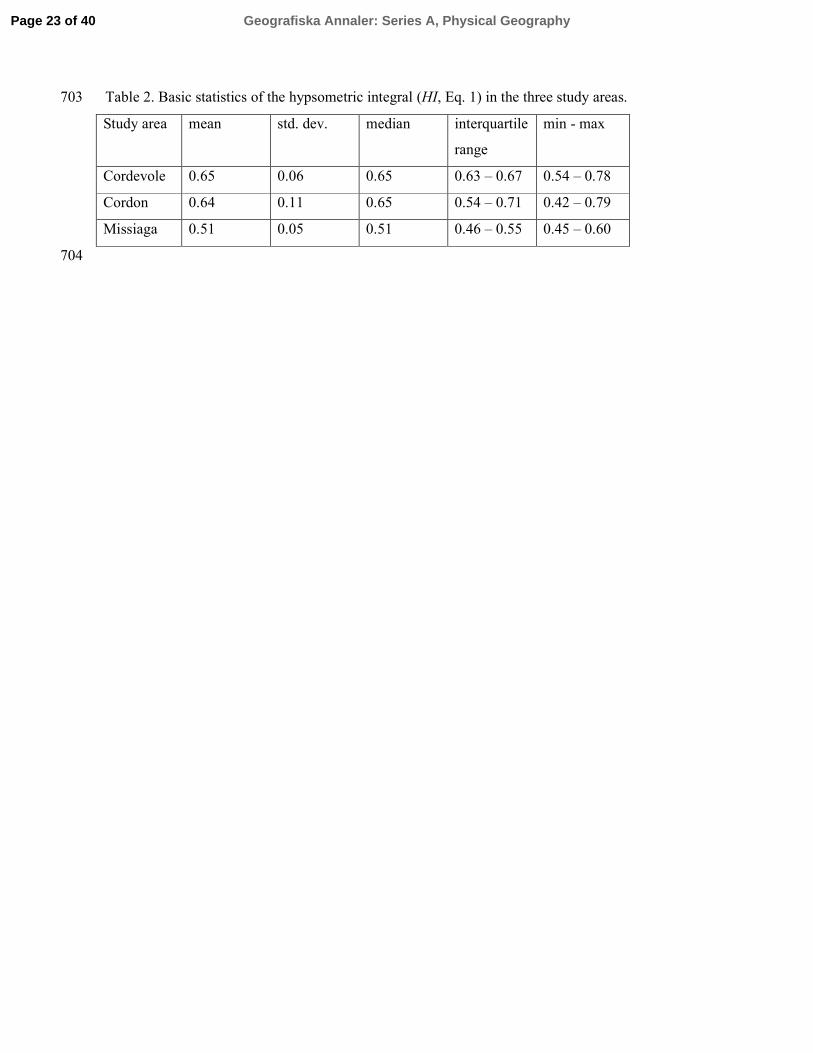
Table 2. Basic statistics of the hypsometric integral (HI, Eq. 1) in the three study areas. 703
Study area mean std. dev. median interquartile
range
min - max
Cordevole 0.65 0.06 0.65 0.63 – 0.67 0.54 – 0.78
Cordon 0.64 0.11 0.65 0.54 – 0.71 0.42 – 0.79
Missiaga 0.51 0.05 0.51 0.46 – 0.55 0.45 – 0.60
704
Page 23 of 40 Geografiska Annaler: Series A, Physical Geography

Table 3. Linear correlation coefficients between the morphometric variables in the three study areas 705
(Hmean: mean catchment elevation, R: relief, HI: hypsometric integral, SF: shape factor). 706
Cordevole Cordon 707
Hmean R HI SF Hmean R HI SF
A .7427
p=.001
.8752
p<.001
-.5452
p=.024
-.0331
p=.900
A -.0496
p=.822
.5850
p=.003
.4169
p=.048
-.1789
p=.414
Hmean .8519
p<.001
.0024
p=.993
.2396
p=.354
Hmean .4216
p=.045
.3897
p=.066
-.0184
p=.934
R -.4769
p=.053
-.2966
p=.248
R .3516
p=.100
-.1457
p=.507
HI -.1018
p=.697
HI -.2992
p=.165
Missiaga 708
Hmean R HI SF
A .4381
p=.047
.6773
p=.001
-.1221
p=.598
.5016
p=.021
Hmean .5772
p=.006
.3914
p=.079
.4005
p=.072
R -.0685
p=.768
.6004
p=.004
HI .1980
p=.390
Page 24 of 40Geografiska Annaler: Series A, Physical Geography

Table 4. Basic statistics of surface roughness in the three study areas. 709
Study area mean std. dev. median interquartile
range
Cordevole 0.81 1.17 0.36 0.15 – 0.97
Cordon 0.79 1.78 0.22 0.13 – 0.56
Missiaga 1.68 2.01 1.07 0.62 – 1.92
710
Page 25 of 40 Geografiska Annaler: Series A, Physical Geography
Figure captions 711
712
Fig. 1: Simplified structural setting (modified from Massari et al. 2004) and location of the study 713
areas: a) Cordevole, b) Cordon, and c) Missiaga. 714
715
Fig. 2: Geological maps of the study areas: a) Cordevole, b) Cordon, and c) Missiaga. Legend: Da 716
(Dachstein Formation, limestone), DP (Dolomia Principale, dolomite), R (Raibl Formation, fine 717
graded sandstones, siltstones and claystones), Du (Dürrestein Formation, mainly dolomite and 718
sandstone), DC (stratified Dolomia Cassiana, dolomite), DCa (massive Dolomia Cassiana, 719
dolomite). Areas covered by scree are represented by white. Rock basins are delineated by grey. 720
721
Fig. 3: Orthophotos of the study areas: a) Cordevole, b) Cordon, and c) Missiaga. Numbers refer to 722
the catchments cited in the text. The coordinate system is WGS84-UTM zone 32N. 723
724
Fig. 4: Identification of the rock basins outlets in a sector of the Missiaga study area. Linear erosion 725
in the scree slope at the interface with the upstream rock gully is clearly visible in the orthophotos. 726
727
Fig. 5: Relations between basin area and hypsometric integral. 728
729
Fig. 6: Relations between basin area and hypsometric integral for rock basins and higher order, 730
partly soil-mantled basins. a) Cordevole, b) Cordon, and c) Missiaga. 731
Fig. 7: Normalised hypsometric curves of a) Cordevole, b) Cordon, and c) Missiaga. Dashed red 732
lines correspond to basins with heterogeneous geo-structural conditions as identified in the 733
subsection on geomorphometric indices and geo-structural settings. The numbers refer to basins 734
mentioned in the text. 735
736
Fig. 8: Extent of the rocky headwaters and scree slopes in the three study areas. 737
738
Fig. 9: Residual HRDTM (observed topography minus smoothed topography) for the three study 739
areas: a) Cordevole, b) Cordon, and c) Missiaga. The colour scale represents positive and negative 740
values of residual topography (m). The stars indicate basins with higher variability of surface 741
texture as a result of complex geo-structural settings, such as variations of lithology and overthrusts. 742
743
Page 26 of 40Geografiska Annaler: Series A, Physical Geography

Fig. 10: Selected sites within the study areas including an outlined interpretation of residual 744
HRDTM. Scree deposits, thrusts and faults are indicated in blue, and rock basins are delimited in 745
grey. The colour scale of the residual HRDTM is shown in Fig. 9. A) Cordevole; B) Cordon; C) 746
Missiaga. 747
748
Fig. 11: Histograms of natural logarithms of surface roughness, and the main parameters of the 749
frequency distributions. a) Cordevole, b) Cordon, and c) Missiaga. 750
751
Fig. 12: Scatterplot of the coefficient of variation of surface roughness versus the hypsometric 752
integral in the three study areas. The size of the symbols varies with the quartiles of the drainage 753
basin area. 754
755
Fig. 13: Number of freeze-thaw days versus elevation based on six meteorological stations of the 756
Dolomites. The vertical segments indicate the median elevation of the three study areas. 757
758
759
Page 27 of 40 Geografiska Annaler: Series A, Physical Geography

Fig. 1: Simplified structural setting (modified from Massari et al. 2004) and location of the study areas: a) Cordevole, b) Cordon, and c) Missiaga.
139x100mm (300 x 300 DPI)
Page 28 of 40Geografiska Annaler: Series A, Physical Geography

Fig. 2: Geological maps of the study areas: a) Cordevole, b) Cordon, and c) Missiaga. Legend: Da (Dachstein Formation, limestone), DP (Dolomia Principale, dolomite), R (Raibl Formation, fine graded sandstones, siltstones and claystones), Du (Dürrestein Formation, mainly dolomite and sandstone), DC
(stratified Dolomia Cassiana, dolomite), DCa (massive Dolomia Cassiana, dolomite). Areas covered by scree are represented by white. Rock basins are delineated by grey.
366x233mm (150 x 150 DPI)
Page 29 of 40 Geografiska Annaler: Series A, Physical Geography
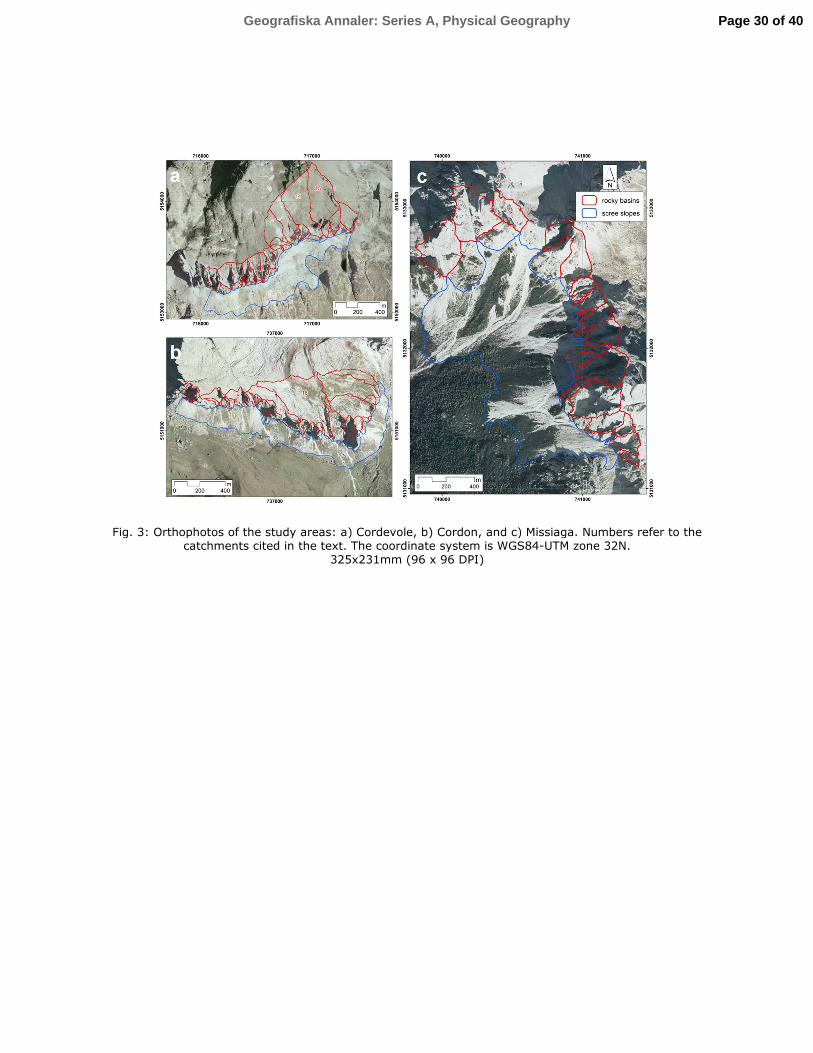
Fig. 3: Orthophotos of the study areas: a) Cordevole, b) Cordon, and c) Missiaga. Numbers refer to the catchments cited in the text. The coordinate system is WGS84-UTM zone 32N.
325x231mm (96 x 96 DPI)
Page 30 of 40Geografiska Annaler: Series A, Physical Geography

Fig. 4: Identification of the rock basins outlets in a sector of the Missiaga study area. Linear erosion in the scree slope at the interface with the upstream rock gully is clearly visible in the orthophotos.
211x167mm (300 x 300 DPI)
Page 31 of 40 Geografiska Annaler: Series A, Physical Geography

Fig. 5: Relations between basin area and hypsometric integral.
476x357mm (96 x 96 DPI)
Page 32 of 40Geografiska Annaler: Series A, Physical Geography

Fig. 6: Relations between basin area and hypsometric integral for rock basins and higher order, partly soil-mantled basins. a) Cordevole, b) Cordon, and c) Missiaga.
978x740mm (96 x 96 DPI)
Page 33 of 40 Geografiska Annaler: Series A, Physical Geography

Fig. 7: Normalised hypsometric curves of a) Cordevole, b) Cordon, and c) Missiaga. Dashed red lines correspond to basins with heterogeneous geo-structural conditions as identified in the subsection on
geomorphometric indices and geo-structural settings. The numbers refer to basins mentioned in the text. 1305x987mm (72 x 72 DPI)
Page 34 of 40Geografiska Annaler: Series A, Physical Geography

Fig. 8: Extent of the rocky headwaters and scree slopes in the three study areas. 476x357mm (96 x 96 DPI)
Page 35 of 40 Geografiska Annaler: Series A, Physical Geography

Fig. 9: Residual HRDTM (observed topography minus smoothed topography) for the three study areas: a) Cordevole, b) Cordon, and c) Missiaga. The colour scale represents positive and negative values of residual topography (m). The stars indicate basins with higher variability of surface texture as a result of complex
geo-structural settings, such as variations of lithology and overthrusts. 331x203mm (150 x 150 DPI)
Page 36 of 40Geografiska Annaler: Series A, Physical Geography

Fig. 10: Selected sites within the study areas including an outlined interpretation of residual HRDTM. Scree deposits, thrusts and faults are indicated in blue, and rock basins are delimited in grey. The colour scale of
the residual HRDTM is shown in Fig. 8. A) Cordevole; B) Cordon; C) Missiaga.
373x567mm (96 x 96 DPI)
Page 37 of 40 Geografiska Annaler: Series A, Physical Geography

Fig. 11: Histograms of natural logarithms of surface roughness, and the main parameters of the frequency distributions. a) Cordevole, b) Cordon, and c) Missiaga.
1305x987mm (72 x 72 DPI)
Page 38 of 40Geografiska Annaler: Series A, Physical Geography

Fig. 12: Scatterplot of the coefficient of variation of surface roughness versus the hypsometric integral in the three study areas. The size of the symbols varies with the quartiles of the drainage basin area.
1031x773mm (96 x 96 DPI)
Page 39 of 40 Geografiska Annaler: Series A, Physical Geography

Fig. 13: Number of freeze-thaw days versus elevation based on six meteorological stations of the Dolomites. The vertical segments indicate the median elevation of the three study areas.
476x357mm (96 x 96 DPI)
Page 40 of 40Geografiska Annaler: Series A, Physical Geography
Related Documents