HYPOTHESIS TESTING

Welcome message from author
This document is posted to help you gain knowledge. Please leave a comment to let me know what you think about it! Share it to your friends and learn new things together.
Transcript
HYPOTHESIS TESTING

In this chapter
We develop a procedure to test the validity of a statement about a population parameter.
Examples: The mean starting salary for graduates of
four year business schools is Rs. 32,000 per month.
Eighty percent of those who play the state lottery regularly never win more than $ 100 in any one play.
What is Hypothesis?
Is a statement about a population developed for the purpose of testing.
In most cases the population is too large that it is not feasible to study all items in the population.
We can, therefore, test a statement to determine whether the sample does or does not support the statement concerning the population.
HYPOTHESIS TESTING
A procedure based on sample evidence and probability theory to determine whether the hypothesis is a reasonable statement.

Five-Step Procedure for Testing a Hypothesis
State the Null Hypothesis (Ho) and the Alternate Hypothesis (Hı)
Select a level of significance. Identify the test statistic. Formulate a decision rule. Make a decision

Step 1: State the Null Hypothesis (Ho) and the Alternate Hypothesis (Hı)
The first step is to state the hypothesis being tested. It is called the null hypothesis, designated (Ho).
The capital H stands for hypothesis, and the subscript zero implies “no difference”.
There is usually a “not” or a “no” term in the null hypothesis, meaning that there is “no change”.

For example, the null hypothesis is that the number of miles driven on the steel-belted tire is not different from 60,000.
Therefore, Ho: μ = 60,000. We either reject or fail to reject the null
hypothesis. The null hypothesis is a statement that is
not rejected unless our sample data provide convincing evidence that it is false.

ALTERNATE HYPOTHESIS
The alternate hypothesis describes what you will conclude if you reject the null hypothesis. It is written as Hı.
It is also called the research hypothesis.
The alternate hypothesis is accepted if the sample data provide us with enough statistical evidence that the null hypothesis is false.
Example:
A recent article indicated that the mean age of U.S. commercial aircraft is 15 years.
The null hypothesis represents the current or reported condition.
Ho: μ = 15. The alternate hypothesis is that the
statement is not true: H1: μ ≠15.

Select a level of significance
The level of significance is designated the Greek letter alpha. It is also sometimes called level of risk.
There is no one level of significance that it is applied to all tests.
The common choices for are .05, .01 and .10.
LEVEL OF SIGNIFICANCE The probability of making a Type 1 error when the null hypothesis is true as an equality.

Traditionally, .05 level is selected for consumer research projects, .01 for quality assurance, and .10 for political polling.
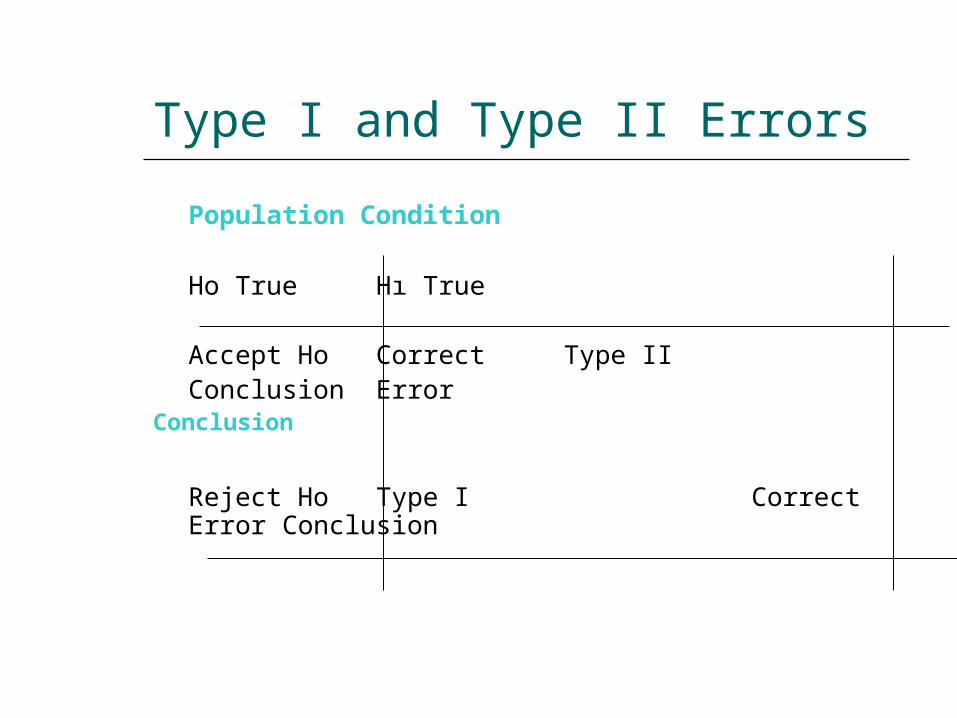
Type I and Type II Errors
Population Condition
Ho True Hı True
Accept Ho Correct Type IIConclusion Error
Conclusion
Reject Ho Type I Correct
Error Conclusion
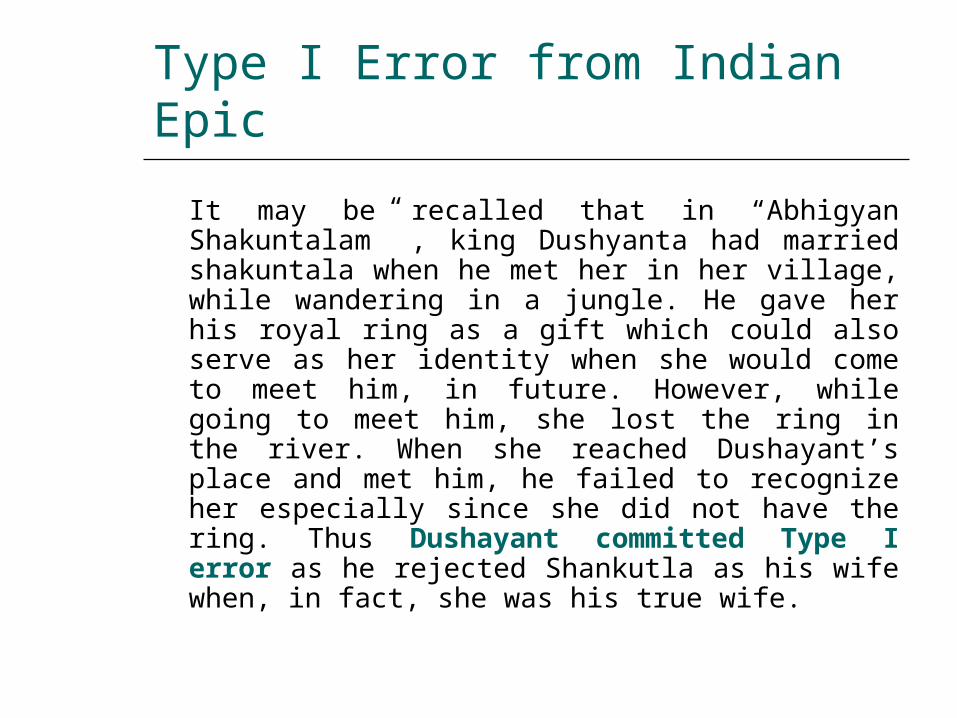
Type I Error from Indian Epic
It may be recalled that in “Abhigyan Shakuntalam” , king Dushyanta had married shakuntala when he met her in her village, while wandering in a jungle. He gave her his royal ring as a gift which could also serve as her identity when she would come to meet him, in future. However, while going to meet him, she lost the ring in the river. When she reached Dushayant’s place and met him, he failed to recognize her especially since she did not have the ring. Thus Dushayant committed Type I error as he rejected Shankutla as his wife when, in fact, she was his true wife.

Type II Error from Indian Epic
In Mahabharta epic, Dronacharya – the ‘guru’ of both Pandavas and Kauravas – was fighting from the Kaurav’s side. However, he had taken a vow that he would stop fighting if and when his son Aswathama was killed in the war. It so happened that during the war, one elephant named Aswathama was killed. Lord - Krishna the mentor of Pandavas – thought of a strategy to make Dronacharya lay down his arms. Yudhishter on advice of lord Krishna, went to Dronacharya and pronounced
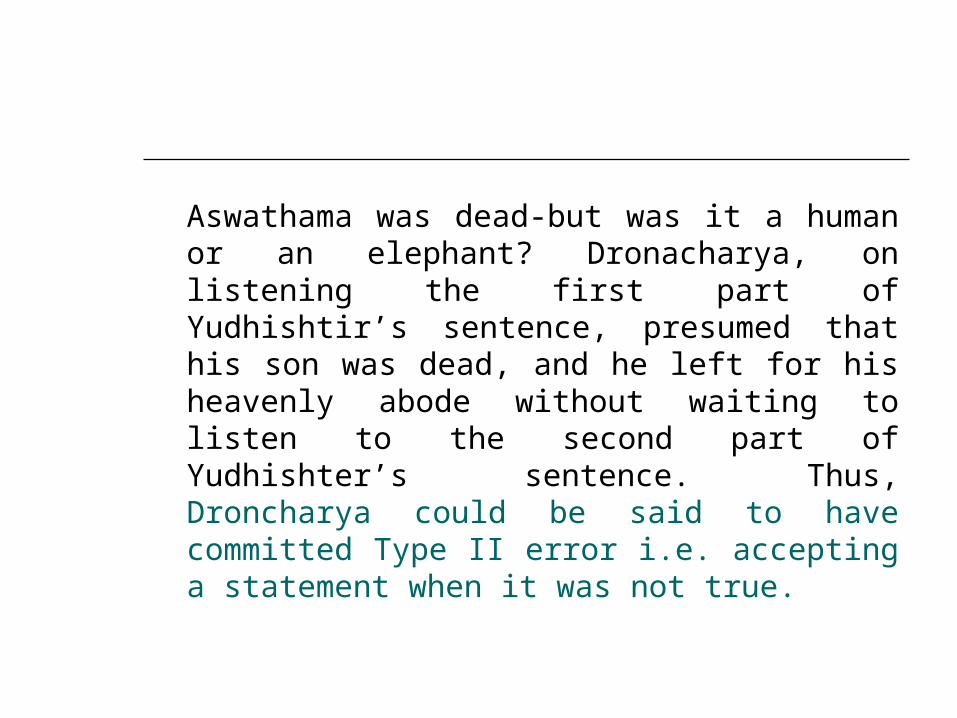
Aswathama was dead-but was it a human or an elephant? Dronacharya, on listening the first part of Yudhishtir’s sentence, presumed that his son was dead, and he left for his heavenly abode without waiting to listen to the second part of Yudhishter’s sentence. Thus, Droncharya could be said to have committed Type II error i.e. accepting a statement when it was not true.
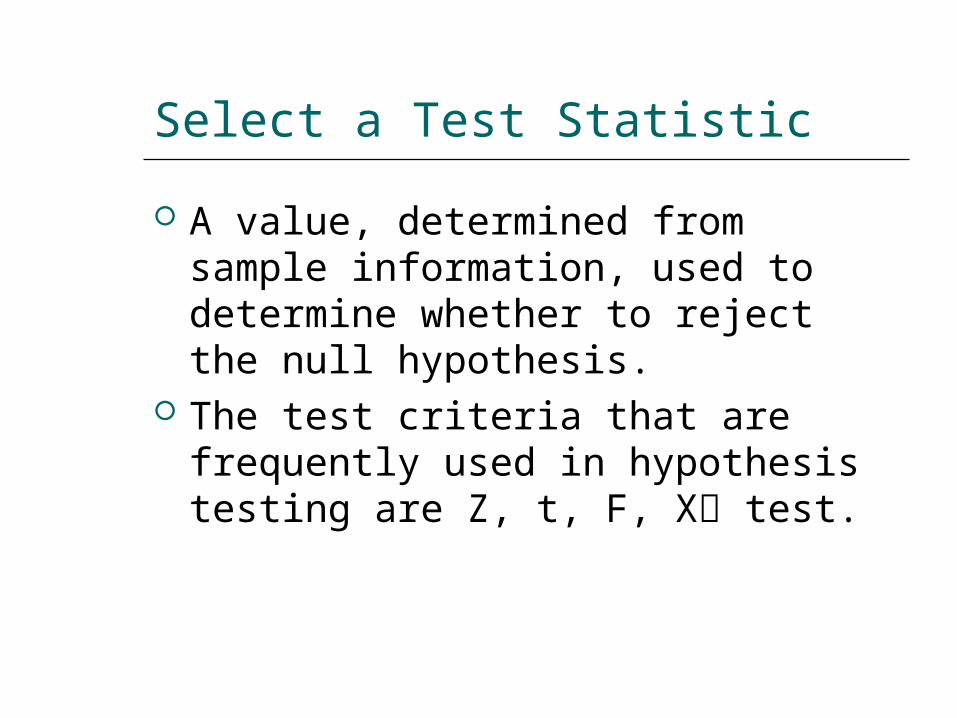
Select a Test Statistic
A value, determined from sample information, used to determine whether to reject the null hypothesis.
The test criteria that are frequently used in hypothesis testing are Z, t, F, Χ test.
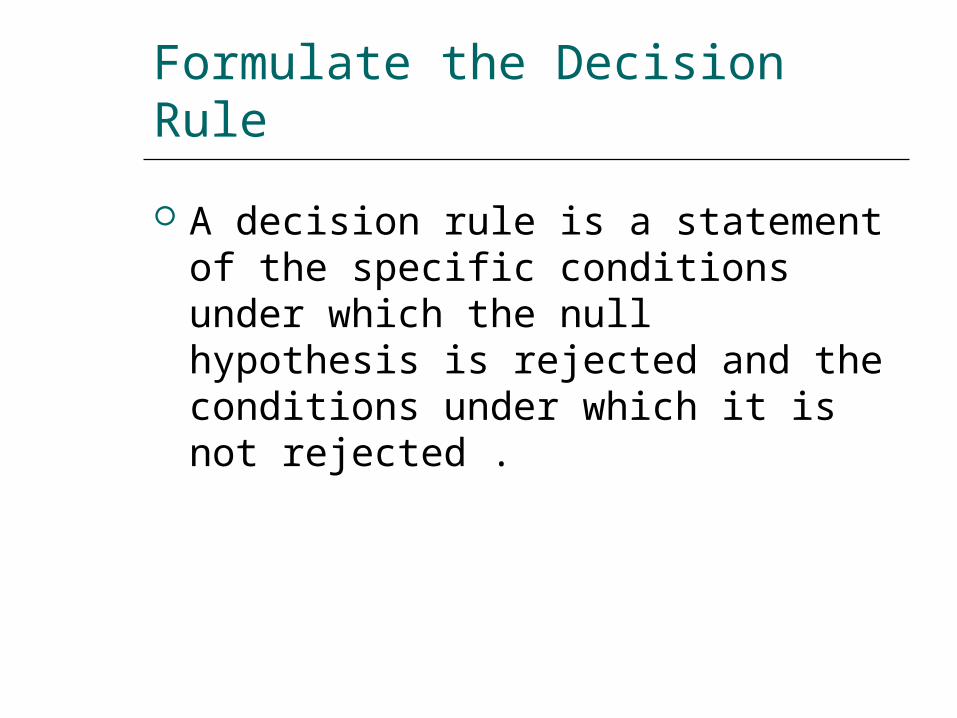
Formulate the Decision Rule
A decision rule is a statement of the specific conditions under which the null hypothesis is rejected and the conditions under which it is not rejected .

Step 5: Make a Decision
Make a decision regarding the null hypothesis on the sample information .
Interpret the results of the test.

One-Tailed Test of Hypothesis
Let us consider a null and alternative hypotheses as below:
One-tailed test contains the rejection region on one tail of the sampling distribution of a test statistic. In case of a left-tailed test, a researcher rejects the null hypothesis if the computed sample statistic is significantly lower than the hypothesizedpopulation parameter (considering the left side of the curve in Figure 10.5).
In case of a right-tailed test, a researcher rejects the null hypothesis if the computed sample statistic is significantly higher than the hypothesized population parameter (considering the right side of the curve in Figure 10.6).
Lower Tail Test Upper Tail TestHo: μ ≥ μo Ho: μ ≤ μo
H1: μ < μo H1: μ > μo

Figure 10.5: Acceptance and rejection regions for one-tailed (left) test (alpha = 0.05)

Figure 10.6: Acceptance and rejection regions for one-tailed (right) test (alpha = 0.05)
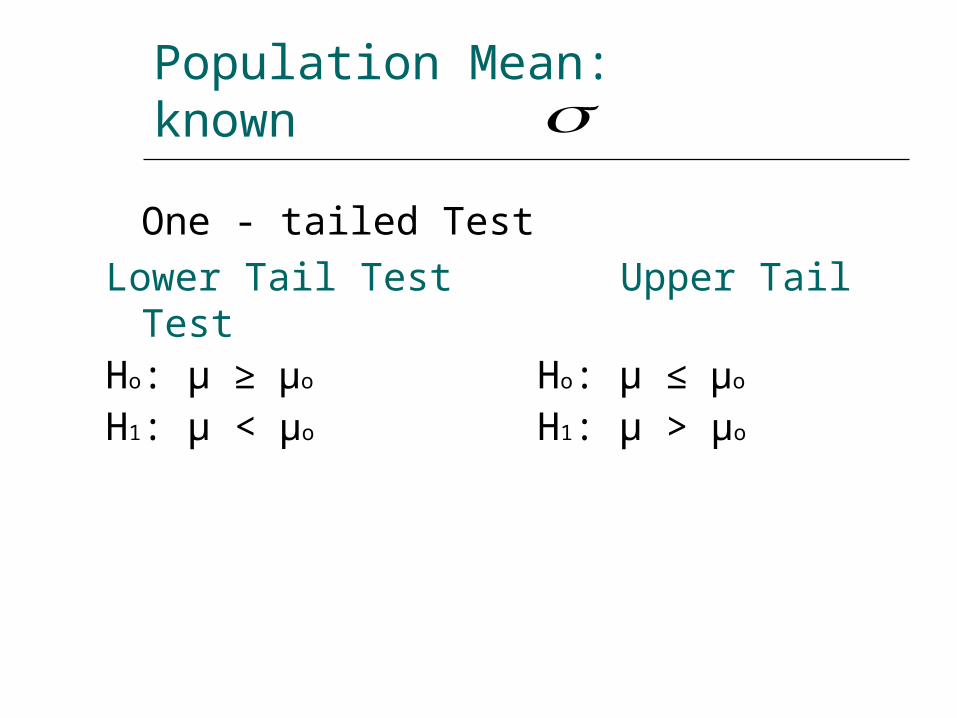
Population Mean: known
One - tailed TestLower Tail Test Upper Tail TestHo: μ ≥ μo Ho: μ ≤ μo
H1: μ < μo H1: μ > μo

Example:
The Federal trade Commission (FTC) periodically conducts statistical studies designed to tests the claims that manufacturers make about their products.
For example, the label on a large can of Hilltop Coffee States that the can contains 3 pounds of coffee.
The FTC knows that Hilltop production process cannot place exactly 3 pounds of coffee, even if the mean filling weight is for the population of all cans filled is 3 pounds per can.
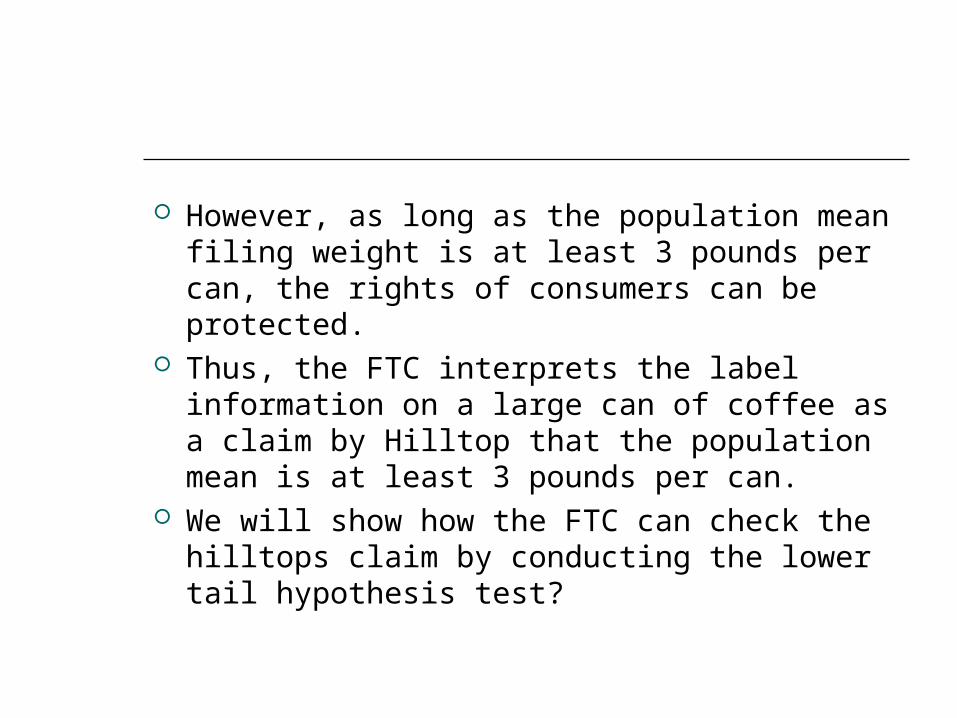
However, as long as the population mean filing weight is at least 3 pounds per can, the rights of consumers can be protected.
Thus, the FTC interprets the label information on a large can of coffee as a claim by Hilltop that the population mean is at least 3 pounds per can.
We will show how the FTC can check the hilltops claim by conducting the lower tail hypothesis test?

Develop Null and Alternative Hypothesis
If the population mean filling weight is at least 3 pounds per can, Hilltop’s claim is correct.
Ho: μ ≥ 3
Hı: μ < 3
The hypothesized value of population mean is μo = 3

Suppose a sample of 36 cans of coffee is selected.
Sample mean is computed as an estimate of population mean μ.
If < 3 pounds, the sample results will cast a doubt on null hypothesis.
We want to know how much less than 3 pounds must be before we would be willing to declare the difference significant and risk making a Type I error by falsely accusing Hilltop of a label violation.
x
x
x

The director of FTC’s program made the following statement:
If the company is meeting its weights specifications at µ = 3, I would like 99% chance of not taking any action against the company. Although I do not want to accuse the company wrongly of underfilling its product, I am willing to risk a 1% chance of making such an error.”
Therefore from the director’s statement we would set a = .01
Thus we must design the hypothesis test so that probability of making a type I error when µ = 3 is .01

Test Statistic
For the Hilltop Coffee study, previous FTC test show that the population standard deviation can be assumed known with the value of σ = .18
In addition these tests also show the population of filling weights can be assumed to have a normal distribution.

Sampling distribution of x
36 n
03.018. x

TEST STATISTIC FOR HYPOTHESIS TESTS ABOUT A POPULATION MEAN: σ KNOWN
n /
0
xz

Suppose the sample of 36 Hilltop coffee cans provides a sample mean of = 2.92 small enough to cause us to reject Ho ?
= 2.92; σ = .18 and n = 36
x
x
36.18/ n /
67.2392.20
xz
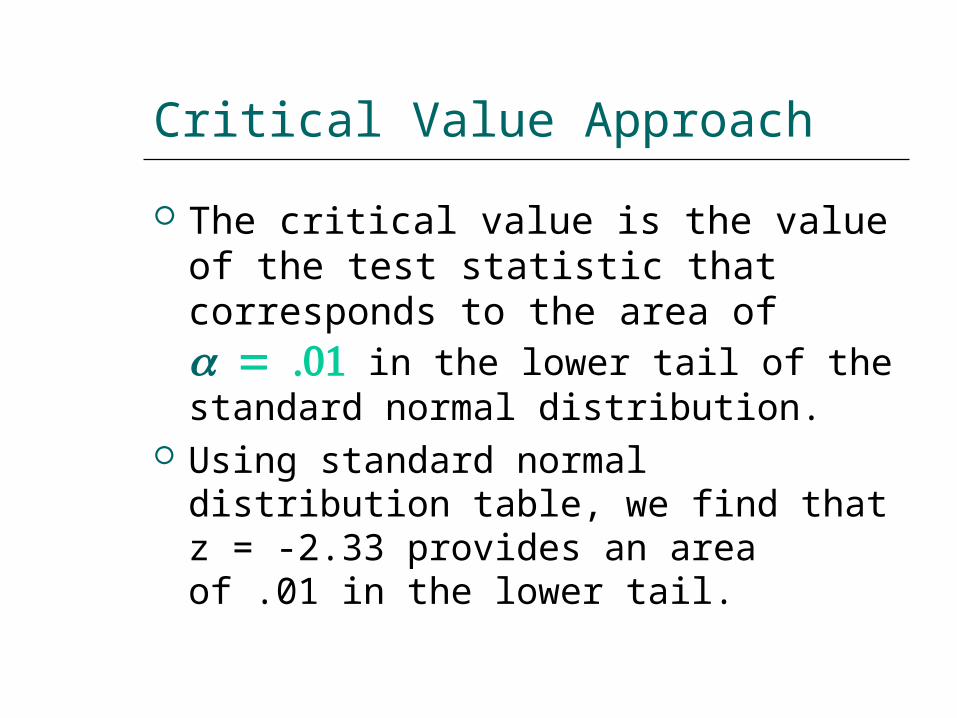
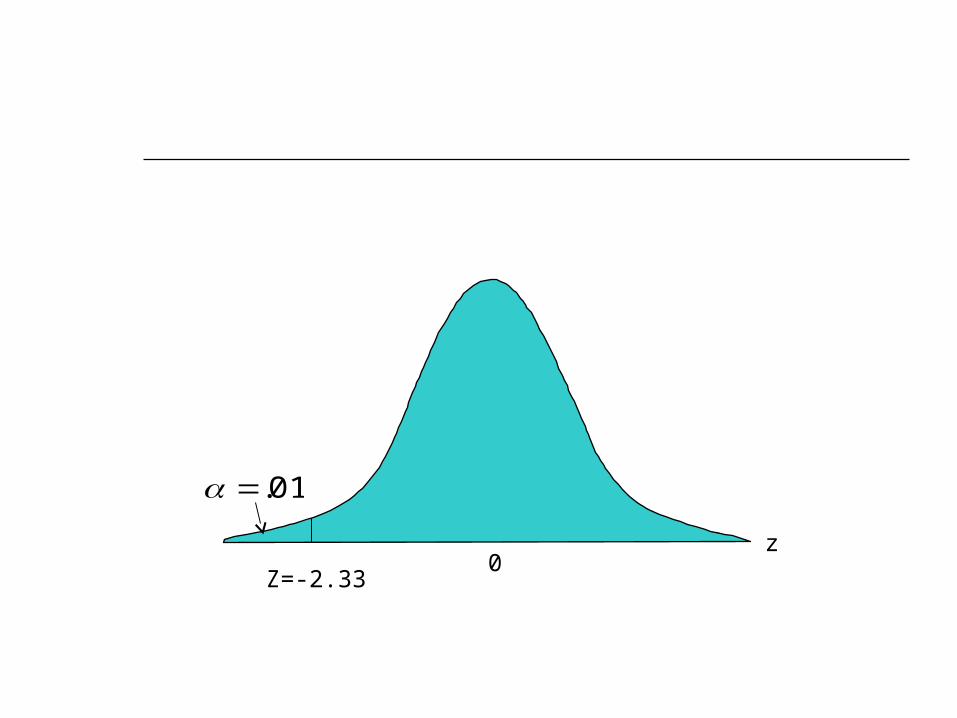
Critical Value Approach
The critical value is the value of the test statistic that corresponds to the area of in the lower tail of the standard normal distribution.
Using standard normal distribution table, we find that z = -2.33 provides an area of .01 in the lower tail.

For Hilltop Coffee Study Critical Value Rejection Rule for a level of significance of .01 is
Reject Ho if Z ≤ -2.33
0z
Z=-2.33
01.
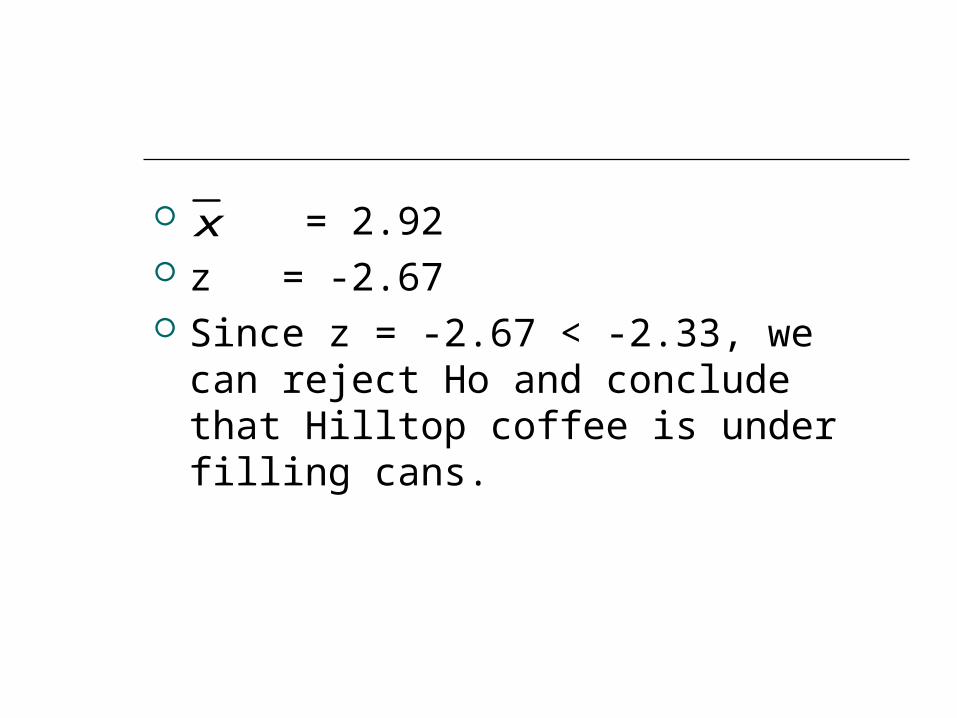
= 2.92 z = -2.67 Since z = -2.67 < -2.33, we can
reject Ho and conclude that Hilltop coffee is under filling cans.
x

p-value approach
The p-value is a probability, computed using the test statistic, that measures the support (or lack of support) provided by the sample for the null hypothesis.
It has become the preferred method when using computer software packages such as Excel, SPSS, Minitab.

Because p-value is probability, it ranges from 0 to 1.
In general the smaller the p-value, the less support it indicates for the null hypothesis.

p-value for Hilltop coffee example
Thus the p-value is the probability that the test statistic z is less than or equal to -2.67
Using the standard normal distribution table, we find that the area between the mean and z = -2.67 is .4962.
Thus the p-value is .5000-.4962 = .0038 This p-value indicates a small probability of
obtaining a sample mean of = 2.92 or smaller when sampling from a population with μ = 3.
x

.0038 <= .01, therefore we reject H0

Two – Tailed Test
Ho: μ = μo
H1: μ ≠ μo
Example:
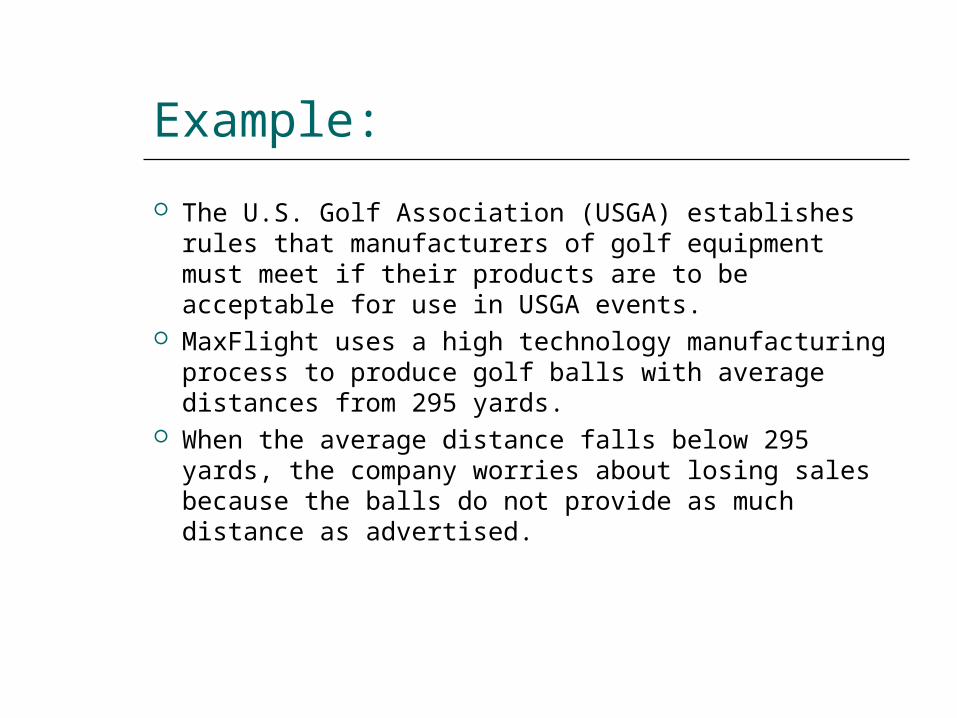
The U.S. Golf Association (USGA) establishes rules that manufacturers of golf equipment must meet if their products are to be acceptable for use in USGA events.
MaxFlight uses a high technology manufacturing process to produce golf balls with average distances from 295 yards.
When the average distance falls below 295 yards, the company worries about losing sales because the balls do not provide as much distance as advertised.
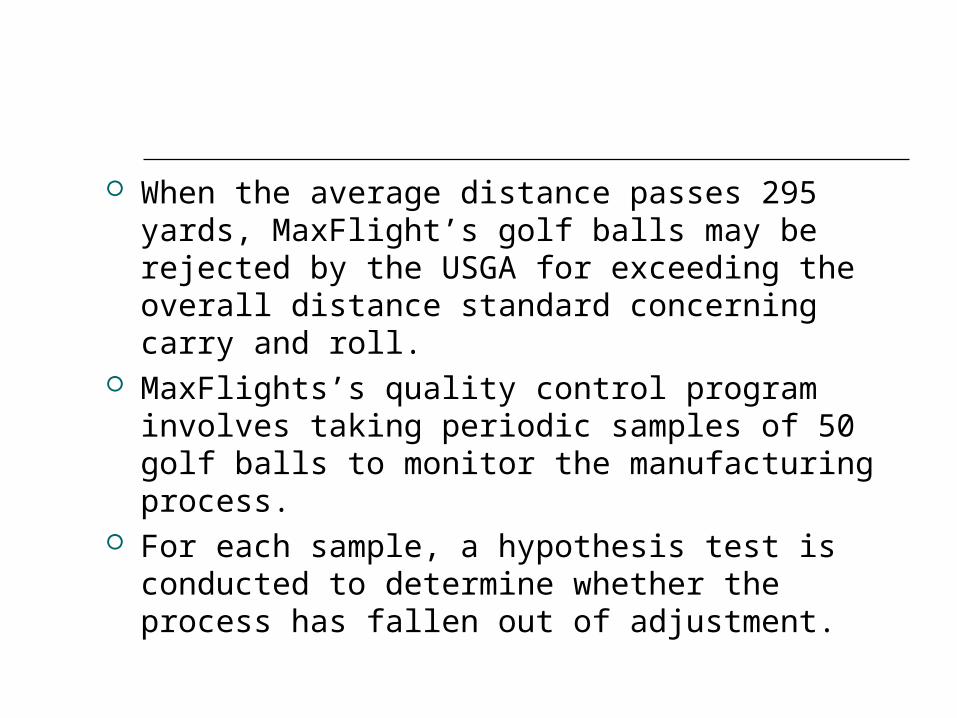
When the average distance passes 295 yards, MaxFlight’s golf balls may be rejected by the USGA for exceeding the overall distance standard concerning carry and roll.
MaxFlights’s quality control program involves taking periodic samples of 50 golf balls to monitor the manufacturing process.
For each sample, a hypothesis test is conducted to determine whether the process has fallen out of adjustment.
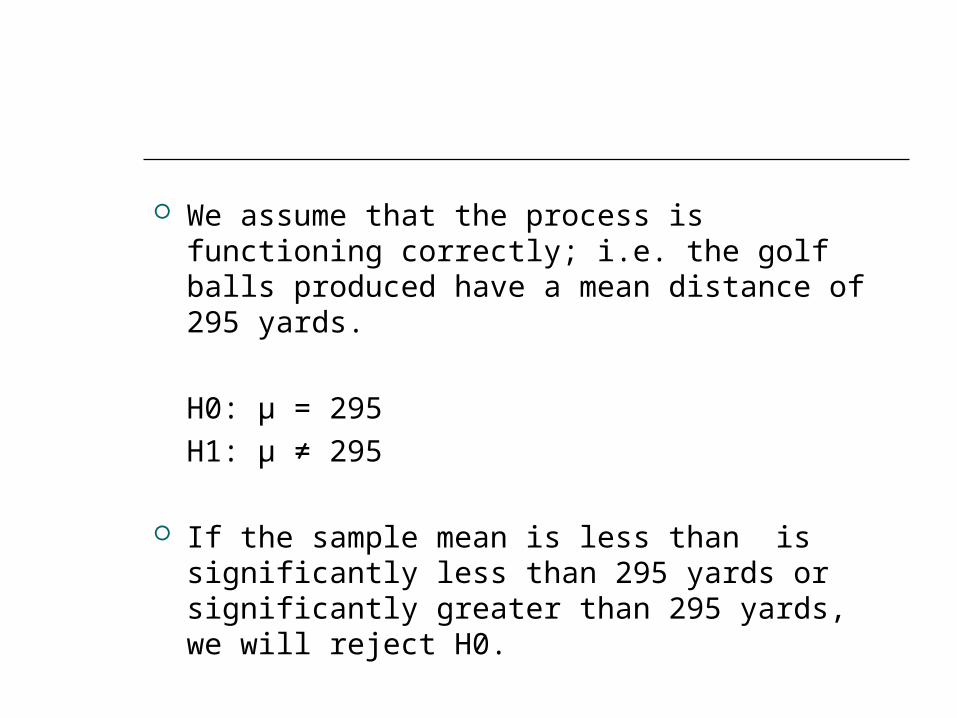
We assume that the process is functioning correctly; i.e. the golf balls produced have a mean distance of 295 yards.
H0: μ = 295H1: μ ≠ 295
If the sample mean is less than is significantly less than 295 yards or significantly greater than 295 yards, we will reject H0.
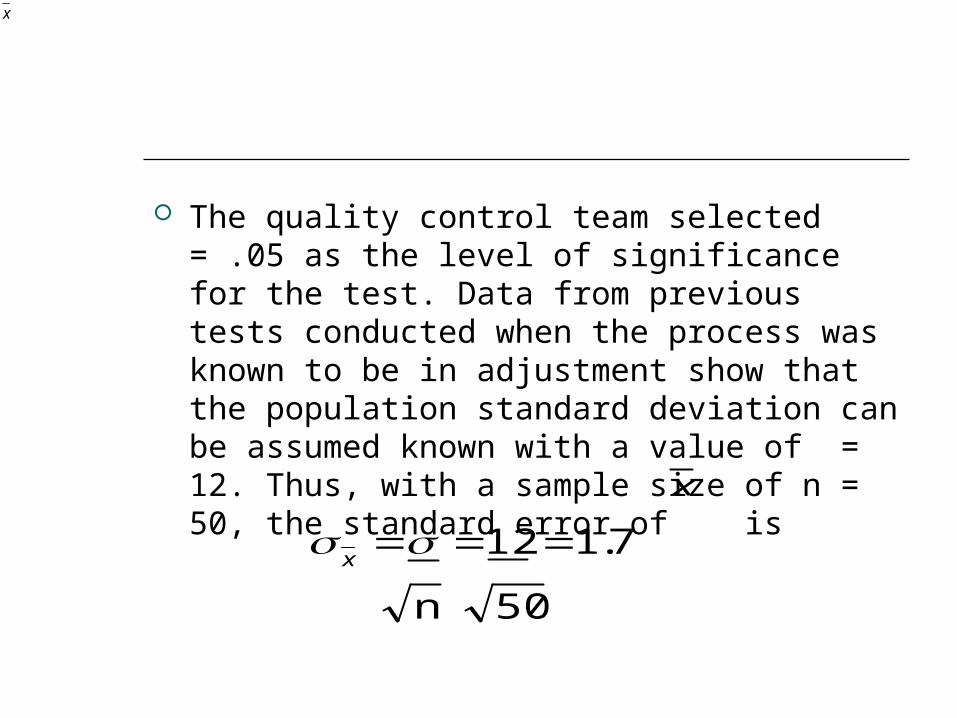
The quality control team selected = .05 as the level of significance for the test. Data from previous tests conducted when the process was known to be in adjustment show that the population standard deviation can be assumed known with a value of = 12. Thus, with a sample size of n = 50, the standard error of is
x
x
50 n
7.112 x
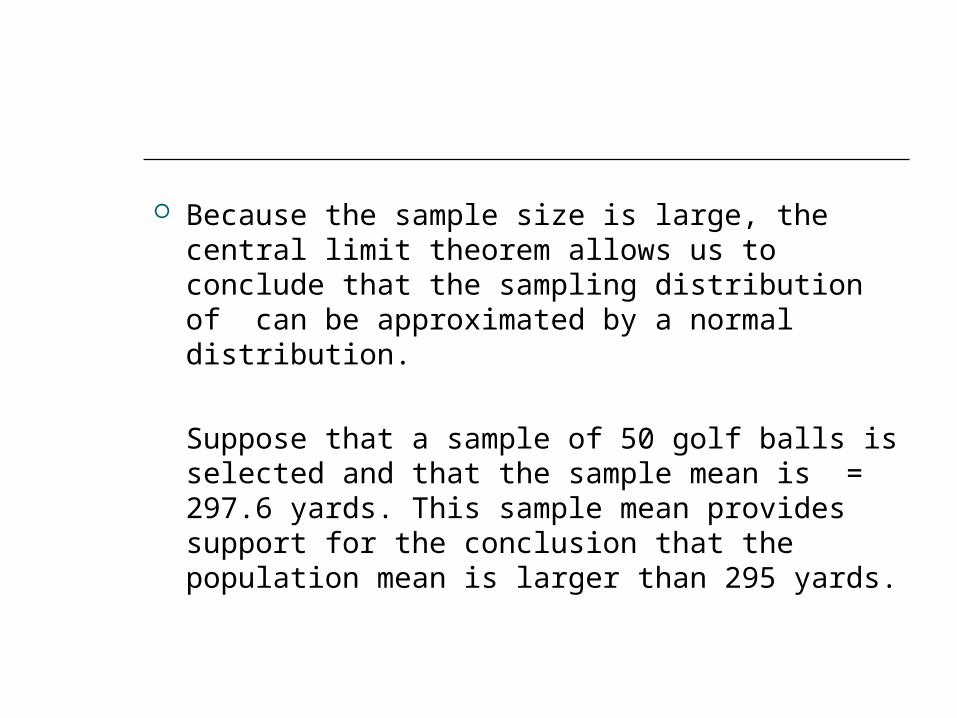
Because the sample size is large, the central limit theorem allows us to conclude that the sampling distribution of can be approximated by a normal distribution.
Suppose that a sample of 50 golf balls is selected and that the sample mean is = 297.6 yards. This sample mean provides support for the conclusion that the population mean is larger than 295 yards.

Computing z - statistic
5012/ /
53.12956.2970
n
xz
Critical Value Approach
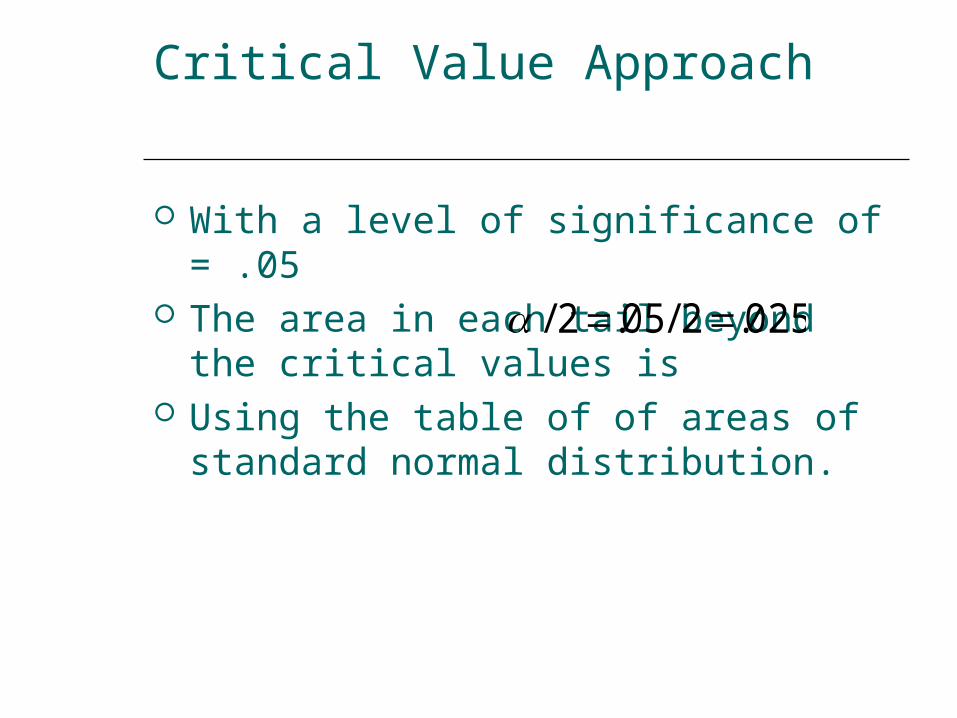
With a level of significance of = .05 The area in each tail beyond the
critical values is Using the table of of areas of
standard normal distribution.
025.2/05.2/

0z
-1.96 1.96
Reject H0Reject H0

96.1 and 96.1 025.025. zz
Reject H0 if z ≤ 1.96 or if z ≥ 1.96
Because the value of the test for the MaxFlight study is z = 1.53,The statistical evidence will not permit us to reject the null hypothesis at the .05 level of significance.

p-value Approach
Area between mean and z = 1.53 is .4370 .5000 - .4370 = .0630 P-value = 2(.0630) = .1260 Since p-value = .1260 >.05 Null hypothesis is not rejected, no action
will be taken to adjust the MaxFlight manufacturing process.

0z
-1.53 1.53
( 1.53) .0630P z ( 1.53) .0630P z
P-value = 2(.0630) = .1260

Example:
• The Jamestown Steel Company manufactures and assembles desks and other office equipment at several plants in Western New York State. The weekly production of Model A325 desk at the Fredonia Plant follows a normal distribution, with a mean of 200 and a standard deviation of 16. recently because of market expansion, new production methods have been introduced and new employees hired.

The vice president of manufacturing would like to investigate whether there has been a change in the weekly production of the model A325 desk. To put it another way, is the mean number of desk produced at the Florida plant different from 200 at the .01 significance level?
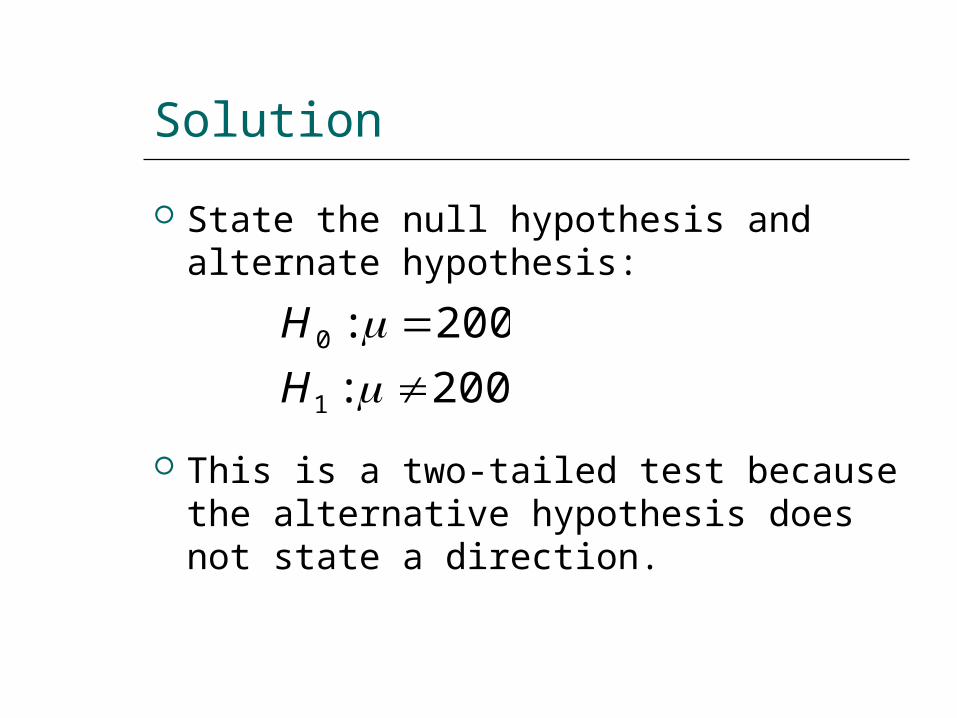
Solution
State the null hypothesis and alternate hypothesis:
This is a two-tailed test because the alternative hypothesis does not state a direction.
200:
200:
1
0
H
H

As noted, the .01 level of significance is used.
It is the probability of committing a Type I error, and it is the probability of rejecting a true null hypothesis.

Select the test statistic
n/
xz

Formulate the decision Rule
The decision rule is formulated by finding the critical values of z.
Since it is a two tailed test, half of .01, or .005, is placed in each tail.
The area where H0 is not rejected, located between the two tails, is therefore .99.

Make a decision and interpret the result
50/16 n/
55.12005.203
xz
Because H0 does not fall in the rejection region, H0 is not rejectedWe conclude that population mean is not different from 200.

Lower Tail Test Upper Tail Test Two-Tailed Test
Hypothesis
Test Statistic
Rejection Rule:p-value app
Rejection Rule:Critical value
0 0
1 0
:
:
H
H
0 0
1 0
:
:
H
H
0 0
1 0
:
:
H
H
0x
n
0x
n
0x
n
0Reject H if
p value 0Reject H if
p value 0Reject H if
p value
0Reject H if
z z0Reject H if
z z
0Reject
if
H if
z z
or z z
Related Documents