Sorana D. BOLBOACĂ Curs 1 8 December 2014 1 HYPOTHESES TESTING

Welcome message from author
This document is posted to help you gain knowledge. Please leave a comment to let me know what you think about it! Share it to your friends and learn new things together.
Transcript
Sorana D. BOLBOACĂ Curs 1
8 D
ec
em
be
r 2
01
4
1
HYPOTHESES TESTING
Sorana D. BOLBOACĂ Curs 1
8 D
ec
em
be
r 2
01
4
2
Content
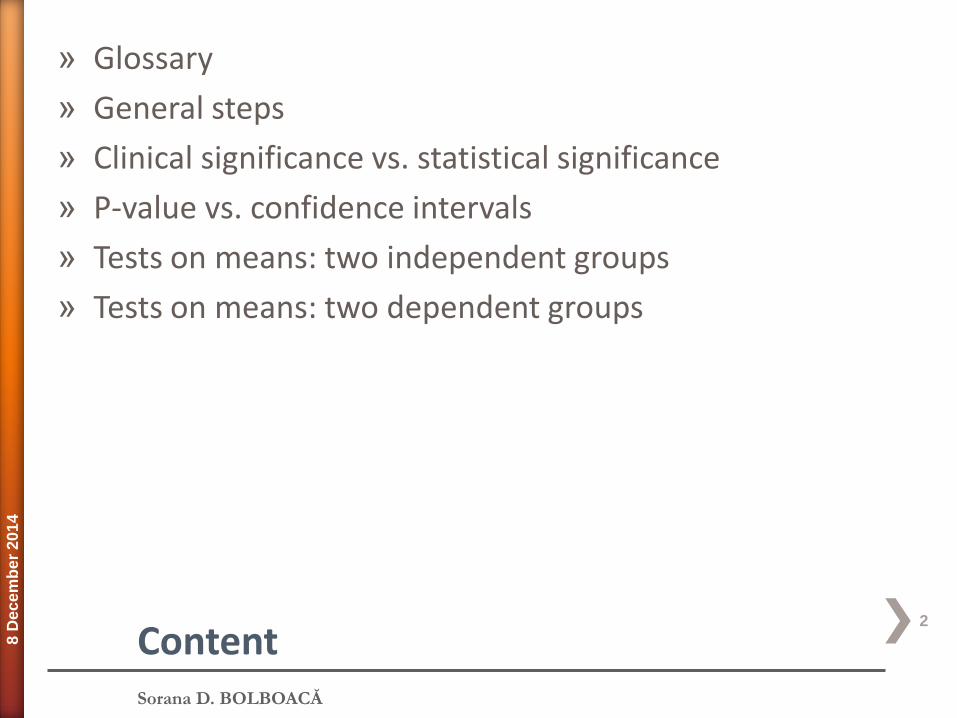
» Glossary
» General steps
» Clinical significance vs. statistical significance
» P-value vs. confidence intervals
» Tests on means: two independent groups
» Tests on means: two dependent groups
Sorana D. BOLBOACĂ Curs 1
8 D
ec
em
be
r 2
01
4
3
Glossary
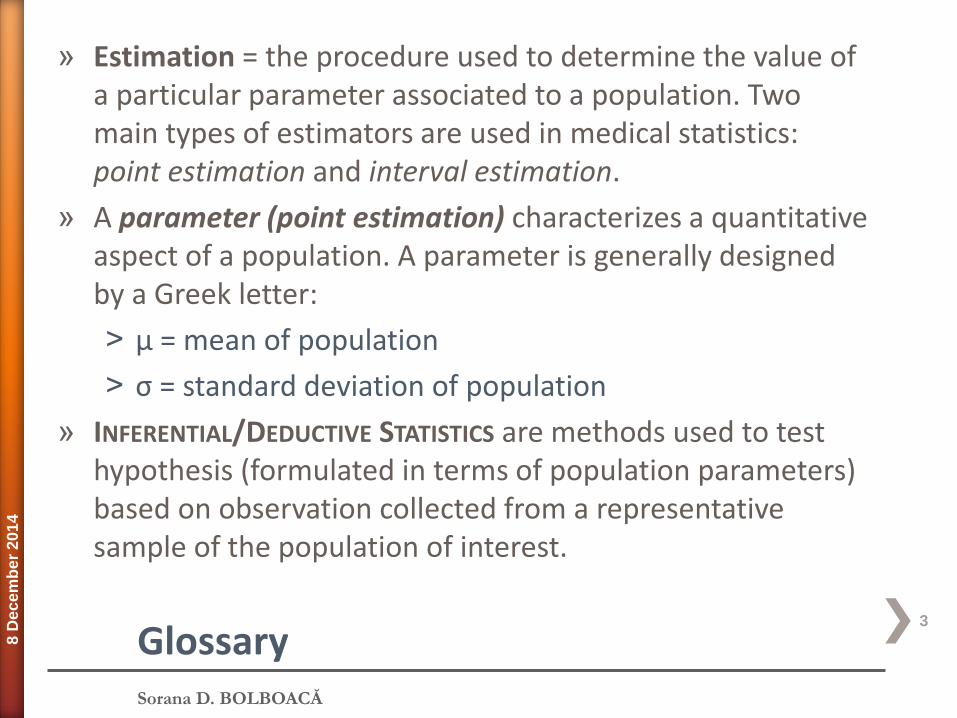
» Estimation = the procedure used to determine the value of a particular parameter associated to a population. Two main types of estimators are used in medical statistics: point estimation and interval estimation.
» A parameter (point estimation) characterizes a quantitative aspect of a population. A parameter is generally designed by a Greek letter:
˃ μ = mean of population
˃ σ = standard deviation of population
» INFERENTIAL/DEDUCTIVE STATISTICS are methods used to test hypothesis (formulated in terms of population parameters) based on observation collected from a representative sample of the population of interest.
Sorana D. BOLBOACĂ Curs 1
8 D
ec
em
be
r 2
01
4
4
Glossary
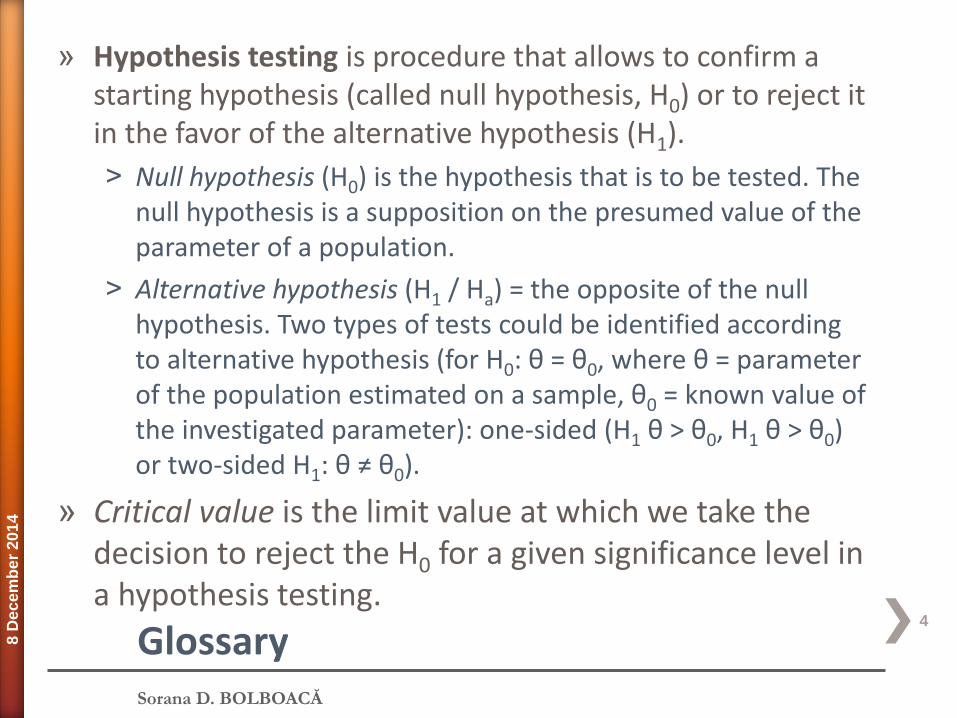
» Hypothesis testing is procedure that allows to confirm a starting hypothesis (called null hypothesis, H0) or to reject it in the favor of the alternative hypothesis (H1).
˃ Null hypothesis (H0) is the hypothesis that is to be tested. The null hypothesis is a supposition on the presumed value of the parameter of a population.
˃ Alternative hypothesis (H1 / Ha) = the opposite of the null hypothesis. Two types of tests could be identified according to alternative hypothesis (for H0: θ = θ0, where θ = parameter of the population estimated on a sample, θ0 = known value of the investigated parameter): one-sided (H1 θ > θ0, H1 θ > θ0) or two-sided H1: θ ≠ θ0).
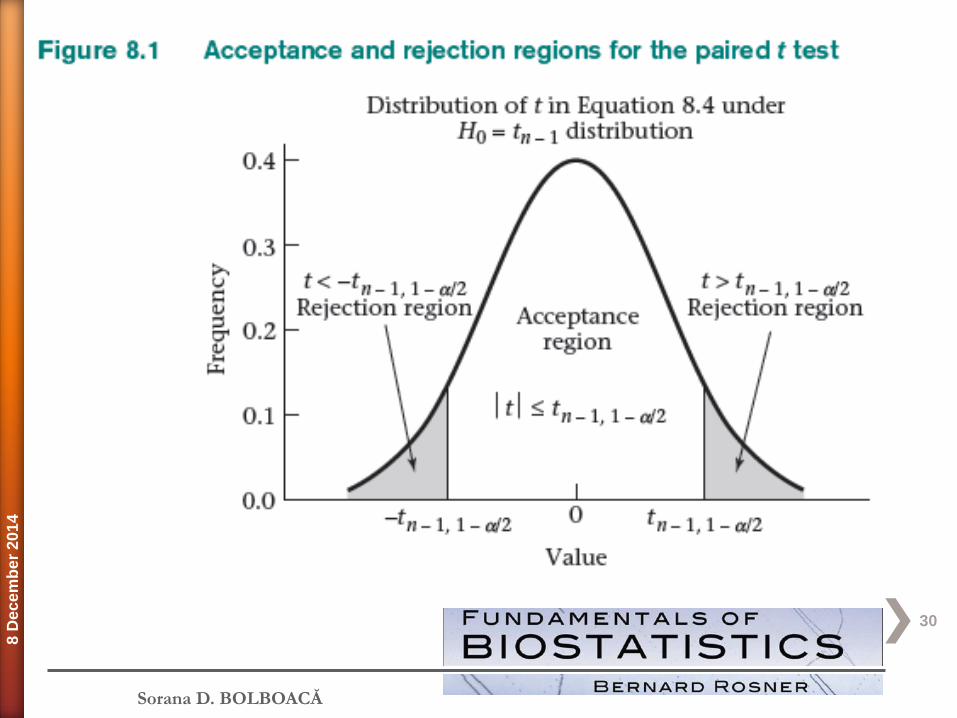
» Critical value is the limit value at which we take the decision to reject the H0 for a given significance level in a hypothesis testing.

Sorana D. BOLBOACĂ Curs 1
8 D
ec
em
be
r 2
01
4
5
Glossary
» Degrees of freedom (df) is the number of values used in the final calculation of a given statistics.
» Acceptance region (opposite to rejection region) is the interval within sampling distribution of the test statistics that is consistent with the null hypothesis (H0) from hypothesis testing. The acceptance region is associated with a probability of 1-α, where α = significance level of the test.
» Rejection region = the interval measured in the sampling distribution of the statistic under study that leads to rejection of the null hypothesis in a hypothesis test. The rejection region is complementary to the acceptance region and is associated to significance level of the test or type I error.
» Level of significance (α, significance level) = a parameter of a hypothesis test which has a value fixed in advance by the user. It is the probability of rejecting the null hypothesis H0 when it is true (α=P{reject H0]H0 true}).
Sorana D. BOLBOACĂ Curs 1
8 D
ec
em
be
r 2
01
4
6
Glossary
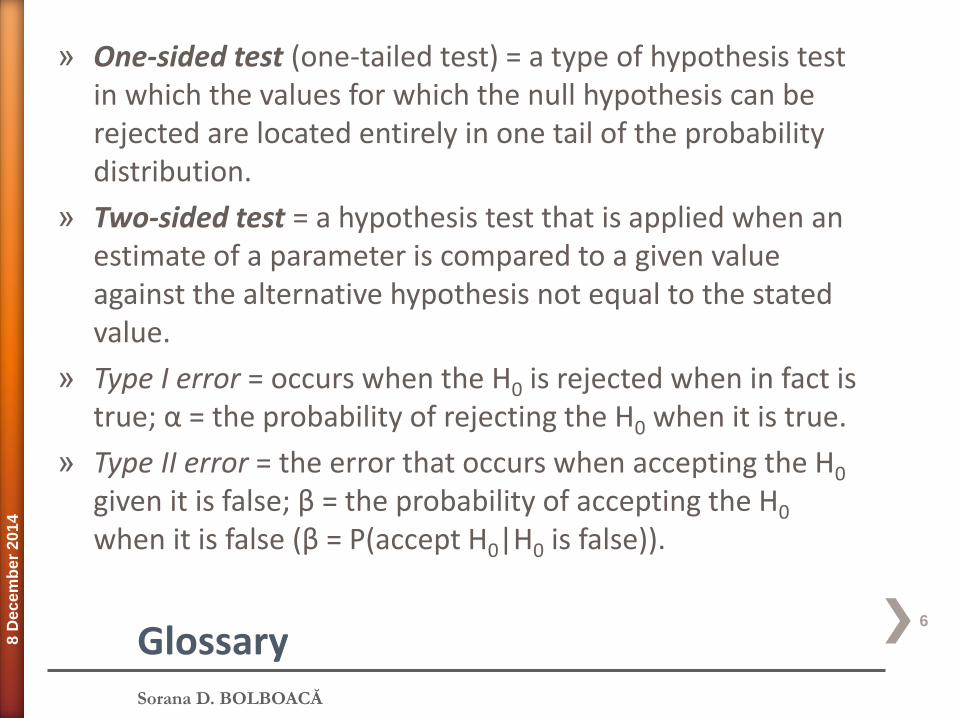
» One-sided test (one-tailed test) = a type of hypothesis test in which the values for which the null hypothesis can be rejected are located entirely in one tail of the probability distribution.
» Two-sided test = a hypothesis test that is applied when an estimate of a parameter is compared to a given value against the alternative hypothesis not equal to the stated value.
» Type I error = occurs when the H0 is rejected when in fact is true; α = the probability of rejecting the H0 when it is true.
» Type II error = the error that occurs when accepting the H0 given it is false; β = the probability of accepting the H0 when it is false (β = P(accept H0|H0 is false)).
Sorana D. BOLBOACĂ Curs 1
8 D
ec
em
be
r 2
01
4
7
Adjustment of p-value for multiple comparisons
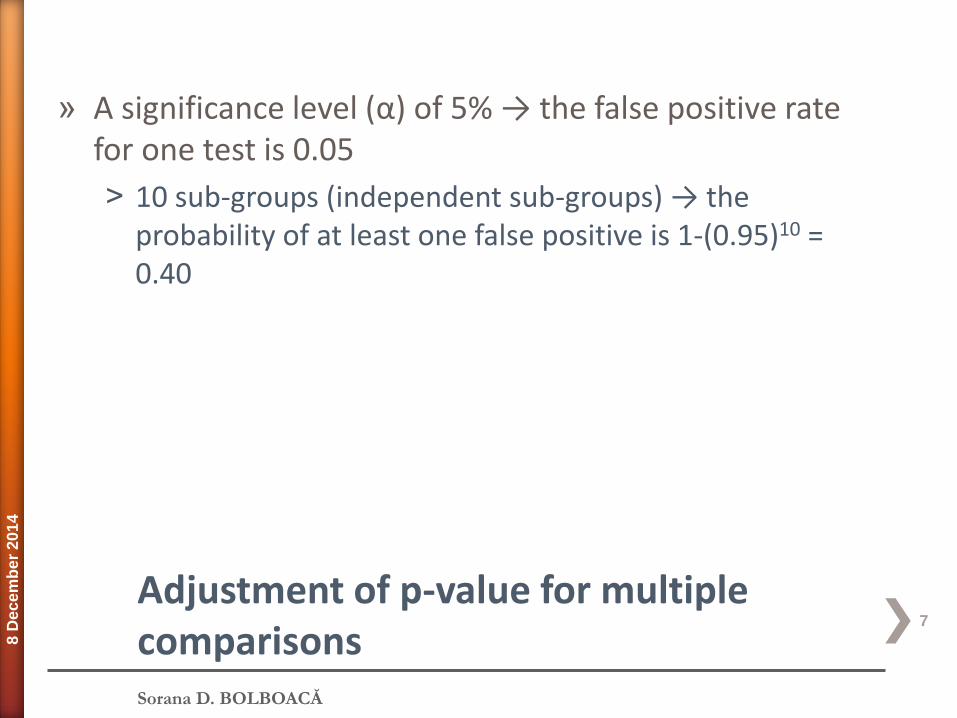
» A significance level (α) of 5% → the false positive rate for one test is 0.05
˃ 10 sub-groups (independent sub-groups) → the probability of at least one false positive is 1-(0.95)10 = 0.40

Sorana D. BOLBOACĂ Curs 1
8 D
ec
em
be
r 2
01
4
8
» Interpret the results in the context of study design.
» Effect that are not clinically important may be statistically significant when the sample size is large enough (e.g. a small standard error exists).
» Pay attention to effect size (results) and confidence intervals (clinical significance).
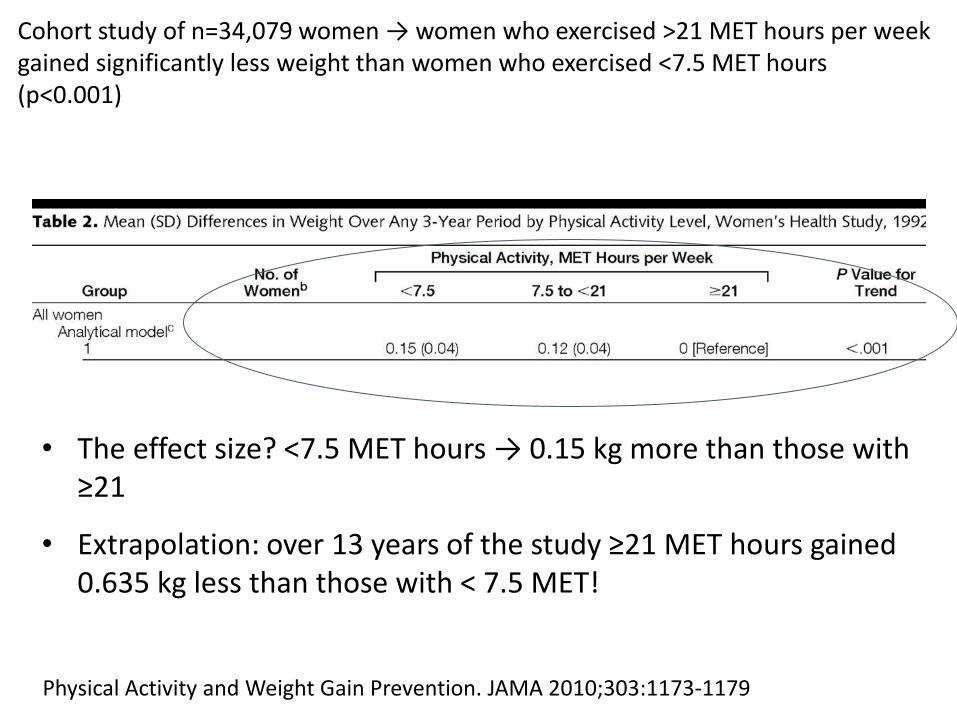
• The effect size? <7.5 MET hours → 0.15 kg more than those with ≥21
• Extrapolation: over 13 years of the study ≥21 MET hours gained 0.635 kg less than those with < 7.5 MET!
Physical Activity and Weight Gain Prevention. JAMA 2010;303:1173-1179
Cohort study of n=34,079 women → women who exercised >21 MET hours per week gained significantly less weight than women who exercised <7.5 MET hours (p<0.001)

Sorana D. BOLBOACĂ Curs 1
8 D
ec
em
be
r 2
01
4
10
Which statistical test?
Outcome Variable
Are the observations independent or dependent? Assumptions
independent dependent
Continuous (e.g. SBP)
T-test
ANOVA
Correlation - Pearson
Linear regression
Paired t-test
Repeated-measures ANOVA
Outcome is normally distributed (important for small samples).
Outcome and predictor have a linear relationship.
Binary or categorical (e.g. disease “yes”/”no”)
Relative risks / Odd ratio
Chi-square test / Fisher
Logistic regression
McNemar’s test
Conditional logistic regression
Sufficient numbers in each cell (>=5)
Time-to-event (e.g. time to adverse effects)
Kaplan-Meier statistics
Cox regression
n/a Cox regression assumes proportional hazards between groups

Sorana D. BOLBOACĂ Curs 1
8 D
ec
em
be
r 2
01
4
11
Main concepts:
» Estimation on the population parameter.
» There are two hypotheses, the null and the alternative hypotheses.
˃ The procedure begins with the assumption that the null hypothesis is true.
» The goal is to determine whether there is enough evidence to infer that the alternative hypothesis is true, or the null is not likely to be true.
» There are two possible decisions:
˃ Conclude that there is enough evidence to support the alternative hypothesis. Reject the null.
˃ Conclude that there is not enough evidence to support the alternative hypothesis. Fail to reject the null.
Sorana D. BOLBOACĂ Curs 1
8 D
ec
em
be
r 2
01
4
12
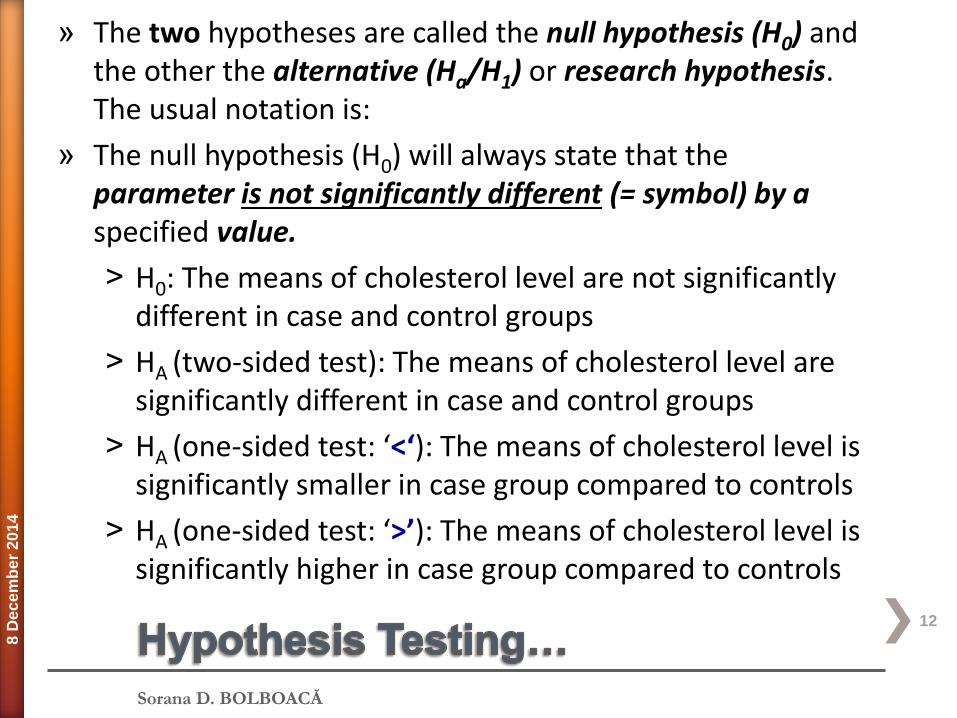
» The two hypotheses are called the null hypothesis (H0) and the other the alternative (Ha/H1) or research hypothesis. The usual notation is:
» The null hypothesis (H0) will always state that the parameter is not significantly different (= symbol) by a specified value.
˃ H0: The means of cholesterol level are not significantly different in case and control groups
˃ HA (two-sided test): The means of cholesterol level are significantly different in case and control groups
˃ HA (one-sided test: ‘<‘): The means of cholesterol level is significantly smaller in case group compared to controls
˃ HA (one-sided test: ‘>’): The means of cholesterol level is significantly higher in case group compared to controls

Sorana D. BOLBOACĂ Curs 1
8 D
ec
em
be
r 2
01
4
13
» When a research study predicts a specific direction for the treatment effect (increase or decrease) → one-tailed test or directional test: ˃ directional prediction in HA/H1
˃ direction in the location of the critical region.
» E.g.: If the original population has a mean of SBP μ = 120 mmHg and the treatment is predicted to decrease the value, then the hypotheses would state that after treatment:
H0: μ ≥ 120
In this case, the entire critical region would be located in the right-hand tail of the distribution because large values for M would demonstrate that there is an increase and would tend to reject the null hypothesis
Sorana D. BOLBOACĂ Curs 1
8 D
ec
em
be
r 2
01
4
14
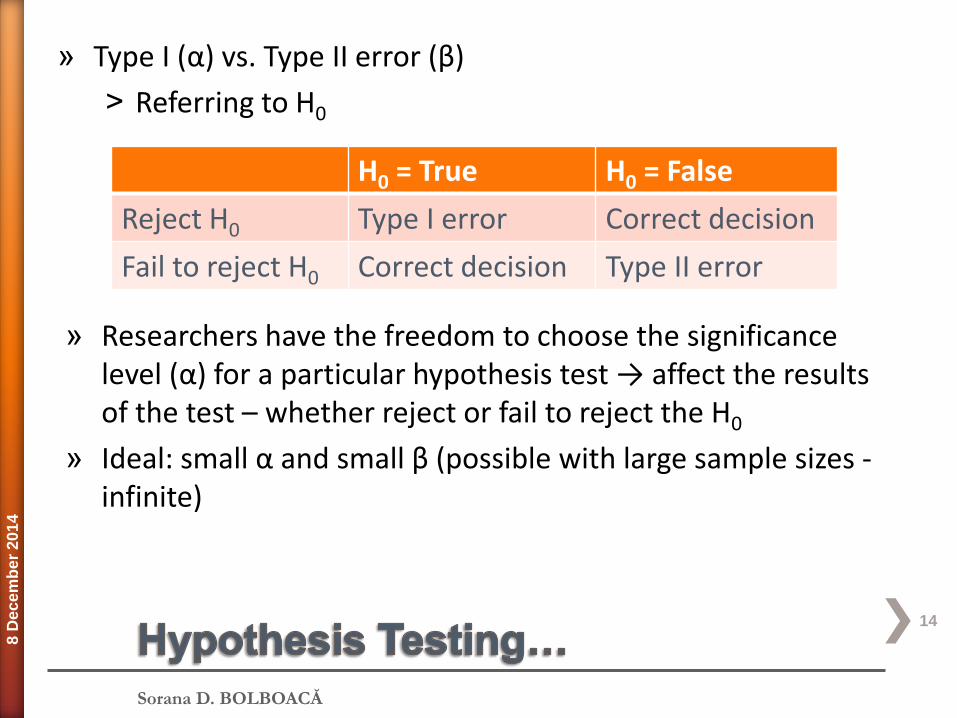
» Type I (α) vs. Type II error (β)
˃ Referring to H0
H0 = True H0 = False
Reject H0 Type I error Correct decision
Fail to reject H0 Correct decision Type II error
» Researchers have the freedom to choose the significance level (α) for a particular hypothesis test → affect the results of the test – whether reject or fail to reject the H0
» Ideal: small α and small β (possible with large sample sizes - infinite)

Sorana D. BOLBOACĂ Curs 1
8 D
ec
em
be
r 2
01
4
15
» Conclusion:
˃ Reject H0
˃ Fail to reject H0
» Never ACCEPT the H0
˃ There are not enough evidence based on the investigated sample to reject the null hypothesis
Sorana D. BOLBOACĂ Curs 1
8 D
ec
em
be
r 2
01
4
16
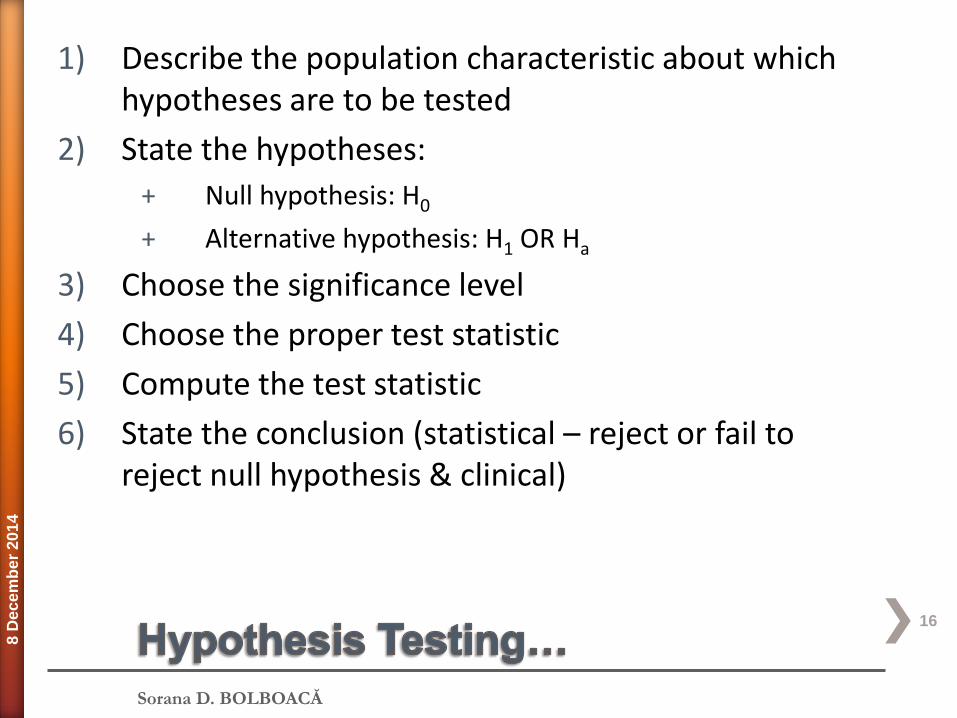
1) Describe the population characteristic about which hypotheses are to be tested
2) State the hypotheses:
+ Null hypothesis: H0
+ Alternative hypothesis: H1 OR Ha
3) Choose the significance level
4) Choose the proper test statistic
5) Compute the test statistic
6) State the conclusion (statistical – reject or fail to reject null hypothesis & clinical)
Sorana D. BOLBOACĂ Curs 1
8 D
ec
em
be
r 2
01
4
17
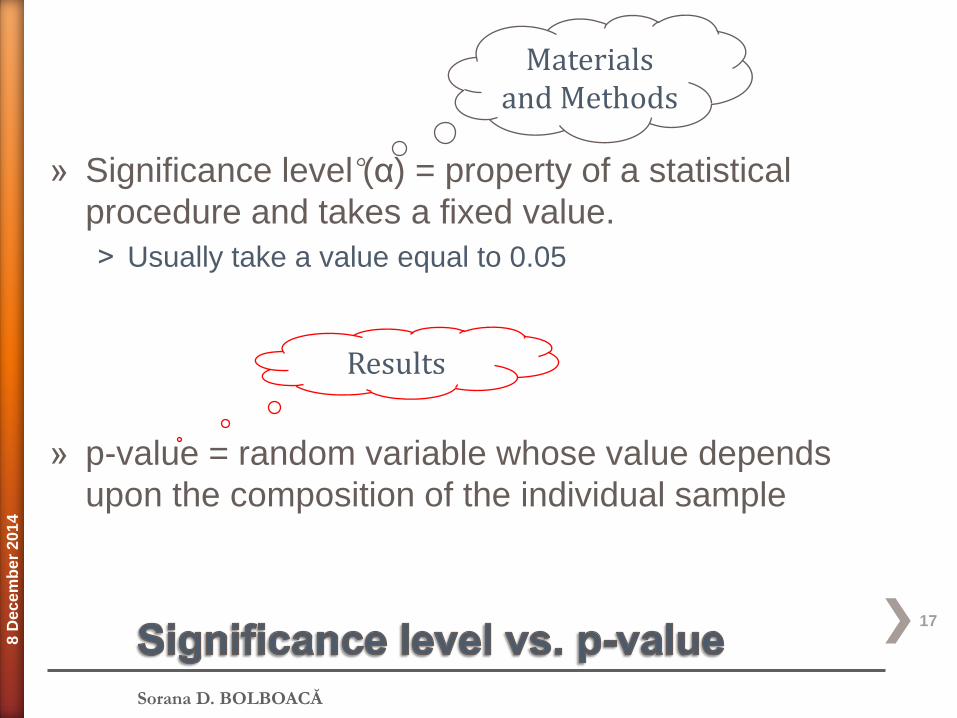
» Significance level (α) = property of a statistical
procedure and takes a fixed value.
˃ Usually take a value equal to 0.05
» p-value = random variable whose value depends
upon the composition of the individual sample
Materials and Methods
Results
Sorana D. BOLBOACĂ Curs 1
8 D
ec
em
be
r 2
01
4
18
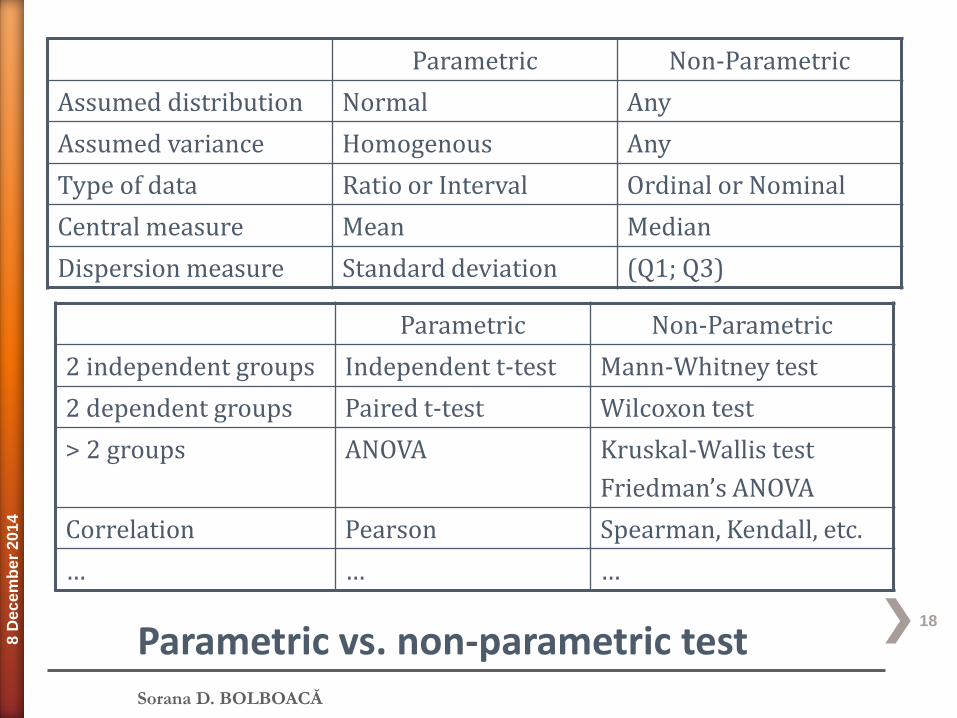
Parametric vs. non-parametric test
Parametric Non-Parametric
Assumed distribution Normal Any
Assumed variance Homogenous Any
Type of data Ratio or Interval Ordinal or Nominal
Central measure Mean Median
Dispersion measure Standard deviation (Q1; Q3)
Parametric Non-Parametric
2 independent groups Independent t-test Mann-Whitney test
2 dependent groups Paired t-test Wilcoxon test
> 2 groups ANOVA Kruskal-Wallis test
Friedman’s ANOVA
Correlation Pearson Spearman, Kendall, etc.
… … …
Sorana D. BOLBOACĂ Curs 1
8 D
ec
em
be
r 2
01
4
19
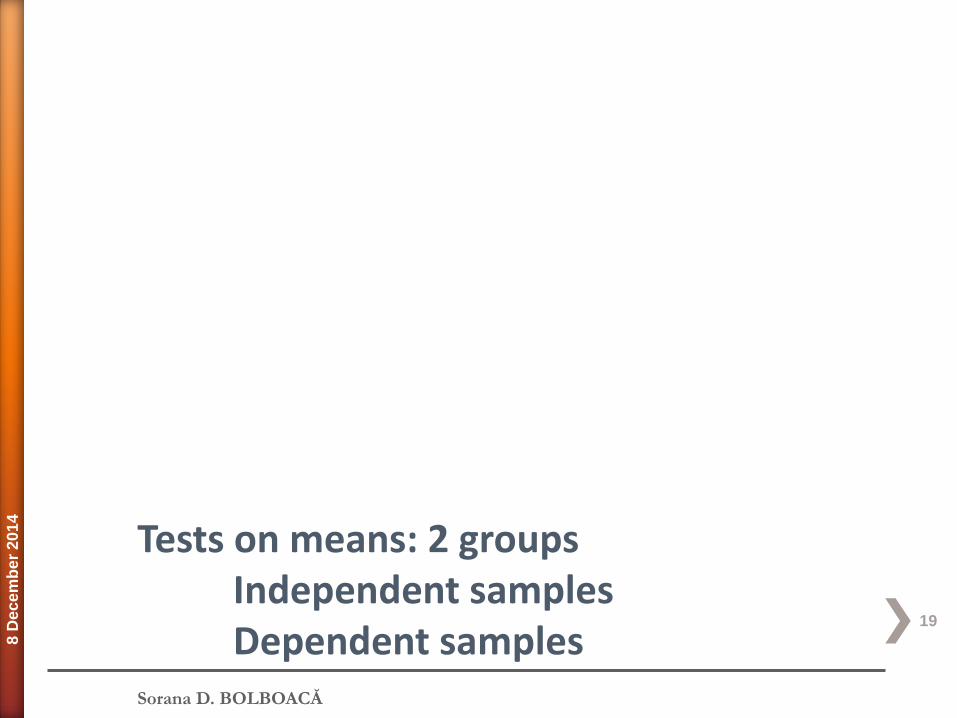
Tests on means: 2 groups Independent samples Dependent samples
Sorana D. BOLBOACĂ Curs 1
8 D
ec
em
be
r 2
01
4
20
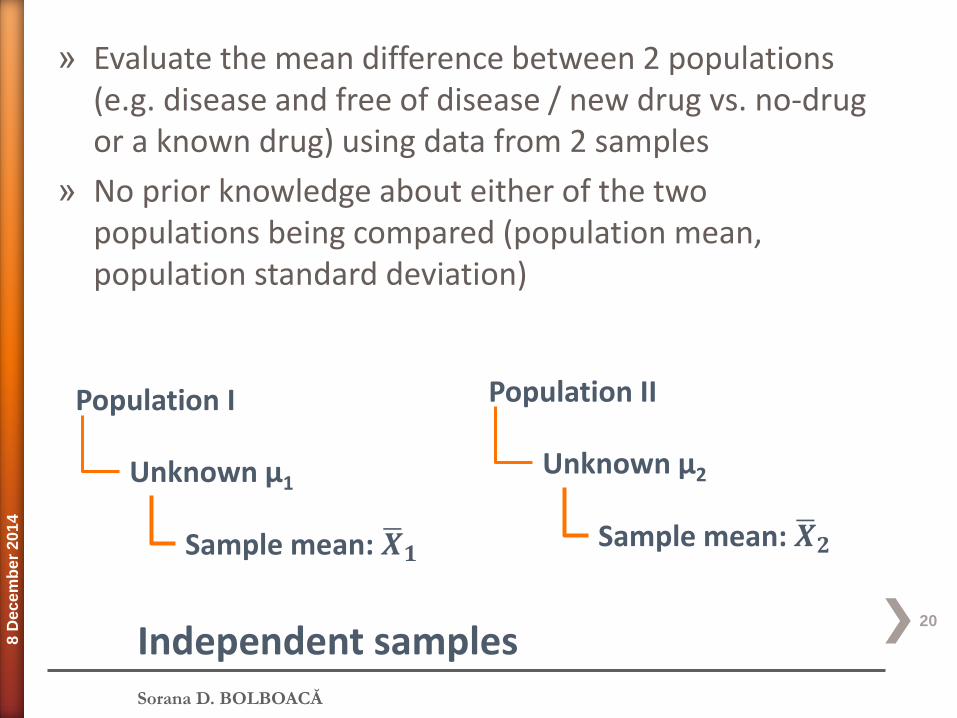
Independent samples
» Evaluate the mean difference between 2 populations (e.g. disease and free of disease / new drug vs. no-drug or a known drug) using data from 2 samples
» No prior knowledge about either of the two populations being compared (population mean, population standard deviation)
Population I
Unknown μ1
Sample mean: 𝑿 𝟏
Population II
Unknown μ2
Sample mean: 𝑿 𝟐
Sorana D. BOLBOACĂ Curs 1
8 D
ec
em
be
r 2
01
4
21
Independent samples
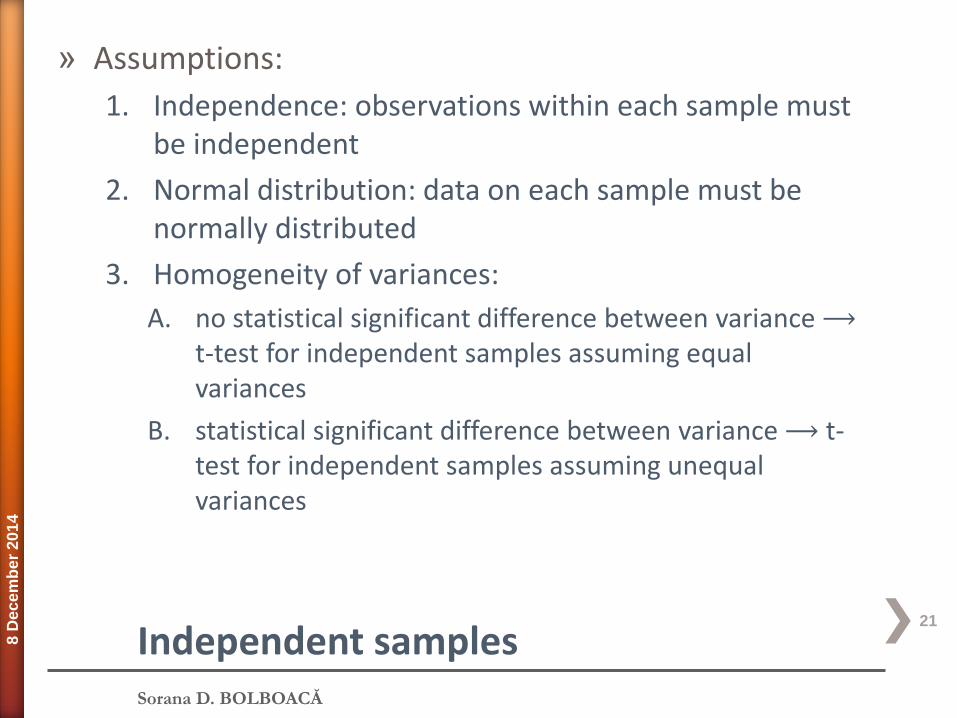
» Assumptions:
1. Independence: observations within each sample must be independent
2. Normal distribution: data on each sample must be normally distributed
3. Homogeneity of variances:
A. no statistical significant difference between variance ⟶ t-test for independent samples assuming equal variances
B. statistical significant difference between variance ⟶ t-test for independent samples assuming unequal variances
Sorana D. BOLBOACĂ Curs 1
8 D
ec
em
be
r 2
01
4
22
Independent samples
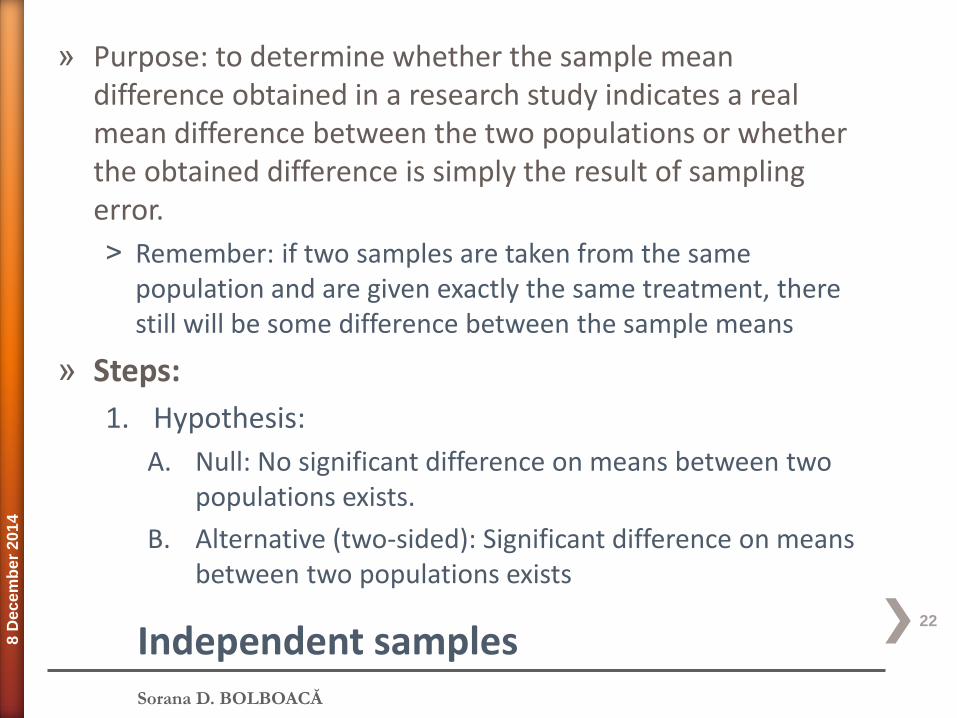
» Purpose: to determine whether the sample mean difference obtained in a research study indicates a real mean difference between the two populations or whether the obtained difference is simply the result of sampling error.
˃ Remember: if two samples are taken from the same population and are given exactly the same treatment, there still will be some difference between the sample means
» Steps:
1. Hypothesis:
A. Null: No significant difference on means between two populations exists.
B. Alternative (two-sided): Significant difference on means between two populations exists
Sorana D. BOLBOACĂ Curs 1
8 D
ec
em
be
r 2
01
4
23
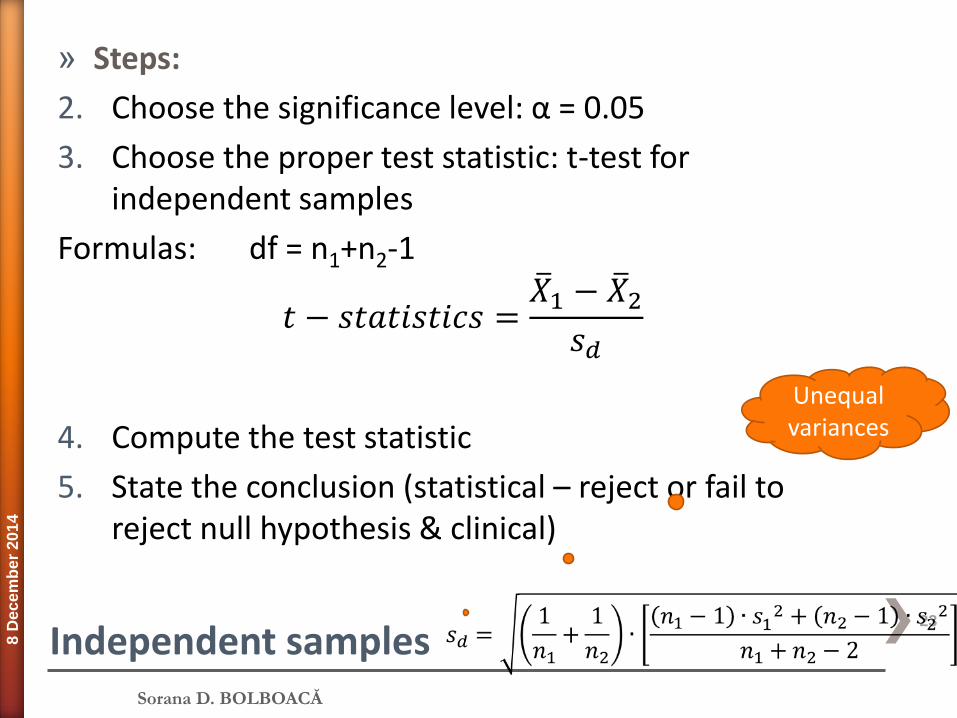
Independent samples
» Steps:
2. Choose the significance level: α = 0.05
3. Choose the proper test statistic: t-test for independent samples
Formulas: df = n1+n2-1
𝑡 − 𝑠𝑡𝑎𝑡𝑖𝑠𝑡𝑖𝑐𝑠 =𝑋 1 − 𝑋 2
𝑠𝑑
4. Compute the test statistic
5. State the conclusion (statistical – reject or fail to reject null hypothesis & clinical)
Unequal variances

Sorana D. BOLBOACĂ Curs 1
8 D
ec
em
be
r 2
01
4
24
Independent samples & unequal variances
Age and prostate cancer t-test
» H0: The mean age of subjects with positive biopsy is not significantly different by the mean age of subjects with negative biopsy
» HA: The mean age of subjects with positive biopsy is significantly different by the mean age of subjects with negative biopsy
» Negative biopsy: n1=206, 𝑋 1= 66.59 years old, s1=8.21
» Positive biopsy: n2=95, 𝑋 2=67.14 years old, s2=7.88
» α = 0.05 → tcritic = 1.96
» sd = sqrt((1/206+1/95)×((204*8.212+94*7.882)/(205+95-2))) = 1.0055
» 𝑡 =𝑋 1−𝑋 2
𝑠𝑑 = (66.59-67.14)/1.0055 = -0.5470 (p-value = 0.582)
» -1.96 ≤ -0.5470 ≤ 1.96 → fail to reject the H0
» For samples > 100 the difference between Z and t-statistic is negligible while the p-values are identical
Sorana D. BOLBOACĂ Curs 1
8 D
ec
em
be
r 2
01
4
25
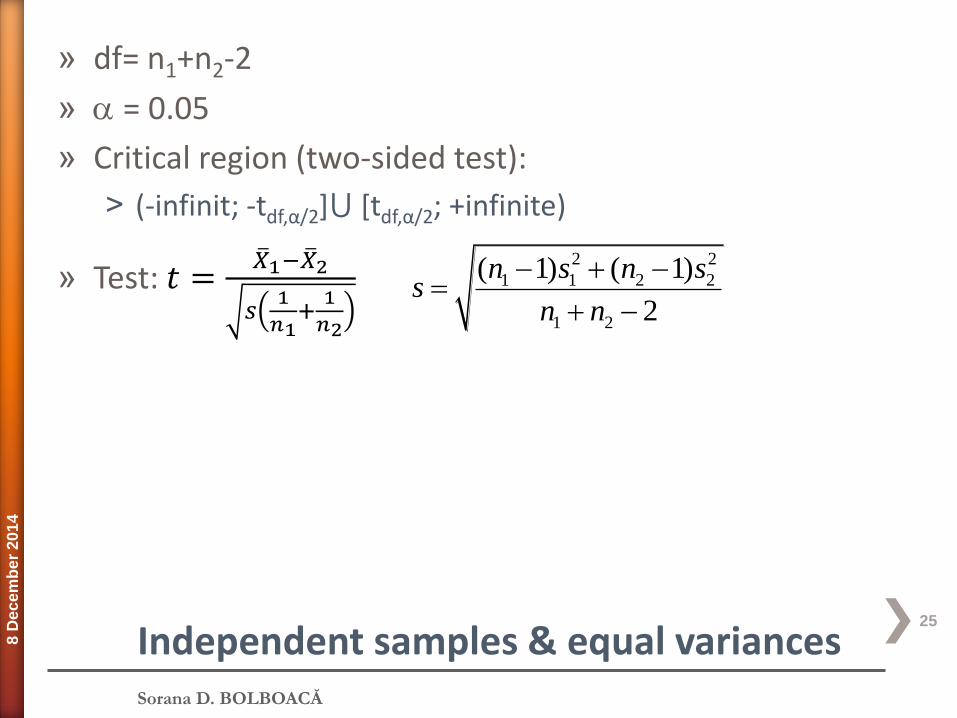
Independent samples & equal variances
» df= n1+n2-2
» = 0.05
» Critical region (two-sided test):
˃ (-infinit; -tdf,α/2]⋃ [tdf,α/2; +infinite)
» Test: 𝑡 =𝑋 1−𝑋 2
𝑠1
𝑛1+
1
𝑛2
2 2
1 1 2 2
1 2
( 1) ( 1)
2
n s n ss
n n
Sorana D. BOLBOACĂ Curs 1
8 D
ec
em
be
r 2
01
4
26
Independent samples & equal variances
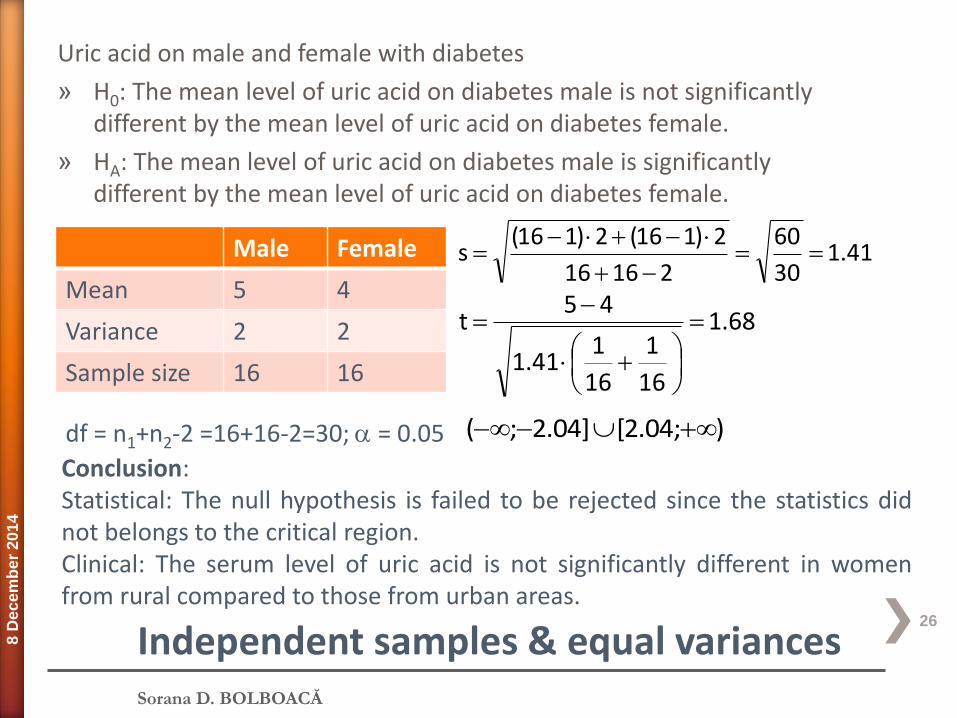
Uric acid on male and female with diabetes
» H0: The mean level of uric acid on diabetes male is not significantly different by the mean level of uric acid on diabetes female.
» HA: The mean level of uric acid on diabetes male is significantly different by the mean level of uric acid on diabetes female.
Male Female
Mean 5 4
Variance 2 2
Sample size 16 16
df = n1+n2-2 =16+16-2=30; = 0.05 );04.2[]04.2;(
41.130
60
21616
2)116(2)116(s
68.1
16
1
16
141.1
45t
Conclusion: Statistical: The null hypothesis is failed to be rejected since the statistics did not belongs to the critical region. Clinical: The serum level of uric acid is not significantly different in women from rural compared to those from urban areas.

Sorana D. BOLBOACĂ Curs 1
8 D
ec
em
be
r 2
01
4
27
http://www.sciencedirect.com/science/article/pii/S0950061810005568#

Sorana D. BOLBOACĂ Curs 1
8 D
ec
em
be
r 2
01
4
28
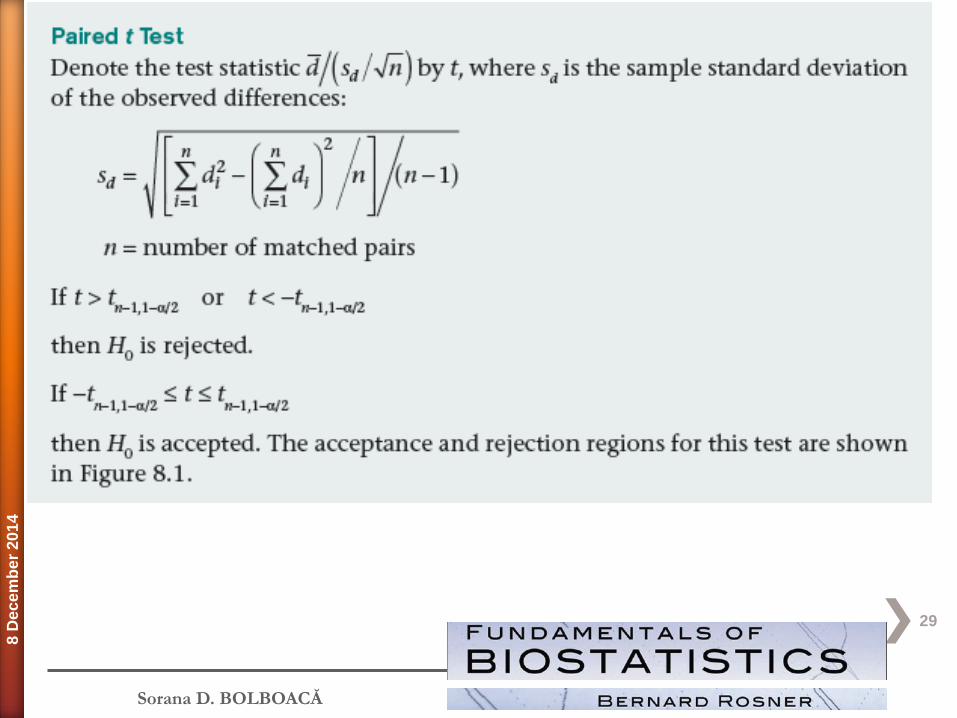
Dependent samples
» Compares the average values of a characteristic measured on a continuous scale between two conditions of the same group (pre- & post-treatment)
» names for this test:
˃ matched-pairs t test
˃ paired-samples t test
» Assumptions:
˃ Individual observations from the first sample corresponds to a pair in the second sample
˃ The differences between pairs of values are normally distributed.
Sorana D. BOLBOACĂ Curs 1
8 D
ec
em
be
r 2
01
4
29
Sorana D. BOLBOACĂ Curs 1
8 D
ec
em
be
r 2
01
4
30
Sorana D. BOLBOACĂ Curs 1
8 D
ec
em
be
r 2
01
4
31
Tests by example

Sorana D. BOLBOACĂ Curs 1
8 D
ec
em
be
r 2
01
4
32
» Which are the general steps of a statistical test
» Vocabulary used in testing hypothesis
» What an independent samples t-test is
» What a dependent samples t-test is
» When to use each test
» How to calculate it
» How to interpret it
Related Documents


