Welcome message from author
This document is posted to help you gain knowledge. Please leave a comment to let me know what you think about it! Share it to your friends and learn new things together.
Transcript


ADVANCES IN EXPERIMENTAL
MEDICINE AND BIOLOGY
Editorial Board:
NATHAN BACK, State University of New York at BuffaloIRUN R. COHEN, The Weizmann Institute of ScienceABEL LAJTHA, N.S. Kline Institute for Psychiatric ResearchJOHN D. LAMBRIS, University of PennsylvaniaRODOLFO PAOLETTI, University of Milan
Recent Volumes in this Series
VOLUME 607
EUKARYOTIC MEMBRANES AND CYTOSKELETON: ORIGINS AND
EVOLUTION
Edited by Gaspar Jekely
VOLUME 608
BREAST CANCER CHEMOSENSITIVITY
Edited by Dihua Yu and Mien-Chie Hung
VOLUME 609
HOT TOPICS IN INFECTION AND IMMUNITY IN CHILDREN IV
Edited by Adam Finn and Andrew J. Pollard
VOLUME 610
TARGET THERAPIES IN CANCER
Edited by Francesco Colotta and Alberto Mantovani
VOLUME 611
PETIDES FOR YOUTH
Edited by Susan Del Valle, Emanuel Escher, and William D. Lubell
VOLUME 612
RELAXIN AND RELATED PETIDES
Edited by Alexander I. Agoulnik
VOLUME 613
RECENT ADVANCES IN RETINAL DEGENERATION
Edited by Robert E. Anderson, Matthew M. LaVail, and Joe
G. Hollyfield
VOLUME 614
OXYGEN TRANSPORT TO TISSUE XXIX
Edited by Kyung A. Kang, David K. Harrison, and Duane F. Bruley
A Continuation Order Plan is available for this series. A continuation order will bring delivery of
each new volume immediately upon publication. Volumes are billed only upon actual shipment. For
further information please contact the publisher.

Kyung A. Kang l David K. Harrison l
Duane F. BruleyEditors
Oxygen Transport toTissue XXIX

EditorsKyung A. KangDepartment of Chemical EngineeringUniversity of Louisville, LouisvilleKY 40292, [email protected]
David K. HarrisonDurham Unit, Regional Medical PhysicsDepartment, University Hospital ofNorth Durham, Durham, [email protected]
Duane F. BruleySynthesizer, Inc., Ellicott City, MDUSA, UMBC, Baltimore, MD, [email protected]
ISBN: 978-0-387-74910-5 e-ISBN: 978-0-387-74911-2
Library of Congress Control Number: 2007936187
# 2008 Springer Science+Business Media, LLC
All rights reserved. This workmay not be translated or copied in whole or in part without the writtenpermission of the publisher (Springer ScienceþBusiness Media, LLC., 233 Spring Street, New York,NY 10013, USA), except for brief excerpts in connection with reviews or scholarly analysis. Use inconnection with any form of information storage and retrieval, electronic adaptation, computersoftware, or by similar or dissimilar methodology now known or hereafter developed is forbidden.The use in this publication of trade names, trademarks, service marks, and similar terms, even if theyare not identified as such, is not to be taken as an expression of opinion as to whether or not they aresubject to proprietary rights.
Printed on acid-free paper
9 8 7 6 5 4 3 2 1
springer.com

Dr. Duane Frederick Bruley
During the Annual 34th ISOTT Conference, August 12–17, 2006
Louisville, Kentucky, USA
The 34th ISOTT Conference President, Kyung A. Kang, would like to dedicatethis volume to one of her mentors, Dr. Duane F. Bruley, one of the two founders(the other one being Dr. Haim Bicher) of ISOTT. He has been continuouslysupportive and helped the conference behind the scenes. Dr. Bruley’s studieson oxygen transport to tissue started in 1962 with a prominent medical doctor,Dr.Melvin H.Knisely (Medical School of South Carolina), who was interested inthe influence of blood agglutination (coagulation) on oxygen transport to tissue,which stimulated Dr. Bruley to form the Society in 1973. Drs. Bruley and Bicherorganized the first ISOTT conference both in Clemson and Charleston, SC, USA,with Dr. Knisely as honorary President. Since then, Dr. Bruley has been a majorresearcher on oxygen transfer in the human (especially brain) tissue, as well as apioneer in the mathematical modeling and computer simulation of the humanmicrocirculation system. His mathematical modeling related to oxygen transportled to a unique computational strategy (BWK technique) that performs three-dimensional, time-dependent, heterogeneous, convection, diffusion, conduction,and reaction simulations. He organized another ISOTT conference in 1983, inRuston, LA, USA. His current research focuses on Protein C, an anticoagulant,antithrombotic, anti-inflammatory and anti-apoptotic protein in blood plasma.
He is an elected fellow of the American Institute of Chemical Engineers,American Society of Mechanical Engineers, and Biomedical Engineering Society,and also an elected founding fellow of the American Institute of Medical andBiological Engineering.

Dr. Britton Chance
During the Annual 34th ISOTT Conference, August 12–17, 2006
Louisville, Kentucky, USA
The 34th ISOTT Conference President, Kyung A. Kang, would also like todedicate this volume to another mentor of hers, Dr. Britton Chance. He hasbeen a long time ISOTT member and was President of the 4th ISOTT con-ference in Philadelphia, PA, USA.
Dr. Chance is Eldridge Reeves Johnson University Professor Emeritus ofBiophysics at the University of Pennsylvania. His studies on the control ofmetabolism, especially as it is related to mitochondria, have been just one of theties to ISOTT. One of his most current research interests is the use of infraredlight to characterize the properties of various tissues and cancer. He joined theUnited States National Academy of Sciences in 1952 and received the NationalMedal of Science in 1974. He is the inventor of both fNIR and an LED breastcancer screening device using the technology. He also won a gold medal for theUnited States at the 1952 Summer Olympics in the 5½ Meter Class. He haspublished more than 700 peer reviewed journal articles.
Kyung A. Kang especially appreciates Dr. Chance’s support and his atten-dance at ISOTT-2006, particularly because he was not in the best of health andwas in the middle of preparing to move to Singapore for a long-term researchproject immediately after the conference.
vi Dedications

Group Photo of ISOTT-2006
Kentucky Derby Museum, Churchill Downs, Louisville, Kentucky, USA
This volume is also dedicated to all ISOTT members, participants of ISOTT-2006, and to the contributors of manuscripts for this volume.
Dedications vii

Preface
The 34th Annual Conference of the International Society on Oxygen Transport toTissue (ISOTT)was held duringAugust 12–17, 2006 in Louisville, Kentucky, USA.
The emphasis of ISOTT-2006wason ‘‘ExpandingourHorizon.’’ In termsof research
topics, we added some newer ones – Translational Studies, Tissue Engineering, andNanobiotechnology. In terms of participants, we put extra effort into including
more junior researchers because we felt that they were the future of our society
and for the first time in ISOTT history we had presentations made by high school
students. In terms of organization, it was truly local, national, and international.The support in organizing ISOTT-2006 came from various directions:
We would like to express our special thanks to the University of Louisville
(UofL), especially to the UofL Provost Office, Speed School of Engineering,
School of Medicine, and the office of the Vice President of Research. UofL’s
financial support allowed us to supplement the student’s registration fees sub-stantially and to invite so many excellent distinguished lecturers. It should be
noted that none of our invited speakers requested an honorarium – we thank
them immensely. I would personally like to thank the Chemical Engineering
Department of UofL for allowing me to take time off from my teaching respon-sibility. We appreciate UofL President Ramsey’s visit to our dinner held at the
DerbyMuseum.We thank the CaseWestern Reserve University for having their
MIMS Center symposium with us. Their financial support through NIH and
participation enable us to have more diverse scientific sessions and more attrac-
tive social events. We truly appreciate the participating industries and the manylocal companies and friends who provided us with monetary support and valu-
able gifts. We also appreciate the encouragement received from the offices of the
Kentucky State Governor and Louisville City Mayor. The international, USA,
and local ISOTT-2006 organizing committee members are acknowledged fortheir constant help, suggestions, and valuable criticisms.
Three ladies, without whom, ISOTT-2006 may not have been possible are:
Barbara Johnson, Trinia S. Hill and Carmel F. Mackin. They mysteriously
appeared just to help ISOTT-2006 and then quietly disappeared.ISOTT-2006 had 100 participants and 77 presentations. In total, 42 papers
were submitted, reviewed, and accepted for publication. We are very proud of
the quality and quantity of the scientific content that we have exchanged/
discussed during the conference and published in this volume.
Kyung A. Kang, President of the 34th ISOTT ConferencePh.D. and Professor of the Chemical Engineering Department
University of Louisville
ix

Organization of ISOTT-2006
The International Society on Oxygen Transport
to Tissue (ISOTT) is an interdisciplinary societycomprising about 250 members worldwide.Its purpose is to further the understandingof all aspects of the processes involved in thetransport of oxygen from the air to its ultimateconsumption in the cells of the various organs ofthe body.
Founded in 1973 by Drs. Duane F. Bruley and Haim Bicher, the society hasbeen the leading platform for the presentation of many of the technological andconceptual developments within the field both at themeetings themselves and inthe proceedings of the society.
The annual meeting brings together scientists, engineers, clinicians andmathematicians in a unique international forum for the exchange of informa-tion and knowledge, the updating of participants on latest developments andtechniques, and the discussion of controversial issues within the field of oxygentransport to tissue.
ISOTT-2006 Officers
Kyung A. Kang, USA President
David J. Maguire, Australia Past President
Per Liss, Sweden President-Elect
Oliver Thews, Germany Secretary
Peter E. Keipert, USA Treasurer
Duane F. Bruley, USA Chairman, Knisely Award Committee
Executive Committee
Chris Cooper, UK Jerry D. Glickson, USA
Fahmeed Hyder, UK Paul Okunieff, USA
Valentina Quaresima, Italy Akitoshi Seiyama, Japan
Peter Vaupel, Germany Christopher B. Wolff, UK
xi

USA Committee
Joseph LaManna Fahmeed Hyder
Chia-Chi Ho Peter Keipert
Anthony Hudetz Sergei Vinogradov
H. Fred Downey
International Committee
Duane F. Bruley, USA Britton Chance, USA
Chis Cooper, UK Louis Hoofd, Netherlands
Fredrik Palm, Sweden Eiji Takahashi, Japan
Oliver Thews, Germany Martin P. Wolf, Switzerland
Giuseppe Cicco, Italy
Local Organizing Committee
Kyung A. Kang, President
Meeting Administration Committee
Matt Becker Cassandra Carmichael Trinia Simmons Hill
Barbara Johnson Patricia Lumley Carmel F. Mackin
Kurt Bendl A. Maria Utley
Greater Louisville Convention and Visitor’s Bureau
Scientific Program Committee
John Barker Richard L. Benton Eric Berson
Douglas B. Borchman Sham S. Kakar David Magnuson
Rosalie Mainous David A. Scott Yang Wang
Student Assistants
James J. Lee Yongjie Ren Samin Rezania
Bin Hong Hanzhu Jin Karen Boone
Rebecca Vitale
xii Organization of ISOTT-2006

Awards
The Melvin H. Knisely Award was first presented by ISOTT at the 1983 annualbanquet to acknowledge a young investigator (35 years of age or younger) foroutstanding achievements in research related to oxygen transport to tissue. Thisaward acknowledges the pleasure that Dr. Knisely derived from assisting andencouraging young scientists and engineers to contribute to the study of thetransport of anabolites and metabolites in the microcirculation. His manyaccomplishments in the field have inspired developing investigators to followin his footsteps. The continuation of this award aims to encourage youngscientists and engineers to join ISOTT and aspire to generate high qualityresearch in the area of oxygen transport to tissue. Members of the society areinvited to nominate eligible candidates for this award. The award usuallyincludes a Melvin H. Knisely plaque and a cash prize.
Melvin H. Knisely Award Recipients:
1983 Antal G. Hudetz, Hungary 1984 Andras Eke, Hungary
1985 Nathan A. Bush, USA 1986 Karlfried Groebe, Germany
1987 Isumi Shibuya, Japan 1988 Kyung A. Kang, Korea/USA
1989 Sanja Batra, Canada 1990 Stephen J. Cringle, Australia
1991 Paul Okunieff, USA 1992 Hans Degens, Netherlands
1993 David A. Benaron, USA 1994 Koen van Rossem, Belgium
1995 Clare E Elwell, UK 1996 Sergei A. Vinogradov, USA
1997 Chris Cooper, UK 1998 Martin Wolf, Switzerland
1999 Huiping Wu, USA 2000 Valentina Quaresima, Italy
2001 Fahmeed Hyder, Bangladesh 2002 Geofrey De Visscher, Belgium
2003 Mohammad N. Khan, USA 2004 Fredrick Palm, Sweden
2005 Nicholas Lintell, Australia 2006 No award was made
The DietrichW. Lubbers Awardwas established in honor of Professor Lubbers’slong-standing commitment, interest, and contributions to the problems of oxygentransport to tissue and to the society. The Lubbers Award is made to a younginvestigator 30 years of age or younter (with the nomination and sponsorship ofan ISOTT member) and will consist of travel support to the meeting at whichthe award is made. The selection will be based on the scientific excellence of theindividual’s first authored manuscript on the topic of oxygen transport as judgedby the members of the organizing committee of the annual meeting.
xiii

Dietrich W. Lubbers Award Recipients:
1994 Michael Dubina, Russia 1995 Philip E. James, UK/USA
1996 Resit Demit, Germany 1997 Juan Carlos Chavez, Peru
1998 Nathan A. Davis, UK 1999 Paola Pichiule, USA
2000 Ian Balcer, USA 2001 Theresa M. Busch, USA
2002 Link K. Korah, USA 2003 James J. Lee, USA
2004 Richard Olson, Sweden 2005 Charlotte Ives, UK
2006 Bin Hong, China/USA
The Britton Chance Award was established in honor of Professor Chance’slong-standing commitment, interest and contributions to many aspects of oxy-gen transport to tissue and to the society. The Chance Award is made to a younginvestigator 30 years of age or less (with the nomination and sponsorship of anISOTT member) and will consist of travel support to the meeting at which theaward is made. The selection will be based on the scientific excellence of theindividual’s first authored manuscript on the topic of oxygen transport asjudged by the members of the organizing committee of the annual meeting.
Britton Chance Award Recipients:
2004 Derek Brown, Switzerland 2005 James Lee, USA
2006 Hanzhu Jin, China/USA
The Duane F. Bruley Awards were first presented by ISOTT at the 2004 annualmeeting in Bari, Italy. They were established to support travel funds for studentresearchers in all areas of oxygen transport to tissue. The Awards signify Dr.Bruley’s interest in seeking young scientists and engineers tomaintain the imageand quality of research associated with the society. As a co-founder of ISOTT in1973, Dr. Bruley emphasizes cross-disciplinary research among basic scientists,engineers, medical scientists, and clinicians. It is hoped that receiving the DuaneF. Bruley Award will inspire students to excel in their research and will assist insecuring future leadership for ISOTT.
Duane F. Bruley Award reciptents:
2004 Helga Blocks (Belgium); Jennifer Caddick (UK); Charlotte Ives (UK);Nicholas Lintell (Australia); LeonardoMottola (Italy); SaminRezania(Iran/USA); Ilias Tachtsidis (UK); Liang Tang (China/USA); IyichiSonoro (Japan); Antonio Franco (Italy)
2005 Robert Bradley (UK) Harald Oey (Australia) Kathy Hsieh (Australia);Jan Shah (Australia)
2006 Benn S. Gooch (UK); Ulf R. Jensen (Germany); Smruta S. Koppaka(USA); Daya Singh (UK); Martin Tisdall (UK); Bin Wang (China/USA); Kui Xu (China/USA)
xiv Awards

Sponsorship
University of Louisville, Office of the University ProvostUniversity of Louisville, Office of Senior Vice President for ResearchUniversity of Louisville, Speed School of EngineeringUniversity of Louisville, School of Medicine and the Health Sciences CenterUniversity of Louisville, Chemical Engineering DepartmentCenter for Modeling Integrated Metabolic Systems (MIMS), Supported by a
grant (GM66309) from the National Institute of General Medical Sciences,NIH, to the Case Western Reserve University, Cleveland, OH
�LOUISVILLE FRIENDS WITH GIFTS
�INSTITUTIONAL/ INDUSTRIAL PARTICIPATIONS
xv

ISOTT-2006 editors would like to thank
the following reviewers
Panel of Scientific Review:
James Bassingthwaighte, University of Washington, USAEric Berson, University of Louisville, USADuane Bruley, University of Maryland Baltimore County, USASimon Faithfull, Fidelis Consulting, USAArthur Fournell, University of Dusseldorf, GermanyPeter Hansell, University of Uppsala, SwedenDavid Harrison, University Hospital of North Durham, UKFahmeed Hyder, Yale University, USAFahmeed Hyder, Yale University, USASham Kakar, University of Louisville, USAKyung A. Kang, University of Louisville, USAPeter Keipert, Sangart Inc., USAJoe LaManna, Case Western Reserve University, USAEdwin Nemoto, University of Pittsburgh, USAPaul Okunieff, University of Rochester, USAGerald Saidel, Case Western Reserve University, USAOliver Thews, University of Mainz, GermanyPeter Vaupel, University of Mainz, GermanyDavid Wilson, University of Pennsylvania, USAMartin Wolf, University Hospital Zurich, SwitzerlandChristopher Wolff, St. Bartholomew’s and the Royal London Hospital, UK
Technical Review:
Laraine Visser-Isles, Rotterdam, the NetherlandsEileen Harrison, Durham, UK
xvii

Contents
Dedications . . . . . . . . . . . . . . . . . . . . . . . . . . . . . . . . . . . . . . . . . . . . . . . . . . v
Preface . . . . . . . . . . . . . . . . . . . . . . . . . . . . . . . . . . . . . . . . . . . . . . . . . . . . ix
Organization of ISOTT-2006 . . . . . . . . . . . . . . . . . . . . . . . . . . . . . . . . . . . xi
Awards . . . . . . . . . . . . . . . . . . . . . . . . . . . . . . . . . . . . . . . . . . . . . . . . . . . xiii
Sponsorship . . . . . . . . . . . . . . . . . . . . . . . . . . . . . . . . . . . . . . . . . . . . . . . . . xv
Acknowledgments . . . . . . . . . . . . . . . . . . . . . . . . . . . . . . . . . . . . . . . . . . . xvii
1 ISOTT: Roots, Founding and Beyond . . . . . . . . . . . . . . . . . . . . . . . . . . . 1Duane Frederick Bruley
2 Dietrich W. Lubbers: Celebration of a Life Dedicated
to Research into Oxygen Transport to Tissue . . . . . . . . . . . . . . . . . . . . . 9David K. Harrison
Part I Oxygen Transport in Tissue
3 Investigation of Frontal Cortex, Motor Cortex and
Systemic Haemodynamic Changes During
Anagram Solving . . . . . . . . . . . . . . . . . . . . . . . . . . . . . . . . . . . . . . . . . . . 21Ilias Tachtsidis, Terence S. Leung, Martin M. Tisdall,Presheena Devendra, Martin Smith, David T. Delpy,and Clare E. Elwell
4 Do Red Blood Cell-b-Amyloid Interactions Alter Oxygen
Delivery in Alzheimer’s Disease? . . . . . . . . . . . . . . . . . . . . . . . . . . . . . . . 29Joy G. Mohanty, D. Mark Eckley, J. D. Williamson, L. J. Launer,and Joseph M. Rifkind
xix

5 Uncoupling Protein-2 in Diabetic Kidneys: Increased Protein
Expression Correlates to Increased Non-transport
Related Oxygen Consumption . . . . . . . . . . . . . . . . . . . . . . . . . . . . . . . 37Malou Friederich, Johan Olerud, Angelica Fasching, Per Liss,Peter Hansell, and Fredrik Palm
6 Measurement of Oxygenation at the Site of Stem Cell Therapy
in a Murine Model of Myocardial Infarction . . . . . . . . . . . . . . . . . . . . 45Mahmood Khan, Vijay Kumar Kutala, Sheik Wisel,Simi M. Chacko, M. Lakshmi Kuppusamy, Pawel Kwiatkowski,and Periannan Kuppusamy
7 Oxygen Pressures in the Interstitial Space of Skeletal
Muscle and Tumors in vivo . . . . . . . . . . . . . . . . . . . . . . . . . . . . . . . . . 53David F. Wilson, William M.F. Lee, Sosina Makonnen,Sophia Apreleva, and Sergei S.A. Vinogradov
Part II Other Metabolite Transport in Tissue
8 Adjuvant Induced Glucose Uptake by Activated T Cells
is not Correlated with Increased Survival . . . . . . . . . . . . . . . . . . . . . . 65Sadhak Sengupta, Rebecca J. Vitale, Paula M. Chilton,and Thomas C. Mitchell
9 Lactate, with Oxygen, Incites Angiogenesis . . . . . . . . . . . . . . . . . . . . 73Thomas K. Hunt, Rummana Aslam, Zamir Hussain,and Stefan Beckert
Part III Blood, Hemostasis and Hemodynamics
10 Activated Protein C Modulates Chemokine Response
and Tissue Injury in Experimental Sepsis . . . . . . . . . . . . . . . . . . . . . . 83Ganesh R. Sharma, Bruce Gerlitz, David T. Berg, Martin S.Cramer, Joseph A. Jakubowski, Elizabeth J. Galbreath, Josef G.Heuer, and Brian W. Grinnell
11 Manipulation of the Affinity Between Protein and Metal Ions
by Imidazole and PH for Metal Affinity Purification
of Protein c from Cohn Fraction IV-1 . . . . . . . . . . . . . . . . . . . . . . . . . 93James J. Lee, Duane F. Bruley, and Kyung A. Kang
12 Separation of Factor V Leiden Molecule, a Mutated Form
of Factor V, from Plasma of Homozygous Patient . . . . . . . . . . . . . . . 101Samin Rezania and Kyung A. Kang
xx Contents

13 A Simple Volume Related Model of Arterial
Blood Pressure Generation . . . . . . . . . . . . . . . . . . . . . . . . . . . . . . . . . 109Christopher B. Wolff, Benn S. Gooch, and James S. Douglas
Part IV Tumor, Cancer and Oncology
14 Strikingly High Respiratory Quotients: A Further
Characteristic of the Tumor Pathophysiome . . . . . . . . . . . . . . . . . . . . 121Peter Vaupel
15 Endogenous Hypoxia Markers: Case not Proven! . . . . . . . . . . . . . . . . 127Arnulf Mayer, Michael Hockel, and Peter Vaupel
16 RAD18 Signals DNA Polymerase IOTA to Stalled Replication
Forks in Cells Entering S-Phase with DNA Damage . . . . . . . . . . . . . . 137Shelly Kakar, Nicholas B. Watson, and W. Glenn McGregor
17 Alanine in HI: A Silent Mutation Cries Out! . . . . . . . . . . . . . . . . . . . . 145J. H. Shah, D.J. Maguire, T.B. Munce, and A. Cotterill
18 Biomathematics in Cancer Detection: Simulation of Lipogenesis in Cancer 151Ping Huang and Britton Chance
19 Activity of Drug Efflux Transporters in Tumor Cells
Under Hypoxic Conditions . . . . . . . . . . . . . . . . . . . . . . . . . . . . . . . . . 157Oliver Thews, Birgit Gassner, Debra K. Kelleher, andMichael Gekle
20 Antioxidants Reduce Consequences of Radiation Exposure . . . . . . . . . 165Paul Okunieff, Steven Swarts, Peter Keng, Weimin Sun,Wei Wang, Jung Kim, Shanmin Yang, Hengshan Zhang,Chaomei Liu, Jacqueline P. Williams, Amy K. Huser, andLurong Zhang
21 Anti-Cancer Effect of Resveratrol is Associated with Induction
of Apoptosis via a Mitochondrial Pathway Alignment . . . . . . . . . . . . . 179Weimin Sun, Wei Wang, Jung Kim, Peter Keng, ShanminYang, Hengshan Zhang, Chaomei Liu, Paul Okunieff, andLurong Zhang
Part V Tissue Engineering
22 Computationally Determined Shear on Cells Grown
in Orbiting Culture Dishes . . . . . . . . . . . . . . . . . . . . . . . . . . . . . . . . . . 189R. Eric Berson, Matthew R. Purcell, and M. Keith Sharp
Contents xxi

23 Formation of Capillary Tube-like Structures
on Micropatterned Biomaterials . . . . . . . . . . . . . . . . . . . . . . . . . . . . . 199Dahai Gao, Girish Kumar, Carlos Co, and Chia-Chi Ho
Part VI Bio-Instrumentation
24 Error Analysis of Finite-Spectral-Linewidth Illumination
in Optical Oximetry Systems . . . . . . . . . . . . . . . . . . . . . . . . . . . . . . . 209Joseph L. Hollmann, and Charles A. DiMarzio
25 Changes in the Attenuation of Near Infrared Spectra by the Healthy
Adult Brain During Hypoxaemia Cannot be Accounted for Solely by
Changes in the Concentrations of Oxy- and Deoxy-Haemoglobin . . . . 217Martin M. Tisdall, Ilias Tachtsidis, Terence S. Leung,Clare E. Elwell, and Martin Smith
26 Assessment of Oxygenation and Perfusion in the Tongue and Oral
Mucosa by Visible Spectrophotometry and Laser Doppler
Flowmetry in Healthy Subjects . . . . . . . . . . . . . . . . . . . . . . . . . . . . . . 227D. B. Singh, G. Stansby and D. K. Harrison
27 Cerebral Tissue Oxygen Saturation Calculated Using Low Frequency
Haemoglobin Oscillations Measured by Near Infrared
Spectroscopy in Adult Ventilated Patients . . . . . . . . . . . . . . . . . . . . . . . 235Terence S. Leung, Martin M. Tisdall, Ilias Tachtsidis, MartinSmith, David T. Delpy and Clare E. Elwell
28 Biosensor for Diagnosing Factor V Leiden, A Single Amino Acid
Mutated Abnormality of Factor V . . . . . . . . . . . . . . . . . . . . . . . . . . . . 245Yongjie Ren, Samin Rezania and Kyung A. Kang
29 Scanning Laser Ophthalmoscope-particle TrackingMethod to Assess
Blood Velocity During Hypoxia and Hyperoxia . . . . . . . . . . . . . . . . . . 253Kristen Lorentz, Astrid Zayas-Santiago, Shanti Tummala,and Jennifer J. Kang Derwent
Part VII Nano-Bio Technology
30 Highly Sensitive Rapid, Reliable, and Automatic
Cardiovascular Disease Diagnosis with Nanoparticle
Fluorescence Enhancer and Mems . . . . . . . . . . . . . . . . . . . . . . . . . . . . 265Bin Hong, Junhai Kai, Yongjie Ren, Jungyoup Han, Zhiwei Zou,Chong H. Ahn, and Kyung A. Kang
xxii Contents

31 Tumor-specific Nano-entities for Optical Detection and Hyperthermic
Treatment of Breast Cancer . . . . . . . . . . . . . . . . . . . . . . . . . . . . . . . . . . 275Hanzhu Jin, Bin Hong, Sham S. Kakar, and Kyung A. Kang
32 LHRH Receptor Targeted Therapy for Breast Cancer . . . . . . . . . . . . 285S. S. Kakar, H. Jin, B. Hong, J. W. Eaton, and Kyung A. Kang
Part VIII Translational and Clinical Studies
33 Saturation of Hemoglobin in Intracranial Arteries is Similar
in Patients with Hemodynamically Relevant and Irrelevant
Stenosis of the Internal Carotid Artery . . . . . . . . . . . . . . . . . . . . . . . . 299U. Jensen, S.Wolff, K.Alfke, K. Borsch, O. Jansen, andR. Stingele
34 A Three-tiered Approach for Calibration of a Biosensor
to Detect Estrogen Mimics . . . . . . . . . . . . . . . . . . . . . . . . . . . . . . . . . 305SarahA.Andres,D.AlanKerr II, StefanieB.Bumpus, Traci L.Kruer,JoshuaW. Thieman, Irina A. Smolenkova, and James L. Wittliff
35 Biosensors for Detecting Estrogen-like Molecules
and Protein Biomarkers . . . . . . . . . . . . . . . . . . . . . . . . . . . . . . . . . . . . 315James L. Wittliff, Sarah A. Andres, Traci L. Kruer, D. Alan KerrII, Irina A. Smolenkova, and Judith L. Erb
Part IX Modeling and Analysis of Metabolism and Transport
36 Muscle Oxygen Uptake Differs from Consumption Dynamics
During Transients in Exercise . . . . . . . . . . . . . . . . . . . . . . . . . . . . . . . 325Nicola Lai, Nakisha Syed, GeraldM. Saidel, andMarco E. Cabrera
37 Modeling Oxygenation and Selective Delivery of Drug
Carriers Post-Myocardial Infarction . . . . . . . . . . . . . . . . . . . . . . . . . . 333Bin Wang, Robert C. Scott, Christopher B. Pattillo, BalabhaskarPrabhakarPandian, Shankar Sundaram, and Mohammad F. Kiani
38 Hypobaric Hypoxia Reduces GLUT2 Transporter Content
in Rat Jejunum more than in Ileum . . . . . . . . . . . . . . . . . . . . . . . . . . . 345Elaine M. Fisher, Xiaoyan Sun, Bernadette O. Erokwu,and Joseph C. LaManna
39 Modeling Oxygen and Carbon Dioxide Transport and Exchange
Using a Closed Loop Circulatory System . . . . . . . . . . . . . . . . . . . . . . 353Brian E. Carlson, Joseph C. Anderson, Gary M. Raymond,Ranjan K. Dash, and James B. Bassingthwaighte
Contents xxiii

40 Effect of Alternate Energy Substrates on Mammalian
Brain Metabolism During Ischemic Events . . . . . . . . . . . . . . . . . . . . . 361S. S. Koppaka, M. A. Puchowicz, J. C. LaManna, and J. E. Gatica
41 Cerebral Blood Flow Adaptation to Chronic Hypoxia . . . . . . . . . . . . . 371Haiying Zhou, Gerald M. Saidel, and Joseph C. LaManna
42 Mitochondrial Dysfunction in Aging Rat Brain Following
Transient Global Ischemia . . . . . . . . . . . . . . . . . . . . . . . . . . . . . . . . . . 379Kui Xu, Michelle A. Puchowicz, Xiaoyan Sun,and Joseph C. LaManna
Part X Others
43 Measurement of Cerebral Tissue Oxygenation in Young Healthy
Volunteers During Acetazolamide Provocation: A Transcranial
Doppler and Near-Infrared Spectroscopy Investigation . . . . . . . . . . . . 389Ilias Tachtsidis, Martin Tisdall, David T. Delpy, Martin Smith,and Clare E. Elwell
44 Measurement of Frontal Lobe Functional Activation and Related
Systemic Effects: A Near-Infrared Spectroscopy Investigation . . . . . . 397Ilias Tachtsidis, Terence S. Leung, Laurence Devoto,David T. Delpy, and Clare E. Elwell
Author Index . . . . . . . . . . . . . . . . . . . . . . . . . . . . . . . . . . . . . . . . . . . . . . . . 405
Subject Index . . . . . . . . . . . . . . . . . . . . . . . . . . . . . . . . . . . . . . . . . . . . . . . 407
xxiv Contents

Chapter 1
ISOTT: Roots, Founding and Beyond
Duane Frederick Bruley1
Abstract The International Society on Oxygen Transport to Tissue (ISOTT) wasfounded inApril, 1973 byDrs.DuaneF. Bruley andHaim I. Bicher.However, theroots of ISOTT go back to Drs. Christian Bohr and August Krogh. Dr. Bruleyfirst wanted to sponsor an international symposium on oxygen transport to tissueto highlight the research activity between his group at Clemson University andDr. Melvin H. Knisely’s group at the Medical College of South Carolina. It wasalso intended to honor Dr. Knisely for his ingenious development of the QuartzRod Crystal technique for observing blood flow in-vivo. Later Dr. Bicher wasselected to organize the program from the Medical College of South Carolina
With an overwhelming response to the initial call for papers, Drs. Bruley andBichermade the decision to found an International Society. They then decided on aname, developed the society logo, assigned amission, developed a charter, sketchedthe by-laws, and contracted a publisher for the proceedings. The new societywas toinclude a focus on inter and cross-disciplinary research involving theoretical andexperimental investigations of oxygen transport to tissue in a single session format.The society meets annually at different venues throughout the world.
1.1 Body
This paper represents an extension of the presentation and paper prepared forthe twenty fifth (25th) anniversary of the International Society on OxygenTransport to Tissue on the founding of ISOTT [1]. Similar to most successfulresearch projects it was an exciting serendipitous process, therefore it is impor-tant to step back and record the sequence of events that took place before thisspecial society (ISOTT) was born.
The roots of ISOTT date back as far as Dr. Christian Bohr (1855–1911), forhis pioneering work in respiratory physiology and to August Krogh(1847–1949), when his work conceptualizing the capillary-tissue cylinder for
1Synthesizer, Inc., Ellicott City, MD, USA; UMBC, Baltimore, MD, USA.
K.A. Kang et al. (eds.), Oxygen Transport to Tissue XXIX� Springer 2008
1

oxygen transport was awarded the Nobel Prize (1920). In my opinion Kroghwas the first Tissue Engineer because he quantified the physical system usingmathematical modeling and calculated molecular transport in and around themicrocirculation. Dr. Krogh studied under Dr. Bohr as his teaching assistantand continued his studies throughout his professional career. Dr. MelvinH. Knisely (1900–1975) served as Dr. Krogh’s Post Doctoral Fellow whichpropelled him on a career of studies related to blood agglutination in thecapillaries and experimental research on the resulting tissue destruction anddisease. Dr. Knisely has been cited as the first person to observe the pathologicalclumping of red and white cells, in vivo, at the capillary level. He identified thesephenomena as ‘‘blood sludging’’ and pointed out its negative impact on oxygentransport to the tissue and to the removal of toxic metabolic byproducts.
Colleagues, on occasion, have said that there were discussions regarding thepossible establishment of a society on oxygen transport. If that is true I wasnever a part of any of the discussions nor was I even contacted by a colleague tobe part of such an effort. Also, I have been asked whether or not Dr. Kniselyapproached me to create a symposium in his honor or to form a society. Just forclarification, I never had any discussions related to the development of asymposium or a society with Dr. Knisely prior to gaining permission fromClemson to host a meeting at Clemson University, Clemson, SC, USA.
My formal education was in traditional chemical, mechanical, and nuclearengineering. In the fall of 1962 I accepted a position as Assistant Professor ofChemical Engineering andHead Varsity Tennis coach at ClemsonUniversity inClemson, South Carolina, USA. That fall a colleague, Dr.William Barlage, andI were discussing possible new research areas; thus, we decided to take a fivehundred mile round trip to the Medical College of South Carolina in Charleston,SC to see if there were problems involving ‘‘living systems’’ that we could applyour engineering skills to. Being traditional engineers neither of us had a formaleducation in the biological or life sciences and had studied only non-living systems.To clarify, even though traditional engineers canmake significant contributions tothe engineering of living systems a new breed has evolved, the Bioengineer, whichrepresents the fifth traditional discipline of engineering [2]. A definition that I havefrequently used for bioengineering is as follows: ‘‘Bioengineering is The Applica-tion of Engineering Principles and Fundamentals to Engineering Problems thatRequire Basic Understanding of the Biological and/or Life Sciences.’’ This defini-tion states that modern Bioengineers must have a formal education that includesthe biological and/or life sciences thus giving them insight into processes involvedin living systems that would not be obvious to traditional engineers. This concepthas a foundation in the principles upon which ISOTT was founded.
On the second day of our visit to the Medical College and after several meet-ings, without success, wewere standing outside of theAnatomyDepartment whenDr. Melvin H. Knisely (Head of the Department) appeared and introducedhimself. After a brief discussion he invited us to lunch where he stated his interestinmathematical modeling and computer simulation of oxygen transport in the greymatter of brain. He was concerned about the viability of neurons under differentpathological conditions andhe thought that computer predication couldbe valuable.
2 D.F. Bruley

This problem was of interest to me since I had recently completed my Ph.D.Dissertation that consisted of experimental and theoretical work on the thermaldynamics of a wetted-wall-column [3]. My theoretical model consisted of acomputer simulation of a coupled set of partial differential equations describingsimultaneous heat and mass transfer in cylindrical coordinates. The equationscontained terms for convection and conduction in two space dimensions andtime and were solved using finite difference techniques via Fortran program-ming. This research fit perfectly with the description of the Krogh CapillaryTissue model and the problems associated with the solution of representativemodels that scientists and engineers around the world were then exploring toquantify the microcirculation. After a year of study to learn the necessaryphysiology and anatomy and the translation of two German articles, one byOpitz and Schneider [4] and the other by Thews [5] (help in translation wasprovided by Isebel Lockard and Elsie Tabor in Dr. Knisely’s Laboratory)I derived a mathematical model, from basic principles (the Bruley Model),that was solved by various graduate students on digital, analog and hybridcomputers, for different anatomical and physiological conditions. This researchrepresented the first computer simulations of the microcirculation, and a majorstep forward in quantitative analysis because computer simulation allowedinvestigation of the dynamic and non-linear characteristics of the system.
These studies started in 1962 and we worked together until Dr Knisely’s deathin 1975. During that period we published about 35 papers together regardingtheoretical and experimental investigations of oxygen transport to tissue.
In 1968 Dr. Haim I. Bicher was recruited to our team because of his knowl-edge of blood agglutination and his expertise in the construction and use ofoxygen micro electrodes. His contribution to our research effort allowed us towork back and forth between theory and experiment thus giving us the bestpossible research environment. We presented our work primarily at theEuropean Microcirculation meetings and published in a variety of journals. Itwas then that we started to examine anti-adhesive drugs in an attempt toprevent clotting and to reverse the consequences of blood agglutination [6].This initial work has led to my current studies of Protein C, a blood factor thatmight be the ultimate anticoagulant/antithrombotic/anti-inflammatory/anti-apoptotic for Protein C deficient patients, because there are little or noknown side effects such as, bleeding complications with the zymogen [7].
In 1971 our team attended a workshop on oxygen supply at TheMax-PlanckInstitute in Dortmund, Germany. It was then that I decided to inquireabout sponsoring a symposium at Clemson University to highlight our teamwork with Dr. Knisely’s group at The Medical School of South Carolina. Imme-diately after I returned to the United States I asked Dr. Edwards, the President ofClemson University, for permission to host an oxygen transport to tissue sympo-sium at ClemsonUniversity andwith it honorDr.MelvinH.Knisely for his manycontributions to the field of microcirculation. Particularly for his development ofthe quartz rod crystal illumination technique that allowed him to visualize thesticking together of blood components, in vivo, in many disease states [8].Permission was granted so I called Dr. Knisely’s wife, Verona, to find out what
1 ISOTT: Roots, Founding and Beyond 3

she thought about it. After a short time Verona called back and said it was a good
idea but she thought it would be better to have the symposium at The Medical
College of South Carolina. With further discussion we decided to have a sympo-
sium at both campuses, with bus transportation in between. Both Dr. Edwards,
President at Clemson University and Dr. McCord, President of The Medical
School of South Carolina agreed to help fund the symposium.WhenDr.Bicher returned froman extended trip to Israel, I askedhim if hewould
like to participate in setting up the symposium.Hewas anxious to do so and he then
took responsibility for further arrangements at the Medical School while I handled
all arrangements at Clemson University and the combined meeting. Together we
obtained additional support fromother companies and agencies to fund themeeting.The intended purpose of the symposium was to promote interdisciplinary
and cross-disciplinary research involving theoretical and experimental investiga-
tions for oxygen transport in tissue. It was to bring together life scientists and
engineers in a single session format to examine the many complex phenomena of
normal tissue growth and maintenance, and tissue survival and repair under
pathological conditions. This has remained the mission for ISOTT since its birth
and is probably the precursor to what is defined as ‘‘Tissue Engineering,’’ today.After an intensive period of planning and preparation an initial meeting
announcement was sent out to sample community interest. The results demon-
strated enthusiasm far beyond projections and triggeredDrs. Bruley and Bicher to
consider the meeting as a launching pad for a very focused international society
regarding oxygen transport to tissue. We presented our idea to several other
investigators and thenwe decided that a formal societywould be in the best interest
of groups around theworld to achieve research goals related to oxygen transport in
tissue and that theCharleston/Clemsonmeetingwould be an appropriate forum to
formalize and begin an international society. We then decided on the name
‘‘International Society on Oxygen Transport to Tissue,’’ designed a society
‘‘logo,’’ assigned a mission, developed a charter, sketched the by-laws, contracted
with Plenum Publishers to publish the meeting proceedings, and selected members
to comprise an International Committee for theClemson/Charlestonmeeting. The
membership consisted of the following scientists and engineers:
Dr. Melvin H. Knisely, Charleston, USA Dr. Duane F. Bruley, Clemson, USA
Dr. Haim I. Bicher, Charleston, USA Dr. Gerhard Thews, Mainz, West Germany
Dr. Ian A. Silver, Bristol, England Dr. Herbert J. Berman, Boston, USA
Dr. Britton Chance, Philadelphia, USA Dr. Leland C. Clark, Jr., Cincinnati, USA
Dr. Lars-Erik Gelin, Goteborg, Sweden Dr. Jurgen Grote, Mainz, West Germany
Dr. Manfred Kessler, Dortmund, Germany Dr. Jose Strauss, Miami, USA
Dr. William J. Whalen, Cleveland, USA Dr. Daniel D. Reneau, Ruston, USA
Drs. Bruley and Bicher solicited Dr. Melvin H. Knisely to serve as an Honorary
President of the Society for the initial symposium. At the Clemson/Charleston
meeting, ISOTT was founded, and the following slate of officers were elected:
4 D.F. Bruley

President-Elect- Dr. Gerhard Thews, Mainz, West GermanySecretary- Dr. Haim I. Bicher, Charleston, USATreasurer- Dr. Ian A. Silver, Bristol, England
The first symposium of ISOTT surpassed all expectations and established a
society that has continued to meet annually at various locations around the
world. The registered participants numbered 267 and two proceedings volumes
consisting of 133 papers were published by Plenum Press in their ‘‘Advances in
Experimental Medicine and Biology’’ series [9, 10].Society meetings have been held at the following locations under the leader-
ship of the listed presidents:
1973 Charleston, SC, USA (Honorary) M.H. Knisely, Founding Meeting
1974 Group Meeting
1975 Mainz, Germany G. Thews (First Elected President)
1976 Anaheim, CA, USA B. Chance
1977 Cambridge, U.K. I. A. Silver
1978 Atlantic City, NJ, USA J. Strauss
1979 La Jolla, CA, USA J. Strauss
1980 Budapest, Hungary A. Kovach
1981 Detroit, MI, USA H. Bicher
1982 Dortmund, Germany D. Lubbers
1983 Ruston, LA, USA D. F. Bruley
1984 Nijmegen, The Netherlands F. Kreuzer
1985 Raleigh, NC, USA I.S. Longmuir
1986 Cambridge, UK I.A. Silver
1987 Sapporo, Japan M. Mochizuki (Carl Honig)
1988 Ottawa, Canada K. Rakusan
1989 Gottingen, Germany J. Piiper
1990 Townsville, Australia M. McCabe
1991 Curacao, Dutch Antilles W. Erdmann
1992 Mainz, Germany P. Vaupel
1993 San Diego, CA, USA P.D. Wagner
1994 Istanbul, Turkey C. Ince (K. Akpir)
1995 Pittsburgh, PA, USA E. M. Nemoto
1996 Dundee, Scotland D.K. Harrison
1997 Milwaukee, WI, USA A.G. Hudetz (25th Anniversary)
1998 Budapest, Hungary A. Eke
1999 Hanover, NH, USA H. Swartz
2000 Nijmegen, The Netherlands B. Oeseburg
2001 Philadelphia, USA D.F. Wilson
2002 Manchester, UK M.S. Thorniley
2003 Rochester, USA P. Okunieff
2004 Bari, Italy G. Cicco
2005 Brisbane, Australia D. Maguire
2006 Louisville, USA K. Kang
1 ISOTT: Roots, Founding and Beyond 5

The 2007 meeting will be held in Uppsala, Sweden where Dr. Per Liss will serve
as President.In 1983 at the Ruston, Louisiana meeting Dr. Bruley initiated the first
Melvin H. Knisely Award to a promising young investigator. This award was
then approved and established by the Executive Committee to express the spirit
and willingness of Dr. Knisely to work with and contribute to the growth of
beginning scientists and engineers addressing the problems of oxygen transport
to tissue. Dr. Bruley was then elected as the Chairman of the ‘‘Melvin
H. Knisely Award’’ selection committee and nominees have been reviewed
each year with those selected being honored at the annual banquet.The recipients, through the 2006 meeting in Louisville, USA are as
follows:
1983 Antal G. Hudetz (Hungary) 1995 Clare E Elwell (UK)
1984 Andras Eke (Hungary) 1996 Sergei A. Vinogradov (USA)
1985 Nathan A. Bush (USA) 1997 Chris Cooper (UK)
1986 Karlfried Groebe (Germany) 1998 Martin Wolf (Switzerland)
1987 Isumi Shibuya (Japan) 1999 Huiping Wu (USA)
1988 Kyung A. Kang (Korea/USA) 2000 Valentina Quaresima (Italy)
1989 Sanjay Batra (Canada) 2001 Fahmeed Hyder (Bangladesh)
1990 Stephen J. Cringle (Australia) 2002 Geoffrey De Visscher (Belgium)
1991 Paul Okunieff (USA) 2003 Mohammad Nadeem Khan (USA)
1992 Hans Degens (The Netherlands) 2004 Frederick Palm (Sweden)
1993 David A. Benaron (USA) 2005 Nicholas Lintell (Australia)
1994 Koen van Rossem (Belgium) 2006 No Awardee Selected
In 1994 a second Award to support travel for a young investigator was
approved by the Executive Committee. The recipients of the ‘‘Dietrich
W. Lubbers Award’’ are as follows:
1994 Michael Dubina (Russia) 2001 Theresa M. Busch (USA)
1995 Philip E. James (UK/USA) 2002 Lino K. Korah (USA)
1996 Resit Demir (Germany) 2003 James J. Lee (USA)
1997 Juan Carlos Chavez (USA) 2004 Richard Olson (Sweden)
1998 Nathan A. Davis (UK) 2005 Charlotte Ives (UK)
1999 Paolo Pichiule (USA) 2006 Bin Hong (China/USA)
2000 Ian Balcer (USA)
The Britton Chance Award was established in 2003 in honor of Professor
Chance’s long-standing commitment, interest and contributions to many
aspects of oxygen transport to tissue and to the society. The award is to
recognize outstanding contributions to research by a young investigator to
help support travel to the ISOTT meeting. The Britton Chance Awardees are
as follows:
6 D.F. Bruley

2004 Derek Brown (Switzerland)2005 James Lee (USA)2006 Hanzhu Jin (China/USA)
The Duane F. Bruley Awards were established and were first presented byISOTT at the 2004 annual meeting in Bari, Italy. They were established tosupport travel funds for student researchers in all areas of oxygen transportto tissue. The Awards signify Dr. Bruley’s interest in seeking young scientistsand engineers to maintain the image and quality of research associated withthe society. As a co-founder of ISOTT in 1973, Dr. Bruley emphasizes cross-disciplinary research among basic scientists, engineers, medical scientists,and clinicians. His pioneering work constructing mathematical models foroxygen and other anabolite/metabolite transport in the microcirculation,employing computer solutions, were the first to consider system non-linear-ities, time dependence, including multi-dimensional diffusion, convection,and reaction kinetics. It is hoped that receiving the Duane F. BruleyAward will inspire students to excel in their research and will assist insecuring future leadership for ISOTT. The Duane F. Bruley Awardees areas follows:
2004 2005 2006
Helga Blocks (Belgium) Robert Bradley (UK) Ben Gooch (UK)
Jennifer Caddick (UK) Harald Oey (Australia) Ulf Jensen (Germany)
Charlotte Ives (UK) Kathy Hsieh (Australia) Smruta Koppaka (USA)
Nicholas Lintell (Australia) Jan Shah (Australia) Daya Singh (UK)
Leonardo Mottola (Italy) Martin Tisdall (UK)
Samin Rezania (USA/Iran) Bin Wong (USA)
Ilias Tachtsidis (UK) Kui Xu (USA)
Liang Tang (USA/China)
Iyichi Sonoro (Japan)
Antonio Franco (Italy)
As pointed out earlier the first society proceedings were published by PlenumPress [9, 10]. However, the number of total proceedings published has beenconfused by the mixing of two different publisher’s ‘‘mistaken’’ use of twodifferent names. Some of the first meeting proceedings were published underthe Library of Congress Cataloging title of ‘‘International Symposium on Oxy-gen Transport to Tissue’’ rather than the official title of ‘‘International Societyon Oxygen Transport to Tissue.’’ Since the two titles are listed separately theuninformed might not be aware of both sets of proceedings and some librariesdo not have all of the volumes.
At the 25th Anniversary it was approved by the Executive Committeeand the membership-at-large to proceed with arrangements to establish a
1 ISOTT: Roots, Founding and Beyond 7

Journal for ISOTT with Plenum Press. The publications committee nowconsists of:
Duane F. Bruley, Chairman Chris Cooper
Antal G. Hudetz Joe C. LaManna
Kyung A. Kang Hal Schwartz
David Harrison Britton Chance
Many attempts to start a journal have failed for various reasons. However, weare still active and working with several publishers to develop a society journal.Because ISOTT remains small in numbers, by choice, most publishers do notfeel a journal would be profitable.
The future of ISOTT will be determined by our young and new members,with the dedicated mentoring of our old time membership. It will be importantto stay current with new technology and be flexible enough to embrace newdirections in the area of oxygen transport to tissue. The vision of ISOTTmembers will be critical in guiding this very special international scientific andengineering society through the troubled waters created by politics and religion.
References
1. Bruley, D.F., The Genesis of ISOTT, Oxygen Transport to Tissue XX, edited by A. G.Hudetz and D. F. Bruley, Plenum Press, New York, 1998.
2. Bruley, D. F., ‘‘Bioengineering: The Fifth Traditional Engineering Discipline,’’ edited byW. Erdmann andD. F. Bruley, Advances in ExperimentalMedicine and Biology, PlenumPress, Vol. 317:3–6, 1992.
3. Bruley, D. F., and J. W. Prados, ‘‘The Frequency Response Analysis of a Wetted WallAdiabatic Humidifier,’’ AlChE Journal, 11,612, Septmeber, 1964.
4. Opitz, E., and M. Schneider, ‘‘The oxygen Supply of the Brain and the Mechanism ofDeficiency Effects,’’ Ergebnisse der Physiologie, Biologischem Chemic, und Experimentel-len Pharmakologic, 46:126–260, 1950.
5. Thews, G., ‘‘Oxygen Diffusion in the Brain. A Contribution to the Question of theOxygen Supply of the Organs,’’ Pflugers Archiv., 271:197–226, 1960.
6. Bicher, H. I., Bruley, D. F., and M. H. Knisely, ‘‘Anti-Adhesive Drugs and TissueOxygenation,’’ edited by D. F. Bruley and H. I. Bicher, Advances in ExperimentalMedicine and Biology, Plenum, Press, Vol. 37B657–667, 1973.
7. Bruley, D. F., and W. N. Drohan, ‘‘Protein C and Related Anticoagulants,’’ Advances inApplied Biotechnology Series, Vol. 11, Gulf Publishing Company (Portfolio PublishingCompany), 1990.
8. Goro, F. W., ‘‘Blood Sludge,’’ Life magazine, Vol. 24, No. 22:49–59, May 31, 1948.9. Oxygen Transport to Tissue- Instrumentation, methods, and physiology, edited by H. I. Bicher
and D. F. Bruley, Advances in Experimental Medicine and Biology, Vol. 37A,Plenum Press, 1973.
10. Oxygen Transport to Tissue- Pharmacology, mathematical studies, and nematology, editedby H. I. Bicher and D. F. Bruley, Advances in Experimental Medicine and Biology,Vol.37B, Plenum Press, 1973.
8 D.F. Bruley

Chapter 2
Dietrich W. Lubbers
Celebration of a Life Dedicated to Research
into Oxygen Transport to Tissue
David K. Harrison1
2.1 Biography
It was with great sadness that members of the International Society on Oxygen
Transport to Tissue heard of the death on 15th November 2005 of Dietrich
Werner Lubbers, one of its most distinguished and long-standing members.He was born on 12th May 1917 in the Harburg district of Hamburg. He
attended the Landesschule Pforta, a celebrated German public boarding school
Dietrich Werner Lubbers: 1917–2005.
1Durham Unit, Regional Medical Physics Department, University Hospital of NorthDurham, DH1 5TW, UK.
K.A. Kang et al. (eds.), Oxygen Transport to Tissue XXIX� Springer 2008
9

near Naumburg on the Saale river, where he completed his ‘‘Abitur’’ (the schoolqualification for entry to university) in 1935. He completed his 6 months com-pulsory labour service before being called up for compulsory military service.
As early as his last years at high school, and throughout his medical course, hedeveloped the ambition to pursue a career in scientific research applied to medi-cine. From 1937 to 1939 he studied medicine at the University of Heidelberg(5 semesters). However, in order to gain a basic scientific education that hadbeen missing from the curriculum at school, in addition to his medical course, hestudied chemistry for 4 semesters. At the outbreak of the secondworld war he wasconscripted for active service, but was able to continue his study of medicine, butnot chemistry (with interruptions for active service) in Halle, Leipzig and Berlin.
Dietrich’s scientific career began in 1941 with the research project for hismedical dissertation in the Institute of Physiology at the University of Berlinunder Professor Kurt Kramer. Kramer had demonstrated that near infraredlight penetrated deep into tissue so that spectral changes could be detected fromthe outside. Dietrich’s project was to investigate the oxygen supply in the frogheart and, to this end, using haemoglobin as the indicator, applied near infraredspectroscopy to measure oxygen. The first problem he encountered was that thefrequency response of the existing manometers was too low to measure thepulsatile pressure. In order to overcome this problem he began the first of histechnical developments. Together with Professor Gerlach of the Institute ofPhysics, University of Berlin, he built a glass plate manometer, which used thecapacitance principle, and this enabled him to successfully complete his dis-sertation in 1944. His thesis ‘‘Amethod formeasurement of the O2 consumptionand dynamics of the isolated cold blooded animal heart’’ clearly set the themefor much of his future research. In the meantime he had passed his final medicalexaminations in 1943 and was working in the army medical corps.
In December 1944 he found himself a prisoner of war in France where, fromtime to time, he acted as the camp doctor. He was not released until June 1948.From 1948 to 1950 he held a clinical post at the Borstel Tuberculosis ResearchInstitute near Hamburg
On the basis of the experimental experience gained during his Dr.med.studies he was awarded a post with Professor Erich Opitz in Kiel in 1950.Opitz’s field of research was the exchange processes between oxygen in capillaryblood and mitochondria. Dietrich’s research project was to investigate the timecourse of the oxygen supply and oxygen consumption in the beating mamma-lian heart. Since his study would involve measurements of the oxygenation ofhaemoglobin, myoglobin and the redox state of cytochromes, he decided on aspectrophotometric approach to the problem. However, this could clearly onlybe achieved with a very fast measuring instrument that scanned a wide range ofwavelengths, and multi-component analysis of the absorption spectra. Afterintensive discussions with Dr Kohler, a physicist, he set about with WalterNiesel to develop the so-called short-time spectral analyser, which was com-pleted in 1957. This was further developed by the Howaldtswerke in Kiel as the‘‘Rapidspektroskop’’ (see below). He completed his Habilitation whilst at Kiel
10 D.K. Harrison

and in 1956/57 was the guest of Briton Chance at The Johnson Foundation,University of Pennsylvania, where they were investigating the redox state ofcytochrome c using spectrophotometry. At Kiel, Dietrich also started otherresearch in the field of electrodes and blood gas measurement (see below).
From 1959 to 1961 he was a supernumerary assistant professor, at theInstitue of Physiology, University of Cologne where the Director was MaxSchneider.
In 1961 he was appointed to a Personal Chair at the Institute for AppliedPhysiology and Occupational Physiology, University of Marburg and in 1965was appointed Professor of Applied Physiology and Director of the Institute inMarburg after turning down a chair in Hanover. In Marburg Dietrich contin-ued his development of oxygen electrodes and, together with Albert and RenateHuch, started to develop the concept of the transcutaneous pO2 for monitoringneonates. Horst Baumgartl joined Dietrich in Marburg and together they wenton to build the multiwire surface pO2 electrode and the finest of needle electro-des for quantitative measurements of pO2 in tissue. Manfred Kessler completedhis Habilitation with Dietrich in Marburg.
In 1968 he was appointed Director of the Max Planck Institute for Occupa-tional Physiology in Dortmund. In 1973 the Institute was renamed the MaxPlanck Institute for Systems Physiology reflecting Dietrich’s approach to theinvestigation of biological systems. The renaming of the Institute caused greatlocal controversy as the original institute was seen as one that carried outscientific research for the benefit of the ordinary worker. Dietrich had toweather a fierce barrage of criticism in the local press [1]. This was quite unfairas he had been instrumental, along with the state of North Rhein Westphalia,for the founding of an Institute for Occupational Physiology at the Universityof Dortmund, and of which he was the acting Director initially [2]. In 1985 he‘‘Retired’’ and became Emeritus director of the Institute, which moved to a newbuilding and was renamed the Institute for Molecular Physiology in 1994.Dietrich retained a laboratory in the Institute until 2003.
Amongst those who went with Dietrich to Dortmund were Manfred Kesslerand Horst Baumgartl. There, of course, with scientists such as Elfriede Lenin-ger-Follert, Helmut Acker, Wolfgang Grunewald, Renate Huch, SebastianSchuchhardt and Reinhard Wodick – to mention but a few – his institute wasenormously productive and unravelled many of the mysteries of local regula-tion of oxygen supply to tissue.
It was in 1977 that I first met Dietrich – and not through oxygen. My PhDproject was the development of a pH electrode for use in human skin and he hadorganized a symposium on the Theory and Application of Ion-Selective Elec-trodes in Physiology andMedicine at the Dortmund Institute. That was the firsttime, too, that I met my good friend and colleague, the late Jens Hoper and ofcourse Manfred Kessler whom I worked for in Erlangen from 1981 to 1990.I had, of course, come to know ofDietrich’s work as soon as I startedmy projectin 1974.My colleague, Vance Spence had started two years earlier on a project todevelop a skin pO2 electrode and had been the guest of Dietrich who introduced
2 Dietrich W. Lubbers 11

Vance to the art ofmaking needle electrodes. Enough ofmy biography. Suffice itto say that it was at this time that Dietrich’s philosophy of the systems approachto physiology had a huge influence onme and has remained with me throughoutmy scientific career.
2.2 The Inventions
‘‘The biological problem was always the basic drive for him. If it turned out thatthe knownmethods were not good enough to enable him to solve it, he undertookthe laborious task of developing the necessary tools himself’’, Gerhard Thews [3].
Below is the ranking Dietrich himself put to his inventions when he wasawarded theDiesel GoldMedal in 1997 of theGerman Institute for Inventions[4]:
l Photometry at the surfaces of scattering media such as on live organs(6 Patents)
l Blood gas analysis (electrochemical sensors) (3 Patents)l pO2 and pCO2 measurements in situ (6 Patents)l Optical sensors with absorbent and fluorescent optical indicators (optodes)
(22 Patents).
As mentioned earlier, by 1957 Dietrich Lubbers, along with Walter Niesel,had built their first fast spectrophotometer in the Institute workshop in Kiel. Incollaboration with the Instrumentation Department of the Hohwaldtwerkeshipyard the spectrometer was further developed and marketed as the T 13/3Rapidspektroskop [5]. This instrument could record 100 spectra (25,000 mea-surements) per second, and was the fastest commercially available instrumentof its kind in 1964. It was a dual beam spectrometer which relied, of course, atthat time on analogue electronics. Depending on the diffraction grating used, ithad a wavelength range of 230–600 nm or 350–700 nm. Use of the full spectralrange allowed the use of multicomponent analysis to deconvolute the spectra ofindividual pigments such as oxy- and deoxyhaemoglobin, myoglobin and cyto-chromes. This was further facilitated after he moved to Dortmund by the rapidevolution of the digital computer and software for the evaluation of the spectrawhich was developed by Hoffmann. By now the spectrophotometer and dedi-cated computer hardware was so large that for clinical research, the patientshad to go to the laboratory at Max Planck Institute for the measurements. Inorder to get round this, together with Wodick and Pieroth, he developed a‘‘portable’’ lightguide spectrophotometer that later was marketed by Sigma asthe Oxyscan (see, for example, Merschbrock et al. [6]).
The aim of Dietrich Lubbers’ research was to understand the entire pathwayand regulation of oxygen transport from the blood into the mitochondria. Todo this he needed to be able to measure the pO2 in the tissue itself. Until the late1950s polarographic measurements in tissue were fraught with difficulties andinterferences. However, the invention of the fully integrated pO2 electrode by
12 D.K. Harrison

Leland Clark [7] changed all that and opened up a whole new realm of inven-tiveness for Dietrich. One of the earliest electrodes Dietrich developed was forin vitro measurements. However, his development of electrodes was not limitedto oxygen. His team also constructed pH and pCO2 electrodes so that theycould carry out blood gas analysis during their physiological experiments. Lateron he developed electrodes for other ions. As a result of these developments, thecompany Eschweiler, also based in Kiel, produced one of the first blood gasanalysers to appear on the market – the Combi-Analyser U in 1961. Its succes-sor is available nowadays as the Combi Line.
After his move to Marburg, together with Horst Baumgartl and ManfredKessler, Dietrich continued to develop electrodes for measurements in tissue.The multiwire surface electrode (MDO) was one of the trusty tools of thephysiological investigation of oxygen transport to tissue. He also applied thepolarographic principal to the measurement of blood flow using hydrogenclearance – a technique that I also became very involved in during the 1980s.The advantages of the MDO were that it was non-invasive and had a highresolution: 98% catchment depth of each wire approx. 60 mm. The randomdistribution of its 8 wires meant that 13 small rotations of the electrode gave astatistical distribution of pO2 consisting ofmore than 100 values – a process thattook only 3 or 4 minutes. Assessment of pO2 histograms on most organs,revealed a remarkable similarity under physiological conditions: a Gaussiandistribution always with less than 5% of values less than 5mmHg. The histo-gram brought life to the Krogh model of oxygen supply from the capillaries tothe tissue and demonstrated that, again under physiological conditions, a highlyefficient regulation of blood flow prevents anoxia occurring in the so-calledlethal corner – the cells at the venous end of the capillaries.
Dietrich always questioned his own methods, and he wanted to test howrepresentative the pO2 histograms measured using the multiwire electrode were.He and Horst Baumgartl therefore produced what I think must be the finesttipped Clark type needle electrode ever made in order to carry out measure-ments within tissue. He presented their results at his last ISOTT meeting inNijmegen in 2000 [8]. He was able to show that with increasing distancesbetween pO2 histogram measurement points, the histogram remainedunchanged thus showing that measurements of histograms with the MDO,which encompass several capillary supply units, do indeed represent the dis-tribution within a single unit.
The citation for the award of the Diesel Gold Metal stated: ‘‘Of particularsignificance, then, is the fact that not only did he invent things that were highlyinnovative – at the same time he endeavoured to put his ideas into clinicalpractice’’ [2]. An excellent example of this is the development of the transcuta-neous pO2 electrode which he continued after his move to Dortmund. He, alongwith theHuchs, discovered that the blood supply of the skin of newborn babies isso high that it was possible to effectively measure arterial pO2 across the skin. Itwas important, however, that the hyperaemia, which was induced by heating theskin, always remained sufficient for the pO2 to remain independent of changes in
2 Dietrich W. Lubbers 13

blood flow. How this was achieved was the subject of yet another of Dietrich’spatents and the transcutaneous pO2 electrode [9] was adopted throughout theworld in neonatal intensive care units for many years as an indispensablemonitoring device until it was eventually superseded by the pulse oximeter.
Dietrich became interested in fluorescence lifetime measurements of pO2 inthe early 1970s whilst trying to study angiogenesis and oxygen supply in thedorsal skin fold chamber in the rat. Measuring pO2 was a problem because theyhad to open the chamber to do so. He decided that this new optical techniquewould be suitable and with Norbert Opitz developed so-called optodes (opticalelectrodes) [10]. They found, however, that the fluorescence-pO2 calibrationwas unstable when the indicator was placed directly in the tissue. His trick wasto sandwich the optical sensor between an oxygen-permeable and an oxygen-impermeable membrane. In a further development, the indicator itself wasbound into a membrane. pH and pCO2 optodes followed and, in collaborationwith a number of commercial companies, the technology has been incorporatedinto blood gas analysers, single use flow-through devices and catheter devicesfor continuous monitoring.
In typical fashion, Dietrich used his inventiveness to apply his fluorescencesensor technology to another physiological question. Some years earlier, hisgroup had discovered, using pO2 microelectrodes, that the pO2 in the upperlayers of skin is a function of depth. He wanted to know to what extent atmo-spheric air was the source of oxygen supply to the skin, and what clinicalimplications this might have. He therefore adapted the fluorescence sensor tomeasure the oxygen flux across the skin. In collaboration with Markus Stuckerat the Dermatological Clinic in Bochum they carried out a number of investiga-tions and were able to demonstrate that cutaneous blood flow contributes littleto the oxygen supply of the upper layers of skin [11]. Recognising the clinicalimportance of the discovery – particularly for the treatment of diabetic, venousand ischaemic skin diseases – in collaboration with Dr Paul Hartmann of AVL(later to become part of Roche Diagnostics) an oxygen flux imaging system wasdeveloped [12].
However, never reliant on the results provided by a single methodology, itwas at this time (2001) that I was recruited to the Dortmund team – albeit forjust 2 weeks – to apply the transcutaneous hydrogen clearance technique thatI had developed based on his transcutaneous pO2 electrode. The idea was totest the reverse hypothesis, i.e. that if the blood flow contributed significantlyto the oxygen supply at the surface of the skin at normal skin temperature, thefreely diffusible, biologically inert hydrogen carried by the blood would bedetected at the surface of the skin. Although we were unable to complete a fullseries of experiments at the time, for Dietrich our preliminary results providedfurther confirmation of the important role of atmospheric oxygen supply tothe skin [13].
I have just used the example of skin, but through Dietrich’s long scientificcareer he was a prolific publisher of some 450 papers reporting studies involvingthe oxygen supply of all of these organs, cells and organelles: heart, brain, liver,
14 D.K. Harrison

carotid body, kidney, eye, tumours, inner ear, lymphatics, olfactory lobe,placenta, capillaries, mitochondria, erythrocytes and many more.
On a personal note, Horst Baumgartl [1] told me that it was always difficultfor Dietrich to get away from the Institute to go on holiday with his family.With almost predictable regularity some sort of calamity occurred just before hewas due to go on leave. On one occasion the garage door fell down on his head;on another he damaged his leg; on another he injured his wrist. In the end themembers of the Institute assumed that these events had nothing to do withchance or accidents, but an unconscious reluctance to leave his scientificendeavours.
2.3 Honours and Awards
Dietrich Lubbers’ achievements were recognised with a host of honours andawards: Member of the New York Academy of Science; Honorary Professor,Ruhr University, Bochum; Corresponding member of the Mainz Academy ofScience and Literature, 1975; President of ISOTT, 1981–2; President of the Ger-manPhysiological Society, 1984;Honorarymember of theGermanPhysiologicalSociety 1986; Honorary member of the German Microcirculation Society, 1985Honorary member of the Association for Occupational Physiology and Occupa-tional Safety, 1977. He was awarded the RatschowMedal of the German Societyof Angiology in 1985 and, as mentioned above, the Diesel Gold Medal of theDiesel Trust at the German Institute for Inventions in 1997. The first DietrichW Lubbers Award was awarded by ISOTT in 1994.
2.4 ISOTT
Dietrich was a member of the first International Committee of ISOTT [14] andattended almost every meeting until 2000. Indeed it was the workshop organisedat the Max Planck Institute in Dortmund in July 1971 that was probably theinspiration for Duane Bruley to organise, with Melvin Knisely, what turned outto be the first ISOTT meeting in April 1973 in Charleston, South Carolina [14].My first ISOTTmeeting was in Dortmund in 1982 and as a young scientist I wasin awe of Dietrich who always had a challenging question for the discussion.However, as I got to know him well, I learnt that it was simply a passionatesearching for the scientific truth that inspired his questions.
Dietrich was usually accompanied by his wife Angela to the meetings andtogether they were very much part of the ISOTT ‘‘Family’’. In 1996 I had thehonour of welcoming him to the ISOTT meeting I organised in Dundee.Manfred Kessler used to refer to Dietrich as his ‘‘scientific father’’ and my‘‘scientific grandfather’’. It was a term I think that Dietrich himself didn’t really
2 Dietrich W. Lubbers 15

approve of, mainly, I believe, because it made him feel old. His health started tomake it difficult for him to travel long distances, and the Nijmegen meeting in2000 was the last ISOTT he attended.
Many of us remember Dietrich as a dedicated scientist with a sharp mind,always ready to discuss new ideas and concepts. As someone who was alwaysseeking after the scientific truth, it may be a surprise to learn that he was ashameless story-teller. He used to tell all sort of tall stories to his children aboutstrange goings on in a castle they were passing, or the wildest tales about theriver they were walking alongside [15]. He was also a religious man. Althoughprofessing to be unmusical, he and his family often sang together a particularsong in German by Matthias Claudius ‘‘The moon has risen’’ (Tr. CatherineWinkworth, 1855) that begins:
Look up; the moon tonightShows us but half her light,
And yet we know her round and fair.At other things how oftWe in our blindness scoffed
Because we saw not what was there.
The words of the whole song reveal that Dietrich was fascinated by thebeauty and mysteries of God’s creation – and this is clearly reflected in hisscientific endeavours to understand it.
Dietrich felt greatly honoured by the Society’s decision to present an annualaward to young scientists bearing his name and it is indeed very fitting thatthrough the Dietrich Lubbers Award, members of ISOTT will continue torecognise and celebrate his enormous contribution to research in the field ofoxygen transport to tissue.
References
1. H. Baumgartl, Personal communication, (2006).2. P. Vaupel, Obituary for Dietrich Lubbers. Yearbook of the Academy of Science and
Literature, Mainz, 2005/2006 (Steiner Verlag, Stuttgart, 2006), pp. 127–130.3. G. Thews, The scientific works ofDietrichLubbers.Commemorative Volume on theOccasion
of the Retiral of Prof. Dr med. D. W. Lubbers, 31st May 1985. edited by R. Kinne, H. Ackerand E Leniger-Follert (Max-Plank-Institute for Systems Physiology, Dortmund, 1985).
4. D. W. Lubbers, Personal papers, ca 1996.5. W. Niesel, D. W. Lubbers, D. Schneewolf, J. Richter and W. Botticher, Double beam
spectrometer with 10-msec recording time. Rev. Sci. Inst. 35, 578–581 (1964).6. U. Meschbrock, J. Hoffmann, L. Caspary, J. Huber, U. Schmicholy and D. W. Lubbers,
Fast wavelength scanning spectrophotometer for non-invasive determination of hemoglo-bin oxygenation in human skin, Int. J. Microcirc. 14, 274–281 (1994).
7. L. C. Clark, Monitoring and control of blood and tissue oxygen, Trans. Am. Soc. Artif.Organs 2, 41–8 (1956).
8. H. Baumgartl, W. Zimelka and D. Lubbers, Evaluation of profiles to describe theoxygen pressure field within the tissue. Comp. Biochem. & Physiol. A 132, 75–85(2002).
16 D.K. Harrison

9. R. Huch, D. W. Lubbers and A Huch, Quantitative continuous measurement of oxygenpressure on the skin of adults and newborn babies.Pflug. Arch. Ges. Physiol. 337, 185–198(1973).
10. D. W. Lubbers and N. Opitz, The pCO2-/pO2-optode: a new probe for measurement ofpCO2 or pO2 in fluids and gases. Z. Naturforsch. C Biosci. 30, 532–533 (1975).
11. M. Stucker, A. Struk, P. Altmeyer, M. Herde, H. Baumgartl and D. W. Lubbers, Thecutaneous uptake of atmospheric oxygen contributes significantly to the oxygen supply ofhuman dermis and epidermis, J. Physiol. 538, 985–994 (2002).
12. P. Hartmann, W. Ziegler, G. Holst and D.W. Lubbers, Oxygen flux fluorescence lifetimeimaging, Sens. Actuators B 38–39, 110–115 (1997).
13. D. Harrison, D. W. Lubbers, H. Baumgartl, C. Stoerb, S. Rapp, P. Altmeyer andM. Stucker, Capillary blood flow and cutaneous uptake of oxygen from the atmosphere.In: Progress in Biomedical Optics and Imaging: Functional Monitoring and Drug-TissueInteraction, editors G. J. Muller and M. Kessler. SPIE Proc Series 4623, 195–205 (2002).
14. D. F. Bruley DF. The genesis of ISOTT, Adv Exp Med Biol. 454, 1–6 (1998).15. A. Lubbers, Personal communication, (2006).
2 Dietrich W. Lubbers 17

Part I
Oxygen Transport in Tissue

Chapter 3
Investigation of Frontal Cortex, Motor Cortex
and Systemic Haemodynamic Changes During
Anagram Solving
Ilias Tachtsidis1, Terence S. Leung
1, Martin M. Tisdall
2, Presheena Devendra
1,
Martin Smith2, David T. Delpy1, and Clare E. Elwell1
Abstract We have previously reported changes in the concentrations of oxy-(�[HbO2]) deoxy- (�[HHb]) and total haemoglobin (�[HbT]=�[HbO2]þ�[HHb]) measured using near infrared spectroscopy (NIRS) over the frontal
cortex (FC) during an anagram solving task. These changes were associatedwith a significant increase in both mean blood pressure (MBP) and heart rate(HR). The aim of this study was to investigate whether the changes in MBPpreviously recorded during an anagram solving task produces associated
changes in scalp blood flow (flux) measured by laser Doppler and whetherany changes are seen in NIRS haemodynamic measurements over a controlregion of the brain (motor cortex: MC). During the 4-Letter anagram tasksignificant changes were observed in the�[HbO2],�[HHb] and�[HbT] in both
the frontal and motor cortex (n=11, FC p<0.01, MC p<0.01). These changeswere accompanied by significant changes in both MBP (n=11, p<0.01) andscalp flux (n=9, p=0.01). During the 7-Letter anagram task significant changeswere observed in the �[HbO2] and �[HbT] (n=11, FC p<0.01, MC p<0.01),which were accompanied by significant changes in both MBP (n=11, p=0.05)
and flux (n=9, p=0.05). The task-related changes seen in MBP and flux in thisstudy appear to contribute to the changes in the NIRS signals over both theactivated and control regions of the cortex.
3.1 Introduction
Amajor aim of functional mapping studies of the human brain is tomonitor the
magnitude and spatial distribution of activity associated with brain function.To that extent cranial functional near-infrared spectroscopy (NIRS) has beenwidely used to investigate the haemodynamic changes which occur in response
1Department of Medical Physics and Bioengineering, Malet Place Engineering Building,Gower Street, University College London, London, UK, WC1E 6BT.2The National Hospital for Neurology and Neurosurgery, Queen Square, London, UK.
K.A. Kang et al. (eds.), Oxygen Transport to Tissue XXIX� Springer 2008
21

to functional activation of specific regions of the cerebral cortex. Based onthe tight coupling of neuronal activity and oxygen delivery, changes in theconcentration of oxygenated (�[HbO2]) and deoxygenated (�[HHb]) haemo-globin as measured by NIRS are quantified and taken as indicators of corticalactivation.
NIRS is increasingly being used to monitor the haemodynamic responseover the frontal and prefrontal regions during cognitive tasks such as colourStroop [1], working memory [2], Wisconsin card sorting test [3], calcula-tions [4], mathematical problems [5], playing video games [6], and anagramsolving tasks [7]. It is possible that some mental tasks used in these studiesmay elicit a systemic response which may affect the measured NIRS signals.We have previously reported that significant changes in mean blood pressure(MBP) and heart rate (HR) occur during anagram activation tasks andobserved that NIRS haemodynamic changes were in some volunteers signifi-cantly correlated with these systemic changes [8].
The aim of this study is to investigate whether the changes in MBP duringanagram solving tasks produce associated changes in scalp blood flow andwhether any changes are seen in NIRS haemodynamic measurements over acontrol region of the brain.
3.2 Materials and Methods
3.2.1 Subjects
11 healthy volunteers (6 males and 5 females) all right handed with Englishas their first language (age 20 to 36 years; mean 25 years) took part in thisstudy.
3.2.2 Instrumentation
A continuous wave near-infrared spectrometer with a sampling rate of 6Hz(NIRO 300, Hamamatsu Photonics KK) was used to measure changes in tissue[HbO2] and [HHb] using the modified Beer-Lambert law. The optodes from thedual channel system were placed on the head based on the 10/20 EEG electrodeplacement system. Channel 1 was placed on the left motor cortex (MC) respon-sible for finger and handmovement identified as the C3 position. Channel 2 wasplaced on the left frontal cortex (FC) identified as the Fp1 position. Bothchannels were shielded from ambient light by using an elastic bandage and ablack cloth. An optode spacing of 4 or 5cm was used in order to optimise thedetected light intensity. For the conversion of the optical attenuation changes to
22 I. Tachtsidis et al.

concentration changes a differential pathlength factor (DPF) of 6.26 was
applied [9]. A Portapres1 system (TNO Institute of Applied Physics) was
used to continuously and non-invasively measure MBP and HR from the
finger. Finally a laser Doppler probe (FloLab, Moore Instruments) was placed
over the forehead tomonitor the changes in scalp blood flow (flux) in nine of the
eleven subjects.
3.2.3 Procedure
All the volunteers were positioned in a comfortable sitting position. Data were
recorded during two minutes of the subject at rest (baseline), followed with one
minute period of the subject solving 4-Letter anagrams (15 anagrams, 4 seconds
per anagram) and then with one minute period of the subject solving 7-Letter
anagrams (6 anagrams, 10 seconds per anagram). Each anagram-solving period
was repeated a total of three times, with the study ending after a 2-minute rest
period (total study time 10 minutes). In this study solving an anagram was
defined as producing one coherent word using only the letters from another
word (e.g. icon–coin; reserve–reverse).The subjects were encouraged to solve as many anagrams as possible and
were instructed to say possible solutions out loud (without moving); however,
the subjects were not scored on their performance.
3.2.4 Analysis
The NIRS haemoglobin signals were first detrended to remove any slow
drift, then all the signals including MBP, HR and flux, were low pass
filtered at 0.08Hz to minimise the effects of other signal components. The
filtering was carried out by a 5th order low pass Butterworth digital filter in
forward backward directions to avoid introducing a phase delay (MatLab
Mathworks Inc). The filtered signals from each volunteer were ensemble
averaged over the repetition cycles (per volunteer two rest periods, three
4-Letter periods and three 7-Letter periods). Changes in total haemoglobin
concentration (�[HbT]) were calculated from the sum of �[HbO2] and
�[HHb].The response to stimulation was calculated as the difference between the
average of 10 seconds worth of baseline data at the end of the rest period,
and the average of 10 seconds of data commencing 20 seconds after the onset
of the 4-Letter anagram solving period and the 7-Letter anagram solving
period respectively. A ‘Student’s t-test’ was used to assess the significance
of these responses (the threshold of significance was set at p�0.05 from
3 Investigation of Frontal, Motor Cortex and Systemic Haemodynamic Changes 23

baseline). Correlations between variables were analysed with the Pearson cor-relation model.
3.3 Results
3.3.1 Activation Results
Figure 3.1 shows the grand average of the NIRS,MBP and scalp flux data fromall volunteers during the entire ten minute test. Table 3.1 shows the meanresponse of each signal during 4- and 7-Letter anagram solving.
During the 4-Letter anagram task significant changes were observed inthe �[HbO2] (n=11, FC p<0.01, MC p<0.01), �[HHb] (n=11, FC p=0.05,MC p<0.01) and �[HbT] (n=11, FC p<0.01, MC p<0.01) in both the frontaland motor cortex. These changes were accompanied by significant changes inboth MBP (n=11, p<0.01) and flux (n=9, p=0.01). During the 7-Letteranagram task significant changes were observed in the �[HbO2] (n=11,FC p<0.01, MC p<0.01) and �[HbT] (n=11, FC p<0.01, MC p<0.01),
)stinuyrartibra(
xulF
Time (minutes)
74
76
78
80
82
84
86RESTREST 4L4L4L 7L7L7L
Time (minutes)
(c) MEAN BLOOD PRESSURE
30
40
50
60
70
80
90RESTREST 4L4L4L 7L7L7L
(d) SCALP BLOOD FLOW
–1.0
–0.5
0.0
0.5
1.0
1.5
2.0
2.5
3.0
3.5
4.0
0
RESTREST 4L4L4L 7L7L7L
(a) FRONTAL CORTEX
ΔCon
cent
ratio
ns (
μM)
ΔCon
cent
ratio
ns (
μM)
–1.0
–0.5
0.0
0.5
1.0
1.5
2.0
2.5RESTREST 4L4L4L7L7L7L
(b) MOTOR CORTEX
Time (minutes) Time (minutes)
Δ[HbO2] Δ[HHb] Δ[HbT]
Mea
n B
lood
Pre
ssur
e (m
mH
g)
1 2 3 4 5 6 7 8 9 10 0 1 2 3 4 5 6 7 8 9 10
0 1 2 3 4 5 6 7 8 9 10 0 1 2 3 4 5 6 7 8 9 10
Fig. 3.1 Grand averaged responses for �[HbO2], �[HHb] and �[HbT] for all 11 subjectsmeasured over the (a) frontal cortex and (b) motor cortex; (c) average (n=11) mean bloodpressure; (d) average (n=9) scalp blood flow. (4L: 4-Letter Anagrams, 7L: 7-LetterAnagrams.)
24 I. Tachtsidis et al.

which were accompanied by similar significant changes in both MBP (n=11,
p=0.05) and flux (n=9, p=0.05). The changes in �[HHb] during the 7-letter
anagram task were not significant. No significant differences were found
between the 4-Letter and 7-Letter anagram activation periods for the NIRS
and MBP signals.
3.3.2 Inter-subject Correlation
The �[HbO2] and �[HHb] signals measured over the frontal and motor
cortex regions were found to have a varying association with the MBP and
flux signals across different volunteers. In order to investigate this we
calculated the correlation coefficient between the filtered �[HbO2] and
MBP, �[HHb] and MBP; �[HbO2] and flux, and �[HHb] and flux for
both frontal and motor cortex in all subjects. These results are shown in
Figs. 3.2 and 3.3
Table 3.1 Response of NIRS signals over the motor and frontal brain regions (MC: motorcortex; FC: frontal cortex) and MBP and Flux during 4- and 7-Letter anagram solving. Datafrom all volunteers are presented as means�SD
NoSubjects 4-Letters minus Rest 7-Letters minus Rest
MC FC MC FC
�[HbO2] (mM) 11 1.55�1.14* 2.04�1.37* 1.34�1.23* 1.83�1.26*�[HHb] (mM) 11 �0.48�0.51* �0.38�0.62z �0.28�0.66 �0.26�0.68�[HbT] (mM) 11 1.08�1.23* 1.65�1.28* 1.07�1.20* 1.57�1.07*MBP (mmHg) 11 4.7�4.4* 3.3�5.2z�Flux (%) 9 50.2�56.5y 18.0�25.2z(t-test *p<0.01; yp<0.03; zp�0.05)
MBP and Δ[HbO2] MBP and Δ[HHb]
–1.00–0.80–0.60–0.40–0.200.00
0.200.400.600.801.00
1 2
Subjects
Co
rrel
atio
n C
oef
fici
ent
–1.00
–0.80
–0.60
–0.40
–0.20
0.00
0.20
0.40
0.60
0.80
1.00
Subjects
Co
rrel
atio
n C
oef
fici
ent
(a) FRONTAL CORTEX (b) MOTOR CORTEX
3 4 5 6 7 8 9 10 11 1 2 3 4 5 6 7 8 9 10 11
Fig. 3.2 Individual correlation coefficients between MBP and �[HbO2] and MBP and�[HHb] for each subject for (a) the frontal cortex and (b) the motor cortex.
3 Investigation of Frontal, Motor Cortex and Systemic Haemodynamic Changes 25

3.4 Discussion
In this study we observed significant changes in the [HbO2], [HHb] and [HbT]measured over both the left frontal and motor cortex regions during a 4-letteranagram solving task. We also observed significant changes in the [HbO2] and[HbT] measurements during a 7-letter anagram solving task. Furthermore, inthe group data, we observed a significant increase from rest in both MBP andscalp flux when the subjects were solving the 4- and 7-letter anagrams. Wefound that the haemoglobin changes measured by NIRS over the frontal andmotor cortex during anagram activation were in some volunteers significantlycorrelated with the changes in MBP and scalp flux.
During the anagram task there is no reason to expect haemodynamicchanges over the motor cortex. The task-related changes seen in MBP andflux in this study appear to contribute to the changes in the NIRS haemody-namic signals over the activated and control regions of the cortex. It is possiblethat the anagram task elicits an emotional response, which produces changes inblood pressure that are likely to cause passive changes in the scalp blood flow asobserved in the laser Doppler flux signal. These changes in the scalp blood flowcan produce small changes in the [HbO2] and [HHb] signals as measured bycranial NIRS.
When analysing cerebral haemodynamic activation data using functionalneuroimaging the task-specific activation observed is due to the existence of aclose coupling between regional changes in brain metabolism and regionalcerebral blood flow. In order for this response to be monitored unambiguouslyit is important that the haemodynamic task-related activity is occurring on topof an unchanged global systemic and brain resting state. The blood pressure andscalp flux changes observed in this study suggest that systemic task relatedresponses may also be present and that they may lead to haemodynamicchanges characteristic of functional activation changes in a control region ofthe brain.
–1.00–0.80–0.60–0.40–0.200.000.200.400.600.801.00
Co
rrel
atio
n C
oef
fici
ent
SubjectsSubjects
Co
rrel
atio
n C
oef
fici
ent
Flux and Δ[HbO2] Flux and Δ[HHb]
(a) FRONTAL CORTEX (b) MOTOR CORTEX
–0.80
–0.60
–0.40
–0.20
0.00
0.20
0.40
0.60
0.80
1.00
1 2 3 4 5 6 7 8 9 10 11 1 2 3 4 5 6 7 8 9 10 11
Fig. 3.3 Individual correlation coefficients between flux and �[HbO2] and flux and �[HHb]for each subject. For subjects 5 and 7 the scalp flux signal was not collected.
26 I. Tachtsidis et al.

The relatively high correlation coefficient found in some subjects in this
study between the NIRS haemodynamic measurements with the MBP and
scalp flux signals suggest a global task-related haemodynamic response. In
the absence of high resolution maps of haemodynamic response it is difficult
to determine whether changes in the NIRS signals are due to the global changes
in systemic variables or haemodynamic changes originating from specific
regions of the cerebral cortex.There are numerous recent publications using functional NIRS where differ-
ences in response have been reported, for example in frontal and prefrontal
activation between healthy volunteers and schizophrenic patients [10], between
healthy volunteers and adults with pervasive developmental disorders [11],
between adults and preschool children [12], between men and women [13],
and between different age groups from 20 to 90 years old [14]. In none of the
studies mentioned above were systemic changes monitored. We suggest that
caution should be exercised when analysing quantitatively the cerebrovascular
response during frontal and prefrontal activation due to the unknown haemo-
dynamic contribution from systemic alterations occurring during the
stimulation.
Acknowledgment The authors would like to thank the UCL/UCLH trustees, the EPSRC/MRC, grant No GR/N14248/01 and Hamamatsu Photonics KK. This paper is dedicated tothe memory of Grigoris Xatzieustratiou (22 July 1978–01 October 2006).
References
1. M. L. Schroeter, S. Zysset, F. Kruggel, and D. Y. von Cramon, Age dependency of thehemodynamic response as measured by functional near-infrared spectroscopy, Neuro-Image 19(3), 555–564 (2003).
2. Y. Hoshi, B. H. Tsou, V. A. Billock, M. Tanosaki, Y. Iguchi, M. Shimada, T. Shinba,Y. Yamada, and I. Oda, Spatiotemporal characteristics of hemodynamic changes in thehuman lateral prefrontal cortex during working memory tasks, NeuroImage 20(3),1493–1504 (2003).
3. S. Sumitani, T. Tanaka, S. Tayoshi, K. Ota, N. Kameoka, S. Ueno, and T. Ohmori,Activation of the prefrontal cortex during the wisconsin card sorting test as measured bymultichannel near-infrared spectroscopy, Neuropsychobiology 53(2), 70–76 (2006).
4. A. Villringer, J. Planck, C. Hock, L. Schleinkofer, and U. Dirnagl, Near Infrared Spectro-scopy (NIRS): a new tool to study hemodynamic changes during activation of brainfunction in human adults, Neurosci. Lett. 154(1–2), 101–104 (14-5-1993).
5. Y. Hoshi andM. Tamura, Near-infrared optical detection of sequential brain activation inthe prefrontal cortex during mental tasks, NeuroImage 5(4 Pt 1), 292–297 (1997).
6. S. Nagamitsu, M. Nagano, Y. Yamashita, S. Takashima, and T. Matsuishi, Prefrontalcerebral blood volume patterns while playing video games–a near-infrared spectroscopystudy, Brain Dev. 28(5), 315–321 (2006).
7. B. Chance, S. Nioka, S. Sadi, and C. Li, Oxygenation and blood concentration changes inhuman subject prefrontal activation by anagram solutions, Adv. Exp. Med. Biol. 510,397–401 (2003).
3 Investigation of Frontal, Motor Cortex and Systemic Haemodynamic Changes 27

8. I. Tachtsidis, T. S. Leung, L. Devoto, D. T. Delpy, and C. E. Elwell, Measurement offrontal lobe functional activation and related systemic effects: a near-infrared spectro-scopy investigation., Adv. Exp. Med. Biol. (2007).
9. A.Duncan, J.H.Meek,M.Clemence, C.E. Elwell, L. Tyszczuk,M.Cope, andD.T.Delpy,Optical pathlength measurements on adult head, calf and forearm and the head of thenewborn infant using phase resolved optical spectroscopy, Phys. Med. Biol. 40(2), 295–304(1995).
10. Y. Kubota, M. Toichi, M. Shimizu, R. A. Mason, C. M. Coconcea, R. L. Findling,K. Yamamoto, and J. R. Calabrese, Prefrontal activation during verbal fluency tests inschizophrenia–a near-infrared spectroscopy (NIRS) study, Schizophr. Res. 77(1), 65–73(2005).
11. H. Kuwabara, K. Kasai, R. Takizawa, Y. Kawakubo, H. Yamasue, M. A. Rogers,M. Ishijima, K. Watanabe, and N. Kato, Decreased prefrontal activation during letterfluency task in adults with pervasive developmental disorders: A near-infrared spectro-scopy study, Behav. Brain Res. 172(2), 272–277 (2006).
12. S. Tsujimoto, T. Yamamoto, H. Kawaguchi, H. Koizumi, and T. Sawaguchi, Prefrontalcortical activation associated with working memory in adults and preschool children: anevent-related optical topography study, Cereb. Cortex 14(7), 703–712 (2004).
13. J. Leon-Carrion, J. Damas, K. Izzetoglu, K. Pourrezai, J. F. Martin-Rodriguez,J. M. Martin, and M. R. Dominguez-Morales, Differential time course and intensity ofPFC activation for men and women in response to emotional stimuli: a functional near-infrared spectroscopy (fNIRS) study, Neurosci. Lett. 403(1–2), 90–95 (2006).
14. I. L. Kwee and T. Nakada, Dorsolateral prefrontal lobe activation declines significantlywith age–functional NIRS study, J. Neurol. 250(5), 525–529 (2003).
28 I. Tachtsidis et al.

Chapter 4
Do Red Blood Cell-b-Amyloid Interactions Alter
Oxygen Delivery in Alzheimer’s Disease?
Joy G. Mohanty1, D. Mark Eckley2, J. D. Williamson3,
L. J. Launer4, and Joseph M. Rifkind1
Abstract Oxygen delivery requires that Red Blood Cells (RBCs) must bedeformable to pass through the microcirculation. Alzheimer’s disease (AD) isa progressive neurodegenerative disorder characterized by abnormal extracel-lular deposition of b-amyloid peptide (Ab) and neuronal loss.We have analyzedRBCmorphology in blood from subjects with AD and found that>15% of theRBCs are elongated as compared to 5.9% in normal controls (p<0.0001). Todetermine whether these morphology changes can be associated with the greaterexposure of RBCs to Ab in AD subjects, we investigated the in vitro effect of Abfibrils on blood. Morphological analysis of RBCs treated with Ab1-40 or Ab1-42fibrils show 8.6% or 11.1% elongated cells, respectively. In contrast, only 2.9%or 1.3%ofRBCs are elongated when blood is treated with buffer ormock fibrilsgenerated from Ab42-1. Elongated RBCs are expected to be less deformable.This prediction is consistent with our earlier studies showing impaired deform-ability of RBCs treated with Ab fibrils. An additional factor previouslyreported by us, expected to impair the flow of RBCs through the microcircula-tion is their adherence to endothelial cells (ECs) whenAb1-40 fibrils are bound toeither RBCs or ECs. This factor would be more pronounced in AD subjectswith elevated levels of Ab on the vasculature. These results suggest that Abinteractions with RBCs in AD subjects can result in impaired oxygen transportand delivery, which will have important implications for AD.
4.1 Introduction
Alzheimer’s disease (AD) is characterized by neuronal degeneration and synap-tic loss [1, 2]. These changes have been associated with the extracellular deposi-
Corresponding author: Joy G. Mohanty, e-mail: [email protected] Dynamics Section, 2Image Informatics & Cell Biology Unit, Laboratory ofGenetics, National Institute onAging, Baltimore,MD, 3RoenaKulynych Center forMemoryand Cognition Research, Department of Medicine, Wake Forest University School ofMedicine, Winston-Salem, NC, 4Laboratory of Epidemiology, Demography and Biometry,National Institute on Aging, National Institutes of Health, Bethesda, MD.
K.A. Kang et al. (eds.), Oxygen Transport to Tissue XXIX� Springer 2008
29

tion of plaques containing b amyloid (Ab) fibrils and neurofibrillary tangles. Inaddition to this, Ab is also found in the vasculature causing amyloidosis in ADsubjects [3–5].
Neuronal function uses �20% of the total oxygen consumed by an indivi-dual. The potential contribution of impaired oxygen delivery to the braincausing neuronal dysfunction associated with AD has thus been consideredan important factor in AD. It has in fact been proposed that AD may originateas a vascular disorder with the resultant impairment of oxygen delivery andoxidative changes initiating the cascade of neuronal changes found in AD [6].
The delivery of oxygen to the brain requires that Red Blood Cells (RBCs)carrying oxygen need to deform in order to pass through the narrow pores ofthe �600km of capillaries that supply oxygen to the human brain. Vascularchanges associated with amyloidosis are expected to directly impair blood flow.Furthermore, in the capillaries the RBCs come in intimate contact with thevasculature where it encounters Ab involved in amyloidosis. Thus, the possiblecontribution of RBC interactions with Ab to impaired oxygen delivery needs tobe considered.
Ab fibrils are formed by both Ab1-40 and Ab1-42 peptides. While Ab1-42 is themajor constituent of senile plaques, Ab1-40 is the main component of vascularamyloidosis [4, 5]. Our earlier studies [7, 8] have shown that both Ab1-40 andAb1-42 fibrils bind to RBCs increasing RBC volume and decreasing RBCdeformability. Thus, we hypothesized that perhaps RBCs in Alzheimer’s sub-jects experience increased binding to the available beta amyloid peptides orfibrils in blood resulting in a decrease in the RBC deformability thus hinderingthe passage of RBCs through the microvasculature. In this study, morphologi-cal characteristics of RBC samples from Alzheimer’s subjects and their age-matched controls have been investigated. The potential influence of Ab bindingto RBCs leading to their morphological changes in Alzheimer’s subjects hasalso been investigated following incubation of Ab1-40 and Ab1-42 fibrils withblood from normal healthy subjects.
4.2 Materials and Methods
Human blood samples from six Alzheimer’s subjects and ten age-matchedcontrols were collected in heparinized (green cap) tubes at Roena KulynychCenter, Wake Forest University School of Medicine, Winston-Salem, NC,following an approved protocol and sent overnight on icepack to MolecularDynamics Section (MDS), National Institute on Aging at Baltimore, MD forprocessing. Subjects (N=16) in this approved ancillary study were members oftheGinkgo Evaluation ofMemory Study (GEMS,N=3,072) recruited betweenSeptember 2000 andMay 2004 [9] and at study entry they were free of dementiabased on full neuropsychological assessment. Subjects with significant neuro-logical or neurodegenerative diseases that by themselves would affect cognitive
30 J.G. Mohanty et al.

function or carried a higher risk of dementia (e.g., Parkinson’s disease) wereexcluded.
Similarly, anyone on cognitive enhancers or treatments for AD (cholinesteraseinhibitors) was excluded at baseline. Data on cognitive function were collectedevery 6 months. According to the GEMS protocol, if the subject failed the fullNPB on scores below cutoff in memory and one other cognitive domain, or failedfive subtests across the battery (including one test in the memory domain) theywere referred for neurological evaluation andMRscanand dementia adjudication(Alzheimer’s dementia, vascular dementia, other dementia, no dementia) to anexpert panel composed of neurologist and neuropsychologist from the Universityof Pittsburgh Alzheimer’s Disease Research Center. This ancillary study was alsoapproved by the Human Subjects Review Board of Wake Forest University.Participants referred for adjudication of possible dementia and their proxy pro-vided informed consent for one additional blood draw and a control from withinthe GEMS study remaining free of dementia was also asked to be a part of thisancillary study, and after informed consent, blood was drawn for analysis.
Unless otherwise indicated all chemicals including Citrate-Phosphate-Dextrosesolution with Adenine (CPDA) were obtained from Sigma Aldrich, St. Lois, MO.
4.2.1 Processing of Blood Samples and Microscopy of RBCs
Blood samples upon arrival at MDS were immediately centrifuged at�1125�gfor 10min at 4 �C. The buffy coat and plasma were carefully collected from thetop of the tube and discarded. The RBC pellet was washed 3 times by resuspend-ing the cells in CPDA buffer and centrifuging them as above. Cells were resus-pended in CPDA buffer to 5% hematocrit and cell morphology was recorded inan Olympus IX-70 with 40X objective using Deltavision software. Microscopicimages were saved as TIFF files, opened by Adobe Photoshop and elongatedcells were counted manually in each frame. Then all the calculation and statis-tical analysis was performed using MS Excel as well as Origin software.
4.2.2 Preparation of Amyloid Fibrils
Amyloid fibrils from Ab1-40, Ab1-42 peptides (BioSource International, Inc.,Camarillo, CA), were prepared as described earlier [7,8] by reconstituting thelyophilized powders obtained from the commercial source in phosphate bufferedsaline at 1mg/ml and incubating them for 72 hours in a water bath at 37 �C. SinceAb having a reversed amino acid sequence (Ab42-1) do not form fibrils, a sampleof Ab42-1 peptides were also prepared in a similar manner as a negative control(mock fibrils) for the amyloid fibrils. Following incubation, amyloid sampleswere stored at –80 �C until use.
4 Red Blood Cell-b-Amyloid Interactions Alter Oxygen Delivery in AD 31

4.2.3 Reaction of Amyloid Fibrils with RBCs and TheirMorphological Analysis
Blood samples collected in heparinized tubes from normal healthy human
subjects were used for binding to amyloid fibril samples prepared as above.
Blood (0.9ml) was incubated with either Ab1-40/Ab1-42 fibrils, mock fibrils from
Ab42-1 preparation or phosphate buffered saline (0.1ml) for 30min at 37 �Cwith
slow stirring. Following incubation, samples were pelleted at �1125�g for
10min at 4 �C, supernatant plasma and buffy coat were carefully removed
and discarded. Cells were washed three times with CPDA buffer and their
morphological analysis was performed as described above.
4.3 Results
A microscopic morphological analysis of a sample of RBCs from an Alz-
heimer’s subject and a healthy individual is shown in Fig. 4.1. It can be
clearly observed that RBCs from the healthy individual contain more of
smooth biconcave cells, while there is an increased number of RBCs with
altered morphology or elongated RBCs in the sample from the Alzheimer’s
subject.Analysis of elongated RBCs in all the blood samples is shown in Fig. 4.2. As
can be seen, the number of elongated RBCs in blood samples from Alzheimer’s
subjects is 15.2% while those in control subjects are only 5.9%. The difference
in these two percentages is statistically significant (P< 0.0001).To test the possibility that the above observation of a higher percentage of
elongated RBCs seen in blood samples from Alzheimer’s subjects could be due
to interactions of Ab peptide aggregates present in their blood, an in vitro
Alzheimer’s
Control
Fig. 4.1 RBCs from an Alzheimer subject (right panel) show altered morphology with manymore elongated shapes than those from a control (left panel) subject.
32 J.G. Mohanty et al.

experiment was performed. Samples of blood from healthy individuals wereincubated with Ab1-40, or Ab1-42 fibrils and then the morphological analysis wasperformed. For comparison, blood samples from healthy individuals were alsoincubated with either CPDA buffer as a control or mock fibrils prepared fromAb42-1 peptides. The results are shown in Fig. 4.3. Interestingly, the percentageof elongated RBCs in samples treated with either Ab1-40 or Ab1-42 fibrils (8.6%and 11.1 %, respectively) is much higher than the samples treated with bufferonly (2.9%) or with mock fibrils (1.3%). This suggests that the morphologicalchanges observed in RBCs from Alzheimer’s subjects can be attributed to thebinding of Ab1-40 or Ab1-42 fibrils to the RBCs.
4.4 Discussion
Our earlier studies [7, 8] have shown that both Ab1-40 and Ab1-42 fibrils bind toRBCs. b-Amyloids have been reported to be associated with cerebral bloodvessels, particularly the capillaries (microvasculature), and have been reported
Control Alzheimer's0
2
4
6
8
10
12
1416
18
20
N = 6
N = 10
P <0.0001
Elon
gate
d R
BC
s (%
of T
otal
)Fig. 4.2 The percent ofelongated RBCs in samplesfrom Alzheimer’s subjects(15.2%) is higher than thosein samples from controlsubjects (5.9%). Thedifference is statisticallysignificant (P< 0.0001).
0
2
4
6
8
10
12
14
Elo
ng
ated
RB
Cs
(% o
f T
ota
l)
Buffer Aβ1-40 Aβ1-42 Aβ42-1
Fig. 4.3 Percentage ofelongated RBCs observed inblood samples treated witheither Ab1-40 or Ab1-42 fibrilsare higher than those treatedwith control buffer or mockfibrils prepared from Ab42-1peptides.
4 Red Blood Cell-b-Amyloid Interactions Alter Oxygen Delivery in AD 33

to be transferred from the brain into blood across the Blood Brain Barrier. In
addition, b-Amyloids are also produced in platelets and thus are in circulationin the peripheral blood. Therefore, b-Amyloids are readily available to RBCs in
the circulation, particularly in AD subjects.The RBC morphological changes observed in blood samples for Alzhei-
mer’s subjects in Figs. 4.1 and 4.2 suggest that the exposure of RBCs to Ab in
vivo may be the cause of these changes. While other changes in AD subjects
can affect the RBCs, the demonstration that similar changes are producedwhen Ab fibrils interact in vitro with RBCs from normal subjects support the
hypothesis that these morphological changes originate from Ab interactions
with RBCs.The passage of RBCs through capillaries with a pore size smaller than the
mean diameter of the RBC requires RBC deformability. RBC deformability
depends on both the properties of the red cell membrane and the excesssurface area of the RBC. The elongated RBCs found in Alzheimer subjects
indicate a decrease in the excess surface area as well as possible membrane
changes suggesting decreased RBC deformability. In support of this sugges-tion, our earlier studies investigating the effects of amyloids on RBCs have
also found an increase in mean cell volume and a decrease in deformability
(Table 4.1) [10].An additional factor that can contribute to impaired blood flow and oxygen
delivery in AD subjects involves increased adherence of RBCs to the brain
microvasculature. We have recently reported that Ab1-40 bound to either the
RBC or endothelial cells increase the adherence of the RBCs to the endothelialcells. This implies that RBCs bound to amyloid will adhere to the endothelium
slowing down blood flow. This effect would be particularly pronounced in the
brain microvasculature with vascular amyloidosis.
Acknowledgment This research was supported (in part) by the Intramural Research Programof the NIH, National Institute on Aging, grant # NIH-HC-99-260 from National Center forComplimentary and Alternative Medicine (NCCAM), and the Tab Williams Fund forDementia Research and the Roena Kulynych Center for Memory and Cognition Research,Wake Forest University School of Medicine, Winston-Salem, NC.
Table 4.1 Measurement of RBC deformability
b–Amyloid (mM)Mean CellVol. (fl)
Mean Cell TransitTime (msec)*
Cells/secpassing thrupores*
% of Slow cells(<6.4 msec)*
0 81.56 3.73 11.67 2.64
5 84.19 3.58 8.62 1.64
15 85.14 4.08 5.79 4.29
20 85.98 4.13 4.86 5.53
* Transit of RBCs through 5m pores using a Cell Transit Analyzer. (Data from: J.M. Rifkindet al., Adv. Cell Aging Gerontol., 2002, Vol. 11, 283–307)
34 J.G. Mohanty et al.

References
1. J. Carter and C. F. Lippa, Beta-amyloid, neuronal death and Alzheimer’s disease, Curr.Mol. Med., 1(6), 733–737 (2001).
2. J. Hardy and D. J. Selkoe, The amyloid hypothesis of Alzheimer’s disease: progress andproblems on the road to therapeutics, Science, 297(5580), 353–356 (2002).
3. J. C. de la Torre, Vascular basis of Alzheimer’s pathogenesis, Ann. N. Y. Acad. Sci., 977,196–215 (2002).
4. K. Ozawa, T. Tomiyama, M. L. Maat-Schieman, R. A. Roos and H. Mori, EnhancedAbeta40 deposition was associated with increased Abeta42-43 in cerebral vasculaturewith Dutch-type hereditary cerebral hemorrhage with amyloidosis (HCHWA-D), Ann.N. Y. Acad. Sci., 977, 149–154 (2002).
5. J. B. Mackic, M. H. Weiss, W. Miao, E. Kirkman, J. Ghiso, M. Calero, J. Bading,B. Frangione and B. V. Zlokovic, Cerebrovascular accumulation and increased blood-brain barrier permeability to circulating Alzheimer’s amyloid beta peptide in aged squir-rel monkey with cerebral amyloid angiopathy, J. Neurochem., 70(1), 210–215 (1998).
6. S. Varadarajan, S. Yatin, M. Aksenova and D. A. Butterfield, Review: Alzheimer’samyloid beta-peptide-associated free radical oxidative stress and neurotoxicity, J. Struct.Biol., 130(2–3), 184–208 (2000).
7. R. Jayakumar, J. W. Kusiak, F. J. Chrest, A. A. Demehin, J. Murali, R. P. Wersto,E. Nagababu, L. Ravi and J.M. Rifkind, Red cell perturbations by amyloid beta-protein,Biochim. Biophys. Acta, 1622(1), 20–28 (2003).
8. L. B. Ravi, J. G. Mohanty, F. J. Chrest, R. Jayakumar, E. Nagababu, P. V. Usatyuk,V. Natarajan and J. M. Rifkind, Influence of beta-amyloid fibrils on the interactionsbetween red blood cells and endothelial cells, Neurol. Res., 26(5), 579–585 (2004).
9. S. T. Dekosky, A. Fitzpatrick, D. G. Ives, J. Saxton, J. Williamson, O. L. Lopez,G. Burke, L. Fried, L. H. Kuller, J. Robbins, R. Tracy, N. Woolard, L. Dunn,R. Kronmal, R. Nahin and C. Furberg, The Ginkgo Evaluation of Memory (GEM)study: design and baseline data of a randomized trial of Ginkgo biloba extract in preven-tion of dementia, Contemp. Clin. Trials, 27(3), 238–253 (2006).
10. J.M. Rifkind, O. O. Abugo, E.Nagababu, S. Ramasamy, A. Demehin andR. Jayakumar,In: Advances in Cell Aging and Gerontology, edited by T. Hagen, (Elsevier, New York,2002), pp. 283–307.
4 Red Blood Cell-b-Amyloid Interactions Alter Oxygen Delivery in AD 35

Chapter 5
Uncoupling Protein-2 in Diabetic Kidneys
Increased Protein Expression Correlates to Increased
Non-transport Related Oxygen Consumption
Malou Friederich1, Johan Olerud1, Angelica Fasching1, Per Liss2,
Peter Hansell1, and Fredrik Palm1
Abstract Diabetic patients have an elevated risk to develop renal dysfunctionand it has been postulated that altered energy metabolism is involved. Wehave previously shown that diabetic rats have markedly decreased oxygenavailability in the kidney, resulting from increased oxygen consumption.A substantial part of the increased oxygen consumption is unrelated to tubulartransport, suggesting decreased mitochondrial efficiency. In this study, weinvestigated the protein expression of mitochondrial uncoupling protein(UCP)-2 in kidney tissue from control and streptozotocin (STZ)-induced dia-betic rats.
Protein levels of UCP-2 were measured in adult male control and STZ-diabetic Wistar Furth as well as Sprague Dawley rats in both the kidney cortexand medulla by Western blot technique.
Two weeks of hyperglycemia resulted in increased protein levels of UCP-2 inkidneys from both Wistar Furth and Sprague Dawley rats. Both cortical andmedullary UCP-2 levels were elevated 2–3 fold above control levels.
We conclude that sustained STZ-induced hyperglycemia increases the kid-ney levels of mitochondrial UCP-2, which could explain the previously reportedincrease in non-transport related oxygen consumption in diabetic kidneys. Theelevated UCP-2 levels may represent an effort to reduce the increased produc-tion of superoxide radicals which is evident during diabetes.
5.1 Introduction
Mitochondrial oxidative phosphorylation is the cellular source of energy(adenosine triphosphate; ATP) and thus a prerequisite for normal cell function.In summary, protons (Hþ) are pumped through the mitochondrial inner
1Department of Medical Cell Biology, Uppsala University, BMC, PO 571, 751 23 Uppsala,Sweden.2Department of Oncology, Radiology and Clinical Immunology, University Hospital, 751 23Uppsala, Sweden.
K.A. Kang et al. (eds.), Oxygen Transport to Tissue XXIX� Springer 2008
37

membrane by complex I–IV of the electron transport chain. This results in anelectrochemical (potential) gradient across the mitochondrial membrane whichis used by the ATP-synthase (complex V) to create ATP from adenosine dipho-sphate (ADP) and inorganic phosphate (Pi). This gradient is also used to trans-port ions and metabolites [1]. However, not all Hþ are used by the ATP-synthase since the membrane is partially permeable to Hþ. This results in abasal Hþ leak, which regulation is dependent on the electrochemical gradientand the energy situation in that specific cell. If ADP and Pi is present, i.e. energydemand is high, the Hþ permeability is usually low and if ATP is present,i.e. energy demand is low, the Hþ permeability increases [1, 2]. A high Hþ
permeability is energy wasting and has been shown to account for up to 25%of the standard metabolic rate [3].
Mitochondria are a significant source of reactive oxygen species (ROS), whichcan cause oxidative stress [4]. Mitochondria primarily produce superoxide (O2
–),which is rapidly converted to hydrogen peroxide (H2O2) by intracellular andmitochondrial superoxide dismutase (SOD). Studies have shown that complex Iof the electron transport chain is the major source of ROS, however the mechan-isms are unclear [5] . It is believed that a high and stable mitochondrial potentialgradient is the cause of the increased O2
– production. The different complexes ofthe electron transport chain are regulated by their own redox-status and there-fore differently regulated by changes in the membrane potential and pH. BothO2
– and H2O2 are highly reactive and quickly interacts with DNA, proteins andlipids, resulting in oxidative damage. Oxidative damage is believed to play amajor role in many pathological conditions such as arteriosclerosis, ischemia-reperfusion damage and diabetic nephropathy [6, 7]
A suggested cytoprotective mechanism against increased mitochondrialradical production is increased levels of uncoupling proteins (UCP). The pro-tonophoric properties of UCP can increase the Hþ leak back across the mito-chondrial inner membrane. This is called inducible Hþ leak and should beconsidered as an additional mechanism for the cells to regulate the Hþ perme-ability across the mitochondrial membrane [1]. Studies have shown that UCPdecreases ROS production by lowering the mitochondrial Hþ gradient, sup-porting the theory that UCP has antioxidant properties [8]. A negative feed-back-loop is believed to exist between ROS and UCP-2, and a signaling role for4-hydroxy-2-nonenal (a by-product in lipid peroxidation) in the regulation ofUCP has recently been reported [9].
Uncoupling proteins are a subfamily of proteins in the family of mitochon-drial anion carriers [7]. Five different UCPs have been identified so far. UCP-1is expressed exclusively in brown adipose tissue and it appears that its onlyfunction is to generate heat. The very low level of ATP-synthase in these cells isbelieved to activate UCP-1 resulting in excessive heat generation [10]. UCP-2 isexpressed ubiquitously throughout the body. UCP-3 is expressed mostly inmuscles. Neither UCP-2 nor 3 have been shown to have any significant thermo-genic effect. This is believed to be a result of the presence of ATP-synthase inthese cells. UCP-4 and UCP-5 is expressed exclusively in the brain [10, 11].
38 M. Friederich et al.

We have previously shown that sustained hyperglycemia results in increasedoxygen consumption by both isolated cortical andmedullary tubular cells [6, 12].The main part of the diabetes-induced increase in oxygen consumption wasunrelated to tubular electrolyte transport; the latter measured as ouabain-sensi-tive oxygen consumption. In the present study, we therefore investigated ifstreptozotocin (STZ)-induced diabetic rats have elevated protein expression ofmitochondrial UCP-2 in the kidneys since this might provide a feasible explana-tion for the previously reported increase in non-transport related oxygen con-sumption. Furthermore, in order to rule out possible strain differences, weinvestigated the UCP-2 levels in kidneys from both Wistar Furth and SpragueDawley rats.
5.2 Materials and Methods
Adult male Wistar-Furth and Sprague-Dawley rats (250–300 g; B&KUniversal,Sollentuna, Sweden) were randomly divided into normoglycemic controls(n=5 per strain) and hyperglycemics (n=5 per strain). The local animal ethicscommittee at the University of Uppsala approved all experiments.
5.2.1 Diabetes Induction and Surgical Procedures
Diabetesmellituswas induced by an injection of streptozotocin (STZ; 45mg/kgBWdissolved in saline forWF and 55 mg/kg for SD; Sigma-Aldrich, St. Louis, MO) inthe tail vein. Animals were considered diabetic if blood glucose concentrationsincreased to� 15 mmol/l within 24 hours after STZ-injection and remained ele-vated. Blood glucose concentrations were determined with test reagent strips (Med-iSense, Bedford, MA) from blood samples obtained from the cut tip of the tail.
All rats were anaesthetized by an intraperitoneal injection of thiobutabarbi-tal sodium, (Inactin, 120 mg/kg BW for non-diabetic rats and 80 mg/kg BW fordiabetic rats; Sigma-Aldrich) and placed on a servo-regulated heating pad.Tracheotomy was performed to ensure sufficient breathing. A polyethylenecatheter was placed in a carotid artery and perfused with 30 ml of phosphatebuffer saline (PBS, Medicago AB, Uppsala, Sweden), and the right renal veinwas cut open in order to facilitate complete perfusion of the kidneys. Rats weresacrificed by administration of saturated KCl.
5.2.2 Protein Extraction and Western Blot
All procedures were performed on ice. Both kidneys were dissected out andprepared for protein extraction. Renal cortex and medulla were separatedunder microscope and placed in separate homogenizers and 700 ml of RIPA
5 Uncoupling Protein-2 in Diabetic Kidneys 39

buffer (1.0% NP40, 0.5% sodium deoxycholate, 0.1% SDS, 10 mM NaF,
80mM Tris pH 7.5) with protein inhibitors (Protease Arrest (10 ml/ml;
GBiosciences, St. Louis, MO, USA), Phosphatase inhibitor cocktail-2
(10 ml/ml; Sigma-Aldrich) and Complete Mini (1 tablet/1.5 ml; Roche Diag-
nostics, Mannheim, Germany)) was added and the tissue homogenized.
After centrifugation (15 min, 5000 G at þ4 8C), the supernatant was stored
at –70 8C.Protein samples were mixed 1:1 with Laemmli þ 2-merkaptoethanol
buffer (BioRad Laboratories). Samples were boiled and 200 mg protein
was loaded onto precast 10% Tris-HCL gels set in a Criterion Cell with
Tris/glycine/SDS buffer (BioRad Laboratories). The proteins were transfer
to a nitrocellulose membrane, which was blocked with 5% non-fat dry milk
in Tris-HCL Tris-base, NaCl, pH 7.4 for 1 h. The membrane was incu-
bated with goat anti-rat UCP-2 antibody (1:1000; Santa-Cruz Biotechnol-
ogy, Santa Cruz, USA) overnight at 48C. Horseradish peroxidase (HRP)-
conjugated secondary antibody (1:5000; sheep anti-goat, Santa-Cruz Bio-
technology) was used to detect the specific band. Detection was performed
according to the manufacturers’ instructions (Chemiglow West; Alpha
Innotech, San Leandro, CT, USA) and analyzed using an ECL- camera
(Kodak image station 2000; New Haven, CT, USA) detecting the HRP-
emitted light. Kodak 1DIM 3.6.3 software was used for analyzing
Western blots.
5.2.3 Statistical Analysis
All values are expressed as means�SEM. Student’s t-test was used to compare
means of two groups. Statistical analysis was performed usingGraph Pad Prism
software (Graph Pad Inc., San Diego, CA, USA), and P<0.05 was considered
statistically significant.
5.3 Results
5.3.1 Wistar Furth Rats
STZ-injection resulted in a sustained hyperglycemia in all injected Wistar
Furth rats (24.5�2.5 vs. 6.1�0.4 mM for control animals; n=5 each). Dia-
betic Wistar Furth rats had 3.7-fold higher UCP-2 levels in the renal cortex
and 3.0-fold higher in the medulla compared to normoglycemic control
animals (Fig. 5.1).
40 M. Friederich et al.

5.3.2 Sprague Dawley Rats
STZ-injection resulted in a sustained hyperglycemia in all injected Sprague
Dawley rats (27.6�0.1 vs. 6.9�0.4 mM for control animals; n=5 each).
Diabetic Sprague Dawley rats had 2.5-fold higher UCP-2 levels in the renal
cortex and 2.1-fold higher in the medulla compared to normoglycemic control
animals (Fig. 5.2).
Fig. 5.1 Protein expression of mitochondrial uncoupling protein-2 (UCP-2) in renal cortexand medulla of normoglycemic and hyperglycemic Wistar Furth rats (n=5 per group).
Fig. 5.2 Protein expression of mitochondrial uncoupling protein-2 (UCP-2) in renal cortexand medulla of normoglycemic and hyperglycemic Sprague Dawley rats (n=5 per group).
5 Uncoupling Protein-2 in Diabetic Kidneys 41

5.4 Discussion
The main finding of the present study is that UCP-2 levels in both renal cortex
and medulla are increased in STZ-induced diabetic rats compared to normo-
glycemic controls. This supports our theory that UCP-2 is a protective mechan-ism counteracting diabetes-induced ROS production. However, an unwanted
side effect of the increased UCP-2 levels should in theory be increased oxygenconsumption. Oxygen consumption related to mitochondrial uncoupling is
unrelated to tubular transport processes, i.e. ouabain insensitive. Indeed, oxy-
gen consumption by freshly isolated ouabain-treated tubular cells from diabeticrats is markedly increased compared to control cells with corresponding treat-
ment [6, 12]. Renal oxygen tension is decreased in STZ-induced diabetes and themechanism has been identified as increased renal mitochondrial oxygen con-
sumption resulting from increased oxidative stress [6]. We now further clarify
the mechanism accounting for the diabetes-induced increase in renal oxygenconsumption to involve increased UCP-2 protein abundance, which has been
shown to increase mitochondrial uncoupling.Previous studies have shown that the degree of hyperglycemia is a
good predictor of the progression of diabetes complications [13], including
the development of renal dysfunction [14]. It is also well known that sustainedhyperglycemia increases theROS production.ROS decreasesNObioavailability,
resulting in both increased vascular tone and increased oxygen consumption [14].
Taken together, the decreased renal oxygen tension and increased ROS produc-tion could be an important pathway leading to the development of diabetic
nephropathy [14].It is believed that an altered UCP regulation can contribute to several
pathological conditions such as arteriosclerosis, insulin resistance and diabetic
nephropathy [7]. Pioneering work by Mattiasson and co-workers showed thatUCP-2 protects against long-term damage resulting from stroke and brain
trauma [15]. In vitro, UCP-2 over-expressing cells showed significantly lower
mortality when subjected to 90 minutes of oxygen-glucose deprivation com-pared to controls [15]. The suggested mechanism for the UCP-2 protective
properties in this study was that UCP-2 prevents activation of apoptotic pro-teins by lowering the electrochemical gradient and thereby reducing ROS
production.
5.5 Summary
Sustained STZ-induced hyperglycemia increases the kidney levels of mitochon-
drial UCP-2 in both Wistar Furth and Sprague-Dawley rats, which might bethe reason for the previously reported increase in non-transport related renal
oxygen consumption. The elevated UCP-2 levels may represent an effort to
42 M. Friederich et al.

reduce the increased production of reactive oxygen species (ROS) which isevident during diabetes.
Acknowledgment This work was funded by The Swedish Research Council, The Marcus andAmalia Wallenberg Foundation, The Linne Foundation for Medical Research, The SwedishDiabetes Association, and The Swedish Society for Medical Research.
References
1. P. S. Brookes, Mitochondrial H(þ) leak and ROS generation: an odd couple, Free RadicBiol Med 38(1), 12–23 (2005).
2. D. G. Nicholls, The non-Ohmic proton leak–25 years on, Biosci Rep 17(3), 251–57 (1997).3. D. F. Rolfe, and G. C. Brown, Cellular energy utilization and molecular origin of
standard metabolic rate in mammals, Physiol Rev 77(3), 731–58 (1997).4. J. F. Turrens, Superoxide production by the mitochondrial respiratory chain, Biosci
Rep 17(1), 3–8 (1997).5. J. St-Pierre, J. A. Buckingham, S. J. Roebuck, andM. D. Brand, Topology of superoxide
production from different sites in themitochondrial electron transport chain, J Biol Chem277(47), 44784–90 (2002).
6. F. Palm, J. Cederberg, P. Hansell, P. Liss, and P. O. Carlsson, Reactive oxygen speciescause diabetes-induced decrease in renal oxygen tension, Diabetologia 46(8), 1153–1160(2003).
7. P. Jezek, Possible physiological roles of mitochondrial uncoupling proteins–UCPn, IntJ Biochem Cell Biol 34(10), 1190–206 (2002).
8. S. Papa, and V. P. Skulachev, Reactive oxygen species, mitochondria, apoptosis andaging, Mol Cell Biochem 174(1–2), 305–19 (1997).
9. K. S. Echtay, T. C. Esteves, J. L. Pakay,M. B. Jekabsons, A. J. Lambert,M. Portero-Otin,R. Pamplona, A. J. Vidal-Puig, S. Wang, S. J. Roebuck, and M. D. Brand, A signallingrole for 4-hydroxy-2-nonenal in regulation of mitochondrial uncoupling, Embo J 22(16),4103–10 (2003).
10. S. Krauss, C. Y. Zhang, and B. B. Lowell, The mitochondrial uncoupling-protein homo-logues, Nat Rev Mol Cell Biol 6(3), 248–261 (2005).
11. P. Jezek, and E. Urbankova, Specific sequence of motifs of mitochondrial uncouplingproteins, IUBMB Life 49(1), 63–70 (2000).
12. F. Palm, P. Hansell, G. Ronquist, A. Waldenstrom, P. Liss, and P. O. Carlsson, Polyol-pathway-dependent disturbances in renal medullary metabolism in experimental insulin-deficient diabetes mellitus in rats, Diabetologia 47(7), 1223–1231 (2004).
13. The effect of intensive treatment of diabetes on the development and progression of long-term complications in insulin-dependent diabetes mellitus. The Diabetes Control andComplications Trial Research Group, N Engl J Med 329(14), 977–86 (1993).
14. F. Palm, Intrarenal oxygen in diabetes and a possible link to diabetic nephropathy, ClinExp Pharmacol Physiol 33(997–1001) (2006).
15. G. Mattiasson, M. Shamloo, G. Gido, K. Mathi, G. Tomasevic, S. Yi, C. H. Warden,R. F. Castilho, T. Melcher, M. Gonzalez-Zulueta, K. Nikolich, and T. Wieloch, Uncou-pling protein-2 prevents neuronal death and diminishes brain dysfunction after strokeand brain trauma, Nat Med 9(8), 1062–68 (2003).
5 Uncoupling Protein-2 in Diabetic Kidneys 43

Chapter 6
Measurement of Oxygenation at the Site
of Stem Cell Therapy in a Murine Model
of Myocardial Infarction
Mahmood Khan1, Vijay Kumar Kutala
1, Sheik Wisel
2, Simi M. Chacko
1,
M. Lakshmi Kuppusamy1, Pawel Kwiatkowski2, and Periannan Kuppusamy1
Abstract We have developed a noninvasive EPR (electron paramagnetic reso-nance) oximetry, based on a new class of oxygen-sensing nano-particulateprobe (LiNc-BuO), for simultaneous monitoring of stem-cell therapy and insitu oxygenation (partial pressure of oxygen, pO2) in a mouse model of acutemyocardial infarction (AMI). AMI was induced by a permanent occlusionof left-anterior-descending (LAD) coronary artery. Skeletal myoblast (SM)cells were used for therapy. The oximetry probe was implanted in the mid-ventricular region using a needle. Tissue histological studies after 3 weeks ofimplantation of the probe revealed significant fibrosis, which was solely due tothe needle track and not due to the probe particles. The feasibility of long-termmonitoring of pO2 was established in control (non-infarct) group of hearts(> 3 months; pO2=15.0�1.2 mmHg,). A mixture of the probe with/withoutSM cells (1�105) was implanted as a single injection in the infarcted region andthe myocardial tissue pO2 at the site of cell therapy was measured for 4 weeks.The pO2 was significantly higher in infarcted hearts treated with SM cells(pO2=3.5�0.9 mmHg) compared to untreated hearts (pO2=1.6�0.7 mmHg).We have demonstrated, for the first time, the feasibility of monitoring pO2 inmouse hearts after stem cell therapy.
6.1 Introduction
Ischemic heart disease is a leading cause of cardiac failure and a clinicallydisabling condition worldwide. A number of studies have confirmed thebeneficial effects of stem cell transplantation on cardiac function after acute
1Center for Biomedical EPR Spectroscopy and Imaging, Davis Heart and Lung ResearchInstitute, Division of Cardiovascular Medicine, Department of Internal Medicine;2Division of Cardiothoracic Surgery, Department of Surgery, The Ohio State University, 420W. 12th Ave, Columbus, OH 43210.Corresponding author: Periannan Kuppusamy, e-mail: [email protected];Tel: 1-614-292-8998; Fax: 614-292-8454
K.A. Kang et al. (eds.), Oxygen Transport to Tissue XXIX� Springer 2008
45

myocardial infarction [1–3]. Skeletal muscle satellite cells are myogenic precur-sor cells located between the basal lamina and sarcolemma of adult skeletalmuscle. Upon activation, as in the case of an injury, these cells have a tendencyto divide mitotically into myoblasts [4]. Transplantation of skeletal myoblast(SM) cells in animal models of acute myocardial infarction has been reported toresult in improved cardiac performance and graft survival [5–10].
It is, however, uncertain whether or not the oxygen concentration in theinfarcted myocardium could play a role in the process of engraftment andsurvival. Hence, the monitoring of in situ tissue oxygenation after SMtransplantation is vital for the understanding of the effects of stem cell therapy.We have recently developed a probe, made of lithium octa-n-butoxy-naphthalocyanine (LiNc-BuO) radicals, in the form of submicron-sized(270�120 nm) crystals (hereafter referred to as OxySpin), which can be directlydetected by electron paramagnetic resonance (EPR) spectroscopy with highsensitivity and specificity [11, 12]. This prompted us to further develop thisunique technology for the evaluation of stem cell therapy, whereby long-termmonitoring of local tissue pO2 at the transplanted site could be performed.Accordingly, the goal of this study was to monitor myocardial tissue oxygena-tion in infarcted murine hearts immediately following transplantation of SMcells, and to subsequently monitor in situ pO2 for several weeks after SM celltransplantation using EPR spectroscopy.
6.2 Materials and Methods
6.2.1 Reagents
The cell-culture medium contained myoblast basal growth medium (SkBM,Clonetics, San Diego, CA) with 20% fetal bovine serum (HyClone, CO),recombinant human epidermal growth factor, dexamethasone, and antibiotics.Trypsin/EDTA and collagenase were obtained from Invitrogen (CA) andWorthington Biochemicals (NJ), respectively. The OxySpin probes weresynthesized as reported [12].
6.2.2 Isolation and Characterization of Murine Skeletal Myoblasts
Approximately, 6 g of hind limb skeletal muscle frommice was obtained and theconnective tissue and tendons were removed. The biopsies were minced into aslurry and subjected to several cycles of enzymatic digestion at 37 8C withtrypsin/EDTA (0.5 mg/ml) and collagenase (0.5 mg/ml) to release themyoblasts. The skeletal myoblasts were cultured in myoblast basal growthmedium containing 20% fetal bovine serum, recombinant human epidermalgrowth factor (10 ng/ml), dexamethasone (3 mg/ml) and antibiotics. The cells
46 M. Khan et al.

were limited to 60–70% confluency to prevent myotube formation. Periodically,the purity of cells was checked using a specific monoclonal CD56 antibody byflow cytometry.
6.2.3 Transplantation of Skeletal Myoblasts with OxySpin
Myoblasts, at 70% confluency (1�104 cells/35-mm dish), in 3 ml of mediumcontaining 10% FBS were trypsinized and the suspension of cells was centri-fuged at 2500g. The pellet was collected and resuspended in 1 ml of sterile PBScontaining glucose (0.1%). OxySpin (100 mg/ml) was added to the cell suspen-sion (2�105 cells/ml) and mixed well with a pipette prior to transplantation intothe myocardium.
6.2.4 Preparation of Mice
C57BL/6 male mice, weighing 25–30 g, were anesthetized with a mixture ofketamine (55 mg/kg) and xylazine (15 mg/kg) that was injected intraperitone-ally. The intubation tube consisted of a 20-gauge intravenous catheter attachedto a connector. The ventilator was set at 120 breaths/min with a tidal volume of250 mL (Harvard Apparatus, Hollister, MA). The body temperature wasmaintained at 37�18C using an isothermal heating pad (Braintree Scientific,Braintree, MA). All of the procedures were performed with approval of theInstitutional Animal Care andUse Committee of the Ohio State University andconformed to the Guide for the Care and Use of Laboratory Animals (NIHPublication No. 86–23).
6.2.5 Induction of Myocardial Infarction
Acute myocardial infarction (AMI) was created by permanently occluding theleft anterior descending (LAD) coronary artery. An oblique 8-mm incisionwas made 2-mm away from the left sternal border toward the left arm pit. Thechest cavity was opened with scissors by a small incision (5 mm long) at thelevel of the third or fourth intercostal space 2 to 3 mm from the left sternalborder. The LAD coronary artery was visualized as a pulsating bright redspike, running through the midst of the heart wall from underneath the leftatrium toward the apex. The LAD artery was ligated 1 to 2 mm below the tipof the left auricle with a tapered needle using 8-0 polypropylene ligature. Theneedle was passed underneath the LAD coronary artery and a double knot
6 Measurement of In Situ Myocardial Tissue Oxygenation 47

was made to occlude the LAD. Occlusion was confirmed by a sudden change
in color (pale) of the anterior wall of the left ventricle (LV). The chest cavitywas closed by bringing together the third and fourth ribs with one6-0 polypropylene silk suture. The layers of muscle and skin were closedwith 5-0 polypropylene suture.
6.2.6 Implantation of Skeletal Myoblasts in the Infarcted Heart
A single intramyocardial injection of sonicated OxySpin (100 mg/ml) with(experimental group) or without (control group) skeletal myoblasts (1�105cells/15 ml) was injected into the mid-ventricular region of the LAD-ligatedmice. The chest was closed after implantation of the cells, and EPR measure-ments were performed immediately, and then every week for several weeks.
6.2.7 pO2 Measurements in the Heart
The sensitivity of the EPR linewidth of OxySpin to oxygen was calibrated asdescribed previously [12]. After a thoracotomy, 15 ml of a suspension of Oxy-Spin in saline was injected into the mid-ventricular region of mouse hearts using
a 29½-gauge needle. The mouse (with/without LAD ligation) was placed in theL-band EPR spectrometer (Magnettech, Germany) with its heart close to theloop of the surface coil resonator. The instrument settings were: microwavepower, 4 mW; modulation amplitude, 180 mG, modulation frequency 100 kHz;receiver time constant, 0.2 msec; and acquisition time, 30 sec. EPR spectra wereacquired as single scans. The peak-to-peak linewidth was used to calculate pO2
using the standard calibration curve.
6.2.8 Histological Analysis of Needle-track Injury
OxySpin (20 mg) was implanted in the mid-myocardium of the mouse heartusing a 25-gauge needle. Identification of needle-track injury in control (needleonly) and OxySpin-implanted hearts was done after 1, 7 and 21 days afterneedle-track injury. The hearts were excised and washed several times withPBS and fixed in 10% formalin. Histological analysis was done on 4-mmsections stained with Hematoxylin and Eosin (H&E) or Masson Trichrome(MT). The latter stain identifies collagen deposition, which is an indication offibrosis.
48 M. Khan et al.

6.3 Results and Discussion
6.3.1 Histology of Mouse Heart with Needle-track Injury
To determine whether the histological changes caused to the heart is due the
OxySpin implantation or by the needle itself, we studied the heart histology in
twodifferent groups: one with needle track only and the other with OxySpin
implantation. The histological studies performed in tissues obtained after three
weeks of implantation revealed significant fibrosis in both the groups (Fig. 6.1).
The results also showed that the injury was solely due to the needle track and
not due to the particles.
6.3.2 Measurement of pO2 in Mouse Heart by EPR Spectroscopy
The OxySpin mixed with SM cells and transplanted in the infarcted heart was
monitored noninvasively, using in vivo EPR spectroscopy. The EPR spectrum
of the OxySpin probes is characterized by a single, narrow peak. The OxySpin
Fig. 6.1 Histology showing needle-track injury in mouse hearts at 3 weeks after implantation(200x). (A) Hematoxylin and Eosin (H & E) staining, (B) Masson Trichrome (MT) stainingshowing collagen deposition and intense fibrosis (blue), (C) H & E staining after OxySpinimplantation, and (D)MT staining after OxySpin implantation showing fibrosis. The arrowsin (C) and (D) show the OxySpin probes in the tissue. (See also color insert.)
6 Measurement of In Situ Myocardial Tissue Oxygenation 49

suspended in PBS showed a linewidth 0.37 G under anoxic conditions (Fig. 6.2a).Figure 6.2b shows the EPR spectrum obtained from the beating heart at 4 weeksfollowing the transplantation of SM cells mixed with OxySpin in the infarctedregion. The results suggest that the probe was retained in the heart for four weeksor possibly longer, enabling precisemeasurement of in situ oxygenation in the heart.
6.3.3 Long-term Monitoring of in vivo Myocardial pO2
After SM Transplantation
Noninvasive measurement of myocardial tissue pO2 was performed using anL-band EPR spectrometer. OxySpin was implanted in the area of risk, prior tothe induction of infarction (by ligation of LAD coronary artery). Figure 6.3a
453 457 461 453 457 461
a b
Magnetic Field (G)
Fig. 6.2 EPR spectrum of OxySpin. (a) The probe suspended in PBS showed a linewidth of0.37 G under anoxic conditions. (b) The spectrum obtained from a beating heart at 4 weeksfollowing the transplantation of SM cells mixed with OxySpin in the infarcted region.
Fig. 6.3 Long-term monitoring of in situ pO2 at the site of transplanted skeletal myoblasts(SM) in infarcted mouse hearts. (a) Myocardial tissue pO2 from mice (N=5) implanted withOxySpin (only) in the mid-ventricular region without LAD coronary artery ligation. Datashow the feasibility of pO2 measurements for more than 3 months after implantation. (b)Myocardial tissue pO2 in mice transplanted with skeletal myoblasts in the mid-ventricular(ischemic) region after LAD artery ligation. Legends: Control, un-infarcted; MI, infarcted;MIþSM, infarcted hearts treated with skeletal myoblasts. Values are expressed as mean� SD(N=5). The tissue pO2 is higher in the infarcted hearts treated with the SM cells (*p<0.05)compared to hearts not treated with SM cells.
50 M. Khan et al.

shows the myocardial tissue pO2 measured noninvasively for 16 weeks(112 days) from non-infarcted (control) hearts. Animals without LAD arteryligation served as controls to obtain baseline pO2 values. The mean pO2 in thenon-ligated hearts was 15.0�1.2 mmHg. This result demonstrates the stabilityof OxySpin in the tissue and feasibility to perform noninvasive measurement ofoxygen concentration in beating hearts over a period of more than 3 months.Figure 6.3b shows the myocardial pO2 measured from infarcted hearts. Thedata revealed a marked decrease in myocardial pO2 (1.6�0.7 mmHg; p<0.001versus control) in the infarct region of untreated hearts at 4 weeks after infarc-tion. The hearts transplanted with SM cells showed a significant increase inmyocardial pO2 (3.5�0.9 mmHg, p<0.05) compared to the MI only controlgroup at 4 weeks post transplantation of skeletal myoblasts.
6.4 Conclusions
The results of this study demonstrated our ability to noninvasively monitorchanges in situ tissue oxygenation during the process of stem cell therapy forseveral weeks, in vivo, using EPR oximetry. The EPR technique is advanta-geous in offering high sensitivity and repeated measurements of myocardialtissue oxygenation in the beating hearts.
Acknowledgment We thank Brian Rivera for critical reading of the manuscript. This workwas supported by NIH grant R01 EB004031 and a State of Ohio Third Frontier grant BRTT/CBE.
References
1. D. Orlic, J. Kajstura, S, Chimenti, D. M. Bodine, A. Leri, and P. Anversa, Transplantedadult bone marrow cells repair myocardial infarcts in mice, Ann. N. Y. Acad. Sci. 938,221–229 (2001).
2. J.Y.Min,M.F. Sullivan,Y.Yang, J. P. Zhang,K.L.Converso, J. P.Morgan, andY.F.Xiao,Significant improvement of heart function by cotransplantation of human mesenchymalstem cells and fetal cardiomyocytes in postinfarcted pigs, Ann. Thorac. Surg. 74(5),1568–1575 (2002).
3. A. A. Kocher, M. D. Schuster, M. J. Szabolcs, S. Takuma, D. Burkhoff, J. Wang,S, Homma, N. M. Edwards, and S. Itescu, Neovascularization of ischemic myocardiumby human bone-marrow-derived angioblasts prevents cardiomyocyte apoptosis, reducesremodeling and improves cardiac function, Nat. Med. 7(4), 430–436 (2001).
4. C. E. Murry, R. W. Wiseman, S. M. Schwartz, and S. D. Hauschka, Skeletal myoblasttransplantation for repair of myocardial necrosis, J. Clin. Inves. 98(11), 2512–2523 (1996).
5. K. A. Hutcheson, B. Z. Atkins, M. T. Hueman, M. B. Hopkins, D. D. Glower, andD. A. Taylor, Comparison of benefits on myocardial performance of cellular cardiomyo-plasty with skeletal myoblasts and fibroblasts, Cell Transplant. 9(3), 359–368 (2000).
6. M. Jain, H. Dersimonian, D. A. Brenner, S. Ngoy, P. Teller, A. S. Edge, A. Zawadzka,K.Wetzel, D. B. Sawyer,W. S. Colucci, C. S. Apstein, andR. Liao, Cell therapy attenuates
6 Measurement of In Situ Myocardial Tissue Oxygenation 51

deleterious ventricular remodeling and improves cardiac performance after myocardialinfarction, Circulation 103(14), 1920–1927 (2001).
7. B. Pouzet, A. A. Hagege, J. T. Vilquin, M. Desnos, D. Duboc, J. P. Marolleau, andP. Menasche, Transplantation of autologous skeletal myoblasts in ischemic cardiacinsufficiency, J. Soc. Biol. 195(1), 47–49 (2001).
8. B. Pouzet, J. T. Vilquin, A. A. Hagege, M. Scorsin, E. Messas, M. Fiszman, K. Schwartz,and P. Menasche, Intramyocardial transplantation of autologous myoblasts: can tissueprocessing be optimized? Circulation 102(19 Suppl 3), III 210–215 (2000).
9. D. A. Taylor, B. Z. Atkins, P. Hungspreugs, T. R. Jones, M. C. Reedy, K. A. Hutcheson,D. D. Glower, and W. E. Kraus, Regenerating functional myocardium: improvedperformance after skeletal myoblast transplantation, Nat. Med. 4(8), 929–933 (1998).
10. M. Scorsin, A.Hagege, J. T. Vilquin,M. Fiszman, F.Marotte, J. L. Samuel, L. Rappaport,K. Schwartz, P. Menasche, Comparison of the effects of fetal cardiomyocyte and skeletalmyoblast transplantation on postinfarction left ventricular function, J. Thorac. Cardiovasc.Surg. 119(6), 1169–1175 (2000).
11. V. K. Kutala, N. L. Parinandi, R. P. Pandian, and P. Kuppusamy, Simultaneousmeasurement of oxygenation in intracellular and extracellular compartments of lungmicrovascular endothelial cells, Antioxid. Redox Signal. 6(3), 597–603 (2004).
12. R. P. Pandian, N. L. Parinandi, G. Ilangovan, J. L. Zweier, and P. Kuppusamy, Novelparticulate spin probe for targeted determination of oxygen in cells and tissues, FreeRadic. Biol. Med. 35(9), 1138–1148 (2003).
52 M. Khan et al.
Chapter 7
Oxygen Pressures in the Interstitial Space
of Skeletal Muscle and Tumors in vivo
David F. Wilson, William M.F. Lee, Sosina Makonnen,
Sophia Apreleva, and Sergei A. Vinogradov1
Abstract A new Oxyphor (Oxyphor G3) has been used to selectively determinethe oxygen pressure in interstitial (pericellular) spaces. Oxyphor G3 is aPd-tetrabenzoporphyrin, encapsulated inside generation 2 poly-arylglycine(AG) dendrimer, and therefore is a true near infrared oxygen sensor, having astrong absorption band at 636nm and emission near 800nm. The periphery ofthe dendrimer is modified with oligoethylene glycol residues (Av. MW 350) tomake the probe water soluble and biologically inert. Oxyphor G3 was injectedalong ‘‘tracks’’ in the tissue using a small needle (30gage or less) and remained inthe pericellular space, allowing oxygen measurements for several hours with asingle injection. The oxygen pressure distributions (histograms) were comparedwith those for OxyphorG2 in the intravascular (blood plasma) space. In normalmuscle, in the lower oxygen pressure region of the histograms (capillary bed)the oxygen pressure difference was small. At higher oxygen pressures in thehistograms there were differences consistent with the presence of high flowvessels with oxygen pressures substantially above those of the surroundinginterstitial space. In tumors, the oxygen pressures in the two spaces were similarbut with large differences among tumors.
In mice, anesthesia with ketamine plus xylazine markedly decreased oxygenpressures in the interstitial and intravascular spaces compared to awake orisoflurane anesthetized mice.
7.1 Introduction
Oxygen transported to tissue, after reaching the tissue microcirculation, dif-fuses from the blood plasma through the walls of the micro-vessels into theinterstitial (pericellular) space and then from interstitial space into the cells and
1David F. Wilson, William M.F. Lee, Sosina Makonnen, Sophia Apreleva, and SergeiA. Vinogradov, Department of Biochemistry and Biophysics (DFW, SA, SAV) andDepartment of Medicine (WMFL, SM), Medical School, University of Pennsylvania,Philadelphia, PA 19104.
K.A. Kang et al. (eds.), Oxygen Transport to Tissue XXIX� Springer 2008
53

finally to the mitochondria. As it diffuses, from the source (blood plasma) to asink (mitochondria), an oxygen pressure gradient is formed in which the pressureis lower at the sink than at the source. The difference in oxygen pressure betweenthe blood plasma and the mitochondria increases with increase in the rate ofoxygen consumption by the mitochondria and the distance from the vessel to themitochondria. The distance over which oxygen can be supplied to the mitochon-dria is, therefore, determined by a) the rate of oxygen consumption by themitochondria, b) the distance from the blood plasma (the oxygen source) tothe mitochondria and c) the oxygen pressure in the blood plasma.
Oxygen dependent quenching of phosphorescence is a minimally non-invasiveoptical method that can quantitate oxygen pressures in biological and othersamples [1–4]. Although it has been widely used [1–17] for measurements invivo, focus has been on the intravascular space. The available oxygen sensitivephosphors, such as Oxyphors R0, R2 and G2 (Oxygen Enterprises, Ltd,Philadelphia, PA), contained Pd-porphyrin cores that are at least partiallyexposed to the medium. As a result, the oxygen sensitivity is dependent on themicroenvironment of the porphyrin and therefore on the macromolecule towhich it is bound, and on the fraction of the Oxyphor bound to thatmacromolecule. In blood plasma, Oxyphors R0, R2 and G2 are essentiallyquantitatively bound to albumin. Albumin plays an important role, helpingboth to limit access of oxygen to the porphyrin core, facilitating oxygenmeasure-ments in the physiological range (0–120 Torr), and to provide a relativelyhomogeneous microenvironment for the phosphor.
A new family of Oxyphors has been synthesized that can be used in a muchwider range of media, particularly in highly heterogeneous environments suchas the interstitial space. The porphyrin core is first coated with dendrons andthen the external surface of the dendrimer modified with oligoethylene glycolfragments [18–20]. Oxyphor G3 is a member of this oxygen sensor family. Notonly are its oxygen quenching properties unaffected by biological macromole-cules such as albumin, but also its oxygen quenching constant and phosphor-escent lifetimes are well suited for measuring oxygen in vivo and in vitro.
7.2 Materials and Methods
7.2.1 Measurement of Oxygen Pressure Histograms
Phosphorescence lifetime measurements were performed using a PMOD-5000phosphorometer (Oxygen Enterprises, Ltd., Philadelphia, PA, USA) [4], afrequency domain instrument with a range of 100–100,000 Hz. Phosphores-cence lifetimes are independent of local phosphor concentration and insensitiveto endogenous tissue fluorophores and chromophores. The PMOD-5000was used in multifrequency mode [4] in order to determine distributions ofphosphorescence lifetimes. The lifetime distributions were used to calculate
54 D.F. Wilson et al.

distributions of oxygen pressures, i.e. oxygen histograms [21, 22]. The excitationlight (635 nm) was modulated by a waveform consisting of 37 sinusoids withequal amplitudes and frequencies ranging from 100 Hz to 38 kHz. The tips ofthe light guides were brought into contact with the skin but care was takennot to apply pressure that might restrict flow in the surface blood vessels. Theobtained signal was used to calculate the dependence of the phosphorescenceamplitude and phase on the modulation frequency. The resulting phase/ampli-tude dependence was analyzed using the Maximal Entropy Method [21, 22] toyield the distribution of phosphorescence lifetimes. This distribution was con-verted into the distribution of oxygen pressure in the sample as describedpreviously [21, 22]. The basis for the conversion is the Stern-Volmerrelationship:
Io=I ¼ To=T ¼ 1þ kQ�To �pO2; (7:1)
where, Io, To and I, T are the phosphorescence intensities and lifetimes in theabsence of oxygen and at oxygen pressure pO2, respectively. The quenchingconstant, kQ, is a second order rate constant, describing the quenching of theexcited state of the phosphor by oxygen. The values of To and kQ have beendetermined for each phosphor for the experimental conditions [4] (temperatureetc. as appropriate).
According to (1), intensities (amplitudes) of phosphorescent signals decreasewith increasing oxygen pressures. Thus, for equal volumes of tissue, containingequal amounts of the phosphorescent probe and excited by equal numbers ofphotons, the accuracy in determination of lifetimes and/or amplitudes will behigher for volumes with lower oxygen pressures. The decrease in accuracy(decrease in signal level) causes asymmetric broadening of oxygen histograms.This broadening increase with increasing oxygen pressure (decreasing signal) andthis is responsible for the ‘‘tail’’ effect on the high oxygen end of the histogram.This broadening is intrinsic to the MEM analysis, reflecting the fact that uncer-tainty in determination of phosphorescence lifetimes increases as the signal-to-noise ratio (S/N) decreases. At lower oxygen pressures there is little broadening,less than 3 Torr for pressures below 20 Torr, but for oxygen pressures aboveabout 80 Torr the histograms are substantially broadened are only qualitative.The presented histograms were arbitrarily truncated at 140 Torr.
7.2.2 Phosphorescent Probes Oxyphor G2 and Oxyphor G3
BothOxyphors G2 [23] andG3 are based on Pd-tetrabenzoporphyrin cores [20].The structure of G3 is published in Wilson et al [24]. and synthesis of similardendritic porphyrins has been reported [25]. Pd tetrabenzoporphyrin (PdTBP)dendrimers G2 and G3 differ by the dendrimer composition(G2 – polyglutamate; G3 – polyarylglycine) and surface coatings (G2 – none;
7 Oxygen Pressures in Interstitial Space of Skeletal Muscle and Tumors in vivo 55

G3 - PEG, Av.MW 350). G2 (MW 2,642) is designed to be used in combinationwith albumin, which provides a uniformmicroenvironment for the phosphor. Incontrast, G3 (MW 16,100) is not affected by albumin and other biomoleculesdue to the surface layer of polyethyleneglycols (PEG’s). The absorption and thephosphorescence spectra of G2 and G3 are nearly identical. Both phosphorshave quantum yields of about 10% and lifetimes of about 270 ms in deoxyge-nated aqueous solutions. Oxygen quenching constants (kQ) of G2 and G3 inaqueous buffered solutions at pH 7.2 at 38�C are 2,800 Torr–1s–1 and 180Torr–1s–1 respectively. UnboundOxyphorG2 cannot be used tomeasure oxygenin physiological range. In the blood, however, it binds tightly to albumin, and theoxygen quenching constant (kQ) of the G2-albumin complex at 38�C is280 Torr–1sec–1. Phosphorescence lifetime and oxygen quenching constant ofOxyphor G3 are insensitive to the presence of albumin (at 1–5% by weight) aswell as changes in pH and ionic strength throughout the physiological range.
7.2.3 Measurements of Oxygen in the Blood Plasmaand Interstitial Space of Muscle
Mouse preparation. The fur on the right and left rear quarters was removed byfirst using electrical clippers and then depilated. Care was taken not to causeany abrasions to the skin. The oxygen measurements were made non-invasivelythrough the undisturbed skin. The fur was removed because in dark coloredmice the fur absorbs both the excitation light and the emitted phosphorescence,greatly attenuating the phosphorescence signal.
Measuring oxygen histograms in the blood plasma (Oxyphor G2).Anesthesiawas induced with 1.5% isoflurane in air and 0.1 ml of a solution of Oxyphor G2(3.2 mg/ml) in physiological saline was injected into the tail vein. As soon asanesthesia was induced, isoflurane was decreased to 1.2% and the oxygenhistograms were measured about 10 min after injection of the Oxyphor. It hasbeen previously noted [17, 24] that induction of anesthesia with isofluranecauses a transient decrease in tissue oxygen pressures that recovers within 10min of continuing anesthesia. After measuring the oxygen histograms (anesthe-tized), the nose cone supplying the isoflurane was removed and the micereplaced in their cage. After about 40 min without inhaled anesthetic, theoxygen histograms were again measured (awake).
Throughout the periods of anesthesia, body temperature was maintained bylaying the mice on a 38� isothermal pad covered with a terry cloth towel to besure they did not overheat.
Measuring oxygen in the interstitial space (Oxyphor G3). The mice wereshaved and depilated as described above. They were anesthetized with isoflurane(nose cone, 1.5% mixed with air) and given injections of Oxyphor G3 solution(80 micromolar in physiological saline) along 3 different 1 cm tracks (20 mLcontaining 1.6 nmoles of Oxyphor per track) in the thigh muscle using a 30 gage
56 D.F. Wilson et al.

needle. The nose cone was removed and themice returned to their cage. They were
allowed to wake up and run about in the cage for 70–90 min to help distribute the
phosphor within the interstitial space of the muscle and then the oxygen histo-
grams measured in the awake mouse. Each mouse was then anesthetized with
either isoflurane or ketamine xylazine and the oxygen histograms measured
described above. The amount of Oxyphor G3 injected into the muscle was about
4% of that required to give the concentration of Oxyphor G2 injected into the
blood. Thus, the measured phosphorescence comes from the interstitial space.The experiments were carried out by investigators trained to handle mice. All
of the experimental procedures were reviewed and approved by the local
IACUC committee. At the end of the experiment the mice were euthanized
according to guidelines established by the AVMA Panel on Euthanasia.
7.3 Results
Preliminary measurements have been made in subcutaneous tumors grown on
the hind quarter of mice. These tumors grow under the skin and the measure-
ments can be made that are selective for tumor tissue since the tumor tissue is
readily separated from the underlying muscle tissue. Illustrative measurements
of the oxygen histograms for the interstitial space of muscle and tumors are
shown in Fig. 7.1A and B. For Fig. 7.1Ameasurements were made for Oxyphor
G3 in the interstitial space of a RENCA tumor and muscle measured on the
same mouse. In this case the mouse was awake, illustrating that the
Fig. 7.1 (A) Oxygen pressure histograms for the interstitial space in RENCA tumors andnormal muscle tissue. The Oxyphor G3 was microinjected and the oxygen histogramsmeasured as described in Methods. The measurements were made while the mouse wasawake and held in the hand. (B) Oxygen pressure histograms for the interstitial space in aLewis Lung carcinoma and in normal muscle. The mouse was anesthetized with 1.2%isoflurane while the measurements were made. The histograms have been normalized to thesame area under the curve for both tumor and muscle in order to eliminate differences in thetotal Oxyphor and illumination intensities.
7 Oxygen Pressures in Interstitial Space of Skeletal Muscle and Tumors in vivo 57

measurements can be made in awake animals. It is important, however, that theanimals be preconditioned to not become anxious when being handled.Although their becoming agitated does not affect the tumor measurementsvery much, if the leg muscles are being used to try to escape, or if the mice arestressed, this alters vascular regulation, blood pressure, and local blood flow.As a result, the tissue oxygen pressures are altered.
In normal muscle essentially all of the interstitial space of normal muscle hasoxygen pressures greater than 10 Torr and there is a very small fraction withoxygen pressures less than 15 Torr. This is consistent with the results publishedearlier as part of a comparison of the oxygen pressures in the interstitial spaceand the vascular space in resting muscle [24]. In both the RENCA and LewisLung tumors the interstitial space oxygenation (Fig. 7.2A, B) is heterogeneousand generally lower than those in normal tissue. Particularly evident, for thesetwo tumor types, is that a substantial part of both the interstitial and thevascular spaces have oxygen pressures less than 15 Torr. The tumor oxygenpressure distributions are, however, sufficiently different among tumors of thesame type that much more detailed studies will be required to determine iffurther generalizations can be made. In addition, our preliminary measure-ments indicate that the anesthetic may also affect tissue oxygen pressures inthe tumors more than in the muscle, and this needs to be studied in more detail.
7.4 Discussion
Oxygen pressures in the interstitial space can not be measured by other meth-ods, making it impossible to compare the measured values with values from theliterature. Micro-oxygen electrodes and solid EPR probes [26] measure a mix-ture of the interstitial space and capillary oxygenation, whereas nitroimidazole
Fig. 7.2 (A) Oxygen pressure in the intravascular space in RENCA tumors and normalmuscle. Oxyphor G2 was injected i.v. in the tail vein and then the oxygen pressure histogramsmeasured in an awake mouse. Three histograms are presented, each measured for a differentregion of the tumor to emphasize the heterogeneity of this tumor [17]. (B) Oxygen histogramsfrom a Lewis Lung carcinoma and normal muscle in an isoflurane anesthetized mouse.
58 D.F. Wilson et al.

binding measures intracellular oxygenation. Most micro oxygen electrode mea-surements for normal tissue have been made in softer tissue, such as the kidney,liver and brain. Baumgartl and coworkers [27] published histograms of theoxygen distribution in dog kidney with mean PO2 values of 36.8 � 6.0 (� SD)Torr, but did not indicate the anesthetic that was used. Oxygen measurementshave been made in rodent muscles using oxygen electrodes and phosphores-cence quenching. The electrode measurements were, however, typically made inurethane and/or barbiturate anesthetized animals and the muscle tissues weresurgically exposed. Whalen and coworkers [28, 29] used electrodes with verysmall tips to measure oxygen pressures within the cells in living tissue in animalsanesthetized with urethane and barbiturate. They reported 75% of the valueswere between 0 and 5 Torr in guinea pig gracilus and cat heart muscles whereasthose in the cat soleus muscle were higher, having a mean value of 18.9 � 1.8Torr. The influence of the anesthetic on oxygen pressure in the tissue was notappreciated, and, partly for this reason early oxygen electrode measurementsgave rise to the erroneous, view that the oxygen pressures in normal tissue arevery low and there were significant volumes with effectively zero oxygen pres-sures. Later measurements have given higher values, and mean values reportedfor muscle tissue include 19 [30] and 26.8 [31] for the rat cremaster muscle, and31.4 [14] Torr for the rat spinotrapezius microvasculature. These are still muchlower than the 46.2 Torr (awake) or 36.9 Torr (isoflurane anesthesia) valuesobtained with phosphorescence quenching for the interstitial space [24], but aremore consistent with those for ketamine plus xylazine anesthesia.
Tissue oxygen measurements using EPR active particles injected into thetissue [26], are reported to give oxygen pressures in the rat brain of 39.3 � 4.1Torr in isoflurane anesthetized rats [32, 33].
Nitroimidazole binding has been used to measure intracellular oxygenation(for review see [34]). Binding is small in normoxic tissue but increases stronglywith decreasing oxygen pressures. Normal muscle and other tissues show littlebinding of the nitroimidazole, EF5 [2-(2-nitro-1H-imidazol-1-yl)-N-(2,2,3,3,3-pentafluoropropyl) acetamide] in awake and isoflurane anesthetized animals,indicating there are few cells with intracellular oxygen pressures less than about15 Torr.
We conclude that the currently available data are consistent with meanoxygen pressures in normal skeletal muscle interstitium of 35–45 Torr andwith there being negligible volumes with oxygen pressures less than 15 Torr.Further, direct measurements of oxygen pressures in the intravascular andinterstitial spaces (see Wilson et al [24].) shows that the difference in oxygenpressure across the capillary walls under resting conditions is very small, lessthan 1.5 Torr. Thus, the capillary walls consume insignificant oxygen andprovide very little resistance for oxygen movement from the blood plasma tothe pericellular space. This contrasts with the suggestion by Tsai et al [35]. thatthe walls of small arterioles consume a substantial fraction of the availableoxygen, resulting in a difference in oxygen pressure across the wall of tensof Torr.
7 Oxygen Pressures in Interstitial Space of Skeletal Muscle and Tumors in vivo 59

Tumors, in contrast to normal tissue, are now well recognized as havingsubstantial heterogeneity within individual tumors and among different tumortypes. Preliminary measurements have shown that the oxygen pressures mea-sured in the intravascular space and the interstitial spaces are very similar,although this is expected to depend on the tumor being measured. Particularlyimportant will be the extent of tumor necrosis, as necrotic volumes will con-tribute to the interstitial space, but not the vascular space, oxygenmeasurements.In tumors, there seems no alternative to making the oxygen measurements in thetumor at the time of treatment if this important parameter is to be useful fordeveloping therapeutic protocols. It is clear that conclusions concerning theefficacy of therapeutic protocols based on experiments in which the tumor tissueoxygenation was not measured must be interpreted with great caution.
Acknowledgment Supported in part by U54 CA105008-01 (WMFL and DFW), NS-31465(DFW), HL081273 (DFW & SAV).
References
1. Vanderkooi JM,Maniara G, Green TJ, andWilson DF. An optical method for measure-ment of dioxygen concentration based on quenching of phosphorescence, J. Biol. Chem.262: 5476–5482, 1987.
2. Wilson DF, Rumsey WL, Green TJ, and Vanderkooi JM. The oxygen dependence ofmitochondrial oxidative phosphorylation measured by a new optical method for measur-ing oxygen. J. Biol. Chem. 263: 2712–2718, 1988.
3. Dunphy I, Vinogradov SA, and Wilson DF. Oxyphor R2 and G2: Phosphors formeasuring oxygen by oxygen dependent quenching of phosphorescence. Analy. Biochem.310: 191–198, 2002.
4. Vinogradov SA, Fernandez-Seara MA, Dugan BW, and Wilson DF Frequency domaininstrument for measuring phosphorescence lifetime distributions in heterogeneous sam-ples, Rev. Sci. Instruments 72: 3396–3406, 2001.
5. Rumsey WL, Vanderkooi JM, and Wilson DF. Imaging of phosphorescence: A novelmethod for measuring the distribution of oxygen in perfused tissue. Science 241:1649–1651, 1988.
6. RumseyWL, Pawlowski M, Lejavardi N, andWilson DF. Oxygen pressure distribution inthe heart in vivo and evaluation of the ischemic ‘‘border zone’’.Am. J. Physiol. 266(4 Pt 2):H1676–80, 1994.
7. Shonat RD and Johnson PC. Oxygen tension gradients and heterogeneity in venousmicrocirculation: a phosphorescence quenching study. Am. J. Physiol. Heart Circ. Phy-siol. 272: H2233–H2240, 1997.
8. Buerk DG, Tsai AG, Intaglietta M, and Johnson PC. Comparing tissue PO2 measure-ments by recessed microelectrode and phosphorescence quenching. Adv. Exp. Biol. Med.454: 367–374, 1998.
9. Shonat, RD, Wilson DF, Riva CE, and Pawlowski M. Oxygen distribution in the retinaland choroidal vessels of the cat as measured by a new phosphorescence imaging method.Applied Optics 31: 3711–3718, 1992.
10. Vinogradov SA, Lo L-W, JenkinsWT, Evans SM,Koch C, andWilson DF. Noninvasiveimaging of the distribution of oxygen in tissue in vivo using near infra-red phosphors,Biophys. J. 70: 1609–1617, 1996.
60 D.F. Wilson et al.

11. Sinaasappel M, Donkersloot C, van Bommel J, and Ince C. PO2 measurements in the ratintestinal microcirculation. Amer. J. Physiol. 276: G1515–20, 1999.
12. RichmondKN, Shonat RD, Lynch RM, and Johnson PC. Critical PO2 of skeletal musclein vivo. Am. J. Physiol. Heart Circ. Physiol. 277: H1831–H1840, 1999.
13. Dewhirst MW, Ong ET, Braun RD, Smith B, Klitzman B, Evans SM, and Wilson DF.Quantification of longitudinal tissue pO2 gradients in window chamber tumours: impacton tumour hypoxia, Br. J. Cancer 79: 1717–1722, 1999.
14. Behnke BJ, Kindig CA, Musch TI, Koga S, and Poole DC. Dynamics of microvascularoxygen pressure across the rest-exercise transition in rat skeletal muscle. Resp. Physiol.126(1): 53–63, 2001.
15. Poole DC, Behnke BJ, McDonough P,McAllister RM, andWilson DF.Measurement ofmuscle microvascular oxygen pressures: compartmentalization of phosphorescent probe.Microcirculation. 11(4): 317–26, 2004.
16. Wilson DF, Vinogradov SA, Grosul P, Vaccarezza MN, Kuroki A, and Bennett J.Oxygen distribution and vascular injury in the mouse eye measured by phosphorescencelifetime imaging. Appl. Optics 44: 1–10, 2005.
17. Ziemer L, Lee WMF, Vinogradov SA, Sehgal C, and Wilson DF. Oxygen distribution inmurine tumors: characterization using oxygen-dependent quenching of phosphorescence.J. Appl. Physiol. 98: 1503–1510, 2005.
18. Rozhkov V, Wilson DF, and Vinogradov SA. Tuning oxygen quenching constants usingdendritic encapsulation of phosphorescent Pd-porphyrins. Polymeric Materials: Sci. &Eng. 85: 601–603, 2001.
19. Rozhkov V,Wilson DF, and Vinogradov SA. Phosphorescent Pd porphyrin-dendrimers:Tuning core accessibility by varying the hydrophobicity of the dendritic matrix. Macro-molecules 35: 1991–1993, 2002.
20. Rietveld IB, Kim E, and Vinogradov, SA. Dendrimers with tetrabenzoporphyrincores: near infrared phosphors for in vivo oxygen imaging. Tetrahedron 59:3821–3831, 2003.
21. Vinogradov SA and Wilson DF. Phosphorescence lifetime analysis with a quadraticprogramming algorithm for determining quencher distributions in heterogeneoussystems. Biophys. J. 67: 2048–2059, 1994.
22. Vinogradov SA and Wilson DF Recursive maximum entropy algorithm and its applica-tion to the luminescence lifetime distribution recovery.Applied Spectroscopy 54: 849–855,2000.
23. Vinogradov SA and Wilson DF. Metallotetrabenzoporphyrins. New phosphorescentprobes for oxygen measurements. J. Chem. Soc., Perkin Trans. II, 103–111, 1994.
24. Wilson DF, Lee WMF, Makonnen S, Finikova O, Apreleva S, and Vinogradov SAOxygen pressures in the interstitial space and their relationship to those in the bloodplasma in resting skeletal muscle. J. Appl. Physiol. 101: 1648–1656, 2006.
25. Vinogradov SA Arylamide dendrimers with flexible linkers via haloacyl halide method.Organic Letters 7: 1761–1764, 2005.
26. Swartz HM. Using EPR to measure a critical but often unmeasured componentof oxidative damage: oxygen. [Review] Antioxidants & Redox Signaling 6(3): 677–686,2004.
27. Baumgartl H, Zimelka W, and Lubbers D. Evaluation of PO2 profiles to describe theoxygen pressure field within the tissue. Comp. Biochem. & Physiol. Part A 132: 75–85,2002.
28. Whalen WJ. Intracellular PO2 in heart and skeletal muscle. Physiologist 14(2): 69–82,1971
29. Whalen WJ, Nair P, and Ganfield RA. Measurements of oxygen tension in tissues with amicro oxygen electrode. Microvascular Research. 5(3): 254–262, 1973.
30. Prewitt RL, and Johnson PC. The effect of oxygen on arteriolar red cell velocity andcapillary density in the rat cremaster muscle. Microvasc. Res. 12: 59–70, 1976.
7 Oxygen Pressures in Interstitial Space of Skeletal Muscle and Tumors in vivo 61

31. Johnson PC, Vandegriff K, Tsai AG, and Intaglietta M. Effect of acute hypoxia onmicrocirculatory and tissue oxygen levels in rat cremaster muscle. J. Appl. Physiol. 98:1177–1184, 2005.
32. Swartz HM, Taie S, Miyake M, Grinberg OY, Hou H, el-Kadi H, and Dunn JF. Theeffects of anesthesia on cerebral tissue oxygen tension: use of EPR oximetry to makerepeated measurements. Adv. Exptl. Med. & Biol. 530: 569–575, 2003.
33. O’Hara JA,HouH,Demidenko E, Springett RJ, KhanN, and Swartz HM. Simultaneousmeasurement of rat brain cortex PtO2 using EPR oximetry and a fluorescence fiber-opticsensor during normoxia and hyperoxia. Physiol. Measur. 26(3): 203–213, 2005.
34. Koch CJ. Measurement of absolute oxygen levels in cells and tissue using oxygen sensorsand EF5. Meth. in Enz. 352: 3–31, 2002.
35. Tsai AG, Friesenecker B, Mazzoni MC, Kerger H, Buerk DG, Johnson PC, and Inta-glietta M. Microvascular and tissue oxygen gradients in the rat mesentery. Proc. Natl.Acad. Sci. USA 95(12): 6590–6595, 1998.
62 D.F. Wilson et al.

Part II
Other Metabolite Transport in Tissue

Chapter 8
Adjuvant Induced Glucose Uptake by Activated
T Cells is not Correlated with Increased Survival
Sadhak Sengupta*, Rebecca J. Vitale*, Paula M. Chilton1,
and Thomas C. Mitchell1
Abstract Authors contributed equally to this manuscript Natural adjuvants,
such as bacterial lipopolysaccharide (LPS), activate antigen presenting cells
via Toll-like receptors and, indirectly, increase the survival of antigen-
activated T cells. The molecular mechanisms leading to increased survival
remain poorly defined. Because T cell clonal expansion leads to high energy
demands, we hypothesized that increased glucose uptake and/or utilization in
adjuvant-activated T cells could be important molecular event(s) that would
lead to adjuvant-associated T cell survival advantage. Using a fluorescent
analog of 2-deoxyglucose, 2-NBDG, we measured glucose accumulation and
rate of uptake in T cells from mice treated with antigen in the absence or
presence of LPS. Although adjuvant activated T cells increased the accumula-
tion of 2-NBDG, the rate of uptake was unchanged compared to cells acti-
vated with only antigen. Furthermore, glucose transport inhibitors,
cytochalasin B or phloretin, decreased the accumulation of glucose in adju-
vant-treated T cells, but this decrease did not impair adjuvant-associated
survival advantages. Together, these data indicate that increased glucose
uptake through glucose transporters is not required for increased survival of
activated T cells.
8.1 Introduction
T cell proliferation initiated by activation with antigen is followed by rapid
death due to a loss of antigen exposure and acute shortage of pro-survival
cytokine signals. This deletion, although important for reducing the risk of
autoimmune responses, hampers immunity because complete elimination of the
1Institute for Cellular Therapeutics, University of Louisville School of Medicine, 570,S. Preston Street, Louisville, KY 40202, e-mail: [email protected]*Authors contributed equally to this manuscript
K.A. Kang et al. (eds.), Oxygen Transport to Tissue XXIX� Springer 2008
65

responding T cells would reduce the ability of a host to resist subsequentinfection. Vella et al. first showed that in vivo activated T cells were protectedfrom growth-factor withdrawal induced death by the natural adjuvant LPS [1].The mechanism(s) by which natural adjuvants keep activated T cells alive in animmune response is still not fully understood. Co-stimulatory factors andknown pro-survival molecules like Bcl2 and Bcl-XL were previously shown tobe insufficient for adjuvant mediated survival [2, 3]. Activated T cell survival isoften linked to the activation of PI3-kinase during clonal expansion because itenhances proliferation and short-term survival through increased expression ofcytokines [4, 5]. We recently reported that although transiently activated byadjuvant exposure, PI3-kinase stimulation was insufficient to account for adju-vant-induced survival and suggested that induction of post PI3-kinase signalingeffects must be involved [6].
PI3-kinase activity is reported to induce increased localization of the glucosetransporter GLUT1 to the cell surface [7]. Recent reports also show thatPI3-kinase stimulates increases in GLUT1 expression in B cells upon activationwith antigen, which results in increased glucose uptake [8]. Increased uptake ofglucose has also been reported to be required by activated T cells for main-tenance of aerobic glycolyis, a metabolic system that is proposed to provide thecarbon source needed by cells as they prepare for several rounds of division [9].Moreover, activated T cells harvested near the peak of clonal expansion inimmunized mice showed an increase in glucose accumulation [6]. We thereforedecided to study whether this accumulation was due to increased rates ofglucose uptake and whether or not it was correlated with adjuvant-mediatedsurvival advantages.
Using 2-NBDG, a fluorescinated derivative of 2-deoxyglucose and knownglucose-transport inhibitors, cytochalasin B and phloretin [10, 11], we mea-sured glucose uptake and survival of T cells activated either in presence orabsence of adjuvant effects induced by LPS. The results indicate thatadjuvant-mediated survival effects do not require increased rates of uptake orintracellular accumulation of glucose.
8.2 Materials and Methods
8.2.1 T Cell Activation and Primary Cell Culture
Activated T cells were harvested from antigen treated mice as described else-where [6]. Briefly, Vb3þ TCR bearing T cells were activated by injecting B10.BRmice via the tail vein with 0.1mg of the T cell superantigen Staphylococcalenterotoxin A (SEA; Toxin Technologies, Sarasota, FL) and 16 h later with10 mg of bacterial lipopolyaccharide (LPS; from Salmonella typhosa; SigmaAldrich, St. Louis, MO). Spleens were harvested 40 h after activation, redblood cells were lysed with ACK buffer (160 mM NH4Cl, 10 mM KHCO3,
66 S. Sengupta et al.

0.1 mM EDTA) and splenocytes were resuspended to 5�106 cells/ml inRPMI-1640 tissue culture medium (Invitrogen, Carlsbad, CA) supplementedand L-glutamine (Invitrogen). Fetal bovine serum was not used in any of theseshort-term cell culture experiments to avoid survival effects due to entrinsicgrowth factors.
8.2.2 Glucose Uptake by Activated T Cells
Activated splenocytes harvested frommice after 40 h of SEA (�LPS) activationwere cultured in each well of a 96-well tissue culture plate (BD Falcon, Bedford,MA) in serum-free and glucose-free RPMI (Invitrogen) up to 1 h. The cells werepulsed with 100 mM of 2-NBDG in glucose-free medium for 10 mins eitherbefore or after the 1 h incubation period. After washing the cells to removeexcess fluorescent dye they were surface stained with anti-CD4 and anti-Vb3monoclonal antibodies (BD Pharmingen, San Diego, CA). The levels of2-NBDG taken up by Vb3þ CD4þ T cells were analyzed using a FACScaliburflow cytometer (BD Immunocytometry System, San Jose, CA).
8.2.3 Glucose Transport Inhibitors and Measurement of GlucoseUptake and Survival of Activated T Cells
To test for the inhibition of glucose transport activity, 5�105 splenocytesharvested from SEA (�LPS) treated mice were plated in a 96-well tissue cultureplate and incubated in RPMI-1640 medium supplemented with glucose trans-porter blockers cytochalasin B (0–20 mM; Sigma Aldrich, St. Louis, MO) orPhloretin (0–20 mM; Sigma Aldrich, St. Louis, MO). Following 20 h culturewith the inhibitors, cells were washed and incubated for 1 hour with 2-NBDG(30 mM) in glucose-free medium and mean fluorescence intensity (MFI) of2-NBDG in Vb3þ CD4þ T cells was assessed by flow cytometry. Portions ofeach 20 h culture were reserved to measure T cell survival. Briefly, cells werewashed after 20 h culture and stained for CD4 and Vb3; survival was deter-mined using a flow cytometer by measuring the proportion of Vb3þ CD4þ Tcells whose light scatter properties showed they were alive or dead [6].
8.3 Results and Discussion
We often use SEA, which is a T cell superantigen (SAg), as a tool to studyantigen and adjuvant-specific effects on primary T cell activation. SAg treat-ment allows for the activation of limited but detectable amounts of the availablerepertoire of normal, primary T cells and does not need to be processed by APCbefore being ‘presented’ to T cells. This allows adjuvant-induced survival effects
8 Glucose Uptake is not Linked to Adjuvant-Mediated T Cell Survival 67

to be restricted to post-presentation events in order to better isolate and studythe underlying mechanism(s). Acute exposure of responsive T cells to purifiedSAg results in activation, expansion and then deletion of these activated cells byapoptosis unless adjuvants are added to the system [1, 12]. In order to measureglucose uptake by activated T cells 2-NBDG was used. 2-NBDG (Molecularprobes, Eugene, OR) is a fluorescent analog of 2-deoxyglucose which is taken bythe glucose transporters and emits fluorescence at a peak Em of 550 nm.2-deoxyglucose is phosphorylated by hexokinase into 2-deoxyglucose-6-phosphatewhich cannot bemetabolized further or transported out and therefore accumulatesin the cells, which makes 2-NBDG a useful tool for measuring glucose uptake viaflow cytometry and confocal microscopy [6, 13, 14].
Rates of glucose uptake were measured in activated T cells. B10.BR micewere injected with SEA in the presence or absence of LPS and activatedsplenocytes were harvested 40 h after SEA injection. The cells were subjectedto a 10-minute pulse with 100 mm 2-NBDG before or after 1 h of glucosestarvation. Initial levels of 2-NBDG taken up by freshly harvested activatedT cells were low. After 60 mins of glucose deprivation, the amount of 2-NBDGtaken in during a 10-min pulse increased significantly. However, cells from bothdifferent treatment groups took up the same amount of 2-NBDG indicatingthat previous exposure to adjuvant had no effect on T cell’s ability to upregulateglucose transport activity (Fig. 8.1).
Fig. 8.1 Rate of Glucose uptake in activated T cells is not changed upon adjuvant stimulation.Splenocytes were harvested from B10.BR mice injected with either Staphylococcal enterotoxinA (SEA) alone or along with LPS (SEAþLPS) and subjected to a 10-minute pulse with 100 mM2-NBDG before or after 1 hr culture in glucose-free condition. Rate of 2-NBDG uptake inactivated CD4 T cells were analyzed by flow cytometry. No difference in rate of 2-NBDGuptake was observed in adjuvant stimulated T cells both before or after glucose-starvationindicating that adjuvant treatment had no effect on the glucose transporters.
68 S. Sengupta et al.

We next assessed the effect of glucose transport inhibitors on glucose accu-
mulation in activated T cells. Splenocytes harvested from SEA � LPS treated
mice were cultured with cytochalasin B and phloretin for 20 h. Cytochalasin B is
a cell-permeable fungal toxin which inhibits cytoplasmic division by blocking
the formation of contractile microfilaments [15]. It inhibits cell movement by
shortening actin filaments by blocking monomer addition at the fast-growing
end of polymers [16]. Cytochalasin B also inhibits glucose uptake by competi-
tive inhibition with D-glucose by binding specifically toGLUT1; other members
of the GLUT family are less affected [10, 17]. Phloretin also competitively
inhibits glucose uptake and affects all GLUT isoforms [11, 18].Following incubation with the inhibitors, the cells were washed and incubated
with 30 mM of 2-NBDG for 60 mins in glucose-free medium. In the absence of
inhibitors, accumulation of intracellular 2-NBDGwasmuch greater in T cells from
SEAþLPS treated mice when compared to T cells from mice given SEA alone
(Fig. 8.2). T cells that had been treated with increasing amounts of phloretin and
Fig. 8.2 Glucose accumulation is inhibited upon treatment of activated T cells with phloretinand cytochalasin B. Splenocytes were harvested from B10.BR mice injected with either Staphy-lococcal enterotoxinA (SEA) alone or alongwithLPS (SEAþLPS) and incubated overnightwithincreasing concentrations of phloretin (A) or cytochalasin B (B). The cells were then incubated for1 hr with 30 mM2-NBDG in glucose-free condition. Levels of 2-NBDG in activated CD4T cellswere analyzed by flow cytometry. Uptake of 2-NBDG was inhibited with both blockers. Theeffectwas visiblewith 2.5mMcytochalasinBwhich however did not affect the uptake in SEAonlyT cells. Phloretin inhibited 2-NBDG uptake in both SEA and SEAþLPS treated T cells.
8 Glucose Uptake is not Linked to Adjuvant-Mediated T Cell Survival 69

cytochalasin B showed decreasing levels of 2-NBDG, such that the adjuvant-
associated advantage narrowed in a dose-dependent manner. 5 mM of either
inhibitor was sufficient to reduce glucose accumulation to the same levels in both
populations. Dose-adjusted vehicle controls (methanol or DMSO) had no effect on
2-NBDG uptake or retention (data not shown). Therefore the glucose transport
inhibitors phloretin and cytochalasin B prevented preferential accumulation of
2-NBDG induced by adjuvant.To test whether or not glucose uptake was necessary for adjuvant-induced
survival effects, splenocytes from SEA or SEAþLPS mice were cultured in
RPMI for 20 h with phloretin and cytochalasin B up to 20 mM; which is inexcess of the concentration needed to reduce glucose uptake to minimal levels
(Fig. 8.2). As shown in Fig. 8.3, phloretin showed no ability to diminish the
adjuvant-induced survival advantage of T cells isolated from SEAþLPS treated
mice at any dose tested. T cell survival was moderately decreased by low
concentrations of cytochalasin B, but further decreases in survival were not
Fig. 8.3 Adjuvant-mediated survival advantage is not reduced by treatment of activated Tcells with cytochalasin B or phloretin. Splenocytes were harvested from B10.BR mice injectedwith either Staphylococcal enterotoxin A (SEA) alone or along with LPS (SEAþLPS) andincubated overnight with increasing concentrations of phloretin (A) and cytochalsinB (B). Survival analysis by flow cytometry showed an overall decrease in viability of activatedT cells but it did not affect the adjuvant-mediated survival advantage of the LPS treated cellseven with 20 mMcytochalasin B . Incubation with phloretin did not affect the general viabilityof the activated T cells and the adjuvant-mediated survival advantage was maintained withexcess of phloretin.
70 S. Sengupta et al.

detectable in higher concentrations. Therefore, both phloretin and cytochalasinB failed to prevent adjuvant-induced survival effects even at concentrations2–4 folds those needed to inhibit the preferential glucose accumulation by theadjuvant treated T cells.
These observations indicate that the adjuvant-mediated survival advantagein activated T cells is not dependent upon efficient glucose uptake. Further-more, the phenomenon of increased accumulation of 2-NBDG in adjuvant-stimulated T cells is not due to increased glucose uptake but is probably causedby increased hexokinase-mediated phosphorylation in T cells of the glucose thatenters the cells. Hexokinase activity in T cells has been reported to be induced byPI3-kinase/pAkt signaling [9]. Therefore we propose that PI3-kinase/pAkt-mediated stimulation of hexokinase is likely to be one of many mechanismsby which adjuvant alter the metabolism of activated T cells.
References
1. A.T. Vella, J.E. McCormack, P.S. Linsley, J.W. Kappler, and P. Marrack. ‘‘Lipopoly-saccharide interferes with the induction of peripheral T cell death.’’ Immunity 2, no.3(March 1995):261–70.
2. T. Mitchell, J. Kappler, and P. Marrack. ‘‘Bystander virus infection prolongs activatedT cell survival.’’ J. Immunol. 162, no. 8 (April 1999):4527–35.
3. T.C. Mitchell, T.K. Teague, D.A. Hildeman, J. Bender, W.A. Rees, R.M. Kedl,B. Swanson, J.W. Kappler, and P. Marrack. ‘‘Stronger correlation of bcl-3 than bcl-2,bcl-xL, costimulation, or antioxidants with adjuvant-induced T cell survival.’’ Ann. N. Y.Acad. Sci. 975, (December 2002):114–31.
4. L.P. Kane and A. Weiss. ‘‘The PI-3 kinase/Akt pathway and T cell activation: pleiotropicpathways downstream of PIP3.’’ Immunol. Rev. 192, (April 2003):7–20.
5. F.V. Lali, J. Crawley, D.A. McCulloch, and B.M. Foxwell. ‘‘A late, prolonged activationof the phosphatidylinositol 3-kinase pathway is required for T cell proliferation.’’J. Immunol. 172, no. 6 (March 2004):3527–34.
6. S. Sengupta, P.M. Chilton, and T.C. Mitchell. ‘‘Adjuvant-induced survival signaling inclonally expanded T cells is associated with transient increases in pAkt levels and sus-tained uptake of glucose.’’ Immunobiology 210, no. 9 (2005):647–59.
7. J.C. Rathmell, C.J. Fox, D.R. Plas, P.S. Hammerman, R.M. Cinalli, and C.B. Thompson.‘‘Akt-directed glucose metabolism can prevent Bax conformation change andpromote growth factor-independent survival.’’ Mol. Cell Biol. 23, no. 20 (October2003):7315–28.
8. C.A. Doughty, B.F. Bleiman, D.J. Wagner, F.J. Dufort, J.M. Mataraza, M.F. Roberts,and T.C. Chiles. ‘‘Antigen receptor-mediated changes in glucose metabolism inB lymphocytes: role of phosphatidylinositol 3-kinase signaling in the glycolytic controlof growth.’’ Blood 107, no. 11 (June 2006):4458–65.
9. K.A. Frauwirth and C.B. Thompson. ‘‘Regulation of T lymphocyte metabolism.’’J. Immunol. 172, no. 8 (April 2004):4661–65.
10. B. Hellwig and H.G. Joost. ‘‘Differentiation of erythrocyte-(GLUT1), liver-(GLUT2),and adipocyte-type (GLUT4) glucose transporters by binding of the inhibitory ligandscytochalasin B, forskolin, dipyridamole, and isobutylmethylxanthine.’’ Mol. Pharmacol.40, no. 3 (September 1991):383–89.
8 Glucose Uptake is not Linked to Adjuvant-Mediated T Cell Survival 71

11. M. Kobori, H. Shinmoto, T. Tsushida, and K. Shinohara. ‘‘Phloretin-induced apoptosisin B16 melanoma 4A5 cells by inhibition of glucose transmembrane transport.’’ CancerLett 119, no. 2 (November 1997):207–12.
12. J.E. McCormack, J.E. Callahan, J. Kappler, and P.C. Marrack. ‘‘Profound deletion ofmature T cells in vivo by chronic exposure to exogenous superantigen.’’ J. Immunol. 150,no. 9 (May 1993):3785–92.
13. A. Virkamaki, E. Rissanen, S. Hamalainen, T. Utriainen, and H. Yki-Jarvinen. ‘‘Incor-poration of [3-3H]glucose and 2-[1-14C]deoxyglucose into glycogen in heart and skeletalmuscle in vivo: implications for the quantitation of tissue glucose uptake.’’ Diabetes 46,no. 7 (July 1997):1106–10.
14. K. Yoshioka, H. Takahashi, T. Homma, M. Saito, K.B. Oh, Y. Nemoto, andH. Matsuoka. ‘‘A novel fluorescent derivative of glucose applicable to the assessment ofglucose uptake activity of Escherichia coli.’’ Biochim. Biophys Acta 1289, no. 1 (February1996):5–9.
15. A. Ghosh, J. Maniloff, and D.A. Gerling. ‘‘Inhibition of mycoplasma cell division bycytochalasin B.’’ Cell 13, no. 1 (January 1978):57–64.
16. P.A. Theodoropoulos, A. Gravanis, A. Tsapara, A.N. Margioris, E. Papadogiorgaki,V. Galanopoulos, and C. Stournaras. ‘‘Cytochalasin B may shorten actin filaments by amechanism independent of barbed end capping.’’ Biochem Pharmacol. 47, no. 10(May 1994):1875–81.
17. J.F. Griffin, A.L. Rampal, and C.Y. Jung. ‘‘Inhibition of glucose transport in humanerythrocytes by cytochalasins: A model based on diffraction studies.’’ Proc. Natl. Acad.Sci. U. S. A. 79, no. 12 (June 1982):3759–63.
18. R.M. Krupka. ‘‘Asymmetrical binding of phloretin to the glucose transport system ofhuman erythrocytes.’’ J. Membr. Biol. 83, no. 1–2 (1985):71–80.
72 S. Sengupta et al.

Chapter 9
Lactate, with Oxygen, Incites Angiogenesis
Thomas K. Hunt, Rummana Aslam, Zamir Hussain, and Stefan Beckert1
Abstract Lactate has been reconsidered! As we now know, most is producedaerobically We report that lactate accumulation commonly occurs in the pre-sence of oxygen and is sufficient to instigate signals for angiogenesis andconnective tissue deposition. These include vascular endothelial growth factor(VEGF), transforming growth factor beta (TGF beta), interleukin-1 (IL-1), andhypoxia-inducible factor (hif-1alpha). This paper, a mini-review, is occasionedby new data showing increased presence of VEGF and angiogenesis in anoxygenated site by adding a slow-release source of lactate into Matrigel1 andimplanting the Matrigel subcutaneously in mice.
9.1 Introduction
Intuition is sufficient to convince that metabolic need is a stimulant to angio-genesis. The well-known hypoxic induction of angiogenic signals is the mostdramatic example. By that reasoning, lactate, at times an expression of meta-bolic need, should be a subsidiary signal; and, indeed, several investigators havedemonstrated that accumulated lactate, enhances collagen deposition, proteo-glycans deposition, and endothelial migration (via stimulation of VEGF) [1–4].
Lactate in the presence of oxygen? Hypoxia is not even the major source oflactate nor does added oxygen necessarily enhance its metabolism! Authorita-tive investigators have now agreed that lactate, long thought to be merely theend product of hypoxia, has far greater significance! In fact, lactate has manyaerobic sources including aerobic glycolysis, and activated leukocytes, andperforms many important and previously unanticipated functions. These newviews have been well discussed in a recent review [5].
1Thomas K. Hunt, Rummana Aslam, Zamir Hussain, and Stefan Beckert, Department ofSurgery at the University of California Medical Center, San Francisco, CA 94143
K.A. Kang et al. (eds.), Oxygen Transport to Tissue XXIX� Springer 2008
73

Since lactate, even if aerobically derived, has these properties which here-tofore were ascribed to hypoxia, it follows that lactate-derived angiogenesismight have many sources other than hypoxia. For instance, lactate accumulatesin wounds regardless of PO2. Albina [6] has found that hypoxia-inducible factorhif-1alpha detected by pimonidazol adduct formation is maximal in wounds at6 hours, the time-frame in which lactate accumulates to its usual 5–10mM level,and well before PO2 falls. Wounds are inflammatory lesions, and leukocytes aremajor sources of aerobic lactate [7]. Might lactate be the dominant source ofangiogenesis that accompanies inflammation of all sorts? Wounds, even welloxygenated wounds, are a major source and reservoir of lactate. Wound angio-genesis is arguably the most robust and most rapid found in nature.
We have previously demonstrated that wound concentrations of lactatemonomer, induce collagen production in fibroblasts [2, 8]. With oxygen, itinduces post-transcriptional hydroxylation of collagen [8]. VEGF release fol-lows the lactate-induced reduction of the NADþ/NADH via reduction ofADPRibosylations [1]. With or without oxygen, lactate induces VEGF frommacrophages [2]. Adding exogenous lactate to wounds increases the presence ofTGF beta, VEGF, interleukin-1 (Il-1) and collagen deposition [8]. Liu [9] hasshown that all the major products of glycolysis, i.e. acetoacetate, pyruvate, andlactate increase the presence of hif-1alpha, a precursor of VEGF, even whenoxygen is present.1
To complicate the situation further, hyperoxia significantly acceleratesangiogenesis and collagen deposition. Therefore, a mechanism for angiogenesismust exist that tolerates high concentrations of oxygen.We propose that lactateaccumulation is a potent stimulator of angiogenesis, and that oxygen is arequired partner in the tissue response.
9.2 Materials and Methods
We chose the Matrigel1 (BD biosciences) model for this study because as otherinvestigators have found, it produces only slight inflammation and no angio-genesis on implantation whether or not it is the reduced growth factor variety.Yet, it does support angiogenesis when, for instance, a sufficient amount ofVEGF is incorporated. The PO2 in such implants is 50 to 60 mmHg in animalsbreathing air at ambient pressure [10].
Preliminarily, we tested various molecular weight polymers of lactate-co-glycolide to determine if any released sufficient monomer (by non-enzymatichydrolysis) in Matrigel to raise and sustain the level of lactate monomer from
1 Since all of these products are in a dynamic equilibrium with each other, it is difficult toknow which of them is/are responsible. However, this distinction is not important for presentpurposes.
74 T.K. Hunt et al.

about 3mM in controls to about 6mM (roughly the characteristic wound level).Polylactate co-glycolide 50:50 (MW 40,000–75,000) (Sigma) met that expecta-tion. Higher molecular weight polymers were not hydrolysable, did not induceangiogenesis, and were used as negative controls. To obtain the most uniformlactate concentration as possible, the polymer crystals were finely powdered(in a coffee grinder).2
9.2.1 Conditions
The lactate polymer powder was mixed into cold Matrigel (30 mg/ml), and0.2 ml of the mixture was injected subcutaneously into each flank in each of50 animals. Fifty controls were implanted with Matrigel alone. Animals weresacrificed at 11 days. The implants were removed, and sections taken frommid-implant were stained with hematoxylin and eosin, Mallory’s trichrome, andwere evaluated for angiogenesis and collagen presence by two independentobservers. The criteria for quantification were: No cells or blood vessel = 0.A few scattered endothelial or other cells but no alignments of cells in linear orcircular tubes = 1. A few circular alignments of cells but no RBC containingareas = 2. The presence of tubular structures containing RBC= 3. Presence ofsmall and medium sized blood vessels with RBC = 4.
9.2.1.1 Experiment 1
Hypothesis: Implantation of lactated Matrigel in animals that subsequentlybreathed ambient air at 1 ATA will demonstrate angiogenesis.
Matrigel pellets were removed at 11 days and those containing lactate(six animals) were compared with pellets not containing lactate that had beenimplanted in 6 other animals, and 6 in which insoluble polymer had beenincorporated.
9.2.1.2 Experiment 2
Hypothesis: A quantitative relationship develops between the concentrations oflactate monomer and VEGF in lactated implants.
The rationale was that our prior findings in vitro demonstrated that lactateinduces VEGF release from macrophages. Scattered inflammatory cells, some
2 The polymer releases lactate, not lactic acid. Lactate is a weak base and thus alkalinizes thesolution slightly.Hydrolysis does not produce local acidosis! The result of hydrolysis is a racemicmixture. Glycolide is quickly metabolized, and some is converted to lactate [3, 8]. L-lactate andd-lactate equally influence endothelial migration, and both chelate with iron ion.
9 Lactate, with Oxygen, Incites Angiogenesis 75

of them macrophages, normally are present at the edge of Matrigel implants.
They are increased in lactated implants.Two lactated implants were injected into each of 10 animals. Ten controls
were injected with Matrigel containing no additive. After their removal at
11 days the pellets were removed and quickly frozen. When all samples had
been collected, they were weighed, thawed, quickly centrifuged free of residual
lactate polymer, and the liquid phase was analyzed for lactate and VEGF
(ELISA, R&D Systems Inc.).
9.2.1.3 Experiment 3
Hypothesis: Oxamate, an inhibitor of LDH and ADPRibosylation, will abolish
the ability of lactate to induce angiogenesis.The rationale was that prior data had demonstrated that decreased ADPRi-
bosylation due to lactate induced collagen deposition and VEGF production.
Themechanism was traced to diminishedNADþ due to increased conversion of
NADþ to NADH. This happens because ADPRibose (Adenosine Diphospho-
Ribose) and subsequent ADPRibosylations are derived only from NADþ. As a
consequence, the ADPR that inhibits collagen prolyl hydroxylase is withdrawn,
thus increasing prolyl hydroxylation and collagen deposition. Inhibition of
lactate dehydrogenase prevents the reduction of NADþ, withdrawal of ADPRi-
bose from prolyl hydroxylase, and greatly inhibits the effect of lactate [1]. A
similar effect regulates VEGF. Oxamate was, therefore expected to abrogate
lactate-induced angiogenesis.Six animals were injected with lactated Matrigel. Six others were injected
with lactated implants that also contained 3 mM of oxamate (Sigma).
9.3 Results
Experiment 1: The addition of soluble lactate polymer induced angiogenesis in
every implant. The average score was 3.5. Neither non-lactated controls nor
implants with insoluble lactate polymer induced any significant angiogenesis in
any implant. The average score was 0.5. There was no overlap (p < 0.01).
Vessels in the lactated implants ranged from small, one-cell layer thick capil-
laries to about 50 m, medium sized vessels with what appear to be surrounding
pericytes, Collagen deposition was evident in and around the perivascular
structures.Experiment 2: A three phase statistical relationship to VEGF was found.
VEGF rose in parallel with the lactate concentration until high levels indicated
lactate toxicity, and VEGF fell (significance, p<0.05). The effect of lactate wasabrogated by Anti-VEGF polyclonal antibody [2].
76 T.K. Hunt et al.

Experiment 3: Oxamate greatly reduced angiogenesis when given togetherwith lactate. (Average score 1.0 vs. 3.5). Again, there was no overlap in theresults.
9.4 Discussion
In previous studies we established that addition of lactate polymer to implantedwiremesh cylinderwounds raised lactatemonomer concentration from 6 to 9mM(p<0.01) collagen deposition by 50% (p<0.02) and also raised VEGF, TGF-B,and Il-1 (transiently) while lowering IGF-1 to almost zero. PO2, pH, and PCO2were unchanged [8]. In unpublished studies, we have demonstrated enhancedsuperoxide flux that was present focally in cultured human endothelial cellsafter the cells were exposed to nitroblue tetrazolium (Sigma) and 15 mM lactatemonomer at standard cell culture oxygen conditions of PO2, i.e. about 35mmHg.
Also in prior studies, we demonstrated that angiogenesis occurs in propor-tion to oxygen tension. Hyperoxia more than doubled the number of ‘‘mature’’vessels [10]. Hypoxia reducedmature vessel count to zero even when VEGFwasimplanted.
These results, taken together, strongly imply that accumulation of lactate tothe 5–10 mM level, in the presence of oxygen, is by itself, but only in thepresence of oxygen, sufficient to initiate a healing reaction, i.e., increased cellmigration, angiogenesis, proteoglycans production, and collagen synthesis anddeposition. Elevation of oxygen tension, as we have shown increases bothangiogenesis and VEGF [10, 11].
The aggregate results are made congruent by five recent discoveries all ofwhich point to a redox control mechanismof the lactate effect: 1) Feþþ,þþþ forma chelate with lactate that in the presence of H2O2 enhances OH- [12]. 2) Iron-containing structures that participate in redox reactions involvingH2O2 occur inor on the endoplasmic reticulum [9]. In Liu’s experiments, hif-1 gene was inter-nalized into the nucleus when H2O2 concentration was increased. The peroxideconcentrationwas proportional to the PO2. 3) Pyruvate, lactate and acetoacetateenhance the presence of hif-1 when added to benign or malignant cells in thepresence of oxygen [13], The investigators propose that this manifests as a ‘‘feedforward,’’ an amplification, loop. 4) As reported by Sen et al. peroxide binds tothe SP-1 site on the VEGF reporter leading to hif-1-independent VEGF produc-tion [14], and 5) lactate diminishes NADþ thus decreasing ADPRibosylationand activating collagen gene transcription and collagen prolyl hydroxylaseactivity [15]. All of these manifestations are likely to be increased in moderatehyperoxia. When excessively high, oxygen is also likely to become toxic due toredox stress as has been found by Hopf [10].
These findings indicate that lactate participates in a complex redox controlsystem that has at least three pathways. We postulate that lactate chelates ironion in highly specific sites whereupon H2O2, itself derived from oxygen, is
9 Lactate, with Oxygen, Incites Angiogenesis 77

diverted from other functions to produce OH-, or perhaps better said, diverted
to a focal area in which redox flux is intensified. It seems likely that these sites
coincide with those found by Liu [9]. In this circumstance, lactate essentially
reverses the expected reduction of hif-1alpha and allows the cell to behave as if it
is hypoxic while other roles of oxygen, collagen prolyl hydroxylation, for
instance, remain uninfluenced and even enhanced.Additionally, The ADPRibose system, diminished by rising lactate, activates
angiogenesis and collagen deposition. Collagen deposition supports ‘‘maturation’’
of vessels in the sense that endothelial cells, anchored by integrins to collagen, can
enlarge and withstand the pressure of circulating blood. Without collagen, new
vessels weaken and rupture as seen in scurvy (ascorbic acid depletion).Thus, instead of lactate being merely the end of the line for anaerobic
metabolism, it becomes, by its many aerobic sources, a stimulant to increase
anaerobic metabolism as well as to activate (some) ‘‘hypoxia response genes’’
and their down stream effects such as activation of angiogenesis, collagen
synthesis and deposition, and matrix endothelial migration. Our composite
view of the overall mechanism is as follows.Although all the steps in Fig. 9.1 are supported by one or another investi-
gator, questions remain. Among them: Does the oxidant flux stimulate VEGF
and hif at one or separate sites? Does lactate inhibit hif-1alpha decay? Does
lactate enhance the transcription of hif? Could the elevated tissue lactate found
in hyperglycemia be prominent in the causation of vascular disease?
LACTATE
hif-1 α VEGFattracts
endothelial cellsand macrophages
endothelialtubes
collagen ANGIOGENESIS
Fe ++
Fe ++++ H2O2+
+
LACTATE
procollagenhydroxylation
VEGF/collagenGene activation
O 2
connectivetissue
NAD +/NADH
Prolyl hydroxylation
OH-
ADPRibosylation
Inflammation
Fig. 9.1 A provisional schema for the composite actions of lactate in the deposition ofangiogenesis and connective tissue has at least three limbs. The ADPRibosylation pathway ison the right. The lactate diversion occurs at the level of the Fe:lactate chelate with thediversion of hydroxyl radical toward the hif mechanism thus activating it [9]. Alternatively,more H2O2 produces these effect by activating the VEGF promoter [14]. Note also thataddition of VEGF toMatrigel leads to vascularization and collagen formation only if oxygenis present [10]. The pathway of hyalouranan is not known.
78 T.K. Hunt et al.

9.5 Conclusions
The unique feature of lactate is that it has both aerobic and anaerobic sources;and, therefore, widens the scope of possibilities by which angiogenesis is stimu-lated in aerobic conditions. Its ability to increase collagen deposition (in thepresence of oxygen) also widens the scope of vessel maturation. Lactate, occa-sioned by mechanical or chemical injury alone, may be the initial source ofangiogenic stimuli in wounds and may be a part of tumor angiogenesis in whichlactate is constitutively present.
Acknowledgment Supported by NIH NIGMS GM27345 and NIH NRSA GM08258.
References
1. Q. P. Ghani, S. Wagner, H. D. Becker, T. K. Hunt, M. Z. Hussain. Regulatory role oflactate in wound repair. Methods Enzymol. 2004; 381:565–75.
2. J. S. Constant, J. J. Feng, D. D. Zabel, H. Yuan, D. Y. Suh, H. Scheuenstuhl, T. K. Hunt,M. Z. Hussain. Lactate elicits vascular endothelial growth factor from macrophages: apossible alternative to hypoxia. Wound Repair Regen. 2000 Sep–Oct; 8(5):353–60.
3. S. Beckert, F. Farrahi, R. S. Aslam, H. Scheuenstuhl, A. Konigsrainer, M. Z. Hussain,T. K. Hunt. Lactate stimulates endothelial cell migration. Wound Repair Regen. 2006May–Jun; 14(3):321–4.
4. B. Formby, R. Stern. Lactate-sensitive response elements in genes involved in hyaluronancatabolism. Biochem Biophys Res Commun. 2003 May 23; 305(1):203–8.
5. L. B. Gladden. Lactate metabolism: a new paradigm for the third millennium. J Physiol.2004 Jul 1; 558(Pt 1):5–30. Review.
6. J. E. Albina, B. Mastrofrancesco, J. A. Vessella, C. A. Louis, W. L. Henry, Jr.,J. S. Reichner. HIF-1 expression in healing wounds: HIF-1alpha induction in primaryinflammatory cells by TNF-alpha. Am J Cell Physiology. 2001 Dec; 281(6):C1971–7.
7. S. Biswas, M. Ray, S. Misra, D. P. Dutta, S. Ray. Is absence of pyruvate dehydrogenasecomplex in mitochondria a possible explanation of significant aerobic glycolysis bynormal human leukocytes? FEBS Lett. 1998 Apr 3; 425(3):411–4.
8. O. Trabold, W. Wagner, C. Wicke, H. Scheuenstuhl, M. Z. Hussain, N. Rosen,A. Seremetiev, H. D. Becker, T. K. Hunt. Lactate and oxygen constitute a fundamentalregulatorymechanism inwoundhealing.WoundRepairRegen. 2003Nov–Dec;11(6):504–9.
9. Q. Liu, U. Berchner-Pfannschmidt, U. Moller, M. Brecht, C. Wotzlaw, H. Acker,K. Jungermann, T. A. Kietzmann. Fenton reaction at the endoplasmic reticulum isinvolved in the redox control of hypoxia-inducible gene expression. Proc Natl Acad SciU S A. 2004 Mar 23;101(12):4302–7.
10. H. W. Hopf, J. J. Gibson, A. P. Angeles, J. S. Constant, J.J. Feng, M. D. Rollins,M. Z. Hussain, T. K. Hunt. Hyperoxia and angiogenesis. Wound Repair Regen. 2005Nov–Dec;13(6):558–64.
11. A. Y. Sheikh, J. J. Gibson, M. D. Rollins, H. W. Hopf, Z. Hussain, T. K. Hunt. Effect ofhyperoxia on vascular endothelial growth factor levels in a wound model. Arch Surg.2000 Nov;135 (11):1293–7
12. M.A. Ali, F. Yasui, S. Matsugo, T. Konishi. The lactate-dependent enhancement of hydro-xyl radical generation by the Fenton reaction. Free Radic Res. 2000 May;32(5):429–38.
9 Lactate, with Oxygen, Incites Angiogenesis 79

13. H. Lu, C. L. Dalgard, A. Mohyeldin, T. McFate, A. S. Tait, A. Verma. Reversibleinactivation of HIF-1 prolyl hydroxylases allows cell metabolism to control basalHIF-1. J Biol Chem. 2005 Dec 23;280(51):41928–39.
14. C. K. Sen, S. Khanna, B. M. Babior, T. K. Hunt, E. C. Ellison, S. Roy. Oxidant-inducedvascular endothelial growth factor expression in human keratinocytes and cutaneouswound healing. J Biol Chem. 2002 Sep 6;277(36):33284–90.
15. D. D. Zabel, J. J. Feng, H. Scheuenstuhl, T. K. Hunt, M. Z. Hussain. Lactate stimulationof macrophage-derived angiogenic activity is associated with inhibition of Poly(ADP-ribose) synthesis. Lab Invest. 1996; 74:644–9.
80 T.K. Hunt et al.

Part III
Blood, Hemostasis and Hemodynamics

Part III
Blood, Hemostasis and Hemodynamics

Chapter 10
Activated Protein C Modulates Chemokine
Response and Tissue Injury in
Experimental Sepsis
Ganesh R. Sharma1, Bruce Gerlitz
1, David T. Berg
1, Martin S. Cramer
1,
Joseph A. Jakubowski1, Elizabeth J. Galbreath2, Josef G. Heuer1,
and Brian W. Grinnell1
Abstract The protein C (PC) pathway plays an important role in vascularfunction, and acquired deficiency during sepsis is associated with increasedmortality. We have explored the role of PC suppression in modulating early
inflammatory events in a model of polymicrobial sepsis. We show thatincreased levels of organ damage and dysfunction are associated with decreasedlevels of endogenous PC. Notably, animals with low PC had correspondinglyhigh levels of pulmonary iNOS expression, which correlated with chemokines
KC/Gro andMIP2, previously shown to predict outcome in thismodel. Treatmentwith activated protein C (aPC) not only reduced the pathology score, leukocyteinfiltration and markers of organ dysfunction, but also suppressed the induc-tion of iNOS, and the chemokine response (including KC/Gro, MIP2, IP-10,
RANTES, GCP-2 and lymphotactin), and increased apoA1. aPC treatmentalso suppressed the induction of VEGF, a marker recently suggested to play apathophysiological role in sepsis. These data demonstrate a clear link betweenlow protein C and degree of organ damage and dysfunction in sepsis, as well asthe early reversal with aPC treatment. Moreover, our data show a direct role
of aPC in broadly modulating monocyte and T-cell chemokines followingsystemic inflammatory response.
10.1 Introduction
Sepsis syndrome occurs from a complex host response to insult followinginfection, and carries a high mortality rate [1]. In severe sepsis, the innate
immune response becomes dysregulated, resulting in a cascade of inflammatoryactivation, microvascular coagulation, endothelial cell dysfunction and ulti-mately organ failure and death (reviewed in [2]). While many soluble factors
1Biotechnology Discovery Research, Lilly Research Laboratories, Lilly Corporate Center,Indianapolis, IN 46285.2Pathology Lilly Research Laboratories, Lilly Corporate Center, Indianapolis, IN 46285.
K.A. Kang et al. (eds.), Oxygen Transport to Tissue XXIX� Springer 2008
83

change during infection and sepsis, the suppression of endogenous protein C(PC) has been associated with increased mortality and is prognostic for sepsisand sepsis severity [3, 4]. Moreover, low protein C levels are predictive of earlydeath in a rat model of polymicrobial sepsis [5, 6], and clinically have beenassociated with early death resulting from refractory shock and multiple organfailure in severe sepsis [4].
In settings of thrombotic stress, the zymogen Protein C is converted to itsactive form by thrombin in complex with endothelial surface thrombomodulin(TM). Activated protein C (aPC) functions as a feedback inhibitor of thrombingeneration [7] and has receptor-mediated anti-inflammatory and cytoprotectiveeffects; [8–10] recent studies have also shown that aPC can inhibit leukocyterolling and adhesion [11, 12]. In this study we have examined early markers ofinflammation and organ function following induction of polymicrobial sepsis,both as a function of endogenous PC suppression and treatment with aPC. Ourstudies show that acquired PC deficiency in polymicrobial sepsis is highlycorrelated with early activation of chemokine response, tissue infiltration andorgan damage. Moreover, treatment with aPC results in suppression of thechemokine response and improved organ function.
10.2 Experimental Procedures
The protocol for the rat cecal ligation and puncture (CLP) model of sepsis hasbeen previously described in detail [5]. Sprague Dawley rats were purchasedfrom Harlan (Indianapolis, IN). Sham rats received identical surgery (exceptfor CLP) and post-operative management. All experimental methods wereapproved by the Institutional Animal Care and Use Committee and were inaccordance with the institutional guidelines for the care and use of laboratoryanimals. Mortality studies were as previously described [5]. Recombinant ratPC was produced in AV12-664 cells, then activated with recombinant ratthrombomodulin/bovine thrombin complex essentially as described previouslyfor human aPC [13]. Infusion syringes were pre-coated overnight with sterile7.5% BSA, then continuous infusion of either vehicle (5% dextrose, 0.9%saline) or recombinant rat aPC (200 ug/kg/hr in 5% dextrose, 0.9% saline)was begun at 10 hrs post-CLP and continued until sacrifice of animals at 22 hrspost-CLP for collection of tissue samples. This resulted in a blood level of�100ng/ml aPC. Blood sampling of animals pre-CLP and 10 hrs post-CLP was viaretro-orbital bleed; cardiac puncture was used for the blood draw at 22 hrs post-CLP (time of sacrifice). Clinical chemistry (alanine aminotranferease [ALT],aspartate aminotransferase [AST], blood urea nitrogen [BUN] and creatinine[CRE]) was performed on serum, while cytokine/chemokine analysis was per-formed on EDTA-plasma using Rodent Multi-Analyte Profile (Rules BasedMedicine; Austin, TX), Rat ELISA kits (R&D Systems, Minneapolis, MN) orthe Rat Cytokine/chemokine Immunoassay Panel (Linco, St. Charles, MO).
84 G.R. Sharma et al.

Endogenous PC levels were determined using a rat-PC ELISA as describedpreviously [5]. Total RNA was purified from rat tissue using RNeasy (Qiagen);quantitative real-time PCR was performed with an ABI Prism 7900HTSequence Detection System.
Tissue was also collected for histopathology as previously described [14]. Acomposite pathology score was derived from scoring of lung, liver and kidney asfollow. Lung pathology was scored by the number of myeloperoxidase (MPO)labeled cells with pavementing: Grade 1 = Mild intravascular margination(IM) of WBC; Grade 2 = Moderate IM of WBC; Grade 3 = Marked IM ofWBC; Grade 4 = Marker IM with pavementing of WBC; Grade 5 = MarkedIM with pavementing & extravascular WBC. Liver was scored by increasingnumbers of MPO labeled cells: Grade 1 = <10 / high powered field (hpf);Grade 2 = 10–20/hpf; Grade 3 = 20–30/hpf; Grade 4 = 30–40/hpf; Grade5=>40/hpf,. Kidney was scored by increasing corticomedullary acute tubularnecrosis (ATN): Grade 1 = proteinuria, rouleaux, individual tubular cellapoptosis /necrosis; Grade 2 = proteinuria, rouleaux, mild focally extensive(<10%) ATN; Grade 3 = proteinuria, rouleaux, mild multifocal (10–20%)ATN; Grade 4 = proteinuria, rouleaux, moderate multifocal (>20%) ATN;Grade 5 = proteinuria, rouleaux, marked multifocal to regional ATN, casts.
ANOVA was used to determine statistical significance, and multivariateregression analysis by pairwise comparison was determined using JMP5.1 soft-ware (SAS Institute). A p value of < 0.05 was considered significant. mRNAchanges elicited by CLP and analyzed by qPCR, were expressed in terms ofpercent change relative to the control group (defined as 100%). The SEM forratios was derived using the delta method [15].
10.3 Results
We examined early changes in inflammatory markers and tissue pathologyfollowing induction of systemic inflammatory response in the CLP model.Following CLP animals were observed for 96 hrs, with early death defined asbeing before 30 hrs and late death thereafter. Shown in Fig. 10.1 is a clusteringof plasma markers that differentiated outcome, from a panel of 46 cytokinesand chemokines measured 22 hrs post-CLP. Notably, low levels of endogenousPC and APO-A1, as well as elevated levels of proinflammatory chemokinespredicted early death relative to sham animals.
We further analyzed this suppression of PC relative to known markers oftissue injury and observed significant negative correlations between PC and thefollowing markers: AST r = –0.81, p < 0.0001; ALT r = –0.83, p < 0.0001;creatinine r= –0.76, p< 0.002.We next examined the tissue pathology at 22 hrspost CLP and observed a graded response using scoring that differentiated lunginfiltration and margination of leukocytes (Fig. 10.2A), tubular damage in thekidney and degree of myeloperoxidase-positive cells in the liver. We observedthat the animals having low PC at 22 hrs had a higher mean pathology score
10 APC Modulates Chemokine Response and Tissue Injury 85

than animals whose PC did not decrease below normal (defined as < 60% of
baseline [6]) (Low PC= 4.5þ/–0.7 vs. Normal PC= 2.6þ/–0.3, p< 0.05). We
observed significant correlations with degree of tissue pathology and the neu-
trophil chemotactic CXC chemokines MIP2 and KC/Gro (Fig. 10.2B). More-
over, the pathology score was significantly correlated with tissue injury markers
(plasma AST p < 0.008 ; ALT p < 0.01). A key factor shown to correlate with
inflammatory response, especially in acute lung injury, is inducible nitric oxide
MCP-3MCP-1 / JE
MIP-2
GCP-2KC / GROalpha
IP-10Change in Protein C
21 hr Protein CApolipoprotein A1
Early DeathAnimals
Survivor (S) or Late Death (L) ShamAnimalsL L S S S L S S S S S L L S L L S S
Che
mok
ines -
-2
-
Fig. 10.1 Clustering of plasma markers as a function of outcome in the CLP model. Thelevels of various plasma markers from the Rodent Multi-Analyte Profile were clustered inJMP 5.1 using the Ward method. Dark blue to dark red change indicates low to high relativelevels, respectively, for each marker. (See also color insert.)
Lung
mye
lope
roxi
dase
Grade 1 Grade 3 Grade 5
Fol
d C
hang
e (1
0 to
22
hr)
0
2
4
6
8
10
12
14
Grade 1 Grade 3 Grade 5
MIP2KC/GRO
Fol
d iN
OS
Exp
ress
ion
Percent baseline PC
1
10
70
10 50 100
30
3
r = – 0.93p < 0.0001
A
B C
Fig. 10.2 Tissue injury, inflammatory markers and protein C suppression in the rat CLP.(A) Example of pathology in the lung by severity grade. (B) Analysis of change in protein Cplasma level as a function of MIP2 and KC/Gro. Arteriole blood draws were performed atapproximately 10 and 22h and plasma was analyzed for various analytes as describedpreviously [5]. (C) Relationship of the change in PC as a function of lung iNOS expression,analyzed by quantitative real-time PCR (TaqMan1) n=11 animals. (See also color insert.)
86 G.R. Sharma et al.

synthase (iNOS) expression [16–18]. As shown in Fig. 10.2C, increased lung
iNOS expression was highly correlated with reduction in baseline PC level.
Moreover, the increase in iNOS was highly correlated with the increase in
both MIP2 (r =0.84, p < 0.001) and KC/Gro (r =0.80, p < 0.005).The above data suggested a strong relationship between the level of endo-
genous PC and markers of tissue injury. To provide evidence of a causal
relationship, we administered activated PC during disease progression, to
determine any effect on tissue pathology and inflammatory mediators. As
shown in Fig. 10.3A, infusion of aPC for 12 hrs, starting 10 hrs after CLP,
significantly reduced the mean pathology score.Moreover, the mean increase in
the level of ALT (Fig. 10.3B) and AST (not shown) following CLP was sig-
nificantly reduced by aPC treatment. Treatment with aPC significantly restored
plasma apoA1 and fibrinogen levels, both of which are markers of liver syn-
thetic capacity (Fig. 10.3C). In view of apoA1’s anti-inflammatory activity [19],
blocking its suppression may play a role in aPC’s anti-inflammatory activity,
possibly complementing the suppression of the chemokine response.An examination of changes in chemokine levels showed a significant sup-
pression of neutrophil chemotactic CXC chemokines (Fig. 10.4A) as well as the
T-cell/NK cell chemokines IP-10, RANTES and lymphotactin. We also
observed significant inhibition of OSM, MIP1a, and MIP1b (data not shown).
Of interest, aPC treatment had no significant effect on TNFa, IL-1 or IL-6 in
ALT
(U
/l)
50
100
150
200
250
10 hr 22hr 22h10 hr Control Rat aPC
10-22 hrs
NS
p < 0.005
Fol
d C
hang
e po
st tr
eatm
ent
0
1
2
3
4
5
6
APOA1 Fibrinogen
p < 0.03
*
Control
aPC
1.0
1.5
2.0
2.5
3.0
3.5
Mea
n P
atho
logy
Ssc
ore
p < 0.05
aPCVehicle
A B C
*
*250
4
5
Fig. 10.3 Effect of aPC infusion on organ pathology and functional markers. Recombinantrat aPC or vehicle control (in 5% dextrose, 0.9% saline) was administered by continuousinfusion begun at 10 hrs post-CLP and continued until sacrifice of animal at 22 hrs post-CLPfor collection of tissue and plasma samples. (A) Effect of aPC on a composite mean pathologyscore (n= 20) (B) Effect of aPC treatment on ALT levels and (C) on liver markers apoA1 andfibrinogen. Data are mean þ/– SE, n= 22 vehicle, 19 aPC treated.
10 APC Modulates Chemokine Response and Tissue Injury 87

this model (data not shown [5]). The up-regulation of iNOS, which correlated
highly with PC suppression and chemokine activation, was also dramatically
reduced by the aPC treatment.Recent studies have suggested that increases in circulating levels of vascular
endothelial growth factor (VEGF) may play a pathophysiologic role in mediating
the sepsis phenotype [20]. In our ratmodel, we observed an increase in VEGF from
215 þ/–7 pg/ml to 323 þ/–35 pg/ml by 22 hrs post-CLP. We examined the
0
2
4
6
8
10
12
0
0.5
1
1.5
2
2.5
3
3.5
MIP2/Groβ KC/Groα GCP-2
CLP
CLP + aPC
#
#**
IP-10 RANTES lymphotactin
CLP
CLP + aPC
#
***
Fol
d C
hang
e po
st tr
eatm
ent
0
5
10
15
20
25
30
Fol
d ch
ange
in iN
OS
exp
ress
ion
p < 0.005
sham CLP CLP + aPC
p < 0.001A B
10
15
20
25
B
Fig. 10.4 Effect of aPC administration (described in legend to Fig. 10.3) on (A) chemokineresponse and (B) iNOS. Data are meanþ/- SE from n= 22 vehicle, 19 aPC treated. * p < 0.05,** p <0.02, # p < 0.01.
0
25
50
75
100
125
Pla
sma
PC
(%
bas
elin
e)
1 2 3VEGF (Fold Change)
r = 0.77p < 0.0001
1
1.25
1.5
1.75
Vehicle aPC
p < 0.02
Pla
sma
VE
GF
(%
bas
elin
e)
A B
–
Fig. 10.5 (A) Relationship between endogenous PC and circulating plasmaVEGF. (B) Effectof aPC administration (legend to Fig. 10.3) on VEGF levels. Data are mean þ/– SE, n = 22vehicle, 19 aPC treated.
88 G.R. Sharma et al.

relationship between endogenous PC and the increase in VEGF, and observed asignificant negative correlation (p< 0.0001) (Fig. 10.5A). Moreover, we observeda significant reduction in the level of circulating VEGF with aPC treatment(Fig. 10.5B).
10.4 Discussion
Recent studies have begun to elucidate the role of the protein C pathway incontrolling normal physiology of the vasculature and of the innate immunesystem. aPC has been shown to modulate endothelial function by inhibiting celladhesion and apoptosis, and by promoting cell survival/angiogenesis [8, 9, 21–24].These effects are likely due a combination of the ability of aPC to inhibit thrombingeneration, and through specific receptor-mediated signaling at the PAR-1 recep-tor in conjunction with the endothelial protein C receptor. This receptor complexis present not only on the endothelium, but also appears to be present on mono-cytes, natural killer cells [11], neutrophils [25], and eosinophils [26]. Thus, theemerging data suggest that aPC plays a key role in modulating the endothelial/leukocyte interface in response to stress.
Our results demonstrate a clear role of the PC pathway in the tissue pathol-ogy and early chemokine response in the CLP model. The effect of aPC waspredominately on suppression of chemokines critical for amplification of theresponse to infection, and on chemokines critical for both neutrophil and T-cellmodulatory factors (reviewed in [27]). Of interest, previous studies demon-strated that KC/Gro and MIP2 were good predictors of early death in CLP,and we have now shown that these correlate highly with pathology in thismodel, and were significantly suppressed by aPC treatment. In addition, thehigh correlation of these chemokines with iNOS expression is of interest as Kimet al. [28] have suggested that iNOSmay regulate certain chemokines, includingRANTES and MIP1a. Possibly, suppression of iNOS by aPC may be drivingthe observed reduction of the chemokine response seen with treatment. Ourresults also suggest that aPC suppresses VEGF in the setting of sepsis. VEGF isknown to sensitize the vasculature to the effect of cytokines, and thus likelyplays a role in enhancing the activation of the endothelium during sepsis [20]. Inlight of the effect of aPC on modulating both VEGF and the chemokineresponse, it is notable that chemokines can regulate vascular/angiogenic func-tion by modulating VEGF function (reviewed in [29]).
While the cause and effect relationship of low PC and clinical outcome hasnot been proven, the data presented here suggest that low endogenous PC levelsduring systemic inflammatory response may be pathophysiologically related topoor outcome. The low level of PC likely compromises the ability to naturallygenerate aPC, which results in a reduction in the natural protective mechanismof the vasculature to limit inflammatory and ischemic injury. Our data furthersuggest that aPC’s ability to modulate not only coagulopathic dysfunction [4],
10 APC Modulates Chemokine Response and Tissue Injury 89

but also the cascading inflammatory responses following infection, plays a keyrole in reversing vascular injury, poor tissue perfusion and resulting organdysfunction.
Acknowledgment We gratefully acknowledge Eddie J. Stephens, Renee L. Grubbs, KimberlyC. Holmes, Kelly Fynboe, and Dominick Montani for assistance with animal care and CLPstudies.We thank Joe Brunson, Sherri L. Hilligoss, andDon B.McClure for assistance with cellculture in producing rat aPC.
The authors disclose that they are employees of Eli Lilly and Co, who produce recombi-nant human protein C (drotrecogin alfa [activated]).
References
1. D. Angus, W.T. Linde-Zwirble, J. Lidicker, G. Clermont, J. Carcillo, M.R. Pinsky,Epidemiology of severe sepsis in the United States: analysis of incidence, outcome, andassociated costs of care, Crit Care Med 291;303–1310 (2001).
2. B. Grinnell andD.E. Joyce, Recombinant human activated protein C: A systemmodulatorof vascular function for treatment of severe sepsis, Crit Care Med 29;S53–S61 (2001).
3. C.J. Fisher and S.B. Yan, Protein C levels as a prognostic indicator of outcome in sepsisand related diseases, Crit Care Med 28(9);S49–S56 (2000).
4. W.L.Macias and D.R. Nelson, Severes protein C deficiency predicts early death in severesepsis, Crit Care Med 32;S223–S228 (2004).
5. J.G. Heuer, G.R. Sharma, B. Gerlitz, T. Zhang, D.L. Bailey, C. Ding, D.T. Berg,D. Perkins, E.J. Stephens,K.C.Holmes, R.L.Grubbs,K.A. Fynboe,Y.F. Chen, B.Grinnell,and J.A. Jakubowski, Evaluation of protein C and other biomarkers as predictors ofmortality in a rat cecal ligation and puncture model of sepsis. [see comment], Crit CareMed 32(7);1570–1578 (2004).
6. D. Berg, B. Gerlitz, G. Sharma, M. Richardson, E. Stephens, R. Grubbs, K. Holmes,D. Montani, T. Zhang, M. Cramer, S. Engle, J. Jakubowski, H. JG, and B. Grinnell,FoxA2 Involvement in Suppression of Protein C, an Outcome Predictor in ExperimentalSepsis, Clinical Vaccine Immunol. 13;426–432 (2006).
7. C.T. Esmon, J.M.Gu, J. Xu,D.Qu,D.J. Stearns-Kurosawa, and S.Kurosawa, Regulationand functions of the protein C anticoagulant pathway, Haematologica 84(4);363–8 (1999).
8. D.E. Joyce, L. Gelbert, A. Ciaccia, B. Dehoff, and B.W. Grinnell, Gene ExpressionProfile of Antithrombotic Protein C Defines New Mechanisms Modulating Inflamma-tion and Apoptosis, J Biol Chem 276;11199–11203 (2001).
9. L.O. Mosnier and J.H. Griffin, Inhibition of staurosporine-induced apoptosis ofendothelial cells by activated protein C requires protease activated receptor-1 andendothelial cell protein C receptor, Biochem J 8(2003).
10. M. Riewald, R. Petrovan, A. Donner, B. Mueller, and W. Ruf, Activation of endothelialcell protease activated receptor 1 by the protein C pathway, Science 296;1880–1882 (2002).
11. D.E. Joyce, D.R. Nelson, and B.W. Grinnell, Leukocyte and endothelial cell interactionsin sepsis: relevance of the protein C pathway, Crit Care Med 32(5 Suppl),(2004).
12. J.N. Hoffmann, B. Vollmar, M.W. Laschke, D. Inthorn, J. Fertmann, F.W. Schildberg,and M.D. Menger, Microhemodynamic and cellular mechanisms of activated protein Caction during endotoxemia.[see comment], Crit Care Med 32(4);1011–1017 (2004).
13. B. Gerlitz and B.W. Grinnell, Mutation of protease domain residues Lys37-39 in humanProtein C inhibits activation by the thrombomodulin-thrombin complex without affect-ing activation by free thrombin, J Biol Chem 271(37);22285–22288 (1996).
90 G.R. Sharma et al.

14. D.T. Berg, L.J. Myers, M.A. Richardson, G. Sandusky, and B.W. Grinnell, Smad6sregulates plasminogen activator inhibitor-1 through a protein kinase C-beta-dependentup-regulation of transforming growth factor-beta, J Biol Chem 280(15);14943–7 (2005).
15. Y. Bishop, S. Feinberg, and H. PW, Discrete multivariate analysis: Theory and practice,Cambridge: The MIT Press (1975).
16. L. Dugo, S. Marzocco, E. Mazzon, R. Di Paola, T. Genovese, A.P. Caputi, andS. Cuzzocrea, Effects of GW274150, a novel and selective inhibitor of iNOS activity, inacute lung inflammation, Br J Pharmacol 141(6);979–987 (2004).
17. H. Toga, T. Tobe, Y. Ueda, G.H. Yang, K. Osanai, M. Ishigaki, H. Okazaki, S. Katsuda,K. Takahashi, and N. Ohya, Inducible nitric oxide synthase expression and nuclearfactor-kappaB activation in alveolar type II cells in lung injury, Experimental LungResearch 27(6);485–504 (2001).
18. L.W. Chen, B. Hwang,W.J. Chang, J.S.Wang, J.S. Chen, and C.M. Hsu, Inducible nitricoxide synthase inhibitor reverses exacerbating effects of hypertonic saline on lung injuryin burn, Shock 22(5);472–477 (2004).
19. M. Navab, G. Anantharamaiah, and A. Fogelman, The role of high-density lipoproteinin inflammation, Trends Cardiovasc Med 15;158–161 (2005).
20. K. Yano, P. Liaw, J. Mullington, S. Shih, H. Okada, N. Bodyak, P. Kang, L. Tolt,B. Belikoff, J. Buras, B. Simms, J. Mizgerd, P. Carmeliet, S. Karumanchi, and W. Aird,Vascular endothelial growth factor is an important determinant of sepsis morbidity andmortality, J Exp Med 203(6);1447–1458 (2006).
21. D.E. Joyce and B.W. Grinnell, Recombinant human activated protein C attenuates theinflammatory response in endothelium and monocytes by modulating nuclear factor-kappaB, Crit Care Med 30;S288–293 (2002).
22. T. Cheng, D. Liu, J. Griffin, J. Fernandez, F. Castellino, E. Rosen, K. Fukudome, andB. Zlokovic, Activated protein C blocks p53-mediated apoptosis in ischemic human brainendothelium and is neuroprotective, Nat Med 9;338–342 (2003).
23. M.Uchiba, K. Okajima, Y. Oike, Y. Ito, K. Fukudome, H. Isobe, and T. Suda, Activatedprotein C induces endothelial cell proliferation by mitogen-activated protein kinaseactivation in vitro and angiogenesis in vivo, Circulation Research 95(1);34–41 (2004).
24. K. Okajima, Prevention of endothelial cell injury by activated protein C: the molecularmechanism(s) and therapeutic implications, Current Vascular Pharmacology 2(2);125–133(2004).
25. D.H. Sturn,N.C.Kaneider, C. Feistritzer,A.Djanani,K. Fukudome, andC.J.Wiedermann,Expression and function of the endothelial protein C receptor in human neutrophils, Blood102(4);1499–1505 (2003).
26. C. Feistritzer, D.H. Sturn, N.C. Kaneider, A. Djanani, and C.J. Wiedermann, Endothelialprotein C receptor-dependent inhibition of human eosinophil chemotaxis by protein C,J Allergy Clin Immunol 112(2);375–381 (2003).
27. A. Mantovani, A. Sica, S. Sozzani, P. Allavena, A. Vecchi, and M. Locati, The chemo-kine system in diverse forms of macrophage activation and polarization, Trends inImmunology 25(12);677–686 (2004).
28. J.Y. Kim, D. Kim, E.M. Lee, I. Choi, C.G. Park, K.S. Kim, J. Ha, S.J. Kim, J. Yang,Y.S. Kim, J.S. Han, S. Kim, J.S. Lee, and C. Ahn, Inducible nitric oxide synthaseinhibitors prolonged the survival of skin xenografts through selective down-regulationof pro-inflammatory cytokine and CC-chemokine expressions, Transplant Immunology12(1);63–72 (2003).
29. M. Rosenkilde and T. Schwartz, The chemokine system – a major regulator of angiogen-esis in health and disease, APMIS 112(7–8);481–495 (2004).
10 APC Modulates Chemokine Response and Tissue Injury 91

Chapter 11
Manipulation of the Affinity Between Protein and
Metal Ions by Imidazole and PH forMetal Affinity
Purification of Protein c from Cohn Fraction IV-1
James J. Lee1, Duane F. Bruley
2, and Kyung A. Kang
1
Abstract Protein C (PC) is an important anticoagulant in blood plasma. CohnFraction IV-1 (CFIV-1) is an inexpensive PC source but contains a largeamount of factor II (FII). Immobilized metal affinity chromatography(IMAC) utilizes metal ions to adsorb proteins primarily via their surface histi-dine. Two major operation parameters for IMAC are imidazole concentrationand pH: imidazole is a histidine analog and pH controls the protein surfaceprotonation level. The effects of these two parameters on the adsorption andelution of PC and FII were studied for each protein individually and alsotogether as a mixture. For the individual proteins, low FII (16%) and highPC (98%) adsorption were achieved at 8 mM imidazole, pH 8.0. At 11 mMimidazole, 92% of the adsorbed FII was eluted, with only a 3% PC loss.At 40 mM, 97% of the adsorbed PC was recovered. For the protein mixture,very similar adsorption and elution results were obtained, but slightly greaterPC loss (16%) during elution at 11 mM imidazole. This result shows that thereis a high potential for the PC purification from CFIV-1 by appropriatelyadjusting the imidazole concentration and pH in the IMAC process.
11.1 Introduction
Protein C (PC) is an anticoagulant, antithrombotic, anti-inflammatory [1,2], andanti-apoptotic [3,4]. Therefore, PC can be a valuable therapeutic for patientswith PC deficiency, various thrombo-embolisms, advanced sepsis, and stroke [5].Currently known PC sources are transgenic animal milk, recombinant mamma-lian cells, and blood plasma, all of which are very expensive and not alwaysavailable. Cohn Fraction IV-1 (CFIV-1) is a by-product of the plasma fractiona-tion process, and retains approximately 90% of the PC in plasma. CFIV-1 usedto be discarded and, therefore, is a very inexpensive PC source. Purification of
1Department of Chemical Engineering, University of Louisville, Louisville, KY 40292.2Department of Chemical and Biochemical Engineering, University of Maryland BaltimoreCounty, Baltimore, MD 21250 and Synthesizer Inc., Ellicott City, MD 21043.
K.A. Kang et al. (eds.), Oxygen Transport to Tissue XXIX� Springer 2008
93

PC from CFIV-1 using usual bio-purification methods, such as ion-exchangechromatography, is difficult, if not impossible, because CFIV-1 contains variouscoagulants that are structurally homologous to PC (factors II, VII, IX,and X [6,7]; Table 11.1). Among these coagulants, factor II (FII) is the mostproblematic one because of its long half-life and abundance in the source [8].Thus, our study focus has been the separation of FII from PC.
Histidine is a strong electron-donor and has a high affinity to metal ions(electron acceptor) [11]. The separation of FII from PC by immobilized metalaffinity chromatography (IMAC) with Cu2þ and iminodiacetic acid (IDA)chelator has been studied by our group [12,13]. In IMAC operation, theimidazole concentration and pH are the two major parameters used for adjust-ing the affinity between the metal ions and the proteins [14]. Our previous studyresults showed that, when no imidazole was added in the buffer, the amounts ofadsorbed PC and FII to the IMACmatrix were similar for pHs 6.0, 7.0, and 8.0.The elution study results showed that approximately 20% of the adsorbed FIIwas eluted at 15 mM imidazole, pH 6.0, without eluting PC. Here, the effect ofboth the pH and imidazole concentration on the adsorption and elution of PCand FII were characterized.
11.2 Instruments, Materials, and Methods
11.2.1 IMAC Matrix Preparation
Chelating Sepharose Fast FlowTM
matrix with iminodiacetic acid (IDA)(Amersham Biosciences; Piscataway, NJ) was reacted with cupric sulfatepentahydrate (Sigma-Aldrich; St. Louis, MO) to immobilize Cu2þ, followingthe manufacturer’s instruction. One mL of the settled Cu2þ immobilized matrixwas measured in a graduated cylinder and then transferred into a 15 mLcentrifuge tube (Fisher Scientific; Chicago, IL). Then the matrix wascentrifuged (Marathon 3200R; Fisher Scientific) at 4000 rpm for one minuteand the supernatant was discarded. Next, the Cu2þ immobilized matrix wasequilibrated with 10 mL of the equilibration buffer (20 mM sodium phosphatebuffer and 0.5 M NaCl) at a predetermined pH, centrifuged, and the super-natant was discarded. The pH equilibrated matrix was pre-equilibrated with1 mL of the equilibrium buffer at the predetermined pH and imidazole con-centration for ten minutes. The equilibrated Cu2þ-IDA-imidazole matrix was
Table 11.1 Half-life and amount of the homologous proteins found in CFIV-1*
PC FII FVII FIX FX
Half-life (hrs) [9,10] 8 85 5.5 22 24
Amount (mg/g CFIV-1) 100 1200 30 14 270* Modified from Rezania, et al [8].
94 J.J. Lee et al.

then divided into aliquots of 100 mL in 1.5 mL micro-centrifuge tubes (FisherScientific).
11.2.2 Adsorption and Elution of PC and/or FII
For the adsorption study, 100 mL of the equilibrated Cu2þ-IDA-imidazolematrix at predetermined conditions were reacted either with 20 mg of PC(Innovative Research; Southfield, MI), 20 mg of FII (Innovative Research), orthe mixture of 20 mg-PC and 20 mg of FII in 200 ml of an equilibration buffercondition to be tested, at room temperature (22–24 8C). The vial was gentlyvortexed for 2 seconds and then was placed on a nutating mixer (Clay Adams1
Nutator; Becton-Dickinson; Franklin Lakes, NJ) for ten minutes, and was thencentrifuged at 4000 rpm for oneminute. The protein in the supernatant after theadsorption reaction was quantified by ELISA. Following the protein adsorp-tion, thematrix was washed with 400 mL of the equilibration buffer at pH 6.0 fortenminutes and then centrifuged. The protein in the supernatant was quantifiedby ELISA.
For the elution study, the protein adsorbed matrix was reacted with 400 mLof the phosphate equilibrium buffer at a predetermined imidazole concentra-tion and pH 6.0 for ten minutes. The matrix was centrifuged and the protein inthe supernatant was quantified by ELISA. For some cases, the elution processwas repeated more than once.
11.2.3 ELISA for PC and FII
ELISA of PC and FII were performed using the procedure described by Leeet al [14]. EIA/RIA 96-well flat-bottom plate (Corning, NY) was first coatedwith a rabbit anti-human-PC Gig (Sigma; St. Louis, MO) for PC quantifica-tion, or goat anti-human-FII IgG (Boomed; Foster City, CA) for FII. For PC,the plate was washed and then blocked with BSA for 90 minutes. For FII, theplate was washed and was incubated for 90 minutes without BSA during theblocking step. After blocking, the plate was washed; the samples were applied tothe wells vertically. The samples were diluted across the plate horizontally byserial dilution in the dilution buffer, and then incubated for 90 minutes. Thenthe plate was washed and incubated for 90 minutes with a goat anti-human-PCIgG (American Diagnostica Inc.; Hauppauge, NY), or a mouse anti-human-FII IgG (Enzyme Research; Southbend, IN). Next, the plate was washed andincubated for 20 minutes with horseradish peroxidase-conjugated to a rabbitanti-goat IgG (Sigma), or horseradish peroxidase-conjugated to a goat anti-mouse IgG (Sigma). O-phenylenediamine dichloride (OPD; Sigma) was addedfor color development, and the optical density was measured at 450 nm using anELISA plate reader (Bio-Rad; Hercules, CA).
11 Manipulation of the Affinity Between Protein and Metal Ions 95

11.3 Result and Discussion
11.3.1 Effect of Imidazole and pH on the Adsorptionand Elution of PC or FII
Our previous study results showed that the pH change (6�8) alone did not
affect the adsorption of either FII or PC [14]. As a next step, the adsorption
behaviors of these proteins were studied with the changes in both the imidazole
concentration between 0 and 11 mM and the pH between 6 and 8. For each
protein, 20 mg was reacted with 100 ml of Cu2þ-IDA IMAC matrix and the
amount of the adsorbed protein was quantified (Fig. 11.1).FII adsorption decreased as imidazole concentration increased, at all pHs
[Fig. 11.1 (a)]. Also, with the presence of imidazole, as the pH increased, FII
adsorption decreased significantly. At 8 mM imidazole and pH 8.0, only 2.9 mg(14%) of FII was adsorbed. For PC [Fig. 11.1 (b)], most of the reacted PC was
adsorbed, with little difference for the pHs and imidazole concentrations tested.
At 11 mM imidazole, the amount of adsorbed PC decreased only slightly as the
pH increased. A minimal FII adsorption with good PC adsorption was shown
at 8 mM imidazole and pH 8.0.Our previous elution study result at pH 6.0 showed that, 4.1 mg (�20%) of FII
and less than 0.5 mg (3%) of PCwere eluted at both 15 and 20mM imidazole [14].
This time, the elution behavior of FII was studied at an imidazole concentration
range between 7 and 15 mM. For PC, a concentration between 20 and 40 mM
was studied because of its higher affinity to Cu2þ ions. As described above, after
the adsorption process at 8 mM imidazole and pH 8.0, the IMAC matrix
0
5
10
15
20
0 2 4 6 8 10 12Immidazole (mM)
0 2 4 6 8 10 12Immidazole (mM)
Ads
orbe
d F
II (m
icro
-g)
0
5
10
15
20
Ads
orbe
d P
C (
mic
ro-g
)
pH 6.0
pH 7.0
pH 8.0
pH 6.0
pH 7.0
pH 8.0
(a) (b)
Fig. 11.1 Amounts of adsorbed (a) FII and (b) PC in the IMAC matrix with the changes inthe imidazole concentration and the pH. 20 mg of FII or PC was reacted with 100 ml of Cu2þ-IDA matrix for 10 minutes.
96 J.J. Lee et al.

retained 2.9 mg of FII and 19.8 mg of PC. The amounts of PC and FII eluted bythe buffer at various imidazole concentrations are shown in Fig. 11.2.
At 7 mM imidazole, 1.9 mg (66%) of the adsorbed FII was eluted with only0.2 mg (1%) of PC [Fig. 11.2 (a)]. At 11 mM imidazole, the amount of eluted FIIwas slightly higher at 2.7 mg (93%), with only 0.7 mg (3%) of PC eluted. At15 mM imidazole, a similar amount of FII was eluted but 2.0 mg (10%) of PCwas also eluted. An imidazole concentration at 11 mM provided a maximalelution of FII with a minimal PC loss.
At 20 mM imidazole, 3.6 mg (18%) of PC was eluted during the 1st elutionand 2.7 mg (14%) during the 2nd elution [Fig. 11.2 (b)], resulting in only 6.3 mg(32%) of the adsorbed PC (19.8 mg). At 30 mM imidazole, the total amount ofPC eluted was 12.0 mg (60%). At 40 mM imidazole, the total PC recovered was19.3 mg (97%).
11.3.2 Effect of Imidazole and pH on the Adsorption and Elutionof the Mixture of PC and FII
With the information on the behavior of individual protein PC and FII in theIMAC process, a mixture of PC and FII at 1:1 ratio (20 mg of PC and 20 mg ofFII) was used as the source material and the IMAC process was performed.Figure 11.3 shows the amounts of adsorbed PC and FII in the IMAC matrix at8 mM imidazole, pH 8.0, when the protein mixture was reacted together withthe matrix.
During the adsorption process, 5.3 mg (26%) of FII was adsorbed, slightlymore than the amount adsorbed in the case with FII only (3.3 mg) [Fig. 11.3 (a)].The amount of adsorbed PC [Fig. 11.3 (b)] was 19.3 mg (97%), similar to theamount for the adsorption with PC only (19.8 mg). The elution process was thenperformed using 11 mM and 40 mM imidazole (Fig. 11.4).
0
5
10
15
20
7 11 15Imidazole (mM)
20 30 40Imidazole (mM)
Elu
ted
Pro
tein
(m
icro
-g)
Elu
ted
PC
(m
icro
-g)
PCFII
0
5
10
15
20 1st Elution2nd Elution
(a) (b)
Fig. 11.2 Amounts of eluted (a) PC and FII at imidazole concentrations of 7, 11, and 15 mMand (b) PC at the imidazole concentrations of 20, 30, and 40 mM from the IMACmatrix withPC or FII. The matrix adsorbed with protein at 8 mM imidazole and pH 8.0 was reacted with400 ml of the elution buffer for 10 minutes.
11 Manipulation of the Affinity Between Protein and Metal Ions 97

At 11 mM imidazole [Fig. 11.4 (a)], nearly 100% of the adsorbed FII waseluted, but 3.2 mg (16%) of PC was also eluted, showing an increase from thecase with only PC (0.6 mg). After this elution step, 16.1 mg of PC was expectedto be in the matrix. The next two elutions at 40 mM imidazole removed 13.5 mg(84%) and 1.6 mg (10%) of PC for the 1st and 2nd elution steps, respectively,with the total of 15.1 mg (94%), slightly less than that for case with PC only(97%) [Fig. 11.4 (b)]. The adsorption at 8 mM imidazole and pH 8.0, followedby an elution at 11 mM imidazole for FII, and at 40 mM imidazole for PCelution has provided an effective separation of FII from a mixture withPC when the sample is a mixture of PC and FII at a ratio of 1:1.
11.4 Conclusions
The effect of imidazole concentration and pH on the adsorption and elution ofPC and FII in IMAC operation was studied for an effective FII separation fromPC. For the adsorption process, the imidazole concentration at 8 mM and pH
0
5
10
15
20
PC or FIIMixture
Ads
orbe
d F
II (m
icro
-g)
(a)0
5
10
15
20
Ads
orbe
d P
C (
mic
ro-g
)
(b)
Fig. 11.3 Amounts of adsorbed (a) FII and (b) PC shown for each protein (20 mg PC or 20 mgFII) and for the mixture (20 mg PC with 20 mg FII). Proteins were reacted with 100 ml ofCu2þ-IDA matrix for 10 minutes at 8 mM imidazole and pH 8.0.
0
5
10
15
20
FII PC
Elu
ted
Pro
tein
(m
icro
-g)
0
5
10
15
20
Elu
ted
PC
(m
icro
-g)
PC or FII
Mixture
Non-Mixture
1st Elution
2nd Elution
(a) (b)Mixture
Fig. 11.4 Amounts of eluted (a) PC and FII at an imidazole concentration of 11 mM and (b)PC at an imidazole concentration of 40 mM.
98 J.J. Lee et al.

8.0 provided a minimal FII adsorption with a maximal PC adsorption, for bothcases with FII or PC alone and with the PC/FII mixture. At a concentration of40 mM imidazole, more than 94% of the adsorbed PCwas eluted for both casesby eluting twice. In the IMAC process for PC purification from CFIV-1, theseparation of FII from PC may be improved by selecting the suitable imidazoleconcentration and pH.
11.5 Future Study
For FII elution, the imidazole concentrations lower than 11 mMwill be studiedfor less PC loss. A mixture of PC and FII at a ratio of 1:20, which is the ratio ofPC and FII in the CFIV-1, will be studied for adsorption and elution of PCand FII.
Acknowledgment The authors thank the American RedCross (Rockville,MD) for providingCohn Fraction IV-1.
References
1. C. T. Esmon, The Anticoagulant and Anti-Inflammatory Roles of the Protein CAnticoagulant Pathway, J. Autoimmun. 15, 113–116 (2000).
2. C. T. Esmon, Protein C anticoagulant pathway and its role in controlling microvascularthrombosis and inflammation, Crit. Care Med. 29(7), 48–51 (2001).
3. D. E. Joyce, L. Gelbert, A. Ciaccia, B. DeHoff and B.W. Grinnell, Gene expression profileof antithrombotic protein C defines new mechanisms modulating inflammation andapoptosis. J. Biol. Chem. 276, 11199–11203 (2001).
4. T. Cheng, D. Liu, J. H. Griffin, J. A Fernandez, F. Castellino, E. D. Rosen, K. Fukudomeand B. V. Zlokovic, Activated protein C blocks p53-mediated apoptosis in ischemic humanbrain endothelium and its neuroprotective, Nat. Med. 9(3), 338–342 (2003).
5. D. Liu, T. Cheng, H. Guo, J. A. Fernandez, J. H. Griffin, X. Song and B. V. Zlokovic,Tissue plasminogen activator neurovascular toxicity is controlled by activated protein C,Nat. Med. 10(12), 1379–1383 (2004).
6. R.M. Bertina,Protein C and Related Proteins; Biochemical andClinical Aspects, (ChurchillLivingstone, New York, 1998), pp. 1–54.
7. D. F. Bruley and W. N. Drohan, Advances in Applied Biotechnology Series; Protein C andRelated Anticoagulants, 11 (Gulf Publications, Houston, TX 1990).
8. S. Rezania, D. G. Ahn and K. A. Kang, Separation of Protein C from Cohn FractionIV-1 by Mini-Antibody, Proceedings of the 33rd Annual ISOTT meeting 2005. Adv. Exp.Med. Biol.: Oxygen Transport to Tissue XXVIII, 599, (Maguire, D. J., Bruley, D. F.,Harrison, D. K., eds.), p. 125–132, 2007.
9. L. H. Edmunds and E. W. Salzman, Hemostatic Problems, Transfusion Therapy, andCardiopulmonary Bypass in Surgical Patients,Hemostasis and Thrombosis, 3rd ed., R. W.Colman, J. Hirsh, V. J. Marder and E. W. Salzman, (J. B. Lippincott Co, Philadelphia,1994), p. 958.
11 Manipulation of the Affinity Between Protein and Metal Ions 99

10. G. J. Broze Jr. and J. P. Miletich, Biochemistry and Physiology of Protein C, Protein S,and Thrombomodulin, Hemostasis and Thrombosis, 3rd ed., R. W. Colman, J. Hirsh,V. J. Marder and E. W. Salzman, (J. B. Lippincott Co., Philadelphia, 1994), p. 262.
11. E. S. Hemdan, Y. J. Zhao, E. Sulkowski and J. Porath, Surface topography of hisitdineresidues: A facile probe by immobilized metal ion affinity chromatography, Proceedingsof the National Academy of Science USA, 86, 1811–1815 (1989).
12. H. Wu and D. F. Bruley, Homologous human blood protein separation using immobi-lized metal affinity chromatography: protein C separation from prothrombin withapplication to the separation of factor IX and prothrombin, Biotechnol. Progr. 15, 928(1999).
13. H. Wu, D. F. Bruley, K. A. Kang, Protein C Separation form human plasma Cohnfraction IV-1 using immobilized metal affinity chromatography, Adv. Exp. Med. & Bio.:Oxy. Trans. to Tis. XX, 454, (Plenum Press, New York, 1998), pp. 697–704.
14. J. J. Lee, D. F. Bruley, and K. A. Kang, Effect of pH and Imidazole on Protein CPurification from Cohn Fraction IV-1 by IMAC, Proceedings of the 33rd AnnualISOTT meeting 2005. Adv. Exp. Med. Biol.: Oxygen Transport to Tissue XXVIII, 599,(Maguire, D. J., Bruley, D. F., Harrison, D. K., eds), p. 53–60, 2007.
100 J.J. Lee et al.

Chapter 12
Separation of Factor V Leiden Molecule,
a Mutated Form of Factor V, from Plasma
of Homozygous Patient
Samim Rezania and Kyung A. Kang1
Abstract Factor V (FV) is a coagulant in plasma. The FV molecule consists
of a heavy chain and a light chain, and Factor V Leiden (FVL) is mutated FV
at a single amino acid in the heavy chain. FVL patients are in a dangerous
hyper-coagulation state in their body. Current FVL diagnosis is done by
DNA analysis, which is expensive and time consuming. Our group has been
developing a real-time, cost effective immuno-optical biosensor for FVL
diagnosis. For the sensor development, pure FVL, which is not currently
available, is needed. Here, we have attempted FVL purification from FVL
patient’s plasma. Since plasma contains many proteins and some proteins are
structurally homologous to FV, the purification must be done by a very
specific method, such as immuno-affinity chromatography. However, an anti-
body that does not react with FV is not currently available. Because the
mutation is in the heavy chain and the amino acid sequence of the light
chain of FVL is identical to that of FV, antibodies generated against the
light chain of FV were tested for purifying FVL. Plasma was obtained from a
homozygous FVL patient. First, the plasma was pretreated by barium citrate
and polyethylene glycol 6000, to remove the vitamin K-dependent proteins,
alpha globulins, and other smaller than 6 kDa molecular weight proteins. The
yield in the process was 54%. Immuno-affinity purification of FVL from
patient plasma was then performed using an anti-FV light chain antibody
immobilized CNBr-Sepharose, and the purification yield was 25%. In sum-
mary, the antibody against the light chain of FV was able to purify the single
point mutated form of FV (FVL) from plasma with an overall yield of 14%.
The same principle can probably be used for purification of the other single
point mutated proteins.
1Samin Rezania and Kyung A. Kang, Department of Chemical Engineering, Universityof Louisville, Louisville, KY 40292.
K.A. Kang et al. (eds.), Oxygen Transport to Tissue XXIX� Springer 2008
101

12.1 Introduction
Factor V (FV) is a coagulation factor in blood plasma. It accelerates clot forma-
tion initiated by factor X in the presence of phospholipid and calcium. It consists
of a C-peptide region (Mw = 100,000), a heavy chain (Mw = 105,000), and a
light chain (Mw=74,000), and the two chains are non-covalently associated and
its total molecular weight is approximately 300,000 [1,2,3]. Activated protein C
(APC) inactivates activated FV (FVa), by cleaving the heavy chain of FVa [4] at
positions Arg306, Arg506, and Arg679. Factor V Leiden (FVL) has a single point
mutation from the arginine at the position 506 to glutamine [5]. FVLhas the same
coagulant function as FV, but due to the lack of Arg506, it is not deactivated by
APC, leading the body to a dangerous hyper-coagulating state.FVL is the most common blood coagulation disorder, present in 3–8%of the
general US and European populations [5]. Nevertheless, FVL screening is not a
routine clinical procedure. Currently, the diagnosis is made by DNA analysis,
which is complex, expensive, and time consuming [6]. Therefore, the ultimate
goal of our study is to develop a rapid, accurate, and cost-effective immuno-
biosensor to diagnose FVL.For this sensor development, both pure FVL molecule and antibodies
against FVL are needed, but neither is currently available. The only source
for FVL is FVL patient’s plasma. Since plasma contains several proteins
homologous to FVL, the purification of FVL from plasma should be done by
a highly specific method, such as immuno-affinity chromatography. The single
point mutation for FVL is in the heavy chain and the amino acid sequences of
the light chains of FV and FVL are identical. Here, commercially available
antibodies generated against the light chain of FV molecule were tested to
purify FVL from homozygous FVL patient’s plasma.
12.2 Materials, Methods, and Equipment
Unless otherwise specified, all the materials for different experiments were
purchased from Sigma-Aldrich (St. Louis, MO).
12.2.1 Pretreatment of Plasma
Normal human plasma was obtained from Sigma-Aldrich. Plasma was
obtained from a FVL homozygous patient (FVL plasma) by the plasmaphresis
procedure, following the IRB approved by the University of Louisville Human
Subjects Protection Program. The plasma was collected and was kept at –70 8Cuntil the purification process.
102 S. Rezania et al.

Before pretreatment, normal plasmawas reconstituted using 1milliliter (mL)DI water and the FVL plasma was thawed at 4 8C. Then, protease inhibitors,156.6 mg of benzamidine hydrochrolide, 50 mg of soybean trypsin inhibitor,and 25 mg of phenylmethanesulfonyl fluride per 1 liter of plasma, were added toboth the normal and patient plasma.
The plasma was then pretreated following the procedure as described byDahlback et al [3]. First, to remove Vitamin-K dependent proteins to reducethe risk formation of small amounts of thrombin or other active coagulationfactors [7], 1 M barium chloride was added dropwise to plasma at a concentra-tion of 80 mL/L-plasma, and the mixture was stirred for 1 hr. It was thencentrifuged (TJ-MI refrigerated centrifuge; Beckman Coulter; Kansas City,MO) at 6,000 g for 10 min. 40 g solid polyethylene glycol 6000 (PEG; AlfaAesar; Ward Hill, MA) was added to a liter of the supernatant, was stirred for1 hr, andwas centrifuged to remove alpha globulins, proteins smaller than 6 kDa,and reduce the sensitivity of plasma to proteolytic enzymes [8]. Then, PEG wasadded to the supernatant from the last step at a ratio of 80 g/L-supernatant. Thesolution was stirred for 1 hr and centrifuged as described above. After centrifu-gation, the supernatant was discarded and the precipitate was dissolved in Trisbuffer (pH 7.4), to a final volume of 30 mL, and was kept at –70 8C before theimmuno-affinity purification.
12.2.2 Selection of Antibody and Immuno-purification of FV/FVL
Four commercially available antibodies against the light chain of FV werepurchased from Haematologic Inc. (HTI; Essex Junction, VT), QED Inc.(QED; San Diego, CA), Biodesign International (Biodesign; Saco, MA), andFitzgerald Inc. (Fitzgerald; Concord, MA). The enzyme linked immunoassay(ELISA) for the antibody was performed as follows: Microtiter ELISA plates(Nalgen Nunc International; Roskilde, Denmark) were coated with 2 mg/mL ofthe antibodies. After blocking with 1% bovine serum albumin, FVL patientplasma was applied and a ½ serial dilution was performed. After washing theplate, horseradish peroxide conjugated antibody (HRP) was applied to thewells. Then, o-phenylenediamine dichloride (OPD) solution was addedand optical density was measured at 450 nm using an ELISA plate reader(Bio-Rad; Hercules, CA).
The two affinity chromatography matrices tested for purification wereActigel ALDTM (Actigel; Sterogene; Carlsbad, CA) and CNBr-activatedSepharoseTM 4B (CNBr; Amersham Biosciences; Piscataway, NJ). Followingthe manufactuer’s instruction, 1 mg of antibody was immobilized on 1 mL ofeach matrix, and then the matrix was packed in a chromatography column(d=0.7 cm; BioRad; Hercules, CA). The column was equilibrated with10-column volume (CV) of 0.02 M imidazole, 5.0 mM CaCl2, 0.15 M NaCl,pH 6 (Equilibrium/Washing buffer).
12 FVL Purification from Plasma 103

Themethod of immuno-affinity chromatography of FV/FVL is based on theprotocol developed by Katzmman et al [9]. The regeneration protocol wasmodified as described by Kang et al [10]. Briefly, 6 mL of pretreated plasmawas applied to the 1 mL anti-FV immobilized CNBr matrix, equilibrated withequilibration buffer as described above. The adsorption was allowed for 10 minand the column was washed with 10 CV of washing buffer. Adsorbed FV/FVLwas eluted with elution buffer containing high salt concentration (0.02 Mimidazole, 5.0 mM CaCl2, 1.2 M NaCl, pH 6.5).
12.3 Results and Discussion
12.3.1 Selection of Antibody
To select the antibody among four commercially available antibodies generatedagainst the light chain of FV, the relative affinities of the antibodies againstFVL (in FVL homozygous patient plasma) were measured by ELISA (Fig. 12.1).
The antibody fromHaematologic (HTI) showed the highest affinity and the onefrom Fitzgerald showed the lowest. Because, the affinity of ligand is usually sig-nificantly reduced during the immobilization process, HTIwas selected to test first.
12.3.2 Selection of Affinity Chromatography Gel Matrix
Two commercially available affinity chromatography gel matrices, Actigel andCNBr were tested for their FV purification efficiency. Actigel and CNBr have a5-atoms and 1-atom spacers, respectively. Our previous study results [11]
Fig. 12.1 Relative affinities of four commercially available monoclonal antibodies againstthe light chain of FV to FVL plasma.
104 S. Rezania et al.

showed that the spacer length between the antibody and the matrix can affect
the affinity of the immobilized antibody to antigen. Actigel has shown a better
performance than CNBr and, therefore, it was tested first.The HTI antibody was immobilized on Actigel as described in the Methods
section, and the immobilization efficiency was 99.2% (Table 12.1). FV purifica-
tion performance of the matrix was then tested, using 40 mg pure FV and the
amounts of FV in various fractions were quantified by ELISA (Table 12.1). Only
2.5% of FV was washed away during the washing step, but only 1% was eluted
(Table 12.1), indicating a too high affinity between the antigen and the antibody.
Therefore, the antibody showing the lowest affinity (Fitzgerald) was tested next.
With the Fitzgerald antibody, 3.8% of the FVwas washed away and 7.5% of FV
was eluted, showing a slightly better recovery, but still very high affinity. We
attempted to further reduce the affinity by using the CNBr matrix [10].The antibody immobilization efficiency to the CNBr matrix was 99.9%
(Table 12.1). The immuno-affinity chromatography for FV was again per-
formed. During the washing step, 5.5% and 6.1% of the FV was washed
away from the matrices immobilized with HTI and Fitzgerald, and the purifica-
tion yields were 2.7 and 30% (Table 12.1), showing that the combination of the
Fitzgerald antibody and the CNBr matrix provided the best performance.
12.3.3 FV Purification from Blood Plasma
As a next step, FV purification from normal plasma (5 mL) was studied.
Human plasma was pretreated as described in the Methods section and the
amounts of FV in each step were quantified by ELISA (Table 12.2).
Table 12.1 Performance of two commercially available immuno-affinity gel matrixes for FVpurification
Actigel CNBr
HTI Fitzgerald HTI Fitzgerald
Immobilization efficiency (%) 99.2� 0.28 99.9� 0.07
Washing (%) 2.5� 0.28 3.8� 0.07 5.5� 0.1 6.1� 0.07
Elution (%) 1.2� 0.13 7.5� 0.63 2.7� 0.21 30� 19
Table 12.2 Pretreatment of normal plasma before affinitypurification of FV
FractionAmount of FV(mg)
Yield(%)
Plasma (5 mL) 41.00
Barium citrate supernatant 40.04 98� 1
PEG-6000 I supernatant 31.40 76� 3
PEG-6000 II precipitate 20.00 49� 8
12 FVL Purification from Plasma 105

Then immuno-affinity chromatography of FV was performed using the pre-
treated plasma, and 1 ml of the anti-FV immobilized CNBr. The amount of FV
in each process was determined (Table 12.3). Approximately 5% of FV was
washed away during the washing step. A purification yield of 25%was achieved
for the immuno-affinity chromatography of FV from plasma (Table 12.3).
Therefore, the overall FV purification yield from plasma is approximately
13% combining the yield from the pretreatment of plasma (49%) and the yield
(25%) for the immuno-affinity purification of FV. The maximum overall yield
for FV purification from plasma reported in other references is 20% [3,4,9],
confirming that our result is similar to others.
12.3.4 FVL Purification from Homozygous Patient PlasmaUsing FV Antibody
Since the performance of the anti-FV immobilized CNBr for FV purification
was reasonable, the same procedure was used for FVL purification from the
homozygous patient plasma. The plasma was pretreated as described pre-
viously. The recovery of the FVL from the barium citrate adsorption, PEG
precipitation I, and PEG precipitation II was 93%, 89, and 54% (Table 12.4),
which was similar to the yields for the pretreatment of normal plasma. The
immuno-affinity purification of FVL showed a yield of 25%. The overall FVL
purification yield from patient plasma was found to be 14% combining the yield
from the pretreatment of homozygous plasma (54%) and the yield (25%) for
immuno-affinity purification of FVL, which was similar to that of FV.
Table 12.3 Immuno-affinity purification of FV from plasma usingCNBr
Amount of FV in thesource, mg
Washing,mg (%)
Elution,mg (%)
20 0.94 (4.7� 0.2) 5 (25� 4)
Table 12.4 Immuno-affinity purification of FVL fromFVLhomozygous patient plasma using anti-FV immobilizedCNBr
FractionAmount ofFVL (mg)
Yield(%)
Plasma 165.3
Barium citrate supernatant 153.5 93� 2
PEG-6000 I supernatant 146.7 89� 1
PEG-6000 II precipitate 92 54� 5.5
Affinity chromatography 23.2 14� 2
106 S. Rezania et al.

12.4 Conclusions
FVL is the most common hereditary, abnormal blood-coagulation disorder. Todevelop a rapid and inexpensive biosensor for FVL diagnosis, FVL moleculeswere purified from homozygous patient plasma. The immuno-affinity chroma-tography of FVL was performed using antibodies against the light chain of FV.The antibody was able to purify the single point mutated form of FV (FVL)from plasma at an overall yield of 14%. The same principle can be used topurify the other single point mutated proteins.
Acknowledgment The authors thank the National Institutes of Health (5 R21EB003485-02)for the financial support, and Dr. Sharma at the Oncology Department of the University ofLouisville for his help to obtain the plasma from a homozygous patient.
References
1. C. T. Esmon, The subunit structure of thrombin-activated factor V: Isolation of activatedfactor V, separation of subunits, and reconstitution of biological activity. J. Biol. Chem.254, 964–973 (1979).
2. W. H. Kane, P. W. Majerus, Purification and characterization of human coagulationfactor V. J. Biol. Chem. 256, 1002–1007 (1981).
3. B. Dahlback, Human coagulation factor V purification and thrombin-catalyzed activa-tion. J. Clin. Invest. 66, 583–591 (1980).
4. J. Rosing, and G. Tans, Factor V, Int. J. Biochem. 29, 1123–1126 (1997).5. E. Castoldi, J. M. Brugge, G. A. Nicolaes, D. Girelli, G. Tans, J. Rosing, Impaired APC
cofactor activity of factor V plays a major role in the APC resistance associated with thefactor V Leiden (R506Q) and R2 (H1299R) mutations, Blood 103, 4173–4179 (2004).
6. M. Wilmer, C. Stocker, B. Buhler, B. Conell, A. Calatzis, Improved distinction of factorV wild-type and factor V Leiden using a novel prothrombin-based activated proteinC resistance assay, Am J Clin Pathol. 122, 836–842 (2004).
7. R. J. Alexander, T. C. Detwiler, Quantitative adsorption of platelet glycoprotein G(thrombin-sensitive protein, thrombospondin) to barium citrate. Biochem. J. 217, 67–71(1984).
8. H. A. Donald, K. C. Ingham, Mechanism of precipitation of proteins by PolyethyleneGlycol. J. Biol. Chem. 256, 12108–1211766 (1981).
9. J. A. Katzmann, M. E. Nesheim, L. S. Hibbard, K. G. Mann, Isolation of functionalhuman coagulation factor V by using a hybridoma antibody. Proc. Natl. Acad. Sci. USA.78, 162–166 (1981).
10. K. A. Kang, D. Ryu, W. M. Drohan and C. L. Orthner, Effect of matrices on affinitypurification of protein C. Biotechnol Bioeng. 39, 1086–1096 (1992).
11. S. Rezania, D. G. Ahn, and K. A. Kang, Separation of protein C from Cohn fraction IV-1by mini-antibody, Proceedings of the Annual 2005 ISOTT meeting. Adv. Exp. Med. Biol.:Oxygen Transport to Tissue XXVIII, 599, (Maguire, D.J., Bruley, D.F., Harrison, D.K.,eds.), p. 125–132, 2007.
12 FVL Purification from Plasma 107

Chapter 13
A Simple Volume Related Model of Arterial Blood
Pressure Generation
Christopher B. Wolff1, Benn S. Gooch2, and James S. Douglas3
Abstract A single compartment model of the arterial circulation was used togenerate an arterial blood pressure waveform from pre-determined strokevolume (SV) and arterial resistance (R). With fixed stroke volume and varyingresistances blood pressure waveforms showed mean values proportional toresistance but amplitude lessening with higher pressure; the amplitude of thehypothetical volume waveform of the arterial system was the same for allresistance values. Where SV varied and R changed reciprocally, the waveformwhen analysed with the PulseCOTM algorithm gave estimates slightly higherthan the input stroke volumes (r 0.9998; y = 0.99xþ 5.28 ml). Where SV variedwith fixed Rmean blood pressure varied with stroke volume; SV estimates were,again, slightly higher than the input stroke volumes (r 0.9994; y= 0.986xþ 6.04ml). Estimates of SV andR fromValsalvamanoeuvre BPwere used in themodelto generate arterial blood pressure. SV estimates closely resembled the originalmodel values (r 0.988; y = 1.0802x – 3.9251). The model appears capable ofgenerating BP waveforms compatible with real BP waveforms since strokevolume estimates closely resemble the original stroke volumes used in themodel.
13.1 Introduction
An algorithm, utilized commercially (PulseCOTM) to derive stroke volume fromarterial blood pressure includes, as part of the procedure, an equation for thegeneralized compliance properties of the arterial tree. It is assumed that thearterial volume, V, is related to the arterial blood pressure, P, according tothe relationship:
1Clinical Pharmacology & Anaesthetics, William Harvey Research Institute, Barts and TheRoyal London, Charter House Square, London, UK, EC1M 6BQ.2St. George’s, University of London, Cranmer Terrace, London, UK, SW17 ORE.3LiDCO Ltd, Unit M, South Cambridge Business Park, Babraham Road, Cambridge, UK,CB2 4JH.Corresponding author: Christopher B. Wolff, e-mail: [email protected]
K.A. Kang et al. (eds.), Oxygen Transport to Tissue XXIX� Springer 2008
109

V ¼ 250ð1� eð�0:0092PÞÞ (13:1)
This allows calculation of a putative arterial volume waveform. The oscillationaround its mean value is subjected to an autocorrelation manoeuvre. The derivedauto-covariance gives an objective cardiac period and its amplitude is deemedrelated to the square of the stroke volume. Cardiac output values are displayedbeat-by-beat. Since subjects vary in size and in their precise arterial wall propertiesa static, absolute, value of cardiac output is obtained intermittently by ‘dye’dilution (Lithium chloride, LiDCOTM) in order to obtain an individual scalingfactor. In effect, the scaling factor (or calibration), simply adjusts the value of 250in the equation above. The algorithm has been validated against Lithium dilutioncardiac outputmeasurement in a number of studies [1–3], and reviewedbyRhodesand Sunderland [4]. Further within-subject/patient validation is underway.
A single compartment model is presented here which includes the aboveassumption about the compliance properties of the arterial system. The inputto the system consists of stroke volume increments fed in 1/100th second at a timeand account is taken of the volume already present in the previous1/100th second, outflow (in the previous 1/100th second) and arterial resistance.This allows generation of an arterial blood pressure waveform. Figure 13.1 showsthe single arterial compartment diagrammatically, with a boundary at zeropressure and another shown for the larger volume which will accompany a finitearterial blood pressure. Details of the computations are given in the next section.
13.2 Model
Themodel arterial blood pressure is generated 1/100th second at a time. Incrementsof stroke volume (v, column D in Fig. 13.2) are added to a volume compartment(column E) to which the previous volume is added. The latest cardiac output
Fig. 13.1 The whole arterial compartment is represented as a single vessel with access fromthe heart and outflow to the periphery. ‘SV in’ represents the input, which will consist ofincrements adding up to the stroke volume during systole and a sequence of zeros during thetime representing diastole. Cardiac output is continuous.
110 C.B. Wolff et al.

increment (‘Outflow’, column G) is subtracted from the total. The volume, V, here
is the excess above the volume of the arterial system when blood pressure is
zero (atmospheric).Hence for the volume column:
Vn ¼ vn þ Vðn�1Þ � qðn�1Þ (13:2)
To obtain the arterial blood pressure corresponding to this volume the equation
for volume from blood pressure P (1) is reversed becoming:
P ¼ 108:7� lnð1� V=250Þ (13:3)
This is applied in columnF inFig. 13.2. For thismodel outflow, q, for each 1/100th
second is derived in column G from P/R where R is arterial resistance (column
H). The model includes starting conditions (all zeros here, in line 8) and, next,
Fig. 13.2 Starting conditions are given in an initial line (line 8 in this instance).Equations to calculate volume (V), arterial blood pressure (P) and blood flow (q) arepresent in line 9 in columns E, F and G respectively. V, P and q are calculated fromstroke volume and resistance on the basis of several simple assumptions outlined in thetext and embodied in the equations. The equations utilise stroke volumes in column Dand values for arterial resistance in column H to generate values for the excess volume(V, above the volume at zero pressure), arterial blood pressure and cardiac output; theyare applied to successive lines of the spreadsheet. Values soon reach a steady state wherethe arterial pressure oscillations and cardiac output are reproduced with every cycle (asin lines 341 to 353).
13 A Simple Volume Related Model of Arterial Blood Pressure Generation 111

the first line of equations (line 9 in this example). Each row represents 1/100thsecond (column C).
Cardiac output is normally expressed as l min–1 so the values in columnG foroutflow (ml per 0.01 s) are 1/6th (1000/(60 � 100)) of the usual units. Hence,cardiac output is obtained from column G using a factor 6 to scale it up fromml/0.01s to l min–1.
A variety of different situations will be examined:
1. A single stroke volume of 100ml will be entered into the model with differentarterial resistance values to see the effect on themodel arterial blood pressureand excess volume.
2. A range of stroke volumes (50, 80, 100, 120 and 150 ml will be entered intothe model with the same value for arterial resistance (100 mm Hg per (ml/0.01s)); this will be expected to lead to mean blood pressures which increaseas stroke volume increases.
3. The same range of stroke volumes will be entered into the model but withreciprocal values of arterial resistance; this is expected to give a constantvalue for the mean arterial blood pressure. For example, for 100 ml strokevolume the resistance entered will be 100mmHg per (ml/0.01s) and for 50mlthe resistance will be 200 mm Hg per (ml/0.01s).
4. The blood pressure records from situations 2. and 3. will be analysed with thePulseCOTM algorithm to give estimates of stroke volume and these will becompared with the values originally entered into the model.
5. The arterial blood pressure recorded before during and after a Valsalvamanoeuvre will be analysed to give estimates of stroke volume, cardiac inter-val and arterial resistance beat-by-beat. These values will be entered into themodel to attempt regeneration of the original blood pressure waveform.
6. The blood pressure record generated by situation 5 will again be analysed togive beat-by-beat stroke volume estimates from the models blood pressureoutput. These will be compared with the values entered into the model.
Since the situation at any given time interval (of 100th s) depends solely on thevalues in the model for the present (SV) and immediately previous (100th s) timeinterval the starting conditions can be finite (they don’t have to be zero); so onecan enter known values from an existing steady state after which the outcomeblood pressure will depend upon the stroke volume and resistance valuesentered into the model.
13.3 Results
13.3.1 Constant SV, Varying R
The overall arterial compliance curve is depicted in Fig. 13.3 (left hand panel).The arterial blood pressure and volume changes resulting from changing
112 C.B. Wolff et al.

peripheral resistance, with a constant stroke volume of 100 ml, are shown in themiddle and right hand panels respectively.
13.3.2 Varying Stroke Volume
Arterial pressure waveforms were generated by the model with stroke volumesvarying between 50 ml and 150 ml. They were then analysed by means of thePulseCOTM algorithm to give estimates of stroke volume which were plottedagainst the original model values. The results are shown in Fig. 13.4.
Plot A shows where arterial resistance was constant (100 (mmHg/(ml/.01s))with proportional changes in mean blood pressure; plot B shows the SV resultswhere resistance was changed inversely with stroke volume so that the arterialmean pressure was constant.
Plots C and D show the differences between SV estimates from the modelblood pressure and the original SV values; the differences in ml. are shown inC and then these are shown as a percentage of the original values in plot D.
Table 13.1 gives SV values entered in the model (‘imposed SVs’) and resis-tances used (fixed resistances, A; reciprocally varying resistances, B). SV esti-mates are also given.
13.3.3 A Valsalva Manoeuvre Blood Pressure Record – SVEstimates Used in the Model
Stroke volumes and cycle lengths were estimated from arterial blood pressurerecorded before during and after a Valsalva manoeuvre (Fig. 13.5, left handpanel). Arterial Mean BP and cardiac output were then used to calculate beat-by-beat arterial resistance. These stroke volume and resistance values were then
Fig. 13.3 Left panel: the compliance relationship between excess arterial volume (the volumeabove that where BP is zero) to the arterial blood pressure – a saturating exponential(1) above. Middle panel: blood pressure output from the model for constant stroke volume(SV, 100ml), with three different arterial resistances (units, mmHg per (ml. 0.01s�1)). There isa progressive increase in mean blood pressure and in the arterial pressure oscillations asresistance increases. Right hand panel: the volume oscillations are of constant amplitudedespite increases in the mean value; otherwise the algorithm to derive SV from blood pressurewould give different stroke volumes.
13 A Simple Volume Related Model of Arterial Blood Pressure Generation 113

Fig. 13.4 This shows the results of estimating stroke volume by means of the PulseCOTM
algorithm from arterial blood pressure waveforms generated by the model; the model strokevolumes were 50, 80, 100, 125 and 150 ml. A. Varying stroke volume with a fixed resistance ;B.Varying stroke volumewith reciprocal resistance values (seeTable 13.1). Errors are shown inCandD, expressed as differences inml. and inD expressed in percentage terms.
Table 13.1 Stroke volumes and resistances imposed on the model and stroke volume valuesderived from the resulting model blood pressure records
A B
Imposed SV(for model) (ml)
FixedResistance(mmHg/(ml/.01s))
DerivedSV (ml)
ReciprocalResistance(inverse of SV)(mmHg/(ml/.01s))
DerivedSV (ml)
50 100 53.0 200 53.3
80 100 84.5 120 84.4
100 100 105.1 100 104.6
125 100 129.3 80 129.1
150 100 151.4 66.7 152.7
114 C.B. Wolff et al.

used to run the model thereby generating a model blood pressure record. Strokevolumes were again estimated, this time from the blood pressure generated by themodel.
Figure 13.5 shows the original arterial blood pressure record on the left withstroke volume estimates from it and, on the right, the model derived bloodpressure and stroke volumes estimated from it. The lower panel shows thestroke volume estimates from the model blood pressure plotted against thestroke volume estimates from the original Valsalva BP record.
13.4 Discussion
Themodel generates a blood pressure waveform on the basis that stroke volumeenters the model’s arterial compartment intermittently. Expansion is less thanstroke volume because of simultaneous outflow (cardiac output) at the
0
50
100
150
200
0 10 20 30 40 50 60Time (s, 100Hz)
BP
& S
V (
mm
Hg
& m
l)
0
50
100
150
200
0 10 20 30 40 50 60Time (s, 100Hz)
BP
& S
V (
mm
Hg
& m
l)
Single Cycle SV
BP (mm Hg)BP from ModelSV from Model BP
y = 1.08x – 3.925r = 0.988
020406080
100120140160
0 50 100 150SV from Original Valsalva (ml)
SV
from
Mod
elV
alsa
lva
(mm
Hg)
Fig. 13.5 Above left: Arterial blood pressure recorded before during and after a Valsalvamanoeuvre (forced expiration against a closed airway for 10s) with stroke volumes beat bybeat, derived using a true single cycle version of the PulseCOTM algorithm (under devel-opment). Above right: Blood pressure waveform derived by the model from stroke volumeestimates and arterial resistance calculated from the original Valsalva manoeuvre (L panel).Again, (R panel) stroke volume estimates are shown, this time derived from the modelblood pressure. Below: The relationship between the stroke volume estimates from themodel version of the blood pressure and the estimates from the original blood pressure(y = 1.08x – 3.925; r = 0.988).
13 A Simple Volume Related Model of Arterial Blood Pressure Generation 115

periphery.5 The outflow, in turn, depends upon the arterial blood pressure (BP).The blood pressure again depends upon the extent to which the arterial volumeexceeds the volume which would be occupied at zero pressure (atmospheric).The curvilinear pressure dependency upon this ‘excess’ volume is represented by(1) and (its reverse) (3), the relationship illustrated in the left-hand panel ofFig. 13.3.
The PulseCOTM algorithm, working on blood pressure waveforms generatedby the model from a wide range of stroke volumes, regenerates stroke volumessimilar to those originally put into the model (imposed volumes). Derivedvolumes are around 3–4% greater than imposed volumes, presumably in some-way due to the effect of the PulseCOTM algorithm’s inclusion of auto-covariance of the volume converted blood pressure. The volume conversioncan be seen to compensate for reduced arterial volume expansion at higherpressures (right hand panel of Fig. 13.3).
The similarity of derived stroke volumes to input stroke volumes underliesthe close similarity of the original and model derived arterial blood pressurewaveforms (Fig. 13.5). One obvious difference, however, is the lack of areflected wave in the model derived blood pressure wave-form, as illustratedin Fig. 13.6 below. Here we see the original waveform with evidence of areflected wave, the model only showing a smooth descent during the diastolicphase.
Validation of PulseCOTM [4] requires further support in the individual butthe near agreement between the model and PulseCOTM (to the extent ofPulseCOTM validation to date) supports the assumptions of the model. Theassumptions made to derive the model are not new; they can be found in thepapers of Remington, Hamilton andDow [5] and Remington andHamilton; [6]authors who, at that stage (1945), could not test their hypotheses readily withcomputers as illustrated here. It is hoped that the model will be of value indeveloping hypotheses concerning circulatory dynamics.
6080
100120140160180
0 1 2 0 1 23 4 5 6 7 8Time (s)
BP
(m
m H
g)
BP
(m
m H
g)
Valsalva (notch)BP from Model
6080
100120140160180
Time (s)
Valsalva (notch)BP from Model
Fig. 13.6 A short section of the early part of original Valsalva manoeuvre blood pressurerecord, prior to the actual manoeuvre with the output from the model. On the left is an 8second sequence with the presence of a dicrotic notch apparent in the original waveform(bold). The model blood pressure lines are thinner. In the right hand panel just over 2 cyclesare shown and the dicrotic notch in the original record is more obvious. The model outputshows a smooth decay.
116 C.B. Wolff et al.

13.5 Competing Interests
Christopher Wolff and James Douglas act as consultants to LiDCO who holdthe patent for the commercial use of the PulseCOTM algorithm.
References
1. T. T. Hamilton, L. M. Huber and M. E. Jessen, PulseCO: a less-invasive method tomonitor cardiac output from arterial pressure after cardiac surgery. Ann. Thorac. Surg.74, S1408–S1412 (2002).
2. M.M. Jonas and S. J. Tanzer, Lithium dilutionmeasurement of cardiac output and arterialpulse waveform analysis: an indicator dilution calibrated beat-by-beat system for contin-uous estimation of cardiac output. Curr. Opin. Crit. Care 8, 257–261 (2002).
3. R. M. Pearse, K. Ikram, and J. G. Barry, Equipment review: an appraisal of theLiDCOTMPlus method of measuring cardiac output. Crit. Care 8, 190–195 (2004).
4. A. Rhodes and R. Sunderland, Arterial pulse power analysis: the LiDCOTM system. In,Functional HemodynamicMonitoring Update in Intensive Care and EmergencyMedicine 42,edited by M. R. Pinsky and D. Payen (Springer-Verlag, Heidelberg, 2005), pp. 183–192.
5. J. W. Remington, W. F Hamilton and P. Dow, Some difficulties involvedin the predictionof the stroke voume from the pulse wave velocity. Am. J. Phyiol. 144, 536–545 (1945).
6. J. W. Remington and W. F Hamilton, The construction of a theoretical cardiac ejectioncurve from the contour of the aortic pressure pulse. Am. J. Phyiol. 144, 546–555 (1945).
13 A Simple Volume Related Model of Arterial Blood Pressure Generation 117

Part IV
Tumor, Cancer and Oncology

Chapter 14
Strikingly High Respiratory Quotients:
A Further Characteristic of the
Tumor Pathophysiome
Peter Vaupel1
Abstract Conspicuously high respiratory quotients (RQs) are found in solidtumors in vivo. RQs in the range between 1.29 and 1.95 neither reflect thedegree of substrate oxidation by tumor cells nor indicate the types of fuelsinvolved in metabolic processes. Instead, such tumor RQs most probably arecaused by (a) channeling of glycolytic end-products into lipogenesis, and by(b) CO2 release from the tumor following extracellular buffering of Hþ-ionsby bicarbonate. Hþ-ions exported from the intracellular space into the inter-stitial compartment titrate extracellular bicarbonate to CO2 and H2O with theaid of the ectoenzyme carbonic anhydrase IX, which is activated at low pH.Strikingly high (RQs) may thus be a further characteristic of the tumormicroenvironment and of the tumor (patho-)physiome, the latter quantita-tively describing the pathophysiologic characteristics of tumor cells and solidtumors.
14.1 Introduction
An indication of the types of fuels involved in metabolic processes is given bythe respiratory quotient: RQ = CO2 output/O2 uptake. If the fuel is purecarbohydrate, the RQ = 1.0, for fat breakdown it is 0.7 [1,2]. In exceptionalcases, the RQ can be outside the range of 0.7 – 1.0. It becomes greater than1.0 when excess carbohydrates are consumed, so that fat stores are builtup [1]. Moreover, extremely high RQ values are (temporarily) found in theearly stages of a voluntary hyperventilation or when metabolic acidosis devel-ops. In these cases, respiratory CO2 output is greater than the metabolic CO2
formation, so that the RQ values briefly rise above 1.0 (in some cases to asmuch as 1.5) [1].
1Institute of Physiology and Pathophysiology, University of Mainz, Duesbergweg 6, 55099Mainz, Germany.
K.A. Kang et al. (eds.), Oxygen Transport to Tissue XXIX� Springer 2008
121

Enhanced lipogenesis has been described for tumor cells [3,4] and data have
recently been communicated that glycolytic end-products can be channeled into
lipogenesis in certain cancer models [5–7]. In this case, RQ values should greatly
exceed the upper end of the reference range. To test this, a critical evaluation of
in vivo data has been performed, and indeed excessively high RQ values have
been calculated for experimental tumors in vivo.
14.2 Material and Methods
RQ values have been calculated from venous-arterial CO2 concentration differ-
ences and arterio-venous O2 concentration differences under steady state con-
ditions. In vivo tumor models include experimental isotransplants in the rat [8]
and xenografted human tumors in immunodeficient rnu/rnu-rats [9,10].
14.3 Results
Taking into account steady-state arterial and venous O2 and CO2 concentra-
tions in tissue-isolated preparations, strikingly high RQ values of 1.91 have
been calculated for experimental DS-sarcomas in SD-rats, and RQ values
between 1.29 and 1.95 for xenografted human carcinomas in nude rats (see
Table 14.1).
Table 14.1 Arterial (art.) and venous (ven.) O2 and CO2 concentrations (cO2 and cCO2,respectively), concentration differences (�c), RQ values of experimental DS-sarcoma (DS-Sa)isotransplants in rats, and xenografted human breast and lung cancers in immunodeficientrnu/rnu-rats. Data are compared to normal (granulation/fat) tissue using a comparable tissue-isolated preparation. RQ = �cCO2/�cO2
Tumor
cO2
(ml/dl)�cO2
(ml/dl) cCO2(ml/dl)�cCO2
(ml/dl) RQ Ref.art. ven. art. ven.
DS-Sa
(rat)
16.40 10.85 5.55 42.8 53.4 10.6 1.91 [8]
Breast Ca.
(human)
16.40 9.70 6.70 45.0 58.0 13.0 1.95 [9]
Breast Ca.
(human)
16.60 9.27 7.31 47.0 57.7 10.7 1.46 [10]
Lung Ca.(human)
17.30 12.50 4.80 48.0 54.2 6.2 1.29 [9]
Granulationtissue
18.47 12.77 5.70 48.0 52.2 4.2 0.74 [10]
122 P. Vaupel

14.4 Discussion
In vitro studies described by Dickens and Simer [11] on tumor slices revealed
RQ values distinctly below 1.0 (RQ= 0.82 – 0.91) which were associated with a
high rate of glycolysis. These authors reasoned that in tumors, carbohydrate
oxidation is limited by a defective mechanism for oxidation of glycolysis pro-
ducts, agreeing fundamentally with Warburg’s idea of an impaired respiration
in tumor cells [12,13]. However, there are several reasons why this hypothesis no
longer seems tenable [6,7,14–16].In contrast to Dickens and Simer [11], strikingly high RQ values are found in
experimental tumors under in vivo conditions. These data may be explained by
(at least) two mechanisms: (1) channeling of glycolytic endproducts into lipo-
genesis (i.e., conversion of carbohydrate to fat) which is known to yield RQ
values above unity, and (2) hypoxia-induced upregulation of genes that can
induce proteomic changes and that allow malignant cells to adapt to their O2-
deprived metabolic state (see Fig. 14.1).
Fig. 14.1 Hypoxia-mediated metabolic adaptation for energy preservation. Activation ofgenes for glucose transporter-1 (GLUT-1 = 1) and glycolytic enzymes yields an increasedglycolytic rate. Hþ-ions produced are preferentially exported via a Naþ/Hþ-antiporter(NHE-1 = 2) and a lactate�/Hþ-symporter (monocarboxylate transporter MCT-1 = 3)leading to a drop in extracellular pH (pHe). Low extracellular pH activates the membrane-bound ectoenzyme carbonic anhydrase IX (CA IX= 4). HIF-1a=hypoxia-inducible factor1a, PHDs = prolyl hydroxylases, FIH = asparagyl hydroxylase, lac�= lactic acid.
14 Strikingly High Respiratory Quotients 123

Over expression of GLUT-1 and of glycolytic enzymes in hypoxia facilitatescellular glucose uptake and enhances the capacity of tumor cells to catabolizeglucose at even higher metabolic rates than those found under normoxic con-ditions. Overproduction of lactic acid is a mandatory consequence. To surviveand proliferate, cells extrude Hþ-ions via transporters to maintain a physiolo-gical intracellular pH, promoting extracellular acidification. The latter,together with a HIF-1a-induced upregulation of the membrane-bound ectoen-zyme carbonic anhydrase (CA IX), finally leads to buffering of the exportedprotons by extracellular bicarbonate causing an intensified CO2 release accord-ing to the following equation [17]
Hþ þHCO�3 ! H2Oþ CO2 (14:1)
Total CO2 output is thus greater than the metabolic formation of CO2 fromsubstrate oxidation. Conspicuously high RQs in solid tumors thus do not reflectthe degree of substrate oxidation in tumor cells. Besides glycolysis, an intensifiedHþ-production results from substantial ATP hydrolysis, glutaminolysis andketogenesis [18,19].
Experimental evidence for this latter notion are very high CO2 partialpressures (79mmHg) and low bicarbonate concentrations (19 mmol/l) foundin the interstitial fluid of solid tumors compared to arterial blood (pCO2 = 40mmHg, bicarbonate concentration = 23–24 mmol/l) [20,21]
14.5 Conclusions
Strikingly high RQ values have been calculated for solid tumors in vivo. Mostprobably these are caused by (i) channeling of glycolytic end-products intolipogenesis, and (ii) buffering of exported Hþ-ions from the intracellularspace to the interstitial compartment. Acidosis-mediated activation of mem-brane-bound CA IX finally yields an intensified (‘‘non-metabolic’’) CO2 releasefrom the tumor tissue. Conspicuously high RQs may thus be a further char-acteristic of the tumor pathophysiome.
In this context, the term ‘‘tumor pathophysiome’’ (in analogy to thephysiome [22,23] and tumor metabolome [24] ) is coined to quantitativelydescribe the (patho-)physiological dynamics and functional behavior of solidtumors in vivo, the quantitative evaluation and description of the tumor micro-environment included.
References
1. G. Thews and P. Vaupel, Autonomic Functions in Human Physiology (Springer, Berlin,Heidelberg, 1985).
2. W.F. Boron, Ventilation and perfusion of lungs, in: Medical Physiology, edited by W.F. Boron and E.L. Boulpaep (Saunders, Philadelphia, 2003).
124 P. Vaupel

3. M. Loffler and F. Schneider, Lipogenesis in Ehrlich ascites tumor cells under anaerobicculture conditions, J. Cancer Res. Clin. Oncol. 95, 115–122 (1979).
4. F.P. Kuhajda, Fatty acid synthase and cancer: New application of an old pathway,Cancer Res. 66(12), 5977–5980 (2006).
5. K. Uyeda and J.J. Repa, Carbohydrate response element binding protein, ChREBP, atranscription factor coupling hepatic glucose utilization and lipid synthesis,CellMetabol.4(2), 107–110 (2006).
6. G. Hatzivassiliou, F. Zhao, D.E. Bauer, C. Andreadis, A.N. Shaw, D. Dhanak,S.R. Hingorani, D.A. Tuveson, and C.B. Thompson, ATP citrate lyase inhibitioncan suppress tumor cell growth, Cancer Cell. 8(4), 311–321 (2005).
7. T. Bui and C.B. Thompson, Cancer’s sweet tooth, Cancer Cell. 9(6), 419–420 (2006).8. P. Vaupel, Atemgaswechsel und Glucosestoffwechsel von Implantationstumoren
(DS-Carcinosarkom) in vivo, Funktionsanalyse biolog. Systeme 1, 1–138 (1974).9. F. Kallinowski, K.H. Schlenger, S. Runkel, M. Kloes, M. Stohrer, P. Okunieff, and
P.Vaupel, Tumor blood flow: The principal modulator of oxidative and glycolyticmetabolism, and of the metabolic micromilieu of human tumor xenografts in vivo,Int. J. Cancer 44, 266–272 (1989).
10. S. Runkel, Durchblutung, O2-Verbrauch und Substrat-Umsatzraten xenotransplantier-ter menschlicherMammakarzinome, Dr. med. Thesis, Faculty ofMedicine, University ofMainz (1988).
11. F. Dickens and F. Simer, The metabolism of normal and tumour tissue. II. The respira-tory quotient, and the relationship of respiration of glycolysis, Biochem. J. 24, 1301–1326(1930).
12. O. Warburg, The Metabolism of Tumors (Arnold Constable, London, 1930).13. O. Warburg, On the origin of cancer cells, Science 123, 309–315 (1956).14. S. Weinhouse, On respiratory impairment in cancer, Science 124, 267–268 (1956).15. X.L. Zu and M. Guppy, Cancer metabolism: facts, fantasy, and fiction, Biochem.
Biophys. Res. Comm. 313, 459–465 (2004).16. V.R. Fantin, J. St-Pierre, and P. Leder, Attenuation of LDH-A expression uncovers a link
between glycolysis, mitochondrial physiology, and tumor maintenance,Cancer Cell. 9(6),425–434 (2006).
17. J. Piiper, Physiologie der Atmung, in:Atmung, Physiologie desMenschen, Vol. 6, edited byO.H. Gauer, K. Kramer, and R. Jung (Urban & Schwarzenberg, Munchen, Berlin, Wien,1975), pp. 1–159.
18. P. Vaupel, Tumor microenvironmental physiology and its implications for radiationoncology, Semin. Radiat. Oncol. 14(3), 198–206 (2004).
19. P. Vaupel, Abnormal microvasculature and defective microcirculatory function in solidtumors, in: Vascular-targeted Therapies in Oncology, edited by D.W. Siemann (Wiley& Sons, Chichester, UK, 2006), pp. 9–29.
20. P.M. Gullino, Techniques for the study of tumor physiopathology, in:Methods in CancerResearch, edited by H. Busch (Academic Press, New York, 1970), pp. 45–91.
21. P.M. Gullino, Extracellular compartments of solid tumors, in: Cancer Vol. 3, edited byE.F. Becker (Plenum, New York, 1975), pp. 327–354.
22. P.J. Hunter and T.K. Borg, Integration from proteins to organs: the Physiome Project,Nat. Rev. Mol. Cell Biol. 4(3), 237–243 (2003).
23. J.B. Bassingthwaighte, Strategies for the Physiome Project, Ann. Biomed. Engin. 28(8),1043–1058 (2000).
24. S. Mazurek and E. Eigenbrodt, The tumor metabolome, Anticancer Res. 23, 1149–1154(2003).
14 Strikingly High Respiratory Quotients 125

Chapter 15
Endogenous Hypoxia Markers: Case Not Proven!
Arnulf Mayer1, Michael Hockel2, and Peter Vaupel3
Abstract The pivotal role of hypoxia within the pathophysiological frame-
work of solid malignant tumors is now considered to be indisputable. The fact
that hypoxia can cause resistance to various cancer therapies and promote
malignant progression is reflected in its adverse impact on prognosis which is
repeatedly shown for various tumor entities. Knowledge in this area is based
on direct assessment of the oxygenation status using O2-sensitive microsen-
sors. However, weaknesses of this standard method are its invasiveness and
limitation to accessible tumor entities. Hypoxia-inducible factor (HIF)-1a, themaster transcriptional regulator of the hypoxic response, as well as certain
downstream genes, e.g., glucose transporter (GLUT)-1 and carbonic anhy-
drase (CA) IX, have been considered to be suitable as surrogate biomarkers of
hypoxia due to their tight regulation by O2 levels under certain, well-defined
in vitro conditions. The fact that statistical correlations between the expres-
sion of these proteins and direct pO2 measurements in the clinic have been
sporadically reported seemed to support their role as ‘‘endogenous hypoxia
markers’’. Remaining disparities were mainly attributed to the influence of
tumor heterogeneity. In a series of studies, we have addressed this question by
examining the expression of HIF-1a, GLUT-1 and CA IX in tissue micro-
areas where direct O2 measurements had previously been carried out, so that
the influence of tumor heterogeneity could be reduced to a minimum. Using
this methodology, no correlation between the expression of ‘‘endogenous
hypoxia markers’’ and direct pO2 measurements could be found. In conclu-
sion, while there may be a stringent association between these markers and the
oxygenation status under standardized in vitro conditions, this is not transfer-
able to the clinical assessment of oxygenation status in patients. The term
‘‘endogenous hypoxia markers’’ should therefore be avoided, at least in the
clinical oncology setting.
1Institute of Physiology and Pathophysiology, University of Mainz, 55099 Mainz, Germany.2Department of Gynecology and Obstetrics, University of Leipzig, 04103 Leipzig, Germany.3Institute of Physiology and Pathophysiology, University of Mainz, 55099 Mainz, Germany.
K.A. Kang et al. (eds.), Oxygen Transport to Tissue XXIX� Springer 2008
127

15.1 Introduction
Themicroenvironment ofmalignant tumors is characterized by extensive areas oflocal hypoxia leading to therapeutic resistance [1] and hypoxia-inducedmalignantprogression [2,3]. The latter is multifactorial, being the common end result ofhypoxia-driven gene expression, mutation and clonal selection. These processeslead to, e.g., enhanced invasive capacity [4,5], tendency tometastasize [6,7], radio-resistance [8] and chemoresistance [9,10]. Since hypoxia is the consequence of aninadequate and malfunctional microvasculature, hypoxic regions may addition-ally indicate areas inaccessible to cytostatic agents and could therefore become‘‘phenotypically’’ chemoresistant [11]. Interactions of hypoxia with other aspectsof the microenvironment (e.g., acidic extracellular pH, elevated interstitial fluidpressure) significantly add to these phenomena. The clinical relevance of thesemechanisms is reflected in a poor prognosis in patients with hypoxic tumors ofvarious entities [2,12–19]. These data have been acquired using O2-sensitivemicrosensors (Eppendorf pO2 histography) in the clinical setting. However,important drawbacks of this method include its invasive nature and a limitedapplicability due to its restriction to tumors accessible to needle electrodes.
Hypoxia-induced gene expression is controlled primarily by a small set of hetero-dimerichypoxia-inducible(transcription)factors(HIFs).HIF-1wasdescribedfirst[20]andremains themost importantprotein inthisgroup.Innormoxia,HIF-1a ishydro-xylatedatcertainconservedprolylresidues[21,22].Conformationalchangesinducedbythis modification allow for recognition by the von Hippel-Lindau protein (pVHL),which is part of an E3 ubiquitin ligase complex [23]. Ubiquitin labeling results inproteasomaldegradationandthusinlowHIF-1alevelsundernormoxia.Thisdegrada-tion process is interrupted under hypoxic conditions, since the activity of the prolylhydroxylases(PHDs)requiredforthisprocessisoxygen-dependent.
Manytumor-relevantmechanismsare triggeredbyhypoxia through theactionofHIF-1targetgenes,ofwhichapprox.70arecurrentlyknown [24].Inadditiontoitsroleintumorpathophysiology,HIF-1aanditstargetgenesGLUT-1andCAIXhavebeenproposedas‘‘endogenousmarkers’’oftumorhypoxia.Markersofthistypewouldnotonly be able to circumvent problems associatedwith themicrosensor technique, butwouldalsopermitoxygenation status assessment inarchival paraffinmaterial.
The association of expression levels of potential endogenous hypoxia mar-kers HIF-1a, GLUT-1 and CA IX with the oxygenation status is well estab-lished in vitro. The aim of the present report was therefore to review the validityof these markers in the clinical setting.
15.2 Hypoxia-inducible Factor-1 (HIF-1)
HIF-1a protein levels in cultured cells are tightly regulated by hypoxia. Eleva-tion of HIF-1a protein by hypoxic inhibition of PHD activity as well asdegradation following reoxygenation are both rapid processes. In HeLa cells,
128 A. Mayer et al.

detectable levels of HIF-1a are reached within 2min of exposure to hypoxia andexhibit a half-life of approx. 8 min upon reoxygenation [25]. The O2 concentra-tions at which accumulation starts are below 5%, with half-maximal inductionat 1.5% and maximal at 0.5% in these cells [26]. The in vivo situation, however,is less clear. Immunohistochemical staining of HIF-1a is typically found toincrease as a function of distance from microvessels within the tumor stroma,but a diffuse pattern has also been observed in some cases [27]. Reportedcorrelations of immunohistochemical HIF-1a expression with data obtainedfrom electrode measurements in patients were weak [28] or even very weak [29].This lack of a stringent association between the two assays was attributedto tumor heterogeneity. To test this hypothesis, HIF-1a staining byimmunohistochemistry was assessed in biopsy specimens of O2 electrode tracks.Using this methodology, both analyses were performed in almost identicaltissue microareas. No correlation between HIF-1a expression and the directlymeasured oxygenation status could be found [30].
Both methodological and biological factors may help to explain this finding.Immunohistochemical detection of HIF-1a is often performed with a biotinyl-tyramide-based, signal-amplifying detection system [28,30–32], which is moredifficult to standardize than the conventional ABC-technique and may yieldhigh background staining. Immediate fixation of specimens, a necessary stepdue to the rapid degradation kinetics of HIF-1a, is not always part of routinepathology procedures. Additionally, the choice of fixation media and fixationtimes has been reported to severely influence results [28].
The stabilization of HIF-1a can also be triggered by microenvironmentalfactors other than hypoxia. Extracellular acidosis, a further hallmark of thehostile tumor micromilieu, has been shown to result in inhibition of pVHLubiquitin-ligase activity, leading to normoxic HIF-1a stabilization [33]. Pyru-vate and lactate, end products of glycolytic metabolism, have also been shownto stabilize HIF-1a [34]. Both elevated [35] and lowered [36] tissue glucoseconcentrations can prevent hypoxic HIF-1a stabilization.
It has long been recognized that HIF-1a expression can occur secondary tothe activation of signaling pathways by growth factors or by mutations withinthese cascades [37,38]. Subsequently, increased levels of HIF-1a protein ‘‘over-ride’’ the proteasomal degradation process and activate the transcription oftarget genes. Since many growth factor genes are target genes of HIF-1a,autocrine feedback loops are likely to be established. Indeed, this has beenshown to apply to insulin-like growth factor 2 [39]. Mutations of the VHL geneare known to result in normoxic stabilization of HIF-1a [23], leading to tumorformation in patients with VHL disease [40]. Activating mutations of HIF-1ahave also been described [41], as well as gene amplification [42] and stabilizationsecondary to mutations of the tumor suppressor p53 [43]. Normoxic HIF-1adegradation is also prevented in cells carrying mutations in genes for themitochondrial enzymes succinate dehydrogenase and fumarate hydratase [44].
This diversity of mechanisms for non-hypoxic HIF-1a induction and mod-ulation of hypoxic HIF-1a induction is probably the reason for the findings of
15 Endogenous Hypoxia Markers: Case Not Proven! 129

our study on cervix cancers [30] and for the weak correlations described byothers [28,29]. The individual relevance of these mechanisms is very likelydependent not only on the tumor type but also on the genetic background ofindividual tumors and possibly even cell clones within tumors.
15.3 Target Genes of HIF-1a
The possibility that target genes of HIF-1a may be suitable as endogenoushypoxia markers whereas HIF-1a itself is not, may at first seem inconsequent.However, in theory this may be the case owing to the fact that HIF-1a tran-scriptional activity is a separate O2-regulated step. The hydroxylation of aspecific asparagine residue by factor inhibiting HIF (FIH) reduces the interac-tion of HIF-1a with its transcriptional co-activators (e.g., p300/CBP). FIH-1 isinhibited at a lower pO2 than the prolyl hydroxylases [45].
15.3.1 Carbonic Anhydrase IX (CA IX)
The gene for CA IX has been shown to be the most strongly hypoxia-inducible of a panel of 24,504 unique transcripts on a gene array [38,46].The induction of CA IX protein is delayed, with the highest levels beingreached after 24 hours of hypoxia. Additionally, CA IX expression has beendemonstrated to be stable for more than 96 hours after reoxygenation [38,47].Therefore, while CA IX seems to be unsuitable as a marker of acute and‘‘episodic’’ hypoxia, it may nevertheless prove to be useful in the assessment ofchronic hypoxia. The immunohistochemical expression pattern of CA IX issimilar to that described for HIF-1a.
Correlation of CA IX expression with oxygenation status has been reportedfor cancers of the uterine cervix [48] and for non–small cell lung cancers [49].However, other investigations were not able to confirm this [50,51], includingour own study in uterine cervix cancers [52]. As in our investigation of HIF-1a,both O2 electrode measurements and immunohistochemistry for CA IX wereperformed in identical tissue microareas. The different types of hypoxiaassessed by these methods (chronic vs. acute) may partially explain the differ-ences seen between direct oxygenation measurements and CA IX expression.However, since we repeatedly found – analogous to our HIF-1a study –stronglyhypoxic tumors completely devoid of CA IX staining and relatively well-oxy-genated tumors exhibiting strong CA IX staining, the discrepancy between bothmethods may be of a more general nature.
Obviously, the deregulation of HIF-1a by non-hypoxic stimuli does play arole and the clear relevance of an additional O2-regulated step as describedabove is not supported by our own findings. Since CA IX is involved in pH
130 A. Mayer et al.

regulation, it is noteworthy that low extracellular pH has been shown to inhibitCA IX expression under hypoxia in SiHa cells [53]. In addition to this, othermicroenvironmental factors such as low bicarbonate [54] or glucose levels [47]have been shown to have a hypoxia-independent impact on CA IX expression.As with the HIF-1a data cited above, low glucose levels have been shown toimpede CA IX expression [47]. CA IX expression has also previously beenshown to be primarily dependent on cell density [55]
15.3.2 Glucose Transporter 1 (GLUT-1)
The immunohistochemical expression pattern of GLUT-1 is again similar tothat of HIF-1a, with the strongest staining being found at the greatest distancefrom vessels within the tumor stroma and in the viable cell layers aroundnecrotic areas. The timescale for GLUT-1 induction is comparable to that ofCA IX, with maximum mRNA levels being reached only after 16 hours ofhypoxia in one study [54]. The hypoxia-induced GLUT-1 fraction as suchwould therefore be expected to be predominantly a marker of chronic hypoxia.Although degradation of GLUT-1 upon reoxygenation is much more rapidthan is the case with CA IX, it is nevertheless incomplete [54]. Hence, theexpression of GLUT-1 tends to be more extensive than that of CA IX [56].
A correlation between electrode measurements and GLUT-1 expression inadvanced carcinomas of the uterine cervix has been described [57]. However, thiscorrelationwas onlyweak (r� 0.28). Contrary to these data, in a recent analysis ofGLUT-1 expression and the oxygenation status in identical microareas, no corre-lation between results obtained with these two methods could be found [58,59].
As was the case for HIF-1a and CA IX, the impact of hypoxia-independentfactors onGLUT-1 expressionmay be the decisive factor for the absence of a directcorrelation. Besides hypoxia, induction of GLUT-1 expression has been reportedto occur as a result of glucose depletion [60,61], and this in turn has been linked tothe induction of the unfolded protein response, [62] although the molecularmechanisms remain unclear. Induction of GLUT-1 expression through glucosedepletion seems to be of pivotal importance in cervical cancer since glucose levelshave been shown to vary considerably in this tumor entity [63, 64]. Other examplesof non-hypoxicGLUT-1 induction are (c-MYC) oncogene activation [65], osmoticstress [66,67] and the hormone triiodothyronine [68].
15.4 Conclusions
A role for HIF-1a, GLUT-1 or CA IX as endogenousmarkers of tumor hypoxiais currently not supported by the available clinical data. The same is true for avariety of other markers which could not be discussed within the scope of this
15 Endogenous Hypoxia Markers: Case Not Proven! 131

review (e.g., VEGF [69], osteopontin [59,70], thymidine phosphorylase [71]). It
currently appears likely that direct O2 measurements and ‘‘endogenousmarkers’’
(HIF-1a and its respective target genes GLUT-1 and CA IX) assess different
aspects of the tumor microenvironment.
References
1. P. Vaupel, O. Thews, M. Hockel, Treatment resistance of solid tumors: role of hypoxiaand anemia, Med. Oncol. 18(4), 243–259 (2001).
2. M. Hockel, K. Schlenger, B. Aral, M.Mitze, U. Schaffer, P. Vaupel, Association betweentumor hypoxia and malignant progression in advanced cancer of the uterine cervix,Cancer Res. 56(19), 4509–4515 (1996).
3. M. Hockel, P. Vaupel, Tumor hypoxia: definitions and current clinical, biologic, andmolecular aspects, J. Natl. Cancer Inst. 93(4), 266–276 (2001).
4. B. Krishnamachary, S. Berg-Dixon, B. Kelly, F. Agani, D. Feldser, G. Ferreira, N. Iyer,J. LaRusch, B. Pak, P. Taghavi, G. L. Semenza, Regulation of colon carcinoma cellinvasion by hypoxia-inducible factor 1, Cancer Res. 63(5), 1138–1143 (2003).
5. S. Pennacchietti, P. Michieli, M. Galluzzo, M. Mazzone, S. Giordano, P. M. Comoglio,Hypoxia promotes invasive growth by transcriptional activation of the met protoonco-gene, Cancer Cell 3(4), 347–361 (2003).
6. R. A. Cairns, T. Kalliomaki, R. P. Hill, Acute (cyclic) hypoxia enhances spontaneousmetastasis of KHT murine tumors, Cancer Res. 61(24), 8903–8908 (2001).
7. E. K. Rofstad, H. Rasmussen, K. Galappathi, B. Mathiesen, K. Nilsen, B. A. Graff,Hypoxia promotes lymph nodemetastasis in humanmelanoma xenografts by up-regulat-ing the urokinase-type plasminogen activator receptor, Cancer Res. 62(6), 1847–1853(2002).
8. L. H. Gray, A. D. Conger, M. Ebert, S. Hornsey, O. C. A. Scott, The concentration ofoxygen dissolved in tissues at the time of irradiation as a factor in radiotherapy,Br. J. Radiol. 26, 638–648 (1953).
9. A. Kondo, R. Safaei, M. Mishima, H. Niedner, X. Lin, S. B. Howell, Hypoxia-inducedenrichment and mutagenesis of cells that have lost DNA mismatch repair, Cancer Res.61(20), 7603–7607 (2001).
10. K.M.Comerford, T. J.Wallace, J. Karhausen,N.A. Louis,M.C.Montalto, S. P. Colgan,Hypoxia-inducible factor-1-dependent regulation of the multidrug resistance (MDR1)gene, Cancer Res. 62(12), 3387–3394 (2002).
11. A. I. Minchinton, I. F. Tannock, Drug penetration in solid tumours, Nat. Rev. Cancer6(8), 583–592 (2006).
12. M.Hockel, C.Knoop,K. Schlenger, B.Vorndran,E.Baussmann,M.Mitze, P.G.Knapstein,P. Vaupel, Intratumoral pO2 predicts survival in advanced cancer of the uterine cervix,Radiother. Oncol. 26(1), 45–50 (1993).
13. D. M. Brizel, G. S. Sibley, L. R. Prosnitz, R. L. Scher, M. W. Dewhirst, Tumor hypoxiaadversely affects the prognosis of carcinoma of the head and neck, Int. J. Radiat. Oncol.Biol. Phys. 38(2), 285–289 (1997).
14. A. W. Fyles, M. Milosevic, R. Wong, M. C. Kavanagh, M. Pintilie, A. Sun,W. Chapman, W. Levin, L. Manchul, T. J. Keane, R. P. Hill, Oxygenation predictsradiation response and survival in patients with cervix cancer, Radiother. Oncol. 48(2),149–156 (1998).
15. K. Sundfor, H. Lyng, E. K. Rofstad, Tumour hypoxia and vascular density as predictorsof metastasis in squamous cell carcinoma of the uterine cervix, Br. J. Cancer 78(6),822–827 (1998).
132 A. Mayer et al.

16. M. Hockel, K. Schlenger, S. Hockel, P. Vaupel, Hypoxic cervical cancers with lowapoptotic index are highly aggressive, Cancer Res. 59(18), 4525–4528 (1999).
17. M. Nordsmark, J. Alsner, J. Keller, O. S. Nielsen, O. M. Jensen, M. R. Horsman,J. Overgaard, Hypoxia in human soft tissue sarcomas: adverse impact on survival andno association with p53 mutations, Br. J. Cancer 84(8), 1070–1075 (2001).
18. M. Nordsmark, J. Overgaard, Tumor hypoxia is independent of hemoglobin and prog-nostic for loco-regional tumor control after primary radiotherapy in advanced head andneck cancer, Acta Oncol. 43(4), 396–403 (2004).
19. M. Nordsmark, S. M. Bentzen, V. Rudat, D. Brizel, E. Lartigau, P. Stadler, A. Becker,M. Adam, M. Molls, J. Dunst, D. J. Terris, J. Overgaard, Prognostic value of tumoroxygenation in 397 head and neck tumors after primary radiation therapy. An interna-tional multi-center study, Radiother. Oncol. 77(1), 18–24 (2005).
20. G. L. Wang, G. L. Semenza, Purification and characterization of hypoxia-induciblefactor 1, J. Biol. Chem. 270(3), 1230–1237 (1995).
21. M. Ivan, K. Kondo, H. Yang, W. Kim, J. Valiando, M. Ohh, A. Salic, J. M. Asara,W. S. Lane, W. G. Kaelin, Jr., HIFa targeted for VHL-mediated destruction by prolinehydroxylation: implications for O2 sensing, Science 292(5516), 464–468 (2001).
22. P. Jaakkola, D. R.Mole, Y.M.Tian,M. I.Wilson, J. Gielbert, S. J. Gaskell, A.Kriegsheim,H. F. Hebestreit, M. Mukherji, C. J. Schofield, P. H. Maxwell, C. W. Pugh, P. J. Ratcliffe,Targeting of HIF-a to the von Hippel-Lindau ubiquitylation complex by O2-regulatedprolyl hydroxylation, Science 292(5516), 468–472 (2001).
23. P. H.Maxwell,M. S.Wiesener, G.W. Chang, S. C. Clifford, E. C. Vaux,M. E. Cockman,C. C. Wykoff, C. W. Pugh, E. R. Maher, P. J. Ratcliffe, The tumour suppressor proteinVHL targets hypoxia-inducible factors for oxygen-dependent proteolysis, Nature399(6733), 271–275 (1999).
24. G. L. Semenza, Targeting HIF-1 for cancer therapy, Nat. Rev. Cancer 3(10), 721–732(2003).
25. U. R. Jewell, I. Kvietikova, A. Scheid, C. Bauer, R. H.Wenger, M. Gassmann, Inductionof HIF-1a in response to hypoxia is instantaneous, FASEB J. 15(7), 1312–1314 (2001).
26. B. H. Jiang, G. L. Semenza, C. Bauer, H. H.Marti, Hypoxia-inducible factor 1 levels varyexponentially over a physiologically relevant range of O2 tension, Am. J. Physiol.271(4 Pt 1), C1172–1180 (1996).
27. G. Gruber, R. H. Greiner, R. Hlushchuk, D. M. Aebersold, H. J. Altermatt, G. Berclaz,V. Djonov, Hypoxia-inducible factor 1 alpha in high-risk breast cancer: an independentprognostic parameter?, Breast Cancer Res. 6(3), R191–198 (2004).
28. H. K. Haugland, V. Vukovic, M. Pintilie, A. W. Fyles, M. Milosevic, R. P. Hill,D.W. Hedley, Expression of hypoxia-inducible factor-1a in cervical carcinomas: correla-tion with tumor oxygenation, Int. J. Radiat. Oncol. Biol. Phys. 53(4), 854–861 (2002).
29. G. J. Hutchison, H. R. Valentine, J. A. Loncaster, S. E. Davidson, R. D. Hunter,S. A. Roberts, A. L. Harris, I. J. Stratford, P. M. Price, C. M. West, Hypoxia-induciblefactor 1a expression as an intrinsic marker of hypoxia: correlation with tumor oxygen,pimonidazole measurements, and outcome in locally advanced carcinoma of the cervix,Clin. Cancer Res. 10(24), 8405–8412 (2004).
30. A. Mayer, A. Wree, M. Hockel, C. Leo, H. Pilch, P. Vaupel, Lack of correlation betweenexpression of HIF-1a protein and oxygenation status in identical tissue areas of squa-mous cell carcinomas of the uterine cervix, Cancer Res. 64(16), 5876–5881 (2004).
31. H. Zhong, A. M. De Marzo, E. Laughner, M. Lim, D. A. Hilton, D. Zagzag,P. Buechler, W. B. Isaacs, G. L. Semenza, J. W. Simons, Overexpression of hypoxia-inducible factor 1a in common human cancers and their metastases, Cancer Res. 59(22),5830–5835 (1999).
32. D.M.Aebersold, P. Burri, K. T. Beer, J. Laissue, V.Djonov,R.H.Greiner, G. L. Semenza,Expression of hypoxia-inducible factor-1a: a novel predictive and prognostic parameter inthe radiotherapy of oropharyngeal cancer, Cancer Res. 61(7), 2911–2916 (2001).
15 Endogenous Hypoxia Markers: Case Not Proven! 133

33. K. Mekhail, L. Gunaratnam, M. E. Bonicalzi, S. Lee, HIF activation by pH-dependentnucleolar sequestration of VHL, Nat. Cell Biol. 6(7), 642–647 (2004).
34. H. Lu, R. A. Forbes, A. Verma, Hypoxia-inducible factor 1 activation by aerobicglycolysis implicates the Warburg effect in carcinogenesis, J. Biol. Chem. 277(26),23111–23115 (2002).
35. S. B. Catrina, K. Okamoto, T. Pereira, K. Brismar, L. Poellinger, Hyperglycemiaregulates hypoxia-inducible factor-1a protein stability and function, Diabetes 53(12),3226–3232 (2004).
36. S. J. Kwon, Y. J. Lee, Effect of low glutamine/glucose on hypoxia-induced elevation ofhypoxia-inducible factor-1a in human pancreatic cancer MiaPaCa-2 and human pro-static cancer DU-145 cells, Clin. Cancer Res. 11(13), 4694–4700 (2005).
37. G. Hopfl, O. Ogunshola, M. Gassmann, HIFs and tumors – causes and consequences,Am. J. Physiol. Regul. Integr. Comp. Physiol. 286(4), R608–623 (2004).
38. A. Mayer, M. Hockel, P. Vaupel, Endogenous hypoxia markers in locally advancedcancers of the uterine cervix: reality or wishful thinking? Strahlenther. Onkol. 182(9),501–510 (2006).
39. D. Feldser, F. Agani, N. V. Iyer, B. Pak, G. Ferreira, G. L. Semenza, Reciprocal positiveregulation of hypoxia-inducible factor 1a and insulin-like growth factor 2, Cancer Res.59(16), 3915–3918 (1999).
40. S. J. Mandriota, K. J. Turner, D. R. Davies, P. G. Murray, N. V. Morgan, H. M. Sowter,C. C. Wykoff, E. R. Maher, A. L. Harris, P. J. Ratcliffe, P. H. Maxwell, HIF activationidentifies early lesions inVHLkidneys: evidence for site-specific tumor suppressor functionin the nephron, Cancer Cell. 1(5), 459–468 (2002).
41. X. S. Fu, E. Choi, G. J. Bubley, S. P. Balk, Identification of hypoxia-inducible factor-1a(HIF-1a) polymorphism as a mutation in prostate cancer that prevents normoxia-induced degradation, Prostate 63(3), 215–221 (2005).
42. O. R. Saramaki, K. J. Savinainen, N. N. Nupponen, O. Bratt, T. Visakorpi, Amplifica-tion of hypoxia-inducible factor 1a gene in prostate cancer, Cancer Genet. Cytogenet.128(1), 31–34 (2001).
43. R.Ravi, B.Mookerjee, Z.M.Bhujwalla, C.H. Sutter,D.Artemov,Q. Zeng, L. E.Dillehay,A. Madan, G. L. Semenza, A. Bedi, Regulation of tumor angiogenesis by p53-induceddegradation of hypoxia-inducible factor 1a, Genes Dev. 14(1), 34–44 (2000).
44. A. King, M. A. Selak, E. Gottlieb, Succinate dehydrogenase and fumarate hydratase:linking mitochondrial dysfunction and cancer, Oncogene 25(34), 4675–4682 (2006).
45. P. Koivunen, M. Hirsila, V. Gunzler, K. I. Kivirikko, J. Myllyharju, Catalytic propertiesof the asparaginyl hydroxylase (FIH) in the oxygen sensing pathway are distinct fromthose of its prolyl 4-hydroxylases, J. Biol. Chem. 279(11), 9899–9904 (2004).
46. A. Lal, H. Peters, B. St Croix, Z. A. Haroon, M. W. Dewhirst, R. L. Strausberg,J. H. Kaanders, A. J. van der Kogel, G. J. Riggins, Transcriptional response to hypoxiain human tumors, J. Natl. Cancer Inst. 93(17), 1337–1343 (2001).
47. D. Vordermark, A. Kaffer, S. Riedl, A. Katzer, M. Flentje, Characterization of carbonicanhydrase IX (CA IX) as an endogenous marker of chronic hypoxia in live human tumorcells, Int. J. Radiat. Oncol. Biol. Phys. 61(4), 1197–1207 (2005).
48. J. A. Loncaster, A. L. Harris, S. E. Davidson, J. P. Logue, R. D. Hunter, C. C. Wycoff,J. Pastorek, P. J. Ratcliffe, I. J. Stratford, C. M. West, Carbonic anhydrase (CA IX)expression, a potential new intrinsic marker of hypoxia: correlations with tumor oxygenmeasurements and prognosis in locally advanced carcinoma of the cervix, Cancer Res.61(17), 6394–6399 (2001).
49. Q. T. Le, E. Chen, A. Salim, H. Cao, C. S. Kong, R. Whyte, J. Donington, W. Cannon,H. Wakelee, R. Tibshirani, J. D. Mitchell, D. Richardson, K. J. O’Byrne, A. C. Koong,A. J. Giaccia, An evaluation of tumor oxygenation and gene expression inpatients with early stage non-small cell lung cancers, Clin. Cancer Res. 12(5),1507–1514 (2006).
134 A. Mayer et al.

50. D. Hedley, M. Pintilie, J. Woo, A. Morrison, D. Birle, A. Fyles, M. Milosevic, R. Hill,Carbonic anhydrase IX expression, hypoxia, and prognosis in patients with uterinecervical carcinomas, Clin. Cancer Res. 9(15), 5666–5674 (2003).
51. B. Jankovic, C.Aquino-Parsons, J. A. Raleigh, E. J. Stanbridge, R. E.Durand, J. P. Banath,S. H. Macphail, P. L. Olive, Comparison between pimonidazole binding, oxygen electrodemeasurements, and expression of endogenous hypoxia markers in cancer of the uterinecervix, Cytometry B Clin. Cytom. 70(2), 45–55 (2006).
52. A.Mayer, M. Hockel, P. Vaupel, Carbonic anhydrase IX expression and tumor oxygena-tion status do not correlate at the microregional level in locally advanced cancers of theuterine cervix, Clin. Cancer Res. 11(20), 7220–7225 (2005).
53. B. S. Sorensen, J. Hao, J. Overgaard, H. Vorum, B. Honore, J. Alsner, M. R. Horsman,Influence of oxygen concentration and pH on expression of hypoxia induced genes,Radiother. Oncol. 76(2), 187–193 (2005).
54. M. Rafajova, M. Zatovicova, R. Kettmann, J. Pastorek, S. Pastorekova, Induction byhypoxia combined with low glucose or low bicarbonate and high posttranslationalstability upon reoxygenation contribute to carbonic anhydrase IX expression in cancercells, Int. J. Oncol. 24(4), 995–1004 (2004).
55. J. Pastorek, S. Pastorekova, I. Callebaut, J. P. Mornon, V. Zelnik, R. Opavsky,M. Zat’ovicova, S. Liao, D. Portetelle, E. J. Stanbridge, Cloning and characterizationof MN, a human tumor-associated protein with a domain homologous to carbonicanhydrase and a putative helix-loop-helix DNA binding segment, Oncogene 9(10),2877–2888 (1994).
56. P. J. Hoskin, A. Sibtain, F. M. Daley, G. D. Wilson, GLUT1 and CAIX as intrinsicmarkers of hypoxia in bladder cancer: relationship with vascularity and proliferation aspredictors of outcome of ARCON, Br. J. Cancer 89(7), 1290–1297 (2003).
57. R. Airley, J. Loncaster, S. Davidson, M. Bromley, S. Roberts, A. Patterson, R. Hunter,I. Stratford, C. West, Glucose transporter Glut-1 expression correlates with tumorhypoxia and predicts metastasis-free survival in advanced carcinoma of the cervix, Clin.Cancer Res. 7(4), 928–934 (2001).
58. A. Mayer, M. Hockel, A. Wree, P. Vaupel, Microregional expression of glucose trans-porter-1 and oxygenation status: lack of correlation in locally advanced cervical cancers,Clin. Cancer Res. 11(7), 2768–2773 (2005).
59. K. I. Sakata,M. Someya, H. Nagakura, K. Nakata, A. Oouchi, M. Hareyama,M. Satoh,A clinical study of hypoxia using endogenous hypoxic markers and polarographic oxygenelectrodes, Strahlenther. Onkol. 182(9), 511–517 (2006).
60. I. Stein, M. Neeman, D. Shweiki, A. Itin, E. Keshet, Stabilization of vascular endothelialgrowth factor mRNA by hypoxia and hypoglycemia and coregulation with other ische-mia-induced genes, Mol. Cell Biol. 15(10), 5363–5368 (1995).
61. R. J. Boado, W. M. Pardridge, Glucose deprivation and hypoxia increase the expressionof the GLUT1 glucose transporter via a specific mRNA cis-acting regulatory element,J. Neurochem. 80(3), 552–554 (2002).
62. E. Wertheimer, S. Sasson, E. Cerasi, Y. Ben-Neriah, The ubiquitous glucose transporterGLUT-1 belongs to the glucose-regulated protein family of stress-inducible proteins,Proc. Natl. Acad. Sci. U. S. A. 88(6), 2525–2529 (1991).
63. S. Walenta, M. Wetterling, M. Lehrke, G. Schwickert, K. Sundfor, E. K. Rofstad,W. Mueller-Klieser, High lactate levels predict likelihood of metastases, tumor recurrence,and restricted patient survival in human cervical cancers,Cancer Res. 60(4), 916–921 (2000).
64. P. Vaupel, F. Kallinowski, P. Okunieff, Blood flow, oxygen and nutrient supply, andmetabolic microenvironment of human tumors: a review, Cancer Res. 49(23), 6449–6465(1989).
65. R.C.Osthus,H. Shim, S.Kim,Q.Li,R.Reddy,M.Mukherjee,Y.Xu,D.Wonsey, L.A.Lee,C. V. Dang, Deregulation of glucose transporter 1 and glycolytic gene expression by c-Myc,J. Biol. Chem. 275(29), 21797–21800 (2000).
15 Endogenous Hypoxia Markers: Case Not Proven! 135

66. K. Barnes, J. C. Ingram,O.H. Porras, L. F. Barros, E.R.Hudson,L.G. Fryer, F. Foufelle,D. Carling, D. G. Hardie, S. A. Baldwin, Activation of GLUT1 by metabolic and osmoticstress: potential involvement of AMP-activated protein kinase (AMPK), J. Cell. Sci.115(Pt 11), 2433–2442 (2002).
67. D. Y. Hwang, F. Ismail-Beigi, Stimulation of GLUT-1 glucose transporter expression inresponse to hyperosmolarity, Am. J. Physiol. Cell Physiol. 281(4), C1365–1372 (2001).
68. L. C. Moeller, A. M. Dumitrescu, S. Refetoff, Cytosolic action of thyroid hormone leadsto induction of HIF-1a and glycolytic genes, Mol. Endocrinol. 90(2), 936–943 (2005).
69. C. M.West, R. A. Cooper, J. A. Loncaster, D. P. Wilks, M. Bromley, Tumor vascularity:a histological measure of angiogenesis and hypoxia,Cancer Res. 61(7), 2907–2910 (2001).
70. S. Lukacova, J. Overgaard, J. Alsner, M. R. Horsman, Strain and tumour specificvariations in the effect of hypoxia on osteopontin levels in experimental models, Radio-ther. Oncol. 80(2), 165–171 (2006).
71. P. Kabuubi, J. A. Loncaster, S. E. Davidson, R. D. Hunter, C. Kobylecki, I. J. Stratford,C. M. West, No relationship between thymidine phosphorylase (TP, PD-ECGF) expres-sion and hypoxia in carcinoma of the cervix, Br. J. Cancer 94(1), 115–120 (2006).
136 A. Mayer et al.

Chapter 16
RAD18 Signals DNAPolymerase IOTA to Stalled
Replication Forks in Cells Entering S-phase
with DNA Damage
Shelly Kakar, Nicholas B. Watson, and W. Glenn McGregor1
Abstract Endogenously generated reactive oxygen species and genotoxic car-cinogens can covalently modify bases in cellular DNA. If not recognized andremoved prior to S-phase of the cell cycle, such modifications can block DNAreplication fork progression. If blocked forks are not are not resolved, theyresult in double strand breaks and cell death. Recent data indicate that theprocess of translesion DNA synthesis (TLS) is a highly conserved mechanismfor bypassing lesions in template DNA. Although not fully understood, in yeasta ubiquitin ligase (RAD18) signals error-prone Y family polymerases to theblocked fork to bypass the damage with potentially mutagenic consequences.Homologs of the yeast proteins are found in higher eukaryotic cells, includinghuman.We are examining the hypothesis that RAD18 acts as a proximal signalto Y-family polymerases to bypass damage, in a manner analogous to yeast butwith additional layers of complexity. Here we report that RAD18 accumulatesin nuclear foci after UV irradiation only in cells entering S-phase with DNAdamage. These foci co-localize with proliferating cell nuclear antigen (PCNA).In addition, a newly described DNA polymerase, pol iota, also forms nuclearfoci in a damage- and S-phase dependent manner. These data support ouroverall hypothesis that RAD18 accumulates at blocked forks and initiates thesignal to recruit TLS polymerases.
16.1 Introduction
Cellular DNA is continuously under assault by the byproducts of endogenousmetabolic processes, particularly reactive oxygen species (ROS), and fromexogenous genotoxic agents. Principal among the latter is ultraviolet radiation,which induces DNA damage by the production of ROS as well as photoaddi-tion products between adjacent pyrimidines. These damages distort the DNA
1Shelly Kakar, Nicholas B. Watson, and W. Glenn McGregor, Department of Pharmacologyand Toxicology and Department of Medicine, James Graham Brown Cancer Center,University of Louisville, Louisville, KY 40202. SK andNBW contributed equally to this work.
K.A. Kang et al. (eds.), Oxygen Transport to Tissue XXIX� Springer 2008
137

helical structure to varying degrees, and prokaryotic and eukaryotic organismshave developed remarkably conserved mechanisms to recognize and removesuch lesions. In general, oxidized bases are removed by the base excision repairsystem and larger bulky adducts are removed by the nucleotide excision repairsystem with some redundancy between the two.
It was recognized several years ago that most mutations are induced in DNAwhen the repair systems fail to remove DNA damage before the cells enterS-phase [1]. It was known that the damaged bases block the highly processive andaccurate replicative DNA polymerase complexes, but themechanisms that result inincorrect copying of the template were largely unknown. Within the last severalyears, dramatic advances have afforded significant new insights into the molecularmechanisms ofmutagenesis. Replication forks that are blocked by bulky adducts inthe DNA are resolved by error-free recombination and error-prone translesionsynthesis (TLS). The latter process is responsible for the majority of base substitu-tions induced in the DNA. TLS is defined as the incorporation of a nucleotideacross from DNA damage followed by extension of the potentially mispairedprimer-template. Data indicate that this process is undertaken by accessory DNApolymerases. Several such polymerases have been discovered in higher eukaryoticcells, and several have been purified. Based on structural homology, these poly-merases fit into one of three families: the Y-family (REV1, pol Z, i, and �), theB-family (pol z) or the X-family (pol m, l, s, and Trf5). The cellular roles of thisuniverse of polymerases are not known [2]. In particular, the extent towhich each ofthese polymerases participates in translesion replication most likely depends on thestructure of a particular adduct and on the sequence context. It has been suggestedthat pol Z,i, and/or � inserts a base directly across from a lesion, and that pol zextends the mispair to form a template-primer that can be extended by pol d [3].
The unrestrained activity of error-prone polymerases would lead to wide-spread mutagenesis and genomic instability, so there are signaling mechanismsthat tightly control polymerase switching events. We are studying the cellbiology of a key regulator of this process, a ubiquitin ligase encoded by theRAD18 gene [4]. The present studies were undertaken to examine the hypoth-esis that RAD18 is required to signal the error-prone DNA polymerase iota tosites of DNA replication forks stalled by damage in the DNA template. Theultimate goal of these studies is to examine the suitability of this gene product asa molecular target to prevent carcinogen-induced mutagenesis, and to translatethese data into a practical way to reduce the frequency of mutations andincidence of carcinogen-induced cancers, such as those of the skin and lung.
16.2 Instruments, Materials, and Methods
16.2.1 Cells and Cell Culture
The primary fibroblast cell strain GM1604 (Coriell Institute) was originallyderived from human fetal lung tissue, and was telomerase immortalized. The
138 S. Kakar et al.

immortalized cells (NF1604) were provided by Dr. Lisa McDaniels (Universityof Texas Southwestern Medical Center, Dallas) under the terms of MTA 3025between WGM and Geron Corporation. Cells were kept in exponential growthin DMEM medium supplemented with 10% supplemented calf serum(Hyclone), 2mMglutamine, penicillin (100U/ml) and streptomycin (100 mg/ml).
16.2.2 Cell Synchronization
Cells were synchronized with 500 mM mimosine for 24 h. Under these condi-tions, inhibition of ribonucleotide reductase causes the cells to arrest in late G1
by depleting the pool of available deoxynucleotides. For studies of cells inS-phase, the medium was replaced with fresh medium without mimosine, andthe cells were irradiated 6 h later. The percentage of cells in each phase of the cellcycle was determined by propidium iodide staining and determination of DNAcontent using a FACScan flow cytometer and the ModFit program.
16.2.3 UV Irradiation
Cells were plated at a density of 2.5� 104 cells/cm2 per well of a 24 well plate 24 hprior to treatment. The wells also contained lysine coated coverslips (Becton-Dickinson). Cells were irradiated inG1-phase, or in S-phase, 6 h after removal ofthe mimosine block. The UV source was a Spectroline germicidal lamp, and theflux was measured at 254 nm using a research radiometer fitted with a SED240photodetector and aW diffuser (International Light, Newburyport,MA,USA).Cells were washed two times with sterile phosphate buffered saline pH 7.4 (PBS),irradiated, then fresh complete cell culture medium was added. The cells oncoverslips were fixed in methanol 2 h after irradiation.
16.2.4 Localization of Proteins
Following fixation, the cells werewashedwith 1x PBS three times for fivemin. each.After the final wash, the cells were permeabilized with 0.2%PBST for 10min. Cellswere then blocked for 30 min. on parafilm squares in 0.2% PBST containing 10%goat serum (GPBST) in a humid chamber at room temperature. While the cellsincubated, the primary antibody was conjugated with the corresponding Zenonfluorescent secondary (Molecular Probes). 2 mg of mouse anti-PCNA (PC-10,Dako) was incubated with 20 mL of goat anti-mouse Alexa-Fluor 594 for fiveminutes at room temp. Similarly, 2 mg of mouse anti-RAD18 or anti-pol iota(Abcam) were incubated with 20 mL of goat anti-mouse Alexa-Fluor 488 for fiveminutes at room temp. After this incubation, 20 mL of non-specific IgG was addedto both tubes to remove any non-bound fluorescent probe. Both solutionswere thenadded together into a 10% GPBST solution. Cells were incubated in the dark for
16 RAD18 Signals DNA Polymerase IOTA to Stalled Replication Forks 139

1 hour on fresh parafilm in a humid chamber.After fluorescently labeling the cells, asecond fixation is performed with 1x PBS containing 4% formaldehyde for 15 min.at room temperature to prevent disassociation of the secondary from the primary.The cells were then washed 3x with PBS and mounted on slides using SlowfadeLight Antifade Kit with DAPI (Molecular Probes) for the mounting medium.The slides were sealed with clear fingernail polish. Slides were imaged usinga Zeiss Axiovert 100M confocal microscope with 100x oil-immersion objective.The images were analyzed with LSM 510 software.
16.3 Results and Discussion
16.3.1 Cell Synchrony
Mimosine is thought to act by inhibiting ribonucletide reductase [5]. Therefore,the available pool of deoxynucleotide precursors is greatly reduced and the cellsarrest in G1. Note that all four deoxynucleotides are affected equally, so there areno potentially mutagenic pool imbalances. To confirm the degree of synchrony,we examined the percentage of cells in all four phases of the cell cycle of variouspopulations using flow cytometry. In Fig. 16.1A, the cells were exposed tomimosine for 24 h, then harvested and stained with propidium iodide. The greatmajority of cells (81%) had 2N DNA content, indicating that they were in G1 (orG0). In experiments that examined cells inG1, the cells were irradiated after 24 h inmimosine, held for 2 h in medium containing mimosine, then fixed for immuno-histochemistry. Figure 16.1B shows the effect of removing the mimosine then
BA
G1/G0 = 81%S = 13%
G2/M = 6%
G1/G0 = 24%S = 76%
G2/M = 0%
Fig. 16.1 A. Cells were synchronized with mimosine for 24 h, then harvested and examinedfor DNA content with flow cytometry. 81% of the cells were in G1-phase. B. Mimosine wasremoved and the cells were harvested 6 h later. Under these conditions, 76% of the cells werein S-phase.
140 S. Kakar et al.

harvesting the cells after 6 h in fresh medium. Under these conditions, the greatmajority (76%) of cells had entered S-phase. The S-phase experiments were doneby irradiating at this point then harvesting the cells 2 h later. These data confirmthe effectiveness and lack of toxicity of mimosine under the conditions examined.
16.3.2 Subcellular Localization of RAD18
Proliferating cell nuclear antigen (PCNA) is a homotrimeric protein that acts as a‘‘clamp’’ that tethers DNA polymerase d and � to the template. It functions in avariety ofDNA transactions in addition to replication, notably inmismatch repairand in the gap filling step of nucleotide excision repair. We showed that PCNAstaining increases in the cytoplasm throughout G1-phase, and is also found withinthe nucleus, as expected, in cells that do not haveDNAdamage [6]. RAD18, on theother hand is restricted to the nucleus in a diffuse pattern in such cells [7].
This pattern is reflected in cells irradiated in late G1 (Fig. 16.2, left panel). ThePCNA (red) is present most intensely in a perinuclear distribution. NuclearPCNA is present in small focal areas. These have been found to colocalize withcyclobutane dimers [7], and are presumed to represent PCNA involvement in thegap filling step of nucleotide excision repair. In contrast, RAD18 was present inthe nucleus in a diffuse pattern in cells irradiated inG1 (Fig. 16.2, green staining).
In cells irradiated in S phase (right panel), PCNA is principally in thenucleus, and is primarily in a focal pattern. The distribution of RAD18 isalso principally in a focal pattern, which colocalizes with PCNA in themerged image. Several Y-family DNA polymerases are known to form
Fig. 16.2 Cells were irradiated in G1 (left panel) or S (right panel) and stained 2 h later. Thecells were stained for PCNA (red), DNA (blue), RAD18 (green), and examined by confocalmicroscopy. The lower right quadrant of each panel is themerged image. (See also color insert.)
16 RAD18 Signals DNA Polymerase IOTA to Stalled Replication Forks 141

foci in the nuclei of cells entering S-phase with DNA damage [7,8]. These foci
are thought to represent stalled DNA replication forks, to which TLS
proteins have been recruited. These data are consistent with the proposed
role of RAD18, which is to signal translesion polymerases to sites of stalled
replication forks.Figure 16.3 shows staining for cells treated exactly as those in Fig. 16.2, but
stained for pol iota instead of RAD18. In the G1 cells (left panel) the PCNA
pattern is similar to that shown in Fig. 16.2, but a cell with a more prominent
focal pattern of PCNA is illustrated. In these cells, little or no pol iota could be
demonstrated. In the S-phase cells (right panel) pol iotawas clearly demonstrated
to be in nuclear foci that colocalize with PCNA. It was organized in a focal
pattern only in cells irradiated in S-phase, and these foci colocalized with PCNA.These results support the hypothesis that RAD18 is recruited to sites of DNA
replication forks that are stalled byUVdamage, and the protein is involved in the
subsequent recruitment of newly discovered error-prone DNA polymerases that
can complete the replication ofDNA containingUVdamage. In separate studies,
we have shown that reducing the level of RAD18 using antisense technology
prevents the formation of foci of pol iota and other Y-family polymerases.
16.4 Conclusions
RAD18 forms nuclear foci that colocalize with PCNA only in cells entering
S phase with DNA damage. These foci represent stalled replication forks, to
which translesion polymerases have been recruited. In support of this idea, pol
Fig. 16.3 Left panel, cells irradiated in G1. Pcna (red), DNA (blue), pol iota (green), lowerright quadrant, merged images. Right panel, cells irradiated in S-phase. (See also color insert.)
142 S. Kakar et al.

iota, a newly discovered translesion polymerase, is recruited to these sites in aRAD18-dependent manner. Recent data support a model in which RAD18recruits a ubiquitin ligase (RAD6) to the site of the stalled replication complex.At least one target of RAD6 is PCNA, which is ubiquitylated in a uniquelinkage that serves a signaling function. A working hypothesis is that theY family polymerases have a higher affinity for PCNA when it is ubiquitylatedin this way, resulting in recruitment to the stalled replication complexes.
16.5 Future Study
We have found that reducing the level of RAD18 using antisense technologygreatly reduces the frequency of mutations induced by UV and chemical carci-nogens. We are investigating the possibility that such cells may become geneti-cally unstable by virtue of illegitimate recombination induced in cells thatcannot perform TLS. If the cells resolve the blocked forks by error-free homo-logous recombination, and are not genetically unstable, then RAD18 maypresent and attractive target for cancer chemoprevention.
Acknowledgment This work was supported by a NASA-Ames NAG2-1647 and NIH/USPHS grants CA112197 and CA112664.
References
1. McGregor, W.G., Chen, R.H., Lukash, L., Maher, V.M. & McCormick, J.J. Cellcycle-dependent strand bias for UV-induced mutations in the transcribed strand of exci-sion repair-proficient human fibroblasts but not in repair-deficient cells.Mol. Cell Biol. 11,1927–1934 (1991).
2. Friedberg, E.C., Lehmann, A.R. & Fuchs, R.P. Trading places: how doDNA polymerasesswitch during translesion DNA synthesis? Mol. Cell. 18, 499–505 (2005).
3. Prakash, S. & Prakash, L. TranslesionDNA synthesis in eukaryotes: a one-or two-polymeraseaffair. Genes Dev. 16, 1872–1883 (2002).
4. Watson, N.B., Mukhopadhyay, S. & McGregor, W.G. Translesion DNA replicationproteins as molecular targets for cancer prevention. Cancer Lett. 241, 13–22 (2006).
5. Krude, T.Mimosine arrests proliferating human cells before onset of DNA replication in adose-dependent manner. Exp. Cell Res. 247, 148–159 (1999).
6. Mukhopadhyay, S., Clark, D.R., Watson, N.B., Zacharias, W. &McGregor, W.G. REV1accumulates in DNA damage-induced nuclear foci in human cells and is implicated inmutagenesis by benzo[a]pyrenediolepoxide. Nucleic Acids Res. 32, 5820–5826 (2004).
7. Tissier, A. et al. Co-localization in replication foci and interaction of human Y-familymembers, DNA polymerase pol eta and REV1 protein.DNA Repair (Amst) 3, 1503–1514(2004).
8. Bi, X., et al. RAD18 regulates DNA polymerase kappa and is required for recovery fromS-phase checkpoint-mediated arrest. Mol. Cell Biol. 26, 3527–3540 (2006).
16 RAD18 Signals DNA Polymerase IOTA to Stalled Replication Forks 143

Chapter 17
Alanine in HI: A Silent Mutation Cries Out!
J. H. Shah1, D. J. Maguire1, T. B. Munce2, and A. Cotterill3
Abstract It is a widely held paradigm in molecular biology that a change in thethird base of a codon is silent in terms of expression. In this investigation, resultsare presented that challenge that paradigm, at least in terms of one polymorph-ism in KCNJ11, which is one of five genes that have been implicated in thedisorder Hyperinsulinism of Infancy. In two cohorts of Australian patients, anuneven distribution of KCNJ11 SNP’s was observed. A silent polymorphism atcodon 190 was over-represented in the patients who responded well to medicaltreatment and under-represented in those that required radical surgical inter-vention. In an attempt to investigate this polymorphism, it was expressed invitro and western blot analysis showed that there were virtually no bands fromthe homozygous variant samples, while strong bands were seen in normalcontrols. The human genome is highly redundant in terms of tRNA speciesfor each amino acids but enigmatically under-represents a number of specificcodons. The polymorphism in question occurs within one such codon. Wepropose that the presence of a base change at the third position of codon thatis not represented by a corresponding anti-codon within the human nucleartRNA leads to a decreased rate of expression of the protein.
17.1 Introduction
Hyperinsulinism of Infancy (HI) is a metabolic syndrome associated with theunregulated release of insulin from the pancreatic beta cells, accompanied byhypoglycaemia that is hard to control. HI is the most common form of perma-nent hyperinsulinism of infancy. Patients usually present in the first 72 hours of
1School of Biomolecular and Biophysical Science, Griffith University, Nathan, Q4111,Australia2Pathology, Mater Health Services, South Brisbane, Queensland, 4101–Metabolic Medicine,Mater Health Services, South Brisbane, Queensland, 41013Paediatric Endocrinology and Diabetes, Mater Children’s Hospital, South Brisbane,Queensland, 4101, Australia
K.A. Kang et al. (eds.), Oxygen Transport to Tissue XXIX� Springer 2008
145

life with symptoms of hypoglycaemia including jitteriness, nausea, vomitingand seizures. In severe cases coma or death can occur [1]. Due to the difficulty incontrolling hypoglycaemic seizures, up to 50% of all patients suffer from long-term neurological impairment. Management can be difficult, with treatmentaimed at maintaining euglycemia [2].
The known causes ofHI are linked to the expression, structure or function of theATP dependent potassium channel of the pancreatic b cells. TheK-ATP channel isan octameric complex consisting of 4 subunits each of the sulfonyl urea receptor(SUR1) and the inwardly rectifying subunit Kir6.2. SUR1 and Kir6.2 are encodedby the genes ABCC8 andKCNJ11 respectively, which lie adjacent to each other at11p15.1 [1]. Mutations in ABCC8 and KCNJ11 have been implicated in HI, withmore than a hundred mutations reported in ABCC8. The genes encoding theenzymes Glucokinase [3] (GCK), glutatmate dehyrogenase [4] (GLUD1) and3-Hydroxyacyl-CoA dehydrogenase [5] (SCHAD) have also been implicated inHI. The genetic cause, however, remains unknown in up to 50% of HI patients [6].
In an effort to further understand of the genetic aetiology of HI and thegenotype-phenotype correlations of the disease, we genotyped a cohort of Aus-tralian HI patients. The patients were segregated by the severity of their diseaseand their response to treatment.Mainstreammedical therapy involves the use ofglucose and glucagon infusions coupled with diazoxide and octreotide. Thosewho failed to respond to this treatment at maximal doses required a partial orsubtotal pancreatectomy to maintain euglycemia. They were assumed to havethe more severe form of the disease and constituted the surgical cohort. Thosepatients who responded well to this medical treatment were assumed to have amilder form of the disease and were classified as the medical cohort [7]. Ourgenetic findings are described in Shah, J.H et al [8]. Upon sequencing KCNJ11we identified a differential distribution of 5 polymorphisms between our twocohorts (p<0.01), also described in Shah et al [8]. One of these polymorphismswas theA190A [9]. aGCC toGCTat codon 190 that did not alter the transcribedamino acid. The polymorphism was identified in 30.5% of medical patients and74%of surgical patients. The allele frequency in 100 control subjects was 27.6%.
Nucleotide base changes are classified as silent in cases where an alterationdoes not lead to a change in the amino acid sequence of a protein. These arecommon, but are usually considered to have no phenotypic effect. Some studieshave shown that silent polymorphisms can have an effect on post translationalmodification as well as alternate splicing [10]. In the case of the A190A poly-morphism, we have investigated the translation process to identify a possiblelink between the silent polymorphism and the disease phenotype
17.2 Hypothesis and Aims
We suggest that in some cases, such as with A190A in HI, the effect of a silentmutation may be enhanced by the relative abundance of the tRNA species forthe codon.
146 J.H. Shah et al.

There are 42 tRNA molecules that carry anticodons specific to those thattranscribe alanine [11]. Alanine has a redundancy of 4 and is transcribed by thecodons GCC, GCG, GCT and GCA. However, there is an uneven distribution oftRNAmolecules for each codon. An assessment of the alanine tRNApopulation inhumans (Table 17.1), revealed that there is no tRNA molecule carrying the antic-odonGGCwhich is specific for theGCC codon that is polymorphic inHI patients.
We hypothesise that the relative abundance of specific tRNA molecules hasan impact on the efficiency of translation, thus implying that the wobblehypothesis in translation is not always true. We propose that the efficiency oftranslation is reduced in those individuals carrying the variant form of thealanine codon at amino acid 190 in KCNJ11. Using Kir6.2 as a model, westudied the efficiency of translation and investigated the possible role that areduced translational efficiency would have in the disease progression in HI.
17.3 Methodology
Six patients and one normal control were chosen for our investigations. Thepatients were selected based on their genotype such thatwe had one homozygousvariant, one heterozygous and one homozygous wildtype from each cohort. Thenormal control was a homozygous wildtype and was not known to have PHHIor any other endocrine disease. Other polymorphisms were identified in theKCNJ11 gene, however these were identical in all participants in this study.
Genotyping of KCNJ11 was carried out by PCR followed by sequencing asdescribed in Shah et al [8]. Initial experiments for measuring in vitro transla-tional efficiency were undertaken using the TNT1 T7 Coupled ReticulocyteLysate System (Promega).
The T7 promoter sequence was ligated 5’ to the KCNJ11 promoter usingPCR. This was confirmed by sequencing. The PCR products were then purifiedusing the High Pure PCR purification kit (Roche) and a low melting pointagarose gel. 1 mg of the purified PCR product was introduced into the TNTrabbit reticulocyte system as described by the manufacturer. *S35-Met wasused as described by the manufacturer. Reactions were stopped by heating to98 8C after predetermined time intervals.
Table 17.1 Population of alanine tRNA in theHuman genome (The genomic tRNA database:http://lowelab.ucsc.edu/GtRNAdb/)
Anti Codon. No. of tRNA in humans
AGC 28*
GGC 0#
CGC 5
TGC 9
Total 42
* Wildtype in HI; #polymorphic in HI
17 Alanine in HI: A Silent Mutation Cries Out! 147

Protein production in the in vitro reactions was analysed using denaturingSDS-PAGE, autoradiography and by Western blot analysis using an antibodyraised against the N terminal of the protein (Santa Cruz antibodies). *S35-Metincorporation was measured by using a beta scintillation counter.
17.4 Results
Protein production at the end of in vitro trancription-translation reactions wereanalysedwithout specific purification. Initial results obtained fromSDS-PAGE –autoradiography showed that there was a slight difference in Kir6.2 proteinsynthesis between the patients analysed (Fig. 17.1a). Through western blottinghowever, significant differences were noted. A strong band representing theKir6.2 protein was observed for the homozygous wildtype samples whereasthere was virtually no signal for the homozygous variants (Fig. 17.1b).
Quantitative scintillation counting for studying incorporation of *S-Met inthe patients was found to follow the same trend as the western blots. In vitrotranslation using wildtype DNA showed a significantly higher rate of *S-Metincorporation and had more protein produced compared to incorporation andprotein production in experiments using homozygous variant DNA (Fig. 17.2).
Incorporation of *S-Met
-20000
0
20000
40000
60000
80000
100000
No DNA WildtypeHomozygous
Genotype
Co
un
t
Fig. 17.2 Measure of *S-Met incorporation in patients after an in vitro translation experiment.
W/t HomW/T
a b
Het Hom
Fig. 17.1 SDS PAGE autoradiography (a) and Western Blotting (b) of in vitro translationproducts. W/t –wildtype, Het – heterozygous, Hom- homozygous.
148 J.H. Shah et al.

17.5 Discussion
Our initial results indicate an apparent reduced amount of Kir6.2 proteinproduced after 90 min in vitro transcription and translation. In someexperiments, a fragmented product was observed. Western blots and *S-Metincorporation studies suggest an even more striking depletion of Kir6.2 in vitroexpression studies than autoradiography. There are several possible explana-tions for this observation, including a decreased rate of protein production dueto the lack of directly binding tRNA species, the slower rate of Kir6.2 proteintranslation could lead to of improper folding or altered pre mRNA editing.
With reference to HI, we can speculate that the presence of the polymorph-ism reduces the rate of Kir6.2 production, and thus channel assembly. It ishowever interesting to note that the GCC codon for alanine that is abnormal inKCNJ11 seems to be the most commonly used alanine codon in the humangenome [12]. Further work will be undertaken to investigate the impact oftranslational efficiency in Kir6.2 and other proteins.
Acknowledgment The authors would like to acknowledge members of the Mater Children’sHospital PHHI research group Dr. D Cowley, Dr. F Bowling, Dr M Harris, Dr R Greer andothers.
References
1. Dunne MJ, Cosgrove KE, Shepherd RM, Aynsley-Green A, Lindley KJ. Hyperinsulinismin Infancy: from Basic Science to Clinical Disease. Physiol Rev, 2004. 84(1), 239–275.
2. Aynsley-Green A, Hussain K, Hall J, Saudubray JM, Nihoul-Fekete C, De Lonlay-Debeney P, Brunelle F, Otonkoski T, Thornton P, Lindley KJ. Practical management ofhyperinsulinism in infancy.Arch Dis Child Fetal Neonatal Ed. Arch Dis Child, 2000. 82(2),F98–F107.
3. Davis EA, Cuesta-Munoz A, Raoul M, Buettger C, Sweet I, Moates M, Magnuson MA,Matschinsky FM. Mutants of glucokinase cause hypoglycaemia- and hyperglycaemia syn-dromes and their analysis illuminates fundamental quantitative concepts of glucose home-ostasis. Diabetologia, 1999. 42(10), 1175–1186.
4. Stanley CA, Lieu YK, Hsu BY, Burlina AB, Greenberg CR, Hopwood NJ, Perlman K,Rich BH, Zammarchi E, Poncz M. Hyperinsulinism and hyperammonemia in infants withregulatory mutations of the glutamate dehydrogenase gene. N Engl J Med, 1998. 338(19),1352–1357.
5. Molven A, Matre GE, Duran M, Wanders RJ, Rishaug U, Njolstad PR, Jellum E,SovikO. Familial HyperinsulinemicHypoglycemia caused by a defect in the SCHAD enzymeof mitochondrial fatty acid oxidation. Diabetes, 2004. 53(1), 221–227.
6. Molven A, RishaugU,MatreGE, Njolstad PR, Sovik O.Hunting for a hypoglycemia gene:Severe neonatal hypoglycemia in a consanguineous family. Am J Med Genet, 2002. 113(1),40–46.
7. Jack MM, Greer RM, Thomsett MJ, Walker RM, Bell JR, Choong C, Cowley DM,Herington AC, Cotterill AM. The outcome in Australian children with hyperinsulinism ofinfancy: Early extensive surgery in severe cases lowers risk of diabetes. Clin Endocrinol(Oxf), 2003. 58(3), 355–364.
17 Alanine in HI: A Silent Mutation Cries Out! 149

8. Shah JH, Maguire DJ, Brown D, Cotterill AM. The role of ATP sensitive channels ininsulin secretion and the implications in Persistent Hyperinsulinemic Hypoglycaemia ofInfancy (PHHI), In Press.
9. Database of Single Nucleotide Polymorphisms (dbSNP). Bethesda (MD): NationalCenter for Biotechnology Information, National Library of Medicine. dbSNP acces-sion:{rs5218}. Available from: http://www.ncbi.nlm.nih.gov/SNP/
10. Nielsen KB, Sorensen S, Cartegni L, Corydon TJ, Doktor TK, Schroeder LD, ReinertLS, Elpeleg O, Krainer AR, Gregersen N, Kjems J, Andresen BS. Seemingly neutralpolymorphic variants may confer immunity to splicing-inactivating mutations: A synon-ymous SNP in exon 5 of MCAD protects from deleterious mutations in a flanking exonicsplicing enhancer. Am J Hum Genet. 2007 80(3), 416–432.
11. Lowe TM, Eddy SR. tRNAscan-SE: A program for improved detection of transfer RNAgenes in genomic sequence Nucl. Acids Res. 1997. 25, 955–964. (The genomic tRNAdatabase. (http://lowelab.ucsc.edu/GtRNAdb/)
12. Nakamura, Y. Codon Usage Datebase. (http://www.kazusa.or.jp/codon/) Accessed 12thJune 2006.
150 J.H. Shah et al.

Chapter 18
Biomathematics in Cancer Detection: Simulation
of Lipogenesis in Cancer
Ping Huang, and Britton Chance1
Abstract The usual mechanisms for biochemical events are steady-state
systems without dynamic simulation. Our study is to simulate lipogenesis
from the breakdown of glucose coupled with oxidative phosphorylation in
mitochondria by using JSim (for Java Simulator) as software development
environment, which enables non-linear differential equations to be used in
a simulation giving a time course through a variety of non-steady-state condi-
tions. Glycolysis and lipogenesis coupled with oxidative phosphorylation in
mitochondria non-linear differential model is built in this paper. Simulation
and discussion on lipogenesis by carbohydrate responsive element-binding
protein (ChREBP) are given. Our model provides a potential way to analyze
the experimental databank.
18.1 Introduction
The usual mechanisms for biochemical events are steady-state systems without
dynamic simulation. We present here a mechanism based upon JSim (for
Java Simulator), which is developed by National Simulation Resource. JSim
is a software environment for scientific modeling that provides tools for devel-
opment of models, for their run-time control, and for analysis of their behavior.
JSim enables non-linear differential equations to be used in a simulation giving
a time course through a variety of non-steady-state conditions. We learn from
this of the very efficient transfer of reducing equivalents from glucose to lipid, a
pathway of some importance for lipid biosynthesis, particularly in cancer.
1Ping Huang and Britton Chance, Department of Biophysics and Biochemistry, Universityof Pennsylvania, Philadelphia, Pennsylvania 19104. Corresponding authors: Ping Huang andBritton Chance, e-mail: [email protected], [email protected].
K.A. Kang et al. (eds.), Oxygen Transport to Tissue XXIX� Springer 2008
151

18.2 Method
The energy released by the breakdown of glucose can be used to phosphorylate
ADP, forming ATP; we see that glucose by itself generates a much smaller
amount of ATP. However, during the breakdown of glucose, a large amount of
mitochondrial NADH is produced; it is this reducing agent that dramatically
increases the amount of ATP produced. We simulate glucose metabolism to
increase ATP production.Glycolysis as well as the lipogenic process could be easily incorporated into
our program as long as a simple quantitative kinetic description of this process
in brain and muscle is appropriate.The pathway from glucose to pyruvate to acetyl Co-A to citrate is in the
cytoplasm and a-ketoglutarate activity is in the mitochondria, the pathway
from citrate to MalonylCoA to Palmitate to lipids can be simulated as in
Fig. 18.1. Pyruvate reduces NAD to NADH and citrate. The definitions and
units of the symbols used in the model are listed in Table 18.1. Other equations
of oxidative phosphorylation in mitochondria are in a related papers [1–5].Glycolysis and lipogenesis non-linear differential equations are given as
following (18.1)–(18.7):
MalonylCoA
Palmitate
k_Mal = 1
k_Pal = 1
Citrate
k_Cit = 1
Lipids
Pyruvate , NADH
Glucose
k_Glu = 1
Glucose-6-P
k_Pyr = 1NADH, NAD, Pyruvate
ATPADP
Mitochondria
k_Pyr = 1
k_Glu6p = 1
Fig. 18.1 Pathway of lipogenesis from glucose to lipids and simulation results.
152 P. Huang, B. Chance

dGlu=dt ¼ �k Glu �Glu; (18:1)
dGlu6P=dt ¼ k Glu �Glu� k Glu6P �Glu6P � k Glu6P GPGLc �Glu6P;(18:2)
dPyr=dt ¼ k Glu6P �Glu6P� k Pyr � Pyr �NAD; (18:3)
dCit=dt ¼ k Pyr � Pyr �NAD� k Cit � Cit �NADH; (18:4)
dMalCoA=dt ¼ k Cit � Cit �NADH� k MalCoA �MalCoA; (18:5)
dPal=dt ¼ k MalCoA �MalCoA� k Pal � Pal; (18:6)
dLip=dt ¼ k Pal � Pal; (18:7)
18.3 Simulation Results and Discussion
ATP hydrolysis is 700 uM/min (rest state). In the lipid biosystem, all reactionrates are set to 1 (units are shown in Table 18.1). The initial values are shown inTable 18.2.
The 6-minute simulation results are shown in Fig. 18.1. The breakdown of1000uM glucose can eventually produce 450 uM lipids in 6 minutes. If we gave
Table 18.1 Definitions and units of the symbols used in the model
Symbol Definition Unit
Glu concentration of Glucose uM
Glu6P concentration of Glucose-6-P uM
Pyr concentration of Pyruvate uM
Cit concentration of Citrate uM
MalCoA concentration of MalonylCoA uM
Pal concentration of Palmitate uM
Lip concentration of Lipids uM
t time Min
k_Glu the rate of reaction : Glu! Glu6P min–1
k_Glu6P the rate of reaction: Glu6P! Pyruvate min–1
k_Pyr the rate of reaction : PyruvateþNAD!NADHþCitrate
uM–1. min–1
k_Cit the rate of reaction : CitrateþNADH!MalonylCoA
uM–1. min–1
k_MalCoA the rate of reaction: MalonylCoA! Palmitate min–1
k_Pal the rate of reaction: Palmitate! Lipids min–1
k_Glu6P_GPGLc the rate of reaction: Glu6P! GPGLc min–1
18 Biomathematics in Cancer Detection 153

2000 uM glucose as initial value, we can obtain around 900uM lipids in 6minutes.Therefore in the case of all reaction rates being set to 1, the efficiency of transfer ofreducing equivalents from glucose to lipid is about 45%.
Also we figure out the rate of glucose-6-P breakdown to pyruvate can affectthe amount of product lipids. If the rate of glucose-6-P breakdown to pyruvateis increased to 5/min, the breakdown of 1000 uM glucose can eventuallyproduce 800 uM lipids in 6 minutes, and 2000 uM glucose can eventuallyproduce 1600 uM lipids in 6 minutes, so the efficiency of transfer of reducingequivalents from glucose to lipid is about 80%. The changes of other rates in thepathway did not affect the produced lipid amount. Therefore in this mechanismthe rate of glucose-6-P breakdown to pyruvate can affect the efficient transfer ofreducing equivalents from glucose to lipid, helping us to investigate lipidbiosynthesis in cancer.
18.4 Simulation and Discussion on Lipogenesis by ChREBP
Dr. Kosaku Uyeda fromUniversity of Texas SouthwesternMedical Center hasindicated that the activation of lipogenesis by Carbohydrate responsiveelement-binding protein (ChREBP) requires many complicated processesincluding the activation of inactive ChREBP, localized in cytosol, bydephosphorylation by PP2A, then ChREBP is imported into the nucleus.mRNA synthesis requires formation of an initiation complex and binding toDNA followed by RNA polymerase reaction. To get mRNA synthesis at highglucose takes at least 24 hrs and an initial lag period may take at least 3–4 hrs.So during this initiation period there are several steps involved, the activation ofChREBP, formation of the initiation complex, and many enzyme steps in RNApolymerase reaction. But neither the rate limiting step of the overall reactionnor each major step are known.
We simulated glucose going from Glucose-6-P to xylulose 5-phosphate(Xu-5-P) pathway. We changed the rate value of ribulose-5-phosphate(Ribu-5-P) to Xu-5-P from 3/min to 12/min (4-fold increase), which stimulatedChREBP from inactivated state (in Cytosol) to activated state (in nucleus).
Table 18.2 Initial values used in the simulation
Name Value Unit
Glucose 1000 uM
Glucose-6-P 0 uM
Pyruvate 0 uM
NADH 1000 uM
Citrate 0 uM
MalonylCoA 0 uM
Palmitate 0 uM
Lipids 0 uM
154 P. Huang, B. Chance

Then the activated ChREBP signaled the enzymes of the lipogenesispathway.The rates on the pathway from citrate to lipids is increased accord-ingly (4 fold). The lipogenesis by the ChREBP pathway and simulation resultsare shown in Fig. 18.2, as are the dynamic flux changes. So Xu-5-P is activatedby glycolysis, and it activates the lipid biosynthesis pathway byChREBP so thatthe pyruvate which we get from activated glycolysis goes into the CAC, makescitrate, from citrate. It makes triglyceride with activation from Xu-5-P.
18.5 Conclusions
Our model provides a potential way to analyze the experimental databank byfitting the data to our model to deduce the parameters of lipogenesis from thebreakdown of glucose coupled with oxidative phosphorylation in mitochondriaglycolysis and lipogenesis in the cancer state.
References
1. Ping Huang and Britton Chance, Simulation of Mitochondrial Function in Brain andMuscle Tissues, Biomedical Optics 2006 OSA (Optical Society of America), ME39, ISBN1-55752-807-1. Fort Lauderdale, Florida, USA. March 19–22 (2006).
2. Zheng Li, Tada Yipintsoi and James B. Bassingthwaighte, ‘‘Nonlinear Model forCapillary-Tissue Oxygen Transport and Metabolism,’’ ABE 25, 604–619 (1997).
Pyruvate
Glucose
k Glu = 1
Glucose-6-P
k Glu6p = 1
k Pyr = 1
k_Glu6P_GPGLc = 1
k Pyr = 1 Citrate MalonylCoA k Cit Palmitatek Mal k Pal
GPGLc
k_GPGLc_Ribu5P = 1.7
k_Ribu5P_GPGLc = 1
Ribu-5-P
k_Ribu5P_Xu5P
k_Xu5P_Ribu5P=3
Xu-5-P
NADH, NAD, Pyruvate
ATPADP
Mitochondria
Nucleus
ChREBP(inactivated)
ChREBP(activated)
Fig. 18.2 Pathway of lipogenesis from glucose to lipids by ChREBP and simulation results.
18 Biomathematics in Cancer Detection 155

3. Bernard Korzeniewski, Jerzy A. Zoladz, ‘‘A model of oxidative phosphorylation inmammalian skeletal muscle,’’ JBC 92, 17–34 (2001).
4. Chandan K. Sen, Lester Packer and Osmo O.P. Hanninen, Handbook of oxidants andantioxidants in exercise (Elsevier Science B.V., 2000).
5. ‘‘Modeling and imaging, the national simulation resource in circulatory mass-transport &exchange,’’ NSR Simulation Analysis Workshop, University of Washington, Sept. (2001).
156 P. Huang, B. Chance

Chapter 19
Activity of Drug Efflux Transporters in Tumor
Cells Under Hypoxic Conditions
Oliver Thews1, Birgit Gassner2, Debra K. Kelleher1, and Michael Gekle2
Abstract Tumor cells exhibit mechanisms by which chemotherapeutic drugscan be actively pumped out of the cell (e.g., p-glycoprotein pGP, MRP1),resulting in a multidrug resistant phenotype. Many human tumors show pro-nounced hypoxia which can result in a local ATP depletion which in turn maycompromise the efficacy of these transporters. The aim of this study was there-fore to assess the transport activity and expression of drug transporters underhypoxic conditions. Prostate carcinoma cells (R3327-AT1) were exposed tohypoxia (pO2<0.5 mmHg) for up to 24h and pump activity was determinedby an efflux assay. The results showed that exposing cells to hypoxia for 3–6 hled to a moderate increase in pGP activity. After 24 h pGP activity was reducedby 44% compared to control levels. Hypoxia reduced the MRP1 activity to alesser extent (by 25%). However, the expression of pGP andMRP1 was almostindependent of the medium pO2. In conclusion, pronounced hypoxia had onlyminor effects on the activity of drug transporters with the activity decreasingonly after 12–24 h under hypoxia, possibly as a result of ATP depletion. Instead,indirect effects of hypoxia leading to extracellular acidosis seem to have a muchmore pronounced effect on pGP activity.
19.1 Introduction
Many tumors exhibit mechanisms by which chemotherapeutic agents can beactively transported out of the cell, leading to a chemoresistant phenotype(MDR=multidrug resistance) [1]. Up until now, a large number of thesetransporters belonging to the ABC (ATP-binding cassette) family havebeen identified. Clinically important representatives of this family are the p-glycoprotein (pGP), the product of the MDR1 gene, and the multidrug resis-tance-related protein 1 (MRP1 [1,2]. These membrane proteins are able to
1Institute of Physiology and Pathophysiology, University of Mainz, 55099 Mainz, Germany.2Institute of Physiology, University of Wurzburg, 97070 Wurzburg, Germany.
K.A. Kang et al. (eds.), Oxygen Transport to Tissue XXIX� Springer 2008
157

actively pump various drugs (e.g., doxorubicin, vinblastine, paclitaxel) out ofthe cell and in this way can reduce the cytotoxic efficacy of these drugs [1]. Atthe same time, various inhibitors of pGP have been identified (e.g. verapamil,probenecid), which are capable of reducing the chemoresistance of pGP- orMRP1-expressing tumor cells, at least in cell culture experiments [1,3,4].
The tumor vasculature exhibits numerous structural and functional abnorm-alities, leading to an inadequate, chaotic perfusion thus resulting in an insuffi-cient O2 supply to the tissue [5]. As a consequence, the mean oxygen partialpressure (pO2) in tumors is often considerably lower than in the surroundingnormal tissue, with areas of severe hypoxia or even anoxia in vital tumor tissuein approx. 60% of human tumors [6]. Correspondingly, tumor cells switch toanaerobic glycolysis which is – from an energetic point of view – less effectiveand result in a lack of ATP [5].
Since ABC-transporters use ATP hydrolysis as an energy source, the ques-tion arises of whether tumor hypoxia can affect the transport efficacy of pGP orMRP1. The aim of this study was to analyze the transport activity and expres-sion of ABC-transporters under hypoxic conditions in vitro.
19.2 Material and Methods
19.2.1 Cell Line
The subline AT1 of the R-3327 Dunning-prostate carcinoma of the rat was usedin all experiments. Cells were grown in RPMI 1640 medium supplemented with10% fetal calf serum (FCS) at 378Cunder a humidified 5%CO2 atmosphere andpassaged once per week. Twenty-four hours prior to the experiments, cells weretransferred to RPMI medium without FCS supplementation. The medium wasbuffered with 20mM HEPES adjusted to a pH of 7.4. In hypoxia experiments,cells were gassed with a mixture containing 95%N2 and 5%CO2 for up to 24 h.
19.2.2 MDR1 and pGP Transport Activity
In order to assess the activity of the MRP1 or the pGP, the efflux rate of afluorescent substrate of the respective transporter in the presence or absence ofa specific inhibitor was measured. For pGPmeasurements, cells were incubatedwith rhodamine (0.5 mM, dissolved in Ringer solution) for 30 min at 378C.Subsequently, the rhodamine-containing solution was removed, the cellsrapidly washed with PBS at 48C and then incubated with fresh rhodamine-free Ringer solution. Samples (100 mL) of the supernatant were taken at 0, 5, 15,and 45 min after medium exchange. The rhodamine-123 efflux rate could thenbe calculated from the increase in the rhodamine-123 concentration in the
158 O. Thews et al.

Ringer solution as determined by fluorimetric measurements using a fluores-cence microplate reader (Victor [2], Wallac, Turku, Finland) with excitation/emission wavelengths of 485/535 nm. In order to determine the pGP-mediatedefflux rate, a second set of cells were primarily incubated with rhodamine-123 asdescribed above, but thereafter the solution was replaced by a rhodamine-freeRinger solution containing verapamil (10 mM, dissolved in EtOH). Due to theinhibition of pGP by verapamil, the rhodamine-efflux rate was slower. Theratio of the efflux rate without and with verapamil was used as a measure ofthe activity of the pGP-mediated efflux [7]. Measurements of the MRP1 activitywere performed in the same manner except that Calcein-AM (Invitrogen, Carls-bad, USA; 0.1 mM, dissolved in Ringer solution) was used as the fluorescentsubstrate and probenecid (2 mM dissolved in Ringer solution) as an MRP1inhibitor.
All values obtained were normalized relative to the protein content in eachPetri dish determined with the bicinchoninic acid (BCA) assay (Pierce, KMFLaborchemie, Sankt Augustin, Germany).
19.2.3 MRP1 and pGP Expression
The cellular expression of MRP1 and pGP was determined in a whole cellELISA, as described previously [8]. In brief, after cell fixation with 4% paraf-ormaldehyde for 60 min, cells were washed with a permeabilizing buffer con-taining 0.1% Triton X-100 and then incubated for 20 min with this buffer towhich 0.6%H2O2 had been added. After incubation with the primary anti-pGP(C219, Signet Laboratories, Dedham, USA) or anti-MRP1 (N19, Santa CruzBiotechnology, Heidelberg, Germany) antibody (diluted 1:1000), respectively,at 48C overnight, cells were washed and incubated with a secondary anti-mouseperoxidase antibody (diluted 1:1000) for 1 h. Thereafter, cells were incubatedwith a HRP-substrate (containing 0.5 mg/mL o-phenylenediamine,11.8 mg/mL Na2HPO4 2H2O, 7.3 mg/mL citric acid and 0.015% H2O2) for15 min and measured photometrically at a wavelength of 490 nm using amicroplate reader (Victor2, Wallac, Turku, Finland). In order to normalizepGP-expression for the number of cells in each well, the permeabilized cellswere subsequently incubated with 0.2% trypan blue solution for 5 min, washedwith PBS, dissolved in 1% SDS and the trypan blue concentration as a measureof cell number was determined photometrically.
19.2.4 Metabolic Parameters
The glucose and lactate concentrations of the medium were measured enzyma-tically using standard test kits (#1447521 and #1822837; Roche-Diagnostics,Indianapolis, USA).
19 Activity of Drug Efflux Transporters in Tumor Cells Under Hypoxic Conditions 159

19.2.5 Statistical Analysis
Results are expressed as means� standard error of the mean (SEM). Differences
between the groups were assessed using the two-tailedWilcoxon test for unpaired
samples. The significance level was set at �=5%.
19.3 Results
Maintaining AT1 cells under pronounced hypoxia (pO2<0.5 mmHg) for up to
24 h leads to forced glycolysis as indicated by a substantial increase in the lactate
concentration of the medium up to 14.3�0.2 mmol/L (Fig. 19.1B). In parallel,
the glucose level decreased to 1.1�0.4 mmol/L after 24 h under hypoxia (Fig.
19.1A). Since our intention was to solely study the effect of hypoxia on the
transporter activity, the medium was buffered with 20 mM HEPES. For this
reason, the pH decreased only slightly to 7.18�0.01 after 24 h (Fig. 19.1C).
0 6 12 18 24time under hypoxic conditions [h]
6.0
6.5
7.0
7.5
extr
acel
lula
r pH
n = 1802468
1012
gluc
ose
conc
. [m
M]
n = 18
0
5
10
15
lact
ate
conc
. [m
M]
n = 6
A
B
C
Fig. 19.1 (A) Glucose and (B) lactate concentrations as well as (C) the extracellular pH in themedium under hypoxic conditions (pO2<0.5 mmHg) for up to 24 h. Data are expressed asmean � SEM; n: number of experiments. All values were statistically significantly differentfrom the values at t=0 h.
160 O. Thews et al.

The transport activity of pGP was measured by determining the rhodamine
efflux rate in the absence and presence of an inhibitor. The ratio of the efflux
without and with verapamil was used as a measure of the activity of pGP [7].
All values were normalized with respect to the pump activity under control
conditions at t=0 h. Exposing the cells to hypoxia for 3–6 h led to a moderate
(but not statistically significant) increase in pGP activity by 19–24%
(Fig. 19.2A). After 12 h under hypoxic conditions the rhodamine efflux rate
returned to control levels whereas after 24 h pGP activity was reduced by
44�15% below control levels (Fig. 19.2A). These differences in activity could
be either the result of an increase in cellular pGP-expression or a higher activity
of the pre-existing transporters. The analysis of expression showed that hypoxic
conditions over 3-6 h caused almost no change in pGP protein content (Fig.
19.2B). After 12 h, a small (however not statistically significant) increase by
19�8% in expression was seen. After 24 h the expression decreased 19�4%below the control level.
The analysis of the multidrug resistance-related protein 1 (MRP1) showed
that hypoxic conditions for up to 6 h had almost no impact on the transporter
activity (Fig. 19.3A). Thereafter the MRP1 transport rate decreased by 24 to
28%.MRP1 expression did not change appreciably throughout the observation
period (Fig. 19.3B).
0
50
100
150
rela
tive
pGP
-ac
tivity
[%]
rela
tive
pGP
-ex
pres
sion
[%]
n = 8-9
*
*
*
*
0 6 12 18 24time under hypoxic conditions [h]
50
100
150
n = 12
B
A
Fig. 19.2 (A) Activity and (B) expression of pGP (p-glycoprotein) in AT1 cells under hypoxicconditions (pO2<0.5 mmHg) for up to 24 h. Data are normalized to control values at t=0 hand expressed as mean � SEM; n: number of experiments; (*) p<0.05.
19 Activity of Drug Efflux Transporters in Tumor Cells Under Hypoxic Conditions 161

19.4 Discussion
In the present study, the impact of hypoxia – a common phenomenon in human
tumors [6] – on the activity and expression of two drug transporting proteins
were analyzed in cell culture experiments. For this, tumor cells were exposed to
a hypoxic atmosphere (pO2<0.5 mmHg) for up to 24 h forcing glycolytic
metabolism as indicated by a rapid increase in the extracellular lactate concen-
tration (Fig. 19.1B). Since the aim of this study was to solely analyze the impact
of hypoxia and not changes due to a concomitant extracellular acidosis, the
medium was buffered so that the medium pH remained practically constant
(Fig. 19.1C). This experimental design was necessary since previous results
showed a medium pH of 6.6 (without hypoxia) to have a strong impact on the
pGP-mediated transport rate [9].The R-3327 AT-1 cell line used is known to functionally express the
p-glycoprotein [4]. In the present study, the daunorubicin efflux from the cells
was 1.75�0.37 times slower in the presence of the pGP-inhibitor verapamil. The
cells also functionally express MRP1 as indicated by a 2.27�0.28 times lower
calcein-AM efflux rate when cells were simultaneously incubated with the
known MRP1-inhibitor probenecid. Since in more than 60% of human tumors
the oxygen supply to the tissue is insufficient [6], solid tumors often show a
pronounced glycolytic metabolism which may result in an ATP deficiency [5,10]
0
50
100
150re
lativ
e M
RP
1-ac
tivity
[%]
n = 8-9
0 6 12 18 24time under hypoxic conditions [h]
50
100
150
rela
tive
MR
P1-
expr
essi
on [%
]
n = 10
A
B
Fig. 19.3 Relative (A) activity and (B) expression of MRP1 (multidrug resistance relatedprotein 1) in AT1 cells under hypoxic conditions (pO2<0.5 mmHg) for up to 24 h. Data arenormalized with respect to control values at t=0 h and expressed as mean� SEM; n: numberof experiments.
162 O. Thews et al.

For this reason, it might be expected that ATP-consuming cellular processessuch as active drug transport might be compromised. However, compared tocontrol conditions, pGP-activity was even higher (approx. 20%, not statisticallysignificant) despite the increased glycolytic metabolism (Fig. 19.2A). A reduc-tion in the daunorubicin efflux of 44% was observed only after exposure tohypoxia for 24 h. After this period the glucose level in the medium decreased to1.1�0.4 mmol/L which may in turn have reduced cellular ATP formationresulting in a reduction in pGP activity. This slight decrease in the transportrate after 24 h was also seen for the MRP1-mediated efflux (Fig. 19.3A).However, further measurements are necessary to analyze the cellular ATPlevel after 24 h of severe hypoxia. A decrease in ATP could be responsible fora reduction in drug transporter activity. It has been proposed that inhibition ofaerobic metabolism (leading to a dramatic decrease in ATP levels) could be apossible therapeutic strategy for overcoming drug resistance. Xu and coworkers[11] showed that inhibition of mitochondrial respiration leads to an increase inthe cytotoxic efficacy of various chemotherapeutic drugs, probably as a result ofa reduced pGP-activity which was attributed to a depletion of ATP.
Despite the slight increase in pGP-activity 3 to 6 h after exposure tohypoxic conditions, the environmental hypoxia did not markedly changepGP-expression (Fig. 19.2B) over this time interval. These results are inaccordance with previous studies showing that hypoxia/anoxia had almostno impact on pGP expression [12,13]. Only Comerford and colleagues [14]found an induction of MDR1 after 48 h in an O2-deprived medium. However,in the latter study, hypoxia was defined as a pO2 in the culture medium of 20mmHg which is not comparable to the pO2 used in the present study andwhich is much higher than the pO2 found in solid-growing tumors [5,6]. Thediscrepancy between the studies may be the result of differences in the celllines, levels of hypoxia and durations of hypoxia exposure used.
In conclusion, the results of the present study show pronounced hypoxia(comparable to that found in solid-growing tumors) to have only minor effectson the activity of drug transporters. The small increase in pGP activity after 3–6 hwas not the result of a change in the number of transport molecules (as indicatedby the expression measurements) but instead due to a functional modulation ofthe pump. However, previous studies using the same tumor cell model clearlydemonstrated that indirect effects of hypoxia leading to extracellular acidosishave a much stronger effect on the p-glycoprotein activity. When cells wereexposed to an extracellular pH of 6.6, the pGP-mediated transport rate wasmore than doubled resulting in a significant reduction of cytotoxicity of chemo-therapeutic drugs known to be substrates for the p-glycoprotein [9]. Insufficientoxygen supply to tumor tissue seems to play a role in the chemosensitivity oftumor cells although this impact seems to be indirectly mediated through theacidic environment which develops due to tumor hypoxia.
Acknowledgment This study was supported by the Deutsche Krebshilfe (grants 106774 and106906).
19 Activity of Drug Efflux Transporters in Tumor Cells Under Hypoxic Conditions 163

References
1. A.H. Schinkel and J.W. Jonker. Mammalian drug efflux transporters of the ATP bindingcassette (ABC) family: an overview. Adv. Drug Deliv. Rev. 55, 3–29 (2003).
2. S.V. Ambudkar, C. Kimchi-Sarfaty, Z.E. Sauna, and M.M. Gottesman. P-glycoprotein:from genomics to mechanism. Oncogene 22, 7468–7485 (2003).
3. T. Fojo and S. Bates. Strategies for reversing drug resistance. Oncogene 22, 7512–7523(2003).
4. M.J. Siegsmund, C. Kreukler, A. Steidler, T. Nebe, K.U. Kohrmann, and P. Alken.Multidrug resistance in androgen-independent growing rat prostate carcinoma cells ismediated by P-glycoprotein. Urol. Res. 25, 35–41 (1997).
5. P. Vaupel, F. Kallinowski, and P. Okunieff. Blood flow, oxygen and nutrient supply, andmetabolic microenvironment of human tumors: a review. Cancer Res. 49, 6449–6465(1989).
6. M. Hockel and P. Vaupel. Tumor hypoxia: definitions and current clinical, biological,and molecular aspects. J. Natl. Cancer Inst. 93, 266–276 (2001).
7. G. Lee and M. Piquette-Miller. Cytokines alter the expression and activity of the multi-drug resistance transporters in human hepatoma cell lines; analysis using RT-PCR andcDNA microarrays. J. Pharm. Sci. 92, 2152–2163 (2003).
8. H.H. Versteeg, E. Nijhuis, G.R. van den Brink, M. Evertzen, G.N. Pynaert, S.J. vanDeventer, P.J. Coffer, and M.P. Peppelenbosch. A new phosphospecific cell-basedELISA for p42/p44 mitogen-activated protein kinase (MAPK), p38 MAPK, proteinkinase B and cAMP-response-element-binding protein. Biochem. J. 350, 717–722 (2000).
9. O. Thews, B.Gassner, D.K.Kelleher, G. Schwerdt, andM.Gekle. Impact of extracellularacidity on the activity of p-glycoprotein and the cytotoxicity of chemotherapeutic drugs.Neoplasia 8, 143–152 (2006).
10. P. Vaupel, C. Schaefer, and P. Okunieff. Intracellular acidosis in murine fibrosarcomascoincides with ATP depletion, hypoxia, and high levels of lactate and total Pi. NMRBiomed. 7, 128–136 (1994).
11. R.H. Xu, H. Pelicano, Y. Zhou, J.S. Carew, L. Feng, K.N. Bhalla, M.J. Keating, andP. Huang. Inhibition of glycolysis in cancer cells: a novel strategy to overcome drugresistance associated with mitochondrial respiratory defect and hypoxia. Cancer Res. 65,613–621 (2005).
12. B.C. Liang. Effects of hypoxia on drug resistance phenotype and genotype in humanglioma cell lines. J. Neurooncol. 29, 149–155 (1996).
13. K. Sakata, T.T.Kwok,B.J.Murphy,K.R.Laderoute,G.R.Gordon, andR.M. Sutherland.Hypoxia-induced drug resistance: comparison to P-glycoprotein-associated drug resistance.Br. J. Cancer 64, 809–814 (1991).
14. K.M.Comerford, T.J.Wallace, J.Karhausen,N.A. Louis,M.C.Montalto, and S.P. Colgan.Hypoxia-inducible factor-1-dependent regulation of the multidrug resistance (MDR1) gene.Cancer Res. 62, 3387–3394 (2002).
164 O. Thews et al.

Chapter 20
Antioxidants Reduce Consequences
of Radiation Exposure
Paul Okunieff, Steven Swarts, Peter Keng, Weimin Sun, Wei Wang, Jung Kim,
Shanmin Yang, Hengshan Zhang, Chaomei Liu, Jacqueline P. Williams,
Amy K. Huser, and Lurong Zhang1
Abstract Antioxidants have been studied for their capacity to reduce the cyto-toxic effects of radiation in normal tissues for at least 50 years. Early researchidentified sulfur-containing antioxidants as those with the most beneficial ther-apeutic ratio, even though these compounds have substantial toxicity whengiven in-vivo. Other antioxidant molecules (small molecules and enzymatic)have been studied for their capacity to prevent radiation toxicity both withregard to reduction of radiation-related cytotoxicity and for reduction of indir-ect radiation effects including long-term oxidative damage. Finally, categories ofradiation protectors that are not primarily antioxidants, including those that actthrough acceleration of cell proliferation (e.g. growth factors), prevention ofapoptosis, other cellular signaling effects (e.g. cytokine signal modifiers), oraugmentation of DNA repair, all have direct or indirect effects on cellularredox state and levels of endogenous antioxidants. In this review we discusswhat is known about the radioprotective properties of antioxidants, and whatthose properties tell us about the DNA and other cellular targets of radiation.
20.1 Introduction
There are many types of radiation damage to normal tissues. The types ofdamage depend on the cells and organs being irradiated, the dose and doserate of the exposure, and the time after exposure that is being assayed for aradiation effect. Many of the types of damage seen after irradiation can beameliorated by antioxidants. This review will outline a number of radiation-related toxicological processes and discuss the role antioxidants might play inaffecting these processes in terms of the likely cellular types or compartments in
1Paul Okunieff, Steven Swarts, Peter Keng, Weimin Sun, Wei Wang, Jung Kim, ShanminYang, Hengshan Zhang, Chaomei Liu, Jacqueline P. Williams, Amy K. Huser, andLurong Zhang, Department of Radiation Oncology, University of RochesterMedical Center,Rochester, NY 14642.
K.A. Kang et al. (eds.), Oxygen Transport to Tissue XXIX� Springer 2008
165

which an antioxidant is employed. The role that different combinations ofantioxidants might play in preventing each of these individual effects will alsobe explored.
20.2 Cell Components
Exposure of a cell to ionizing radiation results in the formation of free radicalswithin the cell, leading to damage of cellular components. Here we will providesome examples of how antioxidants reduce or prevent the damaging effects ofradiation at three sensitive targets in the cell, the nucleus, cellular membranesand mitochondria.
20.2.1 Nucleus
20.2.1.1 Immediate Effects by Antioxidants
Radiation-induced DNA damage is the best studied effect of radiation. Anoxygen enhancement ratio (OER) of 2.5 to 3 in the yield of DNA damage isobserved in the presence of oxygen tensions of 5 mmHg or higher compared tomaximally hypoxic conditions (<1mmHg). In accordance with this difference inDNA damage, there is a 3-fold difference in cell reproductive survival measuredby clonogenic assays in the presence of oxygen which is generally independent ofthe phase of the cell cycle [1]. Prevention of immediate radiation-induced geno-toxicity requires that an antioxidant be present at the time of irradiation [2]. Tobe maximally effective the antioxidant must be present near the DNA and thusmust have access to the nucleus. It must be able to either, 1) react with all theoxygen-related free radicals and detoxify them to radicals that are not them-selves genotoxic and/or 2) effectively compete with oxygen to repair damage tothe DNA chemically through reactions with free radicals on the DNA. Thiol-based compounds are especially good antioxidants because these compoundsare capable of both scavenging oxygen radicals and affecting chemical repair ofsome forms of DNA damage with the subsequent formation of sulfur-basedradicals, which are not reactive with DNA [3]. Incorporating one or morepositive charges on the thiol-based antioxidant has the effect of changing theproximity of the compound to the DNA [4,5]. The resulting counter-ion con-densation between the positive charge of the thiol and the negatively chargedsugar-phosphate backbone of the DNA binds the thiol close to the DNA,facilitating the competition of the thiol with oxygen in reactions with DNAradicals, thereby, reducing DNA damage and increasing cell survival [5,6].
Like the synthetic antioxidants (e.g., amifostine, captopril, and NAC), anti-oxidants derived from natural sources also exhibit dose-modifying effects onDNA damage and cell survival when present at the time of irradiation. This
166 P. Okunieff et al.

immediate protection is mediated by the scavenging of radicals. For example,there are a number of antioxidants, including caffeine, melatonin, flavonoids,polyphenols, and other phytochemicals (e.g., albana), which are shown todecrease radiation-induced damage in either plasmid or cellular DNA throughthe scavenging of oxygen radicals and/or peroxides [7–12].
Uptake and distribution of antioxidants also plays a role in their dose-modifying effects.With amifostine, there is differential uptake of the compoundin tumors and normal tissues. In tumors, the uptake is predominantly throughpassive diffusion, which is slow due to the hydrophilicity of the compound [13].This is in contrast to the dephosphorylated form of the compound, WR-1065,which is less hydrophilic and readily crosses the tumor cell membrane. In fact,Brown et al [14]. suggested that the hydrophilicity of the compound could beuseful for designing or selecting better differential radioprotectors. This issupported by their work that showed increases in the therapeutic gain (ratioof the dose reduction factors for the hematopoietic system and tumor) for6 hydrophilic thiols, ranging from 1.59 to 2.29, in comparison to values rangingfrom 0.88 to 1.59 for 5 lipophilic thiols. In normal tissues, there is active uptakeof amifostine through the polyamine transport system [15]. This active trans-port results in a preferential uptake of the antioxidant into normal tissues ascompared to tumors [13]. Another factor that aids in the differential uptake ofamifostine into normal tissues is the higher concentration of alkaline phopha-tases in these tissues as compared to tumors, converting amifostine to WR-1065, which is then readily taken up by normal tissues [16]. However, the levelsand distributions of the aminothiol can vary between andwithin tissues, leadingto variations in the dose-modifying effects of this compound in irradiatedtissues [17]. These variations can be attributed to differing degrees of negativefeedback on the polyamine transport as a consequence of variable polyamineconcentrations with tissues, thereby reducing or inhibiting the uptake of ami-fostine, and to differences in oxygen concentration within tissues [17,18]. Also,there is a limit to which cells can take up and accumulate thiol-based antiox-idants before the compounds become cytotoxic. For example, in several tumorlines, concentrations of WR-1065 greater than 25–30 nmole/106 cells inducedsignificant cytotoxicity in unirradiated cells [19]. In-vivo these agents causeperipheral neuropathies and hypotension [20]. Clinically speaking, althoughthe impact of amifostine and similar thiol-based antioxidants can theoreticallybe as great as a factor of 3 in dose modification, no antioxidant reaches thispotential and few if any alter the in-vivo tolerance to irradiation by more than afactor of 1.3 when administered at concentrations below those that elicit hemo-dynamic- or cyto-toxicities in unirradiated controls [2,11,14].
20.2.1.2 Chronic Radioprotective Effects by Antioxidants
For many antioxidants, the impact that these compounds have on radiation-induced damage and the biological consequences of the damage within cells and
20 Antioxidants Reduce Consequences of Radiation Exposure 167

tissues can extend to their direct or indirect interactionwith other cellular targets.For example, melatonin has been shown to augment the activity of glutathioneperoxidase in addition to stimulating the activity of glutathione reductase andincreasing the synthesis of glutathione (GSH); all of which are important inreducing levels of oxygen radicals and peroxides in cells [8]. In addition, WR-1065 has been shown to induce a delayed radioprotective effect through theactivation of the redox-sensitive nuclear transcription factor, NFkB, andsubsequent expression of the antioxidant enzyme, manganese superoxide dis-mutase (MnSOD). Other thiols, such as captopril ([S]-1-[3-mercapto-2-methyl-1-oxo-propyl]-L-proline), mesna (sodium-2-mercapto-ethane-sulfonate), andNAC demonstrated similar effects to those observed for WR-1065 with respectto increasing cell survival [21]. The involvement of NFkB in the induced expres-sion of MnSOD was shown in experiments where pretreatment of humanmicrovascular endothelial cells with Helenalin, an inhibitor of NFkB, prior totreatment with WR-1065, prevented the thiol-induced activation of NFkB andsubsequent elevation in MnSOD levels [22].
20.2.2 Membranes
The irradiation of lipid membranes is known to cause an increase in the forma-tion of lipid radicals and peroxides that can result in damage or release ofmembrane proteins [23], in addition to the liberation of products formed fromthe peroxidation of lipids that subsequently react with and alter cellular com-ponents [24]. Various natural and synthetic antioxidants are known to decreasethe peroxidation of membrane lipids. For example, pretreatment of mice withdiethyldithiocarbamate (DDTC) prior to whole body dose resulted in a two-fold decrease in lipid peroxidation in isolated liver microsomes, as comparedwith irradiated control mice [25]. In a recent study, disulfiram, a drug that isused in treating alcohol abuse, inhibited lipid peroxidation in microsomes andreduced lipid peroxides in whole-body-irradiated mice by 65% compared withunirradiated controls [26]. The flavonoid, luteolin, reduced lipid peroxidationby almost 4-fold 48 h post-radiation in comparison with radiation controls inmouse bone marrow cells when mice were pre-treated with the flavonoid for2 hours before irradiation [27]. In a variation on structural design, the antiox-idant, tocopherol-monoglucoside (TMG), is a water soluble derivative of thelipophilic parent compound, a-tocopherol. This structural modification allowsTMG to scavenge oxygen radicals, such as peroxides, superoxides, and hydro-xyl radicals, in both water and lipid phase [28]. Additionally, the compound alsoincreases the levels of glutathione peroxidase (GPx) in treated cells.
It is known that the active form of vitamin E in membranes is maintainedthrough reactions with ascorbic acid [29]. Without this regenerative mechanism,the active formof vitaminEwould be rapidly exhausted inmembranes. Therefore,the optimal properties of antioxidants designed to protect cellularmembranes are,
168 P. Okunieff et al.

1) an ability to scavenge lipid radicals and react with lipid peroxides inmembranes
at concentrations that will not alter the structure or properties of the membrane,
and 2) provide for the maximum interaction of the compound with cytosolic-
reducing agents (ascorbic acid or GSH) to regenerate the antioxidant. This
strategy also necessitates the use of multiple antioxidant therapy, for example
the combination of vitamin E and vitamin C, which provide both an effective
protection of membranes and increased radioresistance in cells [30, 31].
20.2.3 Mitochondria
The mitochondrion is the cellular organelle responsible for energy generation in
the cell through the production of ATP [23]. Mitochondria, like the nucleus,
contain DNA and this DNA is required for proper mitochondrial function and
for mitochondrial replication. Replication of mitochondria occurs naturally in
non-dividing cells. The impact of radiation on mitochondrial DNA likely does
not result in changes in reproductive integrity and thus clonogenic survival,
which is perhaps why it is rarely studied. Long-term cellular health however
clearly requires cells to have a continuous supply of mitochondria for normal
functioning.MitochondrialDNAhas the advantage over nuclearDNA in that it
is present in many replicates (instead of just duplicate), can increase the number
of DNA copies in response to radiation exposure, and the mitochondria is
naturally high in antioxidant capacity [23,32]. In comparison, however, to the
nuclear DNA, nucleotide excision repair of mitochondrial DNA is lacking [33]
and repair is not efficient for specific classes of DNA damage, such as bulky
lesions, and some types of alkaline-labile sites and single strand breaks [34,35]
(Table 20.1). Also, although not yet shown, the fidelity of the repair of radiation-
induced damage at clustered sites in mitochondrial DNA is likely to be adversely
impacted in a similar fashion to clustered lesions in nuclear DNA [36–38].A consequence of mitochondrial energy generation (ATP synthesis) is the
evolution of heat (entropy) and the production of ROS. Mitochondria have an
inherent antioxidant capacity (e.g., the interaction between GSH, GPx,
glutathione reductase [GRd], and MnSOD) to counteract much of the ROS.
Stressors, such as ionizing radiation, damage the mitochondrial function, likely
leading to additional ROS production which can overwhelm the antioxidant
capacity of the organelle. The unscavenged ROS may produce further damage
to mitochondrial components, including mitochondrial DNA, leading to
additional mitochondrial damage and ROS formation. Providing additional
antioxidant capacity to mitochondria, either through uptake of additional
antioxidant agents like vitamin E, or through increasing the levels of GSH
and mitochondrial antioxidant enzymes, can provide the necessary antioxidant
buffer to scavenge additional ROS produced as a consequence of exposure to
radiation and thereby minimize damage to mitochondria and its DNA.
20 Antioxidants Reduce Consequences of Radiation Exposure 169

The antioxidant, melatonin, is particularly effective at protecting mito-chondria by increasing the efficiency of oxidative phosphorylation, therebyreducing the leakage of electrons from the electron transport chain [8]. Thereduction of electron leakage decreases the formation of ROS from theseelectrons and, therefore, damage to mitochondria. Additionally, melatonininduces the levels of antioxidant enzymes, such as GPx and, more impor-tantly, also increases GSH levels within the cell. This latter effect can reducethe levels of radiation-induced oxygen radicals and peroxides in mitochondriathrough the increased availability of glutathione for GSH/GSSG cycling thatis used in regenerating GPx [8]. A similar redox cycle has been proposed forWR-1065 to explain the regeneration of the thiol after it is converted to thedisulfide form following reactions with lipid peroxides in the mitochondrialmembrane. In this case, the disulfide form of WR-1065 is recycled to thereduced state through the oxidation of GSH to the disulfide, GSSG. TheGSSG is then reduced to GSH by GRd [39].
Protection of the mitochondria can be further facilitated through the develop-ment of antioxidants that are designed either for increased uptake intomitochon-dria, or to increase the activity of antioxidant enzymes. Linking the positively-charged functional group, alkyl-triphenyl-phosphonium ion, to vitamin E or
Table 20.1 Characteristic differences between DNA in the nucleus and mitochondria
Parameter Nucleus Mitochondria Advantage
Target Size Under 30,000 genes 37 genes Mitochondria
DNA/GeneRatio
High Low Nucleus
OxygenTension
Normoxic Potentially Hypoxic Mitochondria
RepairCapacity
>99.9% SSB and 98% DSBrepaired
Low repair Nucleus
Gene Copies One duplicate copy per cell High number ofreplicates per cell
Mitochondria
RadicalLevels
Low radical environment High radical environment Nucleus
AntioxidantLevel
Moderate antioxidantenvironment
High antioxidantenvironment
Mitochondria
The DNA in the nucleus and mitochondria have different oxidative environments andmechanisms for repair of oxidative damage. This leads to different temporal and functionalDNA damage responses following irradiation. Mitochondrial DNA has an advantage in thecase of radiation due to its small mass, its large number of replicates, and its naturally highantioxidant capacity. Nuclear DNA enjoys a powerful set of enzymatically mediated DNArepair pathways; mitochondrial DNA instead relies more on the presence of antioxidants.Due to the lower degree of repair capability and fidelity of direct damage in mitochondrialDNA, continuous low dose rate radiation and very late manifestation of radiation damagemight be a relative disadvantage to mitochondrial DNA compared with nuclear DNA. Aftertherapeutic radiation or other high dose or high dose rate exposure, early cytotoxicity isprobably not due to DNA damage of the mitochondria. There are no comprehensive studiesof late radiation toxicity to the mitochondria, so the degree to which this organelle impactscertain radiation scenarios months or years after exposure remains unknown.
170 P. Okunieff et al.

ubiquinone (CoQ) increased the uptake of these antioxidants into the mitochon-drial matrix [23]. However, studies to determine how this structural modificationmight influence the radioprotection of mitochondria have not yet beenperformed. Increasing the levels of antioxidant enzyme activity in mitochondriahas been shown to occur with the administration of SOD mimetics or throughover-expression of MnSOD by transfection of a transgene [40]. Anotherapproach to increasing mitochondrial content of an antioxidant is to takeadvantage of the low pH outside of the inner membrane of the mitochrondrionwhereby functional groups on the compound undergo protonation to change thecharge on the molecule and, thereby, prevent the elimination of the compoundfrom the mitochondrion.
20.3 Apoptosis
Reactive oxygen species play a pivotal role in the initiation of apoptosis, andantioxidants have been shown to have the ability to inhibit apoptosis. Thisinhibitory effect appears to occur through a number of pathways but has as acommon result, the preservation of mitochondrial membrane integrity and theelectrochemical gradient (�P) across the membrane. It is suggested that scaven-ging of ROS by antioxidants interferes with the initiation of apoptosis bydepleting ROS levels in cells and maintaining membrane integrity [41]. Also,antioxidants like the water soluble vitamin E derivative, trolox, reduce bothlipid membrane peroxidation and the post-irradiation uptake of calcium,thereby inhibiting apoptosis [42]. Reduction in lipid peroxides and decreasedapoptotic indices were also found in irradiated mice treated either with SOD or,more effectively, with the combination of catalase and trolox [43].
Antioxidants also have the ability to affect apoptosis through inhibitingproteins in the apoptotic cascade or modification of gene expression. By inhi-biting the cleavage of caspase-3 and its substrate, poly(ADP-ribose) polymer-ase, the green tea polyphenol, (-)-epigallocatechin, was found to preventapoptosis in HaCaT human keratinocytes when pretreated 16 h before irradia-tion [44]. Pretreatment of human microvascular epithelial cells with WR-1065thirty min prior to irradiation was found to down-regulate a host of genesassociated with apoptosis [45]. A greater than two-fold reduction in the expres-sion of 12 genes was observed, including the caspases 2, 4, and 9; the cyclins A,G1, G2, and D3; the DNA check damage/checkpoint proteins, ATM, DNA-PK, and RAD 23B; TNF receptor 1; and FAST kinase. Also, treatment withWR-1065 significantly reduced the accumulation of cells in an apoptotic sub-G1 population 1–2 days following irradiation to levels that were not statisticallydistinguishable (p<0.05) from non-irradiated cells. What is not clear from theseresults are the relative contributions of the radical scavenging properties and themodifying effect that amifostine has on gene expression to the observed reduc-tion in apoptosis.
20 Antioxidants Reduce Consequences of Radiation Exposure 171

20.4 Tissue-based Radiation Effects
Late fibrovascular effects of radiation include vascular dysfunction. Ischemiaitself injures tissue, and ischemia followed by reperfusion is thought to furtherthe injury through the production of a rapid burst of ROS. This rapid produc-tion of ROS can overwhelm the antioxidant capacity of the tissue and lead tofree radical-mediated damage to all intracellular and tissue compartments [46].This can be especially problematic under conditions of chronic ischemia whererecurrent injury to tissues is expected to occur. The involvement of chronicoxidative stress, and concomitant production of ROS, has been suggested as adriving force in the amplification of late radiation effects such as fibrosis,chronic inflammation, and oncogenesis in irradiated tissues [47,48]. Conse-quently, increasing the antioxidant capacity of the involved tissues is expectedto reduce tissue injury due toROS-mediated late radiation effects. However, theuse of antioxidants to reduce the effects of chronic ROS-mediated injury inpost-radiation treatments has not been sufficiently studied and therefore themechanisms by which these effects are mediated are ill-defined. Below, weprovide some examples of what is known from studies of post-radiation admin-istration of protein and non-protein based antioxidants on late radiation effectsin tissues.
20.4.1 Inflammatory Mediators
Under conditions of chronic oxidative stress, as would be encountered inirradiated tissues, the generation of ROS triggers an inflammatory responsethrough the activation of cytokines and other inflammatorymediators [49]. Theadministration of antioxidants in animal and human studies has the effect ofreducing the inflammatory response through the modulation of cytokine levelsin tissues. For example, epicatechin, trans-resveratrol, and theaflavin wereshown to reduce the production of interleukin 1-b (IL-1b), tumor necrosisfactor-a (TNF-a) and interleukin-8 (IL-8), respectively, after stimulation ofan inflammatory response [50–52]. Conversely, catalase and NAC have theability to upregulate interleukin-10 expression which, in turn, decreased thesynthesis of other cytokines [53]. Evidence also exists suggesting the role ofantioxidants in reducing ROS and inflammation in late radiation-inducedtissue injury. Protection of late radiation-induced lung injury was observed inmice over-expressing a transgene for human MnSOD [54]. In anotherapproach, increasing SOD levels through the treatment of rats 15 min prior toirradiation and 5 days post-radiation with a SOD mimetic resulted in both areduction of collagen deposition in lung tissue and a 1.2–2.1 fold reduction intransforming growth factor-b (TGF-b) 10 to 14 weeks post-radiation [55]. In apig model, treatment with Cu/Zn SOD or MnSOD 3 times a week for 3 weekspost-radiation resulted in a softening and shrinkage of fibrotic tissue in a
172 P. Okunieff et al.

cutaneous radiation field that had received a single 160 Gy dose 6 months priorto treatment with antioxidant [56]. Also in a pig model, the co-administration ofpentoxifylline [PTX] and a-tocopherol for 26weeks, after a 26week post-radiationdevelopment of a subcutaneous fibrosis, resulted in a decrease of TGFb-1 levels inresidual scar tissue (26 weeks post-irradiation) as compared with groups receivingpentoxifylline þ irradiation or irradiation alone [57]. In human studies, the com-bined treatment with PTX and a-tocopherol post-irradiation appeared moreeffective at reducing radiation-induced fibrotic tissue in skin than when PTX ora-tocopherol were given alone [58]. PTX is expected to reduce reperfusion injuryand was shown in clinical studies to lower the levels of circulating bFGF (basicfibroblast growth factor) and TNF-a toward non-irradiated control levels [59]. Incultured fibroblasts harvested from normal or radiation-induced fibrotic humanskin, treatment of the fibroblasts harvested from fibrotic tissue with liposomal Cu/Zn SOD resulted in increased expression ofMnSODand decreased levels of TGF-b1, but no significant changes in the levels of these parameters were observed intreated fibroblasts harvested from normal skin [60]. Thus, it can be seen thatstrategies for increasing SOD levels in post-irradiated tissues result in the protec-tion of the tissues from late radiation-induced effects through an apparent reduc-tion in the ROS-mediated damage and the decreased expression of at least onecytokine, TGF-b. Finally, the best treatment for many chronic radiation-inducedsoft tissue injuries is hyperbaric oxygen. The mechanisms of action of hyperbaricdives is not certain but includes natural induction of SOD and other antioxidants,and is associated with inhibition of inflammation and improved tissuevascularization.
Interestingly, cytokines can be radioprotective through induction of SODlevels. For example, pretreatment of mice with interleukin-1 twenty hoursbefore receiving a lethal dose (8 Gy) of radiation was found to enhance theradioresistance of bone marrow cells [61]. It has been suggested that one reasonfor the radioprotective effect of the cytokine is the increased expression ofMnSOD in bone marrow cells that resulted from the cytokine pretreatment.Similarly, tumor necrosis factor-a (TNF-a) has been shown to induce MnSODin hematopoietic stem cells with a concomitant radioprotective effect [62].
At the level of tissue vasculature, irradiation of endothelial cells results in theincreased expression of intercellular cell adhesion molecule-1 (ICAM-1). Expres-sion of ICAM-1 contributes to an inflammatory response that mediates theadhesion and movement of leucocytes to and through the vascular endothelium.ROS are assumed to be involved in the increased expression of ICAM-1, pre-sumably through the AP-1 signaling pathway [63,64]. Therefore, it is expectedthat a reduction in ROS by reactions with antioxidants, for example, shouldreduce radiation-induced expression of ICAM-1. However, pretreatment ofhuman umbilical vein endothelial cells with the thiols NAC and pyrrolidinedithiocarbamate (PDTC) followed by a 7 Gy dose found that neither thiolreduced the radiation-induced expression of ICAM-1 at a post-radiation timeof 48 h. Instead, thiol treatment increased expression by up to 2-fold over cellsirradiated alone [64]. In fact, just pretreatment of cells without exposure to
20 Antioxidants Reduce Consequences of Radiation Exposure 173

radiation resulted in increased expression of ICAM-1 that was 1–2 fold higherthan cells irradiated alone within 48 h post-treatment. This latter result suggeststhat these thiols can be considered, under certain conditions, as pro-inflamma-tory agents. However, it is not knownwhether this extends to other antioxidants,especially thiol-based antioxidants including amifostine.
20.5 Conclusion
The radioprotective effects of antioxidants and the mechanisms by which theseeffects are mediated depend on the properties of both the antioxidant and thecompartment (e.g., cellular or tissue targets) where the radioprotective effectsare measured. There is a large volume of data on the radioprotective effects ofantioxidants at the cellular level, especially at the level of nuclear DNA, wherethe radical scavenging by the antioxidant protects this and other sensitivecellular targets. Many antioxidants have been shown to also protect the cell byacting to increase cellular antioxidant capacity through their ability to elevatethe levels of natural antioxidants (e.g., GSH) and antioxidant enzymes (e.g.,GPx, GRd and MnSOD). Interestingly, exposure to chronic, low-dose-rateionizing radiation can also lead to the induction of antioxidant enzymes. Forexample, exposure of mice to a 0.5 Gy at a dose rate of 1.2 mGy/h for 23 daysincreased the gene expression of catalase and MnSOD by a factor of 2.5 [65].However, at higher doses of 1.0 and 1.3 Gy accumulated at the same dose rate,gene expression either increased by only approximately 1.4 or was not signifi-cantly different from unirradiated controls, respectively. Therefore, care isneeded in low-dose-rate studies in discerning to what extent various agents,like antioxidants, have on modifying the levels of antioxidant enzymes. Evenso, based on what is currently known, specific chemical and/or physical proper-ties of antioxidants can be designed to take advantage of biochemical propertiesor a specific cellular target. In addition, there are a number of in vitro and in vivostudies that show increased radioresistance in normal tissues when antioxidantsare given in combination compared with antioxidants given individually [30,31].There are a number of hypotheses that have been suggested to explain theenhanced radioprotective effect of combined antioxidant treatments related tothe regulation and response toROS, including the regeneration of vitamin E andother antioxidants by vitamin C, induction of cellular antioxidant systems, andinteraction with inflammatory mediators.
The impact of radiation on the mitochondrial DNA and thus long-termreproductive health of the mitochondria, reproduction of the cell, and oncellular redox and energy state has not been studied in detail. The long-termconsequences of radiation may be very dependent on this mechanism of radia-tion toxicity and may be greatly alleviated by properly designed antioxidants.
Regarding what is known about the radioprotective effects of antioxidants onlate radiation effects in tissues, especially for non-protein antioxidants, there is
174 P. Okunieff et al.

only a limited understanding of these effects at a mechanistic level. Therefore,additional studies are needed of current and new antioxidant compounds to look atthese and other radioprotective effects in antioxidants in irradiated cells and tissuesto support rational approaches in the design of antioxidants as radioprotectors.
Acknowledgment This research was supported by the Center for Medical Countermeasuresagainst Radiation Program, U19-AI067733, National Institute of Allergy and InfectiousDiseases.
References
1. J. P. Freyer, K. Jarrett, S. Carpenter, et al., Oxygen enhancement ratio as a function ofdose and cell cycle phase for radiation-resistant and sensitive CHO cells, Radiat. Res.127:297–307 (1991).
2. D. J. Grdina, J. S. Murley, and Y. Kataoka, Radioprotectants: Current status and newdirections, Oncology 63(suppl. 2):2–10 (2002).
3. K. D. Held, Models for thiol protection of DNA in cells, Pharmac. Ther. 39:123–131(1988).
4. G. D. Smoluk, R. C. Fahey, and J. F. Ward, Interaction of glutathione and other low-molecular weight thiols with DNA: evidence for counterion condensation and coiondepletion near DNA, Radiat. Res. 114:3–10 (1988).
5. S. Zheng, G. L. Newton, J. F. Ward, et al., Aerobic radioprotection of pBR322 by thiols:effect of thiol net charge upon scavenging of hydroxyl radicals and repair of DNAradicals, Radiat. Res. 130:183–193 (1992).
6. D.Murray,A. Prager, S. C.Vanankeren, et al., Comparative effect of the thiols dithiothreitol,cysteamine and WR-151326 on survival and on the induction of DNA damage in culturedChinese hamster ovary cells exposed to g-radiation, Int. J. Radiat. Biol. 58:71–91 (1990).
7. S. S. Kumar, T. P. A. Devasagayam, B. Jayshree, et al., Mechanism of protection againstradiation-induced DNA damage in plasmid pBR322 by caffeine, Int. J. Radiat. Biol.77:617–623 (2001).
8. R. J. Reiter, D. Tan, J. C. Mayo, et al., Melatonin as an antioxidant: biochemicalmechanisms and pathophysiological implications in humans, Acta. Biochem. Pol.50:1129–1146 (2003).
9. D. K. Maurya, V. P. Salvi, and C. K. K. Nair, Radioprotection of normal tissues intumor-bearing mice by troxerutin, J. Radiat. Res. 45:221–228 (2004).
10. P. Uma Devi, K. S. Bisht, and M. Vinitha, A comparative study of radioprotection byOcimum flavonoids and synthetic animothiol protectors in the mouse, Brit. J. Radiol.71:782–784 (1998).
11. J. F. Weiss, and M. R. Landauer, Protection against ionizing radiation by antioxidantnutrients and phytochemicals, Toxicology 189:1–20 (2003).
12. B. Frei, and J. V. Higdon, Antioxidant activity of tea polyphenols in vivo: evidence fromanimal studies, J. Nutr. 133:3275S–3284S (2003).
13. J. M. Yuhas, M. E. Davis, D. Glover, et al., Circumvention of the tumor membranebarrier to WR-2721 absorption by reduction of the drug hydrophilicity, Int. J. Radiat.Oncol. 8:519–522 (1982).
14. D. Q. Brown, J.M. Yuhas, L. J.MacKensie, et al., Differential radioprotection of normaltissues by hydrophilic chemical protectors, Int. J. Radiat. Biol. 10:1581–1584 (1984).
15. G. L. Newton, J. A. Aguilera, T. Kim, et al., Transport of aminothiol radioprotectors intomammalian cells: passive diffusion versus mediated uptake. Radiat. Res. 146:206–215(1996).
20 Antioxidants Reduce Consequences of Radiation Exposure 175

16. V. Santini, and F. J. Giles, The potential of amifostine: from cytoprotectant to therapeu-tic agent, Haematologica 84:1035–1042 (1999).
17. J. M. Yuhas, S. M. J. Afzal, and V. Afzal, Variation in normal tissue responsiveness toWR-2721, Int. J. Radiat. Oncol. 10:1537–1539 (1984).
18. H. I. Quinones, A. F. List, and E. W. Gerner, Selective exclusion by the polyaminetransporter as a mechanism for differential radioprotection of amifostine derivatives,Clin. Cancer Res. 8:1295–1300 (2002).
19. P. M. Calabro-Jones, J. A. Aguilera, J. F. Ward, et al., The limits to radioprotection ofChinese hamster V79 cells by WR-1065 under aerobic conditions, Radiat. Res.149:550–559 (1998).
20. C. R. Cully, and C. M. Spencer, An update on its clinical status as a cytoprotectant inpatients with cancer receiving chemotherapy or radiotherapy and its potential therapeuticapplication in myelodysplasia syndrome, Drugs 61:641–684 (2001).
21. J. S. Murley, Y. Kataoka, D. Cao, et al., Delayed radioprotection by NFkB-mediatedinduction of SOD2 (MnSOD) in SA-NH tumor cells after exposure to clinically usedthiol-containing drugs, Radiat. Res. 162:536–546 (2004).
22. J. S. Murley, Y. Kataoka, C. J. Weydert, et al., Delayed radioprotection by nucleartranscription factor kB-mediated induction of manganese superoxide dismutase inhuman microvascular endothelial cells after exposure to the free radical scavenger,WR1065, Free Rad. Biol. Med. 40:1004–1016 (2006).
23. D. C. Wallace, The mitochondrial genome in human adaptive radiation and disease: onthe road to therapeutics and performance enhancement, Gene 354:169–180 (2005).
24. L. J. Marnett, Oxy radicals, lipid peroxidation and DNA damage, Toxicology181:219–222 (2002).
25. N. M. Gandhi, and C. K. K. Nair, Radiation protection by diethyldithiocarbamate:protection of membrane and DNA in vitro and in vivo against g-irradiation, J. Radiat.Res. 45:175–180 (2004).
26. N. M. Gandhi, U. V. Gopalaswamy, and C. K. K. Nair, Radiation protection bydisulfiram: protection of membrane and DNA in vitro and in vivo against g-radiation,J. Radiat. Res. 44:255–259 (2003).
27. K. Shimoi, S. Masuda, B. Shen, et al., Radioprotective effects of antioxidative plantflavonoids in mice, Mutation Res. 350:153–161 (1996).
28. N. Cherdyntseva, A. Shishkina, I. Butorin, et al., Effect of tocopherol-monoglucoside(TMG), a water-soluble glycosylated derivate of vitamin E, on hematopoietic recovery inirradiated mice, J. Radiat. Res. 46:37–41 (2005).
29. J. R. Woods, M. A. Plessinger, and R. K. Miller, Vitamins C and E: missing links inpreventing preterm premature rupture of membranes. Am. J. Obstet. Gynecol. 185:5–10(2001).
30. K. N. Prasad, Rationale for using high-dose multiple dietary antioxidants as an adjunctto radiation therapy and chemotherapy, J. Nutr. 134:3182S–3183S (2004).
31. K. N. Prasad, Rationale for usingmultiple antioxidants in protecting humans against lowdoses of ionizing radiation, Br. J. Radiol. 78:485–492 (2005).
32. L. Malakhova, V. G. Bezlepkin, V. Antipova, et al., The increase in mitochondrial DNAcopy number in the tissues of g-irradiated mice, Cell. Mol. Biol. Lett. 10:721–732 (2005).
33. S. P. LeDoux, G. L.Wilson, E. J. Beecham,T. Stevnsner,K.Wassermann, andV.A. Bohr,Repair of mitochondrial DNA after various types of DNA damage in Chinese hamsterovary cells, Carcinogenesis 13:1967–1973 (1992).
34. G. L. Dianov, N. Souza-Pinto, S. G. Nyaga, T. Thybo, T. Stevnsner, V. A. Bohr, Baseexcision repair in nuclear and mitochondrial DNA, Prog. Nuc. Acid Res. Mol. Biol.68:285–297 (2001).
35. A. May, and V. A. Bohr, Gene-specific repair of g-ray-induced DNA strand breaks incolon cancer cells: no coupling to transcription and no removal from the mitochondrialgenome, Biochem. Biophys. Res. Commun. 269:433–437 (2000).
176 P. Okunieff et al.

36. H. Budworth, and G. L. Dianov, Mode of inhibition of short-patch base excisionrepair by thymine glycol within clustered DNA lesions, J. Biol. Chem. 278:9378–9381(2003).
37. H. Budworth, G. Matthewman, P. O’Neill, and G. L. Dianov, Repair of tandem baselesions in DNA by human cell extracts generates persisting single-strand breaks, J. Mol.Biol. 351:1020–1029 (2005).
38. N. Yang, M. A. Chaudhry, and S. S. Wallace, Base excision repair by hNTH1 andhOGG1: a two edge sword in the processing of DNA damage in g-irradiated humancells, DNA Repair 5:43–51 (2006).
39. L. Tretter, E. Ronai, G. Szabados, et al., The effect of the radioprotector WR-2721 andWR-1065 on mitochondrial lipid peroxidation, Int. J. Radiat. Biol. 57:467–478 (1990).
40. M. W. Epperly, C. A. Sikora, S. J. DeFilippi, et al., Manganese superoxide dismutase(SOD2) inhibits radiation-induced apoptosis by stabilization of the mitochondrial mem-brane, Radiat. Res. 157:568–577 (2002).
41. R. I. Salganik, The benefits and hazards of antioxidants: controlling apoptosis and otherprotective mechanisms in cancer patients and the human population, J. Am. Coll. Nutr.20:464S–472S (2001).
42. D. E. McClain, J. F. Kalinich, and N. Ramakrishnan, Trolox inhibits apoptosis inirradiated MOLT-4 lymphocytes, FASEB 9:1345–1354 (1995).
43. G. Hernandez-Flores, P. C. Gomez-Contreras, J. R. Domınguez-Rodrıguez, et al.,g-irradiation induced apoptosis in peritoneal macrophages by oxidative stress. Implica-tions of antioxidants in caspase mitochondrial pathway, Anticancer Res.25:4091–4100 (2005).
44. H. Kondo, S-H. Park, K. Watanabe, et al., Polyphenol (-)-epigallocatechin gallateinhibits apoptosis induced by irradiation in human HaCaT keratinocytes, Biochem.Biophys. Res. Commun. 316:59–64 (2004).
45. N. N. Khodarev, Y. Kataoka, J. S. Murley, et al., Interaction of amifostine and ionizingradiation on transcriptional patterns of apoptotic genes expressed in human microvas-cular endothelial cells (HMEC), Int. J. Radiat. Oncol. Biol. Phys. 60:553–563 (2004).
46. H. B. Stone, C. N. Coleman, M. S. Anscher, et al., Effects of radiation on normal tissue:consequences and mechanisms, Lancet Oncol. 4:529–36 (2003).
47. M. E. C. Robbins, and W. Zhao, Chronic oxidative stress and radiation-induced latenormal tissue injury: a review, Int. J. Radiat. Biol. 80:251–59 (2004).
48. C. Borek, andW. Troll, Modifiers of free radicals inhibit in vitro the oncogenic actions ofx-rays, bleomycin, and the tumor promoter 12-O-tetradecanoylphorbol 13-acetate, Proc.Natl. Acad. Sci. 80:1304–307 (1983).
49. M. S. Anscher, L. Chen, Z. Rabbani, et al., Recent progress in defining mechanisms andpotential targets for prevention of normal tissue injury after radiation therapy, Int.J. Radiat. Oncol. Biol. Phys. 62:255–259 (2005).
50. M. Mitjans, V. Martınez, J. del Campo, et al., Novel epicatechin derivatives with anti-oxidant activity modulate interleukin-1b release in lipopolysaccharide-stimulated humanblood, Bioorg. Med. Chem. Lett. 14:5031–5034 (2004).
51. J-P.Marier,K.Chen, P. Prince,G. Scott, J. R. E. del Castillo, and P.Vachon, Production ofex vivo lipopolysaccharide-induced tumor necrosis factor-a, interleukin-1b, and interleukin-6 is suppressed by trans-resveratrol in a concentration-dependent manner,Can. J. Vet. Res.69:151–154 (2005).
52. R. Aneja, K. Odoms, A. G. Denenberg, and H. R. Wong, Theaflavin, a black tea extract,is a novel anti-inflammatory compound, Crit. Care Med. 32:2097–2103 (2004).
53. J. J. Haddad, andC. S. Fahlman, Redox- and oxidant-mediated regulation of interleukin-10: an anti-inflammatory, antioxidant cytokine? Biochem. Biophys. Res. Commun.297:163–176 (2002).
54. M. W. Epperly, J. Bray, S. Kraeger, et al., Prevention of late effects of irradiation lungdamage by manganese superoxide dismutase gene therapy, Gene Ther. 5:196–208 (1998).
20 Antioxidants Reduce Consequences of Radiation Exposure 177

55. Z. Vujaskovic, I. Batinic-Haberle, Z. N. Rabbani, et al., A small molecule weight catalyticmetalloporphyrin antioxidant with superoxide dismutase (SOD) mimetic propertiesprotects lungs from radiation-induced injury, Free Rad. Biol. Med. 33:857–863 (2002).
56. J-L. Lefaix, S. Delanian, J-J. Leplat, et al., Successful treatment of radiation-inducedfibrosis using Cu/Zn-SOD and Mn-SOD: an experimental study, Int. J. Radiat. Oncol.Biol. Phys. 35:305–312 (1996).
57. J-L. Lefaix, S. Delanian, M-C. Vozenin, et al., Striking regression of subcutaneousfibrosis induced by high doses of gamma rays using a combination of pentoxifyllineand a-tocopherol: an experimental study, Int. J. Radiat. Oncol. Biol. Phys. 43:839–847(1999).
58. S. Delanian, R. Porcher, S. Balla-Mekias, et al., Randomized, placebo-controlled trial ofcombined pentoxifylline and tocopherol for regression of superficial radiation-inducedfibrosis, J. Clin. Oncol. 21:2545–2550 (2003).
59. P. Okunieff, E. Augustine, J. E. Hicks, et al., Pentoxifylline in the treatment of radiation-induced fibrosis, J. Clin. Oncol. 22, 2207–2213 (2004).
60. S. Delanian, M. Martin, A. Bravard, et al., Cu/Zn superoxide dismutase modulatesphenotypic changes in cultured fibroblasts from human skin with chronic radiotherapydamage, Radiother. Oncol. 58:325–331 (2001).
61. J. Eastgate, J. Moreb, H. S. Nick, et al., A role for manganese dismutase in radioprotec-tion of hematopoietic stem cells by interleukin-1, Blood 81:639–646 (1993).
62. J. Moreb, and J. R. Zucali, The therapeutic potential of interleukin-1 and tumor necrosisfactor on hematopoietic stem cells, Leuk. Lymphoma 8:267–275 (1992).
63. C. Munoz, M. C. Castellanos, A. Alfranca, et al., Transcriptional up-regulation ofintracellular adhesion molecule-1 in human endothelial cells by the antioxidant pyrroli-dine dithiocarbamate involves the activation of activating protein-1, J. Immunol.157:3587–3597 (1996).
64. M. Walther, W. Kaffenberger, and D. van Beuningen, Influence of clinically used anti-oxidants on radiation-induced expression of intracellular cell adhesion molecule-1 onHUVEC, Int. J. Radiat. Biol. 75:1317–1325 (1999).
65. K. Otsuka, T. Koana, H. Tauchi, and K. Sakai, Activation of antioxidant enzymesinduced by low-dose-rate whole-body g irradiation: adaptive response in terms of initialDNA damage, Radiat. Res. 166, 474–478 (2006).
178 P. Okunieff et al.

Chapter 21
Anti-Cancer Effect of Resveratrol is Associated
with Induction of Apoptosis via a Mitochondrial
Pathway Alignment
Weimin Sun, Wei Wang, Jung Kim, Peter Keng, Shanmin Yang,
Hengshan Zhang, Chaomei Liu, Paul Okunieff, and Lurong Zhang1
Abstract Resveratrol, a phytoalexin found in the skin of grapes, is believed tohave multiple bioactivities including anti-cancer, anti-carcinogenesis and anti-inflammatory. The mechanisms by which resveratrol might produce these effectsare not well understood. In this study, malignant human pancreatic cancer cellswere treated without or with resveratrol in combination with ionizing radiation(IR), and then the mitochondrial function of treated cells was evaluated usingseveral standardized assays. They include the Calcein AMmethod for mitochon-dria transition pore; the JC-1 staining method for mitochondria membranepotential; the CM-H2DCFDA method for reactive oxygen species; and theAnnexin V/propidium iodide (PI) method for apoptosis/cell death. Our resultsindicated that (1) pore function was partially intact after resveratrol, but resver-atrol probably interfered with the accumulation of intracellular Calcein AM;(2) depolarization of themitochondriamembranewas increased in the resveratroltreated cells, consistent with mitochondrial dysfunction; (3) ROS was slightlyincreased with resveratrol, a phenomenon that was greatly increased when thisagent was combined with IR; and (4) in parallel with the above changes inmitochondrial and drug transport, cells treated with resveratrol showed increasedapoptosis as measured by Annexin V/PI staining. In summary, the anti-cancereffect of resveratrol is associated with the damage of mitochondrial function thatleads to increased ROS, apoptosis, and possibly intracellular drug accumulationvia inhibition of proteins involved in multi-drug resistance (MDR).
21.1 Introduction
Resveratrol {3, 40,5-trihydroxy-trans-stilbene 5-[(1E)-2-(4-hydroxyphenyl)-ethenyl] -1,3-benzenediol} is a small compound (molecular weight 228.24)that can be purified from several types of plants, most commonly the skin of
1Weimin Sun, Wei Wang, Jung Kim, Peter Keng, Shanmin Yang, Hengshan Zhang,Chaomei Liu, Paul Okunieff, and Lurong Zhang, Department of Radiation Oncology,University of Rochester Medical Center, Rochester, NY 14642 USA.
K.A. Kang et al. (eds.), Oxygen Transport to Tissue XXIX� Springer 2008
179

grapes [1–3]. It serves as a polyphenolic antibiotic to protect the plants (grapes,and nuts) from pathogenic microorganisms, such as bacteria and fungi [4].
A wide range of biological activities have been ascribed to resveratrolincluding anti-inflammatory, anti-oxidant, anti-platelet aggregation, cellgrowth-modulation, anticarcinogenesis, anti-atherogenic, estrogen-like effects,immuno-modulation, and chemoprevention [4–6]. Among these, there ismounting evidence indicating that resveratrol is a promising natural compoundfor cancer prevention and for treatment of a variety of human cancers [7]. Themolecular and cellular targets responsible for the anti-neoplastic effects areunknown. Possible mechanisms include interference with intracellular signalingpathways that regulate cell survival or apoptosis [8], cell cycle arrest, andinhibition of several pathways for kinase activities [9]. The latter mechanismhas the potential of augmenting the response to radiation and chemotherapy.We therefore postulate that resveratrol affects mitochondrial function andpredisposes cells to apoptosis pathways induced by radiation. We performedstudies in a pancreatic cancer model, AsPC-1: a tumor model known to benaturally resistant to apoptosis. We found that resveratrol disrupted the mito-chondrial function of AsPC-1 cells, and resulted in increased apoptosis and celldeath that was substantially augmented by irradiation.
21.2 Materials and Methods
21.2.1 Reagents and Cells
AsPC-1 cells were cultured in DMEM (Dulbecco’s Modification of Eagle’sMedium) supplemented with 10% fetal bovine serum at 378C in an incubatorwith 5% CO2. The resveratrol (purity 98.31%) was purchased from Xi AnChongxin Natural Additive Company (Xi An, China). CM-H2DCFDA{5-(and-6)-chloromethyl-2’,7’Œ-dichlorodihydro-fluorescein diacetate, acetylester}, JC-1, Calcein AM, Annexin V, and propidium iodide (PI) were pur-chased from Molecular Probes (Eugene, OR).
21.2.2 Resveratrol Treatment of Cells
Flow cytometric analyses of different mitochondrial functions were performedusing a FACS Calibur flow cytometer (BD Biosciences, San Jose, CA). Briefly,cells (2�105) were cultured in 6well dishes until 80% confluence, and then treatedwith resveratrol at a concentration 50 mg/ml with or without 5 Gy radiation(Shepherd Irradiator) at a dose rate of 1.85 Gy/min. Twenty-four hours later,cells were harvested and single cell suspensions were placed separately in 6 mltubes with 1 ml culture media and cultured further for one hour to allow
180 W. Sun et al.

membrane damage occurring during the harvest process to recover. This wasfollowed by staining in accordancewithmanufacturer’s instructions, as describedbelow.
21.2.3 Analysis for Transition Pore of Mitochondria
To determine the effects of resveratrol on the activity of transition pore ofmitochondria in AsPC-1 cells, 5 ml of 2 mM Calcein AM and 5 ml of 80 mMCoCl2 were added to 100 ml single cell suspension, incubated at 378C for 15 min,washed once with PBS, and immediately analyzed by flow cytometer for thepercentage of green fluorescent cells. CoCl2 was used to quench the cytosolicfluorescence so that the fluorescent intensity of Calcein AM only representedthe activities from mitochondria.
21.2.4 Analysis for Mitochondria Membrane Potential
Two mg of JC-1 in 30 ml of saline was added to 100 ml of single cell suspensiontreated without or with 50 mg/ml of resveratrol and radiation. The mixtureswere incubated at 378C for 10min, washed with PBS once, and subjected to flowcytometer analysis immediately. The percentages of cells in the high red regionor low red and high green region were measured and compared among thedifferent treatment groups.
21.2.5 Analysis for Reactive Oxygen Species (ROS)
100 ml of single cell suspension from each treatment was incubated withCM-H2DCFDA (final concentration of 5 mM) at 378C for 0.5 hour. Theintensity of fluorescence was determined by flow cytometry and unstainedcells were used for subtraction of auto-fluorescence in the green emission range.
21.2.6 Analysis for Apoptosis and Cell Death
AsPC-1 cells treated with resveratrol or radiation were harvested and stainedwith Annexin V for 30 min and then PI was added immediately before the flowcytometric analysis according to the manufacturer’s instructions [10]. Thepercentage of cells that were Annexin V positive and PI negative was comparedamong different treatment groups.
21 Anti-Cancer Effect of Resveratrol 181

21.2.7 Statistical Analysis
Student’s t test was used to determine the significance between the differenttreatment groups. A P value of < 0.05 was regarded as statistically significant.
21.3 Results
21.3.1 Resveratrol Allows Increased Levels of Calcein AMto Enter the Cell
The Calcein AM assay can be used to determine both the activity of themitochondrial transition pore and the function of multiple drug resistancepump (MDR). The opening of transition pore is an initial event which occursafter cells are damaged. Calcein AM is a non-fluorescent dye that is cleaved to apolar fluorescent molecule by cytoplasmic esterase after it passes through boththe cell and mitochondria membranes. CoCl2, is added to quench cytoplasmicfluorescence and allows the detection of mitochondrial fluorescence if thetransition pore is closed. The result is shown in Fig. 21.1. Control, non-irra-diated cells had little fluorescence. This indicates that the Calcein AM did notaccumulate in control cells. In contrast, irradiated cells treated with resveratrolhad high fluorescence, indicating resveratrol improved the accumulation ofCalcein AM in mitochondria and that the transition pore was intact (closed).
21.3.2 Resveratrol Depolarizes the Mitochondrial Membrane
While the transition pore was at least partially functional, more subtle dysfunc-tion of the mitochondria was detected by measurement of its membrane
Fig. 21.1 Calcein AMAssay.Control, non-irradiated cellshad low fluorescenceindicating poor Calcein AMaccumulation. Resveratrolaided the accumulation ofCalcein AM in thepancreatic carcinoma cells(No IR: P=na; IR: P<0.05).Radiation had no effect onCalcein AM accumulationin the cell or on the functionof the mitochondrialtransition pore. (n=2).
182 W. Sun et al.

depolarization. To determine if there was membrane dysfunction, JC-1 stainingwas performed followed by flow cytometry analysis. Figure 21.2 shows that thepercentage of cells in the high green and low red region before and afterresveratrol. The green shift indicates mitochondrial membrane depolarizationin AsPC-1 cells (P<0.01). The effect of resveratrol on mitochondrial membranepotential was not diminished by irradiation. The data suggest that resveratrolindeed depolarizes the mitochondria membrane and that the effect produced bya dose of 50 mg/ml resveratrol is more pronounced that that of 5 Gy radiation.
21.3.3 Resveratrol Increases the Production of ROS
To determine if resveratrol at a relatively high dose alters the production ofROS, the CM-H2DCFDA method was used. CM-H2DCFDA passes throughplasma membrane and the acetate is cleaved by intracellular esterase andtrapped in the cytosol. The polar substrate is then oxidized to the fluorescentform depending on the cellular redox state. The results are summarized inFig. 21.3. Resveratrol did not change the percentage of AsPC-1 cells in thehigh fluorescent intensity region. When resveratrol was given in combinationwith 5 Gy radiation, the percentage of cells in the high fluorescent intensityregion increased dramatically, indicating that the combination triggered theproduction of ROS.
21.3.4 Resveratrol Triggers Apoptosis
Thedamageofmitochondriacantriggerapoptosis [11–13].AnnexinV,a35–36kDa,Ca2þ dependent, phospholipid binding protein with a high affinity to membranephospholipid phosphatidylserine, shifts from the inner to the outer leaflet of theplasma membrane during the early stage of apoptosis. The detection of early
Fig. 21.2 Resveratroldepolarizes themitochondria membrane.Resveratrol increased thefraction of cells with a greenshift indicatingdepolarization of themitochondria membrane(P<0.01). Radiation had alesser effect (P<0.05) thatwas not significantlydifferent than resveratrolalone. (n=2).
21 Anti-Cancer Effect of Resveratrol 183

apoptosis was supplemented with the PI assay to exclude dead cells. Figure 21.4shows that the percentage of apoptotic cells significantly increased with resveratroltreatment and further increased when radiation was added. The data are consistentwith enhancement of radiation-related cell killing by resveratrol.
21.4 Discussion
In this study, we demonstrated for the first time that the resveratrol alone athigh concentration alters mitochondrial function of AsPC-1 malignantpancreatic cancer cells, and when combined with radiation increases ROSand apoptosis. This is also the first documentation of accumulation ofCalcein in cancer cells after exposure to resveratrol (Fig. 21.1). Calcein AMis an MDR substrate and did not accumulate in AsPC-1 cells until resveratrolwas added. Resveratrol, therefore, might reduce pancreatic carcinoma’s resis-tance to chemotherapy; however, the impact of red wine consumption onchemotherapy remains unclear. In studies of MDR expression in pancreatic
Fig. 21.4 Effect of resvera-trol on apoptosis. TheAsPC-1 cells treated withresveratrol for 24 hours plus5 Gy radiation were stainedwith Annexin V for 30 minand then with PI prior to theflow cytometer analysis. Theapoptotic and dead cellsincreased with the treatmentof resveratrol and furtherincreased upon radiation(P <0.05). (n=2).
Fig. 21.3 Increased ROS inresveratrol treated cells. Thecells were treated with eithervehicle alone (as control) or50 ug/ml of resveratrol and5 Gy radiation for 24 hours.Resveratrol did not induceROS, while it did enhancethe radiation-induced pro-duction of ROS (P<0.05).(n=2).
184 W. Sun et al.

carcinoma cell lines, including AsPC-1, mRNA for both MDR1 and MDR3
was present. AsPC-1 cells also had high basal levels of MRP1, MRP3, and
MRP5 [14]. Thus, AsPC-1 and other pancreatic tumor cell lines likely owe
some of their treatment resistance to these membrane proteins. Inhibition of
these proteins by resveratrol deserves further evaluation. Resveratrol is cur-
rently being examined in clinical trials as a mitigator of normal tissue toxicity
among patients undergoing radiation or chemotherapy for malignancy. Since
some normal tissues do have MDR function, these tissues might be sensitized
by resveratrol. Consumption of red wine (containing resveratrol) among
patients undergoing radiation therapy is not contraindicated; the apoptotic
mechanism in normal tissue is seemingly not altered by resveratrol. Further
research is necessary to determine if resveratrol produces a differential
response between normal tissue and tumor.Resveratrol alone did not increase the number of cells with high ROS, but in
combination with radiation greatly increased ROS (Fig. 21.3). The subsequent
increased apoptosis is a likely consequence of this synergistic effect on
ROS (Fig. 21.4).While we were not able to detect dysfunction of the mitochondrial transition
pore due to failure of Calcein AM to accumulate in AsPC-1 cell, others
have reported that resveratrol modulates mitochondrial transition pore perme-
ability [15, 16]. Since several other aspects of abnormal mitochondrial functions
were detected in the current study, mitochondrial still remained to be the major
target for resveratrol induced damage. Our hypothesis is further supported by
the absence of robust caspase 8 activation but increased cytochrome C with
downstream activation of caspases 9 and 3 [7]. Thus the apoptotic signal is likely
mitochondrial rather than an extrinsic death pathway. The mechanism of
apoptosis after resveratrol, however, is complex since resveratrol-induced
apoptosis occurs only in cells expressing wild-type p53 (p53þ/þ), but not inp53-deficient (p53-/-) cells [17].
In this study, we used a relatively high dose (50 mg/ml) of resveratrol. The
rationale for this was: (1) its biological effects are likely dose dependent; (2) high
doses are expected to be safe if the agent is to be used clinically; and (3) studies
indicate that the resveratrol concentration in red wines can reach as high as
30 mg/ml [18]. It is important to note that many studies have been performed
with resveratrol and many biological effects, both cytoprotective and cytotoxic
have been claimed. Thus, low doses of the agent may have very different effects
than the higher doses we employed.In conclusion, this study demonstrates the impairment by resveratrol of
mitochondrial functions, particularly reduction of the membrane potential,
increase of ROS synergistically with irradiation, induction of apoptosis, and
increase of radiation induced apoptosis. Resveratrol also improved calcein
accumulation in AsPC-1 consistent with inhibition of MDR. While additional
studies are indicated, these data suggest resveratrol has a promising future as a
modulator of cytotoxic cancer therapies.
21 Anti-Cancer Effect of Resveratrol 185

Acknowledgment This research was supported by the Center for Medical Countermeasuresagainst Radiation Program, U19-AI067733, National Institute of Allergy and Infectious Dis-eases. The authors gratefully acknowledge the editing and research assistance of AmyK.Huser.
References
1. P.Waffo-Teguo,M. E.Hawthorne,M. Cuendet, et al., Potential cancer-chemopreventiveactivities of wine stilbenoids and flavans extracted from grape (Vitis vinifera) cell cultures,Nutr. Cancer 40(2):173–179 (2001).
2. L. Fremont, Biological effects of resveratrol, Life Sci. 66(8):663–673 (2000).3. G. J. Soleas, and E. P. Diamandis, and D. M. Goldberg, Resveratrol: a molecule whose
time has come? And gone? Clin. Biochem. 30(2):91–113 (1997).4. J. K. Lin, and S. H. Tsai, Chemoprevention of cancer and cardiovascular disease by
resveratrol, Proc. Natl. Sci. Coun. Repub. China B. 23(3), 99–106 (1999).5. J. A. Baur, and D. A. Sinclair, Therapeutic potential of resveratrol: the in vivo evidence,
Natl. Rev. Drug Discov. 5(6), 493–506 (2006).6. S. K. Manna, A. Mukhopadhyay, and B. B. Aggarwal, Resveratrol suppresses TNF-
induced activation of nuclear transcription factors NF-kappa B, activator protein-1, andapoptosis: potential role of reactive oxygen intermediates and lipid peroxidation,J. Immunol. 164(12), 6509–6519 (2000).
7. S. Pervaiz, Resveratrol–from the bottle to the bedside? Leuk. Lymphoma. 40(5–6),491–498 (2001).
8. S. Fulda, and K.M. Debatin, Resveratrol modulation of signal transduction in apoptosisand cell survival: A mini-review, Cancer Detect. Prev. 30(3), 217–223 (2006).
9. D. Delmas, A. Lancon, D. Colin, B. Jannin, and N. Latruffe, Resveratrol as achemopreventive agent: a promising molecule for fighting cancer, Curr. Drug Targets7(4), 423–442 (2006).
10. http://probes.invitrogen.com/media/publications/508.pdf11. N. Dias, and C. Bailly, Drugs targeting mitochondrial functions to control tumor cell
growth, Biochem. Pharmacol. 70(1):1–12 (2005).12. R. Kim, Recent advances in understanding the cell death pathways activated by
anticancer therapy, Cancer 103(8):1551–1560 (2005).13. T. Asakura, and K. Ohkawa, Chemotherapeutic agents that induce mitochondrial
apoptosis, Curr. Cancer Drug Targets 4(7):577–590 (2004).14. S. Eisold, D. Nauheimer, J. Schmidt, T. Giese, E. Klar, and M. Linnebacher, Influence of
clinically relevantchemotherapeuticsontheexpressionofmultidrug-resistance familymembersin human pancreatic cell lines, Society for Surgery of the Alimentary Tract [abstract]; accessedonline 21Dec2006: http://www.ssat.com/cgi-bin/abstracts/06ddw/SSAT_DDW06_38.cgi
15. S. J. Zunino, and D. H. Storms, Resveratrol-induced apoptosis is enhanced in acutelymphoblastic leukemia cells by modulation of the mitochondrial permeability transitionpore, Cancer Lett. 240(1), 123–134 (2005).
16. X. M. Tian, and Z. X. Zhang ZX, Resveratrol promote permeability transition poreopening mediated by Ca2þ, Yao. Xue. Xue. Bao. 38(2), 81–84 (2003).
17. C. Huang, W. Y. Ma, A. Goranson, and Z. Dong, Resveratrol suppresses celltransformation and induces apoptosis through a p53-dependent pathway, Carcinogenesis20(2), 237–242 (1999).
18. J. F. Moreno-Labanda, R. Mallavia, L. Perez-Fons, V. Lizama, D. Saura, and V. Micol,Determination of piceid and resveratrol in Spanish wines deriving from Monastrell(Vitis vinifera L.) grape variety, J Agric Food Chem. 52(17), 5396–5403 (2004).
186 W. Sun et al.

Part V
Tissue Engineering

Chapter 22
Computationally Determined Shear on Cells
Grown in Orbiting Culture Dishes
R. Eric Berson1, Matthew R. Purcell1, and M. Keith Sharp2
Abstract A new computational model, using computational fluid dynamics
(CFD), is presented that describes fluid behavior in cylindrical cell culture
dishes resulting from motion imparted by an orbital shaker apparatus. This
model allows for the determination of wall shear stresses over the entire area of
the bottom surface of a dish (representing the growth surface for cells in culture)
which was previously too complex for accurate quantitative analysis. Two
preliminary cases are presented that show the complete spatial resolution of
the shear on the bottom of the dishes. The maximum shear stress determined
from the model is compared to an existing simplified point function that
provides only the maximum value. Furthermore, this new model incorporates
seven parameters versus the four in the previous technique, providing improved
accuracy. Optimization of computational parameters is also discussed.
22.1 Introduction
The effects of hemodynamic forces on cellular responses have been studied for
more than thirty years, but the mechanisms linking cause and effect are still not
well known. Wall shear stresses are widely accepted as the primary influence
affecting characteristics of anchored cells subjected to fluid flow. Endothelial
cells, lining the interior walls of arteries and veins, experience shear exerted by
the flow of blood and become aligned and elongated with the direction of flow
and undergo other physiological and biochemical changes [1–8]. The realization
of the relationship between hemodynamic forces on the endothelium and the
origins of atherosclerosis and vascular pathology [9–14], in general, has led to
considerable attention focusing on the effects of these forces on cellular
responses. Detailed, accurate information about the fluid forces acting on
1Department of Chemical Engineering, University of Louisville, Louisville, KY.2Department of Mechanical Engineering, University of Louisville, Louisville, KY.
K.A. Kang et al. (eds.), Oxygen Transport to Tissue XXIX� Springer 2008
189

cells must be known in order to understand the cause and effect relationshipbetween shear stresses and endothelial responses.
Several studies have been conducted in vitro using experimental apparatusthat can provide accurately quantifiable shear stress over a cultured layer ofendothelial cells. One type involves inducing a rotating flow field over a sta-tionary layer of cells. In this arrangement, either a flat plate or a cone rotatesover a fixed surface where the layer of cells exists. An easily calculated wallshear stress is produced since the rotation rate of the upper plate or cone isknown as is the length of the gap between the rotating and stationary surfaces.Another type involves flow in a chamber between two parallel plates, usuallywhere the width and length of the plates are much larger than the gap betweenthe plates. Again, wall shear stress is easily calculated based on the known flowrate and known gap length between the two plates.
These flow devices provide an accurate means of delivering pre-determinedshear stresses to a layer of cultured cells but are limited in that only steady flowis provided. Also, experiments must be performed consecutively rather thansimultaneously unless multiple cone-and-plate or flow chamber devices areavailable. Another prevalent apparatus for providing fluid motion to culturedcells is the orbital shaker platform. Orbital shakers are ideal for simultaneouscell culture experiments and are widely used throughout the cell culture industrybecause of their simplicity. More importantly, orbital shakers provide oscilla-tory flow, somewhat like that experienced by pulsing fluid movement in thehuman vasculature system.
Despite the prevalence and simplicity of usage, few have attempted toemploy the orbiting shaker apparatus as a means for correlating shear stressesto cellular responses due to the complexity involved in accurately calculatingwall shear stresses exerted by the fluid. The movement of fluid in a cylinder thatderives its motion from an orbiting shaker platform will be oscillatory in naturewith a wave whose peak rotates around the cylinder at an angular velocitycorresponding to the orbital velocity of the cylinder. Those that have attemptedto correlate shear stress in a shaker flask to cellular responses have usedsimplified means for estimating the magnitude of the shear.
Ley et al [15]. investigated shear-dependent adhesion of human polymorpho-nuclear neutrophil granulocytes to endothelial cells in cone-and-plate andorbiting shaker experiments. For simplicity, the shear stress they reported inthe orbital shaker experiments was an estimate of the maximum wall shearstress at the bottom of the cylinder:
�! ¼ a �ffiffiffiffiffiffiffiffiffiffiffiffiffiffiffiffiffiffiffiffiffiffiffiffiffiffiffiffiffiffiffiffi
� � � � 2 � p � fð Þ3q
(22:1)
where �! is the maximum shear stress on the bottom of the cylinder, a is theradius of orbit, r is the fluid density, m is the fluid viscosity, and f is thefrequency of rotation. The authors did not provide a derivation or referencefor the origin of Eq. (22.1). Curiously, the equation does not include a term for
190 R.E. Berson et al.

the fluid height which is ordinarily integral to a shear stress calculation. The useof Eq. (22.1) has become prevalent in the related literature since its introductionand is still widely used [7,8,16,17,18,19].
Computational models that solve the Navier-Stokes equations for flowprovide a means to predict fluid dynamic properties that are difficult to orcannot be determined experimentally. In this paper, a computational fluiddynamic (CFD) model is employed to describe fluid behavior in a cylindricalcell culture dish resulting frommotion imparted by an orbital shaker apparatus.This allows for the determination of wall shear stresses imposed over the entirearea of the bottom surface of the cylinder (representing the growth surface forcells in culture) which was previously too complex for accurate quantitativeanalysis. Two preliminary cases are presented, and the maximum shear stressesdetermined from these solutions are compared to Eq. (22.1). Knowledge of thefluid dynamics inside an orbiting cylindrical cell culture dish will significantlyenhance the usefulness of simple orbital shaker apparatuses, one of the mostcommon in vitro cell culture apparatuses, in the study of hemodynamic effectson cell cultures.
22.2 Computational Methods
22.2.1 Solver Description
The fluid behavior is modeled using three dimensional Navier-Stokes equationsthat are solved using Fluent 6.2, a commercial software CFD solver. The solveremploys a finite-volume discretization process to numerically solve the govern-ing equations for conservation of mass andmomentum. The general form of themass conservation equation is written as:
@�
@tþr � �Vð Þ ¼ 0 (22:2)
and the momentum conservation equation is written as:
@
@tþ �Vð Þ þ r � �VVð Þ ¼ �rPþ �gþr �rVð Þ (22:3)
Simulating flow in an orbiting cylinder requires creating a dynamic grid thatmoves through space. Since Fluent can generate rotational and translationalmotion but not orbiting motion, the motion must be generated by a user-defined function which specifies the orbital frequency, orbital radius, and centerof orbit. The user-defined function is an external Cþþ language subroutinelinked to the Fluent solver. A transient solution is required since the location ofthe fluid domain is changing with time. The sloshing of the fluid as a result ofthemotion is a free surface flow that requires tracking of the liquid-air interface.
22 Computationally Determined Shear on Cells Grown in Orbiting Culture Dishes 191

The surface tracking is accomplished with the Volume of Fluid (VOF)model. In
the VOF model, the two fluids across the interface share a single set of momen-
tum equations and the volume fraction of each fluid in each computational cell
is tracked throughout the grid. Flow is treated as laminar (Reynolds numbers
= �100) and residual values reached 5e–5 or better for each iteration following
the earliest time steps.
22.2.2 Optimization of the Computational Grid
Solution accuracy depends on the level of resolution of the computational grid
which is a function of the number of computational cells in the computational
domain. However, a trade-off occurs in terms of resolution and computational
cost. High resolution, transient cases can take on the order of days and weeks to
obtain a final converged solution. To determine the optimum cell count, max-
imum shear stress on the bottom of a dish is compared for a given case over a
0
1
2
3
4
5
6
7
8
9
10
0 0.5 1 1.5 2 2.5 3 3.5 4 4.5Time (seconds)
Max
imu
m S
hea
r S
tres
s (d
yne/
cm2 ) Case A
Case BCase C
Fig. 22.1 Transient motion analysis – time for fluid motion to reach steady state. (Case A: 60rpm, 3.50 cm dish diameter;Case B: 137 rpm, 2.88 cm dish diameter; Case C:137 rpm, 0.96 cmdish diameter).
Table 22.1 Optimization of the computational grid. Maximum shear stress as a functionof computational cell count
Cell Count 25,300 51,060 98,900 299,230 494,680
Maximum Shear Stress (dyne/cm2) 3.25 3.44 3.93 4.30 4.39
192 R.E. Berson et al.

range of cell quantities. The number of cells is increased until the magnitude ofshear shows minimal change between increasing cell counts.
Table 22.1 shows how the magnitude of shear stress varies depending on thegrid resolution for the case of a dish with a 2.4 cm diameter, a 0.108 cm initial fluidheight, a 1.2 cm radius of orbit, and rotating at 82 rpm. Cases were run with cellcounts of approximately 25,000, 50,000, 100,000, 300,000, and 500,000. The cellcount is adjusted by varying the node spacing on the grid, which eventuallydetermines the final cell count. The trial and error method results in cell countsthat deviate slightly from the desired value. The representative maximum shearstress is the value after a minimum of four seconds (and 5.5 rotations) which islonger than the time it was determined for the fluidmotion to have achieved steadystate (see Fig. 22.1). The ratio of the difference in shear stress to the difference incell count is smallest between the 300,000 and 500,000 cases, indicating an opti-mum cell count of 300,000, which is the amount that will be used in all new cases.
22.3 Transient Fluid Motion Analysis
Generating the dish motion requires a transient approach. In order to set thenumber of time steps in the solver, it is necessary to establish the run timeneeded for the fluid motion to reach steady state. The time to reach steady statefor three cases is shown in Fig. 22.1. The three cases cover a variety of rotationrates and dish geometries; Case A: 60 rpm and 3.50 cm dish diameter, Case B:137 rpm and 2.88 cm dish diameter, and Case C: 137 rpm and 0.96 cm dishdiameter. The maximum shear stress on the bottom surface of the dish is againused as the metric for describing flow characteristics.
Case B and Case C reach steady state in less than one second. Case C reachessteady state in a little more than two seconds. Case B and Case C rotate at a rateof 2.28 times the rate of Case A, which suggests that achieving steady state maybe more a function of the number of rotations than of time. Examining cases athigher rotation rates may help determine this. For the cases seen here, it appearsthat steady state is achieved after about two rotations. To be conservative, eachcase will encompass a minimum of four rotations prior to analysis.
22.4 Case Studies
Converged solutions provide phase contours representing the fluid motion andspatial resolution of shear stresses over the entire bottom surface of a dish, asignificant improvement over the widely used Eq. (22.1) which provides just themaximum value without revealing any information as to the extent of thesurface coverage exposed to this shear stress value. Two cases are presented asillustration. The first case has a dish diameter of 2.4 cm, an initial fluid height of0.11 cm, a radius of orbit equal to 1.2 cm, and rotation rate of 82 rpm. The
22 Computationally Determined Shear on Cells Grown in Orbiting Culture Dishes 193

second case has a dish diameter of 3.5 cm, an initial fluid height of 0.20 cm, a
radius of orbit equal to 1.2 cm, and rotation rate of 60 rpm. The fluid properties
(viscosity and density) were treated aswater for both cases. Fig. 22.2 andFig. 22.3
show shear stress contours covering the complete bottom surface of each dish.While significant detail is lost in the grayscale, some salient features are still
visible. The area of maximum shear stress in each contour appears as a rela-
tively small, bright area near the periphery of each dish. Figure 22.4 shows the
location of this maximum shear region relative to the leading edge of the
traveling wave, which is created by the sloshing of the fluid. As the dish travels
in its orbit, the sloshing of the fluid creates a wave with a peak that travels
around the dish at a rate relative to the rotation rate of the dish. In Fig. 22.4, the
peak of the wave is to the left. The fluid / air interface slopes downward to
the right until the fluid depth reaches a minimum at the right side of the dish.
The steepest part of this slope occurs just before the fluid reaches a minimum
depth. The image is a snapshot in time of a dish that is traveling in the counter-
clockwise direction, so this slope is referred to as the leading edge of the wave.
Underneath this leading edge, a bright spot appears corresponding to the bright
spot in Fig. 22.3. Thus, the region of maximum shear occurs just underneath the
leading edge of the traveling wave. It is intuitive that this should be the point of
maximum shear since the velocity is maintained while the liquid height is
reduced, leading to a high velocity to distance ratio.
Fig. 22.2 Shear stress contours over bottom surface of dish (dyne/cm2). [2.4 cm diameter,initial fluid height = 0.11 cm, orbital radius = 1.2 cm, 82 rpm].
194 R.E. Berson et al.

Fig. 22.3 Shear stress contours over bottom surface of dish (dyne/cm2). [3.5 cm diameter,initial fluid height = 0.20 cm, orbital radius = 1.2 cm, 60 rpm].
Fig. 22.4 Phase contour showing the fluid / air interface corresponding to the dish in Fig. 22.3.
22 Computationally Determined Shear on Cells Grown in Orbiting Culture Dishes 195

The shear along the bottom surface is plotted as a function of radius in a lineextending from the center of the dish towards the maximum shear region(Figs. 22.5 and 22.6). Represented this way, it is easier to see the difference inshear magnitude between the center and the periphery of the dish. In both cases,there is at least a two-fold increase in shear from the center to the periphery, anda steep gradient exists on both sides of the peak. The drop in shear near the sidewall of the dish is due to the no slip boundary condition imposed in the solution.Fig. 22.5 and Fig. 22.6 clearly exposes the weakness of Eq. (22.1) when it is usedto correlate cellular responses to shear stresses in orbiting dishes: a single pointfunction, such as this equation, is not a valid means to describe the entire cell
0
0.5
1
1.5
2
2.5
3
3.5
4
4.5
0 0.25 0.5 0.75 1 1.25Radius (cm)
Sh
ear
Str
ess
(dyn
e/cm
2 )
Fig. 22.5 Shear as a function of radius along the bottom surface of the dish corresponding tothe contour in Fig. 22.2.
0
0.2
0.4
0.6
0.8
1
1.2
1.4
1.6
1.8
2
Radius (cm)0 0.25 0.5 0.75 1 1.25 1.5 1.75
Sh
ear
Str
ess
(dyn
e/cm
2 )
Fig. 22.6 Shear as a function of radius along the bottom surface of the dish corresponding tothe contour in Fig. 22.3.
196 R.E. Berson et al.

culture growth area. This is in agreement with Dardik et al [19]. who noticed adifference in shear between a single point near the center and a single point nearthe periphery using optical velocimetry measurements.
Maximum shear stress as given by Eq. (22.1) is 1.89 dyne/cm2 and 3.18 dyne/cm2, respectively, for the two cases presented here compared to 1.70 and 4.30 asdetermined by our computational model. Eq. (22.1) incorporates fluid proper-ties (viscosity and density), rotational rate, and orbital radius in its solution.In addition to these properties, our computational model incorporates dishgeometry, fluid volume, and the effects of gravity. The two methods give adifference in maximum shear of 11% for Case 1 and 26% for Case 2. Theadditional parameters and stringent convergence criteria associated with thenew computational model likely offer a more accurate result.
22.5 Conclusion
A new computational model is presented for determining shear stress on thebottom of a cylindrical cell culture dish that resides on an orbiting shakerapparatus. The model provides significant improvement over an existingmethod for determining shear stress in that it incorporates seven parametersinstead of four, and it provides contours of shear over the entire bottom surfaceof the dish rather than a maximum value at a single point. This should enhancethe usefulness of common orbital shaker apparatuses in the study of cellularresponses to hemodynamic forces in culture.
References
1. M.J. Levesque and R.M. Nerem, The elongation and orientation of cultured endothelialcells in response to shear stress, J Biomech Eng, 107(4), 341–347 (1985).
2. R.J. Satcher Jr., S.R. Bussolari, M.A. Gimbrone Jr., and C.F. Dewey Jr., The distributionof fluid forces on model arterial endothelium using computational fluid dynamics,J Biomech Eng, 114(3), 309–316 (1992).
3. P.F. Davies, A. Remuzzi, E.J. Gordon, C.F. Dewey Jr., and M.A. Gimbrone Jr., Turbu-lent fluid shear stress induces vascular endothelial turnover in vitro,Proc of the Nat Acad ofSci, 83, 2114–2117 (1986).
4. N. DePaola, M.A. Gimbrone Jr., P.F. Davies, and C.F. Dewey Jr., Vascular endotheliumresponds to fluid shear stress gradients.Arteriosclerosis and Thrombosis, 12(11), 1254–1257(1992).
5. C.F. Dewey, S.R. Bussolari, M.A. Gimbrone, and P.F. Davies, The dynamic response ofvascular endothelial cells to fluid shear stress, J Biomech Eng, 103(3), 177–185 (1981).
6. D.L. Fry, Acute vascular endothelial changes associated with increased blood velocitygradients. Circ Res, 22, 165–197 (1968).
7. L.W. Kraiss, A.S. Weyrich, N.M. Alto, D.A. Dixon, T.M. Ennis, V. Modur, T.M.McIntyre,S.M. Prescott, and G.A. Zimmerman, Fluid flow activates a regulator of translation, p70/p85S6 kinase, in human endothelial cells, Am J Physiology, 278(5), H1537–1544 (2000).
22 Computationally Determined Shear on Cells Grown in Orbiting Culture Dishes 197

8. L.W. Kraiss, N.M. Alto, D.A. Dixon, T.M. McIntyre, A.S. Weyrich, and G.A. Zimmer-man, Fluid flow regulates E-selectin protein levels in human endothelial cells by inhibitingtranslation, J Vasc Surg, 37(1), 161–168 (2003).
9. W.E. Stehbens, Hemodynamics and atherosclerosis. Biorheology, 19, 95–101 (1982).10. R.M. Nerem and M.J. Levesque. Fluid dynamics as a factor in the localization of
atherosclerosis. Surface phenomena in Hemorheology: Their theoretical, experimentaland clinical aspects, edited by A.L. Copely and G.V.F. Seaman, Annals of the New YorkAcademy of Science, 416, 709–719 (1984).
11. V.S. Repin, V.V. Dolgov, O.E. Zaikina, I.D. Novikov, A.S. Antonov, N.A. Nikolaeva,and V.N. Smirnov, Heterogeneity of endothelium in human aorta. A quantitativeanalysis by scanning electron microscopy, Atherosclerosis, 50(1), 35–52 (1984).
12. D.P. Giddens, C.K. Zarins, and S. Glagov, The role of fluid mechanics in the localisationand detection of atherosclerosis, J Biomech Eng, 115(4B), 588–594 (1993).
13. S. Glagov, C.K. Zarins, D.P. Giddens, and D.N. Ku, Haemodynamics and atherosclero-sis. Insights and perspectives gained from studies of human arteries,Archives of Pathologyand Laboratory Medicine, 112(10), 1018–1031.
14. A.M. Malek, S.L. Alper, and S. Izumo, Hemodynamic shear stress and its role inatherosclerosis, J. Amer Med Assoc, 282(21), 2035–2042 (1999).
15. K. Ley, E. Lundgren, E. Berger, and K. Arfors, Shear-dependent inhibition of granulo-cyte adhesion to cultured endothelium by dextran sulfate, Blood, 73(5), 1324–1330 (1989).
16. M. Haga, A. Yamashita, J. Paszkowiak, B.E. Sumpio, and A. Dardik, Oscillatory shearstress increases smooth muscle cell proliferation and Akt phosphorylation, J Vasc Surg,37(6), 1277–1284 (2003).
17. A.V. Sterpetti, A. Cucina, L.S. D’Angelo, B. Cardillo, and A. Cvallaro, Shear stressmodulates the proliferation rate, protein synthesis, and mitogenic activity of arterialsmooth muscle cells, Surgery, 113(6), 691–699 (1993).
18. H. Ueba, M. Kawakami, and T. Yaginuma, Shear stress as an inhibitor of vascularsmooth muscle cell proliferation: role of transforming growth factor-b1 and tissue-typeplasminogen activator,Arteriosclerosis, Thrombosis &Vascular Biology, 17(8), 1512–1516(1997).
19. A.Dardik, L. Chen, J. Frattini, H. Asada, F.Haziz, F. Kudo, and B. Sumpio, Differentialeffects of orbital and laminar shear stress on endothelial cells. J. Vasc Surg 41(5), 869–880(2005).
198 R.E. Berson et al.

Chapter 23
Formation of Capillary Tube-like Structures
on Micropatterned Biomaterials
Dahai Gao, Girish Kumar, Carlos Co, and Chia-Chi Ho1
Abstract The survival of three-dimensional tissue requires a vascular networkto provide transport of oxygen andmetabolic byproduct. Here, we report a newapproach to create capillary blood vessels in vitro on biomaterials suitablefor use as scaffolds in engineering tissues. Endothelial cells were culturedon chemical and topographical patterns of micro-sized grooves on gelatin.Selective attachment and spreading of cells within the grooves was ensured bymicrocontact printing the plateau regions with cell resistant PEG/PLA(polyethyleneglycol-L-polylacticacid). Human microvascular endothelial cellsplated on these patterned biomaterials attached and spread exclusively withinthe grooves. These topographical features promote endothelial cells to formcapillary tube-like structures. The results demonstrated that capillary structuresformed on biomaterials are useful for engineering vascularized tissues.
23.1 Introduction
Blood vessels play a key role in supplying oxygen and nutrients to tissues.To engineer viable tissues in vitro, it is critical to engineer blood vessels to transfernutrients and waste to and from the engineered tissues. The differentiation ofendothelial cells to form capillary tube-like structures depends on a variety ofsoluble factors such as VEGF (vascular endothelial growth factor) [1], extracel-lular matrix molecules, and geometrical cues [2]. Previous studies have demon-strated that microvascular endothelial cells cultured in medium containingendothelial growth factors [3] form capillary tubes spontaneously.
To explore whether capillary tube formation can be promoted by geometriccues, we fabricated 10 mm, 20 mm and 30 mm wide line patterns and grooveson gelatin films by using soft-lithography and microcontact printing techni-ques [4,5]. We explored the role of geometric confinement on the differentiation
1Dahai Gao, Girish Kumar, Carlos Co and Chia-Chi Ho, Department of ChemicalEngineering, University of Cincinnati, Cincinnati, OH, USA.
K.A. Kang et al. (eds.), Oxygen Transport to Tissue XXIX� Springer 2008
199

of human microvascular endothelial cells to form capillary structures. Wereport here the effects of surface topography and spatial distribution of celladhesive/resistant molecules on guiding endothelial cells to assemble into capil-lary tube-like structures.
23.2 Materials and Methods
23.2.1 Materials
Gelatin from porcine skin was purchased from Sigma (St. Louis. Mo). PDMS(Sylard 184) was obtained from Dow Corning (Midland, MI). Bovine serumalbumin (BSA) fluorescein conjugate was purchased from Molecular Probes(Eugene, OR). (PBS) solution (137mM NaCl, 2. 7 mM KCl, 10mM KH2PO4,10mMNaHPO4, and 10 mMNaOH) was prepared from PBS pellets purchasedfrom Sigma. Microvascular endothelial cell growth medium and fetal bovineserum (FBS) were purchased from Cambrex Bioscience (Walkersville, MD).
PEG-PLA (polyethyleneglycol-L-polylactic acid) was synthesized by thefollowing method. 0.05 mM of Poly(ethylene glycol) monomethyl ether(mPEG-5000, Mn�5000 Da) and 69 mM of 3,6-dimethyl-1,4dioxane-2,5-dione (lactide) were each dried by azeotropic distillation from toluene andcombined with additional toluene. Following the addition of tin (II) ethylhexanoate, the mixture was heated at reflux for 4 hours at which time thesolvent was removed by distillation. The resulting solid mass was taken up asmall amount of methylene chloride, then added drop-wise to ether, causingmPEG-PLA to precipitate as an oily solid (58%) that was isolated by suctionfiltration. PEG with aMw less than 50,000 can be excreted from the kidneys [6].
23.2.2 Microfabrication of the SiliconMaster Pattern and Transferof the Topological Patterns onto PDMS
Micropatterns with parallel grooves 60 mm wide and ridges of varying widths(10, 20, and 30 mm) were fabricated on silicon wafers using standard photo-lithographic techniques. From this silicon master pattern, complementaryPDMS replicas were formed by pouring PDMS pre-polymer (mixed in a10:1 ratio with a crosslinking catalyst) over the Si master and cured at 56 8Cfor 2 h. The PDMS replicas were used as stamps in subsequent microcontactprinting steps or as molds to form topographical patterned gelatin films.
Flat gelatin films were prepared on glass slides by spreading uniformly0.1 mL gelatin solution in 0.05 M acetic acid over an area of 18.75 cm.2
Topographical patterned gelatin films were prepared by adding gelatin solu-tions (0.05 M acetic acid) drop wise to the PDMS substrates. After drying, the
200 D. Gao et al.

gelatin film was crosslinked by 2% glutaraldehyde solution for 10 min. Thecross-linked gelatin film was then immersed in 0.2% sodium borohydridesolution for 30 min to quench the autoflurescence [7]. The gelatin film wassoaked in deionized water overnight before seeding cells.
23.2.3 Chemical Patterning of Non-adhesive PEG-PLA Regions
Microcontact printing was used to pattern PEG-PLA over gelatin. The PDMSstamp was first cleaned with ethanol and then air-dried. 20 mL PEG-PLA wasdropped onto the stamp. After drying, patterns of PEG-PLA were then trans-ferred onto gelatin films by microcontact printing. Gentle pressure was appliedto ensure conformal contact between the stamp and gelatin film. After 15 s, thestamp was removed from the gelatin and the substrate was air-dried.
A flat PDMS stamp was used to pattern topographical gelatin films. Onlythe plateau regions of the gelatin film were covered by PEG-PLA upon contactprinting. Spatial control of protein adsorption onto the PEG-PLA-patternedgelatin films was confirmed by incubating the substrates with BSA fluoresceinconjugate and visualized using a Nikon TE-2000 inverted microscope.
23.2.4 Culture of Endothelial Cells
Human microvascular endothelial cells (HMVEC-d, purchased from CambrexBioscience,MD) were cultured in endothelial basal medium containing 5% fetalbovine serum, 1 mg/mL of hydrocortisone, 10 mg/mL of epidermal growthfactor (EGF), 10 mg/mL of bovine brain extract, 50 mg/mL of gentamycin,and 50 mg/mL of amphotericin-B under 5% CO2. Prior to incubation with themicropatterned biomaterials, cells were dissociated from the culture dish withtrypsin, resuspended in endothelial basal medium containing 10% serum, andallowed to attach onto micropatterned gelatin films(4�104 cells/cm2).
23.2.5 Immunostaining and Image Analysis
After 72 hours of incubation, the attached cells were stained using cell trackergreen (1 mM, Molecular Probes, Inc., Eugene, OR) for 30 minutes. For vWF/CD31 immunofluorescence staining, cells were fixed by formaldehyde andpermeabilized for 15 min with 0.1% solution of Triton X-100 before incubationwith primary antibody vWF and CD31 for 40 min. Secondary antibody AlexaFlor 546 goat anti-rabbit IgG, Alexa Fluor 488 goat anti-mouse IgG andDAPIwere then added for 45 min.
23 Formation of Capillary Tube-like Structures on Micropatterned Biomaterials 201

Fluorescent microscope images were acquired using a SPOT II CCD camera
(SPOT Diagnostic Instruments Inc., version 3.5.1, Sterling Heights, MI) and
analyzed with Metamorph (Universal Imaging, version 6. 0r4, Westchester,
PA) image analysis software. Confocal images were acquired using a Zeiss
LSM 510 laser scanning confocal microscope and analyzed with LSM Image
Browser software.
23.3 Results and Discussion
Figure 23.1 shows the procedures used to create micropatterns on the flat (Fig.
23.1A) and topographical patterned (Fig. 23.1D) gelatin films. Patterned
PDMS stamps with designed micro-grooves (10 mm, 20 mm and 30 mm) are
inked with cell resistant PEG-PLA and stamped directly onto flat gelatin film
by microcontact printing. Figure 23.1B shows a phase contrast micrograph of a
flat gelatin film patterned with a series of 20 mmwide lines. The 60 mmwide lines
Fig. 23.1 Schematic of the approach used for preparing flat and topographical patternedgelatin films. A). Procedure used to create micropatterns on flat gelatin films. B). Phasecontrast images of a patterned flat gelatin film. The 60 mm wide lines were covered by PEG-PLA. C). Selective adsorption of BSA fluorescein conjugate on flat gelatin films. D). Proce-dure used in fabricating topographically patterned gelatin films. E). Cross-section confocalimage of a topographical patterned gelatin film.
202 D. Gao et al.

separating the 20 mm wide lines were coated with PEG-PLA. BSA selectively
adsorbs to the 20 mm lines that were not coated with PEG-PLA (Fig. 23.1C).Topographical gelatin films were molded from the PDMS mold with
reversed features. After gelatin dried in 608C oven for 4 hours, gelatin film
was peeled off from PDMS mold and cross-linked with glutaraldehyde. After
drying, the gelatin film was patterned by a flat PDMS stamp inked with PEG-
PLA. Only plateau regions of the filmwere covered by PEG-PLA and form cells
resistant area (Fig. 23.1D). The groove depth of the topographical gelatin films
was 4.6�0.2 mm (Fig. 23.1E).To demonstrate the efficacy of patterned PEG-PLA gelatin film to control
the spatial distribution of cells, human microvascular endothelial cells were
seeded on the patterned films. Figure 23.2 shows the phase contrast images of
endothelial cells on PEG-PLA patterned flat (A-C) or topographical patterned
(D-F) gelatin with varying line width. Cells selectively attach and spread along
the 10, 20 and 30 mmwide lines. The width of the 10 mm lines can accommodate
a single cell, while 30 mm wide lines can accommodate two cells side by side.
A CB
D E F
Fig. 23.2 ABC). Endothelial cells on 10 mm, 20 mm, and 30 mmwide lines on flat gelatin filmafter 3 days. D EF). Endothelial cells on 10 mm, 20 mm, and 30 mmwide lines on topographicalpatterned gelatin films after 3 days.
23 Formation of Capillary Tube-like Structures on Micropatterned Biomaterials 203

After 3 days, the endothelial cells form capillary tube-like structures in 10 mmand 20 mm wide lines on flat gelatin films (Fig. 23.3A and 23.3B). No capillarystructure was observed on 30 mm wide lines.
Endothelial cells grown on topographical patterned gelatin films form capil-lary structures in 20 mm and 30 mm grooves. No capillary structure was found in10 mm grooves.
23.4 Conclusions
We have reported here a new approach to control spatially protein adsorptionand cell attachment on flat and topographical patterned gelatin films. Thepatterned gelatin films are stable and have the ability to confine effectivelyendothelial cells in line patterns. Patterned flat gelatin films formed capillarystructures on 10 mm and 20 mm lines while cells on topographical patternedgelatin films form capillary structure on 20 mm and 30 mm grooves. Our resultsshow that under identical medium conditions, cell spreading on patternedsubstrates can determine whether endothelial cells differentiate to form capil-lary tube-like structures.
Fig. 23.3 Capillary tube formation by human microvascular endothelial cells. Confocalmicroscopic images of CMFDA stained cells when viewed in a horizontal (top) or a vertical(bottom) cross section. Endothelial cells form capillary tube-like structures on 10 (A) and 20mm (B) wide lines on flat gelatin films after 3 days. Endothelial cells form capillary tube-likestructures on 20 (C) and 30 mm (D) wide lines on topographical patterned gelatin films after3 days.
204 D. Gao et al.

Acknowledgment The authors would like to thank the National Institute of Health(HL-084648) for the financial support of this work.
References
1. K.H. Plate, P. Warnke, Vascular endothelial growth factor. J. Neurooncol. 35(3), 363–370(1997).
2. L.E. Dike, C.S. Chen, M. Mrksich, J. Tien, M. George, Geometric control of SwitchingBetween Growth, Apooptosis, and Differentiation During Angiogenesis Using Micropat-terned Substrates, In Vitro Cell Dev. Biol. Anim. 35, 441–448 (1999).
3. J. Folkman, C. Haudenschild, Angiogenesis in vitro, Nature 288, 551–556 (1980).4. G. Kumar, Y. Wang, C.C. Co, C.C. Ho, Spatially controlled cell engineering on bioma-
terials using polyelectrolytes, Langmuir 19(25), 10550–10556 (2003).5. C.C. Lin, C.C. Co, C.C. Ho, Micropatterning proteins and cells on polylactic acid and
poly(lactide-co-glycolide), Biomaterials 26(17), 3655–3662 (2005).6. T. Yamaoka, Y. Tabata, Y. Ikada, Distribution and tissue uptake of poly(ethylene glycol)
with different molecular weights after intravenous administration to mice, J. Pharm. Sci.83, 601–606 (1994).
7. C. Job, L. Lagnado, Calcium and protein kinase c regulate the actin cytoskeleton in thesynaptic terminal of retinal bipolar cells, J. Cell. Biol. 143(6), 1661–1672 (1998).
23 Formation of Capillary Tube-like Structures on Micropatterned Biomaterials 205

Part VI
Bio-Instrumentation

Chapter 24
Error Analysis of Finite-Spectral-Linewidth
Illumination in Optical Oximetry Systems
Joseph L. Hollmann1 and Charles A. DiMarzio2
Abstract Multi-spectral systems consisting of a small number of wavelengthsare increasingly using light emitting diodes (LEDs) to reduce the overall costs ofthe system. However, LEDs typically have broad spectral bandwidths andcannot be modeled as having a single discrete wavelength. This paper putsforth a simple model to analyze the effects of using LEDs to illuminate a singlelayer of homogenous tissue. Monte Carlo simulations are used to approximatephoton propagation through a semi-infinite turbid medium oximetry systemusing two light emitting diodes with broad spectra for varying oxygen satura-tions. The results are then compared against diffusion solutions for narrow-band illumination at the same two center wavelengths.
24.1 Introduction
Pulse oximetry was initially developed in the mid-1930s [1]. In its simplest form,tissue is illuminated with two light sources in both the visible and near infrared(NIR) spectrums. Typically the wavelengths are chosen so one is less than, andthe other is greater than the isosbestic wavelength (around 800 nm) [2]. Thesignals’ pulsatile components are then filtered and analyzed. Initially, pulseoximeters were designed to monitor signals due to the cardiac cycle whichmanifests itself primarily in the arteries [1] now some also monitor signalchanges due to the respiratory cycle, which primarily affects the veins. Typi-cally, the Modified-Beer Lambert’s Law or some variant of it is used to find theoxygen saturation for the pulsatile signal.
Typical pulse oximeter illumination wavelengths are centered at 660 nan-ometers (nm) and between 880 and 940 nm [3]. For the purposes of this paper,we shall utilize illumination sources centered at 660 nm and 904 nm to analyze
1RBC Product Development, Lenexa, Kansas, 66215.2Northeastern University, Department of Electrical and Computer Engineering, Boston,Massachusetts, 02115.
K.A. Kang et al. (eds.), Oxygen Transport to Tissue XXIX� Springer 2008
209

the performance of commonly available oximeters; we will also develop themethodology for doing so at other wavelengths.
The basic operating principals of the pulse oximeter have remained largelyunchanged even as the hardware used to acquire the measurements has evolved.One of the hardware changes that requires a second look is the evolution fromlasers to light emitting diodes (LEDs) for illumination sources. This change isoccurring for several reasons: cost, eye safety and the simplicity of the biasingcircuit design are examples.
A laser provides narrow illumination spectral width, whereas the full widthhalf max spectrum of an LED ranges from 20 nm in the visible range to 40 nm inthe NIR region; the absorption coefficient of hemoglobin can change signifi-cantly in this range. However, Beer’s Law assumes a single absorptioncoefficient for each illumination source. Although this is a valid approximationfor lasers it may not be accurate for LEDs. This is especially so in portions of thespectrum where the gradient of the absorption spectrum is steep.
24.2 Theory
If oxygenated and deoxygenated hemoglobin are assumed to be homogenouslydistributed throughout tissue and are the primary absorbers, the absorption ofthe tissue at a given wavelength is given as
650 700 750 800 850 900 950 1000
1
2
3
4
5
6
7
8
lambda (nm)
Spe
cific
mol
ar a
bsor
ptio
n co
effic
ient
oxyhemoglobindeoxy hemoglobin
Fig. 24.1 Specific absorption of oxy (solid line) and deoxy hemoglobin (dashed line) versuswavelength.
210 J.L. Hollmann, C.A. DiMarzio

�aðlÞ ¼ �oxyðlÞSo þ �deoxyðlÞð1� SoÞ� �
Hb½ � (24:1)
where [Hb] is the hemoglobin concentration, So is the fraction of oxygenated
hemoglobin and �oxy and �deoxy are the molar absorption coefficients of oxyge-
nated and deoxygenated hemoglobin, respectively. A graph of the molar
absorption coefficients over the wavelength range 650 nm–1000 nm can be
found in Fig. 24.1.If each illumination source is monochromatic, Eq. (24.1) would be enough to
describe the absorption of light by the tissue. However, this assumption is not
met by LEDs. Analyzing the graph in Fig. 24.1 it is easy to see the deoxygenated
hemoglobin spectrum has a relatively steep gradient in the wavelength range of
650–730 nm. This may present a problem if the amount of deoxygenated
hemoglobin is low.
24.3 Illumination Source
The LED light sources will be modeled as having Gaussian spectral envelopes:
one centered at 660 nm with a 20 nm BW and the other at 904 nm with a 40 nm
BW. The full width-half max (FWHM) of a Gaussian curve is related to the
standard deviation (�) by
� ¼ 2:3548 � FWHM (24:2)
The power spectral density at discrete wavelengths is given as
PlðlÞ ¼Pinput
sffiffiffiffiffiffi
2pp exp �ðl� lcÞ2
.
2s2� �
(24:3)
where lc is the center wavelength of the LED’s spectral envelope. The total
power of the LED, Pinput, is given by
Pinput ¼Z
l hi
l lo
PlðlÞdl; (24:4)
where PlðlÞis the LED power per wavelength. The limits of integration, lhiandllo, are the maximum and minimum wavelengths of the LED’s spectral band-
width (BW), respectively. For the purposes of our simulations, the LED’s
spectral envelope encompassed wavelengths up to one BW away from the
center wavelength. The laser beam was modeled as emitting a single discrete,
wavelength centered at either 660 or 904 nm.
24 Error Analysis of Finite-Spectral-Linewidth Illumination 211

24.4 Tissue Model
To evaluate the difference between the narrow band and broadband model the
pulse oximeter was simulated as being on the ear lobe. The earlobe is simulated
as a 5 mm thick infinite slab with a normally incident, infinitesimally narrow,
collimated light beam incident on one side and a 1 mm diameter circular
detector on the other side of the lobe. Figure 24.2 shows the geometry. The
blood vessel in the figure represents the arterial flow.The microvasculature and cartilage in the ear lobe was modeled as a homo-
genousmedium (as shown in Fig. 24.3). Varying the hemoglobin concentrations
in the tissue simulated the diastolic and systolic pressures in the microvascula-
ture of the earlobe.When the microvasculature was at its minimum volume or diastolic state, the
hemoglobin concentration was 0.12 milliMolar (mM) with low oxygen satura-
tion. After the pulse, at the microvasculature’s maximum or diastolic volume, the
concentration is doubled with the addition of highly oxygenated hemoglobin. A
table of values for the diastolic and systolic pressures can be found in Table 24.1.Thescattering coefficient for the earlobe was chosen to be 400 cm–1 at 660 nm
and 350 cm–1 at 940 nm [4]. The anisotropy factor was 0.8. Since the scattering
coefficient changes gradually with wavelength, it was assumed to be unchanging
over the bandwidth of the LEDs. It should be noted that if both illumination
S
0.5 cm
Lightsource
detector
0.1 cm
Ear Lobe
So
[Hb]Fig. 24.3 Homogenousmodel of the earlobe whereSo is the average oxygensaturation of the ear and[Hb] is the total hemoglobinconcentration.
detector0.5 cm
Lightsource
Ear Lobe
Spo
[Hbt]S Sto
0.1 cm
[Hbp]Fig. 24.2 Earlobe modelwhere [Hbp] and [Hbt] arethe molar concentration ofhemoglobin and Spo and Stoare the pulsatile and tissueoxygen saturation,respectively.
212 J.L. Hollmann, C.A. DiMarzio

wavelengths were chosen closely together, they could be modeled as having a
single scattering coefficient.
24.5 Propagation of Light
Beer’s law describes the propagation of light through a non-scattering medium.
However, it does not accurately describe the effects of scattering. Since most
tissues, including the earlobe, are highly scattering Monte Carlo simulations
were used. A Monte Carlo simulation propagates light through a turbid med-
ium with tissue simulating optical properties using a weighted random walk.
For this work theMulti-Layer Monte Carlo program (MCML) was utilized [5].The MCML program was run with 1 million photons for each wavelength.
The program outputs the transmission in spatially resolved probability (T). If
we assume a 1 mW input, the output has units of mW/cm2. The power incident
on the detector is therefore solved for by integrating the output power over the
area of the detector or
PdetectorðlÞ ¼Z
:5cm
�:5cm
Z
:5cm
�:5cm
PinputðlÞTðx; yÞdxdy: (24:5)
However, MCML assumes radial symmetry and provides an output in cylind-
rical coordinates, so the power incident on the detector is,
Pdetector lð Þ ¼ 2pZ
0:5cm
0
Pinput lð Þ�Tð�; lÞd� (24:6)
where � ¼ffiffiffiffiffiffiffiffiffiffiffiffiffiffiffi
x2 þ y2p
:
The result provides the spectrally resolved power at the detector.
Table 24.1 List of oxygen saturations and the resulting measured power for systolic anddiastolic pressures
Measured Power (mW)
Diastolic Systolic[Hb]= 0.12 mM [HB] = 0.24 mM
65% 75% 82.5% 87.5%
Broad Band 660 7.8392e-005 1.1337e-004 5.3160e-005 7.4098e-005
904 1.4857e-004 1.4318e-004 4.2293e-005 4.1030e-005
Narrow Band 660 8.6977e-005 1.2214e-004 5.4018e-005 7.4855e-005
904 1.5063e-004 1.4915e-004 4.0397e-005 4.1481e-005
24 Error Analysis of Finite-Spectral-Linewidth Illumination 213

To calculate the power at a detector due to a LED, the integral of the
Gaussian weighted values of Pdetector(l) was computed.
Ptotal ¼Z
l hi
l lo
PdetectorðlÞTðlÞdl (24:7)
The spectrum ofPðlÞwas simulated by discrete contribution with a spacing of 2
nm. The calculated Ptotal for a laser illumination source was given by Pdetector
since it is monochromatic. For the integrations in Eqs. 24.6 and 24.7, Simpson’s
numerical quadrature was employed [6].The calculated Pdetector values were utilized for the inverse problem to find
the pulsatile oxygen saturation using Modified Beer-Lambert’s law
Spo ¼�904deoxyR� �660deoxy
�660oxy � �660deoxy � R �904oxy � �904deoxy
� � (24:8)
where
R ¼ln Pdiastolic
total ð660Þ.
Psystolictotal ð660Þ
� �
ln Pdiastolictotal ð904Þ
.
Psystolictotal ð904Þ
� � : (24:9)
24.6 Results and Discussion
Table 24.1 shows the absolute reflectance measurements for two hemoglobin
concentrations with various oxygen saturations. As mentioned above, the power
measured at the detector for laser illumination was calculated using Eq. 24.6 and
the power for the LED was calculated using (7. It should be noted that the error
between themeasuredLEDand laser power is largest at low saturations. From the
discussions abovewe can see this is expected. As the amount of deoxy-hemoglobin
increases so does the effect of the gradient along the illumination spectra.The oxygen saturations were calculated for a diastolic oxygen saturation of
75% and a pulsatile saturation of 90% and 100%. Table 24.2 displays the
resulting error in oxygen saturation calculations as calculated by Eq. 24.8.It is important to note that the inverse oxygen saturations do not match the
actual oxygen saturations. This is due to the scattering properties of the med-
ium; however, these effects are normally calibrated out by taking test data over
several subjects. It is important to note that the narrow band and broadband
calculations are within a few percent of each other.
214 J.L. Hollmann, C.A. DiMarzio

24.7 Conclusion
As discussed, most pulse oximeter algorithms assume a monochromatic illumi-nation source when solving for the oxygen saturation in tissue. A narrowbandwidth source such as a laser can be approximated as a monochromaticsource; however a broadband LED cannot. This paper addressed the issue ofutilizing LEDs in pulse oximetry applications.
This analysis was done for a pulse oximeter on a simulated earlobe. Thespectrally resolved power was then propagated through the earlobe usingMonte Carlo simulations. The LEDs’ spectral envelopes were modeled asGaussians and used to solve for the power arriving at the detector with Eq.24.6. It should be noted that any arbitrary spectral envelope can be utilized.
The simulated absolute power was then solved for each LED and laserillumination source and the results were displayed in Table 24.1. The absolutepower measurements were then utilized to calculate the oxygen saturationsshown in Table 24.2. The results show the error associated with a broadbandLED is minimal within physiological conditions.
However, there are other possible error sources associated with utilizingLEDs, which have not been analyzed here; such as uncollimated light. Thesimulations utilized assumed the light illuminating the tissue was collimated, anassumption more closely met by lasers. Future work will merge the analysisconducted in this paper with an examination of the error associated withutilizing uncolimated light sources.
References
1. Y. Mendelson, Pulse oximetry: theory and applications for noninvasive monitoring, Clin.Chem., 38(9), 1601–1607 (1992).
2. S. Fantini and M. A. Franceshini, in: Handbook of Optical Biomedical Diagnostics, editedby V. V. Tuchin (SPIE Press, Bellingham, 2002), pp. 427–431.
3. S. M. L. Silva, M. L. D. Castilla, and J. P. S. Martin, Near-infrared transmittance pulseoximetry with laser diodes, J. Bio. Opt., 8(3), 525–533 (2003).
4. M. J. C. Van Gemert, , S. L. Jacques, H. J. C. M. Sterenborg, andW.M. Star, Skin Optics,IEEE Trans. Bio. Eng., 36 (12), 1146–1154 (1989).
5. L.-H. Wang, S. L. Jacques, and L.-Q. Zheng, MCML –Monte Carlo Modeling of PhotonTransport in Multi-layered Tissues, Computer Methods and Programs in Biomedicine 47,131–146 (1995).
6. M. N. O. Sadiku,Numerical Techniques in Electromagnetics, 2nd edition (CRC Press, BocaRaton, 2001) pp. 197–199.
Table 24.2 Computed oxygen saturations as calculated by Eq. 8
Calculated Saturations
Oxygen Saturation Narrow Band Broad Band
90% 86.5% 86.4%
100% 97.0% 95.4%
24 Error Analysis of Finite-Spectral-Linewidth Illumination 215

Chapter 25
Changes in the Attenuation of Near Infrared
Spectra by the Healthy Adult Brain During
Hypoxaemia Cannot be Accounted for Solely
by Changes in the Concentrations
of Oxy- and Deoxy-Haemoglobin
Martin M. Tisdall1, Ilias Tachtsidis2, Terence S. Leung2,
Clare E. Elwell2, and Martin Smith1
Abstract It has been suggested that changes in oxidised cytochrome c oxidaseconcentration ([oxCCO]) measured using cerebral near infrared spectroscopy(NIRS) may be algorithm artefacts. We examine the change in near infrared(NIR) attenuation by the healthy adult brain (n=10) during hypoxaemia. Broad-band spectroscopic data were collected during normoxia, and hypoxaemia. TheUCLn algorithm was used to fit (a) oxy- (HbO2) and deoxy-haemoglobin (HHb)spectra (2 component fit), and (b) HbO2, HHb and oxidised-reduced cytochrome coxidase difference spectra (3 component fit) to themean change inNIR attenuationbetween baseline and hypoxaemia. The sum of squares of the residuals was100�10–7 OD2 for the 2 component fit and 8�10–7 OD2 for the 3 component fit,and the two sets of residuals differed from each other (p=0.0003). We compareexperimental and simulated data and suggest that the 2 component residualsindicate a change in [oxCCO]. Changes in near infrared attenuation by the healthyadult brain during hypoxaemia cannot be accounted for solely by changes in oxy-and deoxy-haemoglobin concentrations. Including [oxCCO] in the algorithmimproves its fit quality. These data suggest that changes in cerebral cytochrome coxidase redox occur during hypoxaemia and that they can be detected using NIRS.
25.1 Introduction
The use of near infrared spectroscopy (NIRS) to measure changes in the opticalcharacteristics of living tissue was first described by Jobsis in 1977 [1]. NIRSmakes use of the fact that biological tissue is relatively transparent to lightbetween 700–900 nm, thus allowing interrogation of structures beneath the
1Department of Neuroanaesthesia and Neurocritical Care, The National Hospital forNeurology and Neurosurgery, Queen Square, London, UK.2Department of Medical Physics and Bioengineering, University College London, London, UK.
K.A. Kang et al. (eds.), Oxygen Transport to Tissue XXIX� Springer 2008
217

tissue surface [1]. Light passing through biological tissue is subject to multiplescattering interactions, and this complicates the interpretation of the intensityof detected light. However, if light lost due to scattering is assumed to remainconstant, and the average pathlength of light through tissue is known, themodified Beer-Lambert law can be used to convert change in light attenuationto absolute change in chromophore concentrations [2].
In both animals and humans, NIRS has been used to measure change inconcentrations of oxy- (�[HbO2]), and deoxy-haemoglobin (�[HHb]) andoxidised cytochrome c oxidase (�[oxCCO]) [3–5], however controversy stillremains as to the validity of the measured �[oxCCO] [5].
Cytochrome c oxidase (CCO) is the terminal electron acceptor of the mito-chondrial electron transfer chain and catalyses over 95% of oxygen metabo-lism. The reduction of dioxygen provides the proton motive force to driveaerobic adenosine triphosphate synthesis [6]. The difference spectrum betweenthe oxidised and reduced forms of CCO has a distinct band in the near infrared(NIR) region, with a broad peak located around 830 nm [1]. Assuming the totalconcentration of CCO remains constant, changes in the CCO signal representchanges in the CCO redox state. The CCO signal is an attractive target forclinical monitoring, as it offers the potential to provide a non-invasive markerof the adequacy of mitochondrial oxygen delivery.
However, detection of changes in the CCO signal is complicated by the factthat the concentration of CCO in the brain is approximately one order ofmagnitude less than that of either oxy- or deoxy-haemoglobin [7]. This raisesthe possibility that measured �[oxCCO] might simply be an artefact producedby the algorithms, used to convert measured attenuation changes into chromo-phore concentration changes, being unable to adequately separate the CCO andhaemoglobin signals [5]. Furthermore, controversy remains as to the degree ofhypoxaemia required to produce changes in CCO redox state.
Despite these issues, �[oxCCO] has been shown to correlate with nuclear mag-netic resonance 31P spectroscopy measured reduction in phosphocreatine andnucleoside triphosphate in an animalmodel of cerebral ischaemia [8], and in cardiacsurgery in humans it has been shown to predict adverse neurological outcome [4].
In this study we measure the change in NIR light attenuation by the healthyhuman brain during hypoxaemia using a broadband NIR spectrometer. Weanalyse the residual errors produced by the fitting procedure for the conversionof light attenuation into chromophore concentrations in order to determine ifthe change in NIR attenuation can be accounted for solely by �[HHb] and�[HbO2], or whether �[oxCCO] must also be considered.
25.2 Materials and Methods
This study was approved by the Joint Research Ethics Committee of theNational Hospital for Neurology and Neurosurgery and the Institute ofNeurology. We studied 10 healthy subjects (7 male, 3 female, median age
218 M.M. Tisdall et al.

32 years, range 30–39). Broadband spectrometer (BBS) optodes were placed
3.5 cm apart in a black plastic holder, and fixed to the right side of the
forehead in the midpupilary line. Light from a stabilised tungsten halogen
light source was passed through 610nm long-pass and heat absorbing filters,
and transmitted to the head via a 3.3 mm diameter glass optic fibre bundle.
Light incident on the detector optode was focused via an identical fibre
bundle onto the 400 mm entrance slit of a 0.27 m spectrograph (270M,
Instruments SA, France) with a 300g/mm grating. NIR spectra between
650 and 980 nm were collected at 1Hz on a cooled charge coupled device
detector (Wright Instruments, UK) giving a spectral resolution of �5 nm. An
oximeter probe (Novametrix Medical Systems Inc., USA) measured arterial
oxygen saturation (SaO2). A modified anesthetic machine delivered gas to the
subject via a mouthpiece. Inspired oxygen concentration (FiO2) was mea-
sured using an inline gas analyser (Hewlett Packard, UK). The study com-
menced with five minutes monitoring at normoxia. We then added nitrogen
to the inspired gases to induce a gradual fall in SaO2 to 80% and, immedi-
ately after this was achieved, the FiO2 was returned to normoxia for five
minutes. This cycle was repeated three times.The points just prior to the start of each hypoxaemia (baseline), and at the end
of each hypoxaemia (hypoxaemia), were identifiedmanually using the SaO2 data.
At each of the two points the mean of the preceding ten seconds of data was
taken.Data from the three experimental cycleswere averaged to givemean values
for SaO2 and NIR light intensity at baseline and hypoxaemia for each subject.
Optical pathlength was calculated using second differential analysis of the 740nm
water feature [9]. Change in NIR attenuation was then calculated from:
�A ¼ log10 Ibase�
Ihypox� �
(25:1)
where �A=change in attenuation from baseline to hypoxaemia, Ibase= light
intensity at baseline and Ihypox=light intensity at hypoxaemia measured in units
of optical density (OD). The UCLn algorithm [10], a multiple regression analysis
utilising the Beer-Lambert law was then used to fit chromophore extinction
coefficients, corrected for the wavelength dependence of the optical pathlength
[11], to the group mean change in attenuation, using 120 wavelengths between
780 and 900 nm. Chromophore specific extinction coefficients were downloaded
from the medical physics UCL website [12]. First, only oxy- (HbO2) and deoxy-
haemoglobin (HHb) spectra (2 component fit – Eq. (25.2) and then HbO2, HHb
and the oxidised-reduced CCO difference spectra (oxCCO) (3 component fit –
Eq. (25.3)) were fitted to the group mean change in attenuation. After interpola-
tion of the residuals to the spectral resolution of the BBS (5 nm), the sums of the
squares of the residuals from these two analyses were calculated, and the dis-
tributions of the two sets of residuals were compared.
25 Changes in Near Infrared Attenuation by the Brain 219

� HbO2½ �� HHb½ �
� �
¼ 1
PL
"HbO2lið Þ "HHb lið Þ
..
. ...
"HbO2lj� �
"HHb lj� �
0
B
B
@
1
C
C
A
�1 �A lið Þ...
�A lj� �
0
B
B
@
1
C
C
A
� HbO2½ �� HHb½ �
� oxCCO½ �
0
B
@
1
C
A
¼ 1
PL
"HbO2lið Þ "HHb lið Þ "oxCCO lið Þ
..
. ... ..
.
"HbO2lj� �
"HHb lj� �
"oxCCO lj� �
0
B
B
@
1
C
C
A
�1 �A lið Þ...
�A lj� �
0
B
B
@
1
C
C
A
ð25:3Þ
where�[HHb],�[HbO2] and�[oxCCO]are changes in the concentrationsofoxy-,and deoxy-haemoglobin and oxidised cytochrome c oxidase in mM, PL=path-length in cm, E is the specific extinction coefficient of the subsequent chromophorein OD/mM/cm and �A is the change in attenuation, at wavelengths li to lj.
We then produced a simulated attenuation spectrum calculated usingassumed �[HHb], �[HbO2] and �[oxCCO] and their respective specific extinc-tion coefficients, and ignoring change in attenuation due to other chromo-phores, using Eq. (4). We fitted a 2 component model to this spectrum andcompared the resultant residuals with those from a 2 component fit to the groupmean experimental spectrum. 2 component fits to the experimental and simu-lated data for each individual were then compared.
�AðljÞ ¼ PLf�½HbO2� � "HbO2ðljÞ þ�½HHb� � "HHbðljÞ
þ�½oxCCO� � "oxCCOðljÞg ð25:4Þ
Statistical analysis was carried out using SAS software (v8.2, SAS Institute,USA) and p values <0.05 were considered significant. Group changes betweenbaseline and hypoxaemia were compared using Wilcoxon signed rank test andthe distributions of the residuals from the various fitting procedures werecompared using a 2 sample Siegel-Tukey test [13].
25.3 Results
Results are presented as median (interquartile range). The median time ofhypoxia required to reach an SaO2 of 80% was 4.48 mins (3.92 to 5.04). Duringthe study SaO2 fell from a baseline value of 99.0% (98.2 to 99.2) to 82.4% (80.1 to84.7) at the end of hypoxaemia (p=0.002) (Fig. 25.1). Note that due to the tensecond averaging window this median SaO2 is higher than 80%. There was nochange in optical pathlength between baseline and hypoxaemia (p=0.23). Groupmean change in attenuation from baseline to hypoxaemia is shown in Fig. 25.2
The residuals from the 2 and 3 component fits to the group mean experi-mental spectrum differed from each other (p=0.0003) (Fig. 25.3). The sum of
220 M.M. Tisdall et al.

the squares of the residuals was 100�10–7 OD2 for the 2 component fit to theexperimental spectrum and 8�10–7 OD2 for the 3 component fit to the experi-mental spectrum. There was no difference between the residuals from the2 component fits to the experimental and simulated spectra (p=0.61)(Fig. 25.3). The 2 component fits to the experimental and simulated data foreach subject are shown in Fig. 25.4. In eight out of the ten subjects, there wereno differences between the two sets of residuals (p>0.05).
25.4 Conclusions
The quality of a multiple regression fit can be determined by assessing theresiduals of the fitting procedure. The better the fit the smaller will be the sumof the square of the residuals, with the perfect theoretical fit having residuals all
Baseline Hypoxaemia
p = 0.002
90
100
80
Art
eria
l Oxy
gen
Sat
urat
ion
(%)
Fig. 25.1 Boxplot showing arterial oxygen saturation data at baseline and hypoxaemia.
780 820 860 900Wavelength (nm)
4
2
0
Cha
nge
in A
ttenu
atio
n (O
D ×
10–2
)
Fig. 25.2 Groupmean change in near infrared attenuation between baseline and hypoxaemia.
25 Changes in Near Infrared Attenuation by the Brain 221

equal to zero. Furthermore, any residuals which are present should berandomly distributed around zero. The presence of residuals which are notrandomly distributed suggests that there is a component missing from thefitting analysis.
The residuals from the 2 component fit to the group mean experimentalspectrum do not appear independent and show a broad peak located around830 nm which is similar to the oxCCO difference spectrum. This suggests thatthe attenuation of NIR spectra by the healthy human brain during hypoxaemiacannot be accounted for solely by �[HHb] and �[HbO2]. When the 3 compo-nent model is used, to also fit for �[oxCCO], the sum of the squares of theresiduals is reduced and the residuals appear random, thus improving the fit.The simulated spectrum assumes that �[HHb], �[HbO2] and �[oxCCO] areoccurring and that no other chromophores are causing a change in opticalattenuation. The residuals from the 2 component fit to this spectrum arethose that would be expected from the 2 component fit to the experimentaldata if �[HHb], �[HbO2] and �[oxCCO] were occurring in the brain duringthis hypoxaemic challenge. The residuals from the 2 component fit to theexperimental spectrum do not differ from those resulting from the 2 componentfit to the simulated spectrum. This strongly suggests that �[oxCCO] isoccurring and this accounts for the residuals from the 2 component to theexperimental data.
There is no statistical difference between the individual 2 component fits tothe experimental and simulated data in eight out of ten of the individualsubjects. This demonstrates the optical effect of �[oxCCO] at the individualas well as the group level. In the two subjects who exhibited differences betweenthe residuals to the experimental and simulated data, the simulated residuals arevery close to zero. This results in a very low dispersion in the residuals to thesimulated data. It is possible that in these two individuals the physiologicalchallenge was insufficient to produce a significant change in �[oxCCO].
780Wavelength (nm)
820 860 900Cha
nge
in A
ttenu
atio
n (O
D ×
10–3
)
1
0
–1
Residuals from 2 component fit to experimental spectrumResiduals from 2 component fit to simulated spectrumResiduals from 3 component fit to experimental spectrum
Fig. 25.3 Residuals from 2 and 3 component fits to group mean change in near infraredattenuation between baseline and hypoxaemia and 2 component fit to simulated spectrum.
222 M.M. Tisdall et al.

Fig. 25.4 Residuals from 2 component fits to change in near infrared attenuation betweenbaseline and hypoxaemia (- -) and 2 component fit to simulated spectrum (—) for eachindividual subject. Two subjects had significant differences between the two sets of residuals(marked with *).
25 Changes in Near Infrared Attenuation by the Brain 223

We postulate, therefore, that changes in cerebral CCO redox state occurduring moderate hypoxaemia, and that we can detect these changes using non-invasive BBS. We suggest that one should fit the oxidised-reduced CCO differ-ence spectra when using NIRS to monitor the brain during hypoxaemia. It hasbeen suggested that NIRS algorithms using a small number of discrete wave-lengths are less capable of separating the HbO2, HHb and oxCCO signals.10
This broadband spectroscopy dataset collected using multiple wavelengths willallow us to test various sets of wavelengths in order to determine which subsetsperform best.
We are currently using BBS to study changes in human cerebral CCO redoxstate occurring after traumatic brain injury. This measurement may be able toprovide clinically relevant information with which to guide neuroprotectivetreatment of acute brain injury on the neurocritical care unit.
Acknowledgment MMT is aWelcomeResearch Fellow, GrantNo 075608. IT is supported byUCL/UCLH Trustees.
References
1. F. F. Jobsis, Noninvasive, infrared monitoring of cerebral and myocardial oxygensufficiency and circulatory parameters, Science 198(4323), 1264–1267 (1977).
2. D. T. Delpy, M. Cope, P. van der Zee, S. Arridge, S. Wray, and J. Wyatt, Estimation ofoptical pathlength through tissue from direct time of flight measurement, Phys. Med.Biol. 33(12), 1433–1442 (1988).
3. C. E. Cooper, D. T. Delpy, and E. M. Nemoto, The relationship of oxygen delivery toabsolute haemoglobin oxygenation and mitochondrial cytochrome oxidase redox state inthe adult brain: a near-infrared spectroscopy study, Biochem. J. 332(3), 627–632 (1998).
4. Y. Kakihana, A. Matsunaga, K. Tobo, S. Isowaki, M. Kawakami, I. Tsuneyoshi, Y.Kanmura, and M. Tamura, Redox behavior of cytochrome oxidase and neurologicalprognosis in 66 patients who underwent thoracic aortic surgery, Eur. J. Cardiothorac.Surg. 21(3), 434–439 (2002).
5. T. Sakamoto, R. A. Jonas, U. A. Stock, S. Hatsuoka, M. Cope, R. J. Springett, andG. Nollert, Utility and limitations of near-infrared spectroscopy during cardiopulmon-ary bypass in a piglet model, Pediatr. Res. 49(6), 770–776 (2001).
6. O. M. Richter, and B. Ludwig, Cytochrome c oxidase–structure, function, and physiol-ogy of a redox-driven molecular machine, Rev. Physiol. Biochem. Pharmacol. 147, 47–74(2003).
7. G.C. Brown, M. Crompton, and S. Wray, Cytochrome oxidase content of rat brainduring development, Biochem. Biophys. Acta 1057(2), 273–275 (1991).
8. R. J. Springett, M. Wylezinska, E. B. Cady, V. Hollis, M. Cope, and D. T. Delpy, Theoxygen dependency of cerebral oxidative metabolism in the newborn piglet studied with31P NMRS and NIRS, Adv. Exp. Med. Biol. 530, 555–563 (2003).
9. S. J. Matcher, M. Cope, and D. T. Delpy, Use of the water absorption spectrum toquantify tissue chromophore concentration changes in near-infrared spectroscopy, Phys.Med. Biol. 39(1), 177–196 (1994).
10. S. J. Matcher, C. E. Elwell, C. E. Cooper, M. Cope, and D. T. Delpy, Performancecomparison of several published tissue near-infrared spectroscopy algorithms, Anal.Biochem. 227(1), 54–68 (1995).
224 M.M. Tisdall et al.

11. M. Essenpreis, M. Cope, C.E. Elwell, S.R. Arridge, P. van der Zee P, and D.T. Delpy,Wavelength dependence of the differential pathlength factor and the log slope in time-resolved tissue spectroscopy, Adv. Exp. Med. Biol. 333, 9–20 (1993).
12. http://www.medphys.ucl.ac.uk/research/borl/research/NIR_topics/spectra/spectra.htm.13. S. Siegel, and N.J. Castellan Jr,Nonparametric Statistics for the Behavioural Sciences 2nd
ed. (McGraw-Hill, Singapore, 1988).
25 Changes in Near Infrared Attenuation by the Brain 225

Chapter 26
Assessment of Oxygenation and Perfusion
in the Tongue and Oral Mucosa by Visible
Spectrophotometry and Laser Doppler
Flowmetry in Healthy Subjects
D.B. Singh1, G. Stansby2, and D.K. Harrison1
Abstract Use of Visible Light Spectrophotometry (VLS) and Laser Doppler
Flowmetry (LDF) is currently being studied by the authors to assess the
viability of tissue margins in colon resection and to assess mucosal oxygenation
in the colon. Thus, as a preliminary study it was necessary to evaluate whether
there is any systematic inter-probe variability of the measurements by VLS and
LDF. The oral mucosa was used as a model.
Methods SO2 with VLS (WhitlandResearch RM200) and blood flowwith LDF
(Moor Instruments DRT4) were measured at 10 sites each on the tongue and
oral mucosa of 10 healthy volunteers at 0, 6 and 24 hours using 3 different
probes for VLS and 2 probes for LDF.
Results The results showed that the SO2 measurements by VLS using the
different probes on the tongue and mucosa were significantly correlated
(P<0.05). SO2 values at 6 hours were significantly higher than at 0 and
24 hours (P<0.05) in all but one case. SO2 measurements were not correlated
with LDF. LDF measurements by the 2 probes were correlated significantly
(P<0.05) but the standard deviations were very large.
Conclusions SO2 measurements on the oral mucosa are reproducible. Due to
the large variations in LDF, VLS is likely to be themore clinically useful tool for
identifying mucosal ischaemia
26.1 Introduction
A clinical study is currently being undertaken by the authors on the use of
Visible Light Spectrophotometry (VLS) and Laser Doppler Flowmetry (LDF)
to assess the viability of tissuemargins in colon resection. Adequate tissue blood
flow and oxygenation are known to be essential for anastomotic healing
1University Hospital of North Durham, Durham, UK.2Northern Vascular Unit, Freeman Hospital, Newcastle upon Tyne, UK.
K.A. Kang et al. (eds.), Oxygen Transport to Tissue XXIX� Springer 2008
227

following colorectal resections in both animal and human clinical studies [1].In a comparison of colonic pouch-anal and conventional straight end-to-endanastomosis, the microcirculation at the site of the anastomosis in the pouchwas shown to be better preserved, as measured by higher tissue blood flow, thanat the end of the conventional straight anastomosis [2]. This may account for thereported lower rates of leakage with a colonic J pouch reconstruction followinglow anterior resection [3].
A further study is also assessing mucosal oxygenation in the colon by VLS,during colonoscopy, for diagnosing bowel ischaemia.
The technique of lightguide spectrophotometry to measure tissue oxygensaturation has been validated for use in assessing microvascular blood flow inskin in peripheral vascular disease and has been shown to be of clinical use indefining the levels of amputation in patients with peripheral arterial disease [4].Use of VLS to assess tissue oxygen saturation (SO2) in the colon is a relativelynew procedure [5]. In the current clinical studies different configurations ofprobes are being used for the measurements of SO2 and LDF in the luminalsurface and serosal surface of the bowel. Thus, as a preliminary study it wasnecessary to evaluate whether there is any systematic inter-probe variability ofthe measurements by VLS and LDF. Similarly, it was necessary to establish therange and reproducibility of normal values for mucosal SO2 and to investigatewhether there were any diurnal variations. The oralmucosawas used as amodel.
26.2 Aim
The main aim of this study was to evaluate whether SO2 measurements bydifferent probes as measured by spectrometry are reproducible and whetherthere is any inter-probe variability. The reproducibility of Laser Doppler Fluxmeasurements was also evaluated.
26.3 Materials
The visible light spectrophotometer used was aWhitland Research RM200 SO2
monitor. A Moor Instruments DRT4 was used for Laser Doppler fluxmeasurements.
Three types of probes (2 endoscopic catheter probes and 1 surface probe)were used for SO2 measurements by VLS. Endoscopic catheter probes, 4 metresin length, had outer diameters of 2.1mm and 1.35mm (Moor Instruments, UK,DP6sd). The endoscopic probes used in this study were side delivery ones whichmeant that the light was emitted and received from the side within 5mm of thetip rather than the end. These probes are specifically designed for laser Dopplerfluxmeasurements, but with the help of an adaptor (manufactured with the helpof Moor Instruments, UK) it was possible to use the same probes for SO2
228 D.B. Singh et al.

measurements. The surface probe used is a standard probe by WhitlandResearch used for measuring SO2. An external light source was used with thecatheter probes in the form of a halogen lamp (400watts) as the LED lightsource in the spectrophotometer was not sufficiently powerful for the catheterprobe. For the surface probe we used the spectrophotometer’s in-built lightsource. In order to eliminate systemic spectral effects such as lightguide trans-mission characteristics, variations in photodiode array sensitivity and the dif-ferent light sources used, a dark and white balance was carried out with eachprobe prior to measurement.
Two types of probes were used for LDF measurements – one endoscopiccatheter probe with outer diameter 2.1mm (Moor Instruments DP6asd) and asurface probe (Moor Instruments, DP1T-V2).
26.4 Methods
Ten healthy volunteers were recruited for the study after securing ethicalapproval from the Local Research Ethics Committee. Participants withknown medical conditions and smokers were excluded from the study. SO2
with VLS (Whitland Research RM200) and laser Doppler flux (Moor Instru-ments DRT4) were measured on the tongue and oral mucosa at 0, 6 and24 hours. The three types of probes described above were used for VLS. Theendoscopy catheter probe with outer diameter 2.1 mm and surface probe(DP1T-V2) were used for LD flux measurements. Measurements were takenwith each probe at 10 points both on the tongue and oral mucosa at 0, 6 and24 hours and the mean values recorded. Participants were requested not to haveany hot drinks for at least an hour before the measurements were taken.An ambient temperature of 22–238C was maintained throughout themeasurements.
26.5 Results
The median age of the participants was 43 (range 37–63) years with 7 females.The results showed that the SO2 measurements by VLS using the differentprobes on the tongue and mucosa (Table 26.1) were significantly correlated(P<0.05).
Bland and Altman [6] analysis of the original data showed that 95% of thedifference between the small catheter and surface probes were within 2 standarddeviations (SD). For the large catheter and surface probes, 90%of the differencewere within 2SD. However, this raw data may contain bias due to differencesbetween the probes because of physical factors such as lightguide diameter. Inorder to investigate whether this systematic bias could be corrected, regressionanalysis was carried out whereby the surface probe was considered as the
26 Assessment of Oxygenation and Perfusion in the Tongue and Oral Mucosa 229

standard. The correlations are shown in Figs. 26.1 and 26.2. The appropriate
regression equations shown in the figures were used to ‘‘calibrate’’ the SO2 values
measured using the catheter probes against the surface probe values. After the
corrections, further Bland and Altman [6] plots showed that the measurements
using all 3 probes were in agreement (Figs. 26.3 and 26.4). Ninety five percent of
the differences were within 2 standard deviations.The measurements from all probes were combined and produced mean (SD)
SO2 values for the tongue at 0, 6 and 24 hrs of 78.5 (10.0)%, 81.7 (7.7)%and 78.9
(6.3)% respectively. Corresponding figures for oral mucosa were 82.6 (6.6)%,
85.8 (5.4)% and 84.4 (4.4)% (Table 26.3).SO2 measurements were normally distributed, so the Student t-test was used
to analyse any differences between 0, 6 and 24 hours values in the tongue and
mucosa. The analysis showed significant differences between tongue and muco-
sal SO2 across all times (except at 0 hours) with mucosal SO2 being higher. SO2
values at 6 hours were significantly higher than at 0 and 24 hours (P<0.05) in all
but one case.
Table 26.1 Mean SO2 % in tongue and mucosa by different probes at 0, 6 and 24 hours
TongueMean SO2 ( SD) % MucosaMean SO2 ( SD) %
0 hour 6 hours 24 hours 0 hour 6 hours 24 hours
Large catheterprobe
81.8(5.6)
85.3(4.3)
83.2(3.6)
85.8(4.0)
87.8(3.3)
87.3(3.1)
Small catheterprobe
75.3(9.2)
79.8(8.3)
75.3(7.0)
80.3(6.6)
84.6(5.6)
81.4(3.6)
Surface probe 81.2(5.6)
81.2(5.8)
80.7(2.6)
82.2(5.1)
83.5(3.9)
83.8(2.9)
y = 0.5131x + 43.397
R2 = 0.331
50
55
60
65
70
75
80
85
90
95
100
50 60 70 80 90 100Surface probe SO2 %
Lar
ge
Cat
het
er p
rob
e S
O2
%
Fig. 26.1 Correlation between surface and large catheter SO2 probes.
230 D.B. Singh et al.

R2 = 0.3001
y = 0.8979x + 5.9419
50556065707580859095
100
50 60 70 80 90 100Surface probe SO2 %
Sm
all C
ath
eter
SO
2 %
Fig. 26.2 Correlation between surface and small catheter SO2 probes.
agreement between small catheter and surface SO2 probes (BA Plot using transformed data)
–30
–20
–10
0
10
20
30
0 20 40 60 80 100
mean SO2
dif
fere
nce
in S
O2
diff
–2 S.D.
+2 S.D.
–1 S.D.
+1 S.D.
Fig. 26.3 Bland Altman plot for surface and small catheter SO2 probes.
80
agreement between large catheter and surface SO2 probes (BA Plot using transformed data)
–30
–20
–10
0
10
20
30
0 20 40 60 100
mean SO2
dif
fere
nce
in S
O2
diff
–2 S.D.
+2 S.D.
–1 S.D.
+1 S.D.
80
Fig. 26.4 Bland Altman plot for surface and large catheter SO2 probes.
26 Assessment of Oxygenation and Perfusion in the Tongue and Oral Mucosa 231

SO2 measurements were not correlated with LDF. LDFmeasurements usingthe 2 probes (Table 26.2) were correlated significantly (P<0.05) but the standarddeviations were very large. For the purpose of data analysis we considered thesurfaceDoppler probe as the standard and applying the correlation we corrected
the values measured with the catheter probe. The corrected flux also had a highstandard deviation (163.3).
26.6 Discussion
This study confirms that after calibration of the catheter probes against thesurface probe, the physiological SO2 measurements by three different probes
are in agreement as 95% of the differences between the probes were within 2 SDand are within clinically acceptable limits. For the catheter probe a 400Wexternal light source was used to achieve an adequate signal. This loss is partlybe due to the adaptor used to connect the Laser Doppler probe to the spectro-
photometer. Further significant losses were experienced when using the smalldiameter catheter probe and the quality of the spectra obtained was poor. Forthis reason, the small catheter probe has been discontinued from use in ourfurther clinical work. The difference in mean SO2 for oral mucosa at 0 and6 hours was statistically significant but the actual difference was only 3%,which
would not be clinically significant. Friedland et al [5]. showed in their study thatthe colon SO2 decrease by 40% on induction of ischaemia. Fournell et al [8].hypothesized that an SO2 value below 60% probably mark the threshold formesenteric ischaemia.
Table 26.3 Mean SO2 and Flux values on the tongue and mucosa at 0, 6 and 24 hours
Time
TongueMean SO2
(Std Dev)%
MucosaMean SO2
(Std Dev)%
TongueMean Flux(Std Dev)
MucosaMean Flux(Std Dev)
0 hour 78.5 (10.0) 82.6 (6.6) 282.77 (100.98) 371.84 (106.57)
6 hours 81.7 (7.7) 85.8 (5.4) 332.31 (170.41) 412.81 (158.75)
24 hours 78.9 (6.3) 84.4 (4.4) 317.29 (79.3) 386.2 (91.9))
Table 26.2 Mean Laser Doppler Flux in tongue and mucosa measured by different probes at0, 6 and 24 hours
TongueMean flux (SD)
MucosaMean flux (SD)
0 hour 6 hours 24 hours 0 hour 6 hours 24 hours
Surface probe 339.1(74.7)
312.0(76.4)
312.0(61.6)
362.9(54.9)
364.5(90.4)
397.6(109.4)
Large catheterprobe
218.0(42.3)
263.5(63.4)
255.3(26.3)
271.3(40.2)
292.9(54.1)
269.5(19.8)
232 D.B. Singh et al.

Laser Doppler flux measurements on the tongue and oral mucosa were
highly variable. There was no correlation between SO2 and LDF. This poor
correlation can be explained by the fact that SO2 does not change significantly
until perfusion becomes much lower than any values measured in this study
(Caddick et al) [7]. The measurements using the surface probe were higher than
with the endoscopic probe at all times and sites. Even after correction of the
difference by applying the correlation, the differences between these two probes
were high with a SD of 144.5. There is a possibility that this difference may be
due to the side viewing configuration of the catheter probe. Even with only
slight rotation, the port would look away from the tissue, thus giving a low
reading.
26.7 Conclusions
The results indicate that SO2 measurements on the oral mucosa are reproduci-
ble, and values recorded using different probes are comparable. Due to the large
variations in LDF, VLS is likely to be the more clinically useful tool for
identifying mucosal ischaemia.
References
1. A. Vignali, L. Gianotti, M. Braga, G. Radaelli, L. Malvezzi and V. Di Carlo. Alteredmicroperfusion at the rectal stump is predictive for rectal anastomotic leak. Dis ColonRectum 43, 76–82 (2000).
2. M. Sailer, E. S. Debus, K. H. Fuchs, J. Beyerlein and A. Thiede. Comparison of anasto-motic microcirculation in coloanal J-pouches versus straight and side-to-end coloanalreconstruction: an experimental study in the pig. Int. J. Colorectal Dis. 15, 114–117 (2000).
3. O. Hallbook, K. Johansson, and R. Sjodahl, Laser Doppler blood flow measurement inrectal resection for carcinoma–comparison between the straight and colonic J pouchreconstruction. Br. J. Surg. 83 389–392 (1996).
4. D. K. Harrison, P. T. McCollum, D. J. Newton, P. Hickman and A. S. Jain, Amputationlevel assessment using lightguide spectrophotometry. Prosthet. Orthot. Int. 19 139–147(1995).
5. S. Friedland, D. Benaron, I. Parachikov and R. Soetikno, Measurement of mucosalcapillary hemoglobin oxygen saturation in the colon by reflectance spectrophotometry.Gastrointest. Endosc. 57 492–497 (2003).
6. J. M. Bland and D.G. Altman, Statistical methods for assessing agreement between twomethods of clinical measurement. Lancet 1 307–310 (1986).
7. J. Caddick C. Raine, D. Harrison and M. Erdmann, Lightguide spectrophotometry tomonitor free TRAM flaps. Adv. Exp. Med. Biol. 578 In Press (2006).
8. A. Fournell, S. Pourhassan, K. Franke, L. A. Schwarte, T.W. Scheeren andW. Sandmann,Reflectance spectrophotometry: A novel diagnostic approach to assess intestinal oxygena-tion in patients with mesenteric ischaemia. Presented at 32nd Conference of the Interna-tional Society on Oxygen to Tissue, Bari, Italy 21st–26th August 2004.
26 Assessment of Oxygenation and Perfusion in the Tongue and Oral Mucosa 233

Chapter 27
Cerebral Tissue Oxygen Saturation Calculated
Using Low Frequency Haemoglobin Oscillations
Measured by Near Infrared Spectroscopy
in Adult Ventilated Patients
Terence S. Leung1, Martin M. Tisdall2, Ilias Tachtsidis1, Martin Smith2,
David T. Delpy1, and Clare E. Elwell1
Abstract Oxy- (HbO2) and deoxy- (HHb) haemoglobin signals measured by nearinfrared (NIR) spectroscopy over the human frontal lobes frequently containrespiratory and low frequency oscillations (LFOs). It has been suggested pre-viously that venous oxygen saturation (SvO2) can be calculated from these respira-tory oscillations. In this paper, we investigated the use of a Fourier transformbased algorithm to calculate an oxygen saturation measure known as SoscO2
which may be a close estimate of the underlying SvO2. SoscO2 was calculatedusing three different frequency ranges, (1) respiratory oscillations only, (2) LFOsonly, and (3) both respiratory oscillations and LFOs. At each frequency rangeSoscO2 was calculated using either (1) the modified Beer-Lambert law (MBL) or(2) spatially resolved spectroscopy (SRS). In total six different measurements ofSoscO2 were investigated here. Experiments were performed in six adult ventilatedpatients with traumatic brain injury. The patients’ inspired oxygen fraction (FiO2)was raised in two hyperoxic phases. The calculated SoscO2 values were comparedwith other cerebral oxygenationmeasures including an intraparenchymal catheterbased brain tissue oxygen tension (PbrO2) and the NIR based tissue oxygenationindex (TOI). It was found that the SoscO2 calculated using the combined respira-tory and LFO frequency range and the SRS method resulted in the highestdetection rates of hyperoxic changes. Thismeasure of SoscO2may provide a viable,continuous, non invasive, bedside measure of cerebral venous oxygen saturation.
27.1 Introduction
Measurements of cerebral SvO2 using non-invasive NIRS have previously beendiscussed in the literature. The central idea is to identify changes in bloodvolume which can be attributed to the venous compartment and then to
1Department of Medical Physics and Bioengineering, University College London,London, UK.2Department of Neuroanaesthesia and Neurocritical Care, The National Hospital forNeurology and Neurosurgery, Queen Square, London, UK.
K.A. Kang et al. (eds.), Oxygen Transport to Tissue XXIX� Springer 2008
235

calculate SvO2 based on the relative proportion of�[HbO2] and �[HHb] withinthose changes. In adults and neonates, changes in venous blood volume can beinitiated through head tilting [1] or jugular vein occlusion [2,3]. They can also beassociated with respiration [4–6] which is one of the main focuses in this work.Respiration influences cardiovascular activities such as heart rate, strokevolume, arterial pressure, venous pressure and blood flow [7]. Strictly speaking,respiratory oscillations are associated with both arterial and venous bloodvolume changes. However, since the veins are much more compliant than thearteries [8], it is expected that these oscillations occur predominantly within thevenous compartment [6]. In this study, all patients were being ventilated usingintermittent positive pressure, in which, inspiration generally causes anincrease in intrathoracic pressure leading to a reduction of venous return andan increase in peripheral blood volume [5]. The patients’ ventilation rates werebetween 10 and 14 breaths/min (0.17 and 0.23 Hz).
Other types of oscillation often found in the cerebral haemodynamic signals(�[HbO2] and �[HHb]) in healthy humans occur at a frequency of around0.1 Hz and are termed either vasomotion-waves or spontaneous low frequencyoscillations [9–12]. In this paper, we have adopted the term low frequencyoscillations (LFOs). Similar oscillations can also be found in arterial bloodpressure and heart rate [13,14] and are known as Mayer-waves which aregenerally thought to be generated by baroreflex activity [15].
In this paper we describe a cerebral oxygen saturation measure which utilisesthese respiratory and low frequency oscillations.We have termed this saturation,SoscO2 with the subscript ‘‘osc’’ indicating the oscillatory basis of the signals. Theaim of this paper is to investigate whether SoscO2 can be used to measure cerebralSvO2. We compare our SoscO2 value with other cerebral oxygenation measuressuchTOI and PbrO2 during a hyperoxic study in six adult ventilated patients withtraumatic brain injury. TOI is a mixed arterial and venous oxygen saturationmeasurement that is also dependent on the arterial to venous volume ratio (whichin the brain is assumed to be 1:3). Another cerebral oxygenation measurement,which is invasive, and often used in the care of traumatic brain injury patients onthe intensive care unit, is PbrO2 which provides a local partial pressure of oxygenin the extra-cellular fluid of the brain tissue and reflects the availability of oxygenfor aerobicmetabolism.As suchPbrO2 can be thought of as reflecting the balancebetween oxygen delivery and consumption [16].
27.2 Methods
27.2.1 Experiments
The study was approved by the Joint Research Ethics Committee of theNational Hospital for Neurology and Neurosurgery and the Institute of
236 T.S. Leung et al.

Neurology.We studied six adult ventilated patients with traumatic brain injury.
AnNIRmonitor (NIRO300, Hamamatsu Photonics KK.) was used to measure
�[HbO2], �[HHb] and TOI in the less injured frontal lobe. PbrO2 was mea-
sured using a Licox PMO catheter inserted in the peri-contusional brain tissue.
Arterial oxygen saturation (SaO2) was measured using a pulse oximeter
(Novametrix) placed on the finger. During the study, FiO2 was increased so
that comparisons could be made between the baseline and two hyperoxic levels.
We investigated which of the cerebral oxygenation measures, namely SoscO2,
TOI and PbrO2, could detect an increase (1) from baseline to hyperoxic phase 1,
and (2) from hyperoxic phase 1 to 2. Baseline FiO2 was determined by the
minimum level required to produce an arterial partial pressure of oxygen (paO2)
larger than or equal to 13 kPa. After 30 minutes of baseline, FiO2 was increased
to 60% for 60 minutes (phase 1) and then 100% for 60 minutes (phase 2), before
being returned to baseline for a further 30 minutes. If baseline FiO2 was larger
than 60% then phase 1 was omitted.
27.2.2 Theory
An algorithm based on the Fourier transform of the data was used to estimate
SoscO2:
SoscO2 ¼
P
i
ffiffiffiffiffiffiffiffiffiffiffiffiffiffiffiffi
PHbO2i½ �
p
P
i
ffiffiffiffiffiffiffiffiffiffiffiffiffiffiffiffi
PHbO2i½ �
p
þP
i
ffiffiffiffiffiffiffiffiffiffiffiffiffiffiffi
PHHb i½ �p � 100% (27:1)
where PHbO2[i] and PHHb[i] are the power spectral densities (PSD) of the
�[HbO2] and �[HHb] signals, and the index i corresponds to different
frequency ranges. Three frequency ranges have been used here, (1) the LFO
range: from 0.018 to 0.1 Hz, (2) the ventilation/respiration range: a bandwidth
of 0.02Hz around the ventilation/respiration frequency (different in each
patient) and (3) the combined LFO and ventilation/respiration range: from
0.018 to 0.3 Hz.The NIR spectrometer used in this work (NIRO300) is able to make
measurements based on both the modified Beer Lambert law (MBL) and
spatially resolved spectroscopy (SRS) [17]. The SRS measurements
(i.e. k[HbO2] and k[HHb] where k is a constant accounting for scattering)
have previously been shown to be more sensitive to intracerebral changes
than those based on MBL [18]. Two versions of SoscO2 can thus be calculated,
using either theMBL (SoscO2MBL) or the SRS (SoscO2
SRS) in the three frequency
ranges previously mentioned. The SRS version of SoscO2 was calculated simply
27 Cerebral Tissue Oxygen Saturation 237

by using k[HbO2] and k[HHb] in calculating PHbO2[i] and PHHb[i] in equation(27.1). In total six versions of SoscO2 were calculated for each set of data.
27.2.3 Data Analysis
To implement equation (1), the �[HbO2]/�[HHb] (for MBL) or k[HbO2]/k[HHb] (for SRS) signals were first linearly detrended over 10 minutes. Theirpower spectral densities PHbO2[i] and PHHb[i] were then estimated using theWelch spectral estimation method with a 1024 point Fast Fourier Transform,50% overlap and a 1024 point Hanning windowing function. Subsequently,SoscO2 was calculated using Eq. (27.1). Each 10 minute block of data resultedin one value of SoscO2. Each calculation was then repeated on a block of datawith the same length but shifted along by 1 minute. Altogether ten SoscO2
measurements were calculated for each phase (baseline, hyperoxic phase 1and 2). For hyperoxic phases 1 and 2, the initial 20 minutes of data after theincrease of FiO2 were excluded to allow for stabilisation. The ten measure-ments from each patient were used to calculate the individual mean valuein each phase. One averaged value of PbrO2 and TOI was obtained per10-minute block for each parameter and 10 values (separated by 1 minute)were calculated for each phase.
27.3 Results
In the baseline phase, the mean value of FiO2 was measured at the mouth to be32�5% (range: 24 – 39%). In the first hyperoxic phase, FiO2 was raised and themean value wasmeasured as 58�1% (range: 56 – 59%). In the second hyperoxicphase, FiO2 was raised further and the mean value was measured as 96�3%(range: 90 – 98%).
In this study, we found consistently strong LFOs at around 0.02 Hz in the�[HbO2] and �[HHb] signals in all our patients with brain injury. The fre-quency was lower than those reported previously for healthy human subjects [9].
Using spectral analysis, we often found high peaks in the LFO frequencyrange in the �[HbO2] and �[HHb] amplitude spectra. The existence of a strong�[HHb] spectral peak is most interesting. It is expected that the LFOs in�[HbO2] and �[HHb] are both due to blood volume and possibly flow changesin the arterial and venous sites. Arterial blood is highly oxygenated at around98% which means that the amplitude of the �[HHb] LFOs should be very lowin the arterial site. The strong LFOs found in �[HHb] are therefore most likelyto arise from venous changes. Examples of the �[HbO2] and �[HHb] signalsand their amplitude spectra are shown in Fig. 27.1.
238 T.S. Leung et al.

The groupmean and standard deviation of SoscO2, TOI and PbrO2 for all the
patients were calculated from the individual means (Table 27.1). Table 27.2
shows the number of patients whose SoscO2, TOI and PbrO2 show statistically
significant increases (1) from baseline to hyperoxic phase 1, and (2) from
hyperoxic phases 1 to 2, based on the ten measurements in each phase. As
mentioned earlier, there are six versions of SoscO2 in total each being calculated
using the same method as described above.
27.4 Discussion
The mean values of the six versions of SoscO2 were between 55 and 71% in the
baseline phase. These values are comparable to SvO2 measured in a study in
which the mean of the jugular venous saturation of normoxic subjects (n=6)
was measured as 69% [19]. All patients were in a stable condition when the
studies were carried out and it is assumed that the cerebral metabolic rate of
oxygen (CMRO2) was constant during the experiment. In the first hyperoxic
phase, SaO2 was increased from 98 to 100% and the underlying SvO2 was also
expected to increase because of a stable metabolic rate. A small increase in
dissolved oxygen in the plasma should also increase the underlying SvO2. In the
0 100 200 300 400 500 600–2.5
–2
–1.5
–1
–0.5
0
0.5
1
Time (s)
μM
(a) Time series of Δ[HbO2] and Δ[HHb] signals
Δ[HbO2]
0 0.1 0.2 0.3 0.4 0.5 0.6 0.70
0.5
1
1.5
2
Frequency (Hz)
μM /
Hz
(b) Amplitude spectra of Δ[HbO2] and Δ[HHb] signals
Δ[HbO2]
Δ[HHb]
Δ[HHb]
Fig. 27.1 Time series and amplitude spectra of the �[HbO2] and �[HHb] signals.
27 Cerebral Tissue Oxygen Saturation 239

Table 27.1 Group means and standard deviations of SaO2, TOI and SoscO2 (6 versions) in the three phases of the hyperoxic experiments (n=6)
SaO2(%) TOI(%) SoscO2MBL(%) SoscO2
SRS(%)
LFOrange
Resp. range LFO &Resp.Range
LFOrange
Resp.range LFO &Resp.Range
Baseline 98�1 67�11 64�10 63�14 59�7 59�5% 58�7% 55�3%HyperoxicPhase 1 100�1 69�13 67�10 64�11 61�8 63�6% 59�7% 58�4%Hyperoxic Phase 2 100�1 71�15 67�7 65�11 61�5 63�5% 62�8% 60�4%LFO range: 0.018–0.1 HzResp. range: Respiratory frequency with a bandwidth of 0.02 HzLFO & Resp. range: 0.018–0.3 Hz
240
T.S.Leunget
al.

Table 27.2 Number of patients (detection rate %) showing statistically significant increases (t-test, p<0.05) over the previous phase (n=6)
PbrO2 TOI SoscO2MBL SoscO2
SRS
LFO range Resp range LFO & Resp.range LFO range Resp range LFO & Resp.range
From Baseline to
Hyperoxic Phase 1
6 (100%) 4 (67%) 6 (100%) 2 (33%) 5 (83%) 4 (67%) 2 (33%) 6 (100%)
From HyperoxicPhase 1 to 2
6 (100%) 5 (83%) 2 (33%) 1 (17%) 3 (50%) 2 (33%) 3 (50%) 5 (83%)
LFO range: 0.018–0.1 HzResp. range: Respiratory frequency with a bandwidth of 0.02 HzLFO & Resp. range: 0.018–0.3 Hz
27
Cereb
ralTissu
eOxygen
Saturatio
n241

second hyperoxic phase, FiO2 was raised further. Although SaO2 was fully
saturated at 100%, there should be a small increase in dissolved oxygen in the
plasma and hence an increase in the underlying SvO2. Therefore, any increase in
SoscO2 during hyperoxic phase 1 to 2 is likely to represent this increase in SvO2.Table 27.2 shows that PbrO2 increased in all patients during both hyperoxic
phases, indicating an increased oxygenation at the tissue level. It is interesting to
note however that other cerebral oxygenation measures such as TOI and SoscO2
do not always increase. As shown in Table 27.2, TOI increased from the base-
line to hyperoxic phase 1 in only 4 out of 6 patients. This could be due to the fact
that vasoconstriction occurred during hyperoxia which in turn lowered the
arterial to venous volume ratio. While the underlying SaO2 and SvO2 may
both slightly increase, the overall effect could be a lowered TOI. The same
mechanism could also explain the fact that TOI increases from hyperoxic phase
1 to 2 in only 5 out of 6 patients.The six versions of SoscO2 performed differently in the hyperoxic tests.
Despite previously being used in both adults and neonates [3,5], SoscO2 based
on the respiratory frequency range (both MBL and SRS versions) had low
detection rates in the two hyperoxic phases as shown in Table 27.2. In fact, not
all patients exhibit strong respiratory oscillations. In two patients, the spectral
peaks at the respiratory frequency were very weak (just above the noise floor) in
the �[HbO2]/�[HHb] (and k�[HbO2]/k[HHb]) PSDs.By comparison, SoscO2 based on the LFO frequency range has higher detec-
tion rates (both MBL and SRS versions) in the two hyperoxic phases. This
could be due to the fact that there are consistently higher spectral peaks in the
LFO range in the �[HbO2]/�[HHb] and k�[HbO2]/k[HHb] PSDs for all
the patients and all phases.Relatively high detection rates in the two hyperoxic phases were achieved by
SoscO2 based on the combined respiratory and LFO range. In particular, those
using SRS have the highest detection rates (100% for hyperoxic phase 1 and
83% for phase 2) compared with TOI and other versions of SoscO2. This may be
explained by the fact that SRS measurements have been shown to have a higher
sensitivity to intracerebral changes [18]. It is possible that SoscO2 is dominated
by the venous blood and is thus less susceptible to changes in the arterial to
venous volume ratio.In this preliminary analysis, we have taken the empirical approach that SoscO2
can be calculated using Eq. (27.1). The use of this equation however has not been
fully justified in this paper, especially for the LFOs. Previous studies [5–6] have
shown that this equation is only valid when the �[HbO2] and �[HHb] oscilla-
tions (both respiratory and LFO) are caused by blood volume change alone. As
shown in Fig. 27.1, the�[HbO2] and�[HHb] LFOs are sometimes out of phase,
suggesting that a blood flow change may also have occurred, violating this
assumption. However we found that the SoscO2 values obtained in our studies
consistently fall within the expected range of venous saturation values. We are
currently working on a theoretical model to explain the behaviour of the
242 T.S. Leung et al.

�[HbO2] and �[HHb] LFO signals which may in turn improve the calculationof SoscO2 as an estimate of the underlying SvO2.
Acknowledgment The authors would like to thankHamamatsu Photonics KK, theWellcomeTrust (Grant no. 075608), the UCL/UCLH trustees, Association of Anaesthetists of GreatBritain and Ireland and the EPSRC/MRC (Grant no. GR/N14248/01).
References
1. L. Skov, O. Pryds, G. Greisen, H. Lou, Estimation of cerebral venous saturation innewborn infants by near infrared spectroscopy, Pediatr Res 33(1), 52–55 (1993).
2. C. W. Yoxall, A. M. Weindling, The measurement of peripheral venous oxyhemoglobinsaturation in newborn infants by near infrared spectroscopy with venous occlusion,Pediatr Res 39, 1103–1106 (1996).
3. C. E. Elwell, S. J. Matcher, L. Tyszczuk, J. H. Meek, D. T. Delpy, Measurement ofcerebral venous saturation in adults using near infrared spectroscopy, Adv Exp Med Biol411, 453–460 (1997).
4. C. E. Elwell, H. Owen-Reece, J. S. Wyatt, M. Cope, E. O. R. Reynolds, D. T. Delpy,Influence of respiration and changes in expiratory pressure on cerebral hemoglobinconcentration measured by near-infrared spectroscopy, J Cereb Blood Flow Metab16(2), 353–357 (1996).
5. M. Wolf, G. Duc, M. Keel, P. Niederer, K. von Siebenthal, H-U. Bucher, Continuousnoninvasive measurement of cerebral arterial and venous oxygen saturation at the bed-side in mechanically ventilated neonates, Crit Care Med 25(9), 1579–1582 (1997).
6. M. A. Franceschini, D. A. Boas, A. Zourabian, S. G. Diamond, S. Nadgir, D. W. Lin,J. B. Moore, S. Fantini, Near-infrared spiroximetry: noninvasive measurements ofvenous saturation in piglets and human subjects, J Appl Phyiol 92, 372–384 (2002).
7. L. Nilsson, A. Johansson, S. Kalman, Macrocirculation is not the sole determinant ofrespiratory induced variations in the reflection mode photoplethysmographic signal,Physiol Meas 24, 925–937 (2003).
8. R. M. Berne, M. N. Levy, Cardiovascular Physiology (7th ed.), St. Louis, MO: MosbyYear Book (1997).
9. C. E. Elwell, R. Springett, E. Hillman, D. T. Delpy, Oscillations in cerebral haemody-namics – implications for functional activation studies, Adv Exp Med Bio 471, 57–65(1999).
10. H. Obrig, M. Neufang, R. Wenzel, M. Kohl, J. Steinbrink, K. Einhaupl, A. Villringer,Spontaneous low frequency oscillations of cerebral hemodynamics and metabolism inhuman adults, Neuroimage 12, 623–639 (2000).
11. I. Tachtsidis, C. E. Elwell, T. S. Leung, C.W. Lee,M. Smith, D. T.Delpy, Investigation ofcerebral haemodynamics by near infrared spectroscopy in young healthy volunteersreveals posture dependent spontaneous oscillations, Physiol Meas 25(2), 437–445 (2004).
12. T. Katura, N. Tanaka, A. Obata, H. Sato, A. Maki, Quantitative evaluation of interrela-tions between spontaneous low-frequency oscillations in cerebral hemodynamics andsystemic cardiovascular dynamics, Neuroimage, 31, 1592–1600 (2006).
13. A. C. Guyton, J. E. Hall, The textbook of medical physiology, 10th ed. W.B.SundersCompany, Philadelphia (2000).
14. K. Siebenthal, J. Beran, M. Wolf, M. Keel, V. Dietz, S. Kundu, H. U. Bucher, Cyclicalfluctuations in blood pressure, heart rate and cerebral blood volume in preterm infants,Brain Dev 21(8), 529–534 (1999).
15. H. Nilsson, C. Aalkjaer, Vasomotion: mechanisms and physiological importance, MolInterv 3(2), 79–89 (2003).
27 Cerebral Tissue Oxygen Saturation 243

16. J. Nortje, A. K. Gupta, The role of tissue oxygen monitoring in patients with acute braininjury, Brit J Anaesthesia 97(1), 95–106 (2006).
17. S. Suzuki, S. Takasaki, T. Ozaki, Y. Kobayashi, A Tissue Oxygenation Monitor usingNIR Spatially Resolved Spectroscopy, Proc SPIE 3597 582–592 (1999).
18. P. G. Al-Rawi, P. Smielewski, P. J. Kirkpatrick, Evaluation of a near-infrared spectro-meter (NIRO 300) for the detection of intracranial oxygenation changes in the adult head.Stroke 32(11), 2492–2500 (2001).
19. H.M.Watzman, C. D. Kurth, L. M.Montenegro, J. Rome, J. M. Steven, S. C. Nicolson,Arterial and venous contributions to near-infrared cerebral oximetry, Anesthesiology 93,947–953 (2000).
244 T.S. Leung et al.

Chapter 28
Biosensor for Diagnosing Factor V Leiden,
A Single Amino Acid Mutated
Abnormality of Factor V
Yongjie Ren, Samin Rezania, and Kyung A. Kang1
Abstract Factor V Leiden (FVL) is an abnormality with a single amino acidmutation of Factor V (FV) and is the most common, hereditary blood coagula-tion disorder. FVL is currently diagnosed by DNA analysis, which takes a longassay time, high cost, and a specially trained person. We are developing a rapid,accurate, and cost-effective biosensing system to quantify both FV and FVL inblood plasma, to diagnose FVL and also to evaluate the seriousness of the diseasestatus. This system is based on a sandwich immuno-reaction on an optical fiber.To produce the monoclonal antibody against only FV or only FVL withoutcross-reacting with the other molecule and with a higher probability, a 20 aminoacid sequence (20-mer) of FV or FVL around the mutation region was injectedinto mice and then hybridoma cell lines specific to each 20-mer were selected.When these antibodies were tested with native FV or FVL molecules, they werefound to be cross-reacting with the other molecules, but some with higher affinityto FV (FV preferred) and some to FVL (FVL preferred). Using these antibodies,two different sensors were developed: FV preferred and FVL preferred sensors.These two sensors allowed us to quantify FV and FVL in plasma with a max-imum error of 4%. The plasma levels of both molecules provide us not only FVL
diagnosis but also the level of the seriousness. The same principles may be usedfor developing diagnostic tools for other diseases with a single point mutation.
28.1 Introduction
Factor V (FV) is an essential factor of the blood coagulation cascade [1]. Itsmolecular weight is 330 kDa and it is composed of a heavy chain (MW=105 kDa)and a light chain (MW = 71�74 kDa). When the gene for the arginine at theposition 506 (R506Q) on the heavy chain of FV is mutated and replacedwith glutamine, FV loses the cleavage site for activated protein C (APC;
1Yongjie Ren, Samin Rezania and Kyung A. Kang, Department of Chemical Engineering,University of Louisville, Louisville, KY 40292, USA.
K.A. Kang et al. (eds.), Oxygen Transport to Tissue XXIX� Springer 2008
245

anticoagulant) [2]. This mutation (i.e., factor V Leiden; FVL) prevents APC fromthe efficient inactivation of FV and facilitates overproduction of thrombin, leadingto excess fibrin generation and blood clotting [3].
FVL is the most common hereditary blood coagulation disorder in theUnited States. It is present in 5% of the Caucasian population and 1.2% ofthe African American population [7]. FVL increases the risk of venous throm-bosis 3–8 folds for the heterozygous and 30–140 folds for the homozygousindividuals [7]. Currently, the FVL diagnosis is made by DNA analysis or bythe clotting test that measures the degree of prolongation of plasma clottingtime after the addition of APC [3]. DNA analysis is, however, expensive andtime-consuming, and the clotting test is not specific only for FVL.
The fiber optic biosensing system is a rapid, accurate, and cost-efficientmethod to detect the level of the specific protein in plasma [4, 9, 10, 11]. Thismethod performs a sandwich assay on the surface of an optical fiber.
Here, a fiber optic biosensing system for FVL diagnosis is presented.
28.2 Materials, Instruments and Methods
28.2.1 Materials and Instruments
For biosensing: The fluorometer (Analyte 2000) and the quartz fibers used forsensors were from Research International (Monroe, WA). Factor V and amonoclonal antibody against FV light chainwere purchased fromHaematologicTech. (Essex Junction, VT) and another monoclonal antibody against FV lightchain was from Fitzgerald (Concord, MA). The homozygous patient plasmawas obtained from a FVL homozygous patient, following approval by theUniversity of Louisville Institutional Review Board (IRB). Alexa Fluor1 647(AF647) was purchased from Invitrogen (Carlsbad, CA). ImmunoProbeTM
Biotinylation Kits, avidin, hydrofluoric acid, phosphate buffered saline(PBS), triethylamin, �-maleimideobutyric acid N-hydroxysuccinimide ester,(3-mercaptopropyl) – trimethoxysilane were from Sigma-Aldrich (St. Louis,MO). FV free plasma was from American Diagnosica Inc. (Stamford, CT).
For enzyme linked immunoassay (ELISA): Bovine Serum Albumin (BSA)and o-phenylenediamine dihydrochloride (OPD) tablet were from Sigma-Aldrich. Fc specific, horseradish peroxidase-conjugated rabbit anti-mouseIgG was from Jackson ImmunoResearch Laboratories, Inc. (West Grove,PA). The ELISA plate reader was from Bio-Rad (Hercules, CA).
28.2.2 Methods
For biosensing by fiber optic sensing system:All sensors were prepared followingthe protocol established by previous researchers [4, 9, 10, 11]. Briefly, theantibody against FV or FVL (18MAb) that we have developed using 20-mers
246 Y. Ren et al.

was immobilized on the fiber surface by the avidin-biotin linkage and then thefiber is enclosed in a sensing chamber. When a sample is injected into thechamber, the FV/FVL molecule in the sample is captured by the 18MAb.After washing the fiber surface to remove unbound bio-molecules, the antibodyagainst FV light chain (28MAb) conjugated with AF647 is applied to thesensing chamber. After the sandwich complex is formed, the excitation light isapplied to the sensor and the emitted fluorescence is measured by a fluorometer.The fluorescence intensity is correlated with the amount of FV/FVL in thesample. Regarding the sample and 28MAb incubation time, for testing affinityof the generated antibodies, 10 and 10 minutes (10/10 min.) were used. Forsensing analytes, 3 and 2 minutes (3/2 min.) were used.
For ELISA: To test the affinity of the antibodies generated, ELISA wasperformed as follows: 96 wells of an ELISA plate (Dow corning, NY) werecoated with 100 ml of FV in plasma (2 mg-FV/ml-FV free plasma) or 100 ml ofhomozygous FVL plasma (2 mg/ml). First, the well surface was blocked with250 ml, 1% BSA each well for 90 minutes at room temperature, then 100 ml ofanti-FV antibodies (1 mg/ml) was applied on the first column wells and the½ serial dilution was performed. After incubation at 378C for 90 minutes,100 ml of 1:1000 Fc specific, HRP conjugated rabbit anti-mouse IgG was appliedfor 20 minutes at 378C. After washing the plate and adding 100 ml of OPDsolution to eachwell, the platewas incubated at room temperature for 30minutes,and then the optical density was measured at 450 nm by the ELISA reader.
28.3 Results and Discussion
28.3.1 Production of 18MAb Against FV and FVL
Currently, neither pure FVL molecule nor the antibody against FVL withoutcross-reacting with FV is available. Generating antibodies specifically against asingle point mutation site of a molecule is extremely difficult. To increase theprobability for generating antibodies specifically against the mutation site, the20 amino acid sequences (20-mer) of FV or FVL around the mutation site weregenerated (Fig. 28.1) [8]. The 20-mers were then conjugated with a carrierprotein, the conjugated molecules were injected into mice, and the hybridomacell lines were generated [9, 12]. The resulting antibodies were first screened withthe 20-mers and those with high affinity to FVL molecules without cross-reacting with FV were selected, and vice versa.
FV 20-mer: H-I-C-K-S-R-S-L-D-R-R-G-I-Q-R-A-A-D-I-E-Q-NH2 FVL 20-mer: H-I-C-K-S-R-S-L-D-R-Q-G-I-Q-R-A-A-D-I-E-Q-NH2
Fig. 28.1 The amino acid sequence of 20-mers for FVandFVL (themutation sites are in bold).
28 Biosensor for Diagnosing Factor V Leiden 247

The screened monoclonal antibodies were then tested with native FV mole-cules and homozygous FVL plasma by ELISA [Fig. 28.2(a)]. They were foundto have some cross-reactivity with the other molecule. However, some hadhigher affinity with FV and some with FVL. The affinities of these antibodieswere also tested as the 18MAb for the sensing system, and a commercial anti-body against the FV light chain was used as the 28MAb. For the biosensor, theexperiments was performed for the sample 5 mg FV/FVL in 1 ml plasma and thesensor also showed the cross-reactivity [Fig. 28.2(b)]. Interestingly, the anti-body 5G3 had a higher affinity for FV in ELISA but it shows the highest relativeaffinity for FVL (FVL: FV = 2.17). The antibody 1D4 shows the highestrelative affinity for FV (FV: FVL = 2.55), consistent with the ELISA result.Therefore, the antibody 5G3 and 1D4 are selected to be 18MAbs for the FVLand the FV preferred sensors, respectively.
28.3.2 Sensing Performance of the FV and FVL Preferred Sensors
Heterozygous patients have both FV and FVL molecules in their blood.Quantifying both FV and FVL in their plasma provides information on thedegree of the abnormality. First, the FV and the FVL preferred sensors weretested for their behaviors for FV or FVL, separately in the sample, with thephysiological range of 0�15 mg/ml-plasma (Fig. 28.3). For both FV preferredand FVL preferred sensors, the relationships between the analyte concentrationand the signal intensity were linear. For the FV preferred sensor, the slope of thestandard curve for FV was 9.3, which is higher than the slope of FVL 6.8, asexpected [Fig. 28.3(a)]. For the FVL preferred sensor, the slopes were 8.6 forFVL and 5.4 for FV [Fig. 28.3(b)].
Next, the response of these sensors was studied for a mixture with both FVand FVL molecules. The FV preferred sensor was tested for a sample with bothFV and FVL but at a constant FVL concentration (8 mg/ml) [Fig. 28.4(a)]. The
0
0.1
0.2
0.3
0.4
0.5
0.6
0.7
0.8
5G3 4E2 8B12 3C8 1C8 1D4 5G3 4E2 8B12 3C8 1C8 1D4
Affi
nity
(O
.D. a
t 450
nm
)
Native FV
FVL plasma
0
50
100
150
200
250
Sig
nal I
nten
sity
(pA
) Native FV
FVL plasma
(b)(a)
Fig. 28.2 Relative affinity values (in O.D.) of six selected antibodies against FV ( ) and FVL( ) (a) by ELISA and (b) a biosensor. [Experiment conditions: 10 cm sensors, 10/10 min.sample/28MAb incubation times, 1.2 cm/s circulation flow velocity during incubation].
248 Y. Ren et al.

signal intensity of the mixture was linear with the change in the FV concentra-
tion, with the slope of 8.9, which is 96% of that for FV only (9.3) [Fig. 28.3(a)].
The signal intensity of the y intercept was 54.4, the same for 8 mg/ml of FVL
only. In other words, the signal intensity of the mixture was found to be the
addition of the signal intensities by FV and by FVL, showing that FVL
molecules in a sample do not affect the affinity of FV for the FV preferred
sensor. Figure 28.4(b) confirms that FV molecules in the sample do not affect
the affinity of FVL in FVL preferred sensor, either. In summary, the FV and the
FVL molecules in a sample contribute to the sensor signal intensity indepen-
dently, without interfering with each other.
y = 9.3x
y = 6.8x
0
40
80
120
0 5 10 15Concentration (µg/ml)
FVLFV
y = 5.4x
y = 8.6x
FVLFV
(a)
0 5 10 15Concentration (µg/ml)
(b)
Sig
nal I
nten
sity
(pA
)
0
40
80
120
Sig
nal I
nten
sity
(pA
)Fig. 28.3 Standard curves for FV andFVLby (a) FVpreferred and (b) FVLpreferred sensors.[Experiment conditions: 3 cm sensors, 3/2 min. sample/28MAb incubation times, 1.2 cm/scirculation flow velocity during incubation].
y = 9.3x
y = 8.9x + 54.4
020406080
100120140160180200
0 5 10 15
FV Concentration (µg/ml)
0 5 10 15
FVL Concentration (µg/ml)
MixtureFV only
FVL (8 µg/ml) only
y = 8.6x
y = 8.4x + 43.2
MixtureFVL onlyFV (8 µg/ml) only
(a) (b)
Sig
nal I
nten
sity
(pA
)
020406080
100120140160180200
Sig
nal I
nten
sity
(pA
)
Fig. 28.4 Signal intensities of (a) the FV preferred sensor with the change in FV concentra-tion in the sample when 8 mg/ml of FVL is added in the sample and (b) the FVL preferredsensor with the change in FVL concentration when 8 mg/ml of FV is added in the sample.[Experiment conditions: 3 cm sensors, 3/2 min. sample/28MAb incubation times, 1.2 cm/scirculation flow velocity during incubation].
28 Biosensor for Diagnosing Factor V Leiden 249

28.3.3 Quantification of FV and FVL in Blood Plasma Sample
Since our sensors may not detect FV and FVL molecules exclusively, a mathe-matical manipulation is needed for the quantification of these two molecules in asample. The relationship between the two sensor signal intensities and the con-centrations of FV and FVL molecules in a sample can be expressed as follows:
SI1 ¼ A1CFV þ B1CFVL (28:1)
SI2 ¼ A2CFV þ B2CFVL (28:2)
where, SI is the signal intensity (pA) generated by a sensor; A is the slope ofthe standard curve for FV, in pA/(mg/ml); B is the slope of the standard curvefor FVL, in pA/(mg/ml); C is the concentrations of FV or FVL in the sample, inmg/ml; Subscripts 1 and 2 represent FV preferred and FVL preferred sensor,respectively. The concentrations of FV (CCFV) and FVL (CCFVL) can be, there-fore, expressed as Eq. 28.3 and Eq. 28.4, respectively.
CFV ¼SI2B2� SI1
B1
A2B2� A1
B1
(28:3)
CFVL ¼SI2A2� SI1
A1
B2A2� B1A1
(28:4)
The sensing system is composed of one FV preferred sensor and one FVLpreferred sensor. A summary of the assay for FV and FVL is shown in Fig. 28.5:
Obtain standard curves for FV andFVL using FV preferred and FVLpreferred sensors (Figure. 28.3)
Obtain values A1, A2, B1, B2 andstore them in the data analyzing
program, for later use
Apply the sample with unknown amounts of FVand FVL to the sensing system
Calculate CFV, CFVL by Eqs. 28.3 and 28.4 using thesignals (SI1, SI2) and stored values (A1, A2, B1, B2)
Obtain the signals, SI1 and SI2 from the FV andthe FVL preferred sensors
Fig. 28.5 A schematic diagram describing the procedure for obtaining the amount of FV andFVL in a sample, using our sensing system. The part within a dashed line is the actual protocolfor an assay.
250 Y. Ren et al.

First, the parameters need to be obtained from the standard curves of the samplesof FV or FVL, and stored in the system; then the actual assay for an unknownsample will be performed as described in the block framed by a dashed line. Thetotal assay time is about 8 minutes.
As an example, a mixture of 5 mg of FV and 6 mg of FVL in 1 ml plasma wastested by our sensing system (Table 28.1). As can be seen from the table, the FVand FVL in the sample were quantified with a relative error less than 5%.
28.4 Conclusions
The amino acid sequences of FV and FVL are different by only one amino acid.In order to increase probability for generating antibodies specific only to FV oronly toFVL, 20-mers around themutation site for eachmoleculewere used in thehybridoma cell generation. Two antibodies with a higher affinity to FV and toFVL were selected as 18MAb for the FV and the FVL preferred sensors, respec-tively. For a sample containing both FV and FVL, the total signal intensity wasfound to be the addition of the signals by FV and by FVL. The signals from thesetwo sensors were used to quantify FV and FVL in a plasma sample accuratelywith an error of only 4%. Also, an entire assay can be completed within 10minutes. This system is a rapid and cost-effective tool for FVL diagnosis.
The system can also be used for the diagnosis of factor V deficiency. Thesame principles may be applied for developing diagnostic tools for other dis-eases with a single point mutation.
Acknowldgment The authors thank theNational Institutes ofHealth (5R21EB003485-02) forthe financial support, and Dr. Sharma at the Hematology and Oncology Department of theUniversity of Louisville for obtaining the plasma from a FVL homozygous patient.
Table 28.1 An example of the quantification of FV and FVL in a sample. (a) the parametersof the FV/FVL sensing system and (b) the sensing result of an example
(a)
A [pA/(mg/ml)] B [pA/(mg/ml)]
SI (pA) frommeasurement#1
SI (pA) frommeasurement#2
FV preferred sensor 9.3 8.6 89.5 79.5
FVL preferredsensor
6.8 5.4 83.0 69.5
(b)
Actual
concentration(mg/ml)
Calculated
concentration(mg/ml)
Relative error
(%)
FV 5 4.8�0.1 –4
FVL 6 5.8�1.1 –3
28 Biosensor for Diagnosing Factor V Leiden 251

References
1. R. W. Colman, et al., Hemostasis and Thrombosis: Basic Principles and Clinical Practice,J.B. Lippincott Company, Philadelphia, 3rd edition, 113–120 (1993).
2. R. M. Bertina, B. P. Koeleman, T. Koster, F. R. Rosendaal, R. J. Dirven, H. de Ronde,P. A. van der Velden, and P. H. Reitsma, Mutation in blood coagulation factor Vassociated with resistance to activated protein C. Nature, 369, 64–67 (1994).
3. A. Tripodi, B. Negri, R. M. Bertina, and P. M. Mannucci, Screening for the FV: Q506mutation–evaluation of thirteen plasma-based methods for their diagnostic efficacy incomparison with DNA analysis, Thromb Haemost, 77(3), 436–439 (1997).
4. J. O. Spiker, K. A. Kang, W. N. Drohan, and D. F. Bruley, Preliminary study ofbiosensor optimization for the detection of protein C, Adv. Exp. Med. Biol., 454,681–688 (1998).
5. H. J. Kwon, H. I. Balcer, and K. A. Kang, Protein C biosensor sensitivity for biologicalsamples and sensor reusability, Comp. Biochem. Physiol., Part A, 132, 231–238 (2002).
6. L. Tang, and K. A. Kang, Preliminary study of simultaneous multi-anticoagulant defi-ciency diagnosis by a fiber optic multi-analyte biosensor, Adv. Exp. Med Biol., 566,303–309 (2005).
7. J. C. Mattson, D. Crisan, Inherited thrombophilia due to factor V Leiden mutation.Mol.Design, 3, 55–61 (1998).
8. R. J. Jenny, et al., Complete cDNA and derived amino acid sequence of human factor V,Proc. Natl. Acad. Sci. Biochemistry, 84, 4846–4850 (1987).
9. H. J. Kwon, Theoretical and experimental investigation on sensing performance of proteinC immuno-optical sensor for physiological samples. Dissertation. Chemical Engineering,University of Louisville, Louisville, KY (2002).
10. L. Tang. Multi-analyte, fiber-optic immuno-biosensing system for rapid disease diagnosis:model systems for anticoagulants and cardiac markers. Dissertation. Chemical Engineer-ing, University of Louisville, Louisville, KY (2005).
11. B. Hong, K. A. Kang, Biocompatible, Nano-gold-particle fluorescence enhancer forfluorophore mediated, optical immunosensor, Biosensor and Bioelectronics, 21(7),1333–1338 (2006).
12. H. J. Kwon, S. C. Peiper, and K. A. Kang, Fiber optic immunosensors for cardiovasculardisease diagnosis: quantification of protein C, Factor V Leiden, and cardiac Troponin Tin plasma, Adv. Exp. Med Biol., 510, 115–119 (2003).
252 Y. Ren et al.

Chapter 29
Scanning Laser Ophthalmoscope-particle
Tracking Method to Assess Blood Velocity
During Hypoxia and Hyperoxia
Kristen Lorentz, Astrid Zayas-Santiago, Shanti Tummala,
and Jennifer J. Kang Derwent1
Abstract The main objective was to evaluate a Scanning Laser Ophthalmoscope(SLO) based particle tracking method as a means of quantitative assessment ofretinal blood velocity and vessel diameter changes in response to hypoxia andhyperoxia. Retinal blood velocities were measured by tracking fluorescentmicrospheres (1.0 mm diameter) in anesthetized adult pigmented rats. Velocitieswere calculated based onmicrosphere position changes and the recording framerate. Hypoxia was induced by inspiring a mixture of nitrogen and air andhyperoxia was induced by inspiring 100% oxygen. Average blood velocitiesduring hypoxia obtained for arteries, veins, and small vessels (diameter< 40 mm)were 39.9 � 9.9, 34.9 � 2.7, and 8.8 � 1.8 mm/sec, respectively, whereas duringhyperoxia, the average blood velocities obtained were 23.7� 6.2, 28.2� 2.7, and7.6 � 0.7 mm/sec. Hypoxia was found to increase the diameters of arteries by25% but did not change the diameters of veins; whereas, hyperoxia was found todecrease their diameters by 25% and 18%. Changes detected in vessel diameterand blood velocity suggest that the level of oxygen tension alters retinal hemo-dynamics. Dynamics of retinal hemodynamics in response to hypoxia andhyperoxia can be assessed using the SLO imaging method.
29.1 Introduction
Many ailments of the eye, including macular degeneration and retinopathy, arerelated to aberrant blood flow within the ocular vasculature [1–4]. The devel-opment of an effective non-invasive technique to measure circulation in vivo inthe eye would have a profound impact on assessments of pathophysiology ofthe ocular circulation, of pathologic vulnerability and of pharmacologicaltreatments of the eye. A direct visualization of retinal vasculature and blood
1Kristen Lorentz, Astrid Zayas-Santiago, Shanti Tummala, and Jennifer J. Kang Derwent,Department of Biomedical Engineering, Illinois Institute of Technology, Chicago, IL 60616.
K.A. Kang et al. (eds.), Oxygen Transport to Tissue XXIX� Springer 2008
253

flow makes the eye an ideal system, but measurement through thin retina(�250 mm) and coupled with limited noninvasive tools has made assessmentof retinal hemodynamics difficult.
Use of a scanning laser ophthalmoscope (SLO) as a noninvasive tool to trackparticulate flow in the eye is a promising potential technique to assess retinalhemodynamics [5–9]. Direct observation of particulate flow in vivo is possiblewith an SLO because it allows visibility of fluorescently-labeled cells and otherfluorescent particles introduced into the system. Particle dynamics can betracked and velocities can be calculated. An advantage of this method is thatit is non-invasive and it allows to track particles from various different sizevessels and retinal regions. The main objective of this study was to test thesensitivity of the SLO imaging technique in detecting changes in blood velocityand vessel diameter resulting from induced hypoxia and hyperoxia.
29.2 Materials and Methods
29.2.1 Experimental Procedure
Five male pigmented Long Evans rats weighing approximately 300–400 g wereused in this study. The animals were treated in accordance with the ARVOStatement on the Use of Animals in Ophthalmic and Vision Research. Initialanesthesia was induced with isoflurane and long-term anesthesia was main-tained with urethane (800 mg/kg loading dose; 75 mg/kg h maintenance dose).The femoral vein was cannulated with polyethylene tubing (PE-50) for deliveryof fluorescent microspheres and maintenance doses of urethane. The femoralartery was also cannulated with PE-50 tubing to allow periodic measurement ofarterial blood gas parameters. The animal was paralyzed with pancuroniumbromide (Pavulon; 0.3mg/kg loading dose; 0.2 mg/kg h maintenance dose) andartificially ventilated. Pupils were dilated with a drop of 2.5% phenylephrinehydrochloride and 1% atropine sulfate and a topical anesthetic 0.5% propar-acaine hydrochloride was applied to the eye. Artificial tears were periodicallyapplied tomaintain moisture of the eye. A zero-diopter clear silicon contact wasplaced on the eye prior to image acquisition.
The commercially availableHeidelbergRetinaAngiogram (HRA,HeidelbergEngineering, Vista, CA) was used to acquire images of retinal vessels of the eye.Depth discrimination was achieved by scanning the inside of the eye with eitheran argon ion (488 nmwavelength) or infrared diode (795 nmwavelength) laser incombination with highly selective filters. Heidelberg Eye Explorer (HEE) soft-ware automatically digitized live recordings into either 256� 256-pixel or 512�512-pixel images as well as video. A video frame rate of 20.5 per second was usedto record particle-tracking movies, typically in a field view of 308.
254 K. Lorentz et al.

Yellow-green 1-mm-diameter polystyrene micropsheres (505 nm maximum
absorption and 515 nm maximum emission, Molecular Probes, Eugene, OR)
were injected intravenously (0.02–0.06 ml/kg) as tracer particles to measure
velocity. Retinal blood velocities were obtained in arteries, veins, and small
vessels. ‘‘Small vessel’’ is representative of any vessel with a diameter less than 40
mm. Directional flow of fluorescent microspheres and vessel characterization
were determined based on examination of infrared reflectance (IR) and fluor-
escein angiogram (FA) images of the microsphere paths. IR and FA images
were taken before and after each alteration of O2 gas level in the inspiration
mixture and a microsphere FA video was acquired for 2–5 minutes during each
altered state. At the end of the experiment, a fluorescein injection (0.1 ml/kg)
was intravenously administered to obtain the retinal vascular map.The inspired gas mixture was altered by adding N2 to air to give 10% oxygen
(hypoxia) and by administering 100% O2 (hyperoxia). Approximately five
minutes after the onset of an episode, an arterial blood gas sample was taken
to confirm either hypoxia or hyperoxia. Microsphere FA movies were acquired
approximately ten minutes after the onset of each episode. The animal was
given sufficient time to recover from each episode before altering the oxygen
level to induce a different oxidative state.
29.2.2 Data Analysis
Vessel diameter measurements were obtained from IR images using the HEE
software. Blood velocity measurements were obtained by exporting FA movie
frames with traceable microspheres into a custom written MATLAB1 pro-
gram. Velocities were calculated by multiplying the distance (millimeters) tra-
versed by the microspheres and the acquisition frame rate (20.5 per second) to
obtain instantaneous velocity (millimeters per second). All flows were assumed
to be planar, a reasonable assumption given that the SLO only acquires images
from a thin region at any given time. Accordingly, as particles exited the plane
of focus, they became blurry and disappeared from view [10]. A distance scale
was determined by using the width of the image acquisition frame (in milli-
meters, measured via the HEE software) and the number of pixels. The distance
traveled by a particle was converted from a pixel length to a length in milli-
meters using this scale. Overlaying several consecutive FA microsphere images
on an angiogram image allowed assignment of velocity values to particular
vessel types. Because distinguishing between small arterioles and post-arteriolar
capillaries was somewhat subjective, these vessels were both characterized as
‘‘small vessels’’. Likewise, small venules and pre-venule capillaries were also
characterized as ‘‘small vessels’’. Artery and vein measurements were taken
from the central branches, which radiate symmetrically outwards from the
29 Scanning Laser Ophthalmoscope-particle Tracking Method 255

optic disk. Generally 6–9 arteries and 5–8 veins comprised the outward-extend-ing vessel ‘‘spokes’’ of the rat retina.
29.3 Results
29.3.1 Normoxia
The purpose of this experiment was to determine the feasibility of SLO particle-tracking as an investigative tool to detect small changes in ocular blood flow.Different oxidative states were used to measure the degree of changes in retinalblood velocity with this proposed method. The area of interest was identifiedwith IR images, and then control microsphere FA movies were obtained.Immediately after the injection of microspheres, circulation of particles wasextremely pronounced. However, after several minutes of recirculation thepopulation notably decreased, making it easier to track individual particles.Groups of multiple spheres circulating together were not uncommon, especiallywithin the larger vessels. Once the travel sequence images were identified, eachframe was individually exported to MATLAB1 and distance traveled wasmeasured. Approximately ten measurements were taken in each vessel typeduring normoxia to represent an average blood velocity, and measurementswere restricted to a 7.7�7.7 mm2 area superior to the optic disk in order to limitregional velocity variation.
Diameters of blood vessels were measured from IR images with the HEEsoftware. Mean vessel diameter measurements are displayed in Table 29.1.Three diameter measurements were taken along the vessel length and averagedto represent the mean diameter of that particular vessel. Diameters of smallvessels were too small to be measured accurately using the HEE software.
29.3.2 Hypoxia
The level of hypoxia was confirmed by an arterial blood sample taken 5 minutesafter the onset of 10% hypoxia and the average PaO2 was 32.7 � 5.2 mm Hg.The effects of 10%hypoxia on blood vessel diameters are readily observed in IRimages. As shown in Table 29.1, hypoxia resulted in a statistically significant
Table 29.1 Mean blood vessel diameters measured during normoxia, hyoxia and hyperoxia
Vessel Type
Blood Vessel Diameter (mm) (mean � SD)
Normoxia (n=5 rats) Hypoxia (n=3 rats) Hyperoxia (n=5 rats)
Artery 0.08 � 0.01 0.10 � 0.01 0.06 � 0.01
Vein 0.11 � 0.01 0.11 � 0.01 0.09 � 0.01
256 K. Lorentz et al.

increase of approximately 25% in arterial diameters (P <0.05, n=3; paired
t test), whereas the changes in venous diameter were small or almost none.After the onset of hypoxia, blood velocities in each vessel also exhibited
an increasing trend. Figure 29.1A shows average velocities (approximately
10 measurements for each animal) obtained ten minutes after the onset ofhypoxia from arteries, veins, and small vessels of three rats. On average, arterial
velocities during hypoxia increased by 19% (P = 0.038; paired t test), whilevenous and small vessel velocities increased by 14% and 15%, respectively (P=
0.033 and P=0.037; paired t test).
29.3.3 Hyperoxia
The average PaO2 measured during hyperoxia was 349 � 146 mm Hg (n=5
rats). Due to an inadequate arterial blood sample, a pulseoximeter was used tomonitor the blood oxygen in one of the animals. In contrast to hypoxic effects,
after 10 minutes into the onset of hyperoixa, pronounced constriction of theretinal artery is visible. Overall, hyperoxia resulted in statistically significant
vessel constriction of approximately 25% in arteries and 18% in veins (P<0.05and P<0.05, n=5 respectively; paired t test) (Table 29.1).
Similar to the normoxia and hypoxia procedures, approximately ten velo-
city measurements were made in each animal during hyperoxia. Overall,hyperoxia decreased blood velocity (Fig. 29.1B). On average, the arteries
decreased by 17% (P = 0.046; paired t test) and the veins and small vessels
decreased by 18% and 16%, respectively (P = 0.001 and P = 0.015). Duringextreme cases of hyperoxia (PaO2 greater than 430 mm Hg), visibility of
microspheres in arteries and small vessels severely decreased, almost to thepoint of total disappearance.
Blo
od V
eloc
ity (
mm
/sec
)
Blo
od V
eloc
ity (
mm
/sec
)
0
10
20
30
40
50
60NormoxiaHypoxia
Artery Vein Small Vessel Artery Vein Small Vessel0
10
20
30
40
50
60NormoxiaHyperoxia
A B
Fig. 29.1 A:Average bloodvelocity changes obtained fromartery, vein, and small vessels duringnormoxia (black bars) and hypoxia (graybars). B:Average blood velocity changes obtained fromartery, vein, and small vessels during normoxia (black bars) and hyperoxia (gray bars).
29 Scanning Laser Ophthalmoscope-particle Tracking Method 257

29.4 Discussion
29.4.1 Normoxia
The major objective of this study was to evaluate the SLO particle-tracking
method by measuring the response of retinal blood velocity to changes in
arterial PO2 in the retinal circulation. Microspheres were chosen as the
tracer instead of fluorescently labeled cells for several reasons in this study.
Microspheres are readily available, bright, uniform tracer particles, whereas
fluorescent blood cells involve time-consuming labeling procedures and exhibit
less bright and less-uniform fluorescence. Also, while systemically circulating
microspheres are biologically inert and pose minimal toxicity hazards [10],
excessive fluorescent cell-labeling can lead to adverse effects on biological
functions and behaviors of some cells [11]. One of the main concerns about
using microspheres is that they are different from red blood cells with regard to
their rigidity, size, and shape [9].In order to address the validity of microspheres as tracers, we compared our
results to previously reported blood velocity measurements obtained from
either laser Doppler velocimetry or SLO systems (Table 29.2). With our
method, we obtained an average velocity of 30.5 � 4.4 mm/sec in arteries with
a mean diameter of 80 � 10 mm. This average arterial velocity is similar to
values obtainedwith the laser Doppler velocimetry in humans [2,12] as well as in
cats [13]. For veins with a mean diameter of 110 � 10 mm, we obtained an
average velocity of 34.2 � 6.3 mm/sec. This value is somewhat higher than
Grunwald et al [2]. but similar to that of Williamson and Baxter[ 12]. Our
central artery and vein velocities are higher than Wajer et al [9]. who used
FITC-labeled red blood cells and an SLO to measure the velocities. This
difference may be due to the smaller blood vessel size that velocities were
Table 29.2 Comparison of blood velocity measurements
Authors Method
Arteries Veins Capillaries
Velocity(mm/sec)
Diameter(mm)
Velocity(mm/sec)
Diameter(mm)
Velocity(mm/sec)
Grunwaldet al. [2]
BidirectionalLaserDoppler
29� 9 108� 12 17� 4 152� 14 N/A
Williamson&Baxter [12]
Color LaserDoppler
31–102 Central 38–58 Central N/A
Wajer et al. [9] RBCs/SLO 15.5� 0.5 46.7 14.5� 3.9 55.6 4.8� 1.7
Nagaoka
et al. [13]
BidirectionalLaserDoppler
33.7� 2.5 84� 3 N/A N/A N/A
This study Microspheres/SLO
30.5� 4.4 80� 10 34.2� 6.3 110� 10 9.0� 1.3
258 K. Lorentz et al.

measured from in theWajer et al [9]. study (artery diameter of 46.7 mm and veindiameter of 55.6 mm). When we compared our ‘‘small vessel’’ (diameter < 40mm) velocity to Wajer et al. (2000), our mean velocity of 9.0 � 1.3 mm/sec fellbetween the arteriole/venule and capillary velocities reported byWajer et al [9].A further study is planned to investigate the similarity and difference of tracers.
Onemajor difference between our work and previous studies is that a differentSLO unit was used tomake themeasurements. Previous works have usedRoden-stock SLOs andmicroscopes with video capability attachments [7–10,14,15]. TheRodenstock SLO system has a different field of view (408) and uses NTSC videooutput. One advantage ofRodenstock SLO over ourHRASLO is a higher framerate, thus allowing for more frames to be used in the analysis. However, agree-ment of our data with the previous work suggests that it is reasonable to use theHRA SLO to record measurements of blood velocity and vessel diameter. Nomodification of HRA SLO was done to image rat retina vasculature and toobtain microsphere movies, making it a potential clinical tool. The digital ima-ging of our HRA is an advantage in that it will remove an additional step ofconverting video output to digital format in the data analysis. Our data alsosuggest that microspheres are a reasonable tracer to use for assessment of retinalhemodynamics. Given the positive aspects of SLO particle-tracking method, webelieve that this technique can be adopted for a clinical use.
Based on mean vessel diameter and blood velocity, it is also possible tocalculate volumetric blood flow rate. For an artery with a diameter of 80 mmand blood velocity of 30.5 mm/sec, the flow rate is 9.2 mL/min along the vessel.For a vein diameter of 110 mm and velocity of 34.2 mm/sec, the flow rate is19.5 mL/min in this study.
29.4.2 Hypoxia and Hyperoxia
Altering O2 inspiration had measurable effects on retinal blood vessel diameterand blood velocity. Hypoxia increased both vessel diameter and blood velocityin our experiment. This is consistent with previous work in hypoxia [16,17]. Adecrease in blood oxygen leads to vasodilation and increased blood flow tomaintain oxygen supply to the retinal cells. Various factors such as nitricoxide, adenosine, and prostanoids have been implicated in the control ofblood flow [18–20]. Our measurement method is sensitive enough to detect thechanges under hypoxia, and further studies are planned to investigate whetherintercellular molecules, such as nitric oxide, play a role in controlling retinalblood flow. In response to hyperoxia, both vessel diameter and blood velocitydecreased in our experiments. In contrast to hypoxia, as PO2 increases duringhyperoxia, retinal vessels constrict thus reducing retinal blood flow.Our data arein agreement with previous studies of hyperoxia [21–23].
To our knowledge, this is the first paper to demonstrate the changes in bloodvelocity and vessel diameter using the HRA unit in response to hypoxia and
29 Scanning Laser Ophthalmoscope-particle Tracking Method 259

hyperoxia. Our measurement technique is sensitive enough to detect small
changes in blood velocity and would be a valuable clinical tool for assessing
retinal hemodynamics. This technique can be further developed to non-invasively
measure retinal blood flow changes due to retinal vascular diseases such as retinal
occlusions or diabetic retinopathy.
Acknowledgment Wewould like to thank theWhitaker Foundation for the generous support.
References
1. A. Bill, In:Handbook of Physiology, Section 2, The Cardiovascular System, Circulation ofthe eye, edited by C.C.M.E. Renkin and S.R. Geiger (Am. Physiol. Soc., Bethesda, MD,1975), pp. 1001–1033.
2. J.E. Grunwald, C.E. Riva, S.H. Sinclair, A.J. Brucker, B.L. Petrig, Laser Dopplervelocimetry study of retinal circulation in diabetes mellitus, Arch Ophthalmol,104,991–996 (1986).
3. V. Patel, S. Rassam, R. Newsom, J. Wiek, E. Kohner, Retinal blood flow in diabeticretinopathy, BMJ, 305, 678–683 (1992).
4. V. Patel, S.M. Rassam, H.C. Chen, E.M. Kohner, Oxygen reactivity in diabetes mellitus:effect of hypertension and hyperglycaemia, Clin Sci (Lond), 86, 689–695 (1994).
5. F. Fillacier, G.A. Peyman, Q. Luo, B. Khoobehi, Study of lymphocyte dynamics in theocular circulation: technique of labeling cells, Curr Eye Res, 14, 579–584 (1995).
6. J. Ben-nun, Comparative flow velocity of erythrocytes and leukocytes in feline retinalcapillaries, Invest Ophthalmol Vis Sci, 37, 1854–1859 (1996).
7. R.D. Braun, M.W. Dewhirst, D.L. Hatchell, Quantification of erythrocyte flow in thechoroid of the albino rat, Am J Physiol Heart Circ Physiol, 272, 1444–1453 (1997).
8. B. Khoobehi, G.A. Peyman, Fluorescent labeling of blood cells for evaluation of retinaland choroidal circulation, Ophthalmic Surg Lasers, 30, 140–145 (1999).
9. S.D. Wajer, M. Taomoto, D.S. McLeod, R.L. McCally, H. Nishiwaki, M.E. Fabry,R.L. Nagel, G.A. Lutty, Velocity measurements of normal and sickle red blood cellsin the rat retinal and choroidal vasculatures, Microvasc Res, 60, 281–293 (2000).
10. B. Khoobehi, B. Shoelson, Y.Z. Zhang, G.A. Peyman, Fluorescent microsphere imaging:a particle-tracking approach to the hemodynamic assessment of the retina and choroids,Ophthalmic Surg Lasers, 28, 937–947 (1997).
11. E.C. Butcher, I.L. Weissman, Direct fluorescent labeling of cells with fluorescein orrhodamine isothiocyanate. I. Technical aspects, J Immunol Methods, 37, 97–108 (1980).
12. T.H. Williamson, G.M. Baxter, Central retinal vein occlusion, an investigation by colorDoppler imaging. Blood velocity characteristics and prediction of iris neovascularization,Ophthalmology, 101, 1362–1372 (1994).
13. T. Nagaoka, T. Sakamoto, F. Mori, E. Sato, A. Yoshida, The effect of nitric oxide onretinal blood flow during hypoxia in cats, Invest Ophthalmol Vis Sci, 43, 3037–3044 (2002).
14. H.F. Duijm, A.H. Rulo, M. Astin, O. Maepea, T.J. van den Berg, E.L. Greve, Study ofchoroidal blood flow by comparison of SLO fluorescein angiography and microspheres,Exp Eye Res, 63, 693–704 (1996).
15. N. Masaoka, K. Nakaya, Y. Koura, M. Ohsaki, Hemodynamic changes in two patientswith retinal circulatory disturbances shown by fluorescein angiography using a scanninglaser ophthalmoscope, Retina, 21, 155–160 (2001).
16. G. Eperon, M. Johhson, N.J. David, The effect of arterial PO2 on relative retinal bloodflow in monkeys, Invest Ophtahlmol, 14, 342–352 (1975).
260 K. Lorentz et al.

17. J. Ahmed, M.K. Pulfer, R.A. Linsenmeier, Measurement of blood flow through theretinal circulation of the cat during normoxia and hypoxemia using fluorescent micro-spheres, Microvasc res, 62, 143–153 (2001).
18. A. Deussen, M. Sonntag, R.Vogel, L-arginine-derived nitric oxide: A major determinantof uveal blood flow, Exp Eye Res, 57, 129–134 (1993).
19. N. Toda, Y. Kitamura, T. Okamura, Role of nitroxidergic nerve in dog retinal arteriolesin vivo and arteries in vitro, Am J Physiol, 266, H1985–H1992 (1994).
20. S. Harino, K. Nishimura, K. Kitanishi, M. Suzuki, P. Reinach, Role of nitric oxide inmediating retinal blood flow regulation in cats, JOcur Pharmacol Ther, 5, 295–303 (1999).
21. J.E. Grunwald, C.E. Riva, B.L. Petrig, S.H. Sinclair, A.J. Brucker, Effect of pureO2-breathing on retinal blood flow in normals and in patients with background diabeticretinopathy, Curr Eye Res, 3, 239–241 (1984).
22. B. Kiss, E. Polska, G. Dorner, K. Polak, O. Findl, G.F. Mayrl, H.G. Eichler, M. Wolzt,L. Schmetterer, Retinal blood flow during hyperoxia in humans revisited: concertedresults using different measurement techniques, Microvasc Res, 64, 75–85 (2002).
23. C.E. Riva, J.E. Grunwald, S.H. Sinclair, Laser Doppler Velocimetry study of the effect ofpure oxygen breathing on retinal blood flow, Invest Ophthalmol Vis Sci, 34, 47–51 (1983).
29 Scanning Laser Ophthalmoscope-particle Tracking Method 261

Part VII
Nano-Bio Technology

Chapter 30
Highly Sensitive Rapid, Reliable, and Automatic
Cardiovascular Disease Diagnosis with
Nanoparticle Fluorescence Enhancer and Mems
Bin Hong1, Junhai Kai
2, Yongjie Ren
1, Jungyoup Han
2, Zhiwei Zou
2,
Chong H. Ahn2, and Kyung A. Kang1
Abstract Cardiovascular diseases (CVDs) have been the leading threat tohuman life. An effective way for sensitive and accurate CVD diagnosis is to
measure the biochemical markers released from the damaged myocardial cellsin the bloodstream. Here, a multi-analyte, fluorophore mediated, fiber-optic
immuno-biosensing system is being developed to simultaneously and rapidlyquantify four clinically important cardiac markers, myoglobin, C-reactive pro-
tein, cardiac troponin I, and B-type natriuretic peptide. To quantify thesemarkers at a pico-molar level, novel nanoparticle reagents enhancing fluores-
cence were used and signal enhancement was obtained as high as �230%.Micro-electro-mechanical system (MEMS) was integrated to this system to
ensure a reliable and fully-automated sensing performance. A point-of-care,automatic microfluidic sensing system for four cardiac marker quantification
was developed with the properties of 3 cm sensor size, 300 mL sample volume,9-minute assay time, and an average signal-to-noise ratio of 35.
30.1 Introduction
Cardiovascular diseases (CVDs), especially the acute myocardial infarction(AMI; commonly known as heart attack), have been the top killers for human
beings [1]. Rapid and accurate diagnosis of CVDs is, therefore, critically impor-tant to save lives. This can be realized by rapid, sensitive, and accurate quanti-
fication of cardiac markers released from injured cardiac muscles. CreatineKinase-MB (CK-MB), myoglobin (MG), and cardiac troponin I (cTnI) are
important markers for early diagnosis of a heart attack [2]. B-type natriureticpeptide (BNP) and C-reactive protein (CRP) are crucial markers for the diag-
nosis of congestive heart failure (CHF) and acute coronary syndromes (ACS)and also for the accurate prognosis after an AMI insult [3–4]. Our effort is
1Department of Chemical Engineering, University of Louisville, Louisville, KY 40292.2Department of Electrical and Computer Engineering and Computer Science, University ofCincinnati, Cincinnati, OH 45221.
K.A. Kang et al. (eds.), Oxygen Transport to Tissue XXIX� Springer 2008
265

focused on developing a highly sensitive, reliable, and user-friendly, point-of-care sensing device, utilizing nanoparticle reagents and micro-electro-mechan-ical-system (MEMS) technique.
The main challenge in developing a biosensor is the low concentrations ofbiomarkers in biofluid (very often only a few tens of pico-moles and less) at theearly stage of disease [5]. Since our sensing is interrogated by fluorescence,fluorescence enhancement can improve the sensitivity. Nanogold particles(NGPs), possessing strong plasmon polariton fields on the surface, can reroutelone-pair electrons (normally contributing self-quenching) of a fluorophore toNGPs, resulting in fluorescence enhancement [6–7]. Some biocompatible solventswere also found to enhance fluorescence, by shifting the fluorophore excitation/emission wavelengths and/or increasing the number of trans carbon double bonds[6–7]. To maximize the enhancement effect, NGPs and solvents were combined,forming nanogold particle reagents (NGPRs). According to our previous results[7], the mixture of 5 nm sized NGPs coated with 2-nm thick self-assembledmonolayer (5nmNGP-SAM2nm) in 1-butanol has shown to be an excellentenhancer.
MEMS technique improves the performance of biosensors by providing micro-fabrication tools, the consistency in operation, and compactness, as well as massproduction capability. For a reliable and fully automated sensing performance witha minimal system size, MEMs was integrated to our sensing system.
In this paper, a sensitive and accurate cardiacmarker sensing systemwith theapplication of NGPR and MEMS is reported. With this system, simultaneousfour-cardiac marker quantification was completed in 9 minutes at an averagesignal-to-noise (S/N) of 35.
30.2 Materials, Instruments, and Methods
30.2.1 NGP, Solvent and NGPR-Related Study
The 5 nm nanogold particles coated with tannic acid (Ted Pella, Redding, CA)and 16-mercaptohexadecanoic acid (MHA; Sigma/Aldrich, St. Louis, MO)were used to synthesize 5nmNGP-SAM2nm by self-assembling MHA on theNGP surface [6]. For the butanol based NGPR, 5nmNGP-SAM2nm was thendispersed in pure 1-butanol (Sigma/Aldrich).
30.2.2 Cardiac Marker Sensors and Assay Protocol
Human BNP was purchased from Bachem (Torrance, CA). Monoclonal IgGagainst human BNP, was from Strategic Biosolutions (Newark, DE). HumancTnI,MG, and CRP, and their respective monoclonal antibodies were obtainedfrom Fitzgerald Industries (Concord, MA). Plasma samples with cardiac
266 B. Hong et al.

markers were prepared by adding a known amount of cardiac markers to theemulated human plasma. The emulated plasma is 103 mg/ml human serumalbumin (HSA; Sigma/Aldrich) in the PBS buffered solution [8]. The fluoro-phore, Alexa Fluor1 647 (AF647; max. excitation/emission wavelengths, 649/666 nm), was from Invitrogen (Carlsbad, CA). Four cardiac marker biosensorswere constructed, following the protocol established by Tang et al [5]. Thefluorometer with four sensing channels (Analyte 2000TM) was from ResearchInternational (Monroe, WA). Briefly, the monoclonal antibody (18Mab)against the respective marker is immobilized on the optical fiber surface viastreptavidin-biotin bond and the sensor is encased in a chamber. During theassay, the sample is injected to the sensing chamber. The target marker bindsspecifically to the 18Mab on the sensor surface. After the sample incubation,unbound molecules are washed away from the sensing chamber. Next, thefluorophore tagged, second monoclonal antibody (fluorophore-28Mab) isapplied to the sensor. When the surface immobilized fluorophores are excitedby the laser light, the emitted fluorescence is detected by the fluorometer. Forthe sensing with NGPR, NGPR is applied before the sample incubation for thebaseline [6]. NGPR is also applied after the incubation of fluorophore-28Maband sensor washing. The fluorescence signal difference between the baseline andafter the sandwich complex formation is correlated to the analyte concentrationin the sample. Here, the enhancement is defined as the increase in the fluores-cence signals by using NGPR divided by the fluorescence from same samplewithout using NGPR (control).
30.2.3 Microfluidic Sensing System Utilizing MEMs
To generate micro-turbulence inside the sensing chamber, bumps (or baffles)were added on the upper and bottom sides of the microchamber (i.e., serpentinemicrochannel). The sensing module with the serpentine microchannels as well asthe microchannel network were microfabricated as described by Sohn, et al [9].The computer software LabVIEWTM (version 7.1) and a data acquisition cardDAQ (USB-6008, 8 inputs, 12 bits, 10 ks/s, multifunctional I/O, NationalInstruments; Austin, TX) were used to control all electronic parts in the flowcontrol unit. Electronically controllable micro-solenoid pump (12 v, 50 mL perstroke, 2 W) and 7 micro-solenoid valves (12 v, 280 mW, Lee Co.; Westbrook,CT) were for the automatic flow control. A drive circuit with a power plug, apower switch, and a power LED were customized by our research group.
30.3 Results and Discussion
Our fluorophoremediated, fiber-optic immuno-sensor is a highly sensitive detec-tion tool and, therefore, it can be used for various human disease diagnosis/prognosis [5,8,10]. In our study for the quantification of BNP in plasma (without
30 Rapid, Reliable, and Automatic Cardiovascular Disease Diagnosis 267

using any enhancers), the sensitivity of our system was found to be two orders of
magnitude higher than that of enzyme-linked immunosorbent assay (ELISA)
(data not shown). However, for rapid cardiac marker quantification, especially
for BNP and cTnI, due to their extremely low concentrations in plasma at an
early disease stage, additional sensitivity improvement was needed.
30.3.1 Cardiac Marker Sensing Using NGPR
As previously stated, 5nmNGP-SAM2nm in 1-butanol was found to be an
excellent fluorescence enhancer. Its enhancement effect was, therefore, tested
for a 3-cm BNP sensor. Figure 30.1a shows the sensing performance of BNP
sensor with and without the NGPR. With the NGPR, the signal intensity was
found to be 410%greater than that withoutNGPR. This NGPRwas also tested
with four cardiac marker sensors encased in a four-microchannel sensing mod-
ule (Fig. 30.1b). The sample was the mixture of four cardiac markers in the
emulated human plasma. The concentration of each marker was selected to be at
its lower limit in the sensing range, because this is the condition requiring the
enhancement the most. Results showed that NGPR is able to increase the signal
intensities of BNP, cTnI, MG, and CRP sensors by 60, 50, 180, and 230%,
respectively. In general, the signals from the sensors for the markers with higher
concentration ranges (MG, 4–40 nM; CRP, 5.6–56 nM) were enhanced more
than those for the sensors with lower concentration markers (BNP, 26–260 pM;
(a) (b)
0
100
200
300
400
500
600
700
0 50 100 150 200 250 300BNP concentration (pM)
Without NGPR
With NGPR
0
100
200
300
400
500
600
700
800
900
BNP cTnI MG CRP
Sig
nal I
nten
sity
(pA
)
Sig
nal I
nten
sity
(pA
)
Without NGPR
With NGPR
Fig. 30.1 Sensing performances with and without NGPR: (a) BNP sensor in the BNP sensingrange and (b) four cardiac marker sensors for their lower sensing limit in the microfluidicsensing system. [Experimental conditions: For (a), 3-cm sensor; 3/4 minutes for the sampleand AF647-28Mab incubation; flow velocity at 1.2 cm/sec, NGPR, 5nmNGP-SAM2nm in1-butanol, capillary microchannel, automatic sensing. For (b), cardiac markers at their lowerlimits; mixture of AF647-28Mab; serpentine sensing module, other operation conditions werethe same as (a).]
268 B. Hong et al.

cTnI, 31–310 pM). The reason for different enhancement levels should bestudied further.
30.3.2 Cardiac Marker Sensing Chamber with MicrofabricatedSerpentine Structure
For biosensors utilizing surface reaction, effective analyte mass transport frombulk media to sensor surface is important for a rapid assay. Convective applica-tion of liquid samples/reagents to the sensor surface was proven to improve thesensitivity [10]. However, reasonable flow rates without damaging the micro-channels of the sensing system are in a laminar flow range and limit the analytetransport, especially for the sample with a very low analyte concentration [5].Well-designed microchannels that can create local turbulence facilitate the ana-lyte transport to the surface better [8]. For this purpose, a series of bumps/baffleswere microfabricated on the inner surface of the microchannel (serpentinemicrochannel, Fig. 30.2a and b). Out of various bump configurations that wehave tested, the half-circular bump series, with the dimensions of 1200 mmdiameter, 400 mm height, and 1200 mm spacing between two adjacent bumps,were found to be very effective [8]. The sensing performance of 3-cm BNP andMG sensors was studied for the effectiveness of this serpentinemicrochannel andthe results were compared with those from the channels without bumps (capil-lary microchannel; I.D.=1400 mm). These two molecules were selected for thetest because BNP has a low analyte sensing range (26�260 pM) andMG, a highrange (4,000�40,000 pM). For BNP sensing (Fig. 30.2c), serpentine microchan-nel presented approximately 30�90% higher signals than the capillary micro-channel. For MG sensor, only a slight signal increase (0�6%) was exhibited(Fig. 30.2d), probably because, due to its high sensing range, MG is not masstransport limited.
30.3.3 Sensing Operation Utilizing MEMS
Automation of sensing system operation is important for the assay consistency,reliability in operation, and user-friendliness. In the multi-cardiac marker sen-sing system, MEMS technique was implemented for the automatic flow controlunit (Fig. 30.3ab). An electronically controllable micro-pump and seven micro-valveswere used to deliver the sample and reagents to the sensingmodule and themicrochannel network. The automatic control of the micro-pump, micro-valves,fluorometer, and other electronic parts were done by a customized LabVIEW
TM
code with an easy and simple interface. Therefore, a MEMS based biosensingsystem was developed for simultaneous, quantitative measurement of the fourcardiac markers (Fig. 30.3c). Using this automated sensing system, for all four
30 Rapid, Reliable, and Automatic Cardiovascular Disease Diagnosis 269

sensors, the S/N ratio in average was doubled from 18 to 35, with signalintensities similar to those by the manual operation. In addition, with themicro-fabricated flow network, the sample volume required for each assaydecreased from 1 mL to 300 mL.
In order for our sensing system to be used for a rapid diagnosis of diseases,especially for AMI, a shorter assay time is highly desired. Here, the sensingperformance of four cardiac marker sensors in our serpentine sensing module
(b)(a)
(c) (d)
(e)
Serpentine bumps
4-channelsensingmodule
Microchannels
600 µm
1200 µm
1.4 mm
1.4 mm
400 µm
0
100
200
300
400
500
600
700
800
900
0 50 100 150 200 250 300
BNP concentration (pM)
Capillary microchannel
Serpentine microchannel
0
500
1000
1500
2000
2500
3000
3500
4000
4500
5000
0 10 20 30 40 50
Myoglobin concentration (nM)
Capillary microchannel
Serpentine microchannel
Sig
nal I
nten
sity
(pA
)
Sig
nal I
nten
sity
(pA
)
Fig. 30.2 (a) Schematic diagram of the serpentine microchannel and (b) its actual side view.[Structure: a series of half-circular bumps at 600 mm radius, 400 mm height and 1200 mmspacing between bumps and 1.4�1.4 mm square cross-section]; the sensing performance of (c)BNP and (d) MG sensors using capillary microchannel ( ) and serpentine microchannel ( ).[Experimental conditions: 3-cm sensor, 3/4 minutes for sample and AF647-28Mab incuba-tion, flow velocity at 1.2 cm/sec, NGPR, 5nmNGP-SAM2nm in 1-butanol , automaticsensing.]; and (e) a four-channel serpentine sensing module.
270 B. Hong et al.

(Fig. 30.2e), was studied with changes in the incubation times for the sample
and the AF647-2oMab, by the new assay protocol with NGPR. Plasma samples
with four markers at their lower concentration limits (e.g., 0.1 ng/ml BNP,
0.7 ng/ml cTnI, 70 ng/ml MG, and 700 ng/ml CRP) were incubated for 1, 2 or
3 min, at a constant incubation time of 4 min for the AF647-2oMab mixture
(Fig. 30.4a). Results of BNP and cTnI sensors were shown in one figure
(Fig. 30.4a1), while MG and CRP in another figure (Fig. 30.4a2), because of
their similar sensing ranges. For cTnI (Fig. 30.4a1, �) and MG (Fig. 30.4a2, (),
the signal intensities increased sharply only after 2 min. From the results of four
sensors, 3 min seems the optimal reaction time for the assay. Although the
signals for all sensors may increase after 3 min, the signal intensities at 3 min
were all high with high S/N ratios. Similarly, the effect of the AF647-28Mab
incubation time (1, 2, 3, or 4 min) on sensing performance was studied with a
constant sample incubation time of 3 min. All four sensors showed a similar
2-way microvalves
3-waymicrovalve
Micropump
Microchannelnetwork
Plastic plateWaste outlet Optical sensors
Serpentine sensing module
2-way microvalves
Optical sensorsSerpentinesensing module
(b)(a)
(c)
LabVIEWcontrol panel
Microfluidic flowcontrol/sensing unit
Fluorometer
Fig. 30.3 Automatic sensing system: (a) Schematic diagram and (b) the top view of the actualmicrofluidic sensing unit: imbedded microchannel network, micro-pump, micro-valves, ser-pentine sensing module; (c) The entire sensing system including the laptop computer withLabVIEW control panel, microfluidic flow control/sensing unit with serpentine sensingmodule, fluorometer with four detection channels.
30 Rapid, Reliable, and Automatic Cardiovascular Disease Diagnosis 271

signal profile with the increase of the AF647-28Mab incubation time (Fig. 30.4b).At 3 min, the signal increase was slowly tapered, indicating 3 min is sufficient.
In a sum, with the application of NGPR and MEMS, the four cardiacmarker biosensing can be completed within 9 minutes (3, 3, and 3 min forsample incubation, AF647-28Mab incubation, and all other times such assample/reagent delivery, sensor washing and regeneration, respectively) with a3-cm sensor size, and a high S/N ratio of 35.
30.4 Conclusions
AMEMS based, multi-analyte, point-of-care biosensing system was developedto simultaneously quantify four important cardiacmarkers in blood plasma. Toimprove the sensitivity for analytes, fluorescence enhancing NGPR wasapplied. The sensitivities of BNP, cTnI, MG and CRP sensors increased by60%, 50%, 180% and 230%, respectively. A serpentine sensing chamber wasmicrofabricated to improve the analyte mass transport and the structureimproved the sensitivity well, especially for the analyte with low concentration.
0
100
200
300
400
500
600
700
800
900
Sample mixture incubation time (minute)
MGCRP
0
100
200
300
400
500
600
700
800
900
AF647-2°Mab mixture incubation time (minute)
MG
CRP
(b2)
0
10
20
30
40
50
60
70
Sample mixture incubation time (minute)
BNP
cTnI
0
10
20
30
40
50
60
70
AF647-2°Mab mixture incubation time (minute)
BNP
cTnI
0 1 2 3 4 0 1 2 3 4
0 1 2 3 4 5 0 1 2 3 4 5
Sig
nal I
nten
sity
(pA
)
Sig
nal I
nten
sity
(pA
)S
igna
l Int
ensi
ty (
pA)
Sig
nal I
nten
sity
(pA
)
(b1)
(a2)(a1)
Fig. 30.4 The effects of reaction time for (a) sample and (b) AF647-28Mab on the sensingperformance. [Experimental conditions: four cardiac markers at their lower limit of sensingranges; sensor size, 3 cm; flow velocity, 1.2 cm/sec; NGPR, 5nmNGP-SAM2nm in 1-butanol;serpentine sensing module; automatic sensing.]
272 B. Hong et al.

MEMS technology was also incorporated to the system for a reliable detectionand user-friendly operation. The sensing consistency of the system (S/N ratio)was doubled, the assay time became 9 min and the sample volume decreased to300 mL.
OurMEMS based, multi-analyte biosensing device can be used for quantify-ing disease-representing multi-biomarkers, rapidly, accurately, and user-friendly.
Acknowledgment Authors acknowledge the financial support from Kentucky Science andEngineering Foundation (KSEF-148-502-03-55) for fluorescence enhancement studies andNational Science Foundation (BES-0330075) for cardiac marker biosensing. The Sigma Xihonor society is acknowledged for Bin Hong’s Grants-in-Aid Research award for NGPsrelated studies and the Institute for Molecular Diversity and Drug Design (IMD[3]) at theUniversity of Louisville for Bin Hong’s Graduate Fellowship.
References
1. American Heart Association. Heart Disease and Stroke Statistics, Update, 10–12 (2005).2. F. S. Apple, R. H. Christenson, R. Valdes, A. J. Andriak, K. Mascotti, and A. H.B. Wu,
Simultaneous rapid measurement of whole blood myoglobin, creatine kinase MB, andcardiac troponin I by the triage cardiac panel for detection of myocardial infarction,Clin.Chem. 45(2), 199–205 (1999).
3. A. S. Maisel, P. Krishnaswamy, H. C. Herrmann, and P. A. McCullough, Rapid mea-surement of B-type natriuretic peptide in the emergency diagnosis of heart failure, NewEngl. J. Med. 347, 161–167 (2002).
4. M. S. Sabatine , D. A.Morrow, C. P. Cannon, and E. Braunwald,Multimarker approachto risk stratification in non-ST elevation acute coronary syndromes: Simultaneous assess-ment of troponin I, c-reactive protein, and b-type natriuretic peptide, Circ. 105,1760–1763 (2002).
5. L. Tang, Y. J. Ren, B. Hong, and K. A. Kang, A fluorophore-mediated, fiber-optic,multi-analyte, immuno-sensing system for rapid diagnosis and prognosis of cardiovas-cular diseases, J. Biomed. Optics 11, 021011 (2006).
6. B. Hong and K. A. Kang, Biocompatible, nanogold-particle fluorescence enhancer forfluorophore mediated, optical immunosensor, Biosens. Bioelectron. 21(7), 1333–1338(2006).
7. K. A. Kang and B. Hong, Biocompatible nano-metal particle fluorescence enhancers,Crit. Rev. Eukar. Gene Expres. 16(1), 45–60 (2006).
8. L. Tang, 2005. Multi-analyte, fiber-optic immuno-biosensing system for rapid diseasediagnosis: model systems for anticoagulants and cardiac markers.Dissertation. ChemicalEngineering, University of Louisville, Louisville, KY.
9. Y. Sohn, J. H. Kai, C. H. Ahn, Protein array patterning on Cyclic Olefin Copolymer(COC) for disposable protein chip, Sensor Lett. 2, 171–174 (2005).
10. L. Tang, H. J. Kwon, and K. A. Kang, Theoretical and experimental analysis of analytetransport in a fiber optic, protein C immuno-biosensor, Biotech. Bioeng. 88, 869–879(2004).
30 Rapid, Reliable, and Automatic Cardiovascular Disease Diagnosis 273

Chapter 31
Tumor-specific Nano-entities for Optical
Detection and Hyperthermic Treatment
of Breast Cancer
Hanzhu Jin1, Bin Hong
1, Sham S. Kakar
2, and Kyung A. Kang
1
Abstract The ultimate goal of this study is to develop a tumor-specificmulti-functional, nano-entity that can be used for both cancer detection andtreatment. Low heat (42�458C) hyperthermia is an effective cancer treatmentmethod with little side effect. Magnetic nanoparticles, such as Fe3O4, can beheated by alternating electromagnetic (AEM) fields at well selected frequencies,without heating normal tissue. Nanogold particles (NGPs) are effective opticalabsorbers and also excellent fluorescent enhancers. Therefore, coating gold onFe3O4 particles can enhance the optical contrast as well as keeping theparticle property for hyperthermia. Indocyanine green (ICG), a FDA approvedfluorophore, has a very low quantum yield, and its fluorescence can be enhancedby linking ICG to gold-coated Fe3O4 nanoparticles. Luteinizing hormone releas-ing hormone (LHRH), which has high affinity to breast cancer, can be used fortumor-specific targeting. Our study results showed: Fe3O4 particles at a sizerange of 10�30 nm can be heated well by an AEM field at a rate of 188C/wt%-minute; the fluorescence of ICG was extensively enhanced by NGPs;LHRH-coated gold nanoparticles provided as much cancer specificity asLHRHalone. Combining these properties in one entity, i.e., LHRH/ICG linked,gold-coated Fe3O4 nanoparticles, can be a tumor-specific nano-agent for opticaldetection and electro-magnetically induced hyperthermia for breast cancer.
31.1 Introduction
Low heat hyperthermia (42�45 8C) is an effective cancer treatment method withvery little side effect [1,2]. At this temperature range, the enzymes needed fortumor growth/ survival become deactivated and, with repeated low heattreatments, the tumor is gradually destroyed [3]. Magnetic nanoparticles havebeen considered to deliver heat to the tumor via an alternating electromagnetic
1Department of Chemical Engineering.2Department of Medicine, University of Louisville, Louisville, KY 40292.
K.A. Kang et al. (eds.), Oxygen Transport to Tissue XXIX� Springer 2008
275

(AEM) field [4,5]. One of the most frequently used particles for this purpose isFe3O4 nanoparticles [6,7], although previous applications may not have neces-sarily been tumor specific. Gold is very effective NIR absorber at a nano sizeand, therefore, coating gold on Fe3O4 particles is expected to enhance the NIRcontrast, as well as keeping the heating property for hyperthermia [8,9]. Inaddtion, nanogold particles (NGPs) are chemically inert and their surface caneasily be functionalized for other bio-entities.
Fluorophores can also be very effectively used as optical contrast agents [10].One of the most widely used fluorophores in the NIR range for humans isIndocyanine green (ICG; excitation/emission maxima: 780/830 nm). Neverthe-less, ICG has a very low quantum yield (only 0.012 in whole blood) [11]. Hongand Kang [12] have demonstrated that NGPs, when placed at an appropriatedistance from a fluorophore, can significantly enhance the fluorescence emis-sion. Therefore, the fluorescence of ICG may be enhanced by linking ICG onthe gold-coated Fe3O4 particles via a spacer at a predetermined length.
The diameter of a usual capillary blood vessel is approximately 7 mm [13].Nano-sized particles are much smaller than capillaries, and therefore are easilycirculated in blood vessels. The surface of our proposed nano-entity can befunctionalized with tumor-specific anti-receptors to reduce the systemic toxicity,when it is applied to the body. Luteinizing hormone releasing hormone (LHRH) isa peptide of 10 amino acids (pGlu-His-Trp-Ser-Tyr-D-Trp-Leu-Arg-Pro-Gly-NH2) [14]. LHRH spontaneously reacts with the surface of nanometal particlesby its N-terminal amine group via its self-assembling nature [15]. Many cancertypes, including breast cancers, express receptors for LHRH [14, 16, 17]. Incontrast, most visceral organs do not express LHRH receptors, or express onlyat a low level. Researchers have demonstrated that the breast cancer cells can betargeted through their high affinity LHRH receptors present on the cell mem-brane [15].
In this paper, optical/thermal properties of gold-coated Fe3O4 nanoparticleswere investigated. A preliminary study of adding fluorescence property to thisnano-entity, by linking ICG to the NGPs, was also conducted. Also, LHRHwas linked to the surface of NGPs, and the binding affinity of the particles tothe mouse gonadotrope cell line (LbT2), which expresses high levels of LHRHreceptors, was measured and compared with that of free LHRH.
31.2 Materials and Methods
31.2.1 Measurement of the Thermal Properties of Gold-coatedFe3O4 Nanoparticles
Gold coated Fe3O4 nanoparticles (core size: 10�20 nm; gold layer thickness:4�7 nm) were provided by Dr. Shi at the University of Cincinnati, OH. To testthe effect of a gold layer on the heating performance of Fe3O4 nanoparticles,
276 H. Jin et al.

Fe3O4 or gold-coated Fe3O4 nanoparticles were uniformly mixed with agar gel(2.15wt% agar in water: weight percentage) at a concentration of 1wt% ofparticles. The mixture containing the particles at a volume of 4 ml was placedinto a glass test tube of 1.6 (diameter) � 10 (length) cm, and solidified at roomtemperature. The AEM field was generated at 450 KHz and 5 KW by an AEMgenerator (MKII-5; Taylor-Winfield induction Company; Brookfield, OH). TheAEM applicator (induction heater coil) was made of a copper tube at 0.5 cmdiameter that formed a coil of three turns, at a dimension of 2 cm (diameter) �3 cm (height). The glass tube containing the sample was then placed inside theinduction heater coil and the AEM field was applied for a predetermined period.The sample temperature wasmeasured by a digital thermometer (Traceable1, AllQA product; Belmont, NC) before and after the application of the field.
31.2.2 Measurement of the Optical Properties of Gold-coatedFe3O4 Nanoparticles
Optically breast-tissue-like, experimental models at a dimension of 24� 14� 5 cmwere constructed following the procedure described by Jin and Kang [18]. Theabsorption and scattering properties of the model were adjusted by India ink(Design Higgins1; Sanford Co., Bellwood, IL) and skimmed milk (Kroger Co.,Cincinnati, OH). Agar (Sigma-Aldrich, St. Louis, MO) was used for the mechan-ical property of the experimental breast model. Breast tumors usually have higherabsorption than normal breast tissue [19]. Therefore, for the tumor model withoutthe contrast agent, the absorption coefficientwas adjusted to be 4 times higher thanthat of the breast model. For the particle accumulated tumor models, Fe3O4 orgold-coated Fe3O4 nanoparticles were added at a concentration of 0.1wt% to thesame ingredient of the breastmodel. Each tumormodel ingredient, while it was stillin liquid phase, was injected into an empty oval, Vitamin E capsule shell (1.5� 1.0� 1.0 cm; National Vitamin Company, LLC; Las Vegas, NV). Once the filling ofthe capsule was solidified, the capsule was placed in the breast model solution at apredetermined depth. After the solidification of the breastmodel, the surface of themodel was scanned using the optical fibers of the NIR time resolved spectroscopy(TRS) instrument, as described by Honar and Kang [20]. Obtained TRS spectrawere converted to the frequency domain by Fourier transformation [21].
31.2.3 Cypate Fluorescence Signal Enhancementby Nanogold Particles
Cypate (M.W.=705), an ICGderivative with a carboxylic group, was provided byDr. Achilefus from the Department of Radiology, Washington University SchoolofMedicine. Protein A (PA;�1 nm) linkedNGPs at sizes of 5 (5nmNGP-PA) and
31 Tumor-specific Nano-entities for Optical Detection 277

10 nm (10nmNGP-PA) were purchased from Ted Pella (Redding, CA). Streptavi-din (SA: �3 nm) linked NGPs at a size of 10 nm (10nmNGP-SA) were obtainedfrom Sigma-Aldrich (St. Louis,MO). The thickness of the protein (PA or SA) layeron NGPs was estimated using the software, HyperChem 7.0 (Hypercube, Inc.;Gainesville, FL). For the reaction between the carboxylic acid of Cypate and theamine group of PA or SA, ethanol and N,N0-Dicyclohexylcarbodiimide (DCC;Sigma-Aldrich, St. Louis, MO) were used as a solvent and a catalyst, respectively.Cypate and DCC were dissolved in a minimal amount of ethanol, and then themixture was immediately transferred to 1 mL NGP solution, stirring it at 48C for5 hours. After the reaction, Cypate linkedNGPswere separated from the unreactedmolecules by a dialysis tube [DispoDialyzer1 (Molecular cut off: 25KD); SpectrumLaboratories, Inc.; Rancho Dominguez, CA]. The concentration of Cypate in thefinal product was measured at 780 nm by UV/Vis Spectrophotometer (DU1 520,Beckman Coulter, Inc., Fullerton, CA). The Cypate linked NGPs were mixed withthe experimental breast model ingredients and the mixture was injected into anempty Vitamin E capsule shell as a tumor model. The tumor model was placed inthe experimental breast model at a predetermined depth as described in Section 2.2.The surface of the breast model was then scanned with the source (788 nm) anddetector probes of NIR-TRS instrument to measure the fluorescence contrastgenerated by Cypate or Cypate linked NGPs. For fluorescence detection, a longpass filter (cut-off wavelength: 830 nm; BþW 093 IR 830 nm; Schneider Optics,Inc.; New York, USA) was placed between the detector fiber and the detector toallow passing the fluorescence generated by the fluorophore withminimal detectionof source light (788 nm).
31.2.4 LHRH Linked NGPs for Breast Tumor Targeting
LHRH (MW = 1311.45; Sigma-Aldrich; St. Louis, MO) was coated on thesurface of 10 nm sized NGPs. After the coating, a dialysis tube was used toremove unbound LHRH. The solution containing LHRH coated NGPs wasadjusted to pH 9.0 using 0.1 mM sodium carbonate solution. Then, variousconcentrations of LHRH or LHRH linked NGPs were applied to the mousegonadotrope cell line (LbT2) expressing LHRH receptors. After four hours,cells were lysed and assayed for luciferase activity using Luciferase Assay Kits(Promega Bioscience, Inc, San Luis Obispo, CA) [22].
31.3 Results and Discussion
31.3.1 Gold-coated Fe3O4Nanoparticles as Optical/Thermal Agent
Our previous study results [23] showed that Fe3O4 nanoparticles at size 5�60nm are heated well in the AEM field at a frequency of 450 KHz and a power of5 KW, without heating any tissue components. For the same wt%, the particles
278 H. Jin et al.

at a size range of 10–30 nm were heated the best among the particle size tested.Fe3O4 nanoparticles are reasonably good near infrared (NIR) absorbers. ButNGPs at a size range of 10�250 nm are even stronger NIR absorbers, and goldhas other advantageous properties for multi-functional uses. Gold coatedFe3O4 nanoparticles were, therefore, considered.
31.3.1.1 Effect of Gold Layer on Heating Performance
of Gold-coated Fe3O4 Particles
The effect of the gold layer on the heating of Fe3O4 nanoparticles was studied.Either Fe3O4 (10�20 nm) or gold-coated Fe3O4 nanoparticles (gold layer thick-ness: 4�7 nm) in the range of 0.1 � 1 wt% were added to 4 ml of agar gel. Thesamples were placed in a glass tube and the AEM field was applied at 450 KHzand 5 KW for 2 minutes. Figure 31.1 shows the temperature increase of thesamples containing the Fe3O4 particles, with (?) and without (?) gold coating. Forboth samples, the heating was linearly proportional to the particle concentration.The temperature increases for both were approximately at a rate of 15�188C/wt%– particles perminute, indicating gold coating has little effect on the heating.
31.3.1.2 Effect of Gold Layer on NIR Contrast Enhancement
by Gold-coated Fe3O4 Particles
As a next step, the optical contrast was studied for a tumor model (absorption4 times of normal tissue), a model containing Fe3O4 particles (0.1wt%), or a
0
5
10
15
20
25
30
35
40
0 0.25 0.5 0.75 1Conc. of particles (wt %)
Tem
p. In
crea
ses
(°C
)
Gold-coated Fe3O4
Fe3O4
Fig. 31.1 The effect of a gold layer on the heating performance of Fe3O4 nanoparticles byAEM field. [Experimental conditions: Fe3O4 nanoparticle size: 10�20 nm; gold layer thick-ness: 4�7 nm; AEM frequency: 450 KHz; Power: 5 KW; heating time: 2 min.]
31 Tumor-specific Nano-entities for Optical Detection 279

model with gold coated Fe3O4 particles (0.1wt%). Since Fe3O4 or gold-coatedFe3O4 nanoparticles are mixed with the same ingredients of the breast model,the absorption contrast is created only by the particles. Each tumor model wasplaced 1 cm deep in the breast model and the optical contrast was measured bythe NIR-TRS instrument, in transmittance. The measurements were performedat an interval of 1 cm on an area of 5.0 � 5.0 cm immediately above the tumormodel. The tumor model [Fig. 31.2(a)] generated a maximum absorption con-trast of 2.5 dB. The contrast by Fe3O4 nanoparticles was 2 dB [Fig. 31.2(b)],indicating that Fe3O4 is an effective contrast agent. For the gold-coated Fe3O4,
a maximum contrast observed was 3 dB [Fig. 31.2(c)], which is greater thanthose by the Fe3O4 nanoparticles or by the tumor model.
31.3.2 Fluorescence Contrast Enhancement by NGPLinked Cypate
Cypate (an ICG derivative) was considered to be linked on the gold-coated Fe3O4
nanoparticles to add a highly effective fluorescent contrast property to our entity.As an initial attempt to enhance the fluorescence ofCypate, Cypatewas linked to 5or 10 nmNGPs (eventually gold-coated Fe3O4 particles) via Protein A (PA: 1 nm)or Streptavidin (SA: 3 nm), and their fluorescence was compared to that of Cypateonly (Fig. 31.3). Cypate concentration for this experiment was 30 mM. For allcases, the fluorescence signal was enhanced by 300 � 900 times of that by Cypatealone. The fluorescence signal by Cypate linked via PA spacer and NGP size of5 nm showed the best enhancement by 900 times.
Cypate or Cypate linked NGPs was then mixed with the breast modelingredients at a Cypate concentration of 5 mM, and the mixture was filled into
(a) (b) (c)
Fig. 31.2 Contrasts by (a) a tumor model (b) a model with 0.1wt% of Fe3O4, and (c) a modelwith 0.1 wt% of gold-coated Fe3O4, placed 1 cm deep in the breast model; by NIR-TRS at thewavelength of 788 nm in transmittance; modulation frequency analyzed at 100 MHz. Theblack dashed ellipsoids indicate the tumor model size and position. The arrows indicate amaximum absorption contrast.
280 H. Jin et al.

the Vitamin E capsules as tumor model. The tumor model was, then, placed at1 cm depth in the breast model, and the breast model was scanned using theNIR-TRS instrument at 788 nm excitation wavelength in reflectance. Figure31.4 shows the fluorescence contrast enhancement of Cypate via Protein Alinked 5 nm gold (5nmNGP-PA), Protein A linked 10 nm gold (10 nmNGP-PA), or Streptavidin linked 10 nm gold (10nmNGP-SA).With a constant spacerlength by PA, the fluorescence enhancement was similar for both 5 and 10 nmNGPs, approximately 1.3 times enhancement. For the NGP size at 10 nm, usingSA spacer provided more effective enhancement (2.2 times) than PA spacer(1.3 times).
Compared to the result of free NGP-fluorophore solution (Fig. 31.3), theresults in the experimental breast model showed much less enhancement. One
Fluorescence contrast enhancement (times)
0.0 0.4 0.8 1.2 1.6 2.0 2.45nmNGP-PA1nm
10nmNGP-PA1nm
10nmNGP-SA3nm
Fig. 31.4 Fluorescence contrast enhancement by Cypate linked PA coated 5 nm gold (5nmNGP-PA), PA coated 10 nm gold (10 nmNGP-PA), or SA coated 10 nm gold (10 nmNGP-SA) compared to the contrast by Cypate alone.
0 200 400 600 800 1000
10nmNGP-SA
10nmNGP-PA
5nmNGP-PA
Fluorescence Signal Enhancements (times)
Fig. 31.3 Fluorescence signal enhancement by Cypate linked PA coated 5 nm gold(5nmNGP-PA), PA coated 10 nm gold (10 nmNGP-PA), or SA linked 10 nm gold(10nmNGP-SA) compared to Cypate alone.
31 Tumor-specific Nano-entities for Optical Detection 281

possible reason could be that Cypate linked NGPs may be interacting with the
ingredients of the experimental breast model. Another reason could be that the
fluorescence light generated by Cypate is highly scattered by a turbid media like
our experimental breast model, and the scattered fluorescence signal is mea-
sured by a single photon counting system (NIR-TRS instrument). Further
investigation is on going. The range of the fluorescent contrast by Cypate linked
NGPs was 10�17 dB, which is much higher than the absorption contrast
(�3 dB). This result demonstrates that the feasibility of linking Cypate on the
gold-coated Fe3O4 nanoparticles to enhance Cypate fluorescence. Currently,
further investigation for optimizing NGP size and spacer length to maximize
Cypate fluorescence enhancement is being performed.
31.3.3 Affinity of LHRH to Receptor with/withoutLinking to NGPs
As an initial test for using LHRH as a tumor targeting agent, LHRHwas linked
to NGPs or Fe3O4 nanoparticles (eventually LHRH will be linked to gold-
coated Fe3O4 nanoparticles). The binding affinity of LHRH linked NGPs was
studied. The mouse gonadotrope cell line (LbT2) expressing LHRH receptors
was plated on 6-well plates. 24 hours after plating, cells were transfected
with reporter gene construct CRE-Luciferase (1 mg/well), as described by
Kakar et al [22]. After another 24 hours, the medium was replaced with serum
free medium and the cells were incubated for 60 minutes, followed by treatment
of cells with various concentrations of free LHRH or LHRH linked NGPs, for
four hours. LHRH-linked NGPs showed a similar binding affinity (about
0.1 nM) to the native LHRH peptide, suggesting that the LHRH conjugated
NGP retains its binding affinity.
31.4 Conclusions
From the studies performed on optical/thermal properties of gold-coated Fe3O4
nanoparticles, it is concluded that: the gold layer on iron oxide nanoparticles
enhanced the NIR absorption at 788 nm; gold-coated Fe3O4 particles showed
the same heating performance as non-coated ones in AEM field, indicating that
the gold layer has almost no negative effect on the heating performance of the
nanoparticles; Cypate linkedNGPs via streptavidin spacer (�3 nm) have shown
twice higher fluorescence contrast than ICG alone in our experimental breast
model system. The binding affinity of LHRH linked NGPs was found to be
similar to the LHRH alone, indicating that LHRH retains its binding affinity
after being bound to NGPs.
282 H. Jin et al.

Future studies include linking LHRH and Cypate on gold-coated Fe3O4
nanoparticles as a prototype of a multi-functional nano-entity and then testingthe optical/thermal properties and binding affinity of conjugated LHRH.
Aknowledgment The authors thank the U.S. Army Medical Research and MaterielCommand (DAMD17-03-1-0572) for partial financial support. The authors also thankDr. Shi’s group at the University of Cincinnati, OH for supplying the gold-coated nanopar-ticles, and Dr. Achilefu’s group at Washington University, MO for supplying Cypate.
References
1. F. Kristian Storm, Hyperthermia in Cancer Therapy, (G. K. Hall Medical Publishers,Boston, MA, 1983).
2. S. Sharma, S.P. Sandhu, F. D. Patel, S. Ghoshal, B. D. Gupta, and N. S. Yadav, Cervixcancer and hyperthermia: Side-effects of local hyperthermia: results of a prospectivelyrandomized clinical study, Int. J. Hyperthermia, 6 (2), 279–285, (1990).
3. T. Ohtsubo, H. Igawa, T. Saito, H. matsumoto, H. Park, C. W. Song, E. Kano, andH. Saito, Enhancement of cell killing by induction of apoptosis after treatment with mildhyperthermia at 428C and cisplatin, Radiation Research, 156, 103–109, (2001).
4. A. Jordan, R. Scholz, P. Wust, H. Fahling, and R. Felix, Magnetic fluid hyperthermia(MFH): cancer treatment with AC magnetic field induced excitation of biocompatiblesuperparamagnetic nanoparticles J. Magn. Magn. Mater. 201, 413–419, (1999).
5. P. Tartaj, M.P. Morales, S. Veintemillas-Verdaguer, T. Gonz’alez-Carreno, andC.J. Serna, The preparation of magnetic nanoparticles for applications in biomedicine,J. Phys. D: Appl. Phys. 36, R182–197, (2003).
6. D. Bahadur, and J. Giri, Biomaterials and magnetism, Sadhana, 28 (3 and 4), 639–656,(2003).
7. S. Mornet, S. Vasseur, F. Grasset, and E. Duguet, Magnetic nanoparticle design formedical diagnosis and therapy, J. Mater. Chem., 14, 2161–2175, (2004).
8. S. J. Oldenburg, J. B. Jackson, S. L. Westcott, and N. J. Halas, Infrared extinctionproperties of gold nanoshells, Applied Physics Letters, 78 (19), 2897–2899, (1999).
9. C. H. Chou, C. D. Chen, and C. R. Wang, Highly Efficient, Wavelength-Tunable, GoldNanoparticle Based photothermal Nanoconvertors, J. Phys. Chem. B, 109, 11135–11138,(2005).
10. S. Achilefu, R. B. Dorshow, J. E. Bugaj, and R. Rajagopalan, Novel receptor-targetedfluorescent contrast agents for in vivo tumor imaging. Invest Radiol, 35:479–485, (2000).
11. C. D. Geddes, A. Parfenov, D. Roll, M. J. Uddin, and J. R. Lakowicz, Fluorescencespectral properties of indocyanine green on a roughened platinum electrode: Metal-enhanced fluorescence, Journal of Fluorescence, 13 (6), 453–457, (2003).
12. B. Hong and K.A. Kang, Biocompatible, nanogold-particle fluorescence enhancer forfluorophore mediated, optical immunosensor, Biosensors and Bioelectronics, 21(7),1333–1338, (2006).
13. R. Eckert, D. Randall, and G. Augustin,Animal Physiology, 3rd Edition, W. H. Freemanand Company, New York, 435–473, (1988).
14. S. S. Kakar, L. C. Musgrove, D. C. Devor, J. C. Sellers, and J. D. Neill, Cloning,sequencing, and expression of human gonadotropin releasing hormone (GnRH) receptor.Biochem. Biophys. Res. Commun. 189, 289–295, (1992).
15. M. Preuss, W.G. Schmidt, and F. Bechstedt, Coulombic amino group-metal bonding:Adsorption of adenine on Cu (110), Physical Review Letters, 94, 236102–4, (2005).
31 Tumor-specific Nano-entities for Optical Detection 283

16. S. S. Kakar, W. E. Grizzle, and J. D. Neill, The nucleotide sequences of human GnRHreceptors in breast and ovarian tumors are identical with that found in pituitary, Mol.Cell. Endocrinol. 106, 145–149, (1994).
17. S. S. Kakar, M. T. Malik, S. J. Winters, and W. Mazhawidza, Gonadotropin-releasinghormone receptors: structure, expression, and signaling transduction. Vitam Horm. 69,151–207, (2004).
18. H. Jin and K. A. Kang, Fluorescent mediated detection of Heterogeneity in a highlyscattering media, Adv. Exper. Med. Bio., 566, 167–172, (2005).
19. T. L. Troy, B. W. Pogue, E. D. Genety, S. B. Poplack, O. L. Osterburg, andK.D. Paulsen, Spectroscopic diffuse optical tomography for the quantitative assessmentsof hemoglobin concentration and oxygen saturation in human breast tissue, Appl. Opt.,38(25), 5480–5490, (1999).
20. A.L. Honar and K.A. Kang, Effect of the source and detector configuration on thedetectability of breast cancer, Comp. Biochem.Physio - Part A: Molecular & IntegrativePhysiology, 132(1), 9–15, (2002).
21. D. F. Bruley, Pulse reduction code written for process identification (personal commu-nication), (1974).
22. S. S. Kakar, S. J., Winters, W. Zacharias, D. M. Miller, and S. Flynn, Identification ofdistinct gene expression profiles associated with treatment of LbetaT2 cells with gonado-tropin-releasing hormone agonist using microarray analysis. Gene. 308, 67–77, (2003).
23. H. Jin and K. A. Kang, Application of Novel Metal Nanoparticles as Optical/ThermalAgents in Optical Mammography and Hyperthermic Treatment for Breast Cancer,Proceedings of the 33rd ISOTT Annual Meeting, August 28-September 2, Brisbane,Australia, Manuscript Submitted, (2005).
284 H. Jin et al.

Chapter 32
LHRH Receptor Targeted Therapy
for Breast Cancer
S.S. Kakar1, H. Jin2, B. Hong2, J.W. Eaton1, and Kyung A. Kang 2
Abstract Breast cancer remains the most common cancer among women,with an estimated 212,920 new cases and 40,970 deaths in the United Statesin 2006. The present work extends the studies of nanoparticles targeted tothe luteinizing hormone-releasing hormone (LHRH) receptor which is over-expressed in breast, ovarian, endometrial and prostate cancer cells. In con-trast, LHRH receptors are not expressed, or expressed at a low level in mostvisceral organs. In our studies, we conjugated Fe3O4 nanoparticles (20–30 nm)with [D-Trp6]LHRH (Triptorelin), a decapeptide analog of LHRH currentlyused for treatment of sex-hormone-dependent tumors. Conjugation of [D-Trp6]LHRH to Fe3O4 particles retained its binding affinity and biologicalactivity for the LHRH receptor. Treatment of two separate breast tumor celllines (MCF-7 and MDA-MB231) with these conjugated nanoparticles resultedin 95–98% cell death and loss of viability within 24 h whereas no change incell proliferation or cell apoptosis was observed in cells treated with equalamounts of either [D-Trp6]LHRH or unconjugated Fe3O4 nanoparticles.These studies provide critical and important information regarding use ofLHRH receptor targeted therapy for breast cancer.
32.1 Introduction
Cancer is a complex disease that affects millions of people worldwide.Currently, one in four deaths in the United States is due to cancer. Thisdisease affects diverse tissues and organs including colon, prostate, lung andbreast. Breast cancer is the most common cancer among women with anestimated 212,920 new cases and 40,970 deaths in 2006 [1]. Although thedeath rate from breast tumors has been reduced by the introduction of breast
1Department ofMedicine and James Graham Brown Cancer Center, University of Louisville,Louisville. KY 40202.2Department of Chemical Engineering, J.B Speed School of Engineering, Universityof Louisville, Louisville. KY 40202.
K.A. Kang et al. (eds.), Oxygen Transport to Tissue XXIX� Springer 2008
285

screening mammography and adjuvant therapies, more efficacious treatment
modalities are needed. The primary treatment modality for breast cancer is
cytoreductive surgery followed by adjuvant chemotherapy, radiotherapy, or
both [2]. This strategy is successful in the majority of patients, however it is
always accompanied by cytotoxicity to normal organs and tissues. Successful
chemotherapy is also hindered by intrinsic or acquired resistance of breast
cancer cells.An alternative to standard chemotherapies involves more direct targeting of
cancer cells using agents specifically directed to binding sites on cancer cells.
Several different targets have been explored, including carbohydrates, lectins,
receptor ligands and antibodies. Usually, ligands which recognize these targets
are coupled with low molecular weight anti-neoplastic drugs. However, a new
class of potential anticancer agents has appeared in recent years – nanoparticles –
which hold promise for improved cancer detection and treatment. Some of these
applications include iron-based nanoparticles which may permit magnetic drug
targeting, hyperthermia, magnetic field-assisted radio nucleotide therapy and
magnetic resonance imaging (MRI) contrast enhancement. To meet application
requirements, nanoparticles are generally coated with various functional surface
layers to increase residence time in circulation but there has been little
work aimed at the strategies for preferential delivery of these nanoparticles to
tumors.In the present work, we exploited LHRH receptors for targeting of nano-
particles because these receptors are overexpressed in a variety of tumors
including breast, ovarian, endometrial, prostate, and melanoma, and not
expressed in a detectable level in most visceral organs. We are targeting this
receptor using [D-Trp6]LHRH (Triptorelin), a decapeptide analog of LHRH.
In addition, LHRH is inexpensive compared to the most frequent used ligands
and humanized monoclonal antibodies.Luteinizing hormone-releasing hormone (LHRH), also known as gonadotropin-
releasing hormone (GnRH), is a hypothalamic decapeptide (p-Glu-His-Trp-Ser-
Tyr-Gly-Leu-Arg-Pro-Gly-NH2). Based on studies from our laboratory and
others, it became clear that high affinity LHRH receptors are overexpressed in
most of the tumors analyzed to date and treatment of tumor cells with LHRH
agonists and antagonists results in reduction in tumor cell growth and proliferation
in vitro (see ref [3] for review). However, such antiproliferative affects of LHRH
analogs are moderate (15–20% inhibition after three to four days of treatment),
making LHRH analogs not particularly useful for the treatment of breast cancer.
Our investigations are based on the idea that we might be able to employ
nanospheres displaying analogs of LHRH to effect selective delivery of these
nanospheres to breast tumors, thereby sparing normal, non-cancerous cells from
unnecessary exposure. In support of this general concept, Schally and his
colleagues developed cytotoxic analogs of LHRH containing doxorubicin or
derivatives of doxorubicin and showed inhibition of proliferation of various
tumor cell lines and tumor growth in nude mice [4].
286 S.S. Kakar et al.

Recently, Dharap et al. [5] and Zhou et al. [6] have investigated breasttumor specific targeting using LHRH peptide to deliver anti-cancer drugs forcancer treatment or magnetic nanoparticles for enhancing magnetic resonanceimaging (MRI) contrast [7]. Their results showed that the use of LHRHpeptide as targeting moiety substantially enhances the uptake of the anti-cancer drugs or magnetite nanoparticles (20 nm) in tumors, with much lessaccumulation in liver or kidney compared to magnetic particles alone. In theirstudies, magnetite nanoparticles were conjugated with LHRH and intrave-nously injected to female mice bearing carcinogen initiated tumors. After 20hr, the distribution of the nanoparticles was examined in tumor, liver andkidney. No studies were performed to analyze the effects on tumor growth orregression by these investigator [6]. Most of the un-conjugated particles(55.5%) were found in the liver, while those conjugated with LHRH werefound primarily in the tumors (59.1%) and in pulmonary metastases of thetumors (20.3%), confirming the high specificity of targeting achieved byLHRH derivitization.
32.2 Materials and Methods
32.2.1 Cross Linking of an LHRH Analog to Fe3O4 Particles
The clinically used LHRH analog [D-Trp6]LHRH (Triptorelin) has anamino acid sequence of p-Glu-His-Trp-Ser-Tyr-D-Trp-Leu-Arg-Gly-NH2.It can be coupled to the surface of appropriately prepared magnetite nano-particles via its N-terminal amine group. To conjugate [D-Trp6]LHRH (MW= 1311.45) to nanoparticles, 10 mg of magnetite particles (20-30 nm fromAlfa Aesar, Ward Hill, MA) were treated with 3 ml of 28% NH4OHsolution in a glass bottle coated with silicone for 2 h. The hydroxylatedparticles were then centrifuged and washed three times with H2O followedby three washes with methanol. The particles were dried at 658C for 1 h.Two ml of toluene was added to the particles and sonicated for 1–2 min andsparged with N2 for 5 min. Ten ml of (3-aminopropyl)trimethoxysilane(APTS) was added to the mixture and incubated at 408C for 2 h. Themixture was centrifuged and particles were washed three times with toluene.Particles were resuspended in 10 ml H2O. To this, 15.6 mg of dicyclohex-ylcarbodiimide solubilized in 50 ml of ethanol was added. To this mixture, 1mg of [D-Trp6]LHRH solubilized in 3 ml of PBS was added, mixed andincubated for 2 h. The mixture was centrifuged to collect the [D-Trp6]LHRHconjugated particles and washed [6]. Unconjugated [D-Trp6]LHRH was mea-sured in the supernatant. The conjugated particles were resuspended in 1%BSA/PBS buffer solution to a final volume of 5.0 ml (Fig. 32.1). The amount of
32 LHRH Receptor Targeted Therapy for Breast Cancer 287

[D-Trp6]LHRH conjugated to particles and amount of particles was determinedas described by Zhou et al [6].
32.2.2 Cross Linking of an LHRH analog to Gold CoatedFe3O4 Particles
For control experiments, gold nanoparticles (NGP) were conjugated with[D-Trp6]LHRH as described by Aslam et al.8 Briefly, nanogold colloids coated
with surfactant tannic acid was adjusted to pH 9.0 using 0.1 M sodium carbo-
nate solution in the silicone coated glass bottle. One mg of [D-Trp6]LHRH wasdissolved in 1 ml of H2O and immediately transferred to gold colloid, and the
mixture was intensively vibrated at 48C for one h. Tannic acid on the NGP
surface was then replaced with [D-Trp6]LHRH and [D-Trp6]LHRH linkedNGP (LHRH-NGP) were formed (Fig. 32.1). LHRH-NGP were collected by
centrifugation at 10,000 RPM for 10 min. Particles were washed three times
with H2O and resuspended in 1% BSA PBS buffered solution to a final volumeof 5.0 ml. The amount of [D-Trp6]LHRH linked to NGP was calculated as
described above.
32.2.3 Cell Culture
Breast tumor cell lines (MCF-7 and MDA-MB231) were obtained from
American Type Tissue Culture (ATCC) (Rockville, MD). Mouse pituitarygonadotrope cell line LbT2 was obtained from Dr. Pamela Mellon, (Univeristy
of California, SanDiego, CA). The cell lines were cultured according to the
suppliers’ recommendations in 10% fetal calf serum (FCS) at 378C in an atmo-sphere of 5% CO2 in humidified air. The cell lines were subcultured on routine
basis every 3–4 days.
Fig. 32.1 Scheme of the reaction between hydroxylated Fe3O4 particles (A) or gold (NGP)coated Fe3O4 particles (B) and [D-Trp6] LHRH.
288 S.S. Kakar et al.

32.2.4 Determination of Binding Affinity of LHRHConjugated Nanoparticles
The binding affinity of LHRH-NP to LHRH receptor and activation ofLHRH receptor was determined as described previously [9,10]. For thispurpose, we used a mouse pituitary gonadotrope tumor cell line (LbT2)that expresses high levels of high affinity LHRH receptors [10,11]. Thecells were transfected with CRE-Luc reporter construct as described pre-viously [10]. The reporter construct (CRE-luciferase) is used for the mea-surement of cAMP response element (CRE) activation. It contains fourcopies of a CRE enhancer element fused to luciferase cDNA (pCRE-Lucplasmid, Stratagene, La Jolla, CA). This reporter construct is commonlyused to determine the activation of G-protein coupled receptors such asLHRH receptor in response to ligand binding resulting in change in intra-cellular cAMP levels leading to activation of lucifierase activity [12]. Afterovernight transfection of cells, the medium was replaced with serum freemedium for 4 h. Cells were treated with various concentrations of [D-Trp6]LHRH, LHRH-NP or NP. After 6 h of treatment, the cells werelysed and luciferase activity was assayed. IC50 value was calculated asdescribed previously [10].
32.2.5 Treatment of Breast Tumor Cells with LHRH-NPand Determination of Cell Death
Breast tumor cells (MCF-7 and MDA-MB231) were plated in 6-well plates.After 24 h, the FCS-containing medium was replaced with serum-free medium.After 2 h, the cells were treated with various concentrations of LHRH analog[D-Trp6]LHRH, LHRH-NP or NP for 15 min. The cells were rinsed twice withPBS and 1.0 ml of medium containing 1% FCS was added to each well. Thecells were incubated at 378C for overnight and examined under an Olympusmicroscope for cell survival and morphological changes. To quantitate the cellnumber, we fixed the cells with 10% formaldehyde and then stained the cellswith 1% crystal violet. Following thorough rinsing in PBS, the cells wereexamined microscopically.
32.2.6 Cell Viability Assay
To determine the effect of LHRH-NP on breast tumor cell proliferation andcell survival, we performed cell viability assays. We plated breast tumor cells(MCF-7 and MDA-MB231) that express LHRH receptors [13,14] in 96-wellopaque plates. After 24 h, the medium was replaced with serum-free
32 LHRH Receptor Targeted Therapy for Breast Cancer 289

medium. Cells were incubated at 378C for 2 h and then treated with various
concentrations of free [D-Trp6]LHRH, LHRH-NP or nanoparticles (NP)
for 15 min. The amount of LHRH bound to the nanoparticles was adjusted
to a concentration equivalent to free [D-Trp6]LHRH and final concentration
of nanoparticles was 0.002–0.02 mg/ml. After 15 min of treatment,
the medium was aspirated and cells were rinsed twice with PBS. One
hundred ml of medium containing 1% FBS was added to each well and the
cells were incubated at 37 8C in the incubator. After 48 h of treatment,
cells were equilibrated to room temperature for 30 min, 100 ml of CellTi-
ter-Glo reagent from the kit (Promega, Madison, WI) was added to cells.
The cells were incubated for 10 min and luminescence was recorded by
Luminometer.
32.2.7 Cell Membrane Integrity Assay
To determine the cytotoxic effect of LHRH-NP on breast tumor cells, we used
CytoTox-OneMembrane Integrity Assay kit from Promega. This assay is based
on the release of lactate dehydrogenase (LDH) from cells with damaged mem-
branes. Cells were plated in 96-well opaque plates and treated with [D-
Trp6]LHRH, LHRH-NP or NP as described above. To measure LDH release
in the medium, after 48 h of treatment of cells, 100 ml of CytoTox-One reagent
from the kit was added to cells containing 100 ml of growth medium and
incubated at room temperature for 10 min. To each sample 50 ml of stop
solution was added and mixed. Fluorescence was measured using spectrofluo-
rometer (Molecular Devices) with an excitation wavelength of 560 nm and an
emission wavelength of 590 nm.
32.2.8 Determination of Release of Iron from Fe3O4
Particles at Low pH
Finally, we investigated the possibility that nanoparticle-induced cytotoxicity is
mediated by iron released from the magnetite particles in the acidic and
cysteine-rich interior of the lysosomal compartment. To test the hypothesis
that LHRH conjugated nanoparticles release iron in lysosomes, we incubated
1 mg of LHRH conjugated or non-conjugated magnetite beads suspended in
500 ml of 20 mMTris and 2 mM cysteine. In one case the pH was adjusted to 7.4
whilst in the other the pH was lowered to 4.5 to mimic intralysosomal pH. The
supernatant was sampled at 1, 4 and 24 hours and ’free’ iron was determined
using the ferene S reaction [15].
290 S.S. Kakar et al.

32.3 Results and Discussion
32.3.1 LHRHConjugated Nanoparticles Bind to LHRHReceptorswith High Affinity and Activate the Production of cAMP
Fe3O4 or gold nanoparticles conjugatedwith the LHRHanalog [D-Trp6]LHRH
showed high binding affinity. To determine the binding affinity and activation of
LHRH receptor by LHRH conjugated nanoparticles, we transfected LbT2 cellswith pCRE plasmid followed by treatment of cells with [D-Trp6]LHRH,
LHRH-NP or NP. Treatment of cells with [D-Trp6]LHRH or LHRH-NP
showed activation of LHRH receptor resulting in an increase in production of
intracellular cAMP which was measured by activation of CRE to drive lucifer-
ase. Using this latter as a surrogate marker for LHRH receptor occupancy, the
binding affinity (IC50 value) for [D-Trp6]LHRH conjugated magnetite particles
was found to be similar to free [D-Trp6]LHRH (0.1 nM), suggesting that the
LHRH analog bound to magnetite nanoparticles retained its normal affinity for
the receptor and its biological activity. Similar results were obtained when gold
coated particles (LHRH-NGP) were used for conjugation, suggesting that con-
jugation of [D-Trp6] to Fe3O4 or gold coated Fe3O4 did not lose its binding
affinity for the LHRH receptor or its biological activity to induce intracellular
signaling. Binding affinity of [D-Trp6]LHRHor conjugated particles was similar
to our earlier studies [9,10].
32.3.2 Effect of LHRH-NP on Breast Tumor Cell Survival
To determine the effect of LHRH-NP particles on breast tumor growth and
survival, we treated the MCF-7 and MDA-MB231 cells with various concen-
tration of free [D-Trp6]LHRH, LHRH-NP or NP as described in materials and
methods. Cells after treatment were examined microscopically. As shown in
Fig. 32.2, treatment of both MCF-7 cells with LHRH-nanoparticles caused
substantial dose-dependent cell death compared to cells treated with vehicle,
free [D-Trp6]LHRH or uncoated nanoparticles. Maximum cell death (95–98%)
was observed with conjugated LHRH-nanoparticle concentration of 0.5 mM to
1 mM(particle concentration=0.01–0.02mg/ml). Similar results were obtained
when MDA-MB231 cells were used. Staining of cells with crystal violet showed
similar results confirming that LHRH conjugated nanoparticles induce cell
death in breast tumor cells (Figs. 32.3 and 32.4). In contrast HEK293 cells
that do not express LHRH receptor [16] showed no change in cell proliferation
or cell survival when treated with free [D-Trp6]LHRH, LHRH-NP or NP.
Therefore, cell death induced by LHRH-NP is specific and is achieved through
LHRH receptors present on breast tumor cells.
32 LHRH Receptor Targeted Therapy for Breast Cancer 291

Fig. 32.3 Effect of treatment of MCF7 cells with LHRH-NP on cell survival. MCF7 cellswere treated with [D-Trp6]LHRH, LHRH-NP or NP. After 24 h of treatment cells werestained with crystal violet and examined under a microscope and photographed. Nanoparti-cles concentration (mg/ml) and corresponding LHRH concentration are indicated.
Fig. 32.2 Treatment of breast tumor cells (MCF7) with Fe3O4-LHRH nanoparticles. MCF7cells were treated with [D-rp6]LHRH, LHRH-NP, NP. After 24 h of treatment cells wereexamined under a microscope to examine death and morphological changes. Nanoparticlesconcentration (mg/ml) and corresponding LHRH concentration are indicated.
292 S.S. Kakar et al.

32.3.3 Effect of LHRH-NP on Breast Tumor Cell Proliferation
To quantitate the effect of LHRH-NP on breast tumor cell proliferation, we
performed cell viability assays. This method is based on quantitation of intra-
cellular ATP which reflects the metabolic activity of control and treated cells.
Using this surrogate measure of cell viability, we found that both MCF-7 and
MDA-MB231 cells are efficiently killed (95–98%) when treated with LHRH-
NP at a final concentration of [D-Trp6]LHRH of 0.5 mM or 1 mM. In contrast
very few cells were killed when treated with free [D-Trp6]LHRH or NP alone.
No change in cell proliferation or cell survival was observed when gold coated
LHRH conjugated Fe3O4 particles were used for treatment, suggesting that loss
of cell viability (cell death) achieved by LHRH-conjugated Fe3O4 particles is
due to cellular cytotoxicity induced by Fe3O4.
32.3.4 Effect of LHRH-NP on Breast Tumor Cellular Toxicity
Binding of LHRHor its analog results in desensitization of LHRH receptors and
internalization of the ligand-receptor complex (endocytosis) (see ref 3 for review).
In lysosomes, LHRH is released from the receptor and most of the LHRH
receptors undergo proteolytic degradation (although some receptors may be
recycled to the plasma membrane. Once within the lysosomal compartment,
Fe3O4 might be released, thereby, inducing cellular cytotoxicity. To determine
Fig. 32.4 Effect of treatment of MDA-MB231 cells with LHRH-NP on cell survival.MDA-MB231 cells were treated with [D-Trp6]LHRH, LHRH-NP or NP. After 24 h oftreatment of cell were stained with crystal violet and examined under a microscope andphotographed. Nanoparticles concentration and corresponding LHRH concentrationare indicated.
32 LHRH Receptor Targeted Therapy for Breast Cancer 293

the extent of cytotoxicity caused by LHRH-NP, we performed cytotoxicity
assays using the CytoTox-One system from Promega. This method is based on
the measurement of lactate dehydrogenase (LDH) release from cells which
reflects loss of plama membrane integrity. After treatment of cells with LHRH-
NP for 48 h, cytotoxic assay was performed as described in materials and
methods. There was a dose-dependent cell death as indicated by LDH release.
Such effects of LHRH-NP were observed to be dose dependent. No cytotoxic
effects were observed when cells were treated with free [D-Trp6]LHRH or NP
alone.
32.3.5 LHRH-Conjugated Fe3O4 Nanoparticles Release Ironat Low pH
Finally, we are entertaining the possibility that nanoparticle-induced cytotoxicity
is mediated by iron released from the magnetite particles in the acidic and
cysteine-rich interior of the lysosomal compartment. In brief, we earlier found
that in normal cells almost all redox active iron is located within lysosomes [17,18]
and that the lysosomal iron derives from the continuous ’autophagocytosis’ of
ferruginous intracellular material such as mitochondria and ferritin. Further-
more, this iron pool seems most important in mediating oxidant-induced cell
death (which can involve reactive oxygen species produced by normal mitochon-
drial metabolism). Most importantly, iron- and oxidant-mediated cell death
involves lysosomal rupture as the first event, followed by activation of the classical
apoptotic cascade [19]. To indirectly test the hypothesis that LHRH conjugated
nanoparticles might release iron within the lysosomes, we incubated 1 mg of
LHRH conjugated or non-conjugated magnetite beads suspended in 500 ml of20 mMTris and 2 mM cysteine. In one case (A) the pH was adjusted to 7.4 whilst
in (B) the pH was lowered to 4.5 to mimic intralysosomal pH. The supernatant
was sampled at 1, 4 and 24 hours and ’free’ iron was determined using the ferene S
reaction [15].Note the absence of iron release at neutral pH (or, at least, the failure
of ’loose’ iron to appear in the supernatant). In contrast, Fe3O4 nanoparticles
incubated at low pH showed substantial free iron in the supernatant (Table 32.1),
Table 32.1 Release of free iron from LHRH-NP or NP
SUPERNATANT Fe CONTENT (nmol)
SAMPLES 1 h 4 h 24 h
Nano particles @ pH 7.4 0* 0* 0*
LHRH-nanospheres @ 7.4 0* 0* 0*
Nano particles @ pH 4.5 3.06 5.46 8.66
LHRH-nanospheres @ pH 4.5 1.51 2.92 5.56
* Below limits of detection
294 S.S. Kakar et al.

suggesting that the release of free iron fromLHRH conjugated and unconjugatedFe3O4 particles at acidic pH which may promote cell death.
32.4 Conclusions
Our results clearly define that conjugation of the LHRH analog [D-Trp6]LHRHto Fe3O4 nanoparticles retains normal LHRH receptor binding affinity andbiological activity. Our studies also demonstrate that treatment of breasttumor cells (MCF-7 and MDA-MB 231) with LHRH-NP specifically inducescytotoxicity leading to cell death and loss of cell viability. Incubation of LHRH-conjugated and unconjugated particles release free iron at pH 4.5 (intralysoso-mal pH). The effect of LHRH conjugated Fe3O4 nanoparticles on tumor growthand metastasis in vivo remains to be tested.
Acknowledgment This work was supported in part by a grant from the U.S. Army MedicalResearch and Material Command (W81XWH-06-1-0662), and funds from James GrahamBrown Cancer Center, University of Louisville. The authors are thankful to Dr. MohammadT. Malik and Ms. Alison L. Burton for their technical help.
References
1. A. Jemal, R. Siegel, E. Ward et al. Cancer statistics, 2006. CA: a Cancer J Clin 2006;56(2): 106–130
2. A.M. Bajo, A.V. Schally, G, Halmos et al. Targeted doxorubicin containing luteinizinghormone-releasing hormone analogue AN-152 inhibits the growth of doxorubicin-resis-tant MX-1 human breast cancers. Clin Cancer Res 2003; 9: 3742–3748
3. S.S. Kakar, M.T. Malik, S.J. Winters et al. Gonadotropin-releasing hormone receptors:structure, expression, and signaling transduction. Vit Horm 2004; 69: 151–207
4. A. Nagy, A.V. Schally. Targeting of cytotoxic luteinizing hormone-releasing hormoneanalogs to breast, ovarian, endometrial, and prostate cancers. Biol Reprod 2005; 73(5):851–859
5. S.S. Dharap, Y. Wang, P. Chandna et al. Tumor-specific targeting of an anticancer drugdelivery system by LHRH peptide. Proc Nat Acad Sci USA 2005; 102(36): 12962–12967
6. J. Zhou, C. Leuschner, C. Kumar et al. Sub-cellular accumulation of magnetic nanopar-ticles in breast tumors and metastases. Biomaterials 2006; 27(9): 2001–2008
7. C. Leuschner, C. Kumar, M. Urbina et al. The use of ligand conjugated supermagneticiron oxide nanoparticles (SPION) for early detection of metastasis. In INST NaotechTech Proc 1005; 1: 5–6
8. M. Islam, L. Fu, M. Su et al. Novel one-step synthesis of amine-stabilized aqueouscolloidal gold nanoparticles. J Material Chem 2004; 14; 1795–1797
9. S.S. Kakar, L.C. Musgrove, D.C. Dever et al. Cloning, sequencing, and expression ofhuman gonadotropin-releasing hormone (GnRH) receptor, Biochem Biophys Res Com-mun 1992; 189: 289–295
10. 10. S.S. Kakar, S.J. Winters, W. Zacharias et al. Identification of distinct gene expressionprofiles associated with treatment of LbetaT2 cells with gonadotropin-releasing hormoneagonist using microarray analysis. Gene 2003; 308: 67–77
32 LHRH Receptor Targeted Therapy for Breast Cancer 295

11. P. Thomas, P.L. Mellon, J. Turgeon et al. The L beta T2 clonal gonadotrope: a model forsingle cell studies of endocrine cell secretion. Endocrinology 1996; 137: 2979–2989
12. G.Y. Bedecarrats, K.D. Linher, J.A. Janovick et al. Four naturally occurring mutationsin the human GnRH receptor affect ligand binding and receptor function. Mol CellEndocrin 2003; 205(1–2), 51–64
13. A. Mangia, S. Tommasi, S.J. Reshkin et al. Gonadotropin releasing hormone receptorexpression in primary breast cancer: comparison of imunohistochemical, radioligand andWestern blot analyses, Oncol Rep 2002; 9(5): 1127–1132
14. T.Moriya, T. Suzuki, M. Pilichowska et al. Immunohistochemical expression of gonado-tropin releasing hormone receptor in human breast carcinoma. Pathol Int 2001; 51(5):333–337
15. M. W. Qian, J.W. Eaton. Iron translocation by free fatty acids, Am J Path 1991; 139(6):1425–1434
16. S.S. Kakar. Inhibition of growth and proliferation of EcRG293 cell line expressing high-affinity Gonadotropin-releasing hormone (GnRH) receptor under the control of aninducible promoter by GnRH agonist (D-Lys6)GnRH and antagonist (Antide). CancerRes 1998; 58(20): 4558–4560
17. Z. Yu, H.L. Persson, J.W. Eaton et al. Intralysosomal iron: a major determinant ofoxidant-induced cell death. Free Rad Biol Med 2003; 34(10): 1243–1252
18. H.L. Persson, Z. Yu, O. Tirosh et al. Prevention of oxidant-induced cell death bylysosomotropic iron chelators. Free Rad Biol Med 2004; 34(10): 1295–1305
19. U.T. Brunk, J. Neuzil, J.W. Eaton. Lysosomal involvement in apoptosis, Redox Rep2001; 6(2): 91–97
296 S.S. Kakar et al.

Part VIII
Translational and Clinical Studies

Chapter 33
Saturation of Hemoglobin in Intracranial Arteries
is Similar in Patients with Hemodynamically
Relevant and Irrelevant Stenosis of the Internal
Carotid Artery
U. Jensen1, S. Wolff2, K. Alfke2, K. Borsch1, O. Jansen2, and R. Stingele1
Abstract The aim of this study was to establish if patients with hemodynami-cally relevant or irrelevant stenoses of the extracranial internal carotid arteryhave different intracranial arterial oxygen saturation as measured by transcra-nial pulse oximetry using near infrared spectroscopy.
Patients with unilateral stenosis�70% according to North American Symp-tomatic Carotid Endarterectomy Trial (NASCET) were included. Hemody-namic relevance was assessed using ultrasound criteria. Transcranialspectroscopy recordings were taken before and after surgical or interventionaltreatment of the stenosis. Optodes were placed bilaterally on the intact fronto-parietal aspect of the skull. Oxygen saturation and diversion angle alpha fromthe hemoglobin plane were measured.
There were no significant differences regarding arterial oxygen saturationbetween the two groups. Oxygen saturation ranged from 0.910 � 0.08 to 0.957 �0.028 in the subgroups (all values asmean� S.E.). These values are consistent withprevious studies and theoretical values. In smokers we found a significantly shifteddiversion angle from the hemoglobin plane to the negative side. This indicates thepresence of an absorber other than oxy- and desoxyhemoglobin in the optical field.
We conclude that transcranial pulse oximetry cannot distinguishbetweenpatientswith hemodynamically relevant and irrelevant stenosis of the internal carotid artery.However it seems to be capable of distinguishing smokers from non-smokers.
33.1 Introduction
Transcranial pulse oximetry (TCO) using near infrared spectroscopy (NIRS) isa method used to detect desaturation of hemoglobin in the arterial vessels of thebrain. It was demonstrated that it detects failure of collateral blood flow in
1Department of Neurology, University of Kiel, Schittenhelmstr. 10, 24105 Kiel, Germany.2Section of Neuroradiology, University of Kiel, Schittenhelmstr. 10,24105 Kiel, Germany.Corresponding author: U. Jensen, e-mail address: [email protected], Tel.: + 49-431-5978550; Fax: + 49-431-5978502
K.A. Kang et al. (eds.), Oxygen Transport to Tissue XXIX� Springer 2008
299

patients with impaired blood supply [1]. We tested the possiblity to assess the
hemodynamical relevance of stenosis of the internal carotid artery (ICA).
Additionally we investigated the influence of smoking on the near infrared
pulse oximetry.
33.2 Material and Methods
33.2.1 Near Infrared Spectroscopy
With each cycle of the heart there is a pulsatile change of blood volume in the
intracranial arteries. Venous vessels and capillaries do not change their volume.
This leads to a pulsatile change in infrared absorption since hemoglobin is a
strictly intravascular near infrared chromophore [2]. The pulsatile changes of
blood volume lead to pulsatile changes of NIR-absorbance that were measured
at 3 wavelengths with 10 Hz acquisition frequency. A plot of the absorption
values against each other is given in Fig. 33.1. Each datapoint represents a triple
of absorption values at one point in time. In such a three wavelength-plot,
absorption changes in time along a straight line. The straight lines in Fig. 33.1
represent the theoretical absorption values with saturation 1 and 0, respectively.
These theoretical lines span a plane in the 3-D plot (termed hemoglobin plane)
that contains all absorption values that can be explained by any arterial oxygen
905 nm
769 nm
HbH
HbO
850 nm
Fig. 33.1 Oxygen saturation of 0.89 recovered from a recording of a patient. Note the twovectors for desoxy- (HbH) and oxyhemoglobin (HbO) spanning the hemoglobin plane.
300 U. Jensen et al.

saturation. The line resulting from the linear fit of the measured absorptionvalues is analyzed in two ways: First, the projection of the line onto thehemoglobin plane is used to calculate the arterial oxygen saturation, asdescribed before (1). Second, the angle formed by the measured line with thehemoglobin plane (alpha) is calculated to quantify how well the observedabsorption values are explained by oxy- and deoxy-hemoglobin in the opticalfield. If pulsatile absorption changes are due to these absorbers only the anglealpha is 0. An angle alpha 6¼ 08 means that other absorbers than oxy- ordesoxyhemoglobin are present intraarterially.
As a first step the received scattered clouds of datapoints had to be reducedto the main vector. This was done by principal component analysis [3]. Thesecond step required a coordinate system transformation. Graphically itincluded stretching and rescaling of the hemoglobin plane [4]. The last stepwas a recovery of the oxygen saturation by trigonometric calculation using Eq.(33.1) in which b represents the angle formed by the main resulting vector andthe new x-axis of the coordinate system.
Saturation ¼ 1þ tan bð Þð Þ�1 (33:1)
For details regarding the different steps and the technique itself see literatureon TCO using NIRS [1,2].
Additionally a goodness of fit (GOF) using multiple correlation was calcu-lated for every recording [5]. It ranges between 0 and 1 and is an indicator for thequality of the recording. A goodness of fit of 1 indicates a perfect measurementwith no diversion of the datapoints from the main vector formed in 3D-spaceduring the recording. A GOF of 0 indicates a bad measurement with nocorrelation of the scattered datapoints over time.
33.2.2 Apparatus
TCO using NIRS (OXYMON spectroscope, University of Nijmegen, three wave-lengths: 769, 850, 905 nm, 10 Hz sampling frequency, 2 channels) was used. TCOwas performed before and after angioplasty with stent or surgery. Optodes wereplaced over both hemispheres simultanously. Source-detector distance was 55mm.Patients were asked not to speak, move, and to breathe normally and externalconditions were kept constant during the recording. Each recording consisted of anarterial saturation and an angle alpha. The received signals were bandpass-filtered.
33.2.3 Subjects
The 21 patients with unilateral extracranial stenosis of the ICA were examined.Inclusion criteria were a symptomatic stenosis � 70% according to NASCET.Stenosis were categorized prospectively in hemodynamically relevant (group 1)
33 Hemoglobin Saturation in Patients with Stenosis of the ICA 301

and irrelevant (group 2) stenosis according to ultrasound criteria. Featuresassessed by ultrasoundwere bloodflow velocity in the ipsilateral middle cerebralartery and the presence of collateral bloodflow. After the treatment patientswere again evaluated by ultrasound to rule out restenosis or insufficient treat-ment. In addition patients were categorized as smokers and non-smokers toassess the possibility to detect the presence of carboxyhemoglobin in the opticalfield. Participants were informed in oral and written form about the nature ofthe study. Informed consent was obtained from all participants and the experi-ment was approved by the local Ethical Committee.
33.3 Results
Only measurements with a GOF � 0.9 were taken into account. All patientswere treated successfully. Values are given as mean� S.E. In group 1, 9 patients(? = 9, age: 67.22 � 6.83 years) were included before and 6 patients (/ = 6,age: 66.17� 6.46 years) after treatment. In group 2, 10 patients (? =9, / =1,age: 67.8 � 9.21 years) were included before and 10 patients (same group) aftertreatment. 16 patients (? = 15, / = 1, age: 67.19 � 8.09 years) were includedbefore and after treatment. 6 smokers and 13 non-smokers could be identified.
No statistically significant differences were found between group 1 andgroup 2, before and after the treatment and between the affected and unaffectedhemisphere (p > 0.05, all comparisons with Wilcoxon-Mann-Whitney U-test,see Table 33.1).
All smokers’ hemispheres (n= 22) had a smaller angle alpha (–0.291� 3.78)compared to non-smokers’ hemispheres (n = 48, 1.38 � 3.738, p < 0.05). Thisdifference was present in all hemispheres (�1.325 � 3.558, 2.6 � 3.068,p < 0.001), affected (�2 � 2.278, 2.8 � 1.898, p < 0.001) and not-affectedhemispheres (-0.645 � 4.648, 2.4 � 3.998, p < 0.05) in smokers (n = 12, n = 6)and non-smokers (n = 26, n = 13) but only before the treatment. After thetreatment this difference disappeared (p > 0.05, all comparisons withWilcoxon-Mann-Whitney U-test).
33.4 Discussion
Our results show that TCO is not able to distinguish hemodynamically relevantfrom irrelevant stenosis of the ICA if this dichotomization is performed usingultrasound criteria. We conclude that oxygen saturation in patients with hemo-dynamically relevant and irrelevant stenosis of the ICA is similar. Previousstudies using this method showed decreased oxygen saturation in intracranialarteries in situations with bad collateral blood supply [1]. Therefore TCO can beregarded as a method sensitive to failure of collateral blood supply. The valuesof intracranial oxygen saturation are consistent with theoretical values andvalues found in previous studies in healthy volunteers and patients with stenosis
302 U. Jensen et al.

Table 33.1 Results of the subgroups for oxygen saturation and angle alphay
Group 1 before Group 2 before Group 1 after Group 2 after
affectedz normal{ affected normal affected Normal affected Normal
sO2 0.94�0.05 0.91�0.08 0.95�0.05 0.92�0.06 0.94�0.04 0.94�0.04 0.95�0.04 0.96�0.03alpha 1.33�2.67 2.39�4.56 1.24�3.44 0.59�4.15 0.83�3.48 1.4�2.97 -0.6�3.67 0.21�4.89y: angle alpha in degreesz: affected side{: not affected side
33
Hem
oglobin
Saturatio
nin
Patien
tswith
Sten
osis
oftheIC
A303

of the ICA but intact collateral blood supply [1,6,7]. In the patients presentedhere collateral blood supply was still sufficient to allow for normal intraarterialsituations. Smokers have a smaller angle alpha. This can be explained by largeramounts of carboxyhemoglobin in the blood of smokers [8]. The probable causeof the normalisation after the treatment is the drop of concentration of carbox-yhemoglobin due to less tobacco consumption during hospitalisation.
References
1. R. Stingele, H. Schnippering, E. Keller, T. Steiner, and W. Hacke, Transcranial pulseoximetry using fast near infrared spectroscopy can detect failure of collateral blood supplyin humans, Comp. Biochem. and Physiol. Part A 134, 539–543 (2003).
2. J. W. Severinghaus and Y. Honda, Pulse oximetry, Int. Anesthesiol. Clin. 25, 205–214(1987).
3. N. A. Gershenfeld, The Nature of Mathematical Modeling (Cambridge University Press,Cambridge, 1999).
4. G. Strang: Introduction to Linear Algebra (Wellesley Cambridge Press, 1998).5. L. Sachs In: Angewandte Statistik, edited by L. Sachs (11. ed., Springer, Heidelberg, 2003),
pp. 571–580.6. A. S. Popel, Theory of oxygen transport to tissue, Crit. Rev. Biomed. Eng. 17, 257–321
(1989).7. M. Sharan, M. D. Jones Jr., R. C. Koehler, R. J. Traystman, and A. S. Popel, A compart-
mental model for oxygen transport in brainmicrocirculation, Ann. Biomed. Eng. 17, 13–38(1998).
8. A. Deller, R. Stenz, K. Forstner,M. N. Schreiber, F. Konrad, and T. Fosel, Carbomonoxy-hemoglobin and Methemoglobin in patients with and without a smoking history duringambulatory anesthesia, Anesthesiol. sIntensivmed. Notfallmed. Schmerzther. 26 (4),186–190 (1991).
304 U. Jensen et al.

Chapter 34
A Three-tiered Approach for Calibration
of a Biosensor to Detect Estrogen Mimics
Sarah A. Andres, D. Alan Kerr II, Stefanie B. Bumpus, Traci L. Kruer,
Joshua W. Thieman, Irina A. Smolenkova, and James L. Wittliff1
Abstract A three-tiered approach was developed to determine the influence of
a chemically-diverse group of compounds exhibiting estrogen mimicry using
recombinant human estrogen receptor (rhER) activity to calibrate a receptor
protein-based biosensor. In the initial tier, a ligand competition array was
developed to evaluate compounds inhibiting [3H]estradiol-17b binding to
rhER. Each of six different concentrations of [3H]estradiol-17b was mixed
with increasing concentrations of an unlabeled putative mimic. Each of these
mixtures was incubated with a constant amount of rhERa and then receptor-
bound [[3H]estradiol-17b was measured. This array protocol analyzes ligand
binding affinities of hERa with a potential inhibitor over the entire range of
receptor protein saturation.When either hERa or hERb binds to an estrogenic ligand, the receptor
monomer forms both homo- and hetero-dimers. Then the ligand-receptor
dimer complex activates transcription by associating with an estrogen response
element (ERE), which is a specific DNA sequence located upstream of estrogen-
responsive genes. The second tier for ligand evaluation utilized an electrophore-
tic mobility shift assay (EMSA), which was performed with an ERE sequence
labeled with [a[32]P]dATP and incubated with rhER in the presence or absence
of unlabeled ligand. ERE-hER complexes were separated by electrophoresis
and analyzed using phosphor imaging technology.To assess biological effects of an estrogen mimic on expression of an
ER-target gene, a yeast cell-based bioassay was constructed with recombinant
DNA technology using Saccharomyces cerevisiae. Each of these engineered
yeast cells contained a rhERa expression plasmid (YEpE12) and a separate
reporter plasmid (YRG2) containing an ERE sequence upstream of a
b-galactosidase reporter gene. Incubation of these yeast cells with an estro-
genic compound allows formation of ligand-hERa complexes, which
1Sarah A. Andres, D. Alan Kerr II, Stefanie B. Bumpus, Traci L. Kruer, JoshuaW. Thieman,Irina A. Smolenkova, and James L. Wittliff, Department of Biochemistry & MolecularBiology, University of Louisville, Louisville, KY 40292 USA.
K.A. Kang et al. (eds.), Oxygen Transport to Tissue XXIX� Springer 2008
305

recognize the ERE sequence regulating b-galactosidase expression. Estrogeniccompounds, which were evaluated as calibrators for ligand-based and ERE-
based biosensors, elicit varying responses in each of the three tiers of the
protocol.
34.1 Introduction
Estrogen plays a crucial role beginning with conception and continuing through
normal development, as well as in many health-related events, e.g., prevention
of cardiovascular diseases, osteoporosis and treatment of cancer [1,2]. Many
substances in the environment, such as phytoestrogens and mycoestrogens, as
well as man-made therapeutic estrogens and certain industrial pollutants, may act
as estrogen mimics [3,4]. Exposure to endocrine disrupting compounds has
recently emerged as a major public health concern due to potentially hazardous
effects through their interaction with steroid hormone receptors and their target
pathways. Determination of the extent of estrogen mimicry by environmental
compounds is essential to estimate risk/benefit ratios in both human and animal
populations.An evanescent biosensor (EndotectTM) was developed jointly with IA, Inc./
Threefold Sensors (Ann Arbor, MI) for screening compounds exhibiting
potential estrogen mimicry effects [5–7]. This biosensor utilizes laser-based
fiber optics with Cy5-labeled recombinant human estrogen receptor-a(rhERa) as a probe for either ligand or estrogen response element-based
fibers. Calibration of the biosensor by independent methodologies, e.g, ligand
binding and ERE recognition, as well as biological response is necessary to
insure accuracy of mimic detection. The long-term objective is to utilize the
biosensor to identify molecules with either hormone-stimulating or disrupting
properties before human exposure so that rational assessment of risk/benefit
ratios may be evaluated.
34.2 Methods
34.2.1 Expression of Human Estrogen Receptor-�
Saccharomyces cerevisiae strain BJ3505, transformed with expression vector
YEpE12 containing the hERa gene, was expressed as an ubiquitin fusion under
the control of a CUP1 promoter [8,9]. Lysates were separated into pellet and
extract containing hERa by centrifugation at 40,000 rpm for 45 min at 48C and
purified by various modes of chromatography.
306 S.A. Andres et al.

34.2.2 Ligand Competition Array
A ligand competition array performed in both the presence and absence of a
compound suspected of estrogen mimicry was employed [10]. Each of six differ-
ent concentrations of [[3H]estradiol-17b was mixed with increasing concentra-
tions of a putative mimic, and the mixture was incubated with rhERa for 16 hr at
48C. Then receptor-bound [[3H]estradiol-17b was measured in a scintillation
counter. Each curve describing the binding isotherm (Fig. 34.1, B-H) represents
results from assays in which an unlabeled candidate mimic were added to
increasing concentrations (a-f) of [3H]estradiol-17b. Curve A represents total
binding of [3H]estradiol-17b to both receptor and non-receptor proteins in the
absence of unlabeled candidate competitor. Curve I represents radiolabeled-
ligand binding in the presence of excess unlabeled diethylstilbestrol, which serves
as a measure of low affinity, non-specific binding (i.e., the control). By solving
differences in binding curves (A-H), specific binding capacities and affinities of
[3H]estradiol-17b were calculated in the presence of unlabeled test compound
from an array of binding isotherms. This allowed identification of the activity of
an estrogen mimic, as well as detection of mimic-induced alterations in affinity
constants of [3H]estradiol-17b binding using Lundon One-Site1 and GraphPad
Prism1 software (calculations I & II). Calculation III designates experimental
results used to directly generate ligand competition curves with Lundon Com-
pete1 and GraphPad Prism1 software. The IC50 value of an unlabeled test
compound was used to estimate relative affinity according to the following
equation:
A
BCDEFG
H
I
a b c d e f
LIG
AN
D B
OU
ND
[LIGAND]
III, Competition Analysis• Analyzed with Compete® & Prism® software
I , Ligand TitrationAnalysis (Control)
II, Ligand TitrationAnalysis (with competitor)
• Both Analyzed with OneSite®
& Prism® Software
Fig. 34.1 Schematic of the ligand competition array protocol for analyzing competition of acandidate compound for the human estrogen receptor. Adapted from Raffelsberger andWittliff [10].
34 A Three-tiered Approach for Calibration of a Biosensor 307

Kdunknown ¼ Kdreference � IC50unknownð Þ=IC50reference (34:1)
34.2.3 Electrophoretic Mobility Shift Assays
Double-stranded ERE sequences (i.e., VitA2, pS2, h-fos, jun and cathepsin D),were radiolabeled using DNA Polymerase I Large (Klenow) fragment in 1XKlenow buffer (Promega), 5% b-mercaptoethanol (Sigma), 750 mM dCTP,dGTP and dTTP (Promega) and 1.25 mM [a[32P]dATP (800 Ci/mmol, PerkinElmer) [8,9]. Each reaction was incubated at 378C for 30 min, followed bygravity-flow separation through a NICK column (Amersham). Poly (dI-dC)(50 ng, Amersham), 10 mMKCl & 1% glycerol were added to 40 mMTris-HClbuffer, pH 8.0, containing 500 mM PMSF and 10 mM monothioglycerol [8,9].rhER preparations were incubated with a candidate estrogen mimic for 30 min,48C. Labeled ERE was then added to each reaction and incubated overnight at48C. Electrophoresis was performed as described previously using non-dena-turing PAGE with 0.5x TBE running buffer [8,9]. Gels were dried and exposedto phosphor screens (Perkin Elmer) overnight, and bands representing[32P]ERE-protein complexes and free [32P]ERE were visualized, quantifiedand analyzed using a Cyclone Storage Phosphor System with OptiQuant1
software (Perkin Elmer).
34.2.4 Cell-based Bioassay
Saccharomyces cerevisiae (BJ3505) containing both a plasmid encoding hERa(YEpE12) and a reporter plasmid (YRG2) containing an ERE driving theexpression of b-galactosidase (Fig. 34.2) were grown in YNBD medium with-out tryptophan in an orbital shaker at 308C overnight in a 100 ml culture [1,11].The following morning rhER expression was induced with 100 mMCuSO4, andthe culture was divided into 5ml mini-cultures, each of which was treated with atest compounds for 4 hr. Mini-cultures were then centrifuged, and each pelletwas resuspended in Z-Buffer (50 mM Na2HPO4/NaH2PO4 buffer pH 7.0, 10mM KCl, 1 mM MgSO4 and 50 mM 2-mercaptoethanol), and the cell densitywas measured in a spectrophotometer at 600 nm. Cells were then lysed byaddition of 0.4% N-lauroyl sarcosine in Z buffer. b-Galactosidase activitywas determined after addition of 2.6 mg/ml ONPG. When sufficient yellowproduct had formed, reactions were terminated by the addition of 625 mMNa2CO3. Reactions were analyzed in a spectrophotometer at wavelengths of420, 550 and 600 nm. Miller units were calculated with the following equation:
U ¼ 1000� OD420ð Þ � 1:75�OD550ð Þ½ �f g= tð Þ � vð Þ OD600ð Þ½ � (34:2)
308 S.A. Andres et al.

Where: t = time of reaction (min)v = volume of culture in assay (ml)OD600 = cell density at the start of assayOD420 = combination of absorbance by ONP & light scattering by cell
debrisOD550 = light scattering by cell debris
34.3 Results and Discussion
When a compound is selected as a calibrator candidate for the biosensor, it isevaluated initially in the ligand competition array. This allows analyses of
ligand binding capacities over the entire range of steroid hormone receptorsaturation. A series of ligand binding isotherms is developed for eachconcentration of competitor candidate and analyzed independently for specific
binding to rhERa. Then competition curves are created at each concentrationof [3H]estradiol-17b (Fig. 34.3) over a broad range receptor saturation. As
shown in Fig. 34.3, the Ki value determined at 0.35 nM [3H]estradiol-17b(below saturation) was comparable to that observed at 2.5 nM [3H]estradiol-17b, which represents a saturating concentration of labeled ligand. Each compe-
tition curve is analyzed independently and binding affinities for the competitorcandidate are calculated using data obtained from each curve (Fig. 34.4). These
ligand-binding affinities of calibrator estrogen mimics are then correlated withsensor-gram data obtained from the biosensor using the ligand-based optic fiber.
The next tier for evaluating a calibrator candidate utilizes both ligand- andDNA-binding characteristics of rhERa. Briefly, ligand association with rhERaallows the complex to interact with ERE sequences appearing upstream ofestrogen responsive genes encoded in DNA. Assessment of a compound’s
YEpE12
Cup1 UB hER
hER-E2
Estradiol-17ß
ERE ß-Gal
Transcription
Putative E2 Mimic
β-Gal
hERprotein
YRG2
CuSO4
?
Fig. 34.2 Schematic of the yeast cell-based bioassay for analysis of an estrogen mimic.Adapted from Wittliff and Raffelsberger, 1995.
34 A Three-tiered Approach for Calibration of a Biosensor 309

influence on these binding activities is required to calibrate the biosensor and
ERE-based optic fiber. Figure 34.5 shows alteration in rhERa-ERE complex
migration due to association of the receptor protein with tamoxifen, an man-
made, pharmacologically-active estrogen mimic [1,2]. While certain estrogen
mimics induce a downward shift in the migration profile, indicating a more
compact conformation of the rhER-ERE complex, other mimics induce an
upward shift indicative of a less compact conformation. Results such as those
shown in Fig. 34.5A and B may be quantified using the densitometric profiles,
which also reflect rhER-ERE complex differences with and without a compe-
titor candidate. Titration results of estrogen mimic-hERa complexes with an
ERE sequence, when compared to that of estradiol-liganded ER-ERE
TAMOXIFEN / [3H]ESTRADIOL-17β0 1 10 100 1000
0
20
40
60
80
100
Kd = 7.5 E-9 MRBA = 0.61
Fig. 34.4 Representative graph depicting the results from eight independent competitionanalyses of tamoxifen inhibition of [3H]Estradiol-17b to rhERa. Each point represents thecollective results from an experiment performed with the ligand competition array. Note thatthe affinity calculated from this analysis is slightly different from that of the individualanalyses.
Competition Curve
–9.5 –8.5 –7.5 –6.5 –5.5–25
0
25
50
75
100
125
log [competitor]
% S
pec
ific
Bin
din
g
Competition Curve
–9.5 –8.5 –7.5 –6.5 –5.5–25
0
25
50
75
100
125
log [competitor]
% S
pec
ific
Bin
din
g Ki = 4.4 E-8 MKi = 2.4 E-8 M
Fig. 34.3 Representative competition curves performed at different levels of rhERa satura-tion: 0.35 nM [3H]Estradiol-17b (left) and 2.5 nM [3H]Estradiol-17b (right).
310 S.A. Andres et al.

complexes, allows estimation of relative binding affinities for calibration of the
ERE-based optic fiber of the biosensor.The cell-based bioassay encompasses the activities of the entire estrogen recep-
tor transcriptional complex, including ligand binding to the rhERa protein, its
associationwith the ERE sequence, recruitment of transcription factors, aswell as
the expression of a target gene [1,2]. The yeast cell expression system, described in
Fig. 34.2, provides transcriptional machinery that is highly conserved between
mammals and Saccharomyces, and therefore is considered relevant to the
+ Tam -Tam
A B
Fig. 34.5 Representative EMSA results illustrating the different migration of the ER-EREcomplex in the presence (A) and absence (B) of tamoxifen. Migration is quantified in thedensitometric profile on the right. Peak A represents the ER-ERE complex in the presence oftamoxifen, while peak B represents the complex without ligand. Peak C (not shown on gel) isutilized as an alignment control between lanes on the EMSA gel.
Unt
reat
edVe
hicl
e
1nM
Est
radi
ol-1
7β1 n
M E
stro
ne10
nM
Est
rone
1 nM
Eth
ynyl
Est
radi
ol
1 nM
Cou
mes
trol
10 n
M C
oum
estr
ol1 n
M T
amox
ifen
100 n
M T
amox
ifen
0102030405060708090
100110
% o
f β-
Gal
acto
sid
ase
Ind
uct
ion
by
1 n
M E
stra
dio
l-17
β
Fig. 34.6 Representativeanalysis of five knownestrogenic compounds usingthe cell-based bioassay.
34 A Three-tiered Approach for Calibration of a Biosensor 311

examination of the human estrogen response mechanism [9,11]. Addition ofknown estrogenic compounds to the growth media allows formation ofliganded-hERa complexes, which subsequently associate with the ERE sequenceregulating expression of the b-galactosidase reporter gene. Figure 34.6 illustratesthe relative effects of five known estrogenic compounds [1–4] compared to theactivity of estradiol-17b. Results shown correlate with the known properties invivo of these compounds to induce gene transcription in mammals [1]. This cell-based bioassay provides essential results for calibration of the biosensor andconfirms the results obtained with the estrogen mimic candidate from of theligand competition array and the EMSA experiments.
34.4 Summary and Conclusions
A three-tiered approach using recombinant human ER-based analyses wasemployed for calibration of a fiber-optic biosensor that will be used to identifyestrogen mimics in environmental samples. Each tier evaluates a specific modeof ER action, such as ligand binding, ERE sequence recognition and inductionof transcriptional activity. Using ligand competition arrays, apparent dissocia-tion constants of mimic candidates were generated and utilized to calibrateligand-based fiber measurements. EMSA results using rhERa in the presenceand absence of mimic candidate identified ligands that altered rhER-EREcomplex migration, which may be correlated with biosensor measurementsusing the ERE-based fiber. Results from the cell-based bioassay were used asa confirmation of estrogen mimicry derived from the ligand competition arrayand EMSA, as well as determined alterations in target gene expression inducedby a suspected estrogenmimic. Collectively, this three-tiered approach providesa broad spectrum of analyses for biosensor calibration to ensure its utility indetecting and characterizing compounds with estrogenic activities.
Acknowledgment Supported in part by grants NIEHS/SBIR #1R43-ES10076-01,#2R44-ES10076-02, USAID CFDA No.98.009 & the Phi Beta Psi Charity Trust. SAA &DAK are recipients of IPIBS Fellowships from the University of Louisville. SBB is a recipientof a Fellowship from NCI 5R25CA44789.
References
1. J. L. Wittliff and W. Raffelsberger, Mechanisms of Signal Transduction: Sex Hormones,Their Receptors, and Clinical Utility, J. Clin. Ligand Assay 18(4), 211–235 (1995).
2. J. L.Wittliff, R. Pasic, K. I. Bland, In: The Breast: ComprehensiveManagement of BenignandMalignant Diseases, edited byK. I. Bland and E.M. Copeland III (W.B. Saunders Co., Philadelphia, 1998), pp. 458–498.
3. T. Colburn, C. Clement, Chemically-Induced Alterations in Sexual and FunctionalDevelopment: The Wildlife/Human Connection (Princeton Sci. Publ. Co., 1992), pp. 403.
312 S.A. Andres et al.

4. B. Gutendorf and J. Westendorf, Comparison of an Array of in vitro Assays for theAssessment of the Estrogenic Potential ofNatural and Synthetic Estrogens, Phytoestrogensand Xenoestrogens, Toxicology 166(1–2), 79–89 (2001).
5. R. H. Smith, W. J. Lemon, J. L. Erb, J. R. Erb-Downward, J. G. Downward, O. E.Ulrich, and J. L. Wittliff, Development of Kinetic Ligand-binding Assays Using a FiberOptic Sensor, Clin. Chem. 45(9), 1683–1685 (1999).
6. E. A. E. Garber, J. L. Erb, J. G. Downward, E. M. Priuska, J. L. Wittliff, W. Feng,J. Magner, and G. L. Larsen, Biosensor, ELISA, and Frog Embryo Teratogenesis Assay:Xenopus (FETAX) Analysis ofWater Associated with FrogMalformations inMinnesota,Proc. Soc. Photo-Optical Instrumentation Engineers (SPIE) 4206, 147–158 (2001).
7. J. L. Erb, E. A. E. Garber, J. G. Downward IV, and E.M. Priuska, Data from an EstrogenReceptor-based Biosensor Correlates with Evidence of Frog Malformation andDemonstrates a Differential Response of hERa & b to Beneficial and Harmful EstrogenicCompounds, In: Proc. 2nd Intl. Conf. Pharmaceuticas & Endocrine Disrupting Chemicalsin Water, p. 203–217, Westerville, OH, The National Ground Water Association (2001).
8. J. L. Wittliff, L. L. Wenz, J. Dong, Z. Nawaz, and T. R. Butt, Expression and Character-ization of anActive EstrogenReceptor as aUbiquitin Fusion Protein fromEscherichia coli,J. Biol. Chem. 265(35), 22016–22025 (1990).
9. K. Graumann, J. L. Wittliff, W. Raffelsberger, L. Miles, A. Jungbauer, and T.R. Butt,Structural and Functional Analysis of N-terminal Point Mutants of the Human EstrogenReceptor, J. Steroid Biochem. Mol. Biol. 57(5–6), 292–300 (1996).
10. W. Raffelsberger and J. L. Wittliff, A Novel Approach for Comparing Ligand BindingResults from Titration and Competition Analyses to Study Hormone Mimics, J. Clin.Ligand Assay 20(4), 275–280 (1997).
11. C. R. Lyttle, P. Damian-Matsumura, H. Juul, and T. R. Butt, Human Estrogen ReceptorRegulation in a Yeast Model System and Studies on Receptor Agonists and Antagonists,J. Steroid Biochem. Mol. Biol. 42(7), 77–685 (1992).
34 A Three-tiered Approach for Calibration of a Biosensor 313

Chapter 35
Biosensors for Detecting Estrogen-like Molecules
and Protein Biomarkers
James L. Wittliff1, Sarah A. Andres1, Traci L. Kruer1, D. Alan Kerr II1,
Irina A. Smolenkova1, and Judith L. Erb2
Abstract A novel evanescent-based biosensor (EndotectTM, ThreeFold Sen-sors, Inc.) was developed with laser-based fiber optics using fluorescent dye-labeled recombinant human estrogen receptor-a (rhERa) and hERb as probes.A three-tiered approach evaluating various steps in the formation of the estro-gen-receptor complex and its subsequent activity was developed for instrumentcalibration to detect estrogen mimics in biological samples, water and soil.Using this approach, binding affinities and activities of certain known estrogenmimics were determined for their use as calibrator molecules. Results indicatedrhERa and rhERb may be employed as probes to distinguish estrogen mimicswith a broad range of affinities. In addition, application of the biosensor fordetecting DNA-binding proteins in human tissue extracts was demonstrated.The later studies suggest the biosensor may be used as a clinical laboratory toolfor assessing tumor marker proteins.
35.1 Introduction
Estrogen mimics used in clinical management of breast cancer and osteoporo-sis, e.g. Tamoxifen and Raloxifene respectively, mediate their therapeuticeffects through direct interaction with estrogen receptor proteins. Determina-tion of the extent of estrogen mimicry by new generations of these drugs as wellas estrogenic compounds encountered in the environment (endocrine disruptorcompounds, EDCs) is essential to estimate risk/benefit ratios.
The effects of putative EDCs on the reproductive functions of human andanimal species has become an area of intense concern [1]. The EnvironmentalProtection Agency (EPA) has been mandated by Congress to develop a plan fortesting some 87,000 chemicals known to be present in the environment to
1Department of Biochemistry &Molecular Biology, Institute forMolecular Diversity &DrugDesign, University of Louisville, Louisville, KY USA.2IA, Inc./ThreeFold Sensors, Ann Arbor, MI, USA.
K.A. Kang et al. (eds.), Oxygen Transport to Tissue XXIX� Springer 2008
315

determine their potential for producing endocrine disruption. In response tothis mandate, the Endocrine Disruptor Screening and Testing Advisory Com-mittee (EDSTAC) was created by the EPA and has issued recommendations fora multi-tier screening program to be executed on 15,000 chemicals beginning in1999. Tier 1 screening involves assessment of the effects of test compounds onestrogen receptor mediated functions. Additional EDC activities may be due tocancer therapeutics, such as tamoxifen, which was designed to exert endocrinedisrupting effects, useful in treating certain reproductive cancers [2]. A thor-ough understanding of the mechanisms by which each type of effect occurs isrequired in order that informed regulatory decisions may be made, and usefulnew drugs may be developed for treating reproductive cancers.
Evidence supporting an aggressive testing program for endocrine disruptorssuggests that the reproductive functioning of both animal and human species isbeing adversely affected and that environmental exposure to chemicals is likelyto be involved [1]. In response to this need, a novel biosensor (EndotectTM,ThreeFold Sensors, Inc.) was developed to identify compounds in biologicalsamples which contained EDCs, such as estrogen mimics [3–5].
The physical principles of operation of the sensor instrument are explained indetail in previous publications [3–5]. The biosensor technology utilizes anevanescent field generated on the surface of an optical fiber held in a cartridge.The fiber surface possesses covalently-linked molecules (e.g., steroids, EREsequences, antibodies), to which the molecules of interest are attracted. In thecase of the biosensor described, this is either Cy5-labeled recombinant hERa orhERb proteins. When the fluorophore-labeled molecules are attracted to theligand on the fiber surface, the fluorophore will be excited by the evanescentfield upon binding. Because of the nature of the evanescent field [3–5], fluor-ophore-labeled molecules in the surrounding solution are not excited, thuskinetic analyses becomes possible.
35.2 Methods
35.2.1 Biosensor
The essential feature of the fiber-optic evanescent biosensor is confinement offluorescence sensing to the immediate surface of an optical fiber. It takesadvantage of the evanescent field produced by total internal reflection of lightpropagating within the fiber, as described by Hirchfield [6]. Figure 35.1Aillustrates the ligand-based optic fiber, in which estrone-1-glucuronide (E1g)has been chemically attached to the fiber surface. Recombinant hER, acting asthe probe for the biosensor, was fluorescently labeled by incubation with Cy5(Amersham Pharmacia Biotech) for 30 min, and separation of Cy5-hER fromfree Cy5 was performed using a 10DG gravity flow column (Biorad). Cy5-labeled hER is used as a probe in solution, which flows through the cartridge
316 J.L. Wittliff et al.

around the optical fiber. When bound to the ligand E1g on the fiber surface, the
evanescent field excites fluorescence of Cy5-hER. In solution, E1g exhibits an
affinity for rhERawith an apparent Kd value of 2.5� 10[–9M[3]. Figure 35.1B
illustrates the estrogen response element (ERE)-based optic fiber, in which
Vitellogenin A2 ERE (50-GATCCGTCAGGTCACAGTGACCTGATG-30)is bound to the optic fiber in a system similar to that of the ligand-based fiber.
A three-tiered approach was developed with hERa and hERb consisting
of 1) ligand titration and competition arrays [7], 2) gel mobility shift and super-
shift assays [8,9] and 3) yeast cell-based bioassays [10] with various known
estrogen mimics for instrument calibration to detect suspected estrogen mimics
in biological samples, water and soil. The therapeutic tamoxifen associated with
recombinant hERa (Fig. 35.2) with lower affinity (Kd = 0.8–2 � 10–7 M) than
that of hERb (Kd = 3–7 � 10–8 M). Using this approach, binding affinities of
other calibrator substances were determined: 4-Hydroxytamoxifen- 2–4� 10–10
M; Clomiphene- 2–5 � 10–7 M; Ethynylestradiol- 2–5 � 10–10 M; Nafoxidine-
1–3 � 10–8 M; and Raloxifene- 3–8 � 10–10 M.For calibration of the ERE-based fiber, the second tier approach was
employed using electrophoretic mobility shift assays (EMSA) to identify hER
or other proteins that may bind to ERE sequences located upstream of estrogen
receptor target genes. Double-stranded ERE sequences (i.e., VitA2, pS2, h-fos,
jun, cath D), were labeled with [a [32] P]dATP (Perkin Elmer) [8,9]. EMSA
reactions were performed in 40 mM Tris-HCl buffer, pH 8.0, containing 500
1.2 mm ID/1.5 mm OD Glass Capillary Tube
Low index of refraction coatingcovered by black polyimide
Inlet Tube (19 guage)
400µ optical fiber
Flow Outlet
B.A.
~80 µl Sample volume
Fig. 35.1 Schematic of biosensor cartridge illustrating the ligand-based (A) and ERE-based(B) optic fibers.
35 Biosensors for Detecting Estrogen-like Molecules and Protein Biomarkers 317
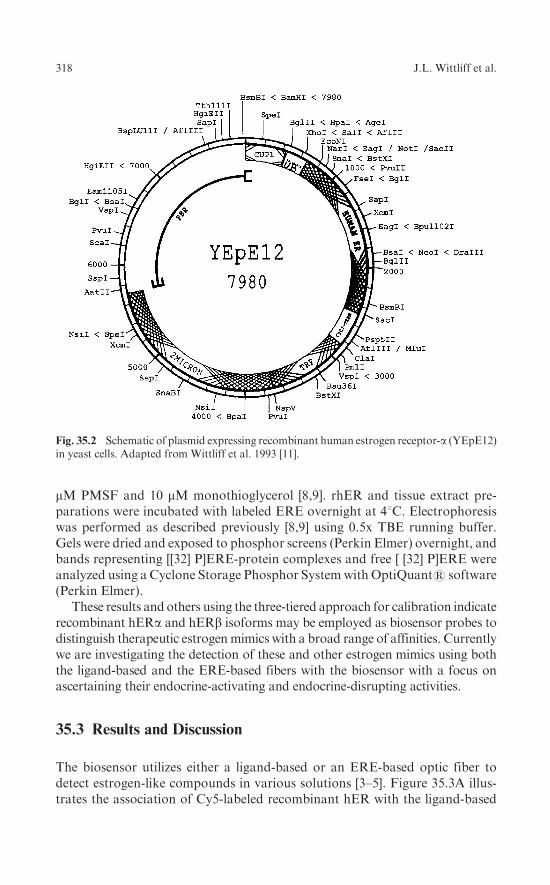
mM PMSF and 10 mM monothioglycerol [8,9]. rhER and tissue extract pre-parations were incubated with labeled ERE overnight at 48C. Electrophoresiswas performed as described previously [8,9] using 0.5x TBE running buffer.Gels were dried and exposed to phosphor screens (Perkin Elmer) overnight, andbands representing [[32] P]ERE-protein complexes and free [ [32] P]ERE wereanalyzed using a Cyclone Storage Phosphor Systemwith OptiQuant1 software(Perkin Elmer).
These results and others using the three-tiered approach for calibration indicaterecombinant hERa and hERb isoforms may be employed as biosensor probes todistinguish therapeutic estrogenmimics with a broad range of affinities. Currentlywe are investigating the detection of these and other estrogen mimics using boththe ligand-based and the ERE-based fibers with the biosensor with a focus onascertaining their endocrine-activating and endocrine-disrupting activities.
35.3 Results and Discussion
The biosensor utilizes either a ligand-based or an ERE-based optic fiber todetect estrogen-like compounds in various solutions [3–5]. Figure 35.3A illus-trates the association of Cy5-labeled recombinant hER with the ligand-based
Fig. 35.2 Schematic of plasmid expressing recombinant human estrogen receptor-a (YEpE12)in yeast cells. Adapted from Wittliff et al. 1993 [11].
318 J.L. Wittliff et al.

fiber producing an increase in fluorescence as detected by the sensor. Theligand-based fiber allows detection of estrogenmimics present in a test solution,which compete for the Cy5-labeled recombinant hER and create a decreasedfluorescence. Figure 35.3B illustrates the competition of a test solution for theERE fiber. The upper curve represents loading of unliganded Cy5-labeledhERa, while the lower curve represents the reaction of Cy5-labeled hERawith an estrogen mimic in a test solution creating diminished fluorescencedetected by the sensor. The sensogram results are converted to relative bindingaffinities using the results of known estrogens and mimics from the three-tieredcalibration approach (Table 35.1).
Using the ERE-based fiber-optic biosensor, protein molecules recognizinghormone response element sequences, such as hERa and hERbmay be detectedin extracts. The sensograms in Fig. 35.4A indicate the presence of ERE-bindingproteins since addition of extracts prepared from two human reference samplesdecreased Cy5-hERa binding to the ERE fiber. Curves a and b represent tworeactions showing association of uncompeted Cy5-hERa (control) with theERE sequence bound to the optical fiber. Curve c represents a reaction inwhich an extract of a reference myometrium specimen exhibited 36% inhibition
Table 35.1 Comparison of Kd values of binding of various estrogen mimics to rhERacalculated from biosensor data and those obtained by standard radioligand binding methods
Competitor Kd obtained from biosensor Kd obtained from radioligand binding
estradiol-17ß 2�10–10 M 1.1�10–10 M
estrone 2�10–8 M 1.8�10–8 M
estriol 2�10–8 M 3.1�10–8 M
DES 2�10–10 M 1.8�10–10 M
zearalenone 2�10–8 M 3.6�10–8 M
tamoxifen 2�10–9 M 1.1�10–9 M
Note: All first digits of the sensor data are 2, because solutions used to determine Kd consistedof concentrations of test compounds which were 2 times some power of 10.
0
2500
5000
7500
10000
pA
mp
flu
ore
scen
ce
4003002001000seconds seconds
-100
0
100
200
300
400
pA
mp
s fl
uo
resc
ence
250200150100500
B.A.
Fig. 35.3 Representative sensograms of Cy5-labeled recombinant human estrogen receptor-aassociating with a ligand-based optic fiber (A) and ERE-based fiber (B) with (upper curve) andwithout (lower curve) competition.
35 Biosensors for Detecting Estrogen-like Molecules and Protein Biomarkers 319

compared to that of the control. Curve d represents a reaction in which anextract of a reference breast cancer specimen exhibited 68% inhibition.
The degree of inhibition by a tissue extract determined from a sensogram(e.g., Fig. 35.4A) is being calibrated against the results of the same sampleobtained by EMSA (e.g., Fig. 35.4B). Preliminary evaluation suggests a goodqualitative relationship between measurements taken by the two methods.However, considerably more analyses of various tissue extracts will be requiredto establish a quantitative relationship. This is due to the physically differentconditions of the ERE-binding reactions, i.e., soluble ERE sequences in theEMSA compared to covalently-bound ERE sequences on the optical fiber.Experiments addressing the latter relationship are in progress with the goal touse the biosensor to detect as well as quantify these new biomarker proteins.
Further examination of these activities in human tissue extracts by EMSArevealed the presence of several species of ERE-binding proteins that appear tobe unrelated to human estrogen receptor. As shown in Fig. 35.4B, referencetissue extracts exhibited varied abundance of these novel ERE-binding proteinsthat migrated more rapidly than that of intact recombinant human ERa.Furthermore, certain cytosols contained ERE-binding protein species with dif-ferent migration properties (e.g., lanes 13). Levels of expression of ERE-bindingproteins were determined by scanning each lane of the EMSA gels and usingOptiquantTM imaging software for quantification after normalization for thetotal protein content [8,9]. There was no apparent correlation between the level
–100
0
100
200
300
400
500
pA
mp
Flu
ore
scen
ce
0 100 200 300 400
seconds
B.
Free ERE
65
ERE-BP
rhERα
A.
a
b
c
d
4321
Fig. 35.4 (A)Representative sensogramdemonstrating the presence of ERE- binding proteinsin extracts of human reference samples of breast tissue. Curves a and b represent loading ofCy5-labeled hERa alone on the ERE-based optical fiber. Curves c and d represent loadingof recombinant hERa in the presence of protein extracts of human reference specimens ofmyometrium (c) and breast cancer (d), showing the decrease in binding indicative ofERE-binding proteins in the tissue preparations. (B) EMSA gel pattern showing migrationand distribution of various ERE-binding proteins (ERE-BP) in extracts of five different(lanes 1–5) breast cancers compared to that of recombinant human ERa (rhERa), confirmingthe results from biosensor measurements.
320 J.L. Wittliff et al.

of ERE-binding protein and the amount of estrogen receptor in a reference tissue
extract, suggesting these proteins recognizing ERE sequences are unrelated toestrogen receptor proteins. Although preliminary, results using super-shift
assays of human tissue extracts incubated with monoclonal antibodies preparedagainst specific epitopes located in various functional domains of rhERa andrhERb indicated these ERE-binding proteins are not related to known human
estrogen receptor isoforms [12].
35.4 Summary and Conclusions
As demonstrated, the biosensor was employed in a laboratory setting to analyzecompounds known to express estrogen-like properties, as well as in a practical
setting to detect the presence of estrogen mimics with suspected endocrine dis-rupting activities in lake water, in which deformed frogs were identified [4,5].Analyses are easily and rapidly performed on extracts to determine the presence
of hormone mimics and EDCs in various samples, such as industrial waste,foodstuffs, hospital waste, and ground water. Biosensor instrumentation, opticfiber composition and fluorescent probe selection may be modified readily to
analyze other types of molecular interactions including kinetics of ligand-recep-tor association and dissociation of candidate drugs. Furthermore, our research
demonstrated that hormone response element-based fibers may be used as adiscovery tool for detecting novel DNA-binding proteins with potential toserve as cancer biomarkers.
The long-term goal of our research is directed toward an understanding ofthe mechanisms of action by which chemical compounds and ligands exert their
influences on receptor-mediated signal transduction. This includes the devel-opment and testing of an instrument and methods for screening environmental
chemicals for endocrine disrupting potential [1], as a result of their participationin hormone-controlled pathways. Estrogens and certain of their mimics(e.g., phytoestrogens and therapeutic estrogen mimics) appear to influence the
rates of association and dissociation of estrogen receptors-a and -b with theircognate accessory proteins (co-activators and co-repressors) as well as thecomposition of the transactivation complex in the ERE and promoter regions
of responsive genes [1]. A new generation of instrumentation is being developedto address these complex issues using a FRET-based evanescent fiber opticsensor (J.L Erb, J. Downward & J.L. Wittliff, unpublished) that provides real
time kinetic measurements reflecting association and dissociation of receptorswith co-regulatory proteins, response elements and ligands.
Acknowledgment Supported in part by grants NIEHS/SBIR #1R43 ES010076-01 (JLE &JLW) & #2R44-ES010076-02 (JLE & JLW) and grants from Phi Beta Psi Sorority CharityTrust (JLW). SAA, TLK and DAK II are recipients of fellowships from the IntegratedPrograms in Biomedical Sciences, University of Louisville.
35 Biosensors for Detecting Estrogen-like Molecules and Protein Biomarkers 321

References
1. ICCVAM/NICEATM Final Report, Expert Panel Evaluation of the Validation Statusof in vitro Test Methods for Detecting Endocrine Disruptors: Estrogen Receptorand Androgen Receptor Binding and Transcriptional Activation Assays, 2002(http:// iccvam.niehs.nih.gov).
2. J. L. Wittliff, R. Pasic, K. I. Bland: Steroid and Peptide Hormone Receptors: Methods,Quality Control and Clinical Use, in Bland KI, Copeland III EM (eds): The Breast:Comprehensive Management of Benign and Malignant Diseases. Philadelphia, PA,W. B. Saunders Co, 458–498, 1998.
3. R. H. Smith, W. J. Lemon, J. L. Erb, J. R. Erb-Downward, J. G. Downward, O. E. Ulrich,and J. L.Wittliff,Development ofKinetic Ligand-bindingAssaysUsing aFiberOptic Sensor,Clin. Chem. 45(9), 1683–1685 (1999).
4. E. A. E. Garber, J. L. Erb, J. G. Downward, E. M. Priuska, J. L. Wittliff, W. Feng,J. Magner, and G. L. Larsen, Biosensor, ELISA, and Frog Embryo TeratogenesisAssay: Xenopus (FETAX) Analysis of Water Associated with Frog Malformations inMinnesota, Proc. Soc. Photo-Optical Instrumentation Engineers (SPIE) 4206,147–158 (2001).
5. J. L. Erb, E. A. E. Garber, J. G. Downward IV, and E. M. Priuska, Data from anEstrogen Receptor-based Biosensor Correlates with Evidence of Frog Malformationand Demonstrates a Differential Response of hERa & b to Beneficial and HarmfulEstrogenic Compounds, In: Proc. 2nd Intl. Conf. Pharmaceuticas & Endocrine Disrupt-ing Chemicals in Water, p. 203–217, Westerville, OH, The National Ground WaterAssociation (2001).
6. T. E. Hirchfield, Fluorescent Immunoassay Employing Optical Fiber in a Capillary Tube,U.S. Patent No. 4,447,546 (1984).
7. W. Raffelsberger and J. L. Wittliff, A Novel Approach for Comparing Ligand BindingResults from Titration and Competition Analyses to Study Hormone Mimics, J. Clin.Ligand Assay 20(4), 275–280 (1997).
8. J. L. Wittliff, L. L. Wenz, J. Dong, Z. Nawaz, and T. R. Butt, Expression and Characteri-zation of an Active Estrogen Receptor as a Ubiquitin Fusion Protein from Escherichiacoli, J. Biol. Chem. 265(35), 22016–22025 (1990).
9. K. Graumann, J. L. Wittliff, W. Raffelsberger, L. Miles, A. Jungbauer, and T.R. Butt,Structural and Functional Analysis of N-terminal Point Mutants of the Human EstrogenReceptor, J. Steroid Biochem. Mol. Biol. 57(5–6), 292–300 (1996).
10. C. R. Lyttle, P. Damian-Matsumura, H. Juul, and T. R. Butt, Human Estrogen ReceptorRegulation in a Yeast Model System and Studies on Receptor Agonists and Antagonists,J. Steroid Biochem. Mol. Biol. 42(7), 77–685 (1992).
11. J. L.Wittliff, P. Folk, J. Dong, C. Schaupp, and T. R. Butt, Characteristics of the HumanEstrogenReceptor Protein Produced inMicrobial Expression Systems. In: V. K.Moudgil(ed.), Steroid Hormone Receptors: Basic and Clinical Aspects, pp. 473–501, BirkhauserBoston (1993).
12. T. L. Kruer, I. A. Smolenkova and J. L. Wittliff, Expression of Novel ERE-BindingProteins in Breast and Uterine Cells, American Society for Biochemistry & MolecularBiology, Abstract # 1381 (2006).
322 J.L. Wittliff et al.

Part IX
Modeling and Analysis of Metabolismand Transport
This section was contributed by the Center for Modeling Integrated MetabolicSystems (MIMS) of the Case Western Reserve University, Cleveland, OH

Chapter 36
Muscle Oxygen Uptake Differs from Consumption
Dynamics During Transients in Exercise
Nicola Lai1,3, Nakisha Syed1, Gerald M. Saidel1,3, and Marco E. Cabrera1,2,3
Abstract Relating external to internal respiration during exercise requiresquantitative modeling analysis for reliable inferences with respect to metabolicrate. Often, oxygen transport and metabolism based on steady-state massbalances (Fick principle) and passive diffusion between blood and tissue areapplied to link pulmonary to cellular respiration. Indeed, when the work ratedoes not change rapidly, a quasi-steady-state analysis based on the Fick prin-ciple is sufficient to estimate the rate of O2 consumption in working muscle.During exercise when the work rate changes quickly, however, non-invasive invivo measurements to estimate muscle O2 consumption are not sufficient tocharacterize cellular respiration of working muscle. To interpret transientchanges of venous O2 concentration, blood flow, and O2 consumption in work-ing muscle, a mathematical model of O2 transport and consumption based ondynamic mass balances is required. In this study, a comparison is made of thedifferences between simulations of O2 uptake and O2 consumption withinworking skeletal muscle based on a dynamic model and quasi-steady-stateapproximations. The conditions are specified under which the quasi-steady-state approximation becomes invalid.
36.1 Introduction
During exercise, oxygen transport and metabolism within muscle in healthyand disease states (e.g., heart failure and diabetes) can be studied undervarious experimental protocols with non-invasive measurements. Measure-ment methods include pulmonary O2 uptake by indirect calorimetry, muscleoxygenation by near-infrared spectroscopy and microvascular oxygenation byphosphorescence quenching. Muscle O2 consumption (UO2m) during a fast
1Department of Biomedical Engineering and 2Pediatrics, Center for Modeling IntegratedMetabolism Systems and 3Rainbow Babies and Children’s Hospital, Case Western ReserveUniversity, Cleveland, OH 44106, USA.
K.A. Kang et al. (eds.), Oxygen Transport to Tissue XXIX� Springer 2008
325

transient change (e.g., exercise) cannot be directly evaluated by measuring
oxygen uptake in the lungs (VO2p). Consequently, a mathematical model is
needed to relate these variables. Often, a quasi-steady-state model (e.g., Fick
principle) is used to analyze dynamic responses at the onset of exercise in
order to quantify relationships between the oxygen uptake, blood flow, and
O2 concentration dynamics in the capillary bed (or index of extraction) within
muscle [1–3]. Although this method is strictly applicable only under steady-
state conditions [4], it could provide a reasonable approximation under some
conditions [5]. More generally, interpretation of non-invasive measurements
related to O2 transport and metabolism in tissue can be made using dynamic
mass balances if the tissue volume can be determined. Nevertheless, this has
limitations also. At the microvascular level, the volume of tissue supplied with
oxygen by the blood vessels is uncertain. Furthermore, in a macroscopic tissue
volume, the heterogeneous spatial distribution and temporal variation of
blood flow and O2 concentration in tissue can have a significant effect
on the interpretation of measurements. In this study, simulations using a
quasi-steady-state model [3] and those using a multi-compartment dynamic
model [6] are compared to experimental measurements during exercise. The
effect of changes in muscle blood flow on the dynamic responses of venous
oxygen concentration was investigated during exercise assuming specific
dynamics of muscle O2 consumption.
36.2 Methods
We consider oxygen transport and consumption in muscle to occur in a system
of perfectly mixed blood and tissue compartments (Fig. 36.1) as developed
previously [6]. In the blood compartment, the oxygen concentration C(t)
changes with time depending on flowQm(t) through the capillary bed of volume
mQ ( t )TvenC
TartC
UO2m(t), Muscle O2 Consumption
F Fven tisPS (C -C )⋅
2
T T2m m art ven
Muscle O Uptake
VO =Q (t) (C -C )⋅
EXERCISE STIMULUS
MUSCLE
CAPILLARY
TISSUE
Fig. 36.1 Oxygen consumption and transport in skeletal muscle.
326 N. Lai et al.

Vcap and diffusion between blood and tissue with rate coefficient PS accordingto the dynamic mass balance:
VcapdCT
ven
dt¼ Qm tð Þ CT
art � CTven
� �
� PS CFven � CF
tis
� �
(36:1)
where CTj and CF
j represent the total and free oxygen concentrations in compart-ment j, which are related by nonlinear equations [6]. In the tissue compartment, theoxygen concentration C(t) changes with time depending on the rates of diffusionbetween blood and tissue cells and oxygen consumption in muscle UO2m(t):
VtisdCT
tis
dt¼ PS CF
ven � CFtis
� �
�UO2mðtÞ (36:2)
At steady state, these equations can be combined to yield the Fick principlefor oxygen uptake of skeletal muscle:
VO2m ¼ Qm CTart � CT
ven
� �
¼ PS CFven � CF
tis
� �
¼ UO2m (36:3)
In response to a step increase in work rate, the oxygen consumption hastypically an exponential response [3]:
UO2mðtÞ ¼ UOBL2m þ�UO2m 1� expt0�t=�UO2m
h i
(36:4)
Also, the blood flow has two phases (I, II) with different amplitudes and timeconstants [3]:
Qm tð Þ ¼ QBLm þ�Qm;1 1� exp t0�tð Þ
�
�Qm;l
� �
þ�Qm;2 1� exp t0þTD2�tð Þ�
�Qm;11
� �
(36:5)
To simulate the oxygen concentration dynamics of skeletal muscle to a stepchange in work rate from baseline (BL), we must specify initial conditions at t0:CF
ven t0ð Þ ¼ CF;BLven ;CF;BL
tis t0ð Þ ¼ CF;BLtis . Responses of venous oxygen concentration
were simulated between two steady states assuming different values of musclevolume (Vm) engaged during exercise with different dynamic changes of bloodflow in muscle. The differential equations of the model were solved numericallyusing a robust algorithm for stiff systems [7].
For comparison with the results of Ferreira [3], we used the same initialconditions, muscle blood flows (�Qm,I and �Qm,II), and oxygen consumptiontime constant �UO2m
¼ 30sð Þ. Except for the parameter values in Table 36.1,values of other model parameters were obtained from previous studies [6].
Following Ferreira [3] we chose values for the arterial oxygen concentration,CT
art, and free oxygen concentrationCF;BLven . The free oxygen concentration intissue
was determined based on PO2=25 mmHg. The value of PS was computed fromEq. (36.3) at steady state.
36 Muscle Oxygen Uptake Differs from Consumption Dynamics 327

Table 36.1 Initial conditions and model parameters
CF;BLven [mM] CF;BL
tis [mM] CF;BLart [mM] PS [L min–1]
3.48 �10�2 3.37 �10–2 1.05 �10–1 2026
–30 0 30 60 900
1
2
3
4
5
6(a)Blood flow time constants
τQm,I =
2s
τQm,I =
8s
τQm,I =
20s
τQm,I =
2s
τQm,I =
8s
τQm,I =
20s
Mus
cle
Blo
od F
low
[L m
in–1
]
Time [s]
–30 0 30 60 90Time [s]
4
6
8
10
12
14
16
(Vm = 0L)
(b)
τQm,I
τQm,I
(Vm = 15L)
Cve
n [m
l O2
100m
L–1] Model Simulations
Ferreira3 et al.
T
Fig. 36.2 (a) Blood flow dynamic for different time constants �Qm,I, (�Qm,II= 30 s); (b) Effectof blood flow dynamic on the dynamic response of the venous O2 concentration obtained withquasi-steady-state and dynamic model.
328 N. Lai et al.

36.3 Results
The effects of various blood flow time profiles on venous oxygen concentrationfor a specific oxygen consumption dynamics are simulated.
Figure 36.2 shows dynamic changes in phase I ofmuscle blood flow (Fig. 36.2a)and corresponding dynamic responses of venous oxygen concentration(Fig. 36.2b). The dynamic response of the venous oxygen concentration is faster
Blood flow time constants
Model Simulations
Ferreira3 et al.
τQm,II = 25s
τQm,II = 30s
τQm,II = 45s
τQm,II = 25s
τQm,II = 30s
τQm,II = 45s
–30 0 30 60 18090 120 1500
1
2
3
4
5
6(a)
Mus
cle
Blo
od F
low
[Lm
in–1
]
Time [s]
–30 0 30 60 18090 120 150Time [s]
τQm,II
(Vm = 0L)
(b)
τQm,II
(Vm = 15L)
4
2
6
8
10
12
14
Cve
n [m
l O2
100m
L–1]
T
T
Fig. 36.3 (a) Blood flow dynamic for different time constants �Qm,II, (�Qm,I = 4 s); (b) Effectof blood flow dynamic on the dynamic response of the venous O2 concentration obtained withquasi-steady-state and dynamic model.
36 Muscle Oxygen Uptake Differs from Consumption Dynamics 329

when the transient term (i.e., rate of oxygen change) is negligible (Vm�0L) thanwhen it is significant (Vm=15L). The overshoot of the venous oxygen concentra-tion is greater with a smaller muscle volume and with a shorter time constant ofphase I (�Qm,1). Evenwhen the time constant of phase I is long, the dynamics of thevenous oxygen concentration depends on the muscle volume.
Figure 36.3 shows dynamic changes in phase II of muscle blood flow(Fig. 36.3a) and corresponding dynamic responses of venous oxygen concentration(Fig. 36.3b). The dynamic response of the venous oxygen concentration is fasterwhen the transient term is negligible (Vm�0L) than when the transient term issignificant (Vm=15L). The undershoot of the venous oxygen concentration isgreater with a smaller muscle volume and with a longer time constant of phase II(�Qm,1I). Even when the time constant of phase II is small, the dynamics of thevenous oxygen concentration depends on the muscle volume.
36.4 Discussion
Model simulations of the time response of venous oxygen concentration inworking skeletal muscle were obtained with a dynamic computational modelfor quasi-steady-state (e.g., negligible muscle volume) and transient conditions.The simulations under quasi-steady-state conditions are equivalent to those ofFerreira [3], who applied a steady-state (Fick principle) analysis.
With a larger muscle volume, a change of muscle blood flow has less effect onthe time profile of the venous oxygen concentration. In any case, an overshootin venous oxygen concentration can occur during phase I of muscle blood flowas reported in human exercise studies [8]. Corresponding to simulations invenous oxygen concentration during phase II of muscle blood flow, experi-ments with rat muscle contractions show a similar undershoot response [9]. Inthese studies with diabetic rats where the disease induces a mismatch betweenoxygen delivery and oxygen consumption, an undershoot can occur in micro-vascular O2 pressure at the onset of exercise.
Based on the Fick principle, the red blood cell flux (or oxygen delivery)and microvascular O2 pressure measurements are used to compute oxygenconsumption in the diabetic state [2]. This simplified analysis shows a mismatchbetween oxygen delivery and oxygen consumption, which accounts for theobserved undershoot in microvascular O2 pressure. Correct interpretation ofthis mismatch requires quantitative analysis with a more general dynamicmodel to determine the effect of muscle volume in the transient term of theoxygen balance. Furthermore, a dynamic model is essential to analyze theresponse of microvascular oxygen pressure in muscle at the onset of contractionin heart failure [10] and aging [11], where O2 delivery is impaired.
Generally, venous oxygen concentration during exercise depends on the rateof oxygen mass accumulation within muscle that results from a dynamic inter-play of convection, diffusion, and metabolism. Consequently, the dynamics of
330 N. Lai et al.

muscle oxygen uptake and muscle oxygen consumption differ during transientchanges in exercise [6]. In this regard the extent of muscle involvement (i.e.,muscle volume), which is often uncertain (especially at the microvascular level),plays a relevant role during exercise.
The more general dynamic model applied in this study consists of spatiallylumped, dynamic mass-balance equations. A special case of this dynamic model isthe quasi-steady-statemodel, which is commonly used to analyze oxygen exchangein capillary blood and in tissue of the working muscle. Although this dynamicmodel of oxygen consumption in skeletal muscle [6] is sufficient for some purposes,modifications are needed to reflect more physiological conditions. For example,the product of permeability and surface area should be a function of blood flowdue to the capillary recruitment occurring at the onset of exercise [12]. Further-more, this dynamic model assumes an exponential function to describe cellularoxygen consumption [13]. While this simple expression is sufficient to make someinferences about dynamic responses, key metabolic processes should be incorpo-rated into the model to provide a mechanistic basis for oxygen consumptiondynamics. For this purpose, future models should incorporate substrates andenzymes participating inmitochondrial oxidative phosphorylation during exercise.
The dynamics of the oxygen concentration in blood depend on the spatialdistribution and temporal variation of the variables such as blood flow andhemoglobin oxygen saturation that affect convective and diffusive transport ofoxygen in themicrocirculation. Although these effects are not directly measurableduringmuscle contraction [14], more general models have been applied to accountfor heterogeneities of blood flow and oxygen consumption of the muscle [15–18].
In conclusion, physiological relations between oxygen transport and con-sumption within skeletal muscle during exercise require a model based ondynamic mass balances for oxygen in blood and tissue. Such a model can beused together with non-invasive or minimally invasive experiments to studycapillary oxygen exchange during an exercise stimulus where active muscle,convection and diffusion have a significant effect. This could contribute toquantifying changes associated with aging in healthy subjects, as well as withpotential pathological alterations of oxygen transport and metabolism inunhealthy subjects suffering from diabetes and heart failure [19].
Acknowledgment Supported by grant (P50 GM-66309) from the National Institute ofGeneral Medical Sciences (NIH).
References
1. Barstow, T.J., Lamarra, N., andWhipp, B.J., 1990, Modulation of muscle and pulmonaryO2 uptakes by circulatory dynamics during exercise, J. Appl. Physiol. 68, 979–989.
2. Behnke, B.J., Barstow, T.J., Kindig, C.A., McDonough, P., Musch, T.I, and Poole, D.C.,2002b, Dynamics of oxygen uptake following exercise onset in rat skeletal muscle, Respir.Physiol. Neurobiol. 133, 229–239.
36 Muscle Oxygen Uptake Differs from Consumption Dynamics 331

3. Ferreira, L.F., Poole, D.C., and Barstow, T.J., 2005, Muscle blood flow-O2 uptakeinteraction and their relation to on-exercise dynamics of O2 exchange, Respir. Physiol.Neurobiol. 147, 91–103.
4. Stringer, W.W., Whipp, B.J., Wasserman, K., Porszasz, J., Christenson, P., andFrench, W.J., 2005, Non-linear cardiac output dynamics during ramp-incremental cycleergometry, Eur. J. Appl. Physiol. 93, 634–639.
5. Kemp, G., 2005, Kinetics of muscle oxygen use, oxygen content and blood flow duringexercise, J. Applied Physiology 99, 2463–2469.
6. Lai, N., Dash, R.K., Nasca, M.M., Saidel, G.M., and Cabrera, M.E., 2006, Relatingpulmonary oxygen uptake to muscle oxygen consumption at exercise onset: in vivo and insilico studies, Eur. J. Appl. Physiol. 97(4), 380–94.
7. Hindmarsh, A.C., 1983, A systematized collection of ode solvers, Scientific computing55–64, DLSODE, http://www.netlib.org/odepack/.
8. Grassi, B., Poole, D.C., Richardson, R.S., Knight, D.R., Erickson, B.K., and Wagner,P.D., 1996, Muscle O2 uptake kinetics in humans: implications for metabolic control,J. Appl. Physiol. 80, 988–998.
9. Behnke, B.J., Kindig, C.A., McDonough, P., Poole, D.C., and Sexton, W.L., 2002a,Dynamics of microvascular oxygen pressure during rest-contraction transition in skeletalmuscle of diabetic rats, Am. J. Physiol. Heart Circ. Physiol. 283, H926–H932.
10. Diederich, E.R., Behnke, B.J., McDonough, P., Kindig, C.A., Barstow, T.J., Poole D.C.,andMusch, T.I., 2002, Dynamics of microvascular oxygen partial pressure in contractingskeletal muscle of rats with chronic heart failure, Cardiovasc. Res. 56, 479–486.
11. Behnke, B.J., Delp, M.D., Dougherty, P.J., Musch, T.I, and Poole, D.C., 2005, Effects ofaging on microvascular oxygen pressures in rat skeletal muscle, Respir. Physiol.Neurobiol. 146, 259–268.
12. Caldwell, J.H., Martin, G.V., Raymond, G.M, and Bassingthwaighte, J.B., 1994, Regio-nal myocardial flow and capillary permeability-surface area products are nearly propor-tional, Am. J. Physiol. Heart Circ. Physiol. 267, H654–H666.
13. Binzoni, T., Colier, W., Hiltbrand, E., Hoofd, L., and Cerretelli, P., 1999, Muscle O2
consumption by NIRS: a theoretical model, J. Appl. Physiol. 87, 683–688.14. Pittman, R.N., 2000, Oxygen supply to contracting skeletal muscle at the microcircula-
tory level: diffusion vs. convection, Acta Physiol. Scand. 168, 593–602.15. Beard, D.A., 2001, Computational framework for generating transport models from
databases of microvascular anatomy, Ann. Biomed. Eng. 29, 837–843.16. Beard, D.A., Schenkman, K.A., and Feigl, E.O., 2003, Myocardial oxygenation in
isolated hearts predicted by an anatomically realistic microvascular transport model,Am. J. Physiol. Heart Circ. Physiol. 285, H1826–H1836.
17. Dash R.K., and Bassingthwaighte, J.B., 2006, Simultaneous blood–tissue exchange ofoxygen, carbon dioxide, bicarbonate and hydrogen Ion. Ann. Biomed. Eng. 34,1129–1148.
18. Popel, A.S., 1989, Theory of oxygen transport to tissue, Crit. Rev. Biomed. Eng. 17,257–321.
19. Poole, D.C., Behnke, B.J., and Padilla, D.J., 2005, Dynamics of muscle microcirculatoryoxygen exchange, Med. Sci. Sports Exerc. 37, 1559–1566.
332 N. Lai et al.

Chapter 37
Modeling Oxygenation and Selective Delivery
of Drug Carriers Post-Myocardial Infarction
Bin Wang2, Robert C. Scott1, Christopher B. Pattillo1,
Balabhaskar PrabhakarPandian2, Shankar Sundaram2,
and Mohammad F. Kiani1
Abstract An anatomically realistic mathematical model of oxygen transport incardiac tissue was developed to help in deciding what angiogenic strategiesshould be used to rebuild the vasculature post myocardial infarction (MI).Model predictions closely match experimental measurements from a previousstudy, and can be used to predict distributions of oxygen concentration innormal and infarcted rat hearts. Furthermore, the model can accurately predicttissue oxygen levels in infarcted tissue treated with pro-angiogenic compounds.
Immunoliposome (IL) targeting to areas of inflammation after MI couldprovide themeans bywhich pro-angiogenic compounds can be selectively targetedto the infarcted region. The adhesion of model drug carriers and immunolipo-somes coatedwith antibody to P-selectinwas quantified in aMI ratmodel. Anti-P-selectin coatedmodel drug carriers showed a 140%and 180% increase in adhesionin the boarder zone of theMI 1 and 4 hours post-MI, respectively. Circulating for24 hrs, radiolabeled anti-P-selectin immunoliposomes showed an 83% and 92%increase in targeting to infarcted myocardium when injected 0 and 4 hrs post-MI,respectively. Targeting to upregulated adhesion molecules on the endotheliumprovides a promising strategy for selectively delivering compounds to the infarctregion of the myocardium using our liposomal based drug delivery vehicle.
37.1 Introduction
Chronic cardiac failure (CCF) following myocardial infarction (MI) is a majorhealth problem of epidemic proportions. A transmural MI involves a loss ofnecrotic cardiomyocytes and a proteolysis of extracellular matrix, vasculatureand nerves. Subsequent tissue repair restores structural integrity at the infarct
1Department of Mechanical Engineering, Temple University, Philadelphia, PA 19122.2CFD Research Corporation, Biomedical Technology Division, Huntsville, AL 35805.Corresponding author: Mohammad F. Kiani, Department of Mechanical Engineering, 1947North 12th Street, Philadelphia, PA 19122. Phone: 1-215-204-4644, Fax: 1-215-204-4956,e-mail: [email protected]
K.A. Kang et al. (eds.), Oxygen Transport to Tissue XXIX� Springer 2008
333

site; it does not involve a significant regeneration of cardiomyocytes. Of neces-sity, rebuilt myocardium must include a vascular network able to nourish itunder diverse metabolic demands. This raises two questions: how and when toregrow a neovasculature at the infarct site.
When to regrow neovasculature? We have applied recently developed tech-niques in the field of tumor biology to quantify microvascular morphology andoxygenation at the infarct site and determined the optimal time for growing newtissue [1]. A mathematical model of oxygenation in myocardial tissue is beingpresented here to help resolve this question. A provisional neovasculatureappears within 7–14 days afterMI, which is not able to deliver sufficient oxygento avoid regions of hypoxia. At 3–4 weeks post-MI, a dense collagen networkhas developed which leaves little space to accommodate the newly growingcardiomyocytes [2]. It appears the optimal time to regrow myocardium and itssupporting vascular network may be within the first 14 days post-MI.
How to regrow neovasculature? Targeted delivery of pro-angiogenic com-pounds (e.g. VEGF) to the infarct site, using a new targeted drug deliveryapproach developed in our laboratory [3], can significantly enhance angiogenesisin post-infarct tissue. The inflammatory cascade is upregulated during thedevelopment ofmyocardial infarction [4, 5]. The endothelium becomes activatedand increases its expression of receptors that bind ligands on the leukocytes. Theup-regulated expression of endothelial cell adhesion molecules in the scar pro-vides a potential avenue for targeting drugs to the infarct tissue similar to thatdeveloped in our laboratory to target drugs and/or other molecules to inflamedtissue [3, 6–8]. In this manner, the MI induced up-regulation of an endothelialcell adhesion molecule(s) within the diseased tissue is used as a target to delivertherapeutic agents (drugs, genes, etc.) selectively to the scar, see Fig. 37.1.
VEGF has been shown to augment perfusion through neovascularizationpost-MI [9–11]. However, systemic administration of VEGF has manyobserved and potential side effects [12, 13]. Many of these side effects can becircumvented through a targeted drug delivery approach in which the drugs canbe preferentially targeted to the scar via the upregulation of various adhesionmolecules in the scar tissue.
A targeted drug delivery system was developed to target drugs (e.g. pro-angiogenic compounds) to infarct myocardium. Liposomes coated with target-ing ligands to adhesion molecules (immunoliposomes) upregulated on the
CAMS
Fig. 37.1 The proposed scheme for delivering drugs to infarcted tissue.
334 B. Wang et al.

surface of endothelium in the infarct regions were selectively delivered to the
infarct regions.Based on the experimental study [1], a mathematical model was developed
and validated, to study oxygen transport from a capillary network in normal
areas of infarcted heart, MI area, and losartan treated MI heart. This mathe-
matical model can be used to guide the regrowth of the neovasculature using
targeted drug delivery system.
37.2 Methods
37.2.1 Animal Model of Myocardial Infarction
As described previously [1], a rat model of myocardial infarction was used. In
brief, following induction of anesthesia with isoflurane, an anterior transmural
MI was created by ligation of the left coronary artery with silk ligature. A series
of novel techniques from tumor biology were adapted to quantify the compo-
nents and functionality (i.e., ability to deliver oxygen) of the scar vascular
network at 1–4 weeks following MI. This combination of fluorescent and
immunohistological stains was then used to define the distribution of distances
from cells to the nearest anatomical or perfused vessel.
37.2.2 Mathematical Model of Myocardial Oxygenationin MI Rat Heart
A two-dimensional model of the physiological oxygen transport in tissue was
developed using the finite volume Computational Fluid Dynamics code, CFD-
ACEþ (ESI-CFD, Huntsville, AL) software on a standard desktop personal
computer. It enables steady-state as well as transient analysis in realistic
geometries. The CFD code uses fast and efficient numerical methods tailored
to solve physiological transport problems in realistic geometries. The method
was based on a continuous representation of the tissue around the vessels. All
elements (myocyte, vessel wall, interstitial space) in this continuous system were
assumed to represent a homogeneous combination of tissue types in this
method. This provides a fast and efficient way of determining the effect of
changes in oxygen concentration and vessel density on a macroscale in both
normal and diseased myocardium. In addition, this was useful in quantitatively
analyzing our experimental data. This was done by comparing the model with
the experimental data derived previously from the EF5/Cy3 intensity cross
section images of infarcted rat heart.
37 Modeling Oxygenation and Selective Delivery 335

37.2.2.1 Vascular Geometry
The microvascular network geometry of the myocardium is derived from theperfused vessel image taken from the cross-section of heart tissue in rats obtainedin previous experimental studies [1]. The outline of every vessel was obtained atthe exact anatomic position and size in the rat heart. Vascular geometries werealso obtained by randomly eliminating capillaries from an experimentallyobtained normal heart microvascular network such that its capillary densitywould match that of experimentally obtained MI rat heart. The results fromthese simulated networks were compared with those from experimentallyobtained vascular geometries. By randomly eliminating the capillaries, we cantest what role vascular distribution per se plays in oxygenation of MI tissue, andwe can use this vascular geometry to determine what level of vessel density isneeded in the tissue to maintain normal function in cardiomyocytes.
37.2.2.2 Mathematical Model Validation
To determine if our mathematical model can also successfully predict improve-ments in tissue oxygenation by various pharmaceutical interventions, wevalidated this mathematical model using the vascular geometry from losartantreatedMI rats to simulate the resulting changes in tissue oxygenation.We haveshown that losartan, an AT1 receptor antagonist, significantly improvesperfusion and reduces tissue hypoxia [1].
37.2.2.3 Transport Equations
Assuming no perfusion and fixed concentration of available oxygen at the vesselinterface, the mass conservation equation for oxygen transport in the tissuereduces to
@Co2
@t¼ Do2r2Co2 � Vo2 consumptionð Þ (37:1)
where t= time, Do2= oxygen diffusivity in tissue, Co2 = molar concentrationof oxygen, and Vo2 is the metabolic sink term.
Oxygen consumption was assumed to be homogeneously distributed withinthe homogeneous tissue according to Michaelis-Menten Kinetics
Vo2 ¼ Vo2 Mð Þ �Co2
Co2 þ KMð Þ (37:2)
where VO2(M) is defined as the maximal rate of oxygen consumption, CO2 isoxygen concentration in the tissue and KM is the effective Michaelis-Mentenconstant [14]. Matrix-based, stiff kinetics solvers were employed for the
336 B. Wang et al.

reaction kinetics. A second-order central differencing method was used forspatial interpolation of concentration variables and Euler time integrationwas employed. The model results were then compared to the experimentaldata previously derived from the EF5/Cy3 image (which shows the hypoxialevels) intensities of the infarcted rat heart.
37.2.2.4 Boundary and Initial Conditions
The vessels served as an inlet with the condition of fixed initial oxygen concen-tration and a zero flux at the external tissue boundary was imposed based onconsideration of symmetry. Therefore, the only flow of oxygen into the tissuecomponents was by diffusion due to the gradient of the oxygen concentration.
The model is used to predict the long-term, steady state distribution ofoxygen in the tissue. As an initial condition, oxygen concentration everywherein the tissue was set at zero; steady state tissue oxygen concentration was thencalculated based on the balance of the vascular source and tissue metabolicsinks.
37.2.3 Targeted Delivery of Model Drug Carriersand Immunoliposomes
Model drug carriers (2mm red and blue fluorescent polystyrene microspheres)were used to show that particles can be targeted to MI tissue. We use modeldrug carriers to show ‘‘proof of concept’’ because they are cheaper and easier touse [15, 16]. The particles were coated with protein A via passive adsorptionby incubating the particles in a 0.1M NaHCO3, pH 9.2 buffer containing300 mg/ml protein A at room temperature for over an hour. The particleswere then washed, incubated in a blocking buffer (Hank’s balanced salinesolution with 1% human serum albumin), washed and incubated with mAbsto anti-P-selectin diluted in blocking buffer. After 1 hour incubation, the mAbcoated particles were washed and stored in the blocking buffer prior to use. ThemAbs to anti-P-selectin were purchased commercially (e.g. R6D Systems;Minneapolis, MN). Particles were separated from solutions by centrifugation.After a predetermined amount of time post-MI, antibody coated model drugcarriers (2 � 108 microspheres of each color) were injected via tail vein andallowed to circulate in the blood stream for 1 minute. The animal was eutha-nized and the heart was quickly removed and washed with a saline solution. Theheart was quickly frozen and sectioned (10 mm thick). Images were taken in boththe border zone (directly adjacent to the necrotic band in left ventricle wall) andnon-infarcted myocardium (taken from right ventricle wall) with two differentfluorescent filters (one for red fluorescing antibody coated model drug carriersand one for green fluorescing IgG coated model drug carriers).
37 Modeling Oxygenation and Selective Delivery 337

Clinically relevant drug carriers (radiolabeled immunoliposomes) bearingmAbs to anti-P-selectin [3] were used to show that drug carriers can be targetedto MI area via upregulated adhesion molecules on the surface of scar endothe-lial cells. These liposomes are small (50–100 nm) and long circulating with asurface chemistry that is well-suited for immune tagging. The initial character-ization of liposomal formulation, surface ligand density, and drug releaseprofile were also performed. After warm 50mM H2CO3 (carbonate) buffer @pH 7.0 at 40 8C, 3 mL of this buffer were added. Then solution was vortexed for3 minutes at 40 8C and extruded @ 800 nm � 5, then 400 nm � 5 followedfinally by 200 nm � 10. Phosphate assay was performed. 2-IT was added at 20fold to Ab (buffer used is now pH 8.0) for 60minutes@ room temperature (RT)following this use a molar ratio of 40:1 maleimide:Ab [17]. This solution wascentrifuged at 14K for 10minutes in amicrocone vial then flipped in the vial andspun at 4k for 5 minutes. Then resuspend the Ab in the carbonate buffer @ pH7.0. It was immediately added to liposomes and incubated at 48Covernight, on ashaker set on low speed. The success of the mAb coupling procedure was testedby quantifying the adhesion of immunoliposomes to endothelial cell mono-layers in a parallel plate flow chamber as described [8, 18].
Radiolabeled immunoliposomes, 0.1 mL at a concentration of 10 mM, wereinjected via a tail vein and allowed to circulate for a predetermined amount oftime. Afterwards, blood was flushed from the animal by injecting saline with asyringe into the left ventricle of the animal and making a small opening withmicro-scissors in the right ventricle. The organs, blood, and heart tissue wereremoved as previously described. The tissue was processed as previouslydescribed for measurement in the scintillation counter.
37.2.4 Statistical Analysis
One way analysis of variance with planned contrasts was used to determinesignificant differences among experimental groups. Kolmogorov-Smirnov Test(StatGraphics Plus, Manugistics Inc.) was used to compare frequency distribu-tions. P<0.05 was considered to be statistically significant.
37.3 Results
As shown in Fig. 37.2, throughout the 1–4 weeks post-MI, the progressive andsignificant increase in measured tissue hypoxia observed experimentally wassuccessfully predicted by our mathematical model. From our previous study [1],the optimal time to regrow and/or rebuild myocardium and its supportingvascular network is before 14 days post-MI. Our mathematical model indicatesthat 2 weeks post-MI 29% of the myocardium is severely hypoxic(PO2<1.25 mmHg) and that a 220% increase in vessel density is required to
338 B. Wang et al.

ensure that no areas of the myocardium are severely hypoxic. Previously we
have shown that losartan, an AT1 receptor antagonist, significantly improves
perfusion and reduces tissue hypoxia [1]. Our model successfully predicted the
changes in oxygenation induced by losartan treatment in infarcted tissue
(Fig. 37.3).We have investigated the adhesion of polystyrene microspheres (used as
model drug carriers) coated with a mAb to anti-P-selectin to the vascular
endothelium of rat scar and adjacent normal tissue. Figure 37.4 shows that in
the scar a large number of anti-P-selectin conjugatedmicrospheres adhere to the
scar microvasculature while no IgG coated microspheres adhere to the same
region. These results are summarized in Fig. 37.5 indicating a 3-fold increase in
adhesion of anti-P-selectin coated microspheres in the infarcted region
compared to normal myocardium.The accumulation of radiolabeled anti-P-selectin coated immunoliposomes
in the infarcted tissue was compared with the accumulation of the radiolabeled
anti-P-selectin coated immunoliposomes in the remaining non-infarcted tissue
Time Post-MInormal 1wk 2wk 3wk 4wk
0.0
0.5
1.0
1.5
2.0
2.5
3.0PredictedExperimental
Inte
nsity
Rat
io (
Infa
rcte
d/N
orm
al I
nten
sity
)Fig. 37.2 Themathematicalmodel developed in thisstudy can successfullypredict experimentallymeasured hypoxia levels in1–4 weeks post-MI tissue.
Time Post-MI2wk 2wk-losartan
Inte
nsity
Rat
io (
Infa
rcte
d/N
orm
al I
nten
sity
)
0
1
2
3PredictedExperimental
Fig. 37.3 Themathematicalmodel developed here cansuccessfully predict changesin tissue oxygenation inlosartan treated animals.
37 Modeling Oxygenation and Selective Delivery 339

at different time periods post-MI. Anti-P-selectin coated immunoliposomesinjected immediately post-MI and allowed to circulate for 24 hours showed asignificant (P = 0.01) increase in adhesion (83%) to the infarct region ascompared to the non-infarcted myocardium (Fig. 37.6). Anti-P-selectin coatedimmunoliposomes injected 4 hours post-MI and allowed to circulate for24 hours showed a significant (P = 0.04) increase in adhesion (92%) to theinfarcted region as compared to the non-infarcted myocardium (Fig. 37.6).These findings indicated that anti-P-selectin mAb can be used to selectivelytarget infarct tissue post-MI using our liposomal drug carrier. In a smallergroup of animals (n = 3), anti-P-selectin coated immunoliposomes wereinjected immediately post-MI and allowed to circulate for only 4 hours. Thisexperiment showed a significant (P = 0.03) but small increase in adhesion(34%) to the infarcted region as compared to the non-infarcted myocardium
Time Point Post-MI1 hour 4 hours 24 hours
Num
ber
of A
dher
ing
Mod
el D
rug
Car
rier
s/m
m2
0
20
40
60
80anti-P-selectin in Non-Infarcted TissueIgG in Non-Infarcted Tissueanti-P-selectin in Infarcted TissueIgG in Infarcted Tissue
** **
Fig. 37.5 Anti-P-selectin coated model drug carriers were found to adhere preferentially tomyocardium in the border zone near the infarcted area at 1 and 4 hours post-MI (140% and180%, respectively).
Fig. 37.4 Anti-P-selectincoated model drug carriersadhere preferentially to theinfarcted myocardium(white dots) as compared toIgG coated model drugcarriers in the same tissue4 hours post-MI.
340 B. Wang et al.

(Fig.37. 6). These observations indicate that this innovative technique can be
used to target drug carriers to select tissue via the up-regulation of adhesion
molecules expressed on endothelial cells in response to MI.
37.4 Discussion
We have developed a series of experimental and mathematical techniques to
characterize vascularity, perfusion, and levels of hypoxia of the scar vascular
network up to 4 weeks post-MI in rats [1]. Utilizing microvascular anatomy of
cardiac tissue based on available morphometric images, our model can be used
to predict distributions of oxygen concentration in normal and infarcted rat
hearts, as well as in infarcted tissue treated with pro-angiogenic compounds
such as losartan. From the minimum oxygen concentration myocytes need to
maintain their normal function, we can calculate the number of new perfused
vessels needed in the heart to avoid tissue hypoxia, guiding our work of
rebuilding vascular networks and myocardium. Our findings indicate that the
optimal time to regrow and/or rebuild myocardium and its supporting vascular
network is before 14 days post-MI.Selectively targeting pro-angiogenic compounds in the infarcted myocar-
dium represents an innovative approach for rebuilding damaged tissue. Our
findings indicate that anti-P-selectin coated model drug carriers and liposomes
Liposome Circulation Time Post-MI0 to 4 hours 0 to 24 hours 4 to 28 hours
CM
PA/g
ram
of
tissu
e
0.0
0.5
1.0
1.5
2.0
2.5 Non-Infarct Tissue Infarct Tissue
**
*
*
Fig. 37.6 Anti-P-selectin coated immunoliposomes (IL) were found to preferentially accu-mulate in the infarcted myocardium at various time points: 0 to 4 hrs (injected 0 hr post-MI,measured 4 hrs post-MI), 0 to 24 hours (injected 0 hr post-MI, measured 24 hrs post-MI), 4 to28 hours (injected 4 hrs post-MI, measured 28 hrs post-MI).
37 Modeling Oxygenation and Selective Delivery 341

can be preferentially targeted to infarcted regions in the myocardium post-MI. Utilizing the liposomal drug carriers, the upregulation of P-selectin dueto inflammation and hypoxia can be used to deliver various compounds(e.g. pro-angiogenic agents such as VEGF) to diseased tissue. We observed asignificant accumulation of clinically relevant anti-P-selectin coated immuno-liposomes in the infarct region within the first 24 hours post-MI. These findingscould have significant clinical implications in that delivering a 100–200%increased dose of a drug to the diseased area with no increase in the dose tonormal tissue could yield a large benefit to the patient without an increase inside effects of the drug.
The development of a minimally invasive treatment for regenerating lostvasculature after a myocardial infarction would be very beneficial in ourattempt at long term treatment of heart disease. This treatment could providea neovasculature for other treatments (e.g. stem cells) which are limited by thelost blood flow after the onset of an MI. We are currently developing amethodology by which pro-angiogenic compounds can be selectively deliveredto post-MI tissue.
Acknowledgment We thank Dr. Andrew Issekutz for providing us with the rat anti-P-selectinantibody. Bin Wang is a pre-doctoral fellow of the American Heart Association. MohammadF. Kiani is an Established Investigator of the American Heart Association.
References
1. B. Wang, R. Ansari, Y. Sun, A.E. Postlethwaite, K.T. Weber, and M.F. Kiani. The scarneovasculature after myocardial infarction in rats. Am. J. Physiol Heart Circ. Physiol. 289,H108 (2005).
2. Y. Sun, J.P. Cleutjens, A.A. Diaz-Arias, and K.T. Weber. Cardiac angiotensin convertingenzyme and myocardial fibrosis in the rat. Cardiovasc. Res. 28, 1423 (1994).
3. C.B. Pattillo, F. Sari-Sarraf, R. Nallamothu, B.M. Moore, G.C. Wood, and M.F. Kiani.Targeting of the antivascular drug combretastatin to irradiated tumors results in tumorgrowth delay. Pharm. Res. 22, 1117 (2005).
4. B. Sun, H. Fan, T. Honda, R. Fujimaki, A. Lafond-Walker, Y. Masui, C.J. Lowenstein,and L.C. Becker. J. Activation of NF kappa B and expression of ICAM-1 in ischemic-reperfused canine myocardium. Mol. Cell Cardiol. 33, 109 (2001).
5. Y. Sun,M.F. Kiani, A.E. Postlethwaite, andK.T.Weber. Infarct scar as living tissue. BasicRes. Cardiol. 97, 343 (2002).
6. H. Yuan, M.W. Gaber, T. McColgan, M.D. Naimark, M.F. Kiani, and T.E. Merchant.Radiation-induced permeability and leukocyte adhesion in the rat blood-brain barrier:modulation with anti-ICAM-1 antibodies. Brain Res. 969, 59 (2003).
7. K.T.Weber, I.C.Gerling,M.F.Kiani,R.V.Guntaka,Y. Sun,R.A.Ahokas,A.E.Postlethwaite,and K.J. Warrington. Aldosteronism in heart failure: a proinflammatory/fibrogeniccardiac phenotype. Search for biomarkers and potential drug targets. Curr. Drug Targets.4, 505 (2003).
8. M.F. Kiani, H. Yuan, L. Smith, M.W. Gaber, and D.J. Goetz. Targeting microparticles toselect tissue via radiation-induced upregulation of endothelial cell adhesion molecules.Pharm. Res. 19, 1317 (2002).
342 B. Wang et al.

9. K. Suzuki, B. Murtuza, R.T. Smolenski, I.A. Sammut, N. Suzuki, Y. Kaneda, andM.H. Yacoub. Cell transplantation for the treatment of acute myocardial infarctionusing vascular endothelial growth factor-expressing skeletal myoblasts. Circulation104, I207 (2001).
10. S.B. Freedman and J.M. Isner. Therapeutic angiogenesis for coronary artery disease.Annals of Internal Medicine 136, 54 (2002).
11. D.A. Engler. Use of vascular endothelial growth factor for therapeutic angiogenesis.Circulation 94, 1496 (1996).
12. S.E. Epstein, R. Kornowski, S. Fuchs, and H.F. Dvorak. Angiogenesis therapy: amidstthe hype, the neglected potential for serious side effects. Circulation 104, 115 (2001).
13. R.J. Lee,M.L. Springer,W.E. Blanco-Bose, R. Shaw, P.C. Ursell, andH.M. Blau. VEGFgene delivery to myocardium: deleterious effects of unregulated expression. Circulation102, 898 (2000).
14. T.B. Bentley, H. Meng, and R.N. Pittman. Temperature dependence of oxygen diffusionand consumption in mammalian striated muscle. Am J Physiol 264, H1825 (1993).
15. H. Yuan, D.J. Goetz, M.W. Gaber, A.C. Issekutz, T.E. Merchant, and M.F. Kiani.Radiation-induced up-regulation of adhesion molecules in brain microvasculature andtheir modulation by dexamethasone. Radiat. Res. 163, 544 (2005).
16. E.E. Burch, P. Shinde, R.T. Camphausen, M.F. Kiani, and D.J. Goetz. The N-terminalpeptide of PSGL-1 can mediate adhesion to trauma-activated endothelium via P-selectinin vivo. Blood 100, 531 (2002).
17. M. Fleiner, P. Benzinger, T. Fichert, and U. Massing. Studies on protein-liposomecoupling using novel thiol-reactive coupling lipids: influence of spacer length and polar-ity. Bioconjug. Chem. 12, 470 (2001).
18. B. Prabhakarpandian, D.J. Goetz, R.A. Swerlick, X. Chen, and M.F. Kiani. Expressionand functional significance of adhesion molecules on cultured endothelial cells inresponse to ionizing radiation. Microcirculation. 8, 355 (2001).
37 Modeling Oxygenation and Selective Delivery 343

Chapter 38
Hypobaric Hypoxia Reduces GLUT2 Transporter
Content in Rat Jejunum more than in Ileum
Elaine M. Fisher1, Xiaoyan Sun2, Bernadette O. Erokwu2,
and Joseph C. LaManna2
Abstract To define some of the specific cellular effects of chronic hypoxia onthe small intestine, we measured the concentration of glucose transporter2 (GLUT2) at two sites, the jejunum and ileum. Wister rats were subjected to21-day normoxia (n=6) or to continuous 21-day hypobaric hypoxiaapproximately 0.5 ATM (n=5). Western blot analysis was performed and theabundance of GLUT2 protein was quantified as relative densitometric unitsand normalized to actin. GLUT2 content was similar in the jejunum and ileumunder normoxic (jejunum = 0.65� 0.13 mean�SD; ileum = 0.56� 0.22 OD;mean difference 0.09, p=0.09) and hypoxic conditions (jejunum= 0.56� 0.14OD mean� SD; ileum = 0.58� 0.16; mean difference �0.01, p =0.42).GLUT2 decreased by 14% of the mean normoxic jejunal levels whereas ilealGLUT2 was slightly increased. A maximum decline in weight of 15% occurredat day 4 followed by a blunted rate of weight gain for rats in the hypoxic group.Thus, sustained exposure to hypobaric hypoxia reduced the availability ofGLUT2 for glucose transport in the jejunum. Regulating small intestinal con-tent of glucose transporters may be an important mechanism for tissue adapta-tion to chronic hypoxia. This finding provides initial insight into hypoxictolerance of the gut to chronic hypobaric hypoxic exposure.
38.1 Introduction
The gut is an important contributing organ for maintaining whole body glucosehomeostasis during normal physiological adaptation. Likewise, it plays a sig-nificant role in the protective, restorative, and pathological response to oxida-tive challenge. At altitudes greater than 4300 meters carbohydrate metabolism
1The University of Akron, College of Nursing, Akron, OH.2Case Western Reserve University, Department of Anatomy, School of Medicine,Cleveland, OH. Corresponding author: Elaine M. Fisher, e-mail: [email protected]
K.A. Kang et al. (eds.), Oxygen Transport to Tissue XXIX� Springer 2008
345

is impaired [1]. Acute anorexia, nausea and vomiting, weight loss, and malaise.
Roberts (1996) and others have described an increase in basal glucose uptake,
hyperinsulinemia, alterations in catecholamine concentrations, and increased
cortisol during acute exposure to altitude (2–7 days) [2]. Thus, the short-term
regulation of glucose may be controlled primarily by changes in insulin and
stress activation of the hypothalamic-pituitary-adrenal axis and less under the
influence of the metabolic rate [3]. Continued exposure to altitude (7–28 days)
however, has been characterized by a return of plasma glucose to baseline (sea
level) or lower values and a reduction in the metabolic rate [4]. These changes
suggest different regulatory pathways are in effect for short versus long-term
control.While studies have reported on whole body glucose transport, few studies
have reported the effect on glucose transport beyond the acute phase at altitude.
The body’s dependence on glucose as a major energy source at altitude led us to
examine the hypoxia induced response on the glucose transport system in the
small intestine to sustained hypobaric hypoxia. Approximately two-thirds of
glucose absorption in the intestine is by carrier-mediated facilitated diffusion.
Glucose transport protein 2 (GLUT2), the most abundant transporter in the
small intestine, is a high capacity transporter that exhibits low receptor speci-
ficity, hence, versatility in the type of hexose sugar transported (glucose, fruc-
tose, galactose) [5]. Histological differences along the small intestine suggest
absorption may vary by site (jejunum and ileum); therefore, we partitioned the
small intestine to account for potential differences. We measured the concen-
tration of GLUT2 at two major absorptive sites in the small intestine, the
jejunum and ileum, to define some of the specific cellular effects of sustained
hypobaric hypoxia on glucose transport.
38.2 Methods and Materials
38.2.1 Animal Preparation
Eleven male, Wistar rats were fed standard rat chow with unlimited access to
food and water. Rats were weighted on day 1, 2, 4, 12, 19, and 21. Rats in the
normoxic group were kept at room atmosphere condition throughout protocol.
Animals in the hypoxic group (n=5) were placed in hypobaric chambers for
21 days at a constant pressure of 0.5 ATM, except for up to one-hour twice
weekly as needed to change cages. For comparison, 0.5 ATM (380 mm Hg) is
the equivalent of exposure to approximately 10% oxygen at 1 ATM. At the end
of 21 days, deep anesthesia was induced with 3-5% isoflorane, followed by
immediate decapitation, and tissue retrieval. Institutional approval was
obtained prior to initiating experiments.
346 E.M. Fisher et al.

38.2.2 Tissue Retrieval and Processing
The jejunum was excised approximately 1/3 of the way down the length of thesmall intestine and at the terminal ileum, 2.5 cm proximal to the cecum. Becauserats were used for more than one experiment, they were not fasted and food wasfound in the intestine. Excrement was freed from the intestine by making alongitudinal cut in the intestine and flushing with 48C phosphate buffered salinesolution (PBS). Tissues were blotted, immediately frozen in liquid nitrogen, andstored at –808C until analysis.
Total protein content was isolated from the jejunum and ileum. Intestinalmembrane proteins were solubilized in RIPA buffer (50mMTris HCL pH8, 150mM NaCl, 1% NP-40, 0.5% sodium deoxycholate, 0.1% SDS, 2 mM EDTA,and 1 mM Na3VO4), supplemented with one protease inhibitor cocktail tablet(Roche) per 10 mL RIPA. Tissues were homogenized and rotated for 2 hours inthe cold room. Tissue lysates were cold centrifuged at 14,000 rpm for 30 minutesand supernatants were collected. Protein concentrations were determined byBradford protein assay with bovine serum albumin as the standard (Bio-Rad).
38.2.3 Western Blot Analysis
Samples were diluted with 2XLaemmli buffer and boiled at 1008C for 5minutes.Seventy-five micrograms of total protein were loaded per lane onto a 10%sodium polyacrylamide gel and electrophoresed. Gel proteins were electro-blotted onto a nitrocellulose membrane (75 minutes at 100V). The membranewas blocked for 1 hour with 7.5% nonfat milk and incubated in 7.5% nonfatmilk overnight at 48C with polyclonal rabbit C-terminus GLUT2 antiserumdiluted 1:1000 (Santa Cruz Biotechnology Inc., Santa Cruz, CA). The mem-brane was washed with TBST (TBSþ 0.1% Tweens; 10 minutes � 3) followedby 1 hour incubation at room temperature with a secondary antibody, donkey-anti-rabbit IgG (1:7000). A positive control, human whole cell lysate - glioblas-toma was used to verify the GLUT2 band location (sc-2411; Santa CruzBiotechnology Inc., Santa Cruz, CA). An enhanced chemiluminescencedetection system (ECL kit, Amersham) was used to visualize the primaryantibody immunoreactive protein bands.
38.2.4 Statistical Methods
The abundance of GLUT2 protein was quantified as relative densitometricunits and normalized to actin. Data are reported as mean � SD. A pairedt-test was used to compare sites (jejunum, ileum) at condition (normoxia,hypoxia). The level of significance was defined as p� 0.05.
38 Hypobaric Hypoxia throughout Reduces GLUT2 347
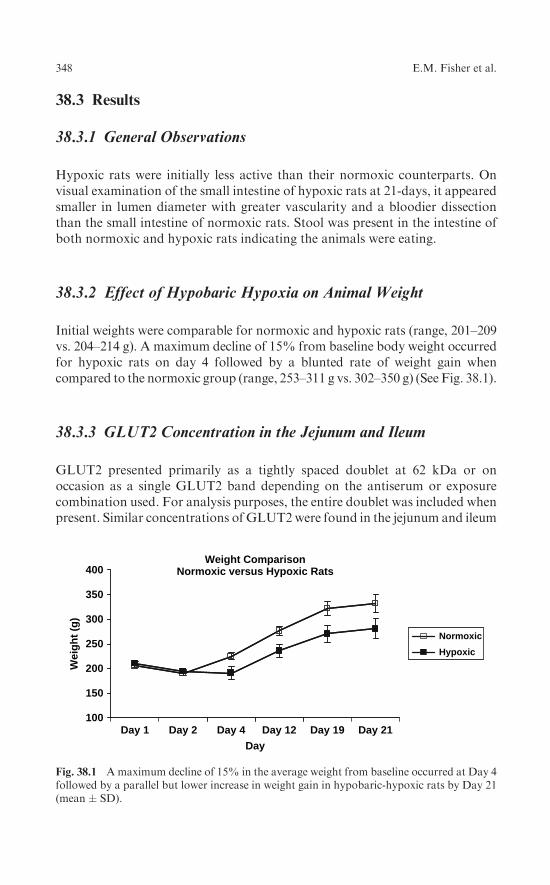
38.3 Results
38.3.1 General Observations
Hypoxic rats were initially less active than their normoxic counterparts. Onvisual examination of the small intestine of hypoxic rats at 21-days, it appearedsmaller in lumen diameter with greater vascularity and a bloodier dissectionthan the small intestine of normoxic rats. Stool was present in the intestine ofboth normoxic and hypoxic rats indicating the animals were eating.
38.3.2 Effect of Hypobaric Hypoxia on Animal Weight
Initial weights were comparable for normoxic and hypoxic rats (range, 201–209vs. 204–214 g). A maximum decline of 15% from baseline body weight occurredfor hypoxic rats on day 4 followed by a blunted rate of weight gain whencompared to the normoxic group (range, 253–311 g vs. 302–350 g) (See Fig. 38.1).
38.3.3 GLUT2 Concentration in the Jejunum and Ileum
GLUT2 presented primarily as a tightly spaced doublet at 62 kDa or onoccasion as a single GLUT2 band depending on the antiserum or exposurecombination used. For analysis purposes, the entire doublet was included whenpresent. Similar concentrations of GLUT2were found in the jejunum and ileum
100
150
200
250
300
350
400Weight Comparison
Normoxic versus Hypoxic Rats
Day 1 Day 2Day
Day 4 Day 12 Day 19 Day 21
Wei
gh
t (g
)
Normoxic
Hypoxic
Fig. 38.1 Amaximum decline of 15% in the average weight from baseline occurred at Day 4followed by a parallel but lower increase in weight gain in hypobaric-hypoxic rats by Day 21(mean � SD).
348 E.M. Fisher et al.

under both normoxic (0.65� 0.13 OD, mean� SD and 0.56� .22; mean differ-
ence 0.09, p = 0.09) and hypobaric hypoxic conditions (0.56 þ 0.14 OD,
mean� SD and 0.58þ 0.16; mean difference 0.01, p = 0.42) (See Fig. 38.2).
The jejunum to ileum ratio under normoxic conditions was 1.2� 0.3 which fell
to 1.0� 0.2 during hypoxia.Figure 38.3 represents a comparison of jejunal GLUT2 and ileal GLUT2
content under the conditions of normoxia and hypobaric hypoxia at 21-days.
While not statistically significant, a consistent observation on blots revealed a
decline in jejunal GLUT2 with hypoxia. GLUT2 decreased to 14% of mean
control jejunal levels. Conversely, a small increase (< 3%) in ileal GLUT2 was
detected.
1.0
0.9
0.8
0.7
0.6
0.5
0.4
0.3
0.2
0.1
0.0
OD
1.0
0.9
0.8
0.7
0.6
0.5
0.4
0.3
0.2
0.1
0.0
OD
Normoxic HypoxicJejunum
Normoxic Hypoxiclleum
Fig. 38.2 A 14% reduction in the average concentration of GLUT2 transporters was foundbetween normoxic and hypoxic animals.
60.4 kDa
35.1 kDa
Glut2
β-Actin
N HHN(+)
Jejunum lleum
Fig. 38.3 GLUT2 concentration in the jejunum and ileum under normoxic (N) and hypoxic(H) condition, where (þ) = positive control, human whole cell lysate, oligoblastoma.
38 Hypobaric Hypoxia throughout Reduces GLUT2 349

38.4 Discussion
Exposure to a continuous 21 day simulated high altitude of approximately5300 m resulted in a decline in GLUT2 content in the jejunum while a smallincrease in ileal GLUT2 was noted. The lack of a substantial difference in ileal
GLUT2 may relate to our choice of sample site. To avoid misidentification oftissue between the jejunum and ileum, we sampled from the terminal ileumwhich may play a lesser role in glucose absorption. The maximal decline inweight loss experienced by rats during acute hypoxia followed by the bluntedrate of weight gain when compared to normal controls is consistent withchanges reported in the literature.
Glucose homeostasis differs for acute versus prolonged hypoxic exposure ataltitude. Acute hypoxic exposure (4300–5500 m) is characterized by increasedplasma glucose uptake and hyperinsulinemia, the presence of these two findingsis suggestive of insulin resistance [4]. Other studies examining the neurohormo-nal stress response to acute changes at altitude report transient increases insympathetic activity and cortisol, with no change in growth hormone. Theseacute findings suggest mechanisms for the initial changes in glucose are directlyregulated by insulin and other stress related hormones, and indirectlyinfluenced by changes in metabolism [6].
Alterations in glucose uptake, insulin release, catecholamines, and cortisolstabilized between 7–10 days of altitude exposure suggesting differentmechanisms are responsible for regulating glucose homeostasis for long-term control. With more prolonged exposure to altitude, stabilization ofplasma glucose levels at or slightly below sea level values were noted [2].Previously reported plasma glucose levels at 21-day hypobaric hypoxic con-dition were 9.4 � 1 mM, a return toward baseline levels of 9.3 � 1.4 mM [7].Plasma glucose is regulated by the liver. The down-regulation we saw inGLUT2 transporters in the jejunum as well as the decline in the jejunal:ilealratio during hypoxia may be that metabolism is a necessary signal for changesin the transport of glucose across the enterocyte and into the circulation.Diamond and Ferraris hypothesized the number of glucose transporters mustbe matched to metabolic demand to achieve a maximal effective transport ofglucose to the blood. Down-regulation may be adaptive to balance the cost ofbiosynthesis and maintenance of GLUT2 transporters with changing meta-bolic demand. Alterations in absorption and transport of glucose as related tometabolism may be explained as: the change in metabolism produces changesin intracellular glucose concentration thereby altering the concentration gra-dients that determine the facilitated component of transport. While a reduc-tion in metabolic rate seems a likely mechanism, one study examining GLUTtransport in heart and skeletal muscle after 28-days of hypobaric hypoxia,reported no change in metabolic enzymes or oxidative capacity (lactatedehydrogenase, pyruvate kinase, hexokinase, citrate synthase, malate dehy-drogenase) with hypobaric hypoxia [8].
350 E.M. Fisher et al.

The longer time period for adaptation may allow for other adjustments tooccur in glucose regulation but at present the mechanisms are unknown. Forexample, activation of apoptotic and/or inflammatory pathways may signal thedown-regulation of GLUT2 protein content. Other pathway changes to opti-mize the use of glucose during chronic hypobaric hypoxia may also occur. Ourmeasurement of GLUT2 using Western blot analysis provided no insight intothe efficiency of carrier function in relation to the metabolic state. Therefore, itremains unknown whether adaptation in glucose transport at altitude is inresponse to the metabolic state or from other triggered pathways.
The down-regulation we noted in GLUT2 to a sustained hypobaric hypoxicstimulus does not hold for all tissue-specific glucose transporters. Dill andcolleagues (2001) reported a persistent elevation of GLUT4 in the heart, whilein the soleus and plantaris muscle they demonstrated an initial increase inGLUT4 content (7 day) followed by a return to control levels at 28 dayhypobaric hypoxia. When cardiac GLUT1 (a second glucose transport proteinpresent in heart tissue) was evaluated, this transporter responded in a mannersimilar to GLUT2 changes in the small intestine. An increase in GLUT1transporter occurred at 7 days followed by a decline toward baseline by 28days. Thus, glucose transporter content is regulated by the duration of exposureto hypobaric hypoxia as well as by a tissue-specific response [8].
In conclusion, chronic exposure to hypoxia reduced the concentration of theglucose transporter GLUT2 in the jejunum with little effect on GLUT2 contentin the ileum. Hypobaric hypoxic-induced alterations in basal glucose transportcapacity may serve as a protective mechanism against ischemia. Regulatingsmall intestinal content of glucose transporters may be an important mechan-ism for tissue adaptation to chronic hypoxia. This finding provides initialinsight into hypoxic tolerance of the gut to chronic exposure.
Acknowledgment This work was supported by a NIH:NINR Mentored Scientist Award –KO1 NR009787-01 and a Nursing Research Award (The University of Akron, College ofNursing, Akron, OH), both to the first author. Special thanks are extended to ConstantinosTsipis for his assistance with densitometry and figure preparation.
References
1. G.A. Brooks, G.E. Butterfield, R.R. Wolfe, B.M. Groves, R.S. Mazzeo, J.R. Sutton,E.E. Wolfel, and J.T. Reeves, Increased dependence on blood glucose after acclimatiza-tion to 4,300 m, J. Appl. Physiol. 70:919 (1991).
2. J.J. Larsen, J.M. Hansen, N.V. Olsen, H. Galbo, and F. Dela, The effect of altitudehypoxia on glucose homeostasis in men, J. Physiol. 504 ( Pt 1):241 (1997).
3. K.M. Oltmanns, H. Gehring, S. Rudolf, B. Schultes, S. Rook, U. Schweiger, J. Born,H.L. Fehm, and A. Peters, Hypoxia causes glucose intolerance in humans, Am. J.Respir. Crit. Care Med. 169:1231 (2004).
4. A.C. Roberts, J.T. Reeves, G.E. Butterfield, R.S. Mazzeo, J.R. Sutton, E.E. Wolfel, andG.A. Brooks, Altitude and beta-blockade augment glucose utilization during submaximalexercise, J. Appl. Physiol. 80:605 (1996).
38 Hypobaric Hypoxia throughout Reduces GLUT2 351

5. C.I. Cheeseman, GLUT2 is the transporter for fructose across the rat intestinal basolateralmembrane, Gastroenterology 105:1050 (1993).
6. G.L. Kellett, A. Jamal, J.P. Robertson, and N. Wollen, The acute regulation of glucoseabsorption, transport and metabolism in rat small intestine by insulin in vivo, Biochem.J. 219:1027 (1984).
7. K. Xu, M.A. Puchowicz, and J.C. LaManna, Renormalization of regional brain bloodflow during prolonged, R.P. Dill, S.G. Chadan, C. Li, and W.S. Parkhouse, Aging andglucose transporter plasticity in response to hypobaric hypoxia, Mech. Ageing Dev.122:533 (2001).
8. R.P. Dill, S.G. Chadan, C.Li, and W.S. Parkhouse, Aging and glucose transporter plas-ticity in response to hypobaric hypoxia, Mech. Ageing Dev. 122:533 (2001).
352 E.M. Fisher et al.

Chapter 39
Modeling Oxygen and Carbon Dioxide
Transport and Exchange Using a Closed
Loop Circulatory System
Brian E. Carlson1, Joseph C. Anderson
1, Gary M. Raymond
1, Ranjan K. Dash
2,
and James B. Bassingthwaighte1
Abstract The binding and buffering of O2 and CO2 in the blood influence theirexchange in lung and tissues and their transport through the circulation. Toinvestigate the binding and buffering effects, a model of blood-tissue gasexchange is used. The model accounts for hemoglobin saturation, the simulta-neous binding of O2, CO2, H
þ, 2,3-DPG to hemoglobin, and temperatureeffects [1,2]. Invertible Hill-type saturation equations facilitate rapid calcula-tion of respiratory gas redistribution among the plasma, red blood cell andtissue that occur along the concentration gradients in the lung and in thecapillary-tissue exchange regions. These equations are well-suited to analysisof transients in tissue metabolism and partial pressures of inhaled gas. Themodeling illustrates that because red blood cell velocities in the flowing bloodare higher than plasma velocities after a transient there can be prolongeddifferences between RBC and plasma oxygen partial pressures. The blood-tissue gas exchange model has been incorporated into a higher level model ofthe circulatory system plus pulmonary mechanics and gas exchange using theRBC and plasma equations to account for pH and CO2 buffering in the blood.
39.1 Introduction
The exchange of O2 and CO2 between the tissue and vasculature depends onadequate delivery and removal of these gases. Oxygen delivery begins withinhalation of ambient air into the airspaces of the lung, transport to the bloodfrom the alveoli, transport through the arterial system, and then exchangebetween the blood and the peripheral tissue. In a closed circulatory system,venous blood returns to the lungs where CO2 is expired. Quantifying O2 andCO2 transport requires accounting for their solubility in plasma, RBCsand tissue as well as their binding and release from the hemoglobin (Hb) in
1Department of Bioengineering, University of Washington, Seattle, Washington, 98195.2Department of Physiology, Medical College of Wisconsin, Milwaukee, Wisconsin, 53226.
K.A. Kang et al. (eds.), Oxygen Transport to Tissue XXIX� Springer 2008
353

the RBCs and, in addition, for O2 only, its binding to myoglobin in tissue.Hemoglobin dissociation curves were developed that described the fraction ofO2 and CO2 bound to Hb in the steady state as a function of PO2, PCO2, pH,2,3-DPG and temperature [1]. These expressions were used to describe thesteady state transport of O2 and CO2 as well as H
þ and HCO3- in a blood-tissue
exchange model with convective transport and axial diffusion in the capillaryalong with exchange and metabolism in the surrounding tissue region [2].
The model presented in this study accounts for ventilatory exchange betweenoutside air and lung alveoli, exchange with alveolar capillary blood, convectivetransport in arteries, the exchange in tissue capillaries and arterioles, and returnof venous blood to the lungs. The model describes transport of O2 and CO2 totissue as influenced by respiration rate, composition of inspired gas, Hþ andCO2 production and O2 consumption in tissue and buffering in the blood.
A feature of biophysical interest but modest physiological importance is thepersistence of disequilibria between plasma and RBC PO2 due to the highervelocities of RBC than plasma. This difference in velocity exists in all regions ofthe vasculature but is at a maximum in the microcirculation. Bloch [3] observedthe existence of a layer of plasma close to the vessel wall, which he called theperipheral plasma layer. The average ratio of total layer thickness to vesselinside diameter was 1:4 in the 5-10 mm capillariies in Bloch’s study, which agreeswith more recent observations of the endothelial surface layer seen by Vink andDuling [4]. Because this layer is close to the capillary wall the velocity of theplasma in that region is slower than the centerline axial velocity of the RBCs.To quantify the relative velocity ratio of RBC to plasma we have looked atindicator dilution studies that document the mean transit time of RBC-taggedversus plasma-tagged indicators by Goresky [5]. Goresky showed that the meantransit time of RBCs was on the order of 2/3 of that of the plasma through theentire hepatic vasculature.
39.2 Description of the Model
39.2.1 Lung-Blood Exchange Region
The lung module is composed of three serial compartments [6]: a low compli-ance compartment representing the oral/nasal cavity and the cartilaginous air-ways, a moderately compliant compartment characterizing the collapsiblebronchial airways and a high compliance compartment resembling the alveolarspace. In the model, the lung can be ventilated by positive pressure or byperiodic chest expansion reducing intrapleural pressure, both resulting in bi-directional airflow and inflation and deflation of the lung. Convective flowbetween compartments is modeled as pressure-driven flow through a resistance.Equations for convective and diffusive transport of oxygen and carbon dioxidebetween adjacent lung compartments are similar to those used in previous
354 B.E. Carlson et al.

models [6]. Each lung compartment is assumed to be well-mixed. The alveolar
compartment exchanges respiratory gases with the plasma region of a blood-
tissue exchange unit [2], which contains a region of red cells surrounded by a
plasma region. The inhaled partial pressure of each species is a model input.
39.2.2 Blood-Tissue Exchange Region
Figure 39.1 shows a previously described one-dimensional blood-tissue
exchange model [2]. The lumen of a permeable vessel is divided into a flowing
core of RBCs surrounded by a plasma sleeve. Hemoglobin binding is repre-
sented in the RBC region by the invertible hemoglobin dissociation expressions
[1]. The exchange vessel endothelial barrier is treated as purely passive and is
surrounded by an interstitial fluid layer giving access to parenchymal cells. In
the parenchymal cells, where myoglobin buffers O2, oxygen is consumed and
CO2 is produced in accord with the respiratory quotient: RQ= moles CO2 per
mole O2 and a specified metabolic rate. Each region is axially-distributed, exhi-
biting concentration gradients from entrance to exit but well-mixed radially, and
is represented by a 1-dimensional partial differential equation. Interregional
conductances, defined by the permeability surface area product (PSx), can beadjusted to accommodate slow diffusional processes. Axial diffusion or disper-
sion (Dx) smoothes the axial concentration gradients.The ratio of RBC to plasma velocity in the blood tissue exchange region was
calculated using experimental morphometric data on intramyocardial arterioles
Outflow: O2 , CO2 , HCO−3 , H+
Inflow: O2 ,CO2 , HCO−3 , H+
Plasma (pl)
InterstitialFluid (isf)
ParenchymalCell (pc)
PScap
PSrbc
V′rbc
V′pl
Red BloodCell (rbc)
O2 + Hb
O2 + Mb
HbO2
MbO2
CO2
oGpc
CO2 + Hb HbCO2
Dpl
Drbc
Disf
DpcO2
PSpc
Fpl ,Vpl
Frbc ,Vrbc
V ′pc
V ′isf
Fig. 39.1 Blood-tissue exchange unit showing red blood cell, plasma, interstitial fluid, andparenchymal cell regions, convection of RBC and plasma, solute transport between regions,the PSs, axial diffusion, binding, and buffering within regions. Bicarbonate buffering occursin all regions. Each region is axially-distributed and radially well-mixed.
39 Closed Loop Circulatory Model 355

and venules fromKassab et al [7]. and the reduction in hematocrit as a functionof vessel diameter documented by Lipowsky [8]. In our model we have repre-sented the blood tissue exchange region as the arterioles and capillaries smallerthan 100 mm in diameter because studies by Duling and Berne [9] show sig-nificant oxygen loss in the precapillary arterioles. For porcine coronary branch-ing trees of Kassab, flow through the blood tissue exchange region has a relativevelocity ratio, vRBC/vpl, of 1.2 to 1.9. Therefore an intermediate value of vRBC/vpl, was taken as 1.5 in lung and tissue exchange regions.
39.2.3 Arterial and Venous Convective Regions
Lung capillary blood is carried through nonexchanging convective conduits(left atrium, left ventricle, aorta, arteries) to the tissue. RBC-plasma soluteexchange continues. Red cell-plasma concentration differences persist whentheir velocities differ. Metabolism is zero, but buffering reactions continue.Values of the ratio of RBC to plasma velocity in the arteries and veins weretaken to be 1.1 and 1.05 respectively, though the choice of these numbers isdependent on the range of diameters represented.
39.2.4 Numerical Methods and Simulation Procedures
Numerical methods are those described previously [10] using a Lagrangiansliding fluid element algorithm. Other partial differential equation solvers (Mac-Cormack, TOMS 731) are also available under the JSim simulation system.Parameter values in this model were those used previously [2] with a fewexceptions. The flow rate is allowed to range from 5 L/min at rest to 25 L/minduring exercise. Also the permeability surface area product for the RBCs(PSRBC) has been recalculated according to experimental evidence [11] to reflectthe combination of a small hindrance to permeation of its membrane and thetimes required for binding and unbinding. The hemoglobin equations incor-rectly assume instantaneous equilibration instead of taking severalmilliseconds. The lung model described here is similar in structure to themodel by Lutchen et al. [6].
39.3 Results and Discussion
Two cases are examined in this study. The first concerns respiratory gas trans-port during normal and elevated ventilation, perfusion, and metabolism. Fornormal levels, the parameters are respiratory rate of 12 breaths/min, tidalvolume of �500 ml driven by 10 mmHg of inspiratory positive pressure at themouth for 2 seconds and inspired air with PO2 = 150 and PCO2 = 0 mmHg.
356 B.E. Carlson et al.

Blood flow was set to �5 L/min and metabolic rate was adjusted so pulmonaryend-capillary blood partial pressures of O2 and CO2 were�100 and�40mmHgwhile venous values were 70 and 45 mmHg. The end tidal PO2 was 105 and PCO2
was 34 mmHg. The second case focuses on the equilibration of O2 betweenplasma and RBCs upon entering the arterial region and the effect of the relativevelocity difference between plasma and RBCs on equilibration. To investigatethe equilibration, the plasma partial pressure of oxygen is increased from 25 to100mmHg and the transient effects are observed. To investigate the effect of therelative velocity difference, a pulsed increase in plasma PO2 is applied at theupstream end and the difference between the plasma and RBC PO2 is quantifiedalong the length of the arterial region.
39.3.1 Respiratory Gas Transport
Figure 39.2 shows that the breathing cycle causes a cyclical variation in the partialpressures of O2 and CO2 in bronchiolar and alveolar air and in capillary plasma.Dispersion along the airways dampens the magnitude of the fluctuations. Thepartial pressure of CO2 in plasma is almost unaffected by the ventilatory cyclebecause it is buffered by the large bicarbonate pool in the blood.
To load the red blood cell (RBC) with oxygen, oxygen moves from the well-mixed alveolar space through the plasma and into the RBC as the red blood cellmoves along the length of the capillary. The relative speeds of these processes
Fig. 39.2 Displays the partial pressures of O2 and CO2 in the plasma region of the blood (pl),the alveoli (alv), and the collapsible airways (bronch).
39 Closed Loop Circulatory Model 357

cause an axial and radial oxygen gradient to be established in the pulmonarycapillary.Under normal conditions (given above), a large gradient between theplasma and RBC appears as the blood enters the capillary and disappears afterthe plasma and RBC have traveled �40% of the capillary length (Fig. 39.3).However, if the normal ventilation (Falv,0) and perfusion (F0) rate are bothincreased 3-fold (to offset a corresponding increase in tissue O2 metabolism),the initial gradient between plasma and RBC increases and the two regions onlyequilibrate after traversing �80% of the capillary length. A 5-fold increase inventilation and perfusion causes the two blood components to never equilibratewhile in the pulmonary capillary.
39.3.2 Disequilibrium Between pO2 in Plasma and RBCs in Arteries
When RBC and plasma velocities are equal then equilibration across the RBCmembrane occurs rapidly with a time constant governed by PSRBC/Vpl. Incontrast, when vRBC/vpl > 1 there is a continuing disequilibrium. To showthis, the arterial module is isolated from the rest of the closed loop modeland beginning with equilibrated PO2 at 25mmHg the plasma PO2 is increasedto 100 mmHg while leaving the RBC PO2 unchanged. The relative velocity isgiven a value of 1.5 to illustrate the relative disequilibrium. In this simulationthe concentration front has traveled about 7 cm. before the RBC and plasmaconcentrations equilibrate. Beyond this, the RBCs near the wavefront of
Fig. 39.3 Oxygen partial pressure gradients between the plasma and red blood cell (�PO2) atend-exhalation for a normal ventilation rate (Falv,0) and blood flow (F0) and when ventilation,blood flow, and metabolism are increased by 3-times and 5-times the normal rates. �PO2 =PO2 (plasma) � PO2 (RBC).
358 B.E. Carlson et al.

heightened plasma PO2, having taken up O2, advance in the central streamahead of the plasma front and release O2 into the plasma where the PO2 is still25 mmHg. This process of RBCs taking upO2 behind the plasma front and thenreleasing it to raise the plasma PO2 continues. In Fig. 39.4 are shown plots of the�PO2 across the RBC membrane as a function of position along the aorta at 4times, a tenth of a second apart after the step increase in plasma PO2 at x = 0and t = 0. Initially the �PO2 is �75 mmHg, but is quickly dissipated as plasmaO2 enters the huge sink of the RBC Hb. Then as the RBCs that have taken upoxygen from the plasma advance ahead of the depleted plasma layer, they havea slightly higher PO2 than that in the plasma that had entered the tube before thepulsed increase and therefore lose oxygen to the plasma. The peak in �PO2
travels at vRBC = 25 cm/s. This peak �PO2 is very small because the carryingcapacity for O2 in plasma is so small compared to that of RBC. The �PO2 islarger when RBCs are fully loaded as they travel through a region where oxygenis consumed in tissue; it is high when PScap is high compared to PSRBC and lowin the reverse situation. It is relevant to the interpretation of plasma PO2 asmeasured by oxygen-dependent phosphorescent probes [12].
39.4 Conclusions
We have linked together a series of blood-tissue gas exchange models with amodel of gas transport in the lung to describe respiratory gas exchange betweenthe lung and tissue via circulating blood. We illustrated that changes in
Fig. 39.4 Difference in partial pressure of O2 between RBC and plasma along vessel lengthfor a Gaussian shaped pulsed increase in plasma PO2 at the vessel entry. The four curvesrepresent the pulse at four different times.
39 Closed Loop Circulatory Model 359

metabolism causing increases in CO2 production and O2 consumption can becompensated by simultaneous increases in ventilation and perfusion. O2 gradi-ents between the plasma and red blood cell can persist along the length of thepulmonary capillary and in the arterial system because RBCs have highervelocities than plasma. The model is ideally suited for investigating questionsconcerning the integrative effects of pulmonary ventilation, chemical bindingkinetics, vascular transport, and tissue metabolism on whole body respiratorygas exchange.
Acknowledgment This research has been supported by NIH/BE-O1973 and HL 073598 andNSF 0506477. Erik Butterworth provided JSim support and assistance in representing thismodel code in Mathematical Modeling Language (MML). JSim and the model can bedownloaded from www.physiome.org.
References
1. R. K. Dash and J. B. Bassingthwaighte, Blood HbO(2) and HbCO(2) dissociation curvesat varied O-2, CO2, pH, 2,3-DPG and temperature levels, Ann Biomed Eng 32(12),1676–1693 (2004).
2. R. K. Dash and J. B. Bassingthwaighte, Simultaneous blood-tissue exchange of oxygen,carbon dioxide, bicarbonate, and hydrogen ion, Ann Biomed Eng 34(7), 1129–1148(2006).
3. E. H. Bloch, A quantitative study of the hemodynamics in the living microvascularsystem, Am J Anat 110(2), 125–153 (1962).
4. H. Vink and B. R. Duling, Identification of distinct luminal domains for macromolecules,erythrocytes, and leukocytes within mammalian capillaries, Circ Res 79(3), 581–589(1996).
5. C. A. Goresky, A linear method for determining liver sinusiodal and extravascularvolumes, Am J Physiol 204(4), 626–640 (1963).
6. K. R. Lutchen, F. P. Primiano and G. M. Saidel, A non-linear model combiningpulmonary mechanics and gas concentration dynamics, IEEEE Trans Biomed Eng29(9), 629–641 (1982).
7. G. S. Kassab, C. A. Rider, N. J. Tang and Y. C. B. Fung, Morphometry of pig coronaryarterial trees, Am J Physiol Heart Circ Physiol 265(1), H350–H365 (1993).
8. H. H. Lipowsky, S. Usami and S. Chien, Invivo measurements of apparent viscosity andmicrovessel hematocrit in the mesentery of the cat, Microvasc Res 19(3), 297–319 (1980).
9. B. R. Duling and R.M. Berne, Longitudinal gradients in periarteriolar oxygen tension: Apossible mechanism for participation of oxygen in local regulation of blood flow, Circ Res27(5), 669–678 (1970).
10. J. B. Bassingthwaighte, I. S. J. Chan and C. Y. Wang, Computationally efficient algo-rithms for convection-permeation-diffusion models for blood-tissue exchange, AnnBiomed Eng 20(6), 687–725 (1992).
11. K. Dalziel and J. R. P. O’Brien, The kinetics of deoxygenation of human haemoglobin,Biochem J 78(236–245 (1961).
12. J. M. Vanderkooi, G. Maniara, T. J. Green and D. F. Wilson, An optical methodfor measurement of dioxygen concentration based upon quenching of phosphorescence,J Biol Chem 262(12), 5476–5482 (1987).
360 B.E. Carlson et al.

Chapter 40
Effect of Alternate Energy Substrates
on Mammalian Brain Metabolism
During Ischemic Events
S.S. Koppaka1,2, M.A. Puchowicz
2,3, J.C. LaManna
2,3, and J.E. Gatica
1,2
Abstract Regulation of brain metabolism and cerebral blood flow involvescomplex control systems with several interacting variables at both cellular andorgan levels. Quantitative understanding of the spatially and temporally hetero-geneous brain control mechanisms during internal and external stimuli requiresthe development and validation of a computational (mathematical) model ofmetabolic processes in brain. This paper describes a computational model ofcellularmetabolism in blood-perfused brain tissue, which considers the astrocyte-neuron lactate-shuttle (ANLS) hypothesis. The model structure consists of neu-rons, astrocytes, extra-cellular space, and a surrounding capillary network. Eachcell is further compartmentalized into cytosol and mitochondria. Inter-compart-ment interaction is accounted in the form of passive and carrier-mediated trans-port. Our model was validated against experimental data reported by Crumrineand LaManna, who studied the effect of ischemia and its recovery on variousintra-cellular tissue substrates under standard diet conditions. The effect ofketone bodies on brain metabolismwas also examined under ischemic conditionsfollowing cardiac resuscitation through our model simulations. The influence ofketone bodies on lactate dynamics on mammalian brain following ischemia isstudied incorporating experimental data.
40.1 Introduction
The onset and recovery from cardiac arrest has been associated with loss ofneurologic function. Ischemia leads to the loss of intracellular cerebralmetabolites and increased lactate in brain. Ischemia and onset of reperfusionhave been associated with lactate accumulation in brain. The restoration of
1Department of Chemical and Biomedical Engineering, Cleveland State University,Cleveland, OH.2Center for Modeling Integrated Metabolic Systems (MIMS), Cleveland, OH.3Department of Anatomy, School of Medicine, Case Western Reserve University,Cleveland, OH.
K.A. Kang et al. (eds.), Oxygen Transport to Tissue XXIX� Springer 2008
361

neurological function is related to the ability of the brain to recover after anischemic event. The extent of restoration is dependent upon many variables.Energetics is one such variable that is known to play a major role in the degreeof outcome. It is known that anaerobic glycolysis, as a result of an ischemicevent, is associated with the accumulation of extra-cellular lactate in braintissue. Understanding the relationship between glucose metabolism, its com-partmentation, and energetics can help discern the mechanism responsible forcellular damage during oxidative stress. Theories have been proposed in anattempt to explain these relationships.
One of the widely accepted theories, the ‘‘classical’’ view is still considered bymany to be the underlying mechanism explaining brain metabolism. This theoryproposes that glucose is taken up by both neurons and astrocytes (review [1]),where it is completely oxidized in both cell types through the aerobic (tricar-boxylic acid cycle) and anaerobic (glycolysis) biochemical pathways. Evidencesupporting this suggests that glucose is transported to the neurons by the GLUTtransporter system and is readily available to the neurons [2,3]. This is contrary toan alternate view point, referred to as the Astrocyte-Neuron Lactate Shuttle(ANLS), which says that lactate is the primary energy substrate to neuronproduced through the metabolic pathways in the astrocyte.
In the early 1990s, it was suggested that lactate produced anaerobically in theastrocyte is shuttled through the extra-cellular space to the neuron as itsprincipal energy substrate (ANLS) [4,5]. They proposed that the lactate trans-port from the astrocyte to the neuron is based on a demand based regulatorymechanism. This theory was thought to unify the coupling between brainactivity and the astrocytic-neuronal metabolism providing an additionalperspective in the metabolic modeling of the brain.
Dienel and Hertz [6] observed that the production of lactate increases in thebrain under certain conditions and that it is important that lactate be clearedfrom the cells where it has been produced (due to the redox mechanisms ofNAD/NADH). However, they seem to disagree with the theory that lactate isre-accumulated and used as a neuronal fuel. Gjedde et al. [7] stimulated theneuron at different degrees and found that neurons in the baseline conditionsustain no net import of pyruvate or lactate in vivo. The changes in metabolism,in fact, are linked to the additive increase in the efferent and afferent activity ofthe brain. A critical review of the ANLS suggests that the possibility of lactatebeing used as a fuel by brain cannot be completely ruled out owing to theheterogeneity of the cells, however, this scenario is limited to certain conditionssuch as hypoglycemia [1].
More recently, Aubert et al. [8,9] presented a model, an extension of theirprevious models. They modeled the brain as comprised of four compartments.The brain was artificially stimulated and they studied the flux of lactate in thesub and extra-cellular compartments. Based on their model, they show thatANLS holds well in the control and excited conditions of the neurons. Theyexplain that the two theories do not contradict each other; rather seem to workconcomitantly in explaining the mechanism of metabolism. Using [13] C NMR
362 S.S. Koppaka et al.

methodology, Hyder et al. [10] emphasize the importance of the contribution of
the astrocyte metabolism of glucose to total glucose metabolism.It is viewed that brain relies solely on glucose supplied by the periphery for its
metabolism and also has little anaerobic capacity with only enough glycogen
storage for twominutes of glycolysis during oxygen deprivation [11,12]. Experi-
mental evidence strongly indicates that oxidation of alternate energy substrates
such as ketone bodies supplement glucose metabolism in brain during
conditions of starvation [12,13]. The utilization of ketone bodies by brain
during insufficient glucose supply seems logical since the brain’s survival is
vital. However, the relative percent of ketone bodies used as an oxidative
substrate remains unclear but is thought to be dependent on the duration of
ketosis and the transporter capacity. It has been reported that the influx of
ketone bodies in the brain depends on the blood concentration of the beta
hydroxybutyrate and the activity of the monocarboxylate transporter [14].
Studying ketone body metabolism is an approach to testing other metabolic
models since their transporter and compartmentalization are different than
glucose, but are likely to be similar to those of lactate.It has been proposed that the long associated fear of ketosis is exaggerated
and state that ketone bodies may provide a better source of energy per brain per
unit oxygen [15]. Ketone bodies have been theorized to decrease cell death in
neurologic and genetic disorders like Alzheimer’s and Parkinson’s disease.
Ketone bodies have been able to protect neurons in culture and this suggests
that the altered energy metabolism in the mitochondria contributes to the
patho-physiology of the brain diseases [16]. It has been suggested that ketone
bodies are produced by astrocytes and then used together with the lactate
produced by the astrocytes to sustain neuronal oxidation [17]. Recently,
the effect of ketones on neurons for glutamate toxicity on a rat model was
examined [18]. They found that pre-treating the hippocampal cell of a mouse
with acetoacetate and b-hydroxybutyrate had a protective effect against gluta-
mate toxicity.Recently, the effect of chronic hypoxia was investigated, during ketosis
induced by diet on the lactate and ketone levels in the tissue [19]. They devel-
oped a rat model of ketosis by feeding a high fat diet (no carbohydrate) to study
glucose and ketone metabolism in brain. In their chronic hypoxic study, they
did not find any elevation in the lactate levels due to the adaptation in rat brain,
unlike their study for acute hypoxia [20]. However, the chronic or acute hypoxic
conditions were found not to interfere with the induced ketosis. The authors
found a sustained increased level of ketones in the plasma and the tissue. It was
suggested that ketones alter glucose metabolism possibly through the inhibition
of glycolysis or by increased lactate disposal.Based on the different perspectives on brain metabolism, a comprehensive
model of brain that addresses the major bio-chemical pathways is needed. Such
a model would facilitate the prediction of trends that are typically challenging
to gather experimentally. The basic assumption for this model is that part of the
40 Effect of Alternate Energy Substrates on Mammalian Brain 363

lactate required for sustaining the activity of the neuron is derived from theextra-cellular space supplemented at times by the glycolysis in the neuron.
In this study, the effect of ketone bodies on lactate dynamics following theonset of ischemia induced by cardiac arrest was investigated. The hypothesis ofthis study was that carbon flux balances would shift towards an increase in fluxrates coming from themetabolism of ketone bodies with a proportional decreasein the flux of lactate coming from the astrocyte, as predicted by astrocyte-neuronlactate shuttle (ANLS). We validate our model against the experimental dataobtained from the study of Crumrine and LaManna [21], and then examinethrough our model the profiles of lactate and redox (NAD/NADH). Thisanalysis was thought to be valuable to understanding the clinical significanceof ketone bodies toward cerebral energymetabolism during ischemic conditions.
40.2 Model Formulation
Although physiologic modeling of the brain began more than a decade ago, theexisting models are either incomplete or neglect the necessary compartmenta-lization of the various domains within and outside the cellular domain. Thiscould be due to the difficulty in simulating the metabolic dynamics in the braindue to various constraints. With this considered, we developed a new
Fig. 40.1 Model diagramof neuro-vascular unit representing various interacting compartmentsin brain which include: cytosol, mitochondria, extra-cellular space and blood compartments.
364 S.S. Koppaka et al.

multi-domainmathematical model including some of themajor pathways of theneuron in the mammalian brain. The approach of this model was to validate itwith existing in vivo experimental data and then predict physiologic responseswhich might be difficult to measure experimentally.
Based on the block diagram that shows the components of this model(Fig. 40.1), compartmentalization of the model was formulated with differentparameters and concentrations. Flux balances were developed andmass balancesof the substrates were formulated as a system of ordinary differential equationsrepresenting dynamics of the metabolites. A characteristic neuron cell wasmodeled into four distinct domains: cytosol, mitochondria, extra-cellular spaceand the blood compartment. Inter-domain transport exists among the compart-ments, which could be passive diffusion or carrier-mediated.
40.3 Metabolic Model Components
The model presented in this paper examines the dynamics of 42 keybio-chemical species in brain tissue. The regulators/controllers (NADþ,NADH, ATP, ADP and Pi) participate in facilitating energy transfer andmetabolic regulation. The dynamic mass balance of any species ‘‘j’’ in theblood, transported between the blood and the extra-cellular space can bewritten as:
VbdCvj
dt¼ Q Caj � Cvj
� �
� jb�xc; j (40:1)
where Vb is the blood volume, Q is the blood flow rate, Cvj (t) is the venousblood concentration of j, Ca j (t) the arterial blood concentration, and J b-x c, j isthe flux from blood to extra-cellular space. The net reaction rate of species ‘‘j’’ ina domain ‘‘x’’, Rx j, can be written as the difference between rate of productionof ‘‘j’’, Px j and the rate of utilization of ‘‘j’’, Ux j.
Rxj ¼ Pxj �Uxj ¼X
n
k¼1�k;j�k;j �
X
m
k¼1�j;k�j;k (40:2)
where is the reaction flux of species k forming species j, b k, j is the correspondingstoichiometric coefficient, n is number of reactions forming j from k, and m isthe number of reactions forming k from j. The general form of an equation inour model is:
E1 E2
A + B C + Dð40:3Þ
40 Effect of Alternate Energy Substrates on Mammalian Brain 365

The corresponding reaction flux is assumed to follow a modified Michaelis-Menten form22 as:
�a�b;c�d ¼Va�b;c�dCaCb
Va�b;c�d þ CaCb
PS�
�� þ PS�
� �
RS�
v� þ RS�
� �
(40:4)
where Ka-b, c-d and V a-b, c-d are theMichaelis-Menten coefficients specific to thereaction process. In this model, the two coupled controllers are the phosphor-ylation state PSþ = CATP/CADP and the redox state RSþ = CNADH/ CNAD,PS– = 1/PSþ and RS– = 1/RSþ (for reactions with reverse kinetics). Thecorresponding controller coefficients m� and n � can vary with each specificreaction process. The derivation and the details of this equation can be found inthe cited paper [22].
40.4 Results
In this section, the dynamics of lactate are analyzed during a 30-min ischemia.The qualitative trends of the model results are compared to the trends observedby Crumrine and LaManna [21] who studied lactate dynamics amongst othermetabolites during an onset of 30-min ischemia. Figure 40.2 compares ourmodel simulations for tissue lactate trends against the experimental data.
0
1
2
3
4
5
6
7
8
0 5 10 15 20 25 30time, min
Lac
tate
co
nce
ntr
atio
n-n
orm
aliz
ed
Experimental
Simulated
Fig. 40.2 Comparison of the trends of tissue lactate concentration observed in the experimentaldata ( ) gathered [21] (in the cortex of the brain) and model-simulated data (dashed line)generated (in cytosol of the neuron) by the model for ischemia induced over 30 min(no recovery). Plot shows normalized levels of lactate with respect to baseline values.(Normalization refers to ratio of experimental data andmodel predictions to their correspondingbaseline values).
366 S.S. Koppaka et al.

Crumrine and LaManna measured the concentration of tissue lactate in the
cortex of the brain tissue which includes lactate in the neuron, astrocyte and the
extra-cellular space.On the other hand, the mathematical model differentiates lactate levels in the
cytosol (of the neuron), the extra-cellular space and the plasma. Hence, a quali-
tative reproduction of the profiles was expected to be a reasonable validation.A unique feature of the mathematical model is its ability to describe com-
partmentalization such that the responses of controllers/modulators within
specific domains can be predicted and thus different pathways can be analyzed
inmore detail. Figure 40.3 shows the dynamics of the normalized NAD/NADH
ratio in the different intra-cellular compartments. We observe a markedly
different dynamic behavior in each compartment. It can be seen that the
dynamics of the controllers in the mitochondria have a shorter characteristic
time as compared to that of the cytosol.In Fig. 40.4, the dynamic responses to ischemia are analyzed by following the
tissue lactate levels in the standard and ketogenic diets as a function of time. The
concentration values are normalized with respect to the tissue lactate concen-
tration baseline value (standard diet condition). It can be seen that, in response
to ischemic conditions, the lactate concentration corresponding to the ketotic
conditions, exhibits a different dynamics than that observed for standard diet
conditions. The lactate levels for ketotic conditions remain below the lactate
levels corresponding to the standard diet conditions. This suggests a possible
coupling of ketone body metabolism to glycolysis by regulation.
0
0.2
0.4
0.6
0.8
1
1.2
0 1 2 3 4 5time, min
NA
D/N
AD
H-N
orm
aliz
ed
CYTO
MITO
Fig. 40.3 Dynamics of NAD/NADH in the cytosolic and mitochondrial compartments forischemia induced over 30 min (no recovery) in the neuron. Plot shows normalized dynamicresponses up to 5 min (5–30 min truncated).
40 Effect of Alternate Energy Substrates on Mammalian Brain 367

40.5 Discussion and Conclusions
There exist many constraints to studying intact brain metabolism and we realizethat an approach to understanding this is through modeling technologies basedon in vivo and in vitro data. Most of the current literature on modeling in thebrain does not take into account, the possible competition by other fuels at thetransport level or the feedback even redox mechanisms. Our model aims ataccommodating different aspects of the currently existing theories. This wouldenable understanding other components which should in theory be testable bythe existing models. Hence, this model provides a building block that wouldserve as a tool towards explaining and testing different theories as well as inincorporating new concepts obtained from newly acquired data. Anyone whowishes to access the model presented in this paper, should contact Dr. JorgeE. Gatica ([email protected]) for the latest update of the model.
Using the methodology applied for flux balance analysis, our model predic-tions for lactate were validated under standard diet conditions against similarexperimental conditions from Crumrine and LaManna. The hypothesis of thisstudy was that carbon flux balances would shift towards an increase in flux ratescoming from the metabolism of ketone bodies with a proportional decrease inthe flux of lactate coming from the astrocyte (as predicted by astrocyte-neuronlactate shuttle). Under the state of ketosis, as a result of feeding a ketogenic diet,our model predictions show a relatively lower accumulation in lactate levelsduring ischemia than under standard diet conditions. This profile suggests thatthere is a loose coupling of ketone body metabolism to glucose metabolism in
0
2
4
6
8
10
12
0 5 10 15 20 3025time, min
Lac
tate
co
nc
KTG
STD
Fig. 40.4 Comparison of the concentrations of tissue lactate in the standard and ketoticconditions for ischemia (concentrations in m-mol g–1ww min–1).
368 S.S. Koppaka et al.

the neuron-astrocyte unit, possibly at the level of glycolysis. Furthermore,ketone body metabolism in brain can be theorized to regulate glycolysis underbasal and increased energy demands via a feedback mechanism possibly at thelevel of citrate.
We anticipate that this work would provide a foundation for further under-standing ischemia in the brain under ketotic conditions. Future work wouldinclude incorporating blood flow response and metabolite dynamics followingischemia reperfusion.
References
1. C. P. Chih and E. L. Roberts Jr, Energy substrates for neurons during neural activity: acritical review of the astrocyte-neuron lactate shuttle hypothesis, J Cereb Blood FlowMetab 23(11), 1263–1281 (2003).
2. R. L. Leino, D. Z. Gerhart, A. M. van Bueren, A. L. McCall, and L. R. Drewes,Ultrastructural localization of GLUT 1 and GLUT 3 glucose transporters in rat brain,J Neurosci Res 49(5), 617–626 (1997).
3. D. Z. Gerhart, B. E. Enerson, O. Y. Zhdankina, R. L. Leino, and L. R. Drewes,Expression of monocarboxylate transporter MCT1 by brain endothelium and glia inadult and suckling rats, Am J Physiol 273(1 Pt 1), E207–E213 (1997).
4. P. J. Magistretti, L. Pellerin, D. L. Rothman, and R. G. Shulman, Energy on demand,Science 283(5401), 496–497 (1999).
5. L. Pellerin and P. J. Magistretti, Glutamate uptake into astrocytes stimulates aerobicglycolysis: a mechanism coupling neuronal activity to glucose utilization, Proc Natl AcadSci U S A 91(22), 10625–10629 (1994).
6. G. A. Dienel and L. Hertz, Glucose and lactate metabolism during brain activation,J Neurosci Res 66(5), 824–838 (2001).
7. A. Gjedde, S.Marrett, andM. Vafaee, Oxidative and nonoxidative metabolism of excitedneurons and astrocytes, J Cereb Blood Flow Metab 22(1), 1–14 (2002).
8. A. Aubert, R. Costalat, and R. Valabregue, Modelling of the coupling between brainelectrical activity and metabolism, Acta Biotheor 49(4), 301–326 (2001).
9. A. Aubert and R. Costalat, Interaction between astrocytes and neurons studied using amathematical model of compartmentalized energy metabolism, J Cereb Blood FlowMetab 25(11), 1476–1490 (2005).
10. F. Hyder, A. B. Patel, A. Gjedde, D. L. Rothman, K. L. Behar, and R. G. Shulman,Neuronal-glial glucose oxidation and glutamatergic-GABAergic function, J Cereb BloodFlow Metab 26(7), 865–877 (2006).
11. O. H. Lowry and J. V. Passonneau, The relationship between substrates and enzymes ofglycolysis in brain, J Biol Chem 239, 31–42 (1964).
12. B. K. Siesjo, Brain Energy Metabolism, (John Wiley & Sons, New York, 1978).13. O. E. Owen, A. P. Morgan, H. G. Kemp, J. M. Sullivan, M. G. Herrera, and G. F. Cahill,
Jr., Brain metabolism during fasting, J Clin Invest 46(10), 1589–1595 (1967).14. D. Z. Gerhart, B. E. Enerson, O. Y. Zhdankina, R. L. Leino, and L. R. Drewes,
Expression of the monocarboxylate transporter MCT2 by rat brain glia, Glia 22(3),272–281 (1998).
15. R. L. Veech, B. Chance, Y. Kashiwaya, H. A. Lardy, andG. F. Cahill, Jr., Ketone bodies,potential therapeutic uses, IUBMB Life 51(4), 241–247 (2001).
16. Y. Kashiwaya, T. Takeshima, N. Mori, K. Nakashima, K. Clarke, and R. L. Veech,D-beta-hydroxybutyrate protects neurons in models of Alzheimer’s and Parkinson’sdisease, Proc Natl Acad Sci U S A 97(10), 5440–5444 (2000).
40 Effect of Alternate Energy Substrates on Mammalian Brain 369

17. M. Guzman and C. Blazquez, Is there an astrocyte-neuron ketone body shuttle? TrendsEndocrinol Metab 12(4), 169–173 (2001).
18. H. S.Noh,Y. S.Hah, R.Nilufar, J. Han, J. H. Bong, S.S.Kang, G. J. Cho, andW. S. Choi,Acetoacetate protects neuronal cells from oxidative glutamate toxicity, J Neurosci Res83(4), 702–709 (2006).
19. M.A. Puchowicz, D. S. Emancipator, K. Xu,D. L.Magness, O. I. Ndubuizu,W.D. Lust,and J. C. Lamanna, Adaptation to chronic hypoxia during diet-induced ketosis, Adv ExpMed Biol 566 51–57 (2005).
20. M. A. Puchowicz, Emancipator D.S., K. Xu, and J. C. LaManna, Diet induced ketosisreduces lactate levels in acute hypoxic rat brain, FASEB 845.5 (2004).
21. R. C. Crumrine and J. C. LaManna, Regional cerebral metabolites, blood flow, plasmavolume, and mean transit time in total cerebral ischemia in the rat, J Cereb Blood FlowMetab 11(2), 272–282 (1991).
22. J. Kim, G. M. Saidel, and M. E. Cabrera, Multi-scale computational model of fuelhomeostasis during exercise: effect of hormonal control, Ann Biomed Eng 35(1), 69–90(2007).
370 S.S. Koppaka et al.

Chapter 41
Cerebral Blood Flow Adaptation
to Chronic Hypoxia
Haiying Zhou1,3, Gerald M. Saidel1,3, and Joseph C. LaManna2,3
Abstract Exposure of rats to mild hypoxia initially increases cerebral blood
flow (CBF) as much as two-fold which maintains the arterial oxygen delivery
rate. Several days after continued hypoxia, CBF decreases toward its baseline
level as the blood oxygen carrying capacity is increased through increased
hemoglobin content [1]. Evidently, CBF regulation and the oxygen carrying
capacity of blood are correlated. To quantitatively analyze the CBF control
mechanisms associated with chronic hypoxia, a mathematical model was devel-
oped that describes the concentration dynamics of O2 and CO2 transport and
metabolic processes in blood and brain tissue. In capillary blood, species trans-
port processes were represented by a one-dimensional convection-dispersion
model with diffusion between blood and tissue cells in the cortex and brain
stem. Three possible control mechanisms for CBF in response to chronic
hypoxia were analyzed: 1) local PO2 change in cerebral tissue; 2) reduced
blood flow associated with elevated blood viscosity from increased Hct;
3) neurogenic input from O2 receptors in the brain stem. Our hypothesis is
that increased PO2 in the brain stem is the signal for the return of CBF to its
baseline condition. This PO2 increase results from an increase in arterial oxygen
carrying capacity and a decrease in local energy metabolism.Model simulations
quantify the relative contributions of each of these control mechanisms during 4
days of hypoxic exposure. These simulations are consistent with experimental
data that show CBF returns to its baseline even though the cerebral cortical
tissue remains hypoxic as indicated by increased levels of the transcription
factor Hypoxia Inducible Factor-1 (HIF-1).
1Department of Biomedical Engineering, 2Department of Anatomy, 3Center for ModelingIntegrated Metabolic Systems, Case Western Reserve University, Cleveland, 44106.
K.A. Kang et al. (eds.), Oxygen Transport to Tissue XXIX� Springer 2008
371

41.1 Introduction
In mammals (e.g., humans and rats), cerebral blood flow (CBF) increases in
response to acute hypoxia [2,3]. The variables that control cerebral circulationare still unclear. Cerebral blood flow in humans does not increase significantlyuntil arterial oxygen partial pressure (PaO2) decreases below 60 mmHg.According to Brown et al., [4] arterial oxygen content is the major determinantof CBF in humans. In rats, CBF initially increases as much as two-fold in
response to hypoxia. As the hypoxic exposure continues, CBF decreases tonormoxic baseline in one week and hematocrit increases to restore arterialoxygen concentration (CaO2) [1,5]. Both the experiments suggest CBF andCaO2 are correlated and PaO2 may not have a direct effect on CBF regulation.
The relationships between arterial oxygen content and cerebral blood floware different under hypoxia and hemodilution conditions. When CaO2 isdecreased, the CBF response is greater in hypoxic animals [6]. This suggests
that tissue PO2 rather than CaO2 is the predominant factor in controlling CBF.According to Jones et al., [7] CBF is controlled by a mechanism that monitorscerebral O2 consumption and CaO2, which implies that tissue PO2 controlsblood flow locally as needed for metabolism.
During hypoxia, CBF and blood viscosity appear correlated, but the rela-tionship ceases when viscosity is high [4]. After accounting for the effects of
arterial oxygen content, however, blood viscosity is not a significant factor inCBF regulation. Experiments were performed to separate the effect of arterialoxygen content and hematocrit (Hct) on CBF regulation [8]. At constant PaO2
and CaO2, CBF falls after hematocrit is increased by transfusion with red bloodcells that contain pure methemoglobin (MHb). Based on this experiment, bothCaO2 and Hct are important in CBF regulation.
In rats, hypoxic excitation of the rostral ventrolateral medulla (RVLM) of
the brainstem increases cortical blood flow [9,10]. When the projection effectfrom RVLM was blocked, the CBF response to normocarbic hypoxia(FIO2 =10%) was decreased by more than 50%, and CBF response to hyper-carbia was unchanged. It was implied that neurons of the rostral ventrolateralmedulla were oxygen detectors that can globally elevate cerebral blood flow in
response to hypoxia. In response to hypoxia, energymetabolism decreases withinbrain stem regions involved in respiratory and cardiovascular control [11].
Three possible primary mechanisms may be involved in the regulation of thecerebral blood flow response to chronic hypoxia (4 days): 1) local PO2 change incerebral tissue (viz., cortical PO2); 2) reduced blood flow associated withincreased Hct that produces higher viscosity; 3) neurogenic input (PO2) fromO2 receptors in the brain stem. To distinguish and predict the effect of these
mechanisms, a mathematical model is needed that can interpret experimentaldata. To quantitatively analyze the CBF control mechanisms associated withchronic hypoxia, a two-compartment (cortex and brain stem) mathematicalmodel was developed. In capillary blood, species transport processes was
372 H. Zhou et al.

represented by a one-dimensional, convection-axial dispersion model withdiffusion between blood and tissue cells in the cortex and brain stem. Withinthe local cortex and brainstem tissues, the concentrations were represented byan average.Model simulations quantify the relative contributions of each of thethree control mechanisms during 4 days of hypoxic exposure.
41.2 Methods
41.2.1 Model Description
A model (Fig. 41.1) has been developed to study global CBF regulation duringhypoxia. From dynamic mass balances of the cortex (C) and brain stem (S) withdistinct metabolic rates, O2 concentrations are described (Eq. 41.1). The speciesconcentration distribution in the capillary blood from arteriole to venule isrepresented by a one-dimensional convection-axial dispersion model (Eq. 41.2),in which D is the dispersion coefficient and Vib is the capillary blood volume.The effect of hemoglobin on transport processes is included. This model takesinto account the species transport flux (J) between capillary blood and tissue,which depends on the partial pressure differences between the blood and tissue.In the tissue, the species concentration dynamics depend on the mass transportflux between tissue and blood, and metabolic (consumption or production)rate. Since an increase in Hct causes an increase in the effective surface areafor O2 transport [12], the corresponding O2 and CO2 transport coefficients arefunctions of Hct.
Cortex
Arteriole
PSO2
PCO2CCO2
CCCO2
Brain Stem CSO2CSCO2
QC
QS
CCbO2, CCbCO2
CSbO2, CSbCO2
J
J
Mc,O2
MS,O2
Capillary
Fig. 41.1 System diagram showing the interaction between cortex and brain stem. Mi,O2
(i=C,S) : oxygen consumption rate in cortex and brain stem; PiO2: O2 partial pressure intissue; CiO2,CiCO2: O2 and CO2 concentration in tissue; CibO2,CibCO2: O2 and CO2 concen-tration in tissue capillary blood.
41 Cerebral Blood Flow Adaptation to Chronic Hypoxia 373

dCiO2
dt¼Z
Vab
0
Jdv�Mi;O2; i ¼ C;Sð Þ (41:1)
@CibO2
@t¼ �Qi
@CibO2
@vþD
@2CibO2
@v2� J (41:2)
The expressions (Eqs. 41.3,41.4) for control of cerebral blood flows to cortex
(QC) and brain stem (QS) incorporate the three mechanisms mentioned above.
PCO2 and PSO2 are O2 partial pressures in the cortex and brain stem. The
subscript ‘‘0’’ means baseline value (e.g., Hct0 is the baseline hematocrit).
QC ¼ QC0Hct0 1þ a 1� PCO2=PCO20ð Þ þ b 1� PSO2=PSO20ð Þ½ �=Hct (41:3)
QS ¼ QS0Hct0 1þ b 1� PSO2=PSO20ð Þ½ �=Hct (41:4)
The general behavior of these controllers is similar. When cortical PCO2 and/
or the brain stem PSO2 decreases, CBF increases; when Hct increases, CBF
decreases.
41.2.2 Model Simulations
To simulate the experimental data and predict responses, the model equations
were solved numerically. Values of most model parameters were taken from the
accepted ranges in previous studies of the rat brain (see Table 41.1). Metabolic
rate in the cortex is assumed constant. The O2 and CO2 transport coefficients
were estimated by matching the model outputs to tissue PO2 and PCO2 data
under normoxia. The values of parameters in CBF controller were chosen to
generate the expected CBF response under hypoxia (see Table 41.1). The control
signal from the brain stem is assume to occupy more than 50% [11]. The
normoxic steady state of PaO2=100 mmHg and PaCO2 =40 mmHg could be
reached by model simulation starting from arbitrary initial conditions. Energy
metabolism in brain stem decreases as PSO2 decreases in response to hypoxia.
Table 41.1 Parameters in the model
Hct0
Qc0, QS0
ml/100g/min
Mc,O2, MS,O2
mlO2/100g/min
Vcb,Vsb ml/100g
ammHg–1
bmmHg–1
Dl2/min
PCO20,PSO20
mmHg
0.46 120 8.4 3.4 1.0 1.5 5�10–4 15
374 H. Zhou et al.

Cerebral blood flow in response to chronic hypoxia is simulated by changingarterial O2 and CO2 partial pressures (PaO2, PaCO2) and Hct. Initially, PaO2
decreases quickly from 100 to 40mmHg, but as the hypoxic exposure continues,PaO2 slowly increases to 45 mmHg because of hypoxic hyperventilation.Also, PaCO2 decreases quickly from 40 to 30 mmHg. Based on the data ofXu et al., [1]. Hct increases as a mono-exponential function (Eq. 41.5) with timeconstant � ¼ 127:5h
Hct ¼ 0:46þ 0:22 1� e�t�
� �
(41:5)
41.3 Results and Discussion
Model simulation of CBF responses in cortex and brain stem to 4 days ofhypoxic exposure are shown in Fig. 41.2. Initially, CBF in cortex increases by85% (from 120 to 220 ml/100g/min), then decreases slowly to 130 ml/100g/minat the 4th day of hypoxia. Of the initial cortical CBF response, 70% is caused bydecreased brain stem PO2. Initially in the brain stem, CBF increases by 70%and then decreases to a similar level as CBF in cortex at the 4th day of hypoxia.
In response to hypoxia, PO2 in cortex tissue decreases quickly from 15 to 8mmHg, then increases slowly to 11 mmHg (Fig. 41.3). In the brain stem, PO2
decreases quickly to 11 mmHg, then increases slowly to 13 mmHg. The smallerPO2 change in brain stem is due to the metabolism change during hypoxia.Arterial O2 concentration (CaO2) decreases from 9.4 to 7.2mMat the beginningof hypoxia because PaO2 decreases. As Hct increases, O2 concentrationincreases to 9.7 mM.
CB
F (
L/1
00g
/min
)
0
0.05
0.1
0.15
0.2
0.25
Time (hours)
CBF in CortexCBF in Brain stem
-5 15 35 55 75 95 115
Fig. 41.2 Responses of CBF in cortex and brain stem to 4 days of hypoxia (-5-0 hour:normoxic baseline; 0–100 hour: hypoxia).
41 Cerebral Blood Flow Adaptation to Chronic Hypoxia 375

By examining the values ofCBF andCaO2 during the entire hypoxic exposure,simulations show that oxygen delivery is higher than under normoxic condition.Initially, oxygen delivery increases from the normoxic 0.25 to 0.35 ml O2/g/min,then slowly declines to 0.3 ml O2/g/min.
After 4 days of hypoxia, even though CaO2 has already recovered to thenormoxic level, PO2 in the cortex and brain stem are still less than theirnormoxic values. This is a consequence of a small transport partial pressuredifference between blood and tissue. This simulation is consistent with theexperimental measurements by Chavez et al., [13] with HIF-1 as an indicatorof tissue hypoxia. HIF-1 initially rose and then fell to about half of themaximum after 7 days, then returned to normoxic level after 21 days. After 4days of hypoxia, cortical and brain stem PO2 still can produce an increase CBF.This is offset, however, by the elevated Hct which can decrease CBF by 20% sothat the combined effects yield CBF close to the normoxic level.
41.4 Conclusions
The aim of this model is to investigate the cerebral blood flow (CBF) duringchronic hypoxia (4 days).The simulation shows that the CBF dynamic responsecan be explained by the combined effect of tissue PO2 (cortex and brain stem)and hematocrit (Hct). The initial (minutes) increase of CBF in cortex and brainstem in response to hypoxia is due to decreases in cortical tissue PCO2 and brainstem PSO2. CBF gradually decreases from the initial increase to the normoxicbaseline in response to chronic hypoxia (4 days). This renormalization of CBFis caused by higher Hct: 1) higher Hct causes increase in PCO2 and PSO2; 2)higher Hct directly decreases CBF (via increased viscosity).
0
4
8
12
16
Time (hours)
PO2 in Brain stem
Tis
sue
PO
2 (m
mH
g)
PO2 in Cortex
–5 15 35 55 75 95 115
Fig. 41.3 Responses of PO2 in cortex and brain stem to 4 days of hypoxia.
376 H. Zhou et al.

Acknowledgment This work was supported by NIH-NIGMS P50-GM-66309 for Center forModeling Integrated Metabolic Systems (MIMS) at Case Western Reserve University
References
1. K. Xu, M.A. Puchowicz, and J.C. LaManna. Renormalization of regional brain bloodflow during prolonged mild hypoxic exposure in rats. Brain Res. 2004; 1027: 188–191.
2. P.N. Ainslie and M.J. Poulin. Ventilatory, cerebrovascular, and cardiovascular interac-tions in acute hypoxia: regulation by carbon dioxide. J. Appl. Physiol. 2004; 97: 149–159.
3. J.C. LaManna, L.M. Vendel, and R.M. Farrell. Brain adaptation to chronic hypobarichypoxia in rats. J. Appl. Physiol. 1992; 72: 2238–2243.
4. M.M. Brown, J.P.H.Wade, and J. Marshall. Fundamental importance of arterial oxygencontent in the regulation of cerebral blood flow in man. Brain 1985; 108: 81–93.
5. K. Xu, and J.C. LaManna. Chronic hypoxia and the cerebral circulation. J. Appl. Physiol.2006; 100: 725–730.
6. M.M. Todd, B. Wu, M. Maktabi, B.J. Hindman, and D.S. Warner. Cerebral blood flowand oxygen delivery during hypoxemia and hemodilution: role of arterial oxygen content.Am. J. Physiol. 1994; 267: H2025–H2031.
7. M.D. Jones, R.J. Traystman, M.A. Simmons, and R. Molteni. Effects of changes inarterial O2 content on cerebral blood flow in the lamb. Am. J. Physiol. 1981; 240:H209–H215.
8. M.L. Hudak, R.C. Koehler, A.A. Rosenberg, R.J. Traystman, andM.D. Jones. Effect ofhematocrit on cerebral blood flow. Am. J. Physiol. 1986; 251: H63–H70.
9. E.V. Golanov, J.R.C. Christensen, and D.J. Reis. Neurons of a limited subthalamic areamediate elevations in cortical cerebral blood flow evoked by hypoxia and excitation ofneurons of the rostral ventrolateral medulla. J. Neurosci. 2001; 21: 4032–4041.
10. E.V. Golanov, D.A. Ruggiero, andD.J. Reis. A brainstem areamediating cerebrovascularand EEG responses to hypoxic excitation of rostral ventrolateral medulla in rat. J. Physiol.2000; 529: 413–429.
11. J.C. LaManna, M.A. Haxhiu, K.L. Kutina-Nelaon, S. Pundik, B. Erokwu, E.R. Yeh,W.D. Lust, and N.S. Cherniack. Decreased energy metabolism in brain stem duringcentral respiratory depression in response to hypoxia. J. Appl. Physiol. 1996; 81:1772–1777.
12. K. Groebe, and G. Thews. Basic mechanisms of diffusive and diffusion-related oxygentransport in biological systems: a review, In: Oxygen transport to tissue XIV,W. Erdmanand D. F. Bruley, ed., Plenum Press, New York. 1992; pp. 21–33.
13. J.C. Chavez, F. Agani, P. Pichiule, and J.C. LaManna. Expression of hypoxia-induciblefactor-1a in the brain of rats during chronic hypoxia. J. Appl. Physiol. 2000;89: 1937–1942.
41 Cerebral Blood Flow Adaptation to Chronic Hypoxia 377

Chapter 42
Mitochondrial Dysfunction in Aging Rat Brain
Following Transient Global Ischemia
Kui Xu, Michelle A. Puchowicz, Xiaoyan Sun, and Joseph C. LaManna1
Abstract Aged rat brain is more sensitive to reperfusion injury induced by
cardiac arrest and resuscitation. The mitochondrial respiratory chain, the
major source of free radicals during reperfusion, is likely to be the target of
lipid peroxidation. Previous work has shown a higher mortality and lower
hippocampal neuronal survival in older rats. 4-hydroxy-2-nonenal (HNE), a
major product of lipid peroxidation, was found to be elevated in cortex and
brainstem after resuscitation. In this study we investigated the acute changes
of mitochondrial function in aging rat brain following cardiac arrest and
resuscitation; the effect of an antioxidant, alpha-phenyl-tert-butyl-nitrone
(PBN) was also tested. Fischer 344 rats, 6 and 24-month old, were subjected
to cardiac arrest (7–10 minutes) and allowed to recover 1 hour after resuscita-
tion. Mitochondria of cortex and brainstem were isolated and assayed for
respiratory function. Compared to their respective non-arrested control
group, 1h untreated groups (both 6 month and 24 month) had similar state
3 (ADP-stimulated) but higher state 4 (resting state) respiratory rates. The
respiratory control ratio (state 3/state 4) of cortex in the 1h untreated group
was 26% lower than the non-arrested control group; similar results were
found in brainstem. The decreased mitochondrial respiratory function was
improved by PBN treatment. HNE–modified mitochondrial proteins were
elevated 1h after resuscitation, with an evident change in the aged. Treatment
with PBN reduced the elevated HNE production in mitochondria of cortex.
The data suggest (i) there is increased sensitivity to lipid peroxidation with
aging, (ii) mitochondrial respiratory function related to coupled oxidation
decreases following cardiac arrest and resuscitation, and (iii) treatment with
antioxidant, such as PBN, reduces the oxidative damage following cardiac
arrest and resuscitation.
1Kui Xu, Michelle A. Puchowicz, Xiaoyan Sun, and Joseph C. LaManna, Department ofAnatomy, Case Western Reserve University, 10900 Euclid Avenue, Cleveland, OH 44106,USA.
K.A. Kang et al. (eds.), Oxygen Transport to Tissue XXIX� Springer 2008
379

42.1 Introduction
Transient global brain ischemia induced by cardiac arrest and resuscitationresults in reperfusion injury associated with oxidative stress [1]. We have pre-viously shown that aged rats are more sensitive to reperfusion injury induced bycardiac arrest and resuscitation. Higher mortality and lower hippocampalneuronal survival were found in the older rats [2]. 4-hydroxy-2-nonenal(HNE), a major product of lipid peroxidation, was found to be elevated incortex and brainstem after resuscitation [3]. An antioxidant, alpha-phenyl-tert-butyl-nitrone (PBN) [4], improved the outcome following cardiac arrest andresuscitation [2]. The cellular mechanism that contributes to the age-relatedchanges in brain aerobic capacity remains to be discerned. Mitochondria areboth a major source and target of free radicals during insult of oxidative stress.Modification of mitochondrial proteins by lipid peroxidation products HNE,have been described to decrease oxidative capacity [5]. Oxidative damage istherefore likely to play a role in the decline of mitochondrial function [6]. Withaging, increased susceptibility to oxidative stress is known to lead to declinedmitochondrial function, especially following an ischemic-reperfusion insult [5].In this study we investigated the effects of aging on mitochondrial function inbrain following cardiac arrest and resuscitation. Mitochondrial oxidative capa-city was assessed by measuring respiratory rates (state 3/state 4) from freshlyisolated mitochondria. Western blot analysis was used to detect HNE-modifiedmitochondrial proteins. We hypothesized that an antioxidant treatment withPBN in the aged rats would result in improved mitochondrial function follow-ing cardiac arrest and resuscitation by attenuation of lipid peroxidation.
42.2 Methods and Materials
42.2.1 Animal Preparation
Male Fischer 344 rats (6- and 24-month-old) were purchased and allowed toacclimate in the animal facility at Case Western Reserve University for oneweek before being utilized. Surgical procedures for each experiment were asfollows: [7] anesthesia was induced by isoflurane (2.5% isoflurane, 70%N2O inO2) and maintained with 1–2% isoflurane, 70% N2O in O2 through a nasalcone. Cannulae were placed in: (i) Ventral tail artery using polyethylene tubing(PE-50, 0.023" i.d., 0.038" o.d.) for the purpose of monitoring of systemicarterial blood pressure and to obtain samples for blood gas, plasma glucoseand lactate determinations (ii) External jugular vein into the right atrium usinga Silastic catheter (0.025" i.d., 0.047" o.d.) for administration of drug. Aftersurgery, the rats were allowed to recover for at least 1 hour while restrained inplastic cages. Throughout the experiment, the body temperature was
380 K. Xu et al.

maintained at 378C by an infrared heat lamp (250W, 45 cm above the body)regulated by feedback from a rectal probe.
42.2.2 Induction of Total Cerebral Ischemia in Rat
Reversible total cerebral ischemia was achieved using a cardiac arrest andresuscitation model [7]. Cardiac arrest was induced in the conscious rat byrapid sequential intra-atrial injection of d-tubocurare (0.3mg) and ice-coldKCl solution (0.5 M; 0.12 ml/100g of body weight). Resuscitation was initiated5minutes after arrest following orotreacheal intubationwith a 14-gauge catheterattached to a rodent ventilator (100% O2, tidal volume: 10cc/kg, respiratoryrate: 80 breaths/min). Simultaneous chest compressions and the infusion ofnormal saline (0.5 ml/min) were given until a spontaneous heartbeat returned.Epinephrine (4–10g) was given intravenously to establish a mean blood pressuregreater than 80% of the pre-arrest value, at which point the animal was con-sidered to be resuscitated (7–10 min ischemia). Ventilation was then adjusted to�30% O2 and 70% N2O, depending on the normal range of blood gas, untilspontaneous respiration was regained. For the PBN-treated rats, PBN (100 mg/kg) was infused intravenously immediately after resuscitation for 60 minutes.The untreated rats were given normal saline for the same period of time.Non-arrested rats went through the same surgical procedures except cardiacarrest. Non-arrested controls and resuscitated rats (1 h post-resuscitation) weredecapitated and brains were removed for further process.
42.2.3 Isolation of Brain Mitochondria
Brain mitochondria were isolated using a method previously described withslight modifications [8]. In brief, tissue of cortex (whole layer, bilateral,0.7–1.0g) and brainstem (�0.3g) were dissected (see Fig. 42.1 below) and rinsed
Fig. 42.1 Dissection of cortex and brainstem (gray-shaded area) of a rat brain.
42 Mitochondrial Dysfunction in Aging Rat Brain 381

in ice-cold isolation buffer (200 mM Mannitol, 70 mM Sucrose, and 5.0 mMMOPS, pH 7.4). The tissue was blotted dry, freed of visible blood vessels, thenweighed and minced thoroughly. The tissue was suspended in isolation buffer(10 ml/g tissue) containing defatted bovine albumin (BSA, 0.2%) and EDTA(0.2 mM) and then treated with the protease Subtilisin A (5mg/g), for 30 secondwith light shaking. The suspension was then homogenized with a Teflon pestle(4 strokes). The homogenate was then centrifuged at 4 8C. The resultingmitochondrial pellet was washed (x2) with isolation buffer, centrifuged andresuspended to a final protein concentration of approximately 25 mg/ml and10 mg/ml, cortex and brainstem, respectively.
42.2.4 Measurement of Mitochondrial Respiratory Rates
Oxidative rates were assessed by measuring oxygen consumption using apolarographic system consisting of a Clark-type electrode in the presence ofthe substrates glutamate plus malate [8]. The NADH-linked oxidative rates(state 3: ADP-stimulated; state 4: resting state, ADP-limited) were then calcu-lated (natom oxygen/min/mg protein). The respiratory control ratio (RCR) wasdetermined (state 3 / state 4). ADP-to-oxygen (ADP/O) ratios (nmol ADP pernanoatom O) were calculated as previously described.
42.2.5 Detection of HNE-Modified Mitochondrial Protein
Western blot analysis was used to detect HNE-modified mitochondrial protein.Samples of mitochondria were prepared by addition of isolation buffer contain-ing 1 mM dithiothreitol and 1 mM phenylmethylsulfonyl. Samples (100 mg ofprotein) were electrophoresed on 10% SDS-polyacrilamide gels. The proteinson the gels were transferred to nitrocellulose membranes then incubated with5% skim milk blocking buffer for 1 hour (room temperature). HNE modifiedproteins were detected by incubating the membranes with a 1:500 dilution ofpolyclonal anti-HNE antibody (Calbiochem) overnight (48C) followed by incu-bation with horseradish peroxidase-conjungated anti-rabbit IgG (1:5000) for 1hour (Jackson ImmunoResearch). The primary antibody immunoreactive pro-tein bands were visualized using enhanced chemiluminescence detection system(ECL kit, Amersham).
42.2.6 Statistical Methods
All values were represented as mean� S.D. Statistical analyses were performedusing SPSS v13.0 for Windows. Group comparisons are made by one-way
382 K. Xu et al.

analysis of variance (ANOVA) using t-test. Significance was considered at the
level of p < 0.05.
42.3 Results
42.3.1 Mitochondrial Respiratory Function
To determine the effect of aging on the overall mitochondrial oxidative
capacity following cardiac arrest and resuscitation, we measured polarogra-
phically, oxygen consumption in the presence of the substrates of glutamate
plus malate. As seen in Table 42.1, there were no significant differences in state 3
oxidative rates between 6-month and 24 -month-old rat brain mitochondria
(cortex and brainstem) under all conditions. However, in brainstem, the state
3 oxidative rates in the 24-month-old rat brains were decreased in both
conditions (22% and 17%, non-arrested and 1 h recovery groups, respec-
tively), compared to the 6-month-old. The state 4 rates in cortex and brain-
stem were significantly higher at 1 h recovery compared to their respective
non-arrested controls (6 and 24-month-old). In both the cortex and brain-
stem, there appeared to be no aging effect on the state 4 respiratory rates
(non-arrested and 1 h recovery), acutely. In both age groups, the respiratory
control ratios in cortex and brainstem were significantly lower at 1 h recovery
compared to non-arrested controls. Since the state 3 oxidative rates were
similar, the lower respiratory control ratios were as a result of higher state 4
rates. There were no differences in ADP/O in any conditions or between age
groups (Table 42.1).Figure 42.2 shows the RCR in the 24-month group (cortex and brainstem),
non-arrested, 1 h recovery-untreated and 1 h recovery-PBN treated. The data
show a decrease of 26% in cortex and 28% in brainstem, compared to the values
of non-arrested controls. PBN treatment resulted in similar RCR values to the
non-arrested baseline.
42.3.2 HNE Detection in Isolated Mitochondria of Brain
HNE-modified proteins were detected by Western blot analysis in isolated
mitochondria from of cortex in 6 and 24-month-old rats. HNE adduct forma-
tion was observed within the molecular weight range of 65 to 110 kDa, with
intense bands at 1h recovery in both age groups compared to the non-arrested
controls (Fig. 42.3). The increase of HNE production was more evident in the
aged group. The elevated levels of HNE adducts were reduced with PBN
treatment in the 24-month group.
42 Mitochondrial Dysfunction in Aging Rat Brain 383

Table 42.1 Respiratory properties of rat brain mitochondria. Values are mean � standard deviation
Age (mos) Condition n State 3 (nO/mg/min) State 4 (nO/mg/min) RCR ADP/O
Cortex 6 Non-arrested 5 338.4 � 34.5 29.0 � 3.0 11.7 � 1.0 2.1 � 0.3
6 1 h recovery 3 313.1 � 16.8 34.9 � 2* 9.0 � 0.1* 2.4 � 0.3
24 Non-arrested 4 317.0 � 34.4 27.5 � 2.7 11.5 � 0.8 2.2 � 0.3
24 1 h recovery 3 287.8 � 51.2 34.2 � 1.3* 8.5 � 1.0* 2.2 � 0.1
24 PBN-treated 3 302.5 � 71.9 28.3 � 8.8 10.9 � 1.2 2.5 � 0.4
Brainstem 6 Non-arrested 5 319.7 � 40.0 27.4 � 3.9 11.9 � 2.2 2.3 � 0.3
6 1 h recovery 3 297.7 � 31.7 35.2 � 1.2* 8.5 � 0.8* 2.3 � 0.4
24 Non-arrested 4 248.3 � 39.0 25.5 � 2.7 9.7 � 1.1 2.2 � 0.1
24 1 h recovery 3 246.8 � 33.8 35.1 � 1.3* 7.0 � 0.8*x 2.3 � 0.1
24 PBN-treated 3 278.5 � 66.4 28.5 � 4.9 9.7 � 0.7 2.3 � 0.2
RCR, respiratory control ratio; ADP/O, ADP-to-oxygen ratio. * indicates significant difference (t-test, p<0.05) from the pre-arrest value in the sameage group. xindicates significant difference (t-test, p<0.05) between the untreated and PBN-treated groups.
384
K.Xuet
al.

42.4 Discussion
This study focused on the early recovery phase from cardiac arrest. Our data
showed that at 1 h recovery following cardiac arrest and resuscitation in both
young and old rat brain RCR are decreased. This was evident by increased state
0
2
4
6
8
10
12
14
non-arrested
1h untreated
1h PBN
**
§
Cortex
RC
R
Brainstem
Fig. 42.2 Respiratory control ratio (RCR) in mitochondria isolated from cortex and brain-stem of 24-month- old rats, non-arrested control (n= 4), untreated (n= 3) and alpha-phenyl-tert-butyl-nitrone (PBN)-treated rats (n = 3). Values are mean� S.D., * indicates significantdifference (t-test, p<0.05) from the values of non-arrested controls. x indicates significantdifference between (t-test, p<0.05) the untreated and PBN-treated group.
kDa
109
78
60
47
24m
-PB
N
24m
-1h
24m
-NA
6m-1
h
6m-N
A
Fig. 42.3 Western blot analyses showing HNE adducts formation in th cortex of 6 and24-month-old rats. NA: non-arrested controls; 6m-NA: 6-month non-arrested rat; 6m-1h: 6-month untreated 1 h recovery rat; 24m-NA: 24-month non-arrested rat; 24m-1h: 24-month 1untreated 1h recovery rat; 24m-PBN: alpha-phenyl-tert-butyl-nitrone (PBN)-treated24-month-old rat at 1 h recovery.
42 Mitochondrial Dysfunction in Aging Rat Brain 385

4 rates and not decreased state 3 rates. These data indicate that ischemicreperfusion injury acutely affects mitochondrial oxidative function throughuncoupling. Furthermore, the HNE–modified mitochondrial proteins wereelevated 1 h after resuscitation and were more apparent in the aged ratscompared to the younger rats, suggesting that mitochondria in aged brain aremore susceptible to damage as a result of lipid peroxidation. The data also showthat with PBN treatment, there was improved mitochondrial respiratory func-tion and reduced HNE modified mitochondrial proteins, possibly through freeradical scavenging properties of PBN. The importance of this work is to provideinformation which may aid in potential therapeutic strategies aimed at earlyphase treatment in brain towards oxidative stress induced damage followingcardiac arrest and resuscitation.
Acknowledgment This work was supported by NIH grants NS 46074 and GM 066309. Wewould like to especially thank Constantinos Tsipis for his assistance in preparation of themanuscript.
References
1. J. Lehotsky, R. Murin, A. Strapkova, A. Urikova, Z. Tatarkova, and P. Kaplan, Timecourse of ischemia/reperfusion-induced oxidative modification of neural proteins in ratforebrain, Gen. Physiol. Biophys. 23(4), 401–415 (2004).
2. K. Xu, X. Sun, M. A. Puchowicz, and J. C. LaManna, Increased sensitivity to transientglobal ischemia in aging rat brain, Adv. Exp. Med. Biol. 599, 199–206 (2007).
3. J. C. LaManna, N. L. Neubauer, and J. C. Chavez, In:Matuation Phenomenon in CerebralIschemia IV, edited by Bazen NG, Ito U, Maecheselli VL, Kuroiwa T, and Klatzo I(Springer-Verlag, Berlin Heidelberg, 2001), pp. 223–227.
4. J. W. Phillis and C. Clough-Helfman, Protection from cerebral ischemic injury in gerbilswith the spin trap agent N-tert-butyl-alpha-phenylnitrone (PBN), Neurosci. Lett. 116(3),315–319 (1990).
5. D. T. Lucas and L. I. Szweda, Cardiac reperfusion injury: aging, lipid peroxidation, andmitochondrial dysfunction, Proc. Natl. Acad. Sci. U. S. A. 95(2), 510–514 (1998).
6. M. F. Anderson andN. R. Sims,Mitochondrial respiratory function and cell death in focalcerebral ischemia, J. Neurochem. 73(3), 1189–1199 (1999).
7. K. Xu, M. A. Puchowicz, W. D. Lust, and J. C. Lamanna, Adenosine treatment delayspostischemic hippocampal CA1 loss after cardiac arrest and resuscitation in rats, BrainRes. 1071(1), 208–217 (2006).
8. J. Kerner, P. J. Turkaly, P. E.Minkler, and C. L. Hoppel, Aging skeletal muscle mitochon-dria in the rat: decreased uncoupling protein-3 content, Am. J. Physiol Endocrinol. Metab.281(5), E1054–E1062 (2001).
386 K. Xu et al.

Part X
Others

Chapter 43
Measurement of Cerebral Tissue Oxygenation
inYoungHealthyVolunteersDuringAcetazolamide
Provocation: A Transcranial Doppler and
Near-Infrared Spectroscopy Investigation
Ilias Tachtsidis1, Martin Tisdall2, David T. Delpy1, Martin Smith1,
and Clare E. Elwell1
Abstract Recent advances in near-infrared spectroscopy (NIRS) allow mea-surements of absolute tissue oxygen saturation (TOI) using spatially resolvedspectroscopy (SRS), while enabling better depth sensitivity. However concernsremain regarding the relative contribution of the extracranial circulation to thecerebral NIRS TOI signal. In this study we investigated this during a period ofselective rise in cerebral blood flow (CBF) produced by the administration ofacetazolamide (ACZ) in 10 healthy volunteers. A two channel spectrometer(NIRO 300, Hamamatsu Photonics KK) was used to measure absolute cerebralTOI over the frontal cortex using the SRS technique using an optode spacing of5 cm and 1.5 cm for channel 1 and 2 respectively. After ACZ administration wewere able to observe a significant increase in the velocity of middle cerebralartery (Vmca, measured with the transcranial Doppler (TCD)) which was accom-panied by an increase in TOI as monitored by the NIRO 300 with an optodespacing of 5 cm but not with an optode spacing of 1.5 cm. Furthermore a directrelationship was seen between the Vmca and the TOI measured at 5 cm optodespacing. This work suggests that using this commercialNIRS instrumentwith anoptode spacing of 5 cm one is able to detect the intracranial changes.
Keywords: Near-infrared spectroscopy � Brain oxygenation � Brain blood flow� Acetazolamide
43.1 Introduction
Near-infrared spectroscopy (NIRS) has been widely used to evaluate changesin cerebral oxygenation and blood volume non-invasively. The techniqueinvolves near-infrared emitting and detecting optical probes placed on the
1Medical Physics and Bioengineering, University College London, Malet Place EngineeringBuilding, Gower Street, London WCIE 6BT.2Department of Neuroanaesthesia & Neurocritical Care, The National Hospital forNeurology & Neurosurgery, London.Corresponding author: Illias Tachtsidis, e-mail: [email protected]
K.A. Kang et al. (eds.), Oxygen Transport to Tissue XXIX� Springer 2008
389

scalp, transmitting light through cerebral as well as extracerebral tissues, suchas skin, cranial bone, and cerebrospinal fluid (CSF). It is obvious that theposition and volume of the interrogated tissue will depend on the positionand spacing of the source and the detection fibres and results from mathema-tical modelling of light transport in tissue suggest that the average penetrationdepth of the detected near-infrared (NIR) light in the tissue increases with probeseparation [1–3]. As a result, it is believed that oxygenation changes in deepertissues of the brain can be detected with large optode spacing [4,5].
Recent advances in NIRS technology allow measurements of absolute tissueoxygen saturation (TOI) using spatially resolved spectroscopy (SRS) [6], whileenabling better depth sensitivity [7]. However concerns remain regarding therelative contribution of the extracranial circulation to the cerebral NIRS TOIsignal. The aim of this study was to investigate whether cerebral tissue oxygena-tion monitored using spatially resolved NIRS reflects changes in intracranialhaemodynamics. This was done by monitoring the NIR derived cerebral tissueoxygenation signal using two different inter-optode spacings during a period ofselective rise in cerebral blood flow produced by the administration of acetazola-mide (ACZ).
43.2 Method
43.2.1 Subjects
After local ethics committee approval and written informed consent, 10 healthyvolunteers (7 men and 3 women; age 27 to 33 years; mean 29.6 years) took partin this study.
43.2.2 Instrumentation
Figure 43.1 shows a schematic of the experimental set up.Middle cerebral arteryflow velocity (Vmca) was measured in the basal right middle cerebral artery usinga transcranial Doppler ultrasonography instrument (Pioneer Nicolet Biomedi-cal Inc). After artery identification a permanently fixed 2-MHz probe was used.The envelope velocity was collected at 50Hz sampling rate and the mean Vmca
was calculated every second using a trapezoidal integration function (MatLabMathworks Inc).
A two channel continuous wave near-infrared spectrometer (NIRS), with asampling rate of 6 Hz (NIRO 300, Hamamatsu Photonics KK) was used tomeasure absolute cerebral TOI over the frontal cortex using the SRS technique.The optodes were placed on the forehead (taking care to avoid the midlinesinuses) and were secured in position by using an elastic bandage. The optodes
390 I. Tachtsidis et al.

for Channel 1 were placed over the right frontal lobe with an optode spacing of5 cm; this measurement of TOI was termed ‘Head TOI’. The optodes forChannel 2 were placed over the left frontal lobe with an optode spacing of1.5 cm. This measurement of TOI was termed ‘Superficial TOI’. Opticalattenuators were used where necessary to optimise the signal to noise ratio.
Skin blood perfusion in the forehead was measured with a laser Dopplersystem (Moor Instruments). The laser Doppler probe was placed on the leftforehead at the height of the eyebrows. The laser Doppler flux signal (theproduct of skin blood concentration and erythrocyte velocity) was collectedcontinuously with a sampling rate of 50 Hz.
End tidal CO2 (EtCO2) was measured continuously (1Hz sampling rate) withnasal prongs (HP Merlin). Mean blood pressure (MBP) was monitored usingthe Portapres1 system, which uses small finger cuffs to continuously and non-invasively measure the blood pressure waveform.
43.2.3 Procedure
Fiveminutes resting baseline data were recorded. All volunteers were then given1 g of ACZ. ACZ was injected intravenously over a 2 minute period withthe subject resting in a semi-recumbent position. Monitoring continued for20 minutes post ACZ administration.
43.2.4 Analysis
The data from all instruments was collected and resampled to 1 point per minute(0.016 Hz) using a cubic interpolation function (MatLab Mathworks Inc.).
PC 1
NIRO 300
5 cm 1.5 cm
CHANNEL 1 CHANNEL 2PC 2
Transcranial Doppler
Laser DopplerFLUX
Systemic Monitoring
Synchronisation
EMITTER
DETECTORDETECTOR
Fig. 43.1 Schematic representation of the experimental set up showing also the placement ofthe probes on the forehead.
43 Measurement of Cerebral Tissue Oxygenation 391

This optimised data handling without losing the temporal resolution of the ACZresponse. Data was then normalised to the start of the ACZ injection. Figure43.2 shows typical data from one volunteer during the 25 minute study.
Group data is presented as mean � standard deviations. All p values werecalculated for two-tailed tests of significance, and differences were consideredstatistically significant from baseline at p<0.05. Correlations between variableswere analysed using the Pearson coefficient.
43.3 Results
Group summary data is shown in Fig. 43.3. Mean Vmca before the ACZinjection was 48.6� 28.1 cm/s; the maximum increase in velocity was21.8� 10.3 cm/s which was equal to a mean increase of 51� 17% (p<0.01from baseline). The mean Vmca at the end of the study was 63.3� 30.6 cm/s.The mean Head TOI before the ACZ injection was 70.1� 3.5%; the maximumincrease was 1.8� 2.4% (p<0.05 from baseline). The EtCO2 at baseline was5.1� 0.6 kPa; the maximum decrease was 0.8� 0.5 kPa (p<0.01 from baseline)which was reached 20 minutes after the injection.
No statistical differences were seen in the laser Doppler perfusion signal, themean blood pressure and the mean Superficial TOI.
1517192123252729313335
Vmca
ACZ Injection15
17
19
21
23
25
27
29
31Flux
ACZ Injection
5.1
5.2
5.3
5.4
5.5
5.6
5.7
5.8
5.9
EtC
O2
(KP
a)
EtCO2
ACZ Injection
62
64
66
68
70
72
74
76
78
0 5 10 15 20 25
Time (minutes)
0 5 10 15 20 25
Time (minutes)
0 5 10 15 20 25
Time (minutes)
0 5 10 15 20 25
Time (minutes)
TO
I (%
)
Vm
ca (
cm/s
ec)
Flu
x (a
.u)
Head TOI
Superficial TOIACZ Injection
(c) (d)
(a) (b)
Fig. 43.2 Typical data from one volunteer. (a) EtCO2 (b) Skin blood perfusion (c) Middlecerebral artery flow velocity (d) NIRS Tissue oxygenation index.
392 I. Tachtsidis et al.

The relationship between the group mean percentage changes in Vmca and
the mean cerebral Head TOI changes show a significant association (r=0.77,
p<0.01), no correlation was seen with the Superficial TOI. These results are
shown in Fig. 43.4.
–20
–10
0
10
20
30
40
50
60
70
80
Δ)
%(ac
mV
¤
‡
‡
‡ ‡‡ ‡ ‡
‡
‡
‡
‡
‡‡‡‡
‡
‡
–1.4
–1.2
–1.0
–0.8
–0.6
–0.4
–0.2
0.0
0.2
0.4
Δ)a
PK(
2O
CtE
¤
‡‡
‡
‡‡
‡
‡‡
‡
‡
‡
‡‡
¤ ¤
–4
–3
–2
–1
0
1
2
3
4
5
¤*‡ *
¤
–6
–4
–2
0
2
4
6
8
0 1 2 3 4 5 6 7 8 9 10 11 12 13 14 15 16 17 18 19 20 21
Time (minutes)
0 1 2 3 4 5 6 7 8 9 10 11 12 13 14 15 16 17 18 19 20 21
Time (minutes)
0 1 2 3 4 5 6 7 8 9 10 11 12 13 14 15 16 17 18 19 20 21
Time (minutes)
0 1 2 3 4 5 6 7 8 9 10 11 12 13 14 15 16 17 18 19 20 21
Time (minutes)
ΔTO
I (%
)
ΔTO
I (%
)
Superficial TOI Change Head TOI Change(c) (d)
(a) (b)EtCO2 Change Vmca Change
‡
Fig. 43.3 Group summary data (a) Percentage changes in Vmca (b) Changes in EtCO2
(c) Changes in Head TOI (d) Changes in the Superficial TOI. (t-test from baseline; *p<0.05¤ p<0.03 z p<0.01).
–2.0–1.5–1.0–0.50.00.51.01.52.0
0 10 20 30 40 50 60ΔVmca (%)
0 10 20 30 40 50 60ΔVmca (%)
ΔTO
I Ch
ann
el 1
(%
)
ΔTO
I Ch
ann
el 2
(%
)r = 0.77, p < 0.01
–0.5
0.0
0.5
1.0
1.5
2.0
2.5r = 0.35, p > 0.05
(a) (b)
Fig. 43.4 Correlation analysis of the group summary data (a) Changes in Head TOI withpercentage changes in Vmca (b) Changes in Superficial TOI with percentage changes in Vmca.
43 Measurement of Cerebral Tissue Oxygenation 393
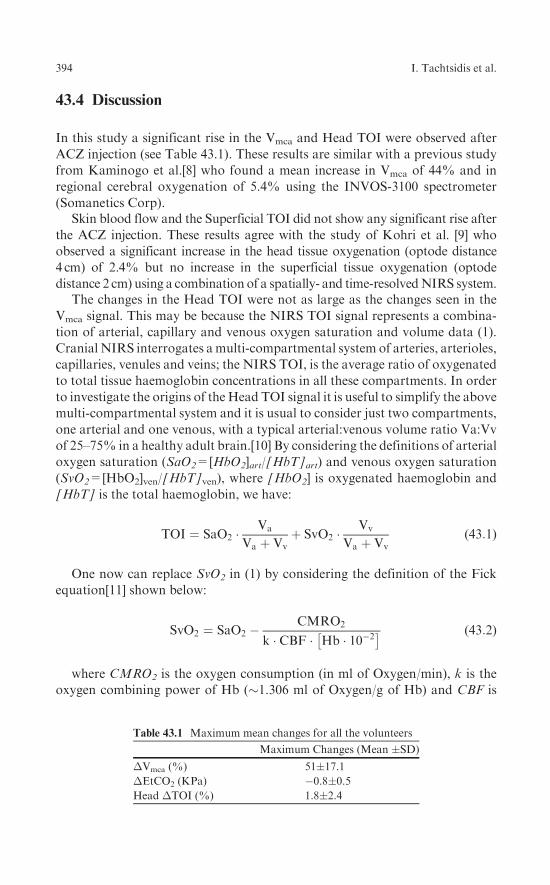
43.4 Discussion
In this study a significant rise in the Vmca and Head TOI were observed after
ACZ injection (see Table 43.1). These results are similar with a previous study
from Kaminogo et al.[8] who found a mean increase in Vmca of 44% and in
regional cerebral oxygenation of 5.4% using the INVOS-3100 spectrometer
(Somanetics Corp).Skin blood flow and the Superficial TOI did not show any significant rise after
the ACZ injection. These results agree with the study of Kohri et al. [9] who
observed a significant increase in the head tissue oxygenation (optode distance
4 cm) of 2.4% but no increase in the superficial tissue oxygenation (optode
distance 2 cm) using a combination of a spatially- and time-resolvedNIRS system.The changes in the Head TOI were not as large as the changes seen in the
Vmca signal. This may be because the NIRS TOI signal represents a combina-
tion of arterial, capillary and venous oxygen saturation and volume data (1).
Cranial NIRS interrogates amulti-compartmental system of arteries, arterioles,
capillaries, venules and veins; the NIRS TOI, is the average ratio of oxygenated
to total tissue haemoglobin concentrations in all these compartments. In order
to investigate the origins of the Head TOI signal it is useful to simplify the above
multi-compartmental system and it is usual to consider just two compartments,
one arterial and one venous, with a typical arterial:venous volume ratio Va:Vv
of 25–75% in a healthy adult brain.[10] By considering the definitions of arterial
oxygen saturation (SaO2=[HbO2]art/[HbT]art) and venous oxygen saturation
(SvO2=[HbO2]ven/[HbT]ven), where [HbO2] is oxygenated haemoglobin and
[HbT] is the total haemoglobin, we have:
TOI ¼ SaO2 �Va
Va þ Vvþ SvO2 �
Vv
Va þ Vv(43:1)
One now can replace SvO2 in (1) by considering the definition of the Fick
equation[11] shown below:
SvO2 ¼ SaO2 �CMRO2
k � CBF � Hb � 10�2� � (43:2)
where CMRO2 is the oxygen consumption (in ml of Oxygen/min), k is the
oxygen combining power of Hb (�1.306 ml of Oxygen/g of Hb) and CBF is
Table 43.1 Maximum mean changes for all the volunteers
Maximum Changes (Mean �SD)
�Vmca (%) 51�17.1�EtCO2 (KPa) �0.8�0.5Head �TOI (%) 1.8�2.4
394 I. Tachtsidis et al.

cerebral blood flow (in ml/min) and Hb is the haemoglobin (in g of Hb/dL of
blood). Therefore:
TOI ¼ SaO2 �Vv
Va þ Vv
� �
� CMRO2
k � CBF � Hb � 10�2� �
!
� 100% (43:3)
Equation 43.3 demonstrates the direct relationship of the NIRO 300 TOI
signal with the arterial/venous volume ratio, oxygen consumption and the
indirect relationship with CBF.ACZ is a selective inhibitor of carbonic anhydrase, which reversibly catalyses
the conversion of CO2þH2O$H2CO3. It therefore causes an increase in the
Hþ, HCO3– and CO2 concentrations in the extracellular fluid of the brain,
which are assumed to be the stimuli for the increase in CBF [12]. Bearing in
mind (3) and with the knowledge that ACZ markedly increases CBF without
any changes in oxygen consumption [13] or arterial oxygen saturation, it is
possible that an increase in the venous volume ratio will attenuate the increase
in TOI resulting from the rise in CBF. Furthermore each of the cerebral
haemodynamics compartments has different saturations and volumes which
may respond differently to ACZ causing a possible change in the Va:Vv.
43.5 Conclusions
After ACZ administration we were able to observe a significant increase in CBF
(measured with the transcranial Doppler) which was accompanied by a small
increase in absolute tissue oxygenation as monitored by the NIRO 300 with an
optode spacing of 5 cm but not with an optode spacing of 1.5 cm. Furthermore a
direct relationship was seen between the changes in Vmca and the Head TOI. This
work suggests that using this commercial NIRS instrument with an optode spacing
of 5 cm one is able to detect the intracranial changes. Further experimental work is
needed to determine the relationship between TOI, CBF, CBV and CMRO2 .
Acknowledgment This work was funded by the MRC/EPSRC MIAS-IRC, the ClinicalResearch & Development Committee of RF&UCMS/UCLH Charitable Trustees (IT) andthe Wellcome Trust (MT).
References
1. G.H. Weiss, R. Nossal, R.F. Bonner, ‘‘Statistics of penetration depth of photons re-emitted from irradiate tissue’’ J. Mod. Opt. 36, 349–359 (1989).
2. C. Cui, C. Kumar, B. Chance, ‘‘Experimental study of migration depth for the photonsmeasured at sample surface’’ Proc SPIE 1431, 180–191 (1991).
43 Measurement of Cerebral Tissue Oxygenation 395

3. E. Okada, M. Firbank, D.T. Delpy, ‘‘The effect of overlying tissue on the spatialsensitivity profile of near-infrared spectroscopy’’ Phys. Med. Biol. 40, 2093–2108 (1995).
4. D.N.F. Harris, F.M. Cowans, D.A. Wertheim, S. Hamid, ‘‘NIRS in adults – effects ofincreasing optode separation’’ Adv. Exp. Med. Biol. 345, 837–840 (1994).
5. E. Okada, D.T. Delpy, ‘‘Near-infrared light propagation in an adult head model. I.Modelling of low-level scattering in the cerebrospinal fluid layer’’ Applied Optics42(16), 2906–2914 (2003).
6. S. Suzuki, S. Takasaki, T. Ozaki, Y. Kobayashi, ‘‘A tissue oxygenation monitor usingNIR spatially resolved spectroscopy’’ Proc. SPIE 3597, 582–592 (1999).
7. P.G. Al Rawi, P. Smielewski, P.J. Kirkpatrick, ‘‘Evaluation of a near-infrared spectro-meter (NIRO 300) for the detection of intracranial oxygenation changes in the adulthead’’ Stroke 32, 2492–2500 (2001).
8. M. Kaminogo, A. Ichikura, S. Shibata, T. Toba, M. Yonekura, ‘‘Effect of acetazolamideon regional cerebral oxygen saturation and regional cerebral blood flow’’ Stroke 26,2358–2360 (1995).
9. S. Kohri, Y. Hoshi, M. Tamura, C. Kato, Y. Kuge, N. Tamaki, ‘‘Quantitative evaluationof the relative contribution ratio of cerebral tissue to near-infrared signals in the adulthuman head: a preliminary study’’ Physiol. Meas. 23, 301–312 (2002).
10. H. An, W. Lin, ‘‘Cerebral venous and arterial blood volumes can be estimated separatelyin humans using magnetic resonance imaging,’’ Magn. Reson. Med. 48, 583–588 (2002).
11. G.A. Dienel, ‘‘Energy generation in the central nervous system,’’ Cerebral blood flow andmetabolism, Edvinsson L. and Krause D.N., eds., (Lippincott Williams & Wilkins,Philadelphia, 2001), 140–161.
12. N.A. Lassen, ‘‘Is central chemoreceptor sensitive to intracellular rather than extracellularPh?’’ Clin. Physiol. 10(4), 311–319 (1990).
13. S. Vorstrup, L. Henriksen, O.B. Paulson, ‘‘Effect of acetazolamide on cerebral blood flowand cerebral metabolic rate of oxygen’’ J. Clin. Invest. 74, 1634–1639 (1984).
396 I. Tachtsidis et al.

Chapter 44
Measurement of Frontal Lobe Functional
Activation and Related Systemic Effects:
A Near-Infrared Spectroscopy Investigation
Ilias Tachtsidis, Terence S. Leung, Laurence Devoto,
David T. Delpy, and Clare E. Elwell1
Abstract Near-infrared spectroscopy (NIRS) has been used to measurechanges in cerebral oxy- and deoxy- haemoglobin (�[HbO2], �[HHb]) inresponse to functional activation. It has been previously reported that duringfunctional activation of the motor cortex heart rate increases. The aim of thisstudy was to investigate systemic changes during functional activation of thefrontal cortex. The responses to anagram presentations with varying difficulty(4-Letters and 7-Letters) over a 6 minute period were recorded. A HamamatsuNIRO 200 NIRS system recorded �[HbO2] and �[HHb] using the modifiedBeer Lambert law (MBL) and tissue oxygenation index (TOI) employing spatialresolved spectroscopy (SRS) over the left and right frontal hemisphere. Meanblood pressure (MBP) and heart rate (HR) were measured continuously. Nineyoung healthy volunteers (mean age 23) were included in the analysis. Signifi-cant task related changes were observed in both the NIRS and systemic signalsduring the anagram solving with increases in [HbO2] and [HHb] accompaniedby changes in MBP and HR. The [HbO2] and [HHb] signals measured over thefrontal region were found to have a varying association with the MBP signalacross different volunteers. The effect of these systemic changes on measuredNIRS signals must be considered
Keywords: Near-infrared spectroscopy, Frontal lobe activation, Anagrams
44.1 Introduction
Near infrared spectroscopy (NIRS) has been widely used to investigate haemo-dynamic changes which occur in response to functional activation of specificregions of the cerebral cortex [1]. With conventional continuous wave NIRS
1Medical Physics and Bioengineering, University College London, Malet Place EngineeringBuilding, Gower Street, London WC1E 6BT.Corresponding author: Ilias Tachtsidis, e-mail: [email protected]
K.A. Kang et al. (eds.), Oxygen Transport to Tissue XXIX� Springer 2008
397

systems it is not possible to determine exactly where the changes in attenuationhave taken place within the illuminated tissue A general assumption is usuallymade that the changes seen in oxyhaemoglobin (HbO2) and deoxyhaemoglobin(HHb) which are coincident with the period of stimulation originate from thecortical layers. We have previously reported that significant changes in heartrate occur during a finger tapping protocol for activation of the motor cortex inadults [2]. NIRS is increasingly being used to monitor the haemodynamicresponse to cognitive tasks by making measurements over the frontal andprefrontal regions [3–5]. It is possible that some mental tasks used in thesestudies may elicit a systemic response which may affect the measured NIRSsignals. The aim of this study was to investigate the systemic changes duringfunctional activation of the frontal cortex by measuring heart rate and meanblood pressure during anagram solving in adult volunteers.
44.2 Method
44.2.1 Subjects
Nine healthy male volunteers all right handed with English as their firstlanguage (age 20–25 years; mean 22.9 years) took part in this study.
44.2.2 Instrumentation
A continuous wave near-infrared spectrometer with a sampling rate of 6 Hz(NIRO 200, Hamamatsu Photonics KK) was used to measure changes in tissueoxygenation index (TOI) using spatially resolved spectroscopy and [HbO2]) and[HHb] using the modified Beer-Lambert law. The optodes from the dualchannel system were placed on the left and right forehead respectively (takingcare to avoid the midline sinuses) and were shielded from ambient light by usingan elastic bandage and a black cloth. An optode spacing of 4cm was used andthe differential pathlength factor (DPF) applied was 6.26 [6]. A Portapres1
system (TNO Institute of Applied Physics) was used to continuously andnon-invasively measure mean blood pressure (MBP) and heart rate (HR)from the finger.
44.2.3 Procedure
All the volunteers were positioned in a sitting position. After 2 minutes ofbaseline rest measurements activation started with a minute period of solving4-Letter anagrams (15 anagrams, 4 seconds per anagram) which was followed
398 I. Tachtsidis et al.

by a minute period of solving 7-Letter anagrams (6 anagrams, 10 seconds per
anagram). Each period was repeated a total of three times, with the study
ending after a 2 minute rest period (total study time 10 minutes). In this study
solving an anagram was defined as producing one coherent word using only the
letters from another (e.g. golf–flog; disease–seaside).
44.2.4 Analysis
The NIRS haemoglobin signals were first detrended to remove the slow drift,
then all the signals including MBP and HR, were low pass filtered at 0.08 Hz to
minimise the effects of other signal components. The filtering was carried out by
a 5th order low pass Butterworth digital filter in forward backward directions to
avoid introducing a phase delay (MatLab Mathworks Inc). The filtered signals
from each volunteer were ensemble averaged over the repetition cycles (per
volunteer two rest periods, three 4-Letter periods and three 7-Letter periods).
Changes in total haemoglobin concentration ([HbT]) were calculated from the
sum of changes in [HbO2] and [HHb].A ‘Student t-test’ was used to assess the significance of the responses (the
threshold of significance was set at p<0.05 from baseline). Correlations
between variables were analysed with the Pearson correlation model.
44.3 Results
44.3.1 Activation Results
Figure 44.1 shows the grand average of the NIRS, MBP and HR data from all
nine volunteers during the entire ten minute test. The response to stimulation
was calculated as the difference between the average of 10 seconds worth of
baseline rest data, and the average of 10 seconds of data 20 seconds after the
onset of the 4-Letter anagram solving period and the 7-Letter anagram solving
period respectively. These changes are shown in Table 44.1. There was a
significant change in [HbO2], [HHb] and [HbT] between rest and the 4-Letter
anagram solving period and between rest and the 7-Letter anagram solving
period. There was no significant difference in the NIRS signals between the 4-
Letter anagram solving period and the 7-Letter anagram solving period. The
systemic signals (MBP and HR) also showed a significant difference between
rest and the 4-Letter anagram solving period and between rest and the 7-Letter
anagram solving period.
44 Measurement of Frontal Lobe Functional Activation 399

Fig. 44.1 Grand averaged responses from all nine subjects of NIRS haemoglobin signals andsystemic measurements for the 10 minute study period.
400 I. Tachtsidis et al.

Table 44.1 Response of NIRS signals over the left and right brain frontal regions and MBPand HR during 4- and 7- Letter anagram solving. Data from nine volunteers is presented asmeans�SD. (t-test *p<0.01; yp<0.03; zp<0.05)
4-Letters - Rest 7-Letters - Rest
LH RH LH RH
�[HbO2] (mmoles/1) 2:48 �2:42* 2:41�1:72* 2:19�2:48* 2:30�1:76*�[HHb] (mmoles/1) �0:28�0:46z �0:38�0:33* �0:46�0:48* �0:44�0:30*
TOI(%) �1:03�3:20 �0:29�1:22 0:03�2:01 0:25�1:30�[HbT](mmoles/1) 2:19�2:69y 2:03�1:92* 1:73�2:76z 1:86�1:92*MBP (mmHg) 4:6�4:1* 4:8�3:2*HR (beats/min) 7:7�5:2* 3:5�3:0*
–0.8
–0.6
–0.4
–0.2
0.0
0.2
0.4
0.6
0.8
1.0
1 2 3 4 5 6 7 8 9
Subjects
Cor
rela
tion
Coe
ffic
ient
LEFT HEMISPHERE
–0.8
–0.6
–0.4
–0.2
0.0
0.2
0.4
0.6
0.8
1.0
1 2 3 4 5 6 7 8 9
Subjects
Cor
rela
tion
Coe
ffic
ient
RIGHT HEMISPHERE
MBP and [HbO2] MBP and [HHb]
Fig. 44.2 Individual correlation coefficients betweenMBP and [HbO2] andMBP and [HHb]for each subject.
44 Measurement of Frontal Lobe Functional Activation 401

44.3.2 Inter-Subject Correlation
The [HbO2] and [HHb] signals measured over the frontal region were found tohave a varying association with the MBP signal across different volunteers.In order to investigate this we calculated the correlation coefficient between thefiltered [HbO2] and MBP and [HHb] and MBP for both hemispheres in allsubjects. These results are shown in Fig. 44.2.
44.4 Discussion
In this study we demonstrated significant changes in NIRS variables ([HbO2],[HHb] and [HbT]) measured over both the right and left frontal region betweenrest and a 4-letter anagram solving period and between rest and a 7-letteranagram solving period. Furthermore, in the group data, we observed asignificant increase from rest in both MBP and HR during periods when thesubjects were solving the 4 and 7 letter anagrams. We have found that thehaemoglobin changes measured by NIRS during frontal lobe functional activa-tion were in some volunteers significantly correlated with the systemic changesin MBP and HR.
Given that the anagram task involves both language and spatial processing it isreasonable that the response is not lateralised. A previous study by Chance etal.[7] describes a robust prefrontal oxygenation signal in response to anagramsolving which also appears to be bilateral. To minimise the likelihood of move-ment artifact or non stimulation related changes, we chose in this study not to askthe subject to provide the answers to the presented anagrams and we were there-fore unable to score the subjects’ performance on the task and determine whetherthe systemic changes were related to this level of performance.
To our knowledge this is the first report of simultaneous measurements ofMBP and NIRS variables during a functional activation task of the frontalcortex. In a previous study we reported an increase in heart rate during a fingertapping task in adult volunteers [2]. Obrig et al [8]. measured arterial bloodpressure and heart rate in three subjects during visual stimulation (annularcheckerboard alternating at 8 Hz) and found a coherence between arterialblood pressure and [HbO2] at frequencies coinciding with the heart rate andspontaneous low frequency oscillations (centred around 0.1 Hz), but made nospecific comment about activation related changes in the systemic variables.
Nearly all studies of task-specific activation using functional neuroimagingrely on the existence of a close coupling between regional changes in brainmetabolism and regional cerebral blood flow, sometimes referred to asactivation-flow coupling or neurovascular coupling. Regional haemodynamicchanges are used as a surrogate marker for changes in regional brain functionthat occur due to changes in metabolism during excitatory or inhibitory neuro-transmission, both of which are energy consuming processes. The relatively
402 I. Tachtsidis et al.

high correlation coefficient found in some subjects in this study between [HbO2]and MBP and [HHb] and MBP suggests a centrally mediated mechanism thatmight play a role in the overall functional haemodynamic changes seen in thebrain in these individuals during stimulation. Caution therefore should be takenwhen analysing the cerebrovascular response of the activated brain due to theunknown haemodynamic contribution from the systemic alterations occurringduring stimulation.
Acknowledgment Thanks to theMIAS-IRC and theMedical Physics group of the Institute ofPhysics for travel support (IT) and the Clinical Research & Development Committee ofRF&UCMS/UCLH Charitable Trustees (IT).
References
1. H. Obrig, A. Villringer ‘‘Beyond the visible-imaging the human brain with light’’ J. Cereb.Blood Flow Metab. 23, 1–18 (2003).
2. T. Leung,C.E. Elwell, J. Henty, D.T. Delpy ‘‘Simultaneous measurement of cerebral tissueoxygenation over the adult frontal andmotor cortex during rest and functional activation’’Adv. Exp. Med & Biol 530, 385–389 (2002).
3. J. Fallgater, W. Strik ‘‘Frontal brain activation during the Wiscosin Card Sorting Testassessed with two channel near-infrared spectroscopy’’ Eur. Arch. Psychiatry Clin.Neurosci. 248, 245–249 (1998).
4. M.J. Hermann, A.C. Ehlis, A.J. Fallgater ‘‘Prefrontal activation through task require-ments of emotional induction measured with NIRS’’ Biol. Psychol. 64, 255–263 (2003).
5. Y. Hoshi, B.H. Tsou, V.A. Billock, M. Tanosaki, Y. Iguchi, M. Shimada, T. Shinba,Y. Yamada, I. Oda ‘‘Spatiotemporal characteristics of hemodynamic changes in thehuman lateral prefrontal cortex during working memory tasks’’ Neuroimage 20,1493–1504 (2003).
6. A. Duncan, J. Meek, M. Clemence, C.E. Elwell, L. Tyszczuk, M. Cope, D.T. Delpy‘‘Optical pathlength measurements on adult head, calf and forearm and the head of thenewborn infant using phase resolved optical spectroscopy’’ Phys. Med. Biol. 40, 295–304(1995).
7. B. Chance, S. Nioka, S. Sadi, C. Li ‘‘Oxygenation and blood concentration changes inhuman subjects prefrontal activation by anagram solutions’’ Adv. Exp. Med. & Biol.510,397–401 (2003).
8. H. Obrig, M. Neufang, R. Wenzel, M. Kohl, J. Steinbrink, K. Einhaupl, A. Villringer‘‘Spontaneous low frequency oscillations of cerebral hemodynamics and metabolism inhuman adults’’ Neuroimage 12, 623–639 (2000).
44 Measurement of Frontal Lobe Functional Activation 403

Author Index
Ahn, Chong H., 265Alfke, K., 299Anderson, Joseph C., 353Andres, Sarah A., 305, 315Apreleva, Sophia, 53Aslam, Rummana, 73, 288
Bassingthwaighte, James B., 353Beckert, Stefan, 73Berg, David T., 83Berson, R. Eric, 189Borsch, K., 299Bruley, Duane Frederick, 1, 15, 93Bumpus, Stefanie B., 305
Cabrera, Marco E., 325Carlson, Brian E., 353Chacko, Simi M., 45Chance, Britton, 4, 11, 151Chilton, Paula M., 64Co, Carlos, 199Cotterill, A., 145Cramer, Martin S., 83
Dash, Ranjan K., 353Delpy, David T., 21, 235, 389, 397Devendra, Presheena, 21Devoto, Laurence, 397DiMarzio, Charles A., 209Douglas, James S., 109
Eaton, J.W., 285Eckley, D. Mark, 29Elwell, Clare E., 6, 21, 217, 235, 389, 397Erb, Judith L., 315, 320Erokwu, Bernadette O., 345
Fasching, Angelica, 37Fisher, Elaine M., 345Friederich, Malou, 37
Galbreath, Elizabeth J., 83Gao, Dahai, 199Gassner, Birgit, 157Gatica, J.E., 361, 368Gekle, Michael, 157Gerlitz, Bruce, 83Gooch, Benn S., 109Grinnell, Brian W., 83
Han, Jungyoup, 265Hansell, Peter, 37Harrison, David K., 5, 8, 227Heuer, Josef G., 83Ho, Chia-Chi, 199Hockel, Michael, 127Hollmann, Joseph L., 209Hong, Bin, 6, 265, 275, 276, 285Huang, Ping, 151Hunt, Thomas K., 73Huser, Amy K., 165Hussain, Zamir, 73
Jakubowski, Joseph A., 83Jansen, O., 299Jensen, U., 7, 299Jin, Hanzhu, 7, 275, 277, 285
Kai, Junhai, 265Kakar, Sham S., 275, 282, 285Kakar, Shelly, 137Kang Derwent, Jennifer J., 253Kang, Kyung A., 93, 101, 104, 245, 265, 275,
276, 277, 285Kelleher, Debra K., 157Keng, Peter, 165, 179Kerr, D. Alan, 305, 315Khan, Mahmood, 45Kiani, Mohammad F., 333Kim, Jung, 89, 165, 179Koppaka, S.S., 361
405

Kruer, Traci L., 305, 315Kumar, Girish, 199Kuppusamy, M. Lakshmi, 45Kuppusamy, Periannan, 45Kutala, Vijay Kumar, 45Kwiatkowski, Pawel, 45
Lai, Nicola, 325LaManna, Joseph C., 345, 361, 371, 379Launer, L.J., 29Lee, James J., 93, 95Lee, William M.F., 53Leung, Terence S., 21, 217, 235, 397Liss, Per, 6, 37Liu, Chaomei, 74, 77, 165, 179Lorentz, Kristen, 253
Maguire, D.J., 145Makonnen, Sosina, 53Mayer, Arnulf, 127McGregor, W. Glenn, 137Mitchell, Thomas C., 64Mohanty, Joy G., 29Munce, T.B., 145
Okunieff, Paul, 165, 179Olerud, Johan, 37
Palm, Fredrik, 37Pattillo, Christopher B., 333Prabhakar Pandian, Balabhaskar, 333Puchowicz, Michelle A., 361, 379Purcell, Matthew R., 189
Raymond, Gary M., 353Ren, Yongjie, 101, 245, 265Rezania, Samim, 101Rezania, Samin, 245Rifkind, Joseph M., 29
Saidel, Gerald M., 325, 371Scott, Robert C., 333Sengupta, Sadhak, 64Shah, J.H., 145
Sharma, Ganesh R., 83Sharp, M. Keith, 189Singh, D.B., 227Smith, Martin, 21, 217, 235, 389Smolenkova, Irina A., 305, 315Stansby, G., 227Stingele, R., 299Sun, Weimin, 165, 179Sun, Xiaoyan, 345, 379Sundaram, Shankar, 333Swarts, Steven, 165Syed, Nakisha, 325
Tachtsidis, Ilias, 21, 217, 235, 389, 397Thews, Oliver, 157Thieman, Joshua W., 305Tisdall, Martin M., 7, 21, 217,
235, 389Tummala, Shanti, 253
Vaupel, Peter, 121, 127Vinogradov, Sergei A., 53Vitale, Rebecca J., 64
Wang, Bin, 333Wang, Wei, 165, 179Watson, Nicholas B., 137Williams, Jacqueline P., 165Williamson, J.D., 29Wilson, David F., 53, 55Wisel, Sheik, 45Wittliff, James L., 305, 309, 315, 320Wolff, Christopher B., 109Wolff, S., 299
Xu, Kui, 375, 379
Yang, Shanmin, 165, 179
Zayas-Santiago, Astrid, 253Zhang, Hengshan, 165, 179Zhang, Lurong, 165, 179Zhou, Haiying, 371Zou, Zhiwei, 265
406 Author Index

Subject Index
Activated protein C, 83–84, 102, 245Adhesion molecules, 333–334, 338, 341Adjuvant, 64, 66–71, 286Alternating electromagnetic field, 275–279Alveolar-arterial PO2 differences, 258,
357–360Alzheimer’s, 29–34, 363Amyloid, 29–34Anagrams, 23–26, 397–399, 402Angiogenesis, 14, 73–79, 89, 334Antioxidant treatment, 174, 380Apoptosis, 68, 85, 89, 165, 171, 179–185, 285
Biomaterials, 199–203Biomathematics, 151–155Biosensor, 101, 102, 245–251, 266–267, 269,
305–312, 315–321Blood
clot, 246pressure, 21, 22, 24, 26, 58, 109–117, 236,
380, 381, 391, 392, 397, 398, 402Blood-tissue exchange, 354–355Brain metabolism, 26, 361–363, 368, 402Breast cancer, 275–276, 285–293, 315, 319Broadband spectrometer, 219
Calcium transition pore, 179, 181–185Calibration, 14, 48, 110, 232, 305–312, 315,
317, 318, 321Cancer
detection, 151–155, 275, 286Carbon dioxide, 353–355Carbonic anhydrase
IX, 121, 124, 127, 130, 395Cardiac
arrest and resuscitation, 379–381, 383,385, 386
marker, 265–273output, 110–113, 115
Cardiovascular diseases, 265, 306Cell
cultures, 46, 66–67, 77, 90, 138–139, 158,162, 189–191, 197, 288–289
cycle, 137, 139, 140, 166, 180therapy, 45–46
Cerebralblood flow regulation, 26, 361, 371–377,
389, 390, 395, 402near-infrared spectroscopy, 217, 389, 397
CFD, 189, 191, 333, 335Chemokine, 83–89Chemoresistance, 128, 158Chemotherapy, 180, 184, 185, 286Cognitive task, 22, 398Cohn fraction IV-1, 93Compartmentalization, 363–367Cytochalasin B, 64, 66, 67, 69–71Cytochrome-c-oxidase, 217–218, 220
Diabetes, 37, 39, 42–43, 325, 331Diagnosis, 101–102, 245–246, 251, 265–273Differentiation, 199Diffusion model, 7, 167, 209, 325,
327, 330–332, 337, 346, 354–355,371, 373
Disorder, 20, 27, 30, 102, 145, 245, 363DNA
polymerase iota, 138–143repair, 165, 170
Electrodes, 3, 11–14, 58–59, 128Endogenous hypoxia marker, 127–131Endothelial cell, 29, 34, 77–79, 168, 173,
189–190, 199–204, 334, 338, 341EPR oximetry, 51Erythrocyte, 15, 391Estrogen, 180, 305–312, 315–321Exercise, 325–327, 330–331, 351, 356
407

Expression, 128–131, 145–146, 149, 157–163,168, 171–174, 184, 305–306, 308–312,331, 334, 354, 355, 374
Factor II, 93, 94Factor V, 101, 102, 245–251
Leiden, 28Leiden purification, 101–107
Fe3O4 nanoparticles, 275–283, 285, 294–295Fluorescence
enhancement, 266, 281, 282lifetime imaging, 14
Frontal lobe, 235, 237, 391, 397–403Functional activation, 397–403
Glucose, 64–71, 123–124, 127, 129, 131,151–160,163, 345–346,350, 362–363,380
Glucose transporter, 64–68, 123, 127, 131,345, 350, 351
Hemodynamical relevance, 300Hemoglobin, 210–214, 299–304, 331,
353–356, 371–373Hemoglobin dissociation curves, 354HI, 145–149Hyperbaric hypoxia, 173Hyperoxia, 74, 77, 242, 253–260Hyperthermia, 275–276, 286Hypoxia
inducible factor-1, 128–130, 371
Immobilized metal affinitychromatography, 93, 94
Immuno-affinity chromatography, 101–107Inflammation, 74, 78, 84, 172, 173, 333, 342INOS, 83, 86–89Internal carotid artery, 299–300Ischemia, 172, 351, 361, 364, 366–369,
379–381Ischemic heart, 45–46ISOTT, 1
awards, 1–2founding, 1–2history, 1meetings, 1–2, 6, 15presidents, 5
Ketone bodies, 361–368Kidney, 37–43, 59, 85, 200, 287Kir6.2, 146–149
Lactate, 73–79, 123, 129, 159, 164, 290, 294,350, 361–368, 380
Laser Doppler Flowmetry, 227Lasers, 210Late radiation effects, 172, 174LHRH
receptor, 276, 278, 282, 285–293Light emitting diodes, 209–210Lipid peroxidation, 38, 168, 379, 380, 386Lipogenesis
CO2 output, 121–124LPS, 64–70Lubbers, D.W., 5, 6
Mathematical model, 2, 3, 7, 325, 326,333–339, 360, 361, 365, 367, 371,372, 390
Microcirculation, 2, 3, 7, 15, 29, 53, 228,331, 354
Microcontact printing, 199–202Micro-electro-mechanical system, 265–266Microfluidics, 265–271MIP2, 83–89Mitochondrial DNA, 169–170, 174Modeling, 151, 325, 333–341Monte Carlo, 209, 213, 215MRPI, 157–165, 185Multi-analyte biosensor, 273Multi-functional, 275, 279, 283Myocardial infarction, 45–48, 265, 333–335
2–NBDG, 64–71Nanogold particle, 266, 275, 276, 277–278Nanoparticle, 265–266, 279, 290, 291, 294Near infrared spectroscopy, 10, 21, 217, 235,
299, 300, 325, 389, 397
Opticaldetection, 275–283sensors, 12, 271
Oral mucosa, 227–233Orbital shaker, 189–191, 197, 308Oscillatory flow, 190Oxygen
consumption, 10, 37–42, 54, 326–331,373, 382, 383, 394, 395
control, 371saturation, 209, 212–219, 221, 228,
235–243, 299–303, 331, 389, 390,394–395
transport, 1–8, 9, 12–13, 53, 325, 326,333, 335, 336
OxyphorG2, 53–58G3, 53–57
408 Subject Index

Particle tracking, 253–259PEG/PLA, 199Pericellular space, 53, 59Permeability, 38, 185, 331, 355, 356P-glycoprotein (pGP), 157, 161–163Phloretin, 64, 66–70Phosphorescence, 54–60, 325Polymorphism, 145–149Protein C, 83–90, 93, 102, 245–246Pulmonary oxygen uptake, 360Pulse oximetry, 209, 215, 299–300
RAD18, 137–143Red blood cell, 29–33, 66, 258, 330,
353–360, 372carriage, 30
Reperfusion injury, 173, 379–380, 386Respiratory quotient, 121–123, 355Retina, 254, 256, 259Retinal hemodynamics, 253, 254, 259, 260
Scalp flux, 21, 24, 26, 27Scanning laser ophthalmoscope, 253–259Sepsis, 83–84, 88, 89, 93Shear stress, 189–197Simulation, 151–155, 215, 325, 326, 328, 356,
358, 361, 366, 371, 373–376Single point mutation, 102, 245, 247, 251Skeletal
muscle, 46, 53–59, 325–327, 330–331, 350myoblast, 45–51
Small intestine, 345–351Smokers, 229, 299, 302Spectrophotometry, 11, 227–228Stenosis, 299–303
Targeteddrug delivery, 334–335therapy, 285–295
T cell, 64–70, 83, 87, 89Thrombosis, 246Tissue
optics, 277oxygenation, 46, 51, 235, 336, 389–394,
395, 397, 398Tongue mucosa, 227–233Transcranial pulse oximetry, 299Translation, 146–149, 191Translesion DNA synthesis, 137Transport
activity, 157–158, 161Traumatic brain injury, 224,
235, 236, 237Tube hematocrit, 31Tumor
acidosis, 124hypoxia, 131, 158, 163oxygenation, 53, 162pathophysiome, 121, 124
UCLn algorithm, 217, 219Uncoupling protein, 37–43UV radiation, 137, 139
VEGF, 73–78, 83, 88–89, 132, 199, 334,342
Venous oxygen saturation, 235, 236, 394Visible light spectrophotometry, 227Visible spectrophotometry, 227
Waveform simulation, 113–116
Subject Index 409
Related Documents