Hyperspectral and Thermal Remote Sensing of Plant Stress Responses to Oil Pollution Ebele Josephine Emengini, B.Sc. (Hons), M.Sc. Thesis submitted in the fulfilment of the requirements for the degree of Doctor of Philosophy Lancaster Environment Centre, Faculty of Science and Technology, Lancaster University, United Kingdom February 2010

Welcome message from author
This document is posted to help you gain knowledge. Please leave a comment to let me know what you think about it! Share it to your friends and learn new things together.
Transcript
Hyperspectral and Thermal Remote Sensing of Plant Stress Responses
to Oil Pollution
Ebele Josephine Emengini, B.Sc. (Hons), M.Sc.
Thesis submitted in the fulfilment o f the requirements for the degree o f
Doctor o f Philosophy
Lancaster Environment Centre, Faculty o f Science and Technology,
Lancaster University, United Kingdom
February 2010
ProQuest Number: 11003496
All rights reserved
INFORMATION TO ALL USERS The quality of this reproduction is d e p e n d e n t upon the quality of the copy subm itted.
In the unlikely e v e n t that the author did not send a c o m p le te manuscript and there are missing p a g e s , these will be n oted . Also, if material had to be rem oved,
a n o te will ind icate the deletion .
uestProQuest 11003496
Published by ProQuest LLC(2018). Copyright of the Dissertation is held by the Author.
All rights reserved.This work is protected against unauthorized copying under Title 17, United States C o d e
Microform Edition © ProQuest LLC.
ProQuest LLC.789 East Eisenhower Parkway
P.O. Box 1346 Ann Arbor, Ml 4 8 1 0 6 - 1346

DECLARATION
I declare that this thesis is my own work, and has not been submitted for the award of
any other degree at this institution or elsewhere.
ii

ACKNOWLEDGEMENTS
I would like to express my deep and sincere gratitude to my principal supervisor
Dr Alan Blackburn, whose inspiration, guidance and support from the initial to the final
level enabled me to develop an understanding of the subject and attain to the completion
o f this thesis. His wide knowledge and logical way of thinking have been o f great value
for me. I am also deeply grateful to my second supervisor Dr Julian Theobald for his
continuous assistance and enormous support throughout the period of this research. His
detailed and constructive comments were very valuable.
It is an honour for me to thank the Petroleum Technology Development Fund
(PTDF), Nigeria for financially sponsoring this research. I gratefully acknowledge the
Natural Environment Research Council (NERC), UK for offering me training and for the
loan of an ASD field spectroradiometer used for this study. I also wish to thank Dr
Duncan Whyatt, Dr Phil Barker, Dr Andy Folkard, Dr Suzi Ilic, and Prof Jingfeng for
their support during this project. I am heartily thankful to Paul Williams, Andy Quin,
Gemma Davies, Simon Chew, Dianne Wilkinson, Jan Parkinson and Maureen Harrison
who were very supportive and always happy to offer technical and administrative
assistance whenever I need them.
I owe my loving thanks to my husband Michael, my sons Dumebi and Kamdili
and my daughter Esom for their patience throughout the period of this research. Indeed,
they were ‘angels' ! Lastly, I would like to express special thanks to my friends and
colleagues, Alex, Emma, Zulkiflee, Liz, Becky, and Elspeth and above all, my Mum and
Dad, brothers and sisters, Nicolas, Emmanuel, for their prayers and enormous support.
ABSTRACT
This study investigates the potential use of hyperspectral and thermal remote sensing
for the early pre-visual detection and quantification of plant stress caused by oil pollution.
Further, it examines the potential for these techniques to discriminate between oil pollution
and two typically encountered plant stresses of waterlogging and water deficit. Results show
that oil pollution, waterlogging and water deficit significantly decreased the physiological
functions of plants and can result in pre-visual changes in spectral and thermal responses.
Various spectral indices such as (R755-R7i6)/(R755+R7i6) and R800/R6O6 were efficient for the
early detection of oil-induced stress in maize (up to 10 days earlier) and bean (up to 4 days
earlier), respectively. These indices and other simple ratios of reflectance such as R673/R545
were also sensitive in the early detection (up to 6 days earlier) of stress symptoms caused by
waterlogging in bean. The canopy absolute temperature and thermal index (IG) were good
indicators of oil related stress in bean, but were insensitive to waterlogging. Absolute leaf
temperature had minimal potential for detecting oil pollution in maize. While the spectral
indices lacked ability for the early detection of stress caused by water deficit at the leaf scale
in both maize and bean, absolute temperature was effective in this regard irrespective of
scale of measurement. Results show that by combining spectral and thermal information, oil
pollution can be discriminated from waterlogging or water deficit treatment. This study
concludes that hyperspectral and thermal remote sensing have the potential to detect and
quantify plant stress caused by oil pollution and it is possible to discriminate between this
and other common stresses. However, further work is needed to refine and operationalise the
approach, and the problems and challenges associated with this are presented and discussed.
CONTENTS PAGE
Title P a g e ........................................................................................................................................i
D eclaration.................................................................................................................................... ii
A cknowledgements.....................................................................................................................iii
A bstract................................................................. iv
C onten ts......................................................................................................................................... v
List o f F igures................................................................... xi
List o f T ab les ............................................................................................................................. xxi
C hap ter 1 ....................................................................................................................................... 1
IN TRO DU CTIO N .................................................................................... 1
1.1 Background...................................................................................................................... 1
1.2 Effects o f oil pollution on plants: threats and opportunities....................................3
1.3 Research aims and objectives.......................................................................................7
1.4 Research outline.............................................................................................................. 8
C hapter 2 .....................................................................................................................................10
LITERATU RE REV IEW ........................................................................................................10
2.1 Introduction....................................................................................................................10
2.2 Plants...............................................................................................................................11
2.2.1 Plant stress.....................................................................................................................11
2.3 Impact of oil on soils and plants................................................................................ 14
2.3.1 Effects o f oil on soil................................................................................................. •••16
2.3.2 Effects of oil on plants.................................................................................................19
2.4 Remote sensing o f plant stress...................................................................................23
2.4.1 The spectral reflectance of plants............................................................................. 24
2.4.2 Diagnostic indicators of plant stress.........................................................................28
2.4.2.1 Visible reflectance..................................................................................................... 28
2.4.2.2 Red-edge region......................................................................................................... 29
2.4.2.3 Near infrared (NIR) region...................................................................................... 31
2.4.2.4 Shortwave infrared (SWIR) region......................................................................... 32
2.4.2.5 Spectral and derivative indices................................................................................ 34
2.4.3 Optical remote sensing techniques........................................................................... 36
2.4.3.1 Multispectral and hyperspectral remote sensing................................................... 37
2.4.4 Thermal infrared imaging techniques......................................................................45
2.4.5 Synthetic Aperture Radar (SAR) imaging techniques..........................................48
2.4.6 LiDAR imaging techniques......................................................................................49
2.5 Conclusion...................................................................................................................51
Chapter 3 .................................................................................................................................... 52
METHODOLOGY ....................................................................................................................52
3.1 Introduction..................................................................................................................52
3.2 Plant material.............................................................................................................. 52
3.3 Plant treatments...........................................................................................................53
3.4 Physiological measurements.....................................................................................54
3.5 Thermal imaging........................................................................ 54
3.6 Spectral measurements..............................................................................................55
3.7 Measurement of leaf pigments and water content................................................ 57
3.8 Data analysis............................................................................................................... 58
3.8.1 Physiological analysis................................................................................................58
3.8.2 Thermal imaging analysis.........................................................................................59
3.8.3 Spectral data analysis................................................................................................60
3.8.4 Statistical and sensitivity analysis............................................................................63
Chapter 4 .....................................................................................................................................65
PRE-VISUAL DETECTION OF OIL-INDUCED STRESS IN MAIZE (Zea mays,
L.) USING LEAF SPECTRAL AND THERMAL RESPONSES................................65
4.1 Introduction..................................................................................................................65
4.2 Pilot study....................................................................................................................6 8
4.2.1 Plant materials and treatments..................................................................................69
4.2.2 Spectral measurements and analysis......................................................................... 69
4.2.3 Results of pilot study.................................................................................................71
4.2.3.1 Visual stress symptoms............................................................................................. 71
4.2.3.2 Spectral response to stress........................................................................................ 72
4.2.3.3 Discussion....................................................................................................................75
4.2.3.4 Conclusion...................................................................................................................76
4.3 M ethods.......................................................................................................................77
4.4 Results.......................................................................................................................... 79
4.4.1 Photosynthesis............................................................................................................79
4.4.2 Transpiration............................................................................................................... 81
4.4.3 Stomatal conductance................................................................................................82
4.4.4 Visual stress observations......................................................................................... 84
4.4.5 Spectral reflectance.................................................................................................... 85
4.4.6 Thermal imaging........................................................................................................ 98
4.5 Discussion..................................................................................................................101
4.6 Conclusion................................................................................................................ 108
Chapter 5 .................................................................................................................................110
DETECTION AND DISCRIMINATION OF STRESS IN BEAN (Phaseolus
vulgaris ‘ Tender green 9 CAUSED BY OIL POLLUTION AND WATERLOGGING
USING SPECTRAL AND THERMAL RESPONSES 110
5.1 Introduction...............................................................................................................HO
vii
5.2 M ethods..................................................................................................................... 1 1 2
5.3 Results.........................................................................................................................113
5.3.1 Visual stress observations....................................................................................... 113
5.3.2 Photosynthesis.......................................................................................................... 114
5.3.3 T ranspiration............................................................................................................. 115
5.3.4 Stomatal conductance.............................................................................................. 116
5.3.5 Spectral Reflectance................................................................................................ 117
5.3.5.1 Visible and NIR reflectance................................................................................... 117
5.3.5.2 Spectral indices........................................................................................................ 118
5.3.5.3 Red-edge features....................................................................................................120
5.3.6 Thermal imaging.......................................................................................................123
5.4 Discussion..................................................................................................................125
5.5 Conclusion.................................................................................................................132
Chapter 6 .................................................................................................................................. 134
EXPLOITING SPECTRAL AND THERMAL RESPONSES OF MAIZE (Zea
mays L.) FOR EARLY DETECTION AND DISCRIMINATION OF STRESSES
CAUSED BY OIL POLLUTION AND WATER DEFICIT ........................................134
6.1 Introduction...............................................................................................................134
6.2 M ethods.....................................................................................................................136
6.3 Results........................................................................................................................137
6.3.1 Physiological and biochemical responses to treatments.................................... 137
6.3.1.1 Visual stress symptoms.......................................................................................... 137
6.3.1.2 Photosynthesis.........................................................................................................138
6.3.1.3 Transpiration............................................................................................................ 139
6.3.1.4 Stomatal conductance.............................................................................................140
6.3.1.5 Leaf total chlorophyll..............................................................................................142
6.3.1.6 Carotenoids.............................................................................................................. 143
6.3.1.7 Leaf water content..................................................................................................144
viii
6.3.2 Interrelationships between physiological and biochemical variables................145
6.3.3 Responses of spectral reflectance to treatm ents................................................... 148
6.3.3.1 Relationships between spectral reflectance and physiological and biochemical
variables......................................................................................................................149
6.3.3.2 Relationships between spectral indices and biochemical variables................. 155
6.3.3.3 Temporal response of optimal spectral indices................................................... 159
6.3.4 Thermography...........................................................................................................162
6.4 Discussion..................................................................................................................165
6.5 Conclusion................................................................................................................ 176
Chapter 7 .................................................................................................................................. 178
ASSESSING THE PERFORMANCE AND STABILITY OF SPECTRAL AND
THERMAL RESPONSES IN BEAN (Phaseolus vulgaris ‘Tendergreen’)
TREATED WITH OIL AND WATER DEFICIT AT LEAF AND CANOPY
SCALES .....................................................................................................................................178
7.1 Introduction............................................................................................................... 178
7.2 M ethods.....................................................................................................................180
7.3 Results........................................................................................................................ 181
7.3.1 Physiological and biochemical responses to treatments.................................... 181
7.3.1.1 Visual stress symptoms............................................................................................181
7.3.1.2 Photosynthesis..........................................................................................................182
7.3.1.3 Transpiration............................................................................................................. 183
7.3.1.4 Stomatal conductance..............................................................................................184
7.3.1.5 Leaf total chlorophyll...............................................................................................186
7.3.1.6 Carotenoids...............................................................................................................187
7.3.1.7 Leaf water content.................................................................................................188
7.3.2 Interrelationships between physiological and biochemical variables...............189
7.3.3 Responses of spectral reflectance to treatm ents..................................................192
7.3.3.1 Relationships between leaf spectral reflectance and physiological and
biochemical variables...............................................................................................194
7.3.3.2 Relationships between spectral indices and biochemical variables.................. 198
7.3.3.3 Temporal response o f optimal spectral indices.................................. 202
7.3.4 Thermography........................................................................................................... 210
7.4 Discussion..................................................................................................................214
7.5 Conclusion.................................................................................................................222
Chapter 8 .................................................................................................................................. 224
CONCLUSIONS AND FUTURE W ORK ........................................................................224
8.1 Conclusions................................................................................................................224
8.2 Synthesis of results...................................................................................................229
8.2.1 Early detection of stress factors............................................................................. 231
8.2.2 Discrimination o f different stresses.......................................................................232
8.3 Summary o f contributions...................................................................................... 235
8.4 Limitations o f the study.......................................................................................... 236
8.5 Future research directions....................................................................................... 237
References 241
LIST OF FIGURES PAGE
Figure 2.0 Schematic o f plant canopies (a-f) and soil structure (g)................................... 15
F igure 2.1 Interaction of incident electromagnetic radiation with plant leaf..................24
F igure 2.2 Typical reflectance characteristics o f leaves. Adapted from Hoffer (1978).25
Figure 4.0 Visual symptoms of grass according to treatment levels o f engine oil. C =
control, L = low, M = medium, H = high................................................................................ 71
Figure 4.1 Visual symptoms of forsythia 28 days after treatments with engine oil at
varied doses. C = control, L = low, M = medium, H = high................................................71
Figure 4.2 Mean reflectance spectra of engine oil treatments and control in grass 28
days after treatments commenced. C = control, EL = engine oil low dose, EM = engine
oil medium dose, EH = engine oil high d o se ........................................................................ 73
Figure 4.3 Differences between mean spectra of engine oil treatments and control in
grass 28 days after treatments commenced. C = control, EL = engine oil low dose, EM =
engine oil medium dose, EH = engine oil high d o se ........................................................... 73
Figure 4.4 Effects of treatment on photosynthesis in maize over the course of the
experiment. Treatments are denoted by the key. Error bars = 1 x SD, n = 8 ...................80
Figure 4.5 Effects of treatment on transpiration in maize over the course of the
experiment. Treatments are denoted by the key. Error bars = 1 x SD, n = 8 ..................81
Figure 4.6 Effects of treatment on stomatal conductance in maize over the course of the
experiment. Treatments are denoted by the key. Error bars = 1 x SD, n = 8 ................... 83
Figure 4.7 Visual stress symptoms of maize according to dose levels 14 days after
treatm ent...................................................................................................................................... 84
Figure 4.8 Mean reflectance spectra o f control and treated maize 14 days after
treatment. Dose level of treatments are denoted by the key, n = 8 0 .............................. 85
Figure 4.9 Relationship between reflectance and measured physiological properties: a)
R705 and photosynthesis; b) R705 and transpiration; c) R705 and stomatal
conductance............................................................................................................................. 86
Figure 4.10 Temporal change in mean reflectance spectra o f treatments at varied dose
levels and control in maize at approximately 705 n m ..................................................... 87
Figure 4.11 Relationship between photosynthesis and index (R755-R7i6)/(R755+R7 i6)--- - 91
Figure 4.12 Mean first (left) and corresponding second (right) derivative reflectance
curves showing temporal change in the shape o f the red-edge and steepness of the
double features found in the red-edge region: a) control; b) low; c) medium; d) high. Dot
and dash lines depict first and second peaks respectively.....................................................94
Figure 4.13 Temporal change in position of first peak in red-edge region of the first
derivative in maize. Treatments are denoted by the key, n = 8 .......................................... 96
Figure 4.14 Temporal change in REP of control and treated maize. Treatments are
denoted by the key. Error bars = 1 x SD, n = 8 .....................................................................97
Figure 4.15 Relationship between the REP and measured physiological properties: a)
photosynthesis; b) transpiration; c) stomatal conductance.................................................. 98
Figure 4.16 Temporal changes in leaf absolute temperature of treated and control plants.
Treatments are denoted by the key. Error bars = 1 x SD, n = 8 ........................................ 99
Figure 4.17 Temporal changes o f thermal index (IG) o f treated and control plants.
Treatments are denoted by the key. Error bars = 1 x SD, n = 8 ........................................100
Figure 4.18 Relationship between thermal index (IG) and stomatal conductance 100
Figure 5.0 Visual stress symptoms in bean caused by oil pollution, waterlogging and
combined oil and waterlogging at the end of the experiment. No visual stress symptoms
were observed in the contro ls................................................................................................... 114
Figure 5.1 Effects of treatment on photosynthesis in bean over the course of the
experiment. Treatments are denoted by the key. Error bars = 1 x SD, n = 8 ....................115
Figure 5.2 Effects of treatment on transpiration in bean over the course of the
experiment. Treatments are denoted by the key. Error bars = 1 x SD, n = 8...................116
Figure 5.3 Effects of treatment on stomatal conductance in bean over the course of the
experiment. Treatments are denoted by the key. Error bars = 1 x SD, n = 8 ....................117
F igure 5.4 Mean reflectance spectra of control and treated bean 14 days after treatment.
Treatments are denoted by the key, n = 8 0 .......................................................................... 118
Figure 5.5 First derivative o f reflectance o f control and treated bean 14 days after
treatment. Treatments are denoted by the k e y ..................................................................... 121
Figure 5.6 Temporal change in REP of control and treated bean. Treatments are denoted
by the key. Error bars = 1 x SD, n = 8 .................................................................................... 122
Figure 5.7 Temporal changes in canopy absolute temperature o f treated and control
plants. Treatments are denoted by the key. Error bars = 1 x SD, n = 8 .............................124
Figure 5.8 Temporal changes o f thermal index (7g) o f treated and control plants.
Treatments are denoted by the key. Error bars = 1 x SD, n = 8 ..........................................124
Figure 6.0 Visual stress symptoms in maize leaves caused by oil pollution, water deficit
and combined oil and water deficit at the end of the experiment. No visual stress
symptoms were observed in the controls................................................................................137
Figure 6.1 Effects of oil contamination o f soil, water deficit and combined oil
contamination and water deficit on photo synthetic activities of maize over time.
Treatments are denoted by the key. Bars = 1 x SE, n = 1 0 ............................................... 139
Figure 6.2 Effects o f oil contamination, water deficit and the combined oil and water
deficit on transpiration o f maize, over time. Treatments are denoted by the key. Bars = 1
x SE, n = 1 0 ................................................................................................................................ 140
Figure 6.3 Effects of oil contamination, water deficit and the combined oil and water
deficit on stomatal conductance of maize, over time. Treatments are denoted by the key.
Bars = 1 x SE, n = 1 0 ................................................................................................................. 141
Figure 6.4 Effects of oil contamination of soil, water deficit and combination of oil and
water deficit on total chlorophyll contents o f maize. Treatments are denoted by the key.
Bars = 1 x SE, n = 5 ................................................................................................................... 143
Figure 6.5 Effects o f oil contamination, water deficit and the combined oil and water
deficit on carotenoid content o f maize. Treatments are denoted by the key. Bars = 1 x
SE, n = 5 .......................................................................................................................................144
Figure 6.6 Effects o f oil contamination, water deficit and the combined oil and water
deficit on leaf water content of maize over time. Treatments are denoted by the key. Bars
= 1 x S E , n = 5 ............................................................................................................................ 145
Figure 6.7 Relationships between total chlorophyll content and photosynthetic activities
o f maize, n = 32 (mean values per treatment, per sampling occasion)............................ 146
Figure 6.8 Relationships between transpiration and leaf water content o f maize,
n = 3 2 ......................................................................................................................................... 147
Figure 6.9 Relationships between stomatal conductance and leaf water content of
maize, n = 3 2 ...............................................................................................................................147
Figure 6.10 Mean reflectance spectra of treated and control leaves 18 days after
treatment. Treatments as denoted by the key, n = 1 0 0 .........................................................149
Figure 6.11 Correlogram showing the variation with wavelength in the correlation
between the photo synthetic activity of maize and spectral reflectance, n = 3 2 ............... 150
xiv
Figure 6.12 Correlogram showing the variation with wavelength in the correlation
between the transpiration rate of maize and spectral reflectance, n = 3 2 ..........................151
Figure 6.13 Correlogram showing the variation with wavelength in the correlation
between the stomatal conductance of maize and spectral reflectance, n = 3 2 ..................152
Figure 6.14 Correlogram showing the variation with wavelength in the correlation
between the leaf chlorophyll content of maize and spectral reflectance, n = 3 2 ..............153
Figure 6.15 Correlogram showing the variation with wavelength in the correlation
between the leaf carotenoid content of maize and spectral reflectance, n = 3 2 ............. 154
Figure 6.16 Correlogram showing the variation with wavelength in the correlation
between the leaf water content of maize and spectral reflectance, n = 3 2 ......................155
Figure 6.17 Relationships between (Ri33o-R538)/(Ri330+R538) and total chlorophyll
content o f maize, n = 3 2 .......................................................................................................... 157
Figure 6.18 Relationships between (R736-R43oy(R736+R43o) and carotenoid content of
maize, n = 3 2 ............................................................................................................................. 158
Figure 6.19 Relationships between R9oo and leaf water content of maize, n = 3 2 .........158
Figure 6.20 Change in (Ri33o-R538)/(Ri330+R538) with time. Treatments are denoted by
the key. Bars = 1 x SE, n = 1 0 ...........................................................................................159
Figure 6.21 Change in (R736-R43o)/(R736+R43o) with time. Treatments are denoted by the
key. Bars = 1 x SE, n = 1 0 ...................................................................................................... 160
Figure 6.22 Change in R90o with time. Treatments are denoted by the key. Bars = 1 x
S E , n = 1 0 .................................................................................................................................. 161
Figure 6.23 Effects of oil contamination, water deficit and the combined oil and water
deficit on the absolute temperature of maize leaves over time. Treatments are denoted by
the key. Bars = 1 x SE, n = 1 0 ................................................................................................163
xv
Figure 6.24 Effects o f oil contamination, water deficit and the combined oil and water
deficit on the thermal index ( Ig ) of maize leaves over time. Treatments are denoted by
the key. Bars = 1 x SE, n = 10 164
Figure 6.25 Relationships between the stomatal conductance and thermal index (Ig), n =
32.................................................................................................................................................... 165
Figure 7.0 Visual stress symptoms in bean leaves caused by oil pollution, water deficit
and combined oil and water deficit at the end of the experiment. No visual stress
symptoms were observed in the controls.............................................................................. 181
Figure 7.1 Visual stress symptoms in bean canopies caused by oil pollution, water
deficit and combined oil and water deficit at the end o f the experiment. No visual stress
symptoms were observed in the controls.............................................................................. 182
Figure 7.2 Effects of oil contamination o f soil, water deficit and combined oil
contamination and water deficit on photosynthetic activities o f bean over the course of
the experiment. Treatments are denoted by the key. Error bars = 1 x SD, n = 10..........183
Figure 7.3 Effects o f oil contamination, water deficit and the combined oil and water
deficit on transpiration of bean, over time. Treatments are denoted by the key. Bars = 1 x
SD, n = 10................................................................................................................................... 184
Figure 7.4 Effects o f oil contamination, water deficit and the combined oil and water
deficit on stomatal conductance o f bean, over time. Treatments are denoted by the key.
Bars = 1 x SD, n = 1 0 ................................................................................................................ 185
Figure 7.5 Effects of oil contamination of soil, water deficit and combination of oil and
water deficit on total chlorophyll contents of bean. Treatments are denoted by the key.
Bars = 1 x SD, n = 5 ............................................................................................................... 187
Figure 7.6 Effects o f oil contamination, water deficit and the combined oil and water
deficit on carotenoid content of bean. Treatments are denoted by the key. Bars = 1 x SD,
n ............................................................................................................................................188
xvi
Figure 7.7 Figure 6.5 Effects o f oil contamination, water deficit and the combined oil
and water deficit on leaf water content of bean over time. Treatments are denoted by the
key. Bars = 1 x SD, n = 5 .......................................................................................................... 189
Figure 7.8 Relationships between total chlorophyll content and photosynthetic activities
o f bean, n = 32 (mean values per treatment, per sampling occasion)................................ 190
Figure 7.9 Relationships between transpiration and leaf water content of bean,
n = 3 2 ......................................................................................................................................... 191
Figure 7.10 Relationships between stomatal conductance and leaf water content of bean,
n = 3 2 ............................................................................................................................................191
Figure 7.11 Mean reflectance spectra o f treated and control bean leaves 18 days after
treatment. Treatments are denoted by the key, n = 1 0 0 ..................................................... 193
Figure 7.12 Mean reflectance spectra of treated and control bean canopies 18 days after
treatment. Note: Oil stress spectral is hidden by the combination o f oil and water stress
spectral. Treatments are denoted by the key, n = 1 0 0 ........................................................ 193
Figure 7.13 Correlogram showing the variation with wavelength in the correlation
between the photosynthetic activity o f bean and spectral reflectance at the leaf scale,
n = 3 2 ............................................................................................................................................194
Figure 7.14 Correlogram showing the variation with wavelength in the correlation
between the transpiration rate of bean and spectral reflectance at the leaf scale,
n = 3 2 ........................................................................................................................................... 195
Figure 7.15 Correlogram showing the variation with wavelength in the correlation
between the stomatal conductance o f bean and spectral reflectance at the leaf scale,
n = 3 2 ......................................................................................................................................... 196
Figure 7.16 Correlogram showing the variation with wavelength in the correlation
between the leaf chlorophyll content of bean and spectral reflectance at the leaf scale,
n .......................................................................................................................................... ' l'7xvii
Figure 7.17 Correlogram showing the variation with wavelength in the correlation
between the leaf carotenoid content of bean and spectral reflectance at the leaf scale,
n = 32........................................................................................................................................... 197
Figure 7.18 Correlogram showing the variation with wavelength in the correlation
between the leaf water content o f bean and spectral reflectance at the leaf scale,
n = 32........................................................................................................................................... 198
Figure 7.19 Relationships between leaf chlorophyll index R8oo/R606 and total chlorophyll
content o f bean at leaf scale, n = 32........................................................................................ 200
Figure 7.20 Relationships between leaf carotenoids index R800/R520 and carotenoid
content of bean at leaf scale, n = 32 ........................................................................................201
Figure 7.21 Relationships between leaf water content index R865 and water content of
bean at leaf scale, n = 32 ...........................................................................................................201
Figure 7.22 Change in simple reflectance ratio R 800/R6O6 o f bean leaves. Treatments are
denoted by the key. Bars = 1 x SD, n = 100 ........................................................................ 203
Figure 7.23 Change in simple reflectance ratio Rsoo/R606 of bean canopy. Treatments are
denoted by the key. Bars = 1 x SD, n = 100 .......................................................................... 205
Figure 7.24 Change in simple ratio R800/R520 o f bean leaves. Treatments are denoted by
the key. Bars = 1 x SD, n = 100 ............................................................................................. 207
Figure 7.25 Change in simple reflectance ratio R 800/R520 o f bean canopies. Treatments
are denoted by the key. Bars = 1 x SD, n = 100 ................................................................... 207
Figure 7.26 Change in mean reflectance of individual narrow waveband Rs65 of bean
leaves. Treatments are denoted by the key. Bars = 1 x SD, n = 100 ............................... 209
Figure 7.27 Change in mean reflectance of individual narrow waveband R865 of bean
canopy. Treatments are denoted by the key. Bars = 1 x SD, n = 100 ............................. 209
xviii
Figure 7.28 Effects of oil contamination of soil, water deficit and the combined oil and
water deficit on the absolute temperature of bean leaves over time. Treatments are
denoted by the key. Bars = 1 x SE, n = 1 0 .............................................................................211
Figure 7.29 Effects o f oil contamination o f soil, water deficit and combination o f oil and
water deficit on the absolute temperature o f bean canopy over time. Treatments are
denoted by the key. Bars = 1 x SE, n = 1 0 .............................................................................211
Figure 7.30 Effects of oil contamination o f soil, water deficit and combination of oil and
water deficit on the thermal index (Iq) of bean leaves over time. Treatments are denoted
by the key. Bars = 1 x SE, n = 1 0 .......................................................................................... 212
Figure 7.31 Effects of oil contamination of soil, water deficit and combination of oil and
water deficit on the thermal index (Ig) of bean canopy over time. Treatments are denoted
by the key. Bars = 1 x SE, n = 1 0 .......................................................................................... 213
Figure 7.32 Relationships between the stomatal conductance and thermal index (Ig) at
the leaf scale, n = 3 2 ................................................................................................................ 213
Figure 8.0 Schematic overview o f hyperspectral and thermal remote sensing o f plant
stress responses to oil pollution, waterlogging and water defic it.................................... 230
Figure 8.1 Optimal approaches for the early detection of plant stress caused by
individual agents (oil pollution, waterlogging and water deficit) based on the most
rapidly responding spectral or thermal index sensitive to the s tress ................................. 232
Figure 8.2 Flowchart showing the approach for deploying remote sensing measures for
discriminating between plant stress caused by oil pollution and waterlogging in bean
canopies.......................................................................................................................................234
Figure 8.3 Flowchart showing the approach for deploying remote sensing measures for
discriminating between plant stress caused by oil pollution and water deficit in maize
leaves........................................................................................................................................... 234
xix

Figure 8.4 Flowchart showing the approach for deploying remote sensing measures for
discriminating between plant stress caused by oil pollution and waterlogging in bean
leav es ............................................................................................................................................ 235
xx
LIST OF TABLE PAGE
Table 2.0 List of natural and anthropogenic stresses acting on terrestrial vegetation ... 13
Table 2.1 Absorption features of plant spectra .....................................................................26
Table 2.2 Characteristics of multispectral remote sensing systems (adapted from NERC
Earth Observation data centre; Satellite Imaging Corp., and Natural Resources
Canada)........................................................................................................................................ 40
Table 2.3 Characteristics of selected hyperspectral imaging spectrometers.................... 45
Table 4.0 Visual stress symptoms of grass and forsythia contaminated with engine oil at
varied doses..................................................................................................................................72
Table 4.1 ANOVA showing significant difference in spectral reflectance changes of
grass and forsythia treated with diesel and engine oil at different treatment doses. In the
wavelength column, subscripts g and f refer to grass and forsythia respectively 74
Table 4.2 Individual narrow wavebands and spectra indices used for spectra
analysis........................................................ 79
Table 4.3 Statistics showing the significance of the differences in photosynthetic
activity between the different dose levels and controls.......................................................80
Table 4.4 Statistics showing significance of the differences in transpiration rates
between the different dose levels and controls....................................................................... 82
Table 4.5 Statistics showing significance o f the differences in stomatal conductance
between different dose levels and controls..............................................................................83
Table 4.6 Sensitivity analysis of selected individual narrow wavebands and spectral
indices across varied dose levels of oil pollution over time. ‘N o’ denotes no significant
difference, while ‘Yes’ denotes a significant difference. Unshaded areas depict either
inconsistency or consistent but not significant while shaded areas depict a significant
xxi
difference that occurs after treatment and remains consistent across at least two sample
days, until the end o f the experiment. *, **, ***Time when visual stress symptoms were
observed in low, medium and high dose levels, respectively............................................... 88
Table 4.7 Sensitivity analysis of the red-edge features across varied dose levels of oil
pollution over time. ‘N o’ denotes no significant difference, while ‘Yes’ denotes a
significant difference. Unshaded areas depict either inconsistency or consistency but not
significant while shaded areas depict a significant difference that occurs after treatment
and remains consistent across at least two sample days, until the end of the experiment.
*, **, ***Time when visual stress symptoms were observed in low, medium and high
dose levels, respectively.............................................................................................................92
Table 5.0 Sensitivity analysis of novel and existing spectral indices in control and
treated plants over time. Unshaded = no significant difference; Shaded = significant
difference. *Time when visible stress symptoms were observed in waterlogging
treatment alone, **time when visible stress symptoms were observed in oil and the
combined oil and waterlogging treatment............................................................................. 119
Table 5.1 Sensitivity analysis of the red-edge features o f control and treated plants over
time. Unshaded = no significant difference; Shaded = significant difference. *Time
when visible stress symptoms were observed in waterlogging treatment alone, **time
when visible stress symptoms were observed in oil and the combined oil and
waterlogging treatment............................................................................................................122
Table 5.2 Sensitivity analysis of the thermal properties of control and treated plants over
time. Unshaded = no significant difference; Shaded = significant difference. *Time
when visible stress symptoms were observed in waterlogging treatment alone, **time
when visible stress symptoms were observed in oil and the combined oil and
waterlogging treatment.............................................................................................................125
Table 6.0 Results o f ANOVA tests demonstrating when there were significant
differences in the physiological and biochemical properties between the treated and
control plants, over the course o f the experiment. Unshaded = no significant difference;
xxii
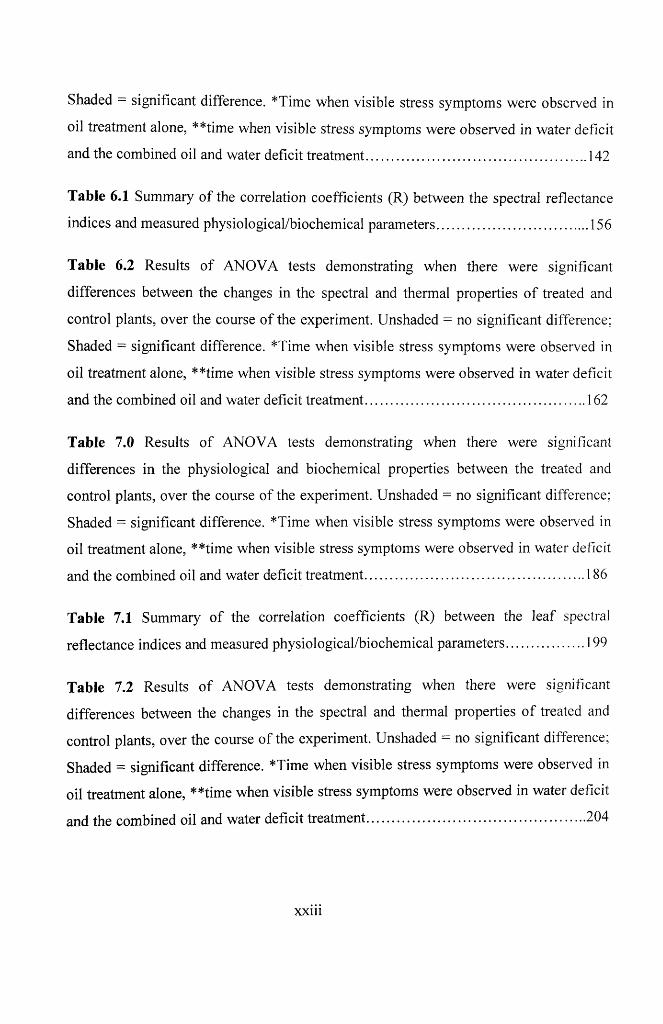
Shaded = significant difference. *Time when visible stress symptoms were observed in
oil treatment alone, **time when visible stress symptoms were observed in water deficit
and the combined oil and water deficit treatment................................................................ 142
Table 6.1 Summary of the correlation coefficients (R) between the spectral reflectance
indices and measured physiological/biochemical parameters............................................ 156
Table 6.2 Results of ANOVA tests demonstrating when there were significant
differences between the changes in the spectral and thermal properties o f treated and
control plants, over the course of the experiment. Unshaded = no significant difference;
Shaded = significant difference. *Time when visible stress symptoms were observed in
oil treatment alone, **time when visible stress symptoms were observed in water deficit
and the combined oil and water deficit treatment...............................................................162
Table 7.0 Results o f ANOVA tests demonstrating when there were significant
differences in the physiological and biochemical properties between the treated and
control plants, over the course of the experiment. Unshaded = no significant difference;
Shaded = significant difference. *Time when visible stress symptoms were observed in
oil treatment alone, **time when visible stress symptoms were observed in water deficit
and the combined oil and water deficit treatment................................................................186
Table 7.1 Summary of the correlation coefficients (R) between the leaf spectral
reflectance indices and measured physiological/biochemical parameters......................199
Table 7.2 Results of ANOVA tests demonstrating when there were significant
differences between the changes in the spectral and thermal properties o f treated and
control plants, over the course of the experiment. Unshaded = no significant difference;
Shaded = significant difference. *Time when visible stress symptoms were observed in
oil treatment alone, **time when visible stress symptoms were observed in water deficit
and the combined oil and water deficit treatment............................................................... 204
Chapter 1
INTRODUCTION
1.1 Background
Oil pollution is noted as one o f the major causes of environmental degradation
and can arise from spills o f crude and refined oil in aquatic and terrestrial environments
(Ogboghodo et al., 2004). Possible sources include accidental oil well blow out, loading
activities of oil tanks, tank washing activities o f ocean going vessels, port and harbour
run off from pipeline leaks and road tanker accidents. Equipment failure such as
malfunctioning, overloading, corrosion or abrasion of parts has also increased the
incidence o f oil spills (Nwankwo and Ifeadi, 1986). In recent years, wilful vandalism of
oil pipelines, particularly in some locales, has also contributed to the menace. For
example, vandalism is a leading cause of oil spills in Nigeria today (Yo-Essien, 2008).
The environmental, safety, economic and health implications of oil pollution cannot be
over emphasised. Some hundreds of thousands barrels of oil are lost to the environment
due to oil spill incidents (Aroh et al., 2010). Available statistics show that,
approximately three million, one hundred and twenty one thousand, nine hundred and
ten barrels of oil were lost between 1976 and 2005 as a result of oil spills. Many lives
have been claimed by oil spill disasters. For example, the Jesse (in Niger Delta) spill
incident o f 1998 resulted in a fire incident that claimed over a thousand lives and raved
the fragile ecosystem (Yo-Essien, 2008). People have contacted various illnesses and
diseases through drinking polluted water and eating contaminated food (Aroh et al.,
1
2010, Odu and Offodum, 1986). Furthermore, damage done to fishponds, nets and traps
was put at over 2 million naira (Odu and Offodum, 1986).
Contamination of soils with petroleum products is becoming an ever-increasing
problem, especially in the light of several breakdowns o f oil pipelines and wells reported
recently (Wyszkowski et al., 2004). For safety and security reasons, oil facilities such as
pipelines are kept constantly under surveillance. This is done in several ways such as
foot patrols by appointed officials and intermittent aerial surveillance particularly the
critical sections of the pipelines using manual observations from aircraft. The overall
aim is to guard the pipeline from damage and to look out for possible leaks. Despite the
security and safety measures in place, reports o f oil leaks and spills with disastrous
effects continue to rise rapidly, especially in some parts of the world. For example,
Nigeria which is the largest oil producer in Africa and the sixth largest in the world
recorded a total number of 4,835 oil spill incidents between 1976 and 1996 and 2,097
between 1997 and 2001 (Nwilo and Badejo, 2004). In addition, 253, 588, and 419 oil
spill incidents were reported in 2006, 2007, and first two quarters of 2008, respectively
(Edem, 2008).
The aerial surveillance of oil pipelines and facilities is costly, has flight risks
associated with low level aircraft and relies absolutely on the accuracy o f the pilot
(Smith et al., 2004). Foot patrol is tedious and time consuming and cannot cover a large
area. It is also logistically difficult in inaccessible areas and hostile environments. If not
detected and stopped early, oil leaks can develop into massive spills, leading to fire
outbreak which can be very disastrous. This has safety, health, economic and
environmental implications including soil contamination, destruction o f vegetative
2
ecosystems and arable crops/lands, contamination o f surface and underground water, air
pollution and extinction of endangered species. Thus, given the severe limitations and
demonstrable ineffectiveness of current surveillance approaches, it is imperative that a
technique is developed for frequent, accurate and spatially-comprehensive monitoring
and detection of oil pollution.
1.2 Effects of oil pollution on plants: threats and opportunities
Plants are extremely important in the lives of people throughout the world.
People depend upon plants to satisfy such basic human needs such as food, clothing,
shelter and health care. These needs are growing rapidly because of a growing world
population, increasing income and urbanisation. Unfortunately under field conditions,
plants are constantly vulnerable to a wide range of biotic, abiotic and anthropogenic
stress inducing factors within the growth environment, which consequently alter their
physiological and biochemical functioning. In regions of oil exploration and
exploitation, oil pollution regularly affects subsistence crops and natural vegetation
growing across a range of hydrological settings from wetlands through to arid
environments. Previous investigations have found that plants are influenced
considerably by hydrocarbon pollution. Thus, identification of the best approaches for
monitoring and detecting the menace of oil pollution in the environment remain a
subject o f growing concern.
Today, there is a growing interest in the study o f plant stress caused by various
agents through a multitude of different mechanisms, such as soil oxygen depletion,
increased carbon dioxide (CO2), reduced water uptake and toxic effects using remote
3
sensing techniques (e.g. Masoni et al., 1996; Penuelas et al., 1997; Riedell and
Blackmer, 1999; Else et al., 2001; Wyszkowski et al., 2004; Dobrowski et al., 2005;
Thomas, 2005; Yordanova et al., 2005; Ladjal et al., 2007; Graeff and Claupein, 2007).
The logic behind the approach is that unfavourable growing conditions result in
morphological, physiological and/or biochemical changes that impact on the manner
with which plants interact with light (Liew et al., 2008). For example, changes have
been observed in biochemistry and reflectance in vegetation growing near natural
hydrocarbon seeps (Lang et al., 1985, Bammel and Birnie, 1994, Yang et al., 1999) and
leaking gas pipelines (Pysek and Pysek, 1989, Smith et a l, 2000, Smith, 2002). Thus,
there may be some potential for bio-detection of oil pollution using hyperspectral remote
sensing to measure the changes in vegetation reflectance due to oil-induced stress.
Changes in the rate of transpiration by plants can also be exploited as an
indicator of developing stress (Liew et al. 2008), with thermal imaging providing
information on the effects of stress on stomatal related parameters (West et al. 2005). It
is known that oil contaminated soil can indirectly induce water stress in plants. Jong
(1980) observed that oil markedly decreased water uptake by wheat from contaminated
soil layers or from deeper water tables below. In studying the effects of soil
contamination with diesel oil on yellow lupine, Wyszkowski et al. (2004) found that as
oil penetrates soil it blocks air spaces and thereby decreases the fluxes o f air and water,
leading to a decrease in crop yield. This presumably is due to anoxia, decreased nutrient
and water uptake, or a combination of all three. Since oil contaminated soil can induce
water stress in plants, thermal remote sensing techniques are potentially o f value as an
indicator of oil-induced stress. In combination, several remotely-sensed spectral and
4
thermal parameters have been identified as viable indicators o f plant stress, but their
potential in the early detection of oil-induced stress is poorly understood.
In the real world, other natural stress occurring factors such as waterlogging and
water deficit affect plants and this can occur separately or concurrently with oil
pollution. Land degradation and serious environmental and poverty impacts have been
associated with waterlogging (World Bank, 1994). Waterlogging can cause stress in
plants by displacing the oxygen in soil by filling the soil spaces with water and thus
limiting oxygen supply to roots and preventing carbon dioxide from diffusing away
(Smith, 2004a). The principal causes of waterlogging are irrigation without drainage,
over-irrigation, low delivery efficiency o f the irrigation and malfunctioning of the
drainage system (Mirani and Memon, 2001). Waterlogging is a typical problem in many
river valleys and delta areas where farmlands are constantly affected. For example, in
many river valleys and deltas at the western foot o f the Andes along the coast of the
Pacific Ocean more than 30% of the agricultural land is affected by waterlogging due to
irrigation of the higher-lying lands (De la Torre, 1987). Oils are also found in delta
regions and thus, there is the possibility that oil pollution which can arise from
exploration and exploitation activities and waterlogging can affect plants in such regions
singly or collectively. Thus, there is the need to develop an approach that can be used in
discriminating between oil pollution and waterlogging. It has been found that
waterlogging can instigate malfunctioning of the root thus, it is expected that such
conditions could result in reflectance changes commonly related to plant stress, such as
increased reflectance in the chlorophyll and water absorption regions (Carter, 1993;
Lichtenhaler et a l, 1996). Indeed, some studies have shown that waterlogging can be
5
detected in plants using changes in reflectance spectra (Anderson and Perry, 1996;
Pickering and Malthus, 1998; Smith et al., 2004a). However, there is a poor
understanding of the capabilities of thermal remote sensing in this context.
It is generally known that water is a vital component for all forms of life but
unfortunately, water deficit is identified as one o f the major naturally occurring stress
factors. In plants, water plays a key role in photosynthesis and the movement of
nutrients; as water evaporates from the surface of leaves, it pulls water upwards from the
root system thus, transporting nutrients and other solutes to the above ground
components of the plant (Audesirk and Audesirk, 1999). When water is in short supply,
plants become stressed as the amount of water taken up by the roots is unable to keep up
with the rate of evaporation of water from the leaves. Thus, the leaves of the plant begin
to wilt as the amount o f water present within the leaf tissue decreases. Water stress is
typically well developed and negatively affecting the plant before it is detected visually,
as visual detection of water stress already indicates high levels of water stress (Griffeth
III, 2009). Therefore, there is the need for early detection of stress caused by water
deficit in order to facilitate timely delivery of remedial measures which can enhance
plant growth and productivity. Also, since water deficit is an important biotic stress
agent that can affect plants singly or concurrently with other stresses such as oil
pollution, therefore, there is the need to develop an approach that can be used in
discriminating between them.
Recent applications o f thermal imaging techniques have shown that water stress
can be detected through an increase in leaf temperature as a result o f stomatal closure in
response to soil drying during a water deficit (Jones, 1999; Grant et al., 2006). Using
6
such techniques, Olga et al., (2007) were able to distinguish between irrigated and non
irrigated grapevine canopies, and even between different deficit irrigation treatments.
When leaf or canopy photosynthesis is compromised due to stress, stomatal conductance
is expected to decrease because of a decrease in demand for atmospheric CO2 (Farquhar
and Sharkey, 1982). If transpiration is restricted due to stomatal closure, leaf
temperatures will increase (Nobel, 1991; Pezeshki and DeLaune, 1993) because o f less
cooling by transpired water as it evaporates from the leaf surfaces. Thus, changes in leaf
temperature may occur as a direct effect of soil water deficit or as an indirect
consequence o f a decrease in photosynthesis that may result from a range of different
types o f stress.
Hence, while spectral and thermal sensing individually have been shown to be
sensitive to different forms of plant stress, there is little evidence with respect to oil
pollution. Moreover, with these water-related stresses being commonplace, it is likely
that oil-induced stress will occur in combination with water-related stress. Yet, little
work has been done in the use o f remote sensing technology for detecting, quantifying
and discriminating between these stresses.
1.3 Research aims and objectives
Remote sensing technology has been identified as a useful tool for monitoring
vast areas of land surface and it is also viable in ecological studies such as in monitoring
plant health status. For early detection and accurate monitoring o f oil pollution, there is
the need to develop a system that is sensitive to physiological changes in plants prior to
visual stress observation. Thus, this study investigated the potential of hyperspectral
7
reflectance and thermal information for detecting and quantifying plant stress induced by
oil pollution. Furthermore, it examined the potential of these remote sensing techniques
for discriminating between oil-induced stress in plants and other stresses caused by
waterlogging and water deficit. In order to achieve this aim, the study was motivated by
the following four scientific questions:
■ What is the optimum remotely-sensed index for early detection of oil-induced
stress in plants at lethal and sub-lethal levels?
■ What is the optimum set of spectral and thermal responses that can be used for
early, non-destructive quantification and discrimination between oil pollution
and waterlogging stress in plants?
■ What is the optimum set o f spectral and thermal responses that can be used for
early, non-destructive quantification and discrimination between oil pollution
and water deficit stress in plants?
■ How consistent are the spectral and thermal responses of plants to oil and water
deficit stress between species and across leaf and canopy scales?
1.4 Research outline
The thesis commences with a literature review as presented in chapter 2. The
details about the effect o f oil on soils and plant are discussed. Specific reference is made
on the use o f remote sensing techniques for monitoring the effects o f a wide range of
stress factors that affect plant, and to provide the conceptual basis for developing
techniques for remote detection of oil-induced stress. Generally, the chapter aims to
understand the background theory and general discussion going on in this area of study
and to identify gaps that would ultimately be covered. Chapter 3 presents the general
methodology adopted in this study. Chapter 4 starts with a pilot study with the aim of
testing overall feasibility, logistics and some of the proposed experimental designs.
Primarily, the impacts o f oil pollution on the physiological, optical, and thermal
properties of maize (Zea mays L.) are investigated in this chapter. In chapter 5, the
spectral and thermal response of stress in bean (Phaseolus vulgaris ‘Tendergreen’)
canopies caused by oil pollution and waterlogging are explored with the aim of
identifying the optimum set of responses that could be used for early, non-destructive
quantification and discrimination between the two stresses. Chapter 6 exploits spectral
and thermal responses of maize leaves for early detection and discrimination of stress
caused by oil pollution and water deficit. In chapter 7, the spectral and thermal responses
of bean for early detection and discrimination of stress caused by oil pollution and water
deficit are explored with the aim of determining whether the responses translated from
leaf to canopy scale. Finally, chapter 8 summarises the main conclusions of this study
and presents a synthesis o f the whole thesis and suggestions for possible areas for further
investigations.
9
Chapter 2
LITERATURE REVIEW
2.1 Introduction
Recent studies have identified remote sensing as a valuable tool for detecting oil
spills in the environment. Remote sensing applications in spill detection have mostly
been in the marine environment using a variety o f sensors operating across the optical to
microwave domains. Consequently, there is a considerable body o f literature in this area.
However, spill monitoring and detection in the terrestrial environment has received
inadequate attention. However, to address some of the needs of agricultural, ecological
and environmental sectors, earlier and on-going studies have led to quantitative
estimation of the biochemical, biophysical, and physiological properties of plants using
various remote sensing techniques. Information about these properties is generally useful
in predicting the health status of vegetation. The emergence of hyperspectral remote
sensing technology has further promoted applications in this area. The high spectral
resolution data provided by hyperspectral remote sensing systems has created an
opportunity for remote sensing of vegetation stress caused by various environmental
factors in a way that was not possible using traditional broad band multispectral data.
Environmental stressors are diverse in nature and range from biotic to abiotic factors.
The focus of this review is on the use of remote sensing technologies for monitoring,
and discriminating the effects o f these factors on plant, and to provide the conceptual
basis for developing techniques for remote detection of oil-induced stress.
10
2.2 Plants
Plants growing in a particular place play an essential role to humans and their
environment. Plants are very crucial for a sustainable ecosystem, as they coexist and live
inter-dependably with humans and animals. They provide a necessary habitat for
wildlife populations and are the ultimate sources of metabolic energy for fauna. The
Iowa Department o f Transportation (2007) noted that 25 percent o f all prescriptions
written annually in the United States contain chemicals from plants and that many
important drugs are yet to be discovered. In addition, about 98 percent of plant species
are yet to be tested for their medical potential. Plants are good sources of some industrial
products, they aid in erosion control and enhance both air and water qualities. They
positively influence regional climate and plant communities form the basis for many
important recreational activities.
2.2.1 Plant stress
Plant stress describes any unfavourable condition and environmental constraints
that are faced by plants. Osmond et al. (1987) reasoned that plant stress has general
connotations rather than a precise definition. Thus, while attempting to make plant stress
a measurable and meaningful term, their study defined it as any factor that decreases
plant growth and reproduction below the genotype’s potential. Similarly, Jackson (1986)
defined plant stress as any disturbance that adversely influences vegetation growth.
Potentially, adverse environmental conditions affect plant growth and development and
11
trigger a wide range of responses, from altered gene expression and modifications in
cellular metabolism to changes in growth rate and crop yields (Kacperska, 2004).
Plant fitness depends on acquiring sufficient resources for growth and
reproduction. However, an optimal environment for plant growth varies with plant
species and growing stage (Hashimoto, 1989) and there is an understanding that
environmental stress may retard plant growth yet improve its quality. For example,
Lichtenthaler (1998) suggested that a mild stress may activate cell metabolism and
increase the physiological activity o f the plant, without causing any damaging effects
even at a long duration. On the other hand, high stress will cause damage to the plant
and induce early senescence and finally death if the stressor is not removed (Smith,
2002). An optimal environmental condition for plant growth is not defined because, as
environmental conditions vary, so the adaptability o f various plant species to change
varies.
Plants are constantly threatened by either nature or humans or both. Table 2.0
illustrates examples o f natural and anthropogenic stress factors. Crude petroleum,
petroleum by-products and heavy metals are the most prevalent industrial pollutants
(Rosso et al., 2005). Previous investigations have found that hydrocarbon influences the
soil and vegetation around hydrocarbon seepage (Noomen et al., 2003). Displacement of
soil oxygen by natural gas leaking from pipelines into the soil was the main damaging
effect on plant growth (Smith, 2002). Van Der Meijde et a l , (2004) found that fields
directly above the gas pipeline show significant increase in vegetation stress possibly
due to gas leaks. This is because one o f the major environmental problems related to
pipelines is the leakage of hydrocarbons into the environment.
12
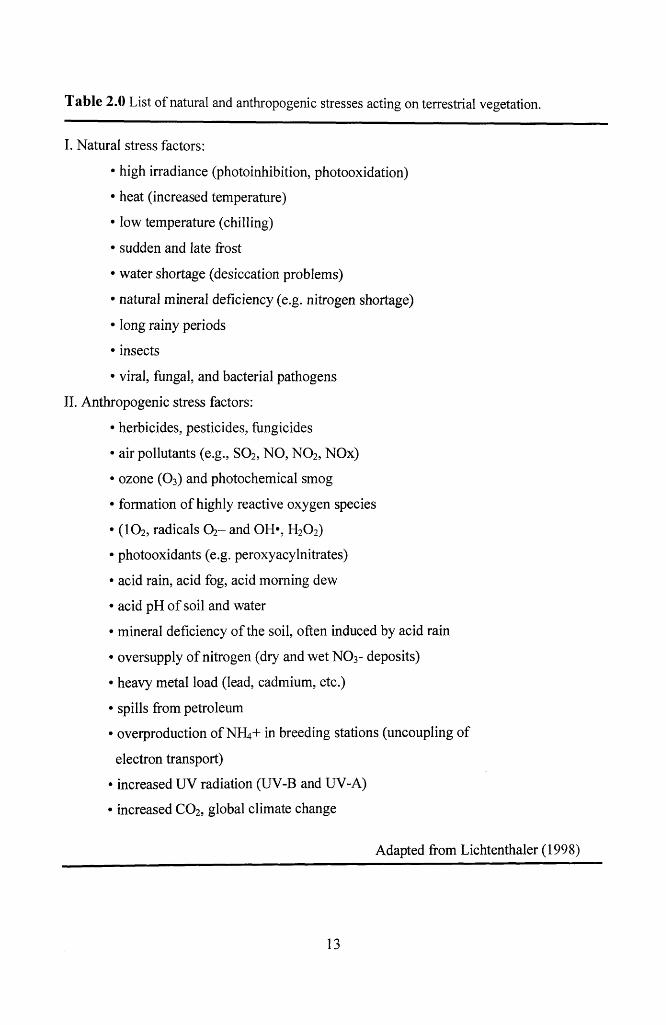
Table 2.0 List of natural and anthropogenic stresses acting on terrestrial vegetation.
I. Natural stress factors:
• high irradiance (photoinhibition, photooxidation)
• heat (increased temperature)
• low temperature (chilling)
• sudden and late frost
• water shortage (desiccation problems)
• natural mineral deficiency (e.g. nitrogen shortage)
• long rainy periods
• insects
• viral, fungal, and bacterial pathogens
II. Anthropogenic stress factors:
• herbicides, pesticides, fungicides
• air pollutants (e.g., S02, NO, N 02, NOx)
• ozone (0 3) and photochemical smog
• formation of highly reactive oxygen species
• (102, radicals O2- and OH*, H20 2)
• photooxidants (e.g. peroxyacylnitrates)
• acid rain, acid fog, acid morning dew
• acid pH of soil and water
• mineral deficiency of the soil, often induced by acid rain
• oversupply of nitrogen (dry and wet NO3- deposits)
• heavy metal load (lead, cadmium, etc.)
• spills from petroleum
• overproduction of NH4+ in breeding stations (uncoupling of
electron transport)
• increased UV radiation (UV-B and UV-A)
• increased C 02, global climate change
Adapted from Lichtenthaler (1998)
13
Hydrocarbons can establish locally anomalous zones that favour the development
o f a diverse array o f chemical and mineralogical changes (Van Der Meijde et al., 2004).
Thus, any vegetation present in these zones is likely to be influenced by the hostile and
polluted environment. Furthermore, Godwin et al., (1990) found restricted growth and
reproduction, and decreased number of individuals of plants subjected to natural gas
leakage into the surrounding soil. Plant stress creates all manner of visible and invisible
stress conditions such as etiolating, wilting, leaf colouring, stomatal closure, poor crop
yield, and early senescence. Smith et al. (2005) recorded visible evidence in vegetation
change around gas leaks. Unfortunately, stress conditions cannot be completely avoided
due to the nature o f their causative factors. However, they could ultimately be mitigated
if detected on time.
2.3 Impact of oil on soils and plants
Oil is known to exert adverse effects on soil properties and plant communities
(Osuji and Nwoye, 2007). Crude oil in soil makes the soil condition unsatisfactory for
plant growth (De Jong, 1980), due to the reduction in the level o f available plant
nutrients or a rise in toxic levels of certain elements such as iron and zinc (Udo and
Fayemi, 1995). Beyond 3% concentration, oil has been reported to be increasingly
deleterious to soil biota and crop growth (Baker, 1976; Amadi et al., 1993; Osuji et al.,
2005). Crude oil is composed of the following elements or compounds: Carbon - 84%,
hydrogen - 14%, sulphur - 1 to 3% (hydrogen sulfides, sulfides, disulfides, elemental
sulphur), nitrogen - less than 1% (basic compounds with amine groups), oxygen (0 2) -
less than 1% (found in organic compounds such as C 0 2, phenols, ketones, carboxylic
14
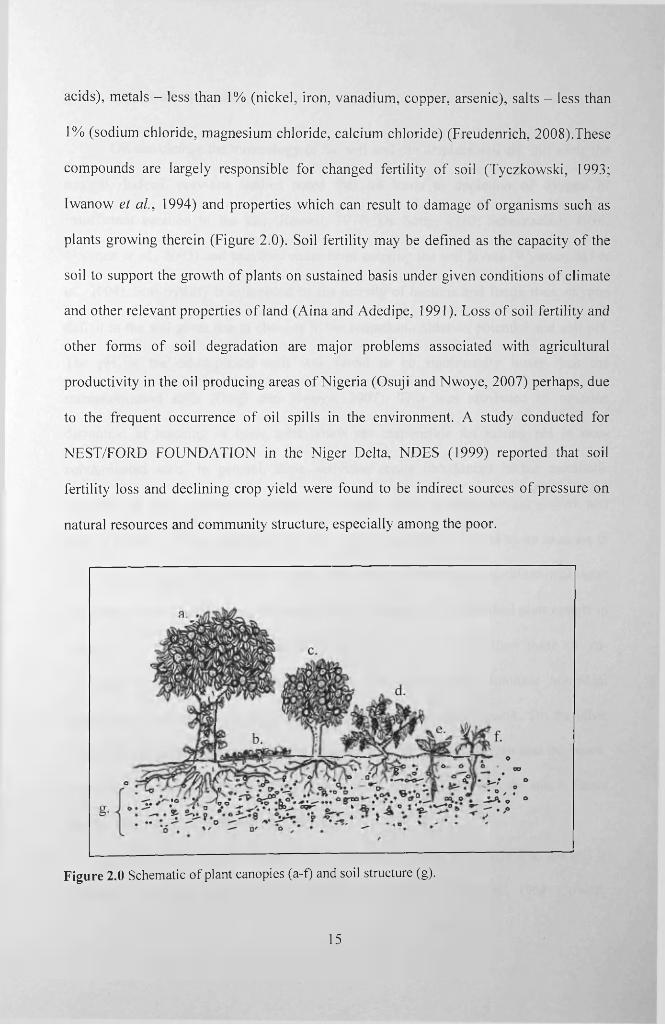
acids), metals - less than 1 % (nickel, iron, vanadium, copper, arsenic), salts - less than
1% (sodium chloride, magnesium chloride, calcium chloride) (Freudenrich, 2008).These
compounds are largely responsible for changed fertility of soil (Tyczkowski, 1993;
Iwanow et al., 1994) and properties which can result to damage of organisms such as
plants growing therein (Figure 2.0). Soil fertility may be defined as the capacity of the
soil to support the growth of plants on sustained basis under given conditions o f climate
and other relevant properties of land (Aina and Adedipe, 1991). Loss of soil fertility and
other forms of soil degradation are major problems associated with agricultural
productivity in the oil producing areas of Nigeria (Osuji and Nwoye, 2007) perhaps, due
to the frequent occurrence of oil spills in the environment. A study conducted for
NEST/FORD FOUNDATION in the Niger Delta, NDES (1999) reported that soil
fertility loss and declining crop yield were found to be indirect sources of pressure on
natural resources and community structure, especially among the poor.
Figure 2.0 Schematic of plant canopies (a-f) and soil structure (g).
15
2.3.1 Effects of oil on soil
Oil can change the mineralogy of the soil and can displace soil air, including the
oxygen. Indeed, previous studies noted that oil leads to depletion o f oxygen or
insufficient aeration in the soil (Rowell, 1977; De Song, 1980; Schumacher, 1996;
Noomen et al., 2003) and prevents water from entering the soil layers (Wyszkowski et
al., 2004). Soil fertility is influenced by the activity o f bacteria and fungi, thus, oxygen
deficit in the soil gives rise to changes in the reduction-oxidation potential and soil pH.
The pH o f the oil-impacted soils was found to be significantly lower than the
uncontaminated soils (Osuji and Nwoye, 2007). This was attributed to possible
disruption of leaching of basic salts which are responsible for raising pH in non
contaminated soils. In general, these activities create imbalances in the metabolic
functions of plant organisms, thereby introducing stress, as their normal growth and
general health condition are disrupted. Soil - oxygen is further reduced by an increase in
demand for oxygen brought about by the activities of oil-decomposing micro-organisms
(Gudin and Syratt, 1975). Lee and Banks (1993) found that the microbial plate counts in
petroleum contaminated vegetated soil were significantly higher than those of un
vegetated contaminated soil. This indicates that plant roots stimulate microbial
populations in polluted soils which promote degradation of contaminants. On the other
hand, as the microbial population in the soil increases demand for oxygen also increases.
Overall, soil aeration can be depleted if the rate at which oil gets into the soil is faster
than the rate the oil is degraded by microbes.
Furthermore, when oil covers the soil surface, oxygen movement into the soil is
restricted which can lead to more anaerobic soil conditions (Ranwell, 1968; Cowell.
16
1969). Apparently, C 0 2 increases with decrease in 0 2 thus, depletion of 0 2 in the soil as
a result of effects of hydrocarbon and activities of microbial will invariably lead to
increased concentration o f C 0 2 in the soil (Hillel, 1998). Accumulation o f C 0 2 in the
soil may affect the water permeability of roots more directly than 0 2 deficiency and a
buildup o f inhibitory concentrations of ethylene in anaerobic soils may affect plant
growth (de Wit, 1978; Trought and Drew, 1980a). Soil 0 2 depletion can disrupt root
metabolism which, in turn, can affect the hormone balance of the shoot (Trought and
Drew, 1980b). A number of factors such as soil type, soil organic matter, size fraction of
soil mineral matter (Figure 2.0) and soil texture play significant roles in the fate of
hydrocarbon in the soil and have extensively been reviewed elsewhere (Pezeshki et al.,
2000). Generally, oil has adversely affected soil drainage. Earlier studies found that oil
reduced water infiltration (Toogood, 1977; Everett, 1978) in mineral soils and this was
attributed to a decrease in soil permeability resulting from the formation of hydrophobic
films on soil particles. Similarly, Gill et al. (1992) reported that fresh crude oil showed a
coagulatory effect on the soil, binding the soil particles into a water impregnable soil
block which seriously impair water drainage and oxygen diffusion. Gassed soil
deteriorates soil drainage so that the soil constantly puddled (Schollenberger, 1930;
Hoeks, 1972). Godwin et al. (1990) also found that the soil drainage was decreased in
the vicinity of gas wells and that puddles formed at the surface.
Oil reduces the available nitrogen content of the soil (Sojka et al., 1975; Jong,
1980) which results from consumption o f all available nitrogen by bacteria and fungi
growing on a hydrocarbon medium in soil thus, restricting the uptake of these elements
by plants (Malachowska-Jutsz et al., 1997; Xu and Johnson, 1997). These activities are
17
caused by a depression in ammonification and nitrification processes triggered by
inhibition in conversion o f mineral and organic nitrogen compounds in soil by petroleum
derived compounds (Iwanow et al., 1994; Amadi et al., 1996). Oil degrading or
hydrocarbon-utilizing microbes such as Azobacter spp. have been reported to become
more abundant while nitrifying bacteria such as Nitrosomonas spp. become reduced in
number (Odu et al., 1985) in oil contaminated soil. Osuji and Nwoye (2007) suggest that
the process of nitrification might have reduced following the incidence of oil spillage
which has led to reduction in the concentration o f nitrate-nitrogen (NO3-N) in oil
contaminated sites.
The physical, chemical and geological characteristics of soil play significant
roles in the degree of its vulnerability to an oil spill (Gundlach and Hayes, 1978). In
some areas, oil may sink and/or be buried rapidly, making clean up difficult while in
some areas, most of the oil will not adhere to, nor penetrate into the compacted soil. For
example, among the shoreline type, salt marsh and mangrove forest are the most
vulnerable to oil spill while the exposed rocky headland is the least. Oil may persist for
years in salt marsh and mangrove forest areas making cleaning o f oil in these areas a
challenging task. On the contrary, the exposed rocky headland areas may require no
clean-up, as wave reflection keeps most of the oil offshore (Gundlach and Hayes, 1978).
Furthermore, contamination of soil with refinery products modifies the structure
(Figure 2.0) and appearance o f the soil and deteriorates its biochemical and
physicochemical properties (Tyczkowski, 1993; Kucharski and Wyszkowska, 2001;
Wyszkowska et al., 2002; Wyszkowski et al., 2004). Schollenberger (1930) and Hoeks
(1972) found that the gassed soil was darker than the ungassed soil, and the normal
18
structure of the soil was lost. Several studies have indicated that soil polluted by
petroleum-based products loses its biological activity and may not recover it over ten
years (Sparrow and Sparrow, 1988; Racine, 1993; Wyszkowska et a l, 2001). A recent
study noted that the greasy texture of hydrocarbons, in excessive amount in the soil, is
responsible for the prevailing amounts of organic carbon over those of nitrogen in soil
(Wyszkowski et a l, 2004). Partial coating o f soil surfaces by the hydrophobic
hydrocarbons might reduce the water holding capacity of the soil due to some significant
reduction in the binding property of clay (Osuji and Nwoye, 2007). Usually, such partial
coats lead to a breakdown of soil structure and the dispersion of soil particles, which
reduce percolation and retention of water. Osuji et al. (2006b) found that soils develop
severe and persistent water repellency following contamination with crude oil. The
coupling effects of this and exhaustion of oxygen in the soil can increase the microbial
activity and thus interfere with the plant-soil-water relationship (Esenowo et a l, 2006).
This can affect plants general growth and productivity.
2.3.2 Effects of oil on plants
Studies show that plants are important productive resources but very vulnerable
in the event o f an oil spill (West et al., 2005). They are highly susceptible to oil
exposure and this may kill them within a few weeks to several months (Omosun et al.,
2008). Thus, they are considered number one priority in oil spill response assignments.
It has been discovered that very often, it is difficult to get rid of the oil from the
environment once contaminated; hence lots of damage is done as oil persist therein for
many years (Gundlach & Hayes, 1978). Both heavy metals and petroleum oils are
19
known to cause stress in plants (Mendelssohn et al., 2001). The adverse effects of oil
pollution on economic plants have been reported (Odu, 1981; Isirimah et al., 1989;
Amadi et al., 1993; Anoliefo and Okoloko, 2000). At high concentrations of oil in soil,
most plants species suffered serious depression in growth (Udo and Fayami, 1975;
Amakiri and Onoteghara, 1984). This condition has been attributed to poor soil
conditions, dehydration and impaired nutrient uptake by the roots, created by the
presence of crude oil (Anoliefo et al., 2003).
Oil spills directly or indirectly contaminate plants in several ways. Oil can enter
the soil and create unfavourable conditions (explained in section 2.3.1) for plant growth
and survival (De Jong, 1980; Gunther et al., 1996). For example, Edema et al. (2009)
noted that crude oil reduced phosphate, sulphate and nitrate ionic concentrations in soils
and thus, oil spillage could make vital plant nutrients unavailable to plants (Odu, 1981;
Anoliefo et al., 2003). Also, it was found that oil markedly reduced water uptake by
wheat from contaminated layers or below such layers (Jong, 1980) and that water
absorption may be inhibited after long periods of anaerobis (Smith, 2002). On the other
hand, plants can be directly affected through physical contact with oil, for example,
through coating of plant foliage (Pezeshki et al., 2000), especially when plant canopies
grow over the land surface (as labeled b. and e. in Figure 2.0). Coating o f plant leaves by
oil causes stomatal closure and consequently, an increase in leaf temperature because of
blocked transpiration pathways (Pezeshki and DeLaune, 1993). However, it is not clear
whether similar thermal effects occur in plants that are indirectly exposed through oil
contamination o f soil.
20
Stomatal closure also reduces leaf photosynthesis because o f restricted entry of
CO2 through stomatal pores (Pezeshki and DeLaune, 1993; Webb, 1994; Pezeshki et al.,
1995). Other workers have mentioned the effects o f crude oil on the growth and
physiology of different plants (Cook and Westlake, 1974; Terge, 1984; Gill et al., 1992;
Pezeshki and DeLaune, 1993; Quinones-Aquilar et al., 2003). Previous studies have
mentioned that the crude oil penetrates the pore spaces of terrestrial vegetation (Bossert
and Bartha, 1984) and subsequently impedes photosynthesis and other physiological
processes of the plant (Odu, 1977, 1981). Through physical contact, refined and light oil
in particular, can penetrate into plants/leaf tissue and consequently, destroy cellular
integrity, and prevent leaf and shoot regeneration (Webb, 1994; Pezeshki et al., 1995;
Pezeshki et al., 2000). The adverse effects of petroleum and its compounds on plant
growth have earlier been reported by Gill et al. (1992). Also, the inhibition o f plant
growth by harmful metallic ions present in petroleum was reported by Winter et al.
(1976).
It has been found that oil penetrating and accumulating in plants can cause
damage to cell membranes and leakage o f cell content (Baker, 1970). Consequently, it
has been observed that oil affects germination, plant height, grain yield, and dry matter
content of crops especially when pollution is heavy (Ogboghodo et al., 2004). A recent
study noted that soils contaminated with crude oil contain polycyclic aromatic
hydrocarbons (PAH) and heavy metals that are toxic to plants (Edema et al., 2009).
Crude oil is phytotoxic because it creates unsatisfactory conditions for plant growth
ranging from heavy metal toxicity to inhibited aeration o f the soil. Edema et al. (2009)
also found that the nature of crude oil and its components was responsible for the low
21
number of plant families encountered in the field. Toxicity symptoms observed in plants
exposed to oil pollution include chlorosis, necrosis, stunted growth, suppression of
leaves, enormous reduction in biomass to stomatal abnormalities (Baker, 1970).
In some salt-tolerant plants, petroleum hydrocarbons may damage root
membranes, thereby adversely affecting the ionic balance of the plants and their ability
to tolerate salinity (Gilfillan et al., 1989). Further investigations have found that the
growth o f cereal in oil polluted soil was inhibited, with leaves undergoing chlorosis and
general plant dehydration (Udo and Fayemi, 1975). Oxygen is generally obtained from
the soil and is required for correct functioning of plant roots (Smith, 2002). It is
necessary for aerobic respiration and the supply of metabolic energy, which is used for
the production o f new root cells for growth and for the uptake o f nutrients from the soil
(de Wit, 1978). Drew and Sisworo (1979) found significant effects on the normal
functioning of waterlogged barley due to mild oxygen depletion from the soil. Therefore
absence or insufficient oxygen in soil caused by oil pollution can lead to plant death.
Spartina alterniflora is an important coastal salt-marsh species and is particularly
susceptible to coastal oil slicks thus; considerable attention has been drawn towards
investigating their response to oil pollution as illustrated in Pezeshki et al. (2000).
Several studies found that accumulation of high levels of crude oils in the soil resulted in
the death of Spartina alterniflora (Krebs and Tanner, 1981; Alexander and Webb, 1987).
A similar study using the same species found that leaves died after about 40 days of
contamination (Pezeshki et a l, 1995). Overall, oil pollution reduces plant transpiration
and carbon fixation and increases plant mortality (Baker, 1970; Pezeshki and Delaune,
1993). However, the extent o f damage highly depends on a number of factors for
22
example; season o f spill, soil type, oil type and these were extensively discussed in
Pezeshki et al. (2000). Overall, plant stress whether directly or indirectly induced by oil
pollution can cause harmful effects on vegetation leading to growth inhibition, early
senescence, chlorosis, dehydration, and death.
In order to minimise the impacts of oil pollution in the environment and to
ensure timely response, recovery and possible bioremediation measures; its early
detection through remotely-sensed response of vegetation becomes o f paramount
importance. Fortunately, stress condition in plants is visible in the spectra (Knipling,
1970; Noomen et al., 2003; Kempeneers et al., 2005) thus, making remote sensing a
valuable tool for early detection of plant stress (Rosso et al., 2005).
2.4 Remote sensing of plant stress
Remote sensing is broadly defined as the science of acquiring information about
an object with a device without being in physical contact with it. In general, the process
requires measuring the interactions between matter and electromagnetic radiation to
identify properties and processes of the object of interest. These interactions are
controlled by the physical, chemical and biological characteristics of the object (Liew et
al., 2008) which, in turn, control its remotely-sensed response. Incident radiation (I) on a
plant leaf is either reflected (R), absorbed (A), or transmitted (T), as illustrated in Figure
2.1, and their relative proportions vary with the wavelength of radiation. The absorbed
energy may be subsequently emitted by the object. Remote sensing systems record the
reflected and emitted energy which, when processed appropriately, can reveal
information about the object measured.
23
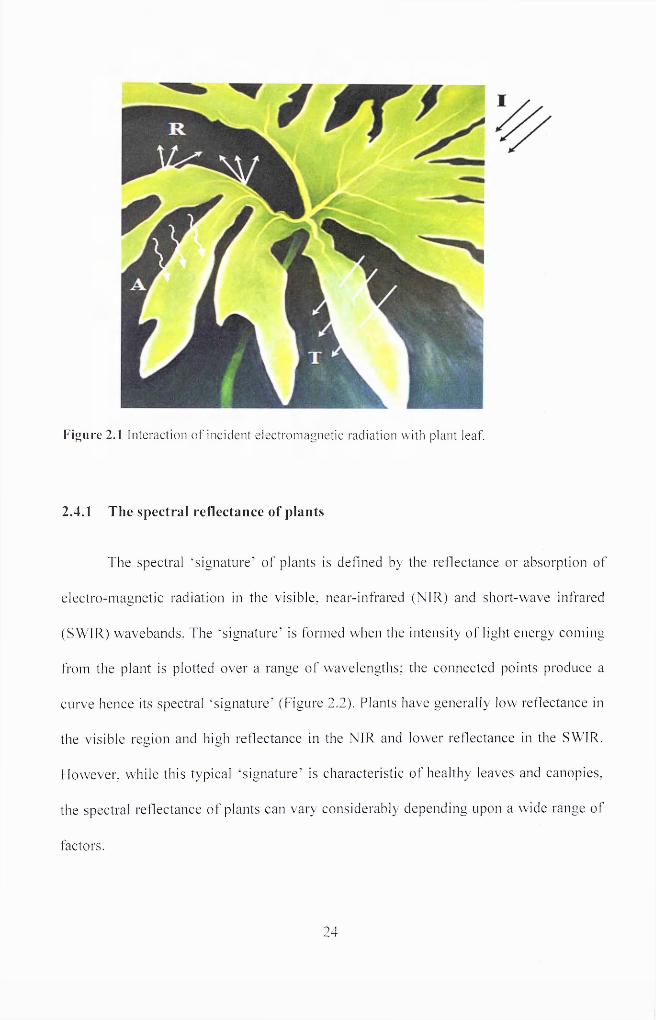
F ig u r e 2.1 In te rac t ion o f in c iden t e le c t ro m a g n e t ic rad ia t ion w ith p lan t leaf.
2.4.1 The spectral reflectance of plants
The spectral ‘signature' o f plants is defined by the reflectance or absorption o f
electro-magnetic radiation in the visible, near-infrared (NIR) and short-wave infrared
(SW1R) wavebands. The ‘signature' is formed when the intensity o f light energy coming
from the plant is plotted over a range o f wavelengths; the connected points produce a
curve hence its spectral ‘signature' (Figure 2.2). Plants have generally low reflectance in
the visible region and high reflectance in the NIR and lower reflectance in the SWIR.
However, while this typical ‘signature' is characteristic o f healthy leaves and canopies,
the spectral reflectance o f plants can vary considerably depending upon a wide range o f
factors.
24
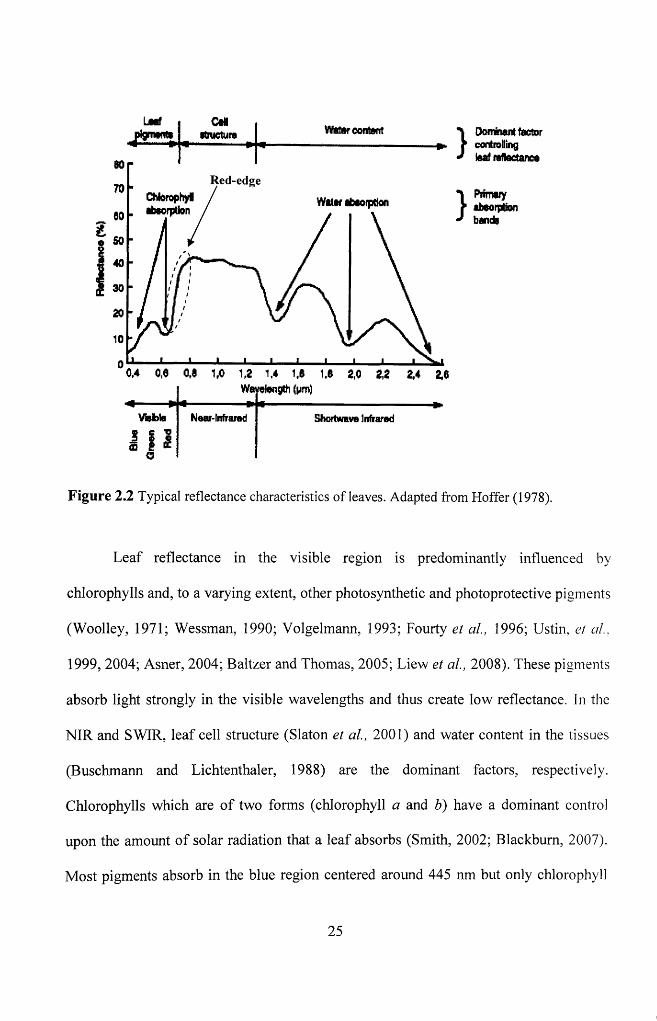
80Red-edge
70Wtt*f abtoiption
80
50
40
30
20
10
00,4 0,0 0,8 1,0 1,2 1,4 1,8 1,8 2,0 2,2 2.4 2,8
}}
Dofflfciai* factor controlling teaf rillectanee
Primaryabeorptlonbands
Wairelangtfi (vim)
VWbfa
1 i 1(J f X<3
Near-lnframd Shortwave Infrared
Figure 2.2 Typical reflectance characteristics of leaves. Adapted from Hoffer (1978).
Leaf reflectance in the visible region is predominantly influenced by
chlorophylls and, to a varying extent, other photo synthetic and photoprotective pigments
(Woolley, 1971; Wessman, 1990; Volgelmann, 1993; Fourty et a l, 1996; Ustin, et al.
1999, 2004; Asner, 2004; Baltzer and Thomas, 2005; Liew et a l, 2008). These pi gments
absorb light strongly in the visible wavelengths and thus create low reflectance. In the
NIR and SWIR, leaf cell structure (Slaton et a l, 2001) and water content in the tissues
(Buschmann and Lichtenthaler, 1988) are the dominant factors, respectively.
Chlorophylls which are o f two forms (chlorophyll a and b) have a dominant control
upon the amount o f solar radiation that a leaf absorbs (Smith, 2002; Blackburn, 2007).
Most pigments absorb in the blue region centered around 445 nm but only chlorophyll
25
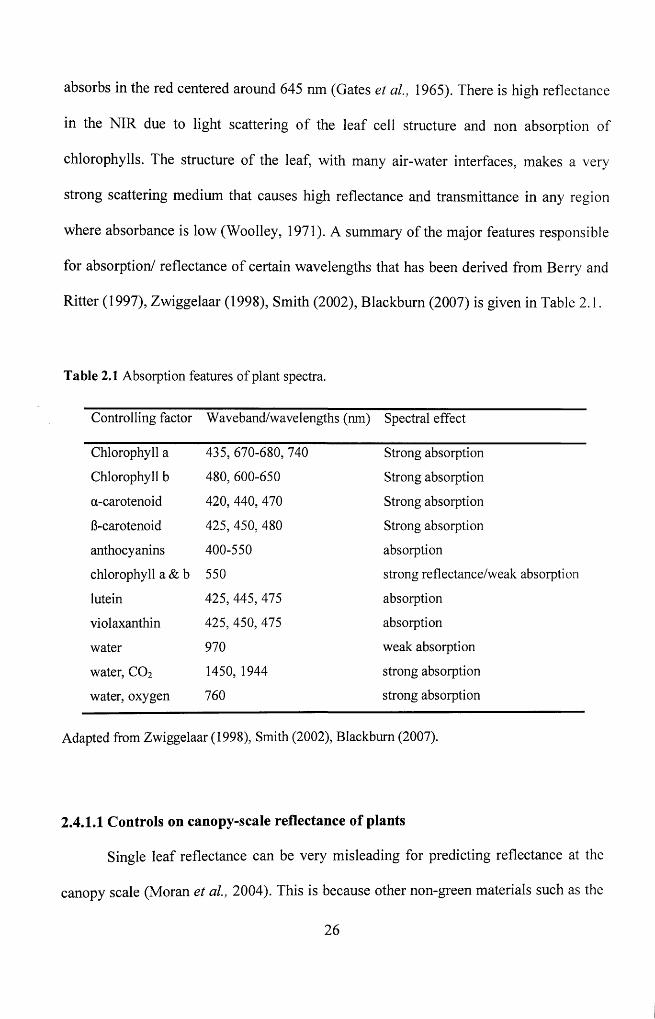
absorbs in the red centered around 645 nm (Gates et al., 1965). There is high reflectance
in the NIR due to light scattering o f the leaf cell structure and non absorption of
chlorophylls. The structure of the leaf, with many air-water interfaces, makes a very
strong scattering medium that causes high reflectance and transmittance in any region
where absorbance is low (Woolley, 1971). A summary of the major features responsible
for absorption/ reflectance of certain wavelengths that has been derived from Berry and
Ritter (1997), Zwiggelaar (1998), Smith (2002), Blackburn (2007) is given in Table 2.1.
Table 2.1 Absorption features of plant spectra.
Controlling factor Waveband/wavelengths (nm) Spectral effect
Chlorophyll a 435, 670-680, 740 Strong absorption
Chlorophyll b 480, 600-650 Strong absorption
a-carotenoid 420, 440, 470 Strong absorption
B-carotenoid 425, 450, 480 Strong absorption
anthocyanins 400-550 absorption
chlorophyll a & b 550 strong reflectance/weak absorption
lutein 425, 445, 475 absorption
violaxanthin 425, 450, 475 absorption
water 970 weak absorption
water, C02 1450, 1944 strong absorption
water, oxygen 760 strong absorption
Adapted from Zwiggelaar (1998), Smith (2002), Blackburn (2007).
2.4.1.1 Controls on canopy-scale reflectance of plants
Single leaf reflectance can be very misleading for predicting reflectance at the
canopy scale (Moran et al., 2004). This is because other non-green materials such as the
26
senescent leaves and litter, bark, wood, and dry reproductive structures do occur in the
majority o f plant canopies, and can contribute significantly to canopy reflectance
(Blackburn, 1993). Other controlling factors are canopy specific such as senescent
vegetation; phenology, soil background, and canopy geometry (plant architecture, Leaf-
Area-Index (LAI), Leaf Angle Distribution (LAD) and viewing geometry specific such
as solar zenith-, sensor look-, and relative solar azimuth angles (Milton and Wardley,
1987; Kasischke et a l, 2004; Moran et al., 2004; Blackburn, 2007). Although stress
senescent detection is closely related to chlorophyll degradation (Goetz et a l, 1983;
Horler et al., 1983), live and dry vegetation amounts within two canopies of the same
total biomass amount may vary, thus can create change in canopy reflectance
(Blackburn, 1993). Indeed, studies have shown that plants at different developmental
stages alter the type of canopy element presented to the sensor (Peterson, 1992; Peterson
andNilson, 1993).
Apart from the effects o f soil and litter background, physiological stress can
cause wilting o f canopy elements which can change reflectance of the canopy as more
soil and less vegetation is seen by the sensor (Collins, 1978). Recent studies have given
evidence about the biophysical sources of variability in canopy reflectance and
bidirectional reflectance function (BRF) variations due to observing geometry
(Jacquemoud, 1993; Asner, 1998; Gastellu-Etchegoriy et a l, 1999). The majority of
these factors influence measurements mostly in field conditions particularly from space-
borne sensors. However, this study investigates the reflectance of stressed vegetation at
the plant scale within a controlled environment and thus, not all the factors may affect
canopy scale reflectance measurements.
27
2.4.2 Diagnostic indicators of plant stress
2.4.2.1 Visible reflectance
The visible region ranges from 0.4-0.7pm (400-700nm), which is an extremely
small portion of the electromagnetic spectrum but this corresponds to the spectral
sensitivity o f the human eye. The blue, green and red colours are ascribed to the
approximate ranges of 0.4-0.5pm (400-500nm), 0.5-0.6pm (500-600nm) and 0.6-0.7pm
(600-700nm) respectively. Several studies have recorded that visible reflectance
increases consistently in various plant species in response to stress induced by a range of
different stressors (Carter and Miller, 1994; Carter et al., 1996).
Spectral measurements by Smith et al. (2004) showed that vegetation exposed to
high concentrations of natural gas in the soil had significantly increased reflectance in
the visible and decreased reflectance in the infrared. Several researchers identified
similar responses to a wide range of plant stresses such as waterlogging, nutrient stress,
heavy metal toxicity and soil oxygen deficiency (Woolley, 1971; Horler et al., 1983;
Milton et al., 1989; Carter, 1993; Carter and Miller, 1994; Anderson and Perry, 1996;
Noomen et al., 2003). In response to a number of different stressors, plants exhibit a
decrease in the production of chlorophyll and other biochemical constituents, which
leads to a decrease in their absorption capacity and therefore an increase in reflectance in
the visible region. Sensitivity analysis of leaf spectral reflectance to leaf characteristics
performed by Ceccato et al. (2002) using the new version o f the PROSPECT model
(Jacquemoud, et al., 2000) shows that chlorophyll content had a major influence
(followed by leaf internal structure) over reflectance values between 400 and 71 Onm
compared to other pigments.
28
As the visible region is characterized by high absorption coefficients for
pigments, reflectance in this region is more sensitive to lower pigment concentrations.
For example, Blackburn (1998a, 1998b) and Sari et al. (2005) noted that reflectance at
wavelengths corresponding to the centre of the major absorption features are most
sensitive to low pigment concentrations as found in early immature and later senescent
leaves and canopies with low leaf area and canopy cover. An empirical study by Rosso
et al. (2005) showed that highly contaminated plants reflected incident radiation in the
deep absorption features of the visible spectrum such as 670nm.
2.4.2.2 Red-edge region
The region of the reflectance red-edge has been used as a means of identifying
stress in plants. The red-edge adjoins the red end o f the visible portion o f the spectrum.
It is an area where there is change in reflectance between wavelengths 690 and 750nm
which characterises the boundary between dominance by the strong absorption of red
light by chlorophyll and the high scattering of radiation in the leaf mesophyll (Smith el
al., 2004). At this region, reflectance rises rapidly leading to a plateau of high
reflectance in the near-infrared, where pigments no longer absorb radiation (Blackburn,
2007). Horler et al. (1983) also stated that the red-edge is the sharp rise in reflectance of
green vegetation between 670 and 780nm.
There is further suggestion that the red-edge region o f the spectrum is considered
a unique parameter for detecting stress in plant. The reflectance of stressed plants often
shows a shift o f the ‘red edge’ position towards shorter wavelengths (Noomen et al.,
2003). Red-edge shifts measured in airborne imaging spectrometer data have been
29
proposed useful to provide an early indicator of vegetation stress. Evidence is given in
Rock et al. (1988) where a shift in red-edge towards the blue, of approximately 5nm was
detected when measuring severe foliage stress on spruce trees due to air pollution. The
shift which was attributed to decline in chlorophyll in the pine needles was detected
before visual symptoms became apparent.
A small number of investigations have looked specifically at the effects of
hydrocarbon pollution on the reflectance red-edge of vegetation. Investigations by
Bammel and Bimie (1994) discovered a consistent and significant blue shift of the green
peak and red trough positions of sagebrush spectra and concluded that the red-edge is
the most reliable indicator of hydrocarbon-induced vegetation stress. A large body of
literature exists that generally shows a decrease in chlorophyll in natural vegetation due
to stress, resulting in a shift to shorter wavelength of the red-edge. However,
spectroscopic analysis by Yang et al. (1999) showed that the red-edge position of wheat
spectra taken from areas of well known hydrocarbon microseepage has shifted 7nm to
longer wavelengths.
To explain the situation, it is important to note that it is generally accepted that
the position and shift o f the red-edge is related to leaf and canopy chlorophyll
concentration. Hence, a decrease or increase in chlorophyll results in red-edge shift
towards either the shorter or longer wavelengths, respectively. In the case of Yang et al.
(1999), it was suspected that hydrocarbons might have served as nutrients during the
short growing season of wheat, which however needs further investigation. Evidence
from previous studies shows that red-edge inflection point (A,p) (the peak in the first
derivative of reflectance that can be used to describe changes due to stress) ranges
30
between 700 and 745nm. Jago and Curran (1996) found two first derivative maxima
within the red-edge with peaks at approximately 693 and 709nm, while studying
grassland canopies at a site contaminated with oil. However, the potential for exploiting
the position o f these peaks and other red edge features such as the distance between the
peaks, and the magnitude or area o f the red edge for plant stress detection have not been
explored.
2.4.2.3 Near infrared (NIR) region
The NIR waveband ranges between 700 and about lOOOnm. The region is
characterised by high reflectance primarily due to light scattering by leaf tissue or
cellular structure (Gausman et al., 1970). Ceccato et al. (2002) found that the leaf
internal structure accounts for 70-80% of reflectance variations in the NIR whereas the
leaf dry matter accounts for the remaining variations (30-20%). Leaf reflectance is very
high in the NIR at ~800nm (Lenk et al., 2007) and a decrease of the reflectance at
800nm may be taken as an indicator of reduced aerial interspaces in the mesophyll of
leaves under stress conditions (Gausman and Quisenberry, 1990; Buschmann et al..
1991). A body o f literature has recently been developed through experimental studies,
which show substantial evidence of high and low reflectance in non-stressed and
stressed plants respectively within this region (Noomen et al., 2003; Smith et al., 2004;
Kempeneers et al., 2005; Rosso et al., 2005; Smith et a l, 2005;). Within these empirical
studies, different problems were simulated given different scenarios. These include
utilisation of different types of plant species, which were subjected to a range of
stressors including water and nitrogen stress, water logging, shading, gas and heavy
31
metal at varying levels o f contamination. A similarity within this range o f studies lies in
the use of a ground based sensor - the spectroradiometer to measure the spectral
reflectance characteristics of the experimental plants.
Treating plants of Salicornia virginicia with two metals - cadmium and
vanadium, at different levels of contamination, Rosso et al. (2005) found that reflectance
differences in the near infrared (NIR) portion followed a similar progression as the
symptom expression; in contrast to visible wavelengths, towards a reduction in
reflectance with stress. A reduction in intercellular spaces produces less light scattering
and less reflectance (Rosso et al., 2005). Water stress influences reflectance in the NIR
region because of changes in mesophyll structure (Bowman, 1989). However, leaf
structural characteristics have more influence in NIR reflectance than at short wave
infrared, whereas water content has a strong control on reflectance at short wave infrared
(SWIR) (Woolley, 1971; Ceccato et al., 2001). It is worth noting that absorption of
radiation by water does not have a large direct influence on reflectance in the NIR but it
does have an important indirect effect due to its influence on leaf cellular structure
which varies considerably as water content varies. Further evidence had been given in
Ustin et al. (1999) and Jacquemoud et al. (1996); that NIR reflectance is strongly
determined by the structural characteristics of leaf parenchyma, fractions of air spaces
and air-water interfaces.
2.4.2.4 Shortwave infrared (SWIR) region
The SWIR ranges between 1300 and 2500 nm and is characterised by light
absorption by the leaf water. Tucker, (1980) and Gausman, (1985) show that SWIR is
32
heavily influenced by water in plant tissue. Bowman (1989) indicated that water stress
influences reflectance at the SWIR region because of a reduction o f water content. A
study by Fourty and Baret (1997) showed that the wavelengths at 1530 and 1720nm
seem to be most appropriate for assessing vegetation water. Also, the radiative transfer
model PROSPECT (Jacquemoud et al., 2000) as a function of chlorophyll a & b
concentration, Cw, Cm, and N was very efficient for estimation of vegetation water
content at leaf level. In an attempt to detect vegetation leaf water content using
reflectance in the optical domain, Ceccato et al. (2001) found that parameters such as the
Equivalent water thickness (Cw) are not the only parameters responsible for significant
reflectance variations within the SWIR range. Other controlling factors include the
internal structure (N) and the dry matter content (Cm). The N and Cm affect reflectance at
wavelength range from 700 to 2500 nm, while Cw affects the wavelength range from 900
to 2500 nm. While Cw accounts for 86.7% of the reflectance variation in the SWIR, N
and Cm account for only 5.8% and 7.5% respectively. Thus, the SWIR reflectance value
alone is not suitable for retrieving vegetation water content at leaf scale. Although Cw is
the dominant factor, the study suggests that combination o f information from both NIR
(820nm) and SWIR (1600nm) is necessary for accurate estimation of vegetation water
content at leaf scale from optical observations.
Ceccato et al. (2001) explained several indices proposed to measure vegetation
stress due to water stress such as Crop Water Stress Index (CWSI), the Stress Index (SI),
and the Water Deficit Index (WDI). These indices assumed that differences between the
air and surface temperatures were related to plant water content and to water stress.
Other indices, such as the moisture stress indices that combine satellite-based
33
information on the relationship between Normalised Difference Vegetation Index
(NDVI), surface temperature, and air temperature, in association with production
efficiency models, have been developed (Goetz et a l, 1999). These indices do not
provide a very accurate way for estimation o f water stress because vegetation status is
not a direct measurement of water content and many species may show signs of reduced
evapotranspiration without experiencing a reduction in water content (Ceccato et a l,
2001).
2.4.2.5 Spectral and derivative indices
Several researchers have developed a wide range o f spectral indices and
wavelength regions that are feasible in detecting stress in a wide range of plant species
(Carter, 1994a; Tarpley et a l, 2000; Read et a l, 2002; Sims and Gamon, 2002; Smith et
a l, 2005; Campell et a l, 2007). Spectral indices based on reflectance spectroscopy offer
the possibility for estimation o f leaf pigment content. The indices commonly use
reflectance ratios derived from dividing leaf reflectance at stress-sensitive wavelengths
by that at stress insensitive wavelengths (Liew et a l, 2008). The idea for using this
approach is to eliminate the effects of leaf internal reflections and thus, provide stronger
quantitative relationships with chlorophyll content (Carter and Miller, 1994). A diverse
range o f spectral indices that combine reflectance in wavebands of different spectral
regions have been employed for plant stress detection and includes simple ratios of
reflectance and normalised difference ratios.
For example, in studying plant spectral responses to gas leaks and other stresses,
Smith et a l (2005) calculated a reflectance ratio by combining wavebands in the visible
34
region near 560nm and 670nm. The study found that in contrast to the control or the
shade-stressed plants, the ratio increased in gas- and herbicide-stressed plants. They
suggested that an increase in the ratio R670-680/R555-565 could be used to detect plant stress
caused by elevated natural gas in soils due to leaks. Tarpley et al. (2000) suggested that
simple reflectance ratios that combine leaf reflectance values at 700nm or 716mn and
755-920nm could improve precision and accuracy in predicting cotton leaf nitrogen
concentration. Read et al. (2002) found strong associations between leaf constituents
such as chlorophyll, carotenoids and nitrogen and simple ratios of reflectance at the
wavelengths 415/695nm, 415/685nm, and 415/710nm, respectively. They found that
reflectance at waveband 415nm appeared to be a more stable spectral feature under
nitrogen stress, as compared with more pronounced changes along the reflectance red
edge at 630nm - 690nm.
Zhao et al. (2005) found high correlation between the reflectance ratios of
R551/R915 and R708/R915 and chlorophyll concentrations in field-grown cotton. They also
found the same relationship at a single wavelength of 551nm or 707nm and high linear
correlation between nitrogen concentrations and a spectral reflectance ratio of R517/R4 13 •
Sims and Gamon (2002) and le Maire et al. (2004) enhanced spectral indices by
incorporating waveband in the blue region to correct for specular reflectance. This
resulted to more accurate estimation of leaf chlorophyll concentrations. Many other
spectral indices derived not only from spectral reflectance but also from derivative
spectroscopy have been found useful for studying plant damage. For example,
derivatives ratios such as D715/D705, D rep /D 7145 D744, D705, or D745 (where D represents
the amplitude o f the first derivative at specific wavelength and D rep is the amplitude of
35
the first derivative at the wavelength of the maximum amplitude in the red edge region)
were sensitive to stress and reflect the differences in the shape of the first derivative
curve among damage levels (Entcheva, 2000). In their experimental study, Campell et
al. (2007) found that D715/D705 consistently performed well as they exhibited high values
for the unstressed condition and significantly lower values as vegetation stress increased.
From the foregoing discussion, it is clear that change in plant reflectance spectra
at specific regions, red-edge features, ratios of narrowband reflectance and derivatives
are valuable indicators o f stress. However, the optimal index to monitor plant stress
response to oil pollution is not known. Besides, the potentials o f other red-edge features
such as the position o f the double features, the distance between them and the magnitude
or area o f the red-edge for plant stress detection have not fully been explored.
2.4.3 Optical remote sensing techniques
Optical remote sensing techniques use data from sensors that collect radiation in
the reflected solar spectrum (about 350 to 2500nm). Optical remote sensing instruments
can be operated from different platforms such as ground-based, air-borne or space-
borne, each with various strengths and weaknesses. Basically, at field and laboratory
scales, the methodology or approach that could be applied at a larger scale for various
plant stress monitoring applications could be developed. For example, a variety of
narrow band spectral reflectance features have been shown to be related to changes in
vegetation condition and amount through laboratory and field studies (Treitz and
Howarth, 1999). In addition, results from laboratory scale studies can provide the basis
for operational applications of vegetation stress monitoring. However, aside from scale
36
or platform definitions, optical remote sensing for vegetation stress monitoring has been
more commonly categorized according to spectral resolution.
2.4.3.1 Multispectral and hyperspectral remote sensing
Multispectral sensors collect data in a few broad spectral bands that cover
important regions of the reflected solar spectrum and have been applied for a wide
variety of environmental applications (Okin and Roberts, 2004). Van Der Meer et al.
(2002) noted that the laboratory and field scale spectra o f vegetation stress have been
studied in detail, but the resolution of broad-band instruments such as the Landsat
Thematic Mapper (TM) or Multispectral Scanner (MSS) is not sufficiently high for
comparison with laboratory or field spectra. This means that the broad bandwidth cannot
characterize all the absorption features that respond to vegetation stress, regardless of the
type o f enhancements employed or the type of information extraction method applied
(Van Der Meer et a l, 2002). For this reason, a frequent use of multispectral remote
sensing systems is with vegetation indices.
Van Der Meer et al. (2002) note that vegetation indices are quantitative
measurements, based on digital values, which attempt to measure biomass or vegetative
vigour and the most popular and widely used is NDVI. The index combines two
channels in a ratio or difference i.e. (NIR-RED)/(NIR+RED) which allows response to
vegetation growth to be distinguished from the background signals. Some of the inherent
limitations associated with NDVI are adequately provided in Okin and Roberts (2004)
and Van Der Meer et al. (2002). For vegetated landscapes, attention has been directed
towards increased spectral sampling because o f great spectral variability, in the 0.7pm to
37
2.5pm range (Curran, 2001). A detailed description o f the band-ratio strategy is given in
Van Der Meer et al. (2002).
Multispectral sensors feature a combination o f limited number o f spectral bands
with planes, helicopters or satellites as their platforms. With satellites, it is possible to
acquire high spatial resolution images at a very wide coverage and on regular basis
which makes it cost effective. However, satellite data are known to be adversely affected
by cloud cover, atmospheric attenuation and scattering which necessitate some
corrections. In addition, fixed satellite orbits impose some limitations as they create
inflexibility in timing of data acquisition. For example, when high cloud cover for a
given region coincides with time the satellite orbits that region, it will be impossible to
acquire clear images for that region. The visible and infrared regions are affected in
particular and are very critical for vegetation monitoring. Hence, satellite-based
multispectral systems have been proved very useful in regions where there are relatively
clear skies, but can be very limited in regions with frequent cloud cover. Using data
from a feasibility study from 1990, Steven et al. (1997) found that in UK, the number of
days with less than 2 oktas cloud cover between June and September sampled by the
SPOT (orbiting 11 times every 26 days) and Landsat (orbiting once every 16 days),
systems were between 2 and 9 days.
Multispectral remote sensing technologies have well-known applications in
vegetation studies, for example in the mapping of physical and structural features of
vegetative ecosystems and in forest surveys (Treitz and Howarth, 1999). In addition, it
has offered opportunity for successful monitoring o f deforestation and desertification
through quantification and estimation of vegetative ecosystems. With multispectral
38
remote sensing such as the Landsat Thematic Mapper, it is possible to quantify
vegetation biophysical properties such as Leaf Area Index (LAI) using spectral indices
derived from their broad wavebands (Asner, 1998; Treitz and Howarth, 1999;
Blackburn, 2007). Table 2.2 illustrates some characteristics o f airborne and spacebome
multispectral systems.
39
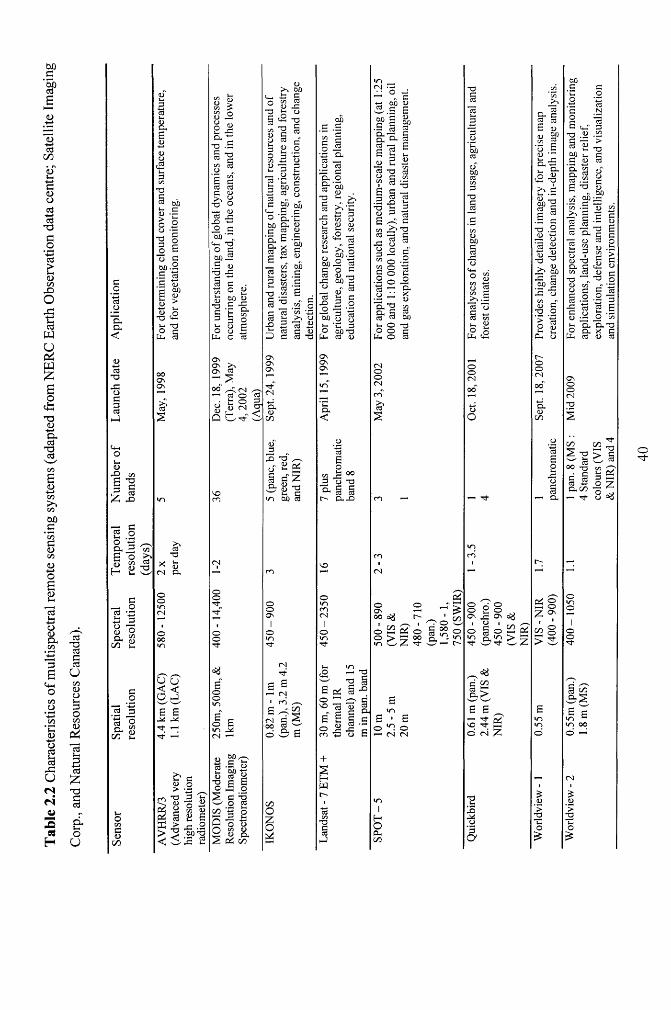
Tab
le
2.2
Char
acte
ristic
s of
mul
tispe
ctra
l re
mot
e se
nsin
g sy
stem
s (a
dapt
ed
from
NER
C Ea
rth
Obs
erva
tion
data
cent
re;
Satel
lite
Imag
ing
Corp
., and
N
atur
al R
esou
rces
Can
ada)
.
Q-SX<
333i-l
<+-cO
Xa3£
•3 c 2 .2 O t d exE o >>CDE'
en 3 CD T 3
3 — O 3 ■ i s 3
o. sC/J
3O
*2 ^’ «> 1 o- ft
oC/3c0)
C/D
<D<L> o -o P-£ §
£ s> V-»*• <Dcn cx
< < O JE E
X X
Tt —H
C/2 CD
X I X M 3 3 —
H — <do
*-c d 3 D . —
T3 -S
§ a
3CD
X2 ■£.2 cw»'~t*—I T3° sb o X.E <d ■3 -S
oo <dc -E•3 Oh3 55 3 2
O' ^Os02 3
>—1 3 o o • H O 3 .
CD r ~q b
o E <r> X
B s)/-' -rft B S b 2 ■o £ E
-3 .§ o o « m <d O . Pi on
3 o 2 o p on -P
oo cx C cd■a e
2 aX J c/i
i ^§ 1 ■*=> 3X 3
- 3 22 o
J33 "o' ^o§ c 7
v£> w "O</-> o o 3
cn
bOBgC/1 *2C ao•p cxC3u cdIX CCU.2cxC3 ‘5b0)73 UnP >>
X Ol Doo CD a>c3 u.o(UC/1 tS 13<U c
.2<u O 3c o cX <DbO73o §ocd Ul GX 3 Oobo 3o 3uGo 00 73£u cd <U
ONONON
*ni—<
cx<
o'5cd2oCOM 003 O 73
‘a, i ii— cxx
— 03P g
X
'o ’3 a3 »g .S
x c
> n _a - s.tiy 00 ow.S E 00 g G G•sI *£ 2B - "3 13
003
ES-c(D
i00 ss s.2 -D 73 J= (D G2S3
X Jo3
C/3-313J-H3Cd^ G 73
13 5oP c
^ oC/3 O
I S
O h ' S°< scb « t- o o o
ix , o
3
oo cj t-~£ S oo I—C W c_2
o > C3 0 O in w X Tf55 I
S' 7 ^o 52. oo o
r-~
6b
6 So g oov X ON 03' d ' W
w w
E E
cn i sO Eo.
b.Sh n X
(U73
<U X ' W) X G.s>!-C oc > r- <U G *2 .2 o ^p 1)
Cu o
o
"Sos c x
"O . 2g "o oo Z, .S uOh ^r v 3 3 .2 2E ^cn O f■K .5>. 3 2 §
(D b 3O . 3
X ~O cny cS o
3X 3<D __ _3 O .o Dh
X e f
(D ^2 3 C . 3 (D
X ) ES c3 o <D . 3cn >O 3B S B o .23 'S
•2 32 EO oo
1/0 ^ 7
°°1 2 S § I o gCl.00 3b ^- ^ 8 5
a ^ a sE gV") >- 00
O7t
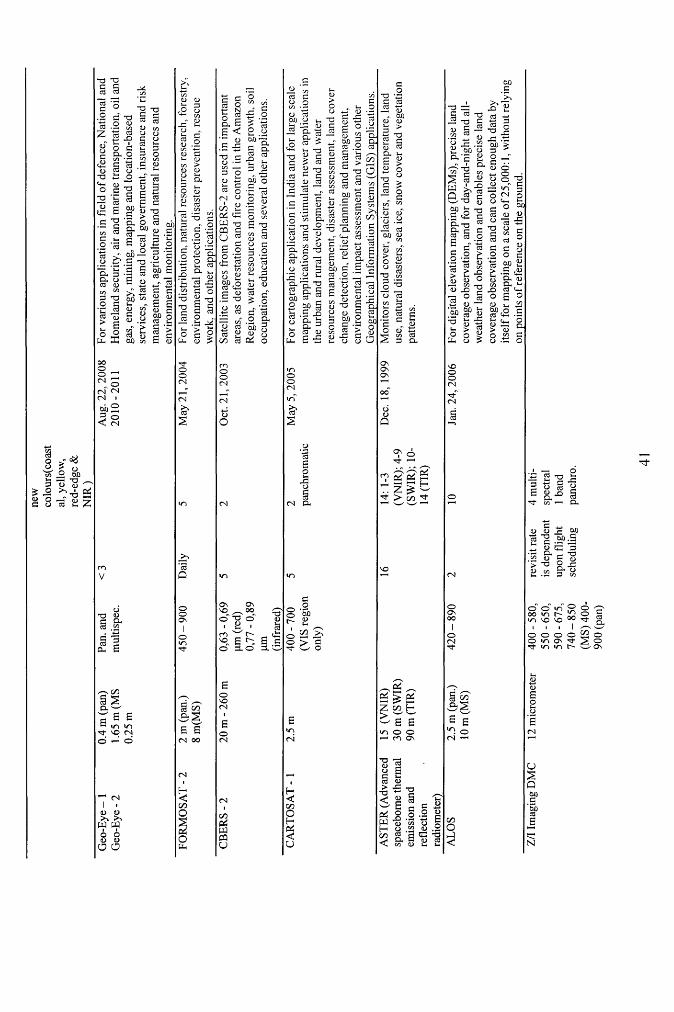
ap > o >ui 5 ®3 1313
£ - 2 ^ 7 3 ^S S i s z
(D T3
Cd <D
^ O (N <N CN i
m23 o
§ 3 Pu a
pp1/5 § 2 co'—''a S SP i n <n -0- vq cn 0 — 0
PJ P3 o o<U Vo o
•p cc ■£O cd
X o' o —<D Q.
2 £ CO t- ^ <D
p o
I I.§ ^£ §
a aCN 00
S I S I !■!
T3 C<D .—c/3 —a oa -eC3 O
CN «
- C£ ^ S S0 0 ~
00 O C —
oo <DCd Xl PJ 73CQ SH fo Xti= CO
S P tSCO 0-<c o a.a *o >.
P 3 u . T 3(D <U
C CO O CO‘So 1s _.
td H 3 o M a K O
as os / -^ °°„ o ' 1? o '
« a ^ a sO 3 . 0 3 . c .
.£C/3"cd Pu .2C/3
o cdW) oc3 Uao cduz, V-.-o (U>C ?>cd a>.2 c"5 <L>n 2
3c £c *po C/3’p -ocd co cd'Hh C/3GDh ocdo cd
X aa*cd;_ Pm
&00 cdob
00p
1)
cS -2
’I ^ > S '
73 O
c/5 C/3w c-c/3 P
a I
XI Co b§-sa rS
(U 732 w a oo© a •CO 2 (U X o
in
cg
‘oowl-
C/3 '
> ’
eo73 xa -2-2 4J„ 00 (D 0)
1 1<u 3P m Wp ^ c >
i> <*>
5 sX 13 '-ft o ^13 coa aP "2
•a c
6 Tf —S' p
5c 7T°? Soi
^ Cd ^£ gs g5 w w^ a a
P I 1 c l* X .2 ■£ 8w u c/3 o a E—i o .23 w .;
° X2 m« * 'S
t t t "2S fQ - g 00 >=; .a c2Dm "O&§3 «“ ! •£"1 > ^ d> <l> -X c/3 <D X3 S:§> §? 73 53 O o
Co, u
X ”2 co§ ^ —1 X<U '
. a m '' 32 2 -
5 o
3^ o O Ml<U ^c 03 <U wa ° to —
c ^.2 § to c £ .2
cdX >o
ca ©<u
C ,u 'S t‘- ' O . <u CO »- CO
a °, . W00 o c co od . a
g S 3 S
S ¥ “1 o
. ' -— o X 2 *P e
1 P 17l- in — CO
O j - 00
c “ c :J j C 3& c -g
■° E . - SC/3 S* ^ X 3 co
o o o O *n Os d" <r> in
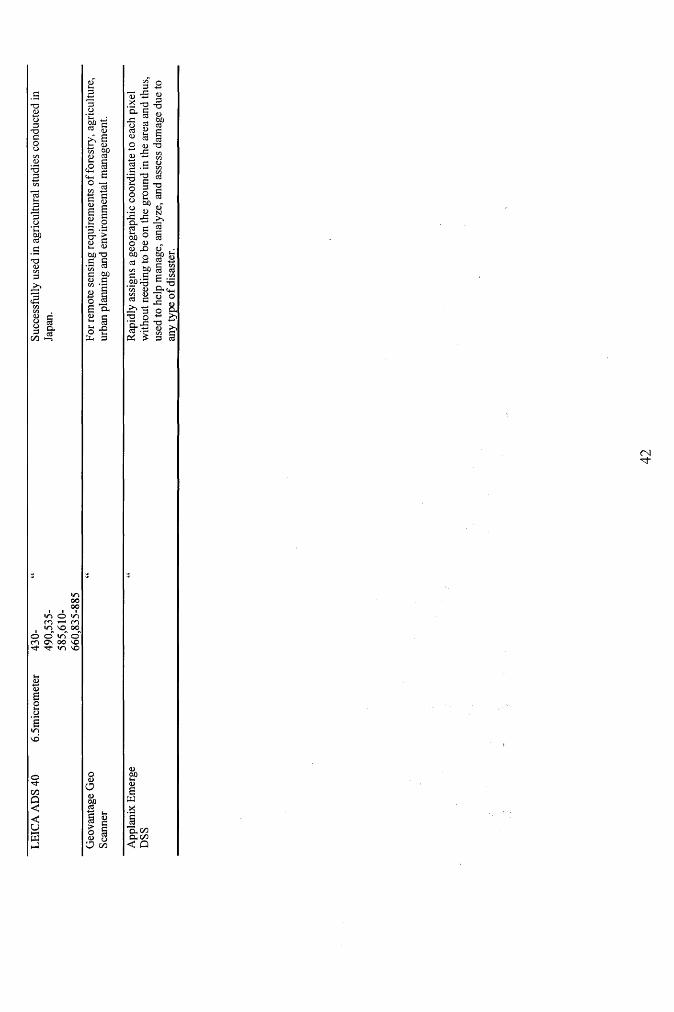
rO3C/3
*CdV-aa
3(Z)
CO
a § «•P S wO $ COCO U -© aO (Ucd a a cc •"*
a c
g §00X X
£" cfo oo <u a) X00 ocd + *C/3 0 0
a l
cdb cds £JS’Ph <D o
3 oi - lcd £
CNTt
m omm mm v© oo o o ’ m o ' m ov oo vo rf ■Tf m vo
c l , 0 5 0*00 < Q
The main advantage of airborne remote sensing is that the effects o f cloud
cover, atmospheric attenuation and scattering can be controlled or avoided. Data can
be acquired when the skies are clear and at any desired temporal frequency on a
repetitive basis thus, leading to a cost effective means o f monitoring the
environment. The system provides several advantages over satellite systems as they
are simple, reliable and inexpensive (Campbell, 1996). However, airborne systems
have a more limited spatial coverage than satellite systems, which offer the potential
o f complete global coverage. In addition, there are inherent risks associated with low
level flights required for monitoring leaks from oil pipeline as the accuracy of
information depends solely on the pilot.
However, the major consideration in the choice o f appropriate remote sensing
system for vegetation stress monitoring is the spectral resolution. As information
about the general health status o f vegetation is often embedded in narrow spectral
features, a high spectral resolution is required. The spectral resolution, which is the
ability o f a sensor to resolve spectral features, is controlled by the bandwidth,
spectral sampling interval and number o f bands. In principle, the higher the spectral
resolution, the greater the chances o f gathering useful information for better
understanding o f plant health status. Biochemical constituents relate to and
invariably provide accurate information about physiological characteristics and thus,
allow assessment o f vegetation condition. Many biochemicals have fine spectral
features which cannot be sampled using the broad bandwidths o f some optical
remote sensing systems (Clark, 1999; Yang et al., 2000; Curran, 2001; Broge and
Mortensen, 2002; Van Der Meer et al., 2002). This is because they use average
spectral information over broadband widths resulting in loss o f critical information
available in specific narrow bands (Blackburn, 1998; Thenkabail et a l, 2000).
43
Overall, it is clear how spectral resolution can be important in determining the ability
o f a remote sensing system to monitor vegetation stress.
Spatial resolution specifies the smallest object that could be detected by a
sensor. There are several remote sensing systems o f very high spatial resolution of
lm or less (Table 2.2) but they have a limited spectral resolution. High spatial
resolution data have primary applications in managing forest inventory related to
assessing stock levels and classification o f vegetation types (Wulder, 1998; Wulder
et al., 2000). Indeed high spatial resolution data are extremely useful for refining
stress detection methods by allowing us to discriminate between different vegetation
types and therefore constrain our predictions. However, there is growing evidence
that for mapping o f vegetation condition associated with health and nutrition, and
biological invasion (pest, diseases, and weeds), a sensor that can measure in several
hundreds o f narrow bands is required, usually with a bandwidth o f lOnm or less
(Filella and Pehuelas, 1994; Yang et a l, 2000; Bronge and Mortensen, 2002; Asner
and Vitousek, 2005; Liew et al., 2008). Unfortunately, due to technical constraints,
satellite remote sensing systems are unable to offer both high spatial and high
spectral resolution but airborne systems do have this capacity.
In reviewing hyperspectral techniques for estimating biophysical parameters
o f forest ecosystems, Treitz and Howarth (1999) provide characteristics of several
imaging spectrometers that can acquire contiguous spectra over land and water
surfaces. These are presented in Table 2.3.
44
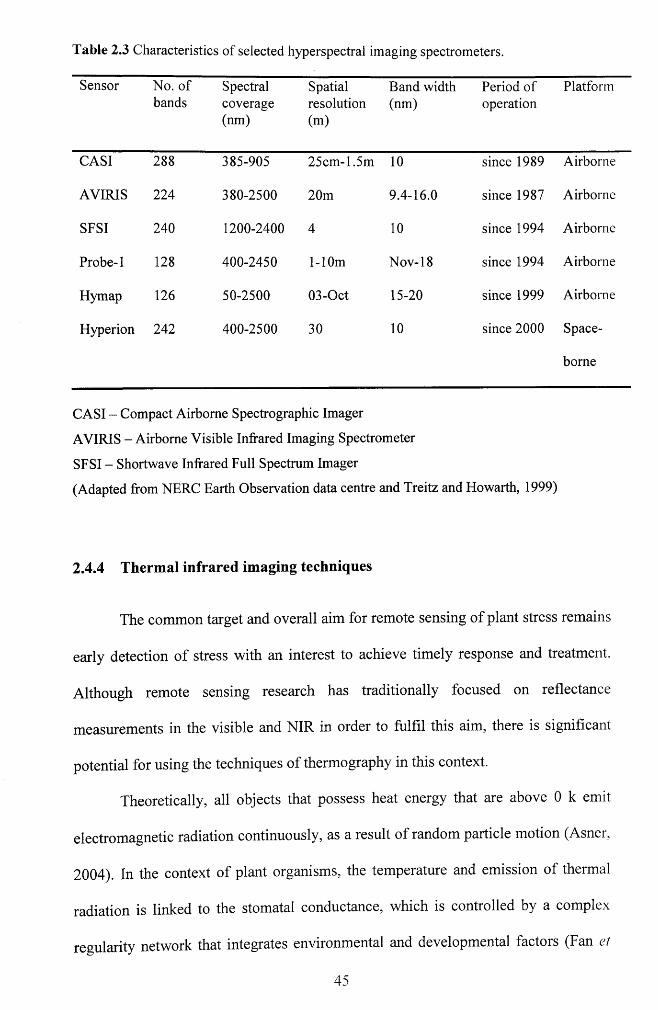
Table 2.3 Characteristics o f selected hyperspectral imaging spectrometers.
Sensor No. of bands
Spectralcoverage(nm)
Spatialresolution(m)
Band width (nm)
Period of operation
Platform
CASI 288 385-905 25cm-1.5m 10 since 1989 Airborne
AVIRIS 224 380-2500 20m 9.4-16.0 since 1987 Airborne
SFSI 240 1200-2400 4 10 since 1994 Airborne
Probe-1 128 400-2450 l-10m Nov-18 since 1994 Airborne
Hymap 126 50-2500 03-Oct 15-20 since 1999 Airborne
Hyperion 242 400-2500 30 10 since 2000 Space-
borne
CASI - Compact Airborne Spectrographic Imager
AVIRIS - Airborne Visible Infrared Imaging Spectrometer
SFSI - Shortwave Infrared Full Spectrum Imager
(Adapted from NERC Earth Observation data centre and Treitz and Howarth, 1999)
2.4.4 Thermal infrared imaging techniques
The common target and overall aim for remote sensing o f plant stress remains
early detection o f stress with an interest to achieve timely response and treatment.
Although remote sensing research has traditionally focused on reflectance
measurements in the visible and NIR in order to fulfil this aim, there is significant
potential for using the techniques o f thermography in this context.
Theoretically, all objects that possess heat energy that are above 0 k emit
electromagnetic radiation continuously, as a result o f random particle motion (Asner,
2004). In the context o f plant organisms, the temperature and emission of thermal
radiation is linked to the stomatal conductance, which is controlled by a complex
regularity network that integrates environmental and developmental factors (Fan et
45
a l, 2004; Chaerle et a l, 2005; Li et al., 2006). Disturbance to the processes of
transpiration can be exploited as cues for plant stresses (Liew et a l, 2008) and the
thermal imaging technique provides information on the effect o f stressor on stomatal
related parameters (West et al., 2005).
Past studies show that the thermal dynamics o f vegetation, involving changes
in leaf or canopy temperatures are good indicators o f vegetation stress. Water deficit
in plant induces stomatal closure and as a result restricts transpiration processes
which ultimately could lead to less water evaporation from the leaf surface (Ceccato
et al., 2001). Thus, this brings about less cooling effects through latent heat loss and
consequently an increase in leaf temperature (Jackson, 1986).
Evidence shows that it is feasible to employ thermal imaging techniques for
plant stress detection because their thermal properties in the use o f captured light
energy possibly changes upon stress (Buschmann, 1999). One way o f employing
thermal techniques for plant stress detection is by use o f thermography. The
operational principle o f thermography as a passive imaging system for detecting the
long-wave (thermal) radiation emitted by the subject is as an indicator o f leaf
temperature (Chaerle et al., 2007). Jones (1999) indicated that thermography
visualizes leaf surface temperature, and has equally been pronounced as a proxy for
transpiration and stomatal conductance. The technique can monitor the event of
water stress as decreased transpirational cooling from stomatal closure leading to an
increase in leaf temperature (Jones, 1999; Jones, 2004; Grant et al., 2007).
Thermography has been successfully used at the laboratory scale to reveal
stress situations that affect stomatal conductance (Jones, 2004). Stomatal
conductance is one of the key factors that determine plant yield (West et al., 2005);
hence it is an acceptable parameter for measuring stress condition. Surface
46
temperature control offered by the transpiration process helps us to interpret different
thermal signals exhibited by plants with respect to stress response. Thus, the
difference in the thermal signals as imaged by thermography could provide reliable
information about the health status o f plants. There are instances where the initial
rise in leaf temperature corresponds to plant resistance to biotic stress, otherwise
called hypersensitive response. Hypersensitive reaction o f tobacco to tobacco mosaic
virus results in initial rise in leaf temperature caused by stomatal closure (Chaerle et
a l, 2007), resulting from accumulation of salicylic acid (Chaerle et a l, 1999). After
an initial rapid thermal expansion over a given period o f time, the thermal signal
gradually declines. This gives additional support and offers strong evidence about the
potentials o f thermal imaging techniques as a viable tool in early detection o f plants
stress - particularly pathogen-induced. Besides disease induced stress, Jones (2004)
noted that most applications of thermal imaging systems are related to monitoring
plant responses to water deficit stress.
Apart from biotic stress, few o f the abiotic-induced stress effects on plant
thermal response have been studied. In a comparative study, Carter et a l (1996)
found no significant difference between plant canopy temperature subjected to
herbicide-induced stress and unstressed canopy. As explained in section 2.4, there is
a view that temperature increases when leaves are coated with oil (Pezeshki et a l ,
2000) due to blockage o f transpiration pathways (Pezeshki and DeLaune, 1993).
However, the thermal response o f plants indirectly exposed to oil pollution, through
soil contamination is not known.
47
2.4.5 Synthetic Aperture Radar (SAR) imaging techniques
Radars are active sensors which operate in the microwave region o f the
electromagnetic spectrum (wavelengths in the order o f millimeters to centimeters).
SAR imaging has potential for large area coverage and is noted to have all weather
and cloud cover penetration capabilities, and thus, is valuable in areas that are prone
to frequent cloud cover. The European Space Agency (ESA) (2007) indicates that the
microwave capability offered by the ERS series means that observation is not limited
by weather or light conditions as are optical data. The agency provides an overview
o f the wide range o f applications o f Earth Resources Satellite (ERS) SAR data.
These ranges o f practical application o f the earth observation system have been
classified under oceanic and land environments and have also been noted as an
emergency application technique.
For example, on the oceans, most o f the illegal or accidental anthropogenic
spills, as well as natural seepage from oil deposits, are clearly visible on radar
images. Ships can be detected and tracked from their wakes. Ice monitoring,
mapping o f the topography o f the ocean floor and provision o f input data (such as
ocean waves and their direction o f displacement) for wave forecasting and marine
climatology are achievable. Major areas o f application o f SAR images include:
(i) mapping and monitoring landuse/landcover and for forestry changes and
agriculture studies for monitoring crop development.
(ii) enhancement o f geological or geomorphological features.
(iii) supports georeferencing o f other satellite imagery to high precision, and
in regular updating o f thematic maps.
(iv) helps to optimize response initiatives and assess damages after flooding.
48
(v) interferometric SAR can be used under suitable conditions, to derive
elevation models or to detect small surface movements, in the order of a
few centimeters, caused by earthquakes, landslides or glacier
advancement.
Monitoring the scale o f global crop production and trade has been identified
as an area in which SAR data may be able to assist. In addition, these systems
provide information for mapping forest extent and type, particularly in tropical areas
which have not previously been mapped due to almost continuous cloud cover. It is a
unique source o f data, and in conjunction with other remotely sensed data it can be
used to map forest damage, the encroachment o f agriculture onto forested areas
unsuitable for development, and in general to provide inventories o f timber areas.
It is worth noting that despite many advantages o f SAR system, it has some
inherent limitations especially in the context of vegetation stress monitoring. There is
a lack o f evidence that it can be used in this context as many o f the available
microwave sensors lack spatial resolution to be practical for plant stress monitoring.
They are more responsive to change in vegetation structure than function thus, can
only be o f relevance for severe or later stages o f stress especially when plant death
must have occurred.
2.4.6 LiDAR imaging techniques
One emerging technology that is gaining rapid attention in remote sensing of
vegetation particularly at canopy scale is LiDAR (Light Detection and Ranging).
LiDAR is an active system; based on an artificial radiation source that operates in the
near-infrared. Vegetation has high reflectance and transmittance at this region;
49
allowing a strong return from the forest canopy as well as from the forest floor
(Kasischke et al., 2004). The technology provides horizontal and vertical information
at high spatial resolutions and vertical accuracies (Lim et al., 2003). LiDAR has the
capability o f measuring the geometrical structure of plants which is the most
important factor that influences the reflectance o f plants at canopy scale. For
example, Riano et al. (2004) demonstrated the possibility o f measuring canopy LAI
from LiDAR imagery.
Thus, while LiDAR imagery alone is probably insufficient for monitoring
plant stress, its combination with hyperspectral imagery is very promising, in this
respect. For example, one notable area o f LiDAR data application which has
improved the accuracy o f pigment estimates at the stand scale is in extraction of
spectral information from tree crowns, while extraneous spectral information from
canopy gaps are removed (Blackburn, 2002). The study noted that this was possible
by applying spatial filters created from the canopy surface elevation models derived
from the LiDAR data to imaging spectrometer data from forests. Again, with
imaging LiDAR, it is possible to quantify total canopy chlorophyll content; by using
the measured canopy LAI to scale-up estimates o f foliar chlorophyll concentration
derived from hyperspectral data (Solberg et al., 2005). Blackburn (2007) suggests
that the combination o f LiDAR and hyperspectral imaging technique in studying the
geometrical structure o f heterogeneous canopies remain a possibility which needs
further investigation.
50
2.5 Conclusion
Plant stress can be caused by various biotic and abiotic factors. Oil pollution
is an abiotic factor that can affect plants. Plants can be affected directly through
physical contamination with oil or indirectly through soil pollution. Various remote
sensing techniques have been identified as valuable tools for estimating and mapping
plant biochemical and biophysical properties, in order to understand the health status
o f plants.
In the context o f hyperspectral remote sensing, several approaches have been
found to be useful for plant stress detection both at early and later stages. These
include: the use o f characteristics o f spectral reflectance in the visible, NIR and
SWIR regions, the characteristics o f the red edge such as the position, selection of
diagnostic individual narrow wavebands, and a plethora o f spectral reflectance- and
derivative-based ratios. However, the optimal spectral indicator for monitoring plant
stress induced by oil pollution is not known. The potential o f thermal imaging
techniques for detection o f plant stress, particularly abiotic-induced stresses other
than water deficit, have not been extensively studied. The literature suggests that
increased leaf temperature is one o f the possible effects o f physically-induced oil
pollution on plants but it is not known if the same effect occurs when plants are
polluted indirectly through soil contamination. In summary, there is strong evidence
that hyperspectral and thermal remote sensing techniques hold considerable potential
for monitoring plant stress, but the specific case o f detecting and quantifying stress
induced by oil pollution requires further investigation.
51
Chapter 3
METHODOLOGY
3.1 Introduction
This chapter deals with the general methodology adopted in this study. It
covers the range o f plant materials used and various treatments applied. Various
measurements undertaken including the instrumentation and measurement
procedures used are presented. The methods and procedures used to analyse the data
are explained and key criteria for evaluating the information found are identified.
3.2 Plant material
With the exception o f a field based pilot study (reported in Chapter 4 below),
all experiments were carried out in a glasshouse (10 x 3m) at the Lancaster
Environment Centre, Lancaster University, UK. Day and night temperatures were
typically 26°C (±2°C) and 15°C (±1°C) respectively, and a 12 h supplementary
photoperiod (06.00 h to 18:00 h) was provided by Osram Plantastar 600W sodium
lamps to give a photosynthetic photon flux density (PPFD) of 400 pmol m V at
bench height. Maize (Zea mays L.) and French dwarf bean (Phaseolus vulgaris
‘Tendergreen ’) were the model plant species chosen for this study. Two seedlings of
maize (previously pre-germinated for three days on damp tissue paper in darkness) or
bean, were sown per 2 L pot containing a loam-based compost (John Innes No.2, J.
Arthur Bowers, Lincoln, UK). Pots were placed on capillary matting that was
watered daily to ensure that soils were kept moist and to prevent waterlogging and
52
possible nutrient leaching that may have arisen by overhead watering. Plants were
thinned to one per pot after two weeks and left to continue to establish for a further
week before treatments commenced. Initial ‘zero tim e’ measurements were taken for
all plants immediately before first treatment application. Measurements were
repeated every 2 to 3 days thereafter.
3.3 Plant treatments
In all experiments, the control received no treatment. For the oil treatment,
15W/40 diesel engine oil (Unipart, Crawley, UK) was applied to the soil surface and
allowed to penetrate down through the pore spaces. In each case, the dosage was
determined based on a percentage volume o f the soil water holding capacity (WHC)
o f the pot (field capacity minus oven dry), previously determined as 0.63g H2O g '1
compost at a density o f 0.8g cm'3. Application rates were 20% of WHC, being
equivalent to 96g oil kg '1 soil. Waterlogging stress was instigated by flooding the
pots with water to a depth o f 2.5cm above the soil surface twice a day. A water
deficit stress was induced by watering to 25% of the soil WHC on a daily basis. The
control and oil treated plants were watered to 80% of soil WHC daily. This was to
ensure that plants received equal volumes o f water, to avoid totally displacing oil
treatments where present, and to prevent occurrence o f incidental waterlogging
where not required. During the experimental period, pots were randomized and
periodically rotated around benches to minimize possible effects o f differences in
glasshouse microclimate on plant development.
53
3.4 Physiological measurements
In order to understand the physiological responses o f plants to the stress
treatments, the same leaf on each plant was monitored throughout the experiment.
The sixth or seventh fully emerged maize leaf and third trifoliate bean leaf (which
was the most dominant from nadir at the start o f the experiment in bean), were
chosen for physiological measurements. All measurements started on Day 0
immediately prior to treatment and then every 2 to 3 days thereafter. Rates of
photosynthesis, transpiration and stomatal conductance were determined using a
portable infrared gas analyser (CIRAS-2, PP Systems, Hitchin, UK). The leaf cuvette
conditions were set to track ambient glasshouse temperature, humidity and ambient
CO2 concentration (38.5 Pa), with a PPFD o f 600 pmol m 'V 1, and a leaf
equilibration time o f 3 minutes in the cuvette prior to recording data. At the same
time plants were visually inspected for any visual signs o f stress.
3.5 Thermal imaging
Thermographs for individual leaves (for leaf scale measurements) and canopies (for
canopy scale measurements) were acquired in the glasshouse (unless otherwise
stated) using an SC2000 thermal camera (FLIR Systems, West Mailing, UK). The
thermal camera operates in a waveband from 7.5 to 13 pm with a thermal sensitivity
o f 0.07°C at 30°C. The field of view (FOV) was 24° x 18°, the spatial resolution 1.3
mrad and emissivity was set to 0.95. Measurements were made following the
procedure of Grant et al. (2006). At each time o f measurement, two leaves were cut
o ff from the reserved maize plants and placed close to the leaf of interest in order to
act as wet and dry reference surfaces. The wet references were regularly sprayed
54
with water to keep them moist while the dry references were covered in petroleum
jelly to inhibit water (and therefore heat) loss. The acquired thermal images were
recorded on a portable disk and later downloaded to a PC for analysis.
3.6 Spectral measurements
Leaf and/or canopy spectral reflectance data were collected in a dark room
directly opposite the glasshouse and immediately after physiological and thermal
measurements, using a field portable GER 1500 spectroradiometer or an ASD
FieldSpec® Pro Spectroradiometer (Boulder, CO 80301 USA). The GER 1500 uses a
diffraction grating with a silicon diode array that has 512 discrete detectors that
provides the capability to read 512 spectral bands. Thus, it scans the spectrum at
approximately 1.5 nm intervals and covers a portion o f the Ultraviolet (UV), the
Visible, and the Near-infrared (NIR) wavelengths from 350 nm to 1050 nm. The
ASD sampling interval over the 350-1050 nm range was 1.4 nm with a spectral
resolution o f 3 nm. Over the 1050-2500 nm range the sampling interval was 2 nm
and the spectral resolution between 10 and 12 nm. The instrument interpolated data
points to give output reflectance values at 1 nm intervals.
The spectral measurements were carried out in a dark laboratory room in
order to ensure stable and uniform illumination conditions (Mutanga et al., 2003;
Vaiphasa et al., 2005). To minimise the effects o f background spectral variations,
each pot was placed on a fixed black tray directly under the sensor (Gong and Heald,
2002; Mutanga et al., 2003). Before leaf spectral measurements were taken, the
leaves were clipped onto a flat low-reflectance surface. The low reflectance was
provided to minimise the effects o f a background spectra on the sample spectrum
(Gong et al., 2002).
55
To fully illuminate the target, a 500W halogen lamp was mounted at a fixed
position away from each leaf or plant canopy to be measured. Where an ASD
FieldSpec® Pro Spectroradiometer was used for reflectance measurements, the ASD
foreoptics were positioned at nadir, 6 cm above each leaf and plant canopy to be
measured. An 18° FOV was used which covered a sample area 2cm diameter on the
surface o f individual leaves and approximately the same diameter at the top surface
o f the plant canopies sampled. Prior to scanning, the lamp was switched on for 20
minutes to eliminate spectral changes in the lamp as it warmed up (Smith et al.,
2004a). Ten spectral measurements were captured per leaf or canopy for each o f the
10 replicates per treatment. Additionally, spectra were taken randomly by
concentrating around the centre o f the leaf or canopy and avoiding outer boundaries.
Leaves were slightly shifted between measurements to capture spectral variations
within each leaf. In order to capture spectral variation within canopies, small
adjustments were made to the position and rotation of the pot between each spectral
measurement. Prior to spectral measurement, a reference measurement was first
made using a white Spectralon panel (Labsphere, North Sutton, New Hampshire,
USA) placed in the same position as the leaf or canopy. In each case, the time
between reference and target measurements never exceeded one minute. The leaf
spectral reflectance (R) was computed by dividing the radiation reflected from the
leaf or canopy (It) by that reflected from the white spectralon reference panel (Ir) and
applying a correction (k) for the spectral reflectance properties o f the panel, as no
perfectly reflecting panel exist in practice (Milton, 1987).
Thus, % R = — x k x 100 (1)Ir
56
3.7 Measurement of leaf pigments and water content
After leaf and/or canopy thermal and spectral properties were measured,
pigment concentrations o f the same leaves were determined. Ten circular discs, each
10 mm in diameter, equivalent to 0.79 cm2 leaf disk areas (for maize) and 6 mm in
diameter equivalent to 0.28 cm2 leaf disk areas (for bean) were punched from five of
the ten replicate leaves for each treatment. On the next day o f measurements, discs
were taken from the other five replicate leaves. The alternate disc collection
sequence was maintained until the end o f the experiment to ensure that any possible
damage to the leaves was minimised. A pilot study confirmed that the disc sampling
technique used did not produce any significant differences in physiology or
remotely-sensed response compared to leaves where discs were not removed.
Immediately after disc removal, five o f the leaf samples were frozen at - 50°C for
later determination o f pigment content. The rest o f the samples were immediately
weighed to determine fresh mass before they were dried at 80°C until a constant dry
mass was obtained. Leaf water content was calculated as the difference between leaf
fresh and dry mass and expressed per unit leaf area.
For pigment content determination, the frozen samples were crushed in a few
drops o f 1 0 0 % methanol with a pinch o f calcium carbonate, to form a homogenous
slurry. Pigments were extracted from the crushed samples by adding 5 ml o f 100%
methanol in a centrifuge tube. The tubes were placed in a refrigerator at < 5°C
overnight to ensure complete extraction before centrifuging to remove particulates.
The samples were spun for 2 minutes at 30,000 revolutions per minute (rpm). Three
replicate extractions derived from each leaf disc were analysed using a Shimadzu UV
mini 1240 UV-VIS spectrophotometer, with measurements of absorbance at 665.2
nm, 652.4 nm and 470 nm. Prior to measurements, blank samples of methanol were
57

measured to calibrate the cuvettes for each wavelength. The analysis procedure was
designed to minimise the completion time after removing each leaf sample from the
freezer. Thus, the preparation and analysis procedure took approximately 10 minutes
per sample, excluding the overnight extraction time. All procedures were carried out
under low-light conditions in the laboratory in order to minimise photo-oxidation of
pigments.
The concentrations o f chlorophyll a, chlorophyll b, chlorophyll a + b and
carotenoids x + c (cars) in pg cm"2 were determined using the equations derived by
Lichtenthaler (1987):
Chlorophyll a = 16.72*A 665.2) - (9.16 *A 652.4) (2)
Chlorophyll b = (34.09* A652.4) - (15.28*A665.2) (3)
Chlorophyll a + b = (1.44*A665.2) + (24.93*A652.4) (4)
Cars = ((1000*A47o)-(1.63*chlorophyll a)-(104.96*chlorophyll b))/221 (5)
While equation 3 gives the concentration o f total chlorophyll, i.e., the sum of
chlorophyll a and chlorophyll b (a + b) (hereafter referred to as total chlorophyll),
equation 4 gives the concentration o f total carotenoids, i.e., the sum of the
xanthophylls and (3-carotene (x + c). These equations gave pigment concentrations in
micrograms per ml o f extract which was converted to contents in micrograms per
cm2 o f leaf.
3.8 Data analysis
3.8.1 Physiological analysis
In order to ascertain and quantify the effects o f treatments on plant
physiological properties, the photosynthetic rate, transpiration and stomatal
58
conductance for each sample was measured on each day o f assessment. Physiological
measurements o f treated plants were expressed as percentage o f control on each
measurement occasion in order to account for the effects on absolute values, o f daily
glasshouse variability in ambient temperature and humidity at the time of
measurement.
3.8.2 Thermal imaging analysis
Thermal images were analysed using ThermaCAM Researcher 2001 software
(FLIR Systems, West Mailing, UK). Polygon areas were selected from the image
covering the wet and dry leaf references as well as the target leaf or canopy of
interest to measure their thermal characteristics. The minimum, maximum, and
average leaf or canopy temperatures were extracted for each replicates o f control and
treated plants. The thermal index (Jo) was calculated from leaf or canopy
temperatures as:
Ig = (Tdry - Tieaf)/(Tieaf — Twet) (Grant et a l, 2006) (6)
Where, Tdry = temperature o f the dry reference
Tieaf = temperature o f the leaf or canopy o f interest
TWet= temperature of the wet reference
The Iq is theoretically proportional to stomatal conductance (gs) under any
environmental conditions (Jones, 1999). The outputs were transferred to Microsoft
Excel spreadsheets in order to determine treatment means and standard errors.
Finally, leaf or canopy mean temperature and Ig (% of control) values were plotted
against time in order to observe the effects o f treatments on thermal responses.
59
3.8.3 Spectral data analysis
The spectral data in GER1500 .sig files were imported into Microsoft Excel
for processing using a Visual Basic macro. Individual reflectance spectra were
displayed and visually assessed to eliminate erroneous data. Differences between the
initial spectral reflectance o f control and treatments were computed. These were used
to normalise subsequent spectral reflectance o f treatments. This was to ensure a
meaningful comparison between changes in spectral reflectance of control and
treated plants. In order to examine the effect o f treatments on plant spectral
properties, the mean reflectance spectra of control and treatments were plotted
against wavelength. However, wavelengths shorter than 400 nm were not analysed
due to excessive noise. Differences between the mean reflectance spectra of
treatments and control were plotted in order to identity wavelengths o f high variation
between the treatments and control.
Derivative spectroscopy concerns the rate o f change o f reflectance with
wavelength (Smith et a l, 2004a). The derivative analysis was undertaken in order to
(i) discriminate between overlapping bands, (ii) locate the position o f the primary
red-edge wavelength associated with leaf damage (Miller et al., 1990; Martin, 1994;
Smith et al., 2005) and (iii) identify other red-edge features that may indicate stress
in leaves. Derivative analysis can enhance absorption features that might be masked
by interfering background absorptions (Elvidge, 1990; Dawson and Curran, 1998)
and leaf background effects. Thus, derivatives can provide a more sensitive analysis
than using original reflectance spectra (Smith et al., 2004b). A first derivative
spectrum displays the variation with wavelength in the slope o f the original
reflectance spectrum (Blackburn, 2007b). Thus, the first derivative was calculated
using the ratio of difference between original spectral reflectance values in two
60
individual narrow wavebands that span a window of three adjacent wavebands. The
resulting derivative was smoothed using a three-band window moving average across
the spectrum. This procedure eliminated the effects o f noise and at the same time
minimised the loss of fine spectral detail.
The red-edge region is the region of occurrence o f multiple peaks. The red-
edge position (REP) is conventionally marked by the wavelength corresponding to
the maximum amplitude o f the first derivative within the region o f the red-edge.
Limitations associated with this method and other methods used in determining the
REP were identified by Cho and Skidmore (2006). This led to the development o f a
new approach called the linear extrapolation technique. The model defines the REP
as the wavelength that corresponds to the intersection o f two straight lines
extrapolated through two points on the far-red and two points on the NIR flanks of
the first derivative reflectance spectrum o f the red-edge region. Thus:
REP = ~ ( c l ~ c2) (7)(ml - m2)
where c l and c2, and m l and m2 are the intercepts and slopes o f the far-red and NIR
lines respectively. Afterwards, the amplitude which gives the degree o f height o f the
REP, in other words, the first derivative reflectance o f the REP was recorded.
Besides the REP and its amplitude, other red-edge attributes analysed include
(i) the positions o f the first and second of the double peaks and (ii) the distance
between the positions o f the double peaks in the second derivative reflectance red-
edge region. Thus, the second derivative was calculated by taking the ratio of
difference between first derivative reflectance values in two individual narrow
wavebands that span a window of three adjacent wavebands. Essentially, the
positions o f the double peaks correspond to points where the second derivative
61
curves have a value o f zero (Cho and Skidmore, 2006). Thus, the position o f the first
o f the double peaks was calculated as the wavelength that corresponds to the first
data point o f zero value in the second derivative curve in the red-edge region.
Similarly, the position o f the second peak was calculated as the wavelength that
corresponds to the second data point of zero value in the second derivative curve in
the red-edge region. The distance between the wavelength positions o f the double
peaks was then calculated.
Various individual narrow wavebands and spectral indices were also used to
analyse stress effects on leaf spectral reflectance. These were chosen based on
systematic selection o f bands (using a single waveband per region o f the spectrum)
and systematic combination of wavebands across the entire wavelength range. In
addition, wavebands at which reflectance variation between treatments and controls
were high were analysed. The entire reflectance spectrum was considered because
subtle differences arising from physiological stress do not appear only at specific
regions such as the red-edge but are distributed across the spectrum. The limitation
o f not investigating all combinations o f wavebands across the entire spectrum was
due to the significant computation time for performing the sensitivity analysis.
Spectral indices proposed by several studies as being useful for plant stress
detection were investigated (Bonham-Carter, 1988; Miller et a l, 1990; Miller et al.,
1991; Vogelman et al., 1993; Carter, 1994; Belanger et al., 1995). These indices
calculate ratios o f bands, or properties mainly in region o f the red-edge (Kempeneers
et al., 2005).
62
3.8.4 Statistical and sensitivity analysis
Statistical analysis was performed using Analysis o f Variance (ANOVA) to
ascertain which o f the stress indicators was optimal for early detection, prediction
and quantification of stress arising from treatments. The criteria used to judge their
sensitivity to stress were time o f detection and consistency in detection during the
remainder o f the experiment. Time o f detection was particularly considered in order
to determine whether stress arising from treatments could be detected by
hyperspectral and/or thermal sensing before symptoms became apparent to an
unaided eye. However, both factors would help to establish reliability and general
sensitivity for each of the stress indicators. All significant differences were at the
0.05 level o f confidence unless otherwise stated. The hypothesis tested using
ANOVA was that there is no significant effect o f treatments on plant physiological,
spectral and thermal properties. Post hoc test analyses using Tukey HSD were
performed on ANOVA to determine significant treatment differences by a mean
square multiple comparison procedure. This helps to ascertain the sensitivity o f an
indicator to various treatments. Regression analysis was conducted to ascertain
relationships between remotely-sensed stress indicators and physiological
parameters.
Where biochemical measurements were made, the measurements of treated
plants were expressed as percentage o f control on each measurement occasion.
Sensitivity analysis was performed on the biochemical data using ANOVA to
determine when significant responses to the different treatments occurred and
whether these responses were consistent throughout the experiment.
T-tests were performed on wavelengths of high spectral variation to
determine whether differences in spectral responses were significantly different
63
between treatments. Correlograms were computed to determine the relationships
between the measured physiological and biochemical parameters and reflectance in
each individual ASD waveband. In order to develop optimal spectral indices,
wavebands with the highest correlations were identified in addition to wavebands
with minimum correlations. Based on previous studies and theoretical considerations,
the sensitivity o f a spectral index is improved when wavebands that are responsive to
a given physiological property e.g. photo synthetic rate, are referenced to
nonresponsive wavelengths (Schepers et al., 1996). Thus, several simple and
normalised difference ratios were developed based on this theory. However, in order
not to overlook some other potentially valuable spectral indices, a range o f existing
spectral indices identified in the literature (Tarpley et al., 2000; Read et al., 2002)
were also tested.
64
Chapter 4*
PRE-VISUAL DETECTION OF OIL-INDUCED STRESS IN MAIZE (Zea
mays, L.) USING LEAF SPECTRAL AND THERMAL RESPONSES
4.1 Introduction
Many studies have shown that pollution-induced stress has a negative effect
on the physiological functioning o f plants. For example, it has been demonstrated
that leakage o f natural gas into the soil caused restricted plant growth and
reproduction as well as decreased the number o f individuals (Godwin et a l, 1990).
However, changes in plant growth rate or species composition and plant community
structure are relatively slow to respond to gas leaks and thus are generally inadequate
as early stress indicators (Mendelssohn et al., 2001). Alternatively, visual
observations o f plants may provide timely indications o f the symptoms o f plant
stress. For example, visual stress symptoms in the form o f shoot and leaf chlorosis
and to some extent, thinner canopies were observed in Salicornia virginica 13 days
after high levels o f cadmium treatment (Rosso et a l, 2005). Similarly, severe effects
o f cadmium on Spartina alterniflora leaf expansion were observed 5 days after
treatment (Mendelssohn et a l, 2001). Shoot mortality, stunting and a moderate
chlorosis were exhibited by Salicornia virginica 19 days after vanadium treatment
and growth was inhibited in S. virginica 10 and 32 days after being contaminated
with ‘Escravos’ and ‘Alba’ petroleum, respectively (Rosso et a l, 2005). These
studies give evidence that it can take a considerable time for plants to show visible
stress symptoms induced by pollution and that this time varies according to the type
* Part o f this chapter has been published in Proceedings o f the 33rd International Symposium on Rem ote Sensing o f Environment (ISRSE), Stressa, Italy. 8 -1 1th May, 2009.
65
of pollutant. Thus, relying solely on visual manifestation o f stress for early detection
o f stress may not be adequate.
Stress conditions in plants are known to result in changes in the reflectance
spectra o f leaves and canopies (Knipling, 1970; Noomen et al., 2003; Kempenneers
et al., 2005) that can be detected before symptoms can be observed visually (Carter
et al., 1996). In the latter study, herbicide-induced stress was detected 16 days prior
to the first visible signs o f damage. Alterations in plant biochemistry and cellular
composition imposed by environmental stressors produce changes in the reflectance
characteristics that can be detected using remote sensors (Rosso et a l, 2005). Indeed,
numerous studies have found a significant increase in visible reflectance and
decrease in near-infrared reflectance in response to various stresses (Carter, 1993;
Carter and Miller, 1994; Carter et al., 1996; De Oliveira, et al., 1997; Rosso et al.,
2005). In contrast, no significant reflectance changes were found in younger leaves
o f plants contaminated with heavy metal at sub lethal levels (Mendelssohn et al.,
2001). This was attributed to the immaturity o f the leaves, as spectral reflectance was
measured in the youngest fully expanded leaves, which were usually robust and
healthy.
A large and growing body o f literature has used changes in thermal properties
o f leaves or canopies to monitor stress, particularly water deficit. Plant temperature is
a valuable index for detection o f plant and canopy water status (Ehrler, 1973;
Jackson et al., 1977). Thus, it is worthwhile to investigate whether the thermal
properties o f leaf could serve as additional way o f detecting stress induced by oil
pollution. In some cases, combined spectral and thermal techniques have been
employed to provide rapid identification o f crop growth status (Al-Abbas et al.,
1974; Thomas and Gausman, 1977; Schepers et al., 1996; Gitelson et al., 2003; Raun
66
et al., 2005). Hence, the fusion o f spectral and thermal remote sensing techniques is
potentially o f value in the context of oil pollution.
This chapter deals with measurements and analysis of physiological, spectral
and thermal properties o f maize (Zea mays L.) contaminated with different levels of
oil. Maize was chosen as model species because in developing countries where oil
pollution is often a major problem affecting subsistence agriculture, maize is a
common crop type and yields of maize are set to double and surpass that o f wheat
and rice by 2020 (Pingali, 2001). Additionally, maize is an important crop which, in
its different processed forms, makes a large contribution towards feeding the world’s
populace and its livestock. Its by-products are used in the manufacture o f diverse
commodities including ethanol, glue, soap, paint, insecticides, toothpaste, shaving
cream, rubber tyres, rayon and moulded plastics. Oil pollution is known to affect
farmlands which are likely to incorporate maize, which is widely cultivated
throughout the world, and a greater weight of it is produced each year than any other
grain.
Measurements were undertaken at various times before and after visual stress
symptoms were seen. The time when significant changes in reflectance spectra and
thermal properties first occurred was compared with the time o f first visible stress
symptoms. Several spectral and thermal indices have been developed as viable stress
indicators, but the indices that are most sensitive to oil-induced stress in maize are
not known. In this study, the sensitivity o f a number o f stress indicators shall be
compared in order to discover which is optimal. Attempt is made to quantify the
effect o f refined oil on the photosynthesis, transpiration and stomatal conductance
activities o f maize. The physiological properties are correlated with spectral and
67
thermal properties in order to understand their relationships. The specific objectives
are:
i) To determine the efficacy o f spectral and thermal properties o f plants as
indicators for oil pollution.
ii) To determine an optimal remotely-sensed index for early detection o f oil-
induced stress in plants.
4.2 Pilot study
In order to improve the quality and efficiency o f this experiment, a feasibility
study was first undertaken to test logistics and gather useful information prior to the
actual experiments. There were key issues from the proposed experimental design
that needed clarification before undertaking further experiments. These include: (i)
working out appropriate dosage for each treatment level as standardised lethal and
sub lethal levels o f oil contamination are not known; (ii) assessing the appropriate
duration o f experiments; and (iii) developing methods o f data analysis. Overall, there
was the need to gain insight and understanding about the basic, technicalities and
operational principles of some o f the techniques that would be used. Apart from
clarifying the above methodological issues, the key aim o f the experimental study
was to investigate the effects o f heavy refined oil product (engine oil) on the spectral
reflectance properties o f two plant species, with two specific objectives:
(i) to examine how oil pollution at varying levels affect the spectral
properties of individual plant species.
(ii) to examine how different plant species respond to oil pollution.
68
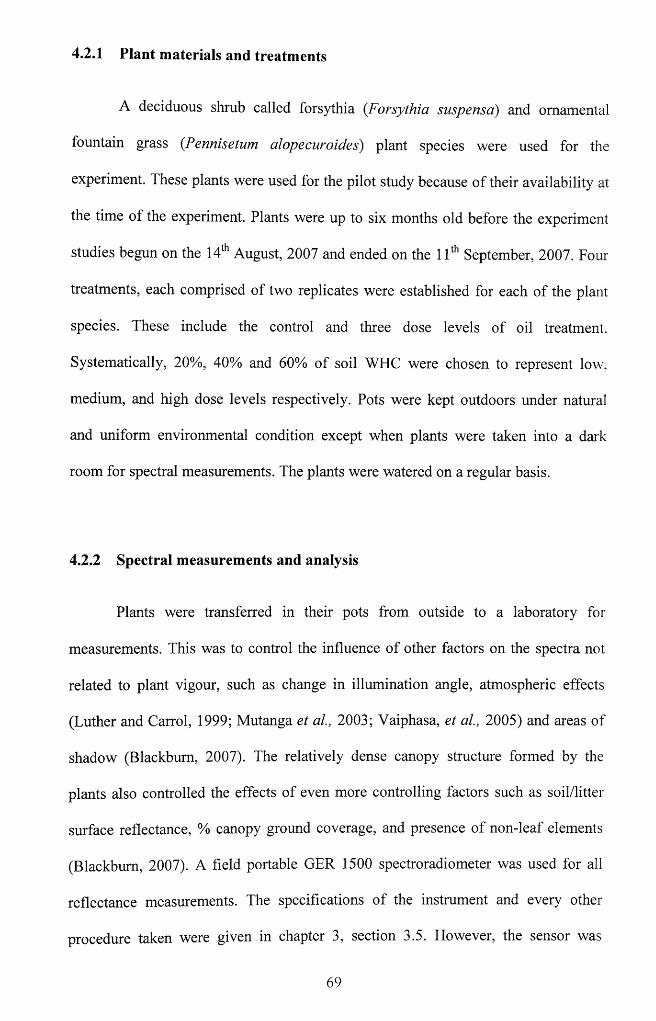
4.2.1 Plant materials and treatments
A deciduous shrub called forsythia (Forsythia suspensa) and ornamental
fountain grass (Pennisetum alopecuroides) plant species were used for the
experiment. These plants were used for the pilot study because o f their availability at
the time o f the experiment. Plants were up to six months old before the experiment
studies begun on the 14th August, 2007 and ended on the 11th September, 2007. Four
treatments, each comprised o f two replicates were established for each of the plant
species. These include the control and three dose levels o f oil treatment.
Systematically, 20%, 40% and 60% of soil WHC were chosen to represent low,
medium, and high dose levels respectively. Pots were kept outdoors under natural
and uniform environmental condition except when plants were taken into a dark
room for spectral measurements. The plants were watered on a regular basis.
4.2.2 Spectral measurements and analysis
Plants were transferred in their pots from outside to a laboratory for
measurements. This was to control the influence o f other factors on the spectra not
related to plant vigour, such as change in illumination angle, atmospheric effects
(Luther and Carrol, 1999; Mutanga et al., 2003; Vaiphasa, et a l, 2005) and areas of
shadow (Blackburn, 2007). The relatively dense canopy structure formed by the
plants also controlled the effects of even more controlling factors such as soil/litter
surface reflectance, % canopy ground coverage, and presence o f non-leaf elements
(Blackburn, 2007). A field portable GER 1500 spectroradiometer was used for all
reflectance measurements. The specifications o f the instrument and every other
procedure taken were given in chapter 3, section 3.5. However, the sensor was
69
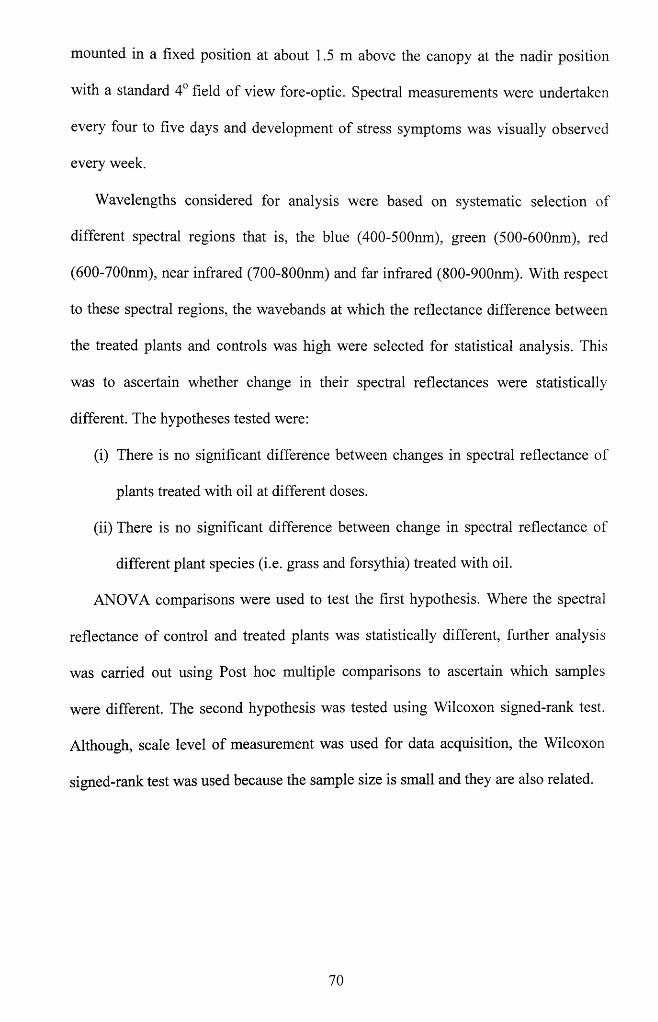
mounted in a fixed position at about 1.5 m above the canopy at the nadir position
with a standard 4° field o f view fore-optic. Spectral measurements were undertaken
every four to five days and development of stress symptoms was visually observed
every week.
Wavelengths considered for analysis were based on systematic selection of
different spectral regions that is, the blue (400-5OOnm), green (500-600nm), red
(600-700nm), near infrared (700-800nm) and far infrared (800-900nm). With respect
to these spectral regions, the wavebands at which the reflectance difference between
the treated plants and controls was high were selected for statistical analysis. This
was to ascertain whether change in their spectral reflectances were statistically
different. The hypotheses tested were:
(i) There is no significant difference between changes in spectral reflectance of
plants treated with oil at different doses.
(ii) There is no significant difference between change in spectral reflectance of
different plant species (i.e. grass and forsythia) treated with oil.
ANOVA comparisons were used to test the first hypothesis. Where the spectral
reflectance o f control and treated plants was statistically different, further analysis
was carried out using Post hoc multiple comparisons to ascertain which samples
were different. The second hypothesis was tested using Wilcoxon signed-rank test.
Although, scale level o f measurement was used for data acquisition, the Wilcoxon
signed-rank test was used because the sample size is small and they are also related.
70
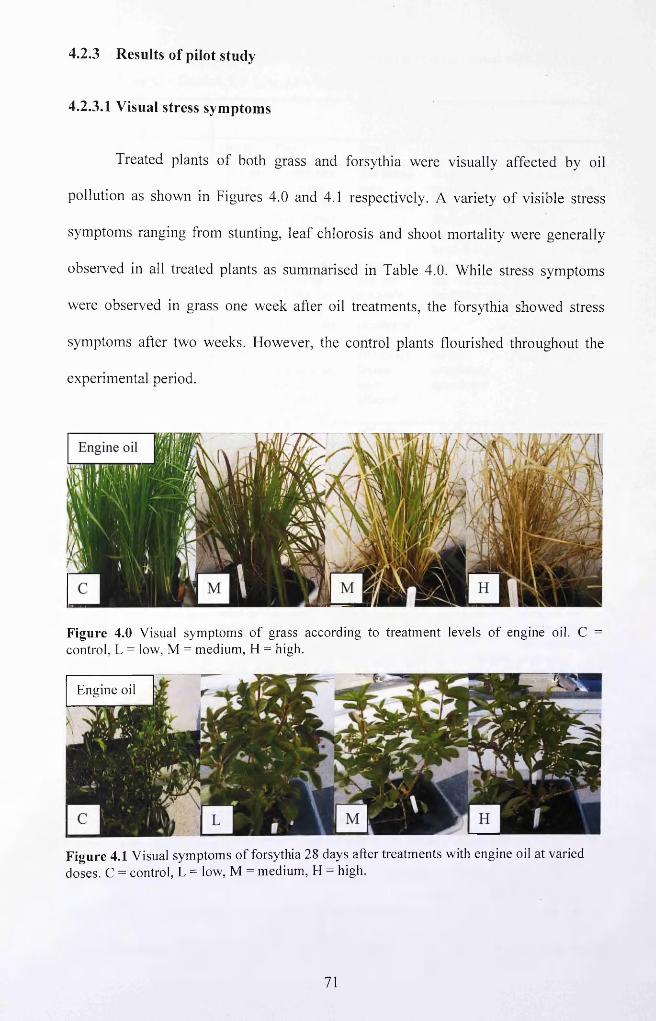
4.2.3 Results of pilot study
4.2.3.1 V isual stress sym ptom s
T reated p lan ts o f bo th grass and fo rsy th ia w ere v isually affec ted by oil
po llu tion as show n in F igures 4.0 and 4.1 respectively . A varie ty o f v isib le stress
sym ptom s rang ing from stunting, le a f ch lorosis and shoot m orta lity w ere generally
observed in all trea ted p lan ts as sum m arised in Table 4.0. W hile stress sym ptom s
w ere observed in grass one w eek after oil trea tm ents, the fo rsy th ia show ed stress
sym ptom s after tw o w eeks. H ow ever, the contro l p lan ts flourished th roughou t the
experim ental period.
Figure 4.0 Visual symptoms of grass according to treatment levels of engine oil. C = control, L = low, M = medium, H = high.
Engine oil
Figure 4.1 Visual symptoms of forsythia 28 days after treatments with engine oil at varied doses. C = control, L = low, M = medium, H = high.
71
Table 4.0 Visual stress symptoms of grass and forsythia contaminated with engine oil at
varied doses. C = Control, L = Low, M = Medium, H = High.
Plant Treatments Visual stress symptomspecie
D ay 0 Day 7 Day 14 Day 21 Day 28
Grass L same as growth rate few leaves few leaves few leavesabove declining were were partially were partially
w hile som e dehydrated dehydrated dehydratedleaves were w hile som e w hile som edehydrating change to
reddish brownchange to reddish brown
M same as growth rate same as same as low same as lowabove declining low but but with an but with an
w hile som e involves increased rate increased rateleaves are moredehydrating number o f
leavesH same as same as low alm ost all leaves plant death
above and medium but at relatively higher rate
leaveswereaffected
com pletelydehydrated
Forsy L same as same as still green very few very fewthia above above leaves
appeared paleleavesappeared pale while others remained green
M same as same as chlorosis similar similarabove above affecting
very few number o f leaves
symptoms as low
symptoms as low but affecting more number o f leaves
H sam e as same as same as similar som e o f theabove above the
medium but with an increased rate
sym ptoms as low but involves larger number o f leaves
leaves wilted and appeared pale and reddish brown, shoot mortality occurred
4.2.3.2 Spectral response to stress
The spectral reflectance of treated plants generally increased in the visible
and decreased in the NIR region of the spectrum relative to control. Figures 4.2 and
4.3 show the mean reflectance o f the treated plants and controls on the final day o f
the experiment. The pattern o f reflectance changes generally follows the dose level
72
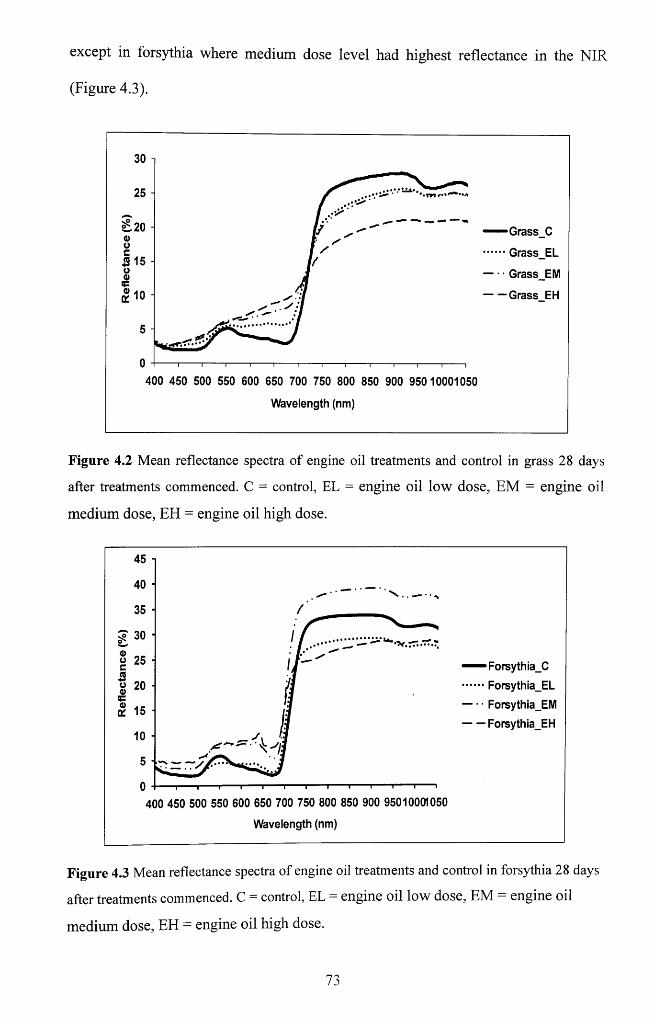
except in forsythia where medium dose level had highest reflectance in the NIR
(Figure 4.3).
25 -
Grass C
Grass EL3 15 - Grass EM
Grass EH
400 450 500 550 600 650 700 750 800 850 900 95010001050
Wavelength (nm)
Figure 4.2 Mean reflectance spectra of engine oil treatments and control in grass 28 days
after treatments commenced. C = control, EL = engine oil low dose, EM = engine oil
medium dose, EH = engine oil high dose.
45
40
35
30 •v.O 25
o 20m “ w
10
5
0400 450 500 550 600 650 700 750 800 850 900 95010001050
— Forsyth ia_C
••• Forsythia_EL
• • Forsythia_EM
— Forsythia_EH
Wavelength (nm)
Figure 4.3 Mean reflectance spectra of engine oil treatments and control in forsythia 28 days
after treatments commenced. C = control, EL = engine oil low dose, EM = engine oil
medium dose, EH = engine oil high dose.
73
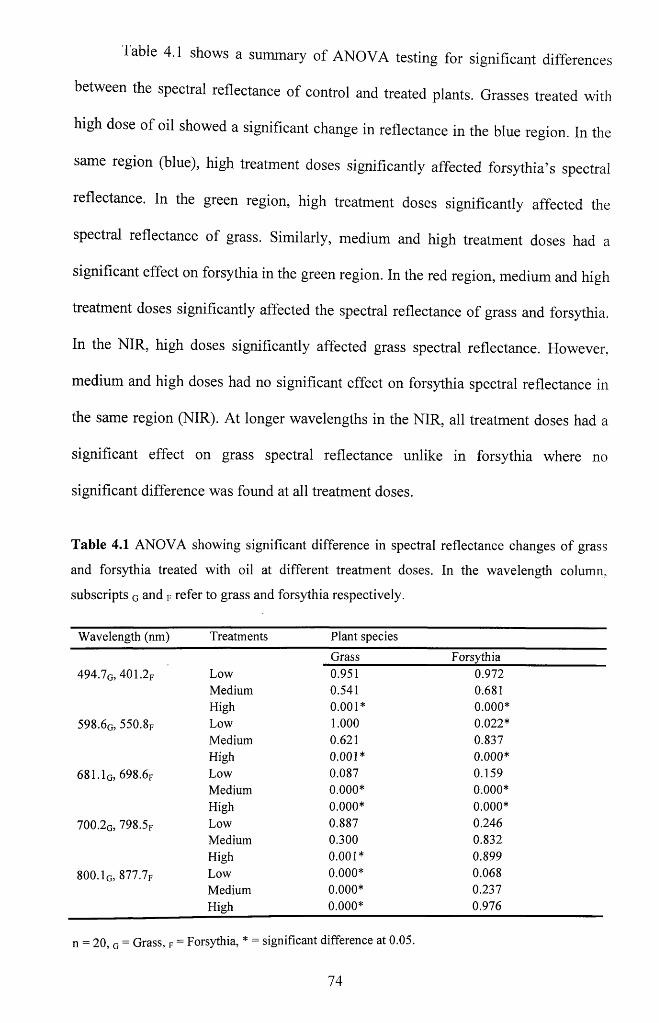
Table 4.1 shows a summary o f ANOVA testing for significant differences
between the spectral reflectance o f control and treated plants. Grasses treated with
high dose o f oil showed a significant change in reflectance in the blue region. In the
same region (blue), high treatment doses significantly affected forsythia’s spectral
reflectance. In the green region, high treatment doses significantly affected the
spectral reflectance of grass. Similarly, medium and high treatment doses had a
significant effect on forsythia in the green region. In the red region, medium and high
treatment doses significantly affected the spectral reflectance of grass and forsythia.
In the NIR, high doses significantly affected grass spectral reflectance. However,
medium and high doses had no significant effect on forsythia spectral reflectance in
the same region (NIR). At longer wavelengths in the NIR, all treatment doses had a
significant effect on grass spectral reflectance unlike in forsythia where no
significant difference was found at all treatment doses.
Table 4.1 ANOVA showing significant difference in spectral reflectance changes of grass
and forsythia treated with oil at different treatment doses. In the wavelength column,
subscripts G and F refer to grass and forsythia respectively.
W avelength (nm) Treatments Plant species
Grass Forsythia4 9 4 .7g, 401 .2 f Low 0.951 0.972
Medium 0.541 0.681High 0 .0 0 1 * 0 .0 0 0 *
598 .6g, 550 .8f Low 1 . 0 0 0 0 .0 2 2 *Medium 0.621 0.837High 0 .0 0 1 * 0 .0 0 0 *
6 8 1 .Iq, 698 .6f Low 0.087 0.159Medium 0 .0 0 0 * 0 .0 0 0 *High 0 .0 0 0 * 0 .0 0 0 *
700.2g, 798 .5f Low 0.887 0.246Medium 0.300 0.832High 0 .0 0 1 * 0.899
8 0 0 .1G, 877.7F Low 0 .0 0 0 * 0.068Medium 0 .0 0 0 * 0.237High 0 .0 0 0 * 0.976
n = 20, o = Grass, F = Forsythia, * = significant difference at 0.05.
74
There is a significant difference between changes in spectral reflectance of
grass and forsythia treated with engine oil at different levels at all waveband regions.
Except in the NIR where the ANOVA test showed no significant difference between
changes in spectral reflectance o f forsythia treated with oil at different levels. Thus,
the hypothesis that there is no significant difference between changes in spectral
reflectance o f plants treated with oil at different doses was rejected at all wavelengths
for the grass and accepted in the NIR for the forsythia only. A Wilcoxon signed-rank
test showed no significant difference (p = 0.109 > 0.05) between changes in spectral
reflectance o f grass and forsythia treated with engine oil. Thus, the hypothesis that
there is no significant difference between change in spectral reflectance o f different
plant species (i.e. grass and forsythia) treated with oil was accepted.
4.2.3.3 Discussion
Oil can flow through plant growing medium when spilled onto the soil
surface. Oil reached the plant root zone as it flowed through the soil substrates, given
that excesses were collected on the plastic bowls placed under the pots. The
estimated dose for each treatment level needed review. The treatment doses adopted
for the medium (40%) and low (20%) levels appeared to exhibit similar effects
particularly on the spectra. Thus, it suggests that the low treatment be reduced by
10%. In addition, plant response to oil doses varied with species and therefore, there
was the need to determine oil treatment doses for each species used in subsequent
experiments. Timing the experiment o f this kind was not straightforward as several
factors such as plant type or specie, type o f pollutant and level o f pollution influence
it. Plants have different levels o f sensitivity to stress, but can generally respond
75
quickly to high dose o f pollution and slowly if contaminated at a sub lethal level. On
average, it can take couple o f weeks for a potted plant to reach mortality level from
the time o f stress initiation. Visual observation and spectral reflectance features have
potential for monitoring oil pollution. Consequently, this potential shall be explored
further in subsequent experiments.
4.2.3.4 Conclusion
The visible region appears to be most sensitive to oil pollution for both plant
species. This is expected as it is the region o f strong chlorophyll absorption. Since
chlorophyll is responsible for light absorption particularly in the red, a higher
reflectance exhibited by the polluted plants in this region implies a decrease in
chlorophyll content. The low dose level (measured as 20% o f soil WHC) showed
similar spectral effects as the medium dose (measured as 40% of soil WHC). Thus,
in the next experiment, the low dose treatment will be reduced by 10% in order to
simulate more accurately a sub lethal level o f oil pollution. Plant response to oil
pollution varied with species and therefore, there may be the need to determine oil
treatment doses for each species used in subsequent experiments. Based on the stress
symptoms observed visually, forsythia appears to be more resistant to oil pollution
than grass. This could possibly be attributed to its strong root system that may have
stored sufficient resources needed to sustain plant growth. However, from the
progression o f stress observed in forsythia, one can predict that mortality will occur
if the experiment is continued for a longer period than that used in the present
experiment. This suggests that irrespective o f level o f oil pollution, duration of
exposure could also count as an important factor for assessing plant damage by oil
76
pollution. Thus, in subsequent experiments, measurements will continue until it
becomes impossible to take further measurements as a result o f plant mortality.
Overall, spectral reflectance, particularly in the visible region, appears to be a
potential indicator of oil stress that could be applicable across different plant species.
This pilot study indicates that the use o f spectral reflectance as an indicator o f oil-
induced stress is worthy o f further investigation, that may be focused particularly on
identifying appropriate analytical methods for quantifying spectral changes that are
most sensitive. The subsequent experiments shall exclusively, be undertaken in a
glasshouse and available resources will allow the use o f maize for the experiment.
4.3 Methods
This section describes distinctive approaches that were used to investigate the
efficacy o f spectral and thermal responses for early detection o f oil-induced stress in
maize. In addition to the use o f information and understanding that were gathered
from the pilot study, the methodology previously described in chapter 3 was adopted
in this experiment.
Four treatments comprised o f eight replicates were randomly selected from
fifty established plants. Each treatment represents the control, low, medium, and high
doses o f oil pollution. The pots were placed in plastic trays and labelled accordingly.
The doses were chosen in order to subject the plants to lethal and sub lethal levels
since oil pollution occurs at varied intensity. It was intended that the low and the
high dose levels represent the lethal and sub lethal levels respectively while the
medium dose stands as an intermediate level. The doses were determined by
calculating 10%, 30%, and 50% of the average soil WHC (see chapter 3, section 3.2)
77
to represent low, medium, and high levels respectively. Liquid fertilizer was applied
at intervals after about one week when plant growth had increased in order to avoid
nutrient deficiency.
The GER 1500 spectroradiometer (already discussed in chapter 3, section
3.5) was mounted in a fixed position, at nadir, 15 cm above each leaf blade to be
measured. An 8° fore-optic was used which covered an instantaneous field o f view
approximately 2cm diameter centered upon the midrib o f the leaf. The 500W halogen
lamp was mounted at a zenith angle o f 45° and at a distance o f 70cm from the leaf.
Leaf pigments and water content were not measured in this experiment. A summary
o f the individual narrow wavebands, spectral indices and normalised difference ratios
analysed is given in Table 4.2.
78
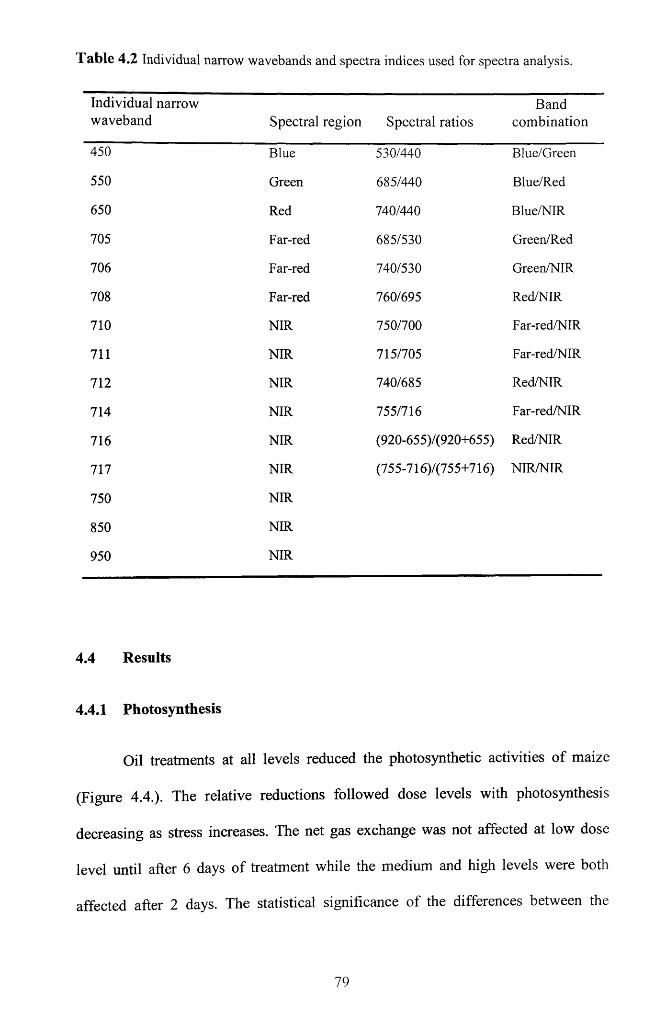
Table 4.2 Individual narrow wavebands and spectra indices used for spectra analysis.
Individual narrow waveband Spectral region Spectral ratios
Bandcombination
450 Blue 530/440 Blue/Green
550 Green 685/440 Blue/Red
650 Red 740/440 Blue/NIR
705 Far-red 685/530 Green/Red
706 Far-red 740/530 Green/NIR
708 Far-red 760/695 Red/NIR
710 NIR 750/700 Far-red/NIR
711 NIR 715/705 Far-red/NIR
712 NIR 740/685 Red/NIR
714 NIR 755/716 Far-red/NIR
716 NIR (920-655)/(920+655) Red/NIR
717 NIR (755-716)/(755+716) NIR/NTR
750 NIR
850 NIR
950 NIR
4.4 Results
4.4.1 Photosynthesis
Oil treatments at all levels reduced the photosynthetic activities o f maize
(Figure 4.4.). The relative reductions followed dose levels with photosynthesis
decreasing as stress increases. The net gas exchange was not affected at low dose
level until after 6 days o f treatment while the medium and high levels were both
affected after 2 days. The statistical significance o f the differences between the
79
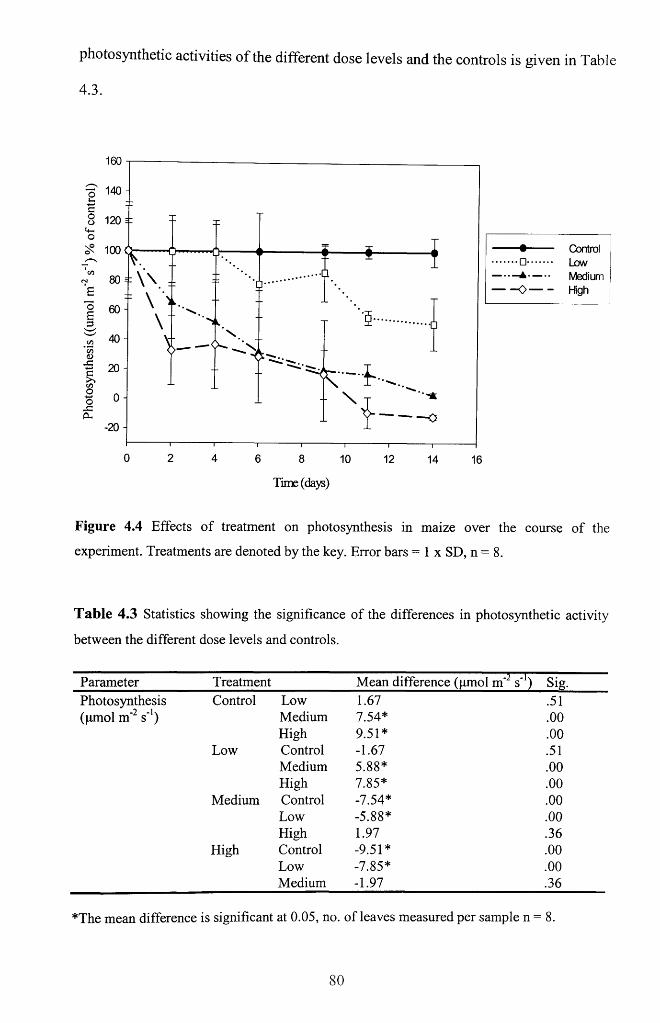
photosynthetic activities o f the different dose levels and the controls is given in Table
4.3.
coo<+-o
<L>-C
ooJC(X
160
140 -
120 i:
100
60
40 -
20 -
0-
-20 -
• W ....\ v.
V
t -
0
— o
\’?■
------ 0
6 8 10 12
Time (days)
14
Control
Medium" High
16
Figure 4.4 Effects of treatment on photosynthesis in maize over the course of the
experiment. Treatments are denoted by the key. Error bars = 1 x SD, n = 8.
Table 4.3 Statistics showing the significance of the differences in photosynthetic activity
between the different dose levels and controls.
Parameter Treatment Mean difference (pmol m‘“ s ) Sig.Photosynthesis Control Low 1.67 .51(|imol m'2 s"1) Medium 7.54* .00
High 9.51* .00Low Control -1.67 .51
Medium 5.88* .00High 7.85* .00
Medium Control -7.54* .00Low -5.88* .00High 1.97 .36
High Control -9.51* .00Low -7.85* .00Medium -1.97 .36
*The mean difference is significant at 0.05, no. of leaves measured per sample n = 8.
80
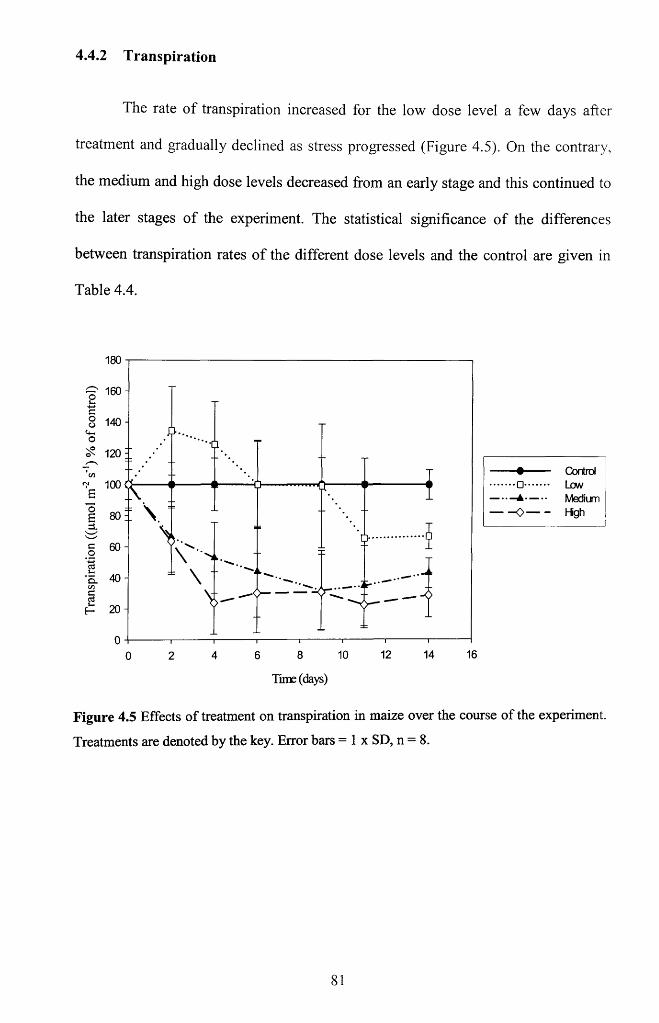
4.4.2 Transpiration
The rate o f transpiration increased for the low dose level a few days after
treatment and gradually declined as stress progressed (Figure 4.5). On the contrary,
the medium and high dose levels decreased from an early stage and this continued to
the later stages o f the experiment. The statistical significance o f the differences
between transpiration rates o f the different dose levels and the control are given in
Table 4.4.
180
160
140o£ 1201
£o£
100
60-
•q . 401cn §£ 20
V
V\
4--------------------- --
Control
Medium- High
-i--------- 1--------- 1--------- 1--------- 1------6 8 10 12 14 16
Time (days)
Figure 4.5 Effects of treatment on transpiration in maize over the course of the experiment.
Treatments are denoted by the key. Error bars = 1 x SD, n = 8.
81
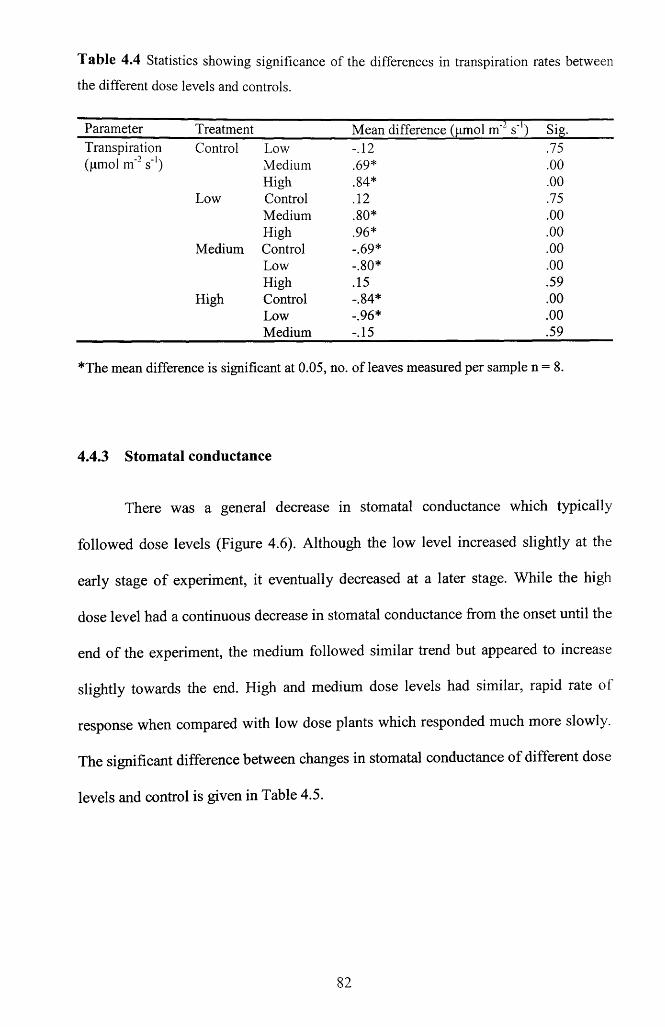
Table 4.4 Statistics showing significance of the differences in transpiration rates between
the different dose levels and controls.
Parameter Treatment Mean difference (pmol rrf2 s'1) Sig.Transpiration Control Low -.12 .75(jwmol m'2 s"1) Medium .69* .00
High .84* .00Low Control .12 .75
Medium .80* .00High .96* .00
Medium Control -.69* .00Low -.80* .00High .15 .59
High Control -.84* .00Low -.96* .00Medium -.15 .59
*The mean difference is significant at 0.05, no. of leaves measured per sample n = 8.
4.4.3 Stomatal conductance
There was a general decrease in stomatal conductance which typically
followed dose levels (Figure 4.6). Although the low level increased slightly at the
early stage o f experiment, it eventually decreased at a later stage. While the high
dose level had a continuous decrease in stomatal conductance from the onset until the
end o f the experiment, the medium followed similar trend but appeared to increase
slightly towards the end. High and medium dose levels had similar, rapid rate o f
response when compared with low dose plants which responded much more slowly.
The significant difference between changes in stomatal conductance o f different dose
levels and control is given in Table 4.5.
82
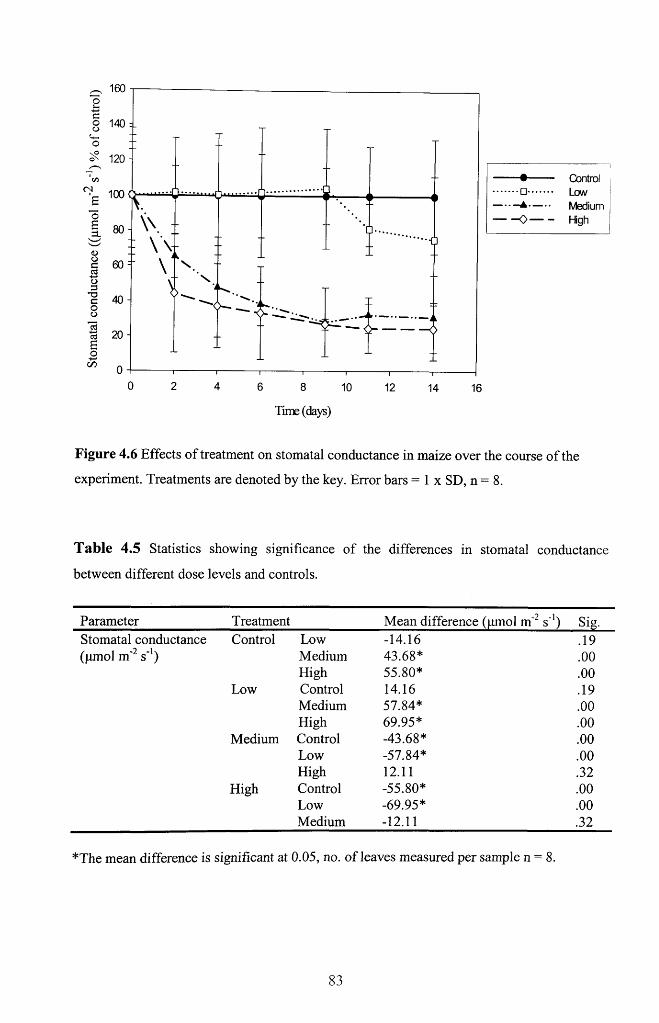
o 160 oi-§ 140
o£ 120
<NsoE3.
4>Oc+->o3•oco01£o
+->C/5
1 0 0 (
8 0 - \ \ -
60 :■ \
i40 -
2 0 -
0 -
» ■• 6
\\
8 -— <►
-O
V— \>-— c>
I---------I—4 6
~i---------1---------1—8 10 12
.......
0-
— Control Low Medium
- High
14 16
Time (days)
Figure 4.6 Effects of treatment on stomatal conductance in maize over the course of the
experiment. Treatments are denoted by the key. Error bars = 1 x SD, n = 8.
Table 4.5 Statistics showing significance of the differences in stomatal conductance
between different dose levels and controls.
Parameter_____________ Treatment_____________ Mean difference (pmol m~2 s'1) Sig.Stomatal conductance Control Low -14.16 .19(pmol m'2 s'1) Medium 43.68* .00
High 55.80* .00Low Control 14.16 .19
Medium 57.84* .00High 69.95* .00
Medium Control -43.68* .00Low -57.84* .00High 12.11 .32
High Control -55.80* .00Low -69.95* .00Medium -12.11 .32
*The mean difference is significant at 0.05, no. of leaves measured per sample n = 8.
83
4.4.4 Visual stress observations
Expectedly, treatments caused different visible stress symptoms such as leaf
chlorosis, rolling and wilting, the thinning of canopies and slower growth in maize
and these increased with dosage and duration o f stress (Figure 4.7). About five days
after oil stress initiation, the controls and treated plants did not show any signs o f
stress visually. The plants flourished and appeared healthy and green. On the sixth
day, there was slight chlorosis on some o f the leaves o f the high dose level plants. By
the eleventh day, the medium and high levels showed symptoms o f stress such as
shoot and leaf chlorosis, thinner canopies and to some extent growth reduction. The
low dose plants exhibited a moderate leaf chlorosis after fourteen days while medium
and high showed severe wilting and general mortality at that stage. The control
plants did not show any visual symptoms o f stress at any time throughout the
experimental period.
M ed iu mC ontrol
F ig u r e 4 .7 V isu a l stress sym p tom s o f m a ize accord in g to d o se le v e ls 14 d ays after treatm ent.
84
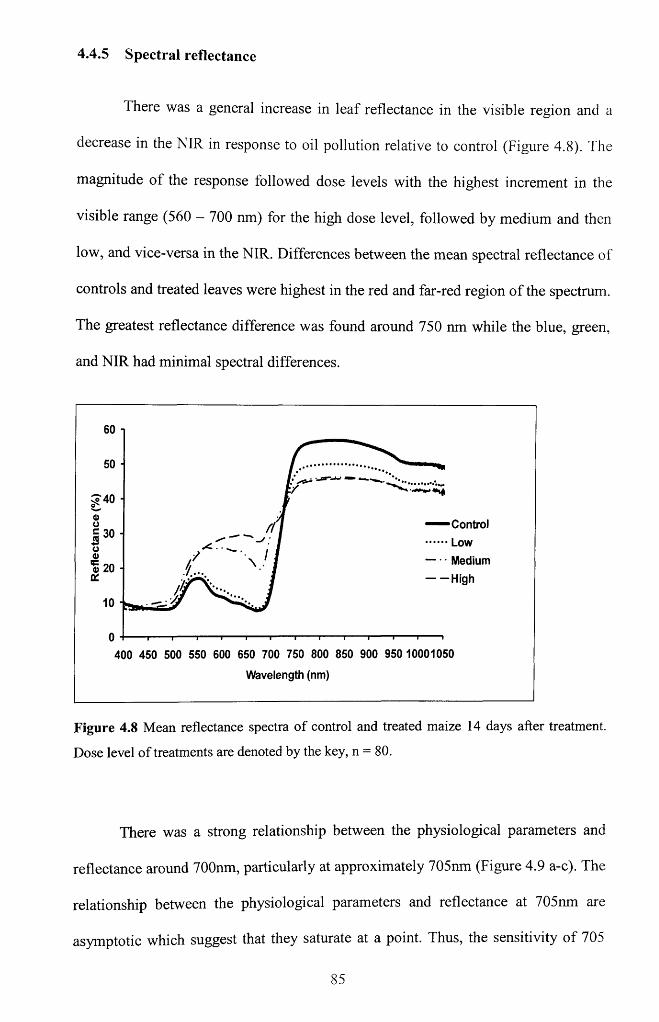
4.4.5 Spectral reflectance
There was a general increase in leaf reflectance in the visible region and a
decrease in the NIR in response to oil pollution relative to control (Figure 4.8). The
magnitude o f the response followed dose levels with the highest increment in the
visible range (560 - 700 nm) for the high dose level, followed by medium and then
low, and vice-versa in the NIR. Differences between the mean spectral reflectance of
controls and treated leaves were highest in the red and far-red region o f the spectrum.
The greatest reflectance difference was found around 750 nm while the blue, green,
and NIR had minimal spectral differences.
— Control Low Medium High
= 30 •
® 20 -
400 450 500 550 600 650 700 750 800 850 900 950 10001050
Wavelength (nm)
Figure 4.8 Mean reflectance spectra of control and treated maize 14 days after treatment.
Dose level of treatments are denoted by the key, n = 80.
There was a strong relationship between the physiological parameters and
reflectance around 700nm, particularly at approximately 705nm (Figure 4.9 a-c). The
relationship between the physiological parameters and reflectance at 705nm are
asymptotic which suggest that they saturate at a point. Thus, the sensitivity o f 705
85
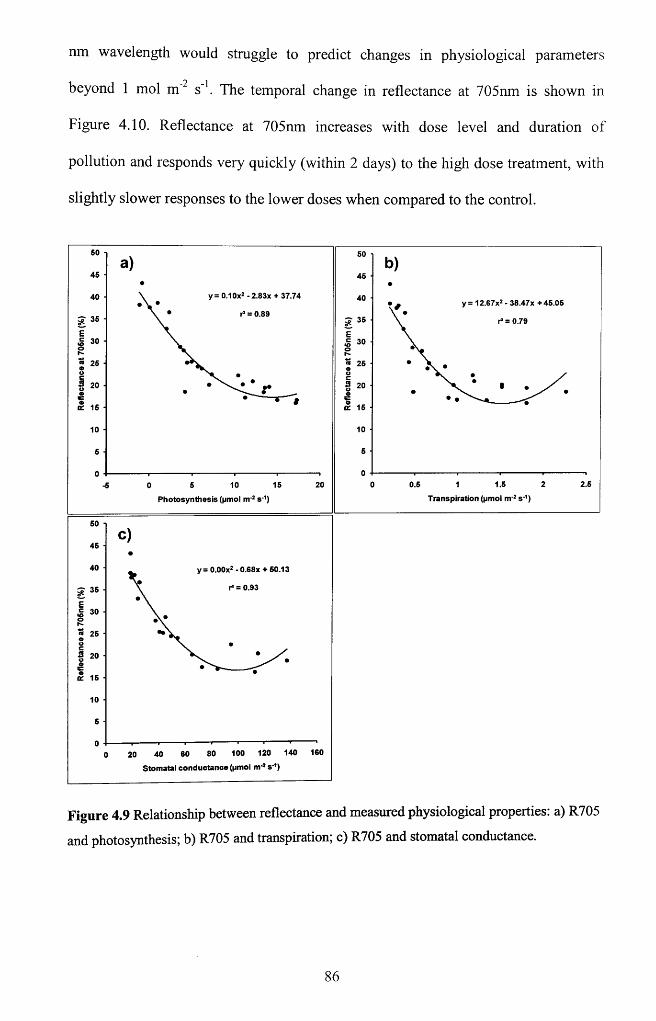
nm wavelength would struggle to predict changes in physiological parameters
beyond 1 mol m 2 s \ The temporal change in reflectance at 705nm is shown in
Figure 4.10. Reflectance at 705nm increases with dose level and duration of
pollution and responds very quickly (within 2 days) to the high dose treatment, with
slightly slower responses to the lower doses when compared to the control.
50 5046 ■ 45
y = 0.1 Ox2 -2.83x + 37.7440 40 y = 12.67x2 - 38.47x +45.05r* as 0.89
5 36 - r* = 0.79
« 25 n 25
OC 15
1010 -
1 1.5
T ranspiration (pmol n r2 s '1)
2.50.520
P ho tosyn thesis (pmol m-2 s '1)
45
40 y = O.OOx2 - 0.68x + 60.13
I* = 0.93C? 36 •
3 20
a . 15
10 -
40 60 80 100 120 140 160
Stom atal conduc tance (pmol nrv2 s 1)20
Figure 4.9 Relationship between reflectance and measured physiological properties: a) R705
and photosynthesis; b) R705 and transpiration; c) R705 and stomatal conductance.
86
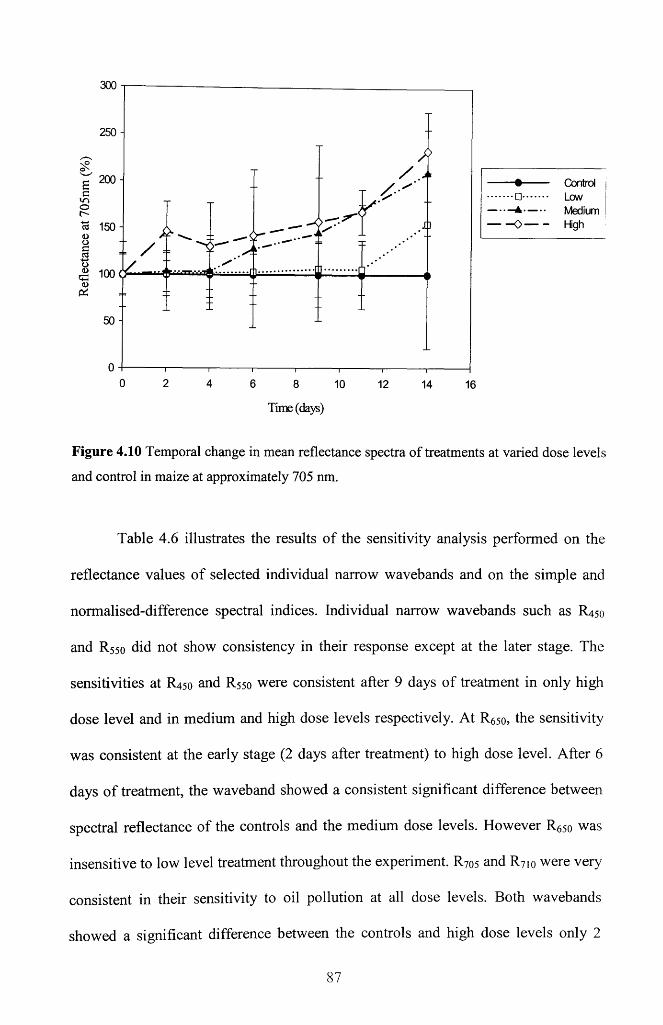
• ------- Control j □........ Low A Medium I— - O High
0 2 4 6 8 10 12 14 16
Tims (days)
Figure 4.10 Temporal change in mean reflectance spectra of treatments at varied dose levels
and control in maize at approximately 705 nm.
Table 4.6 illustrates the results o f the sensitivity analysis performed on the
reflectance values o f selected individual narrow wavebands and on the simple and
normalised-difference spectral indices. Individual narrow wavebands such as R450
and R 550 did not show consistency in their response except at the later stage. The
sensitivities at R450 and R550 were consistent after 9 days o f treatment in only high
dose level and in medium and high dose levels respectively. At R65o, the sensitivity
was consistent at the early stage (2 days after treatment) to high dose level. After 6
days o f treatment, the waveband showed a consistent significant difference between
spectral reflectance o f the controls and the medium dose levels. However R650 was
insensitive to low level treatment throughout the experiment. R705 and R 7i0 were very
consistent in their sensitivity to oil pollution at all dose levels. Both wavebands
showed a significant difference between the controls and high dose levels only 2
87
cot"
o<L><D&
250 -
200 -
100
5 0 -
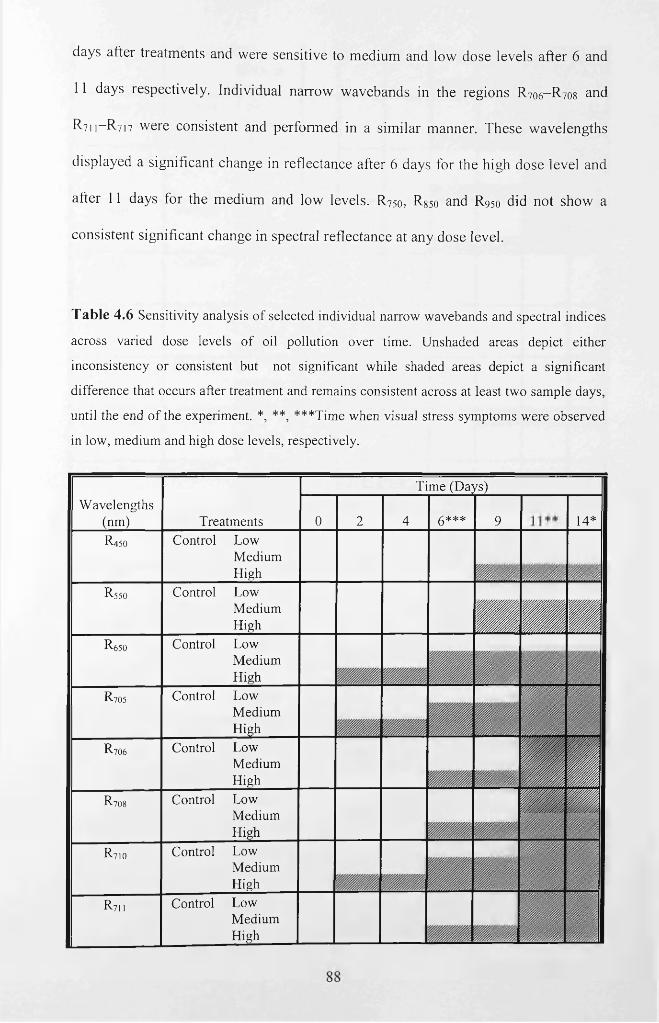
days after treatments and were sensitive to medium and low dose levels after 6 and
11 days respectively. Individual narrow wavebands in the regions R706-R 708 and
R711-R 717 were consistent and performed in a similar manner. These wavelengths
displayed a significant change in reflectance after 6 days for the high dose level and
after 11 days for the medium and low levels. R750, Rsso and R950 did not show a
consistent significant change in spectral reflectance at any dose level.
Table 4.6 S en sitiv ity an a ly s is o f se lec ted ind iv idual narrow w a veb an d s and spectral in d ice s
across varied d o se le v e ls o f o il p o llu tio n over tim e. U n sh a d ed areas d ep ict e ither
in co n s is ten cy or co n sisten t but not sign ifican t w h ile shad ed areas d ep ict a s ig n ifica n t
d ifferen ce that occu rs after treatm ent and rem ains co n sisten t across at least tw o sam p le d ays,
un til the end o f the experim ent. *, ** , * * * T im e w h en v isu a l stress sy m p to m s w ere o b serv ed
in lo w , m ed iu m and h igh d o se le v e ls , resp ective ly .
W a v e len g th s(n m ) T reatm ents
T im e (D a y s)
0 2 4 (}*** 9 1 4 *
R450 C ontrol L owM ed iu mH igh _ _ _ _ _
R550 C ontrol L owM ed iu mH igh
JJJjjJIIIR650
R705
R 7O6
R 7O8
R 7IO
R 7II
C ontrol L owM ed iu mH igh
C ontrol L owM ed iu mH igh
C ontrol L owM ed iu mH igh
C ontrol L owM ed iu mH igh
C ontrol L owM ed iu mH igh
C ontrol L owM ed iu mH igh
1 1
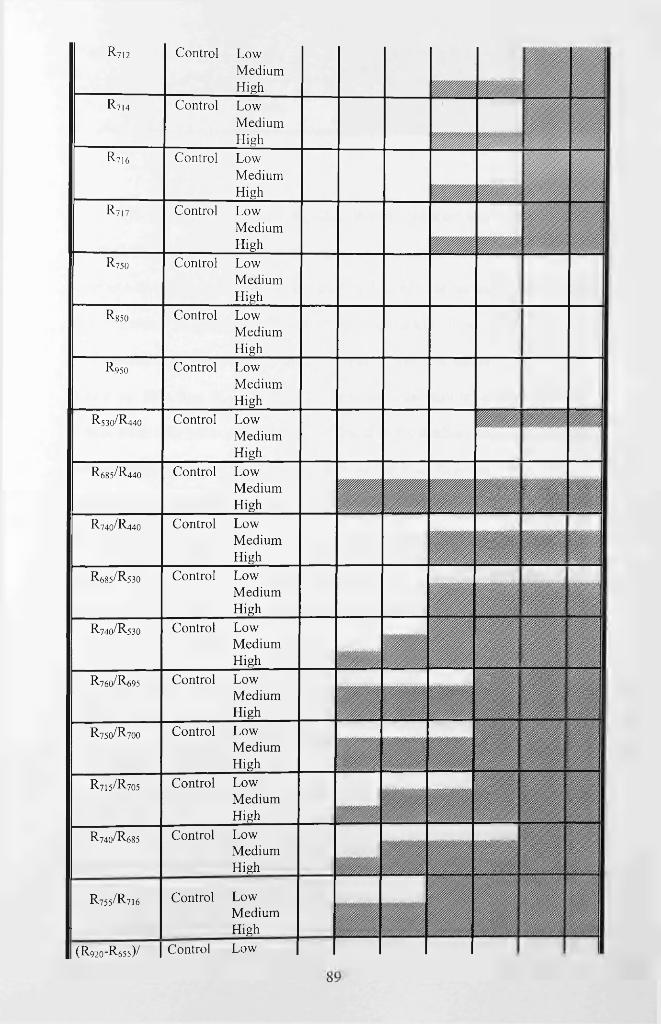
R7 1 2 Control LowMediumHigh
R7 1 4 Contro LowMediumHigh
R716 Contro LowMediumHigh
R717 Contro LowMediumHigh
R750 Contro LowMediumHigh
R850 Contro LowMediumHigh
R,950 Contro LowMediumHigh
R530/R440 Contro LowMediumHigh
R685/R440 Contro LowMediumHigh
R740/R440 Contro LowMediumHigh
R685/R530 Contro LowMediumHigh
R740/R530 Contro LowMediumHigh
R760/R695 Contro LowMediumHigh
R750/R700 Contro LowMediumHigh
R715/R705 Contro LowMediumHigh
R740/R685 Contro LowMediumHigh
R755/R716 Control LowMediumHigh
( R , 20- R 655)/ I Control Lew
999999999999999999^
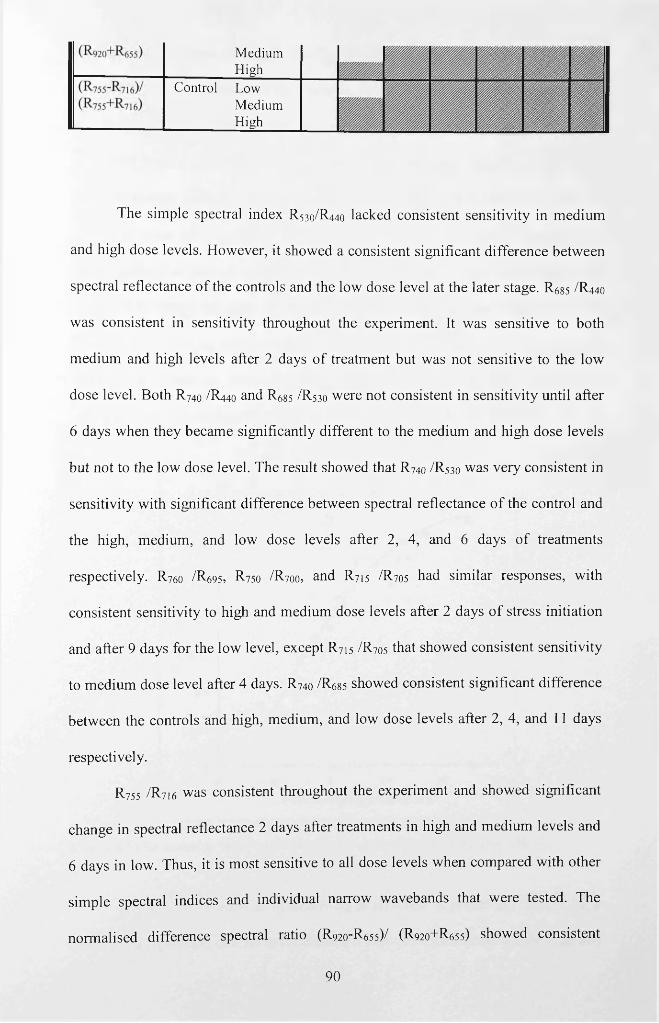
MediumHigh
Control LowMedium
_________ High
The simple spectral index R530/R440 lacked consistent sensitivity in medium
and high dose levels. However, it showed a consistent significant difference between
spectral reflectance o f the controls and the low dose level at the later stage. R.685 /R440
was consistent in sensitivity throughout the experiment. It was sensitive to both
medium and high levels after 2 days o f treatment but was not sensitive to the low
dose level. Both R740 /R440 and R685 /R530 were not consistent in sensitivity until after
6 days when they became significantly different to the medium and high dose levels
but not to the low dose level. The result showed that R740 /R 530 was very consistent in
sensitivity with significant difference between spectral reflectance o f the control and
the high, medium, and low dose levels after 2, 4, and 6 days o f treatments
respectively. R76o /R-695, R750 /R700, and R715 /R705 had similar responses, with
consistent sensitivity to high and medium dose levels after 2 days o f stress initiation
and after 9 days for the low level, except R7i5 /R 705 that showed consistent sensitivity
to medium dose level after 4 days. R74o /R 685 showed consistent significant difference
between the controls and high, medium, and low dose levels after 2, 4, and 11 days
respectively.
R755 /R716 was consistent throughout the experiment and showed significant
change in spectral reflectance 2 days after treatments in high and medium levels and
6 days in low. Thus, it is most sensitive to all dose levels when compared with other
simple spectral indices and individual narrow wavebands that were tested. The
normalised difference spectral ratio (R920-R655)/ (R920+R655) showed consistent
90
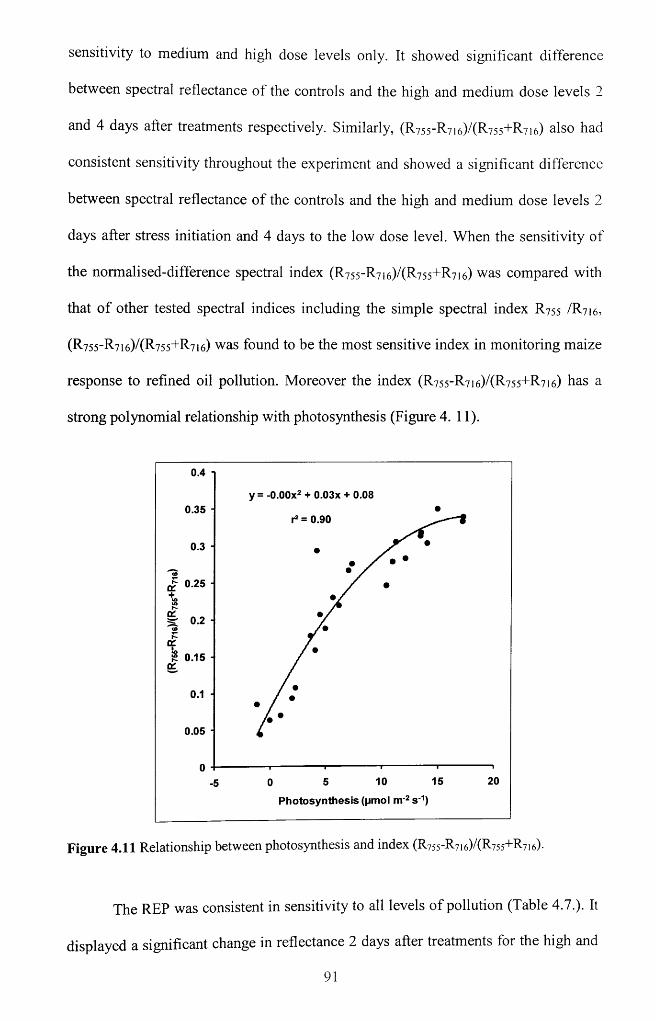
sensitivity to medium and high dose levels only. It showed significant difference
between spectral reflectance o f the controls and the high and medium dose levels 2
and 4 days after treatments respectively. Similarly, (R755-R7 i6)/(R755~ R7 i6) also had
consistent sensitivity throughout the experiment and showed a significant difference
between spectral reflectance o f the controls and the high and medium dose levels 2
days after stress initiation and 4 days to the low dose level. When the sensitivity of
the normalised-difference spectral index (R755-R7 i6)/(R755+R7 i6) was compared with
that o f other tested spectral indices including the simple spectral index R 755 /R 716,
(R755-R716)/(R755+R 716) was found to be the most sensitive index in monitoring maize
response to refined oil pollution. Moreover the index (R755-R7 i6)/(R755+R7 i6) has a
strong polynomial relationship with photosynthesis (Figure 4. 11).
y = -O.OOx2 + 0.03x + 0.080.35 ■
r2 = 0.90
0.25 ■
0.15 ■
0.05 ■
155 10Photosynthesis (pmol nr2 s 1)
Figure 4.11 R elation sh ip b etw een p h o to sy n th esis and in d ex (R 755-R7i6)/(R755+R7i6)-
The REP was consistent in sensitivity to all levels o f pollution (Table 4.7.). It
displayed a significant change in reflectance 2 days after treatments for the high and
91
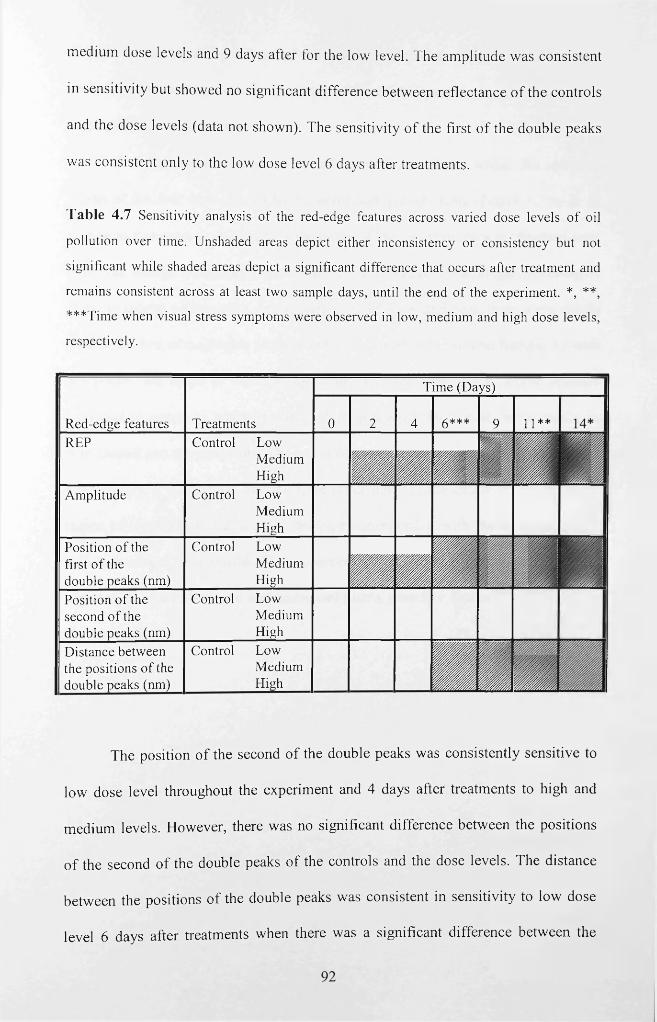
medium dose levels and 9 days after for the low level. The amplitude was consistent
in sensitivity but showed no significant difference between reflectance o f the controls
and the dose levels (data not shown). The sensitivity o f the first o f the double peaks
was consistent only to the low dose level 6 days after treatments.
Table 4.7 Sensitivity analysis o f the red-edge features across varied dose levels o f oil
pollution over time. Unshaded areas depict either inconsistency or consistency but not
significant while shaded areas depict a significant difference that occurs after treatment and
remains consistent across at least two sample days, until the end o f the experiment. *, **,
***Time when visual stress symptoms were observed in low, medium and high dose levels,
respectively.
Time (Days)
Red-edge features Treatments 0 2 4 5*** 9 j]* *
REP Control LowMediumHigh iiiiig 1 111!
Amplitude Control LowMediumHigh
Position o f the first o f the double peaks (nm)
Control LowMediumHigh mml! jjJ!
Position o f the second o f the double peaks (nm)
Control LowMediumHigh
Distance between the positions o f the double peaks (nm)
Control LowMediumHigh H i
The position of the second o f the double peaks was consistently sensitive to
low dose level throughout the experiment and 4 days after treatments to high and
medium levels. However, there was no significant difference between the positions
o f the second o f the double peaks o f the controls and the dose levels. The distance
between the positions of the double peaks was consistent in sensitivity to low dose
level 6 days after treatments when there was a significant difference between the
9999999
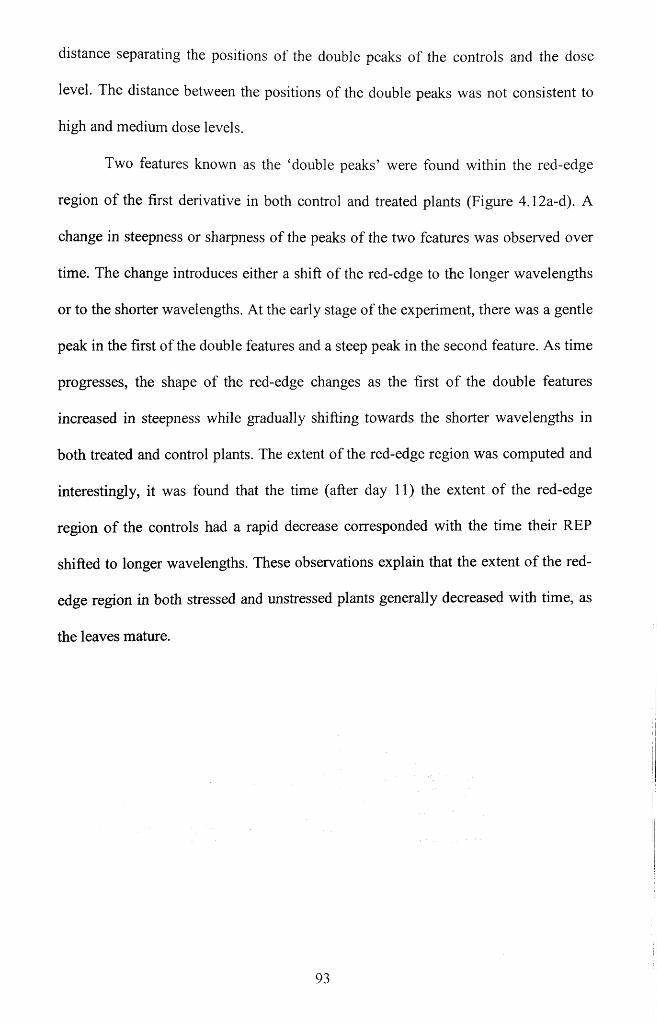
distance separating the positions of the double peaks o f the controls and the dose
level. The distance between the positions o f the double peaks was not consistent to
high and medium dose levels.
Two features known as the ‘double peaks’ were found within the red-edge
region o f the first derivative in both control and treated plants (Figure 4.12a-d). A
change in steepness or sharpness o f the peaks o f the two features was observed over
time. The change introduces either a shift o f the red-edge to the longer wavelengths
or to the shorter wavelengths. At the early stage o f the experiment, there was a gentle
peak in the first o f the double features and a steep peak in the second feature. As time
progresses, the shape o f the red-edge changes as the first o f the double features
increased in steepness while gradually shifting towards the shorter wavelengths in
both treated and control plants. The extent o f the red-edge region was computed and
interestingly, it was found that the time (after day 11) the extent o f the red-edge
region o f the controls had a rapid decrease corresponded with the time their REP
shifted to longer wavelengths. These observations explain that the extent o f the red-
edge region in both stressed and unstressed plants generally decreased with time, as
the leaves mature.
93
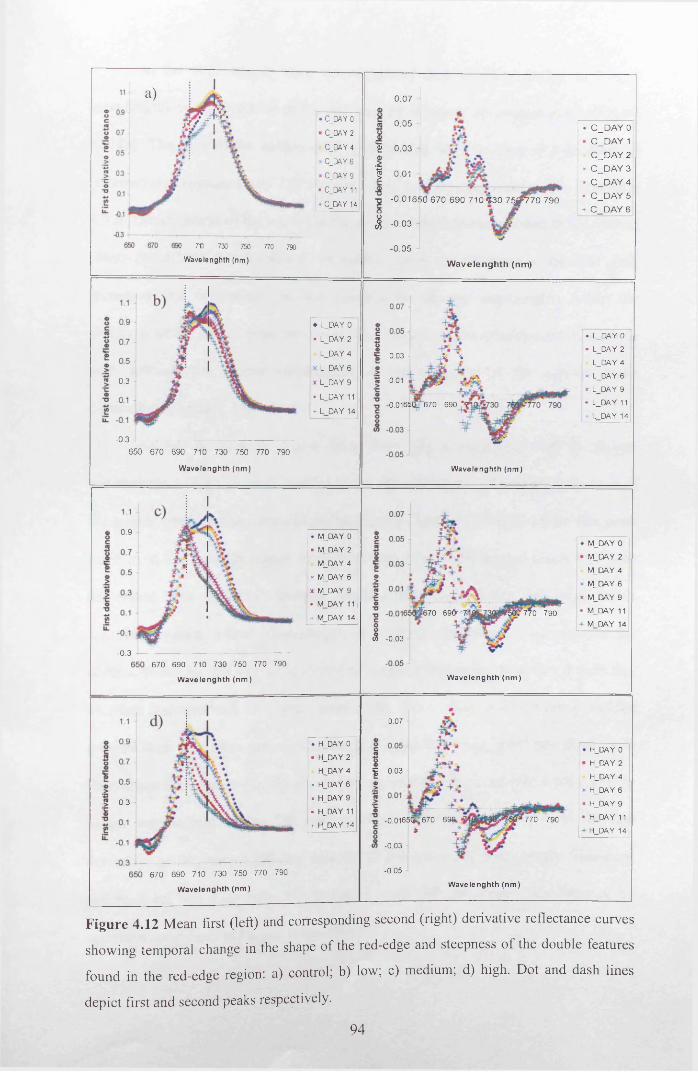
a)T MI*/ ,
- C_CAY 0
' C_DAY 2
C_DAY4
: C_Q4Y 6
: C_DAY 9
C_QAY 11
-C DAY 14
) 7t) 730 750
Wavelenghth (nm)770 790
« 0 3
♦ L_DAY 0
■ L_DAY 2
L_DAY 4
x L_DAY6
x L_DAY 9
• L_DAY 11
+ L DAY 14
-0.3650 6 70 690 710 730 750 770 790
Wavelenghth (nm)
0.07
0.05
1 0.03
.£| 0.01
-0 .01650 670 690 7 1 0 * 3 0 75fip770 790
| -0.03
-0.05
* 3 0 7 ^ 7 7 0 790
W avelenghth (nm)
Wavelenghth (nm)
C _D A Y 0 C_DAY 1 C _D A Y 2 C _D A Y 3 C _D A Y 4 C _D A Y 5 C DAY 6
0.03 1 i t \
0.01 eh
0.0165 Q_: 670 690
• L_DAY 0
■ L_DAY 2
L_DAY 4
X L_DAY 6
x L_DAY 9
• L_DAY 11
+ L DAY 14
0,9 • M_DAY0
• M_DAY 2
M_DAY4
x M_DAY 6
x M_DAY9
• M DA Y 11
+ M DAY 14
-0 .3670 690 710 730 750 770 790
Wavelenghth (nm)
70 6 9 0 '7- 770 790
# -0.03
Wavelenghth (nm)
M_DAY 0
M_DAY 2
M_DAY 4
M _DAY6
M_DAY 9
M_DAY 11
M DAY 14
0.3
. H_DAY 0
• H_DAY 2
H_DAY 4
x H_DAY 6
x H_DAY9
• H_DAY 11
+ H DAY 14
0.07
§ 0.03
0.0165(J»J,670 69ft.
* +-0.03
770 790
670 690 710 730 750 770 790
Wavelenghth (nm)
-0.05
Wavelenghth (nm)
H_DAY 0
H_DAY2
H_DAY 4
H_DAY 6
H_DAY9
H_DAY 11
H DAY 14
Figure 4.12 M e a n first (le ft) and corresp on d in g se c o n d (r igh t) d er iv a tiv e r e fle c ta n c e c u r v e s
s h o w in g tem p o ra l ch a n g e in the sh ap e o f the red -ed g e and s te e p n e ss o f th e d o u b le fea tu res
fo u n d in th e red -ed g e reg ion : a) control; b) low ; c ) m ed iu m ; d) h ig h . D o t and d a sh lin e s
d e p ic t first and se c o n d p eak s resp ec tiv e ly .
94

At the later stages, there was a sudden shift o f the red-edge to longer
wavelengths as the steepness of the first peak decreased in the control plants (Figure
4. 12a). The time of the sudden shift corresponded with the time o f a decrease in
reflectance at approximately 750 nm (see Figure 4.10) as mentioned earlier in section
4.3.6. The steepness o f the second o f the double peaks was not affected in the control
plants throughout the experiment. In treated plants, the steepness o f the first peak
increased and consistently shifted towards the shorter wavelengths while the
steepness o f the second peak decreased. This resulted to the development o f a single
peak towards the shorter wavelengths as the steepness o f the second peaks
diminishes (Figure 4. 12b - d).
As can be seen in Figure 4.13, there was a consistent shift to shorter
wavelengths o f the first peak position in the red-edge region o f the first derivative o f
the treated plants when compared to the controls. The rate o f shifts o f the first peak
position in the red-edge region o f the first derivative o f the treated plants was dose
dependent. The statistical analysis revealed that the medium and high levels
significantly shift to shorter wavelengths from day 2 onwards when compared to the
control. However, the low level shifted to longer wavelengths from day 6 until day
14 when it shifted back to shorter wavelengths. The medium and high levels had the
greatest shift thus, there was no significant difference between these two dose levels
throughout the experiment. By the end o f the experiment, there was a total shift to
longer wavelengths in the first peak position in the red-edge region o f the first
derivative o f the control and low dose by 12 nm and 5 nm, respectively. However,
the medium and high dose levels had a total shift to shorter wavelengths by
approximately 4 nm and 6 nm, respectively.
95
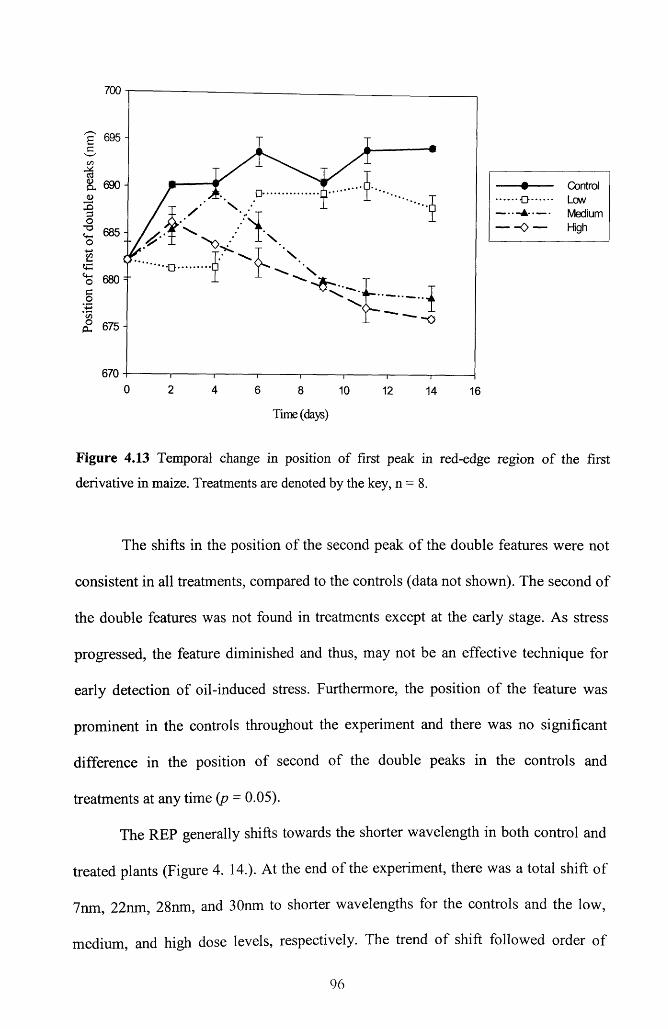
700
/g ' 695 -
ControlLowMediumHigh
6700 2 4 6 8 10 12 14 16
Time (days)
Figure 4.13 Temporal change in position of first peak in red-edge region of the first
derivative in maize. Treatments are denoted by the key, n = 8.
The shifts in the position of the second peak o f the double features were not
consistent in all treatments, compared to the controls (data not shown). The second o f
the double features was not found in treatments except at the early stage. As stress
progressed, the feature diminished and thus, may not be an effective technique for
early detection o f oil-induced stress. Furthermore, the position o f the feature was
prominent in the controls throughout the experiment and there was no significant
difference in the position o f second of the double peaks in the controls and
treatments at any time (p = 0.05).
The REP generally shifts towards the shorter wavelength in both control and
treated plants (Figure 4. 14.). At the end o f the experiment, there was a total shift o f
7nm, 22nm, 28nm, and 30nm to shorter wavelengths for the controls and the low,
medium, and high dose levels, respectively. The trend o f shift followed order o f
96
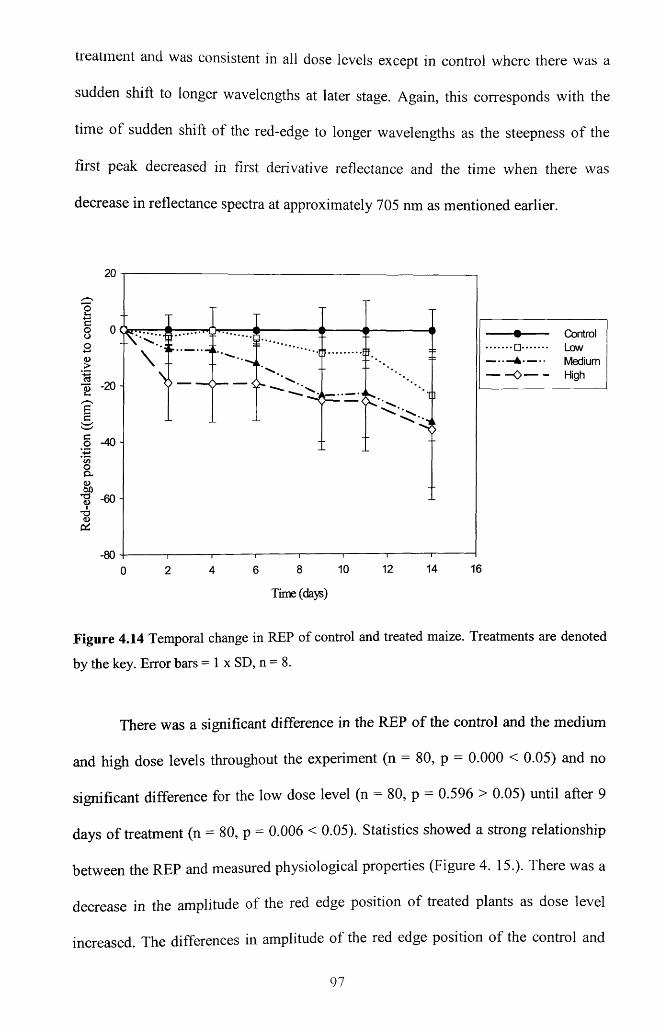
tieatment and was consistent in all dose levels except in control where there was a
sudden shift to longer wavelengths at later stage. Again, this corresponds with the
time o f sudden shift of the red-edge to longer wavelengths as the steepness o f the
first peak decreased in first derivative reflectance and the time when there was
decrease in reflectance spectra at approximately 705 nm as mentioned earlier.
ControlLowMediumHigh
-20 -
-40-
CL
-8014 16121086420
Time (days)
Figure 4.14 Temporal change in REP of control and treated maize. Treatments are denoted
by the key. Error bars = 1 x SD, n = 8.
There was a significant difference in the REP o f the control and the medium
and high dose levels throughout the experiment (n = 80, p = 0.000 < 0.05) and no
significant difference for the low dose level (n - 80, p = 0.596 > 0.05) until after 9
days o f treatment (n = 80, p = 0.006 < 0.05). Statistics showed a strong relationship
between the REP and measured physiological properties (Figure 4. 15.). There was a
decrease in the amplitude of the red edge position o f treated plants as dose level
increased. The differences in amplitude o f the red edge position o f the control and
97
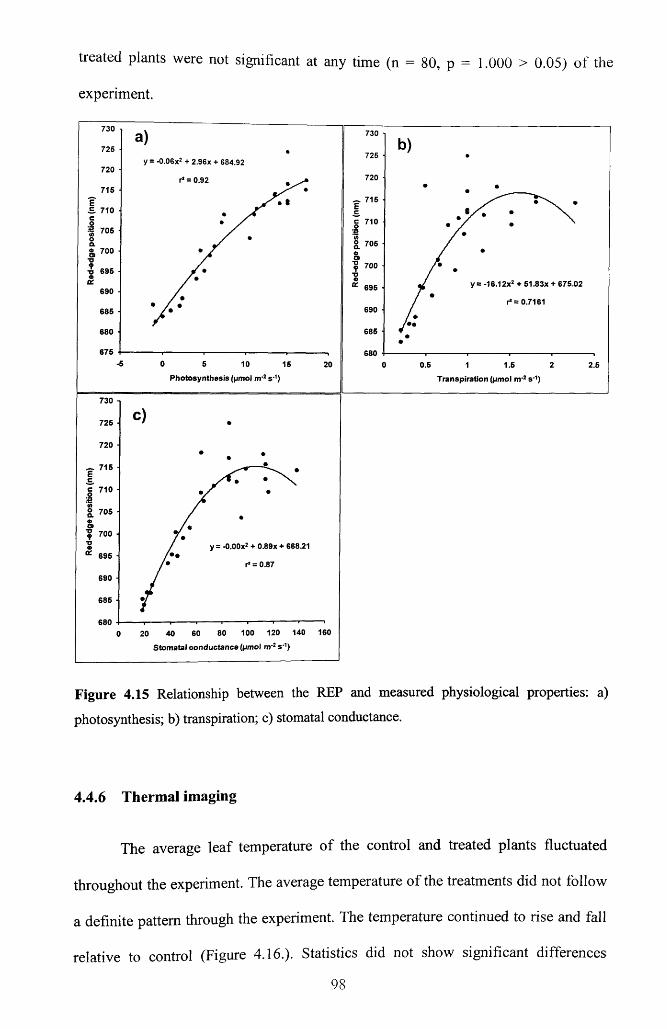
treated plants were not significant at any time (n = 80, p = 1.000 > 0.05) o f the
experiment.
730 730
725725
y = -0.06x2 + 2.96x + 684.92720
720r* = 0.92715
_ 715=. 710
c 7102 705
2 705® 700
700■D 695
y = -16.12x2 + 51.83x + 675.02695690r* = 0.7161
690685
685680
675 6800.5 1 1.5
Transpiration (pmol m*2 s*1)
2.5P ho tosyn thesis (pmol n r2 s -1)
730
725
720 •
~ 715
c 710 •
2 705
700 ■y = -O.OOx2 + 0.89X + 668.21
r1 = 0.87695 -
690
685 -
68080 100 120 140 16040
Stom atal conduc tance (pmol n r2 s '1)20
Figure 4.15 Relationship between the REP and measured physiological properties: a)
photosynthesis; b) transpiration; c) stomatal conductance.
4.4.6 Thermal imaging
The average leaf temperature o f the control and treated plants fluctuated
throughout the experiment. The average temperature o f the treatments did not follow
a definite pattern through the experiment. The temperature continued to rise and fall
relative to control (Figure 4.16.). Statistics did not show significant differences
98
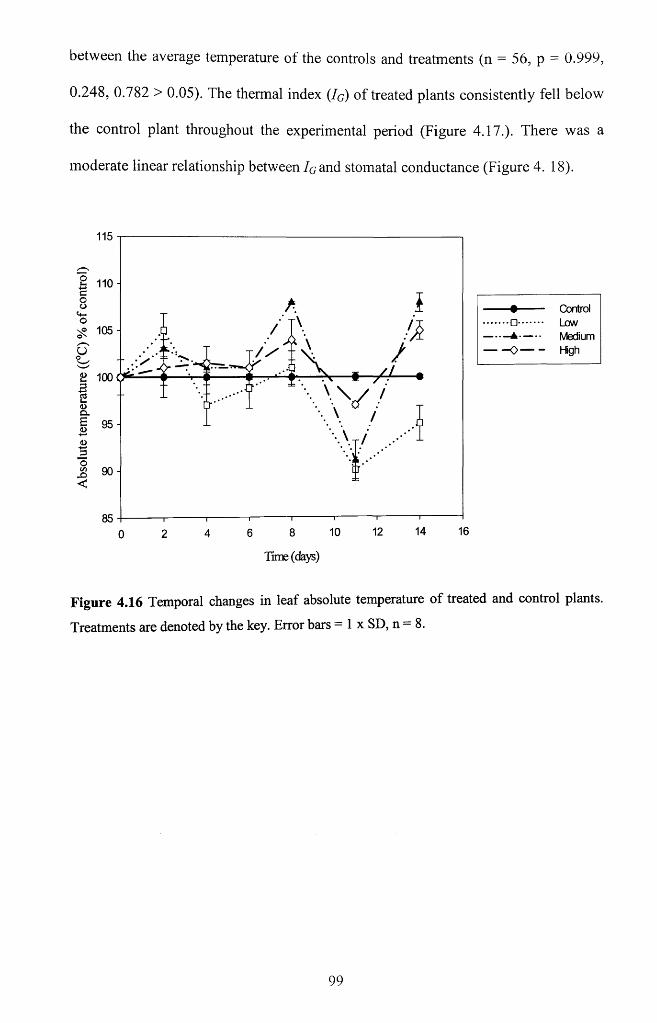
between the average temperature of the controls and treatments (n = 56, p = 0.999,
0.248, 0.782 > 0.05). The thermal index (Ic) o f treated plants consistently fell below
the control plant throughout the experimental period (Figure 4.17.). There was a
moderate linear relationship between I q and stomatal conductance (Figure 4. 18).
115
110 -
105 -
/ /
Vv /90 -
1614121086420
------• ------ Control........□......... Low------A---- Medium------0 ----- High
Time (days)
Figure 4.16 Temporal changes in leaf absolute temperature of treated and control plants.
Treatments are denoted by the key. Error bars = 1 x SD, n = 8.
99
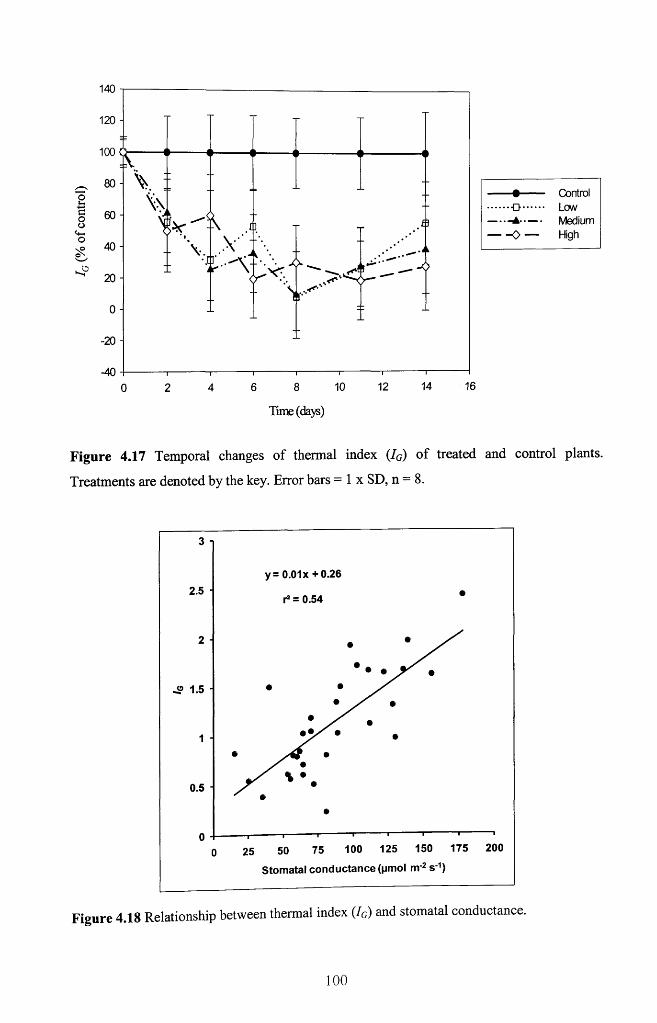
140
120
100
80 H
Sr
oo<+*o£5
40 -j
20
o H
-20
-40
V I
.
- V X■Jr . . A i \ •• A jr \ v*r | -0
o 6 8 10
Time (days)
12 14
------ • ------ Control.......-D....... Low----- A----- Medium------ 0 — High
16
Figure 4.17 Temporal changes of thermal index (IG) of treated and control plants.
Treatments are denoted by the key. Error bars = 1 x SD, n = 8.
3
y= 0.01x +0.262.5
r2 = 0.54
2
1.5
1
0.5
0100 125 150 175 2007550250
Stomatal conductance (Mmol nr2 s 1)
Figure 4.18 Relationship between thermal index (/G) and stomatal conductance.
100
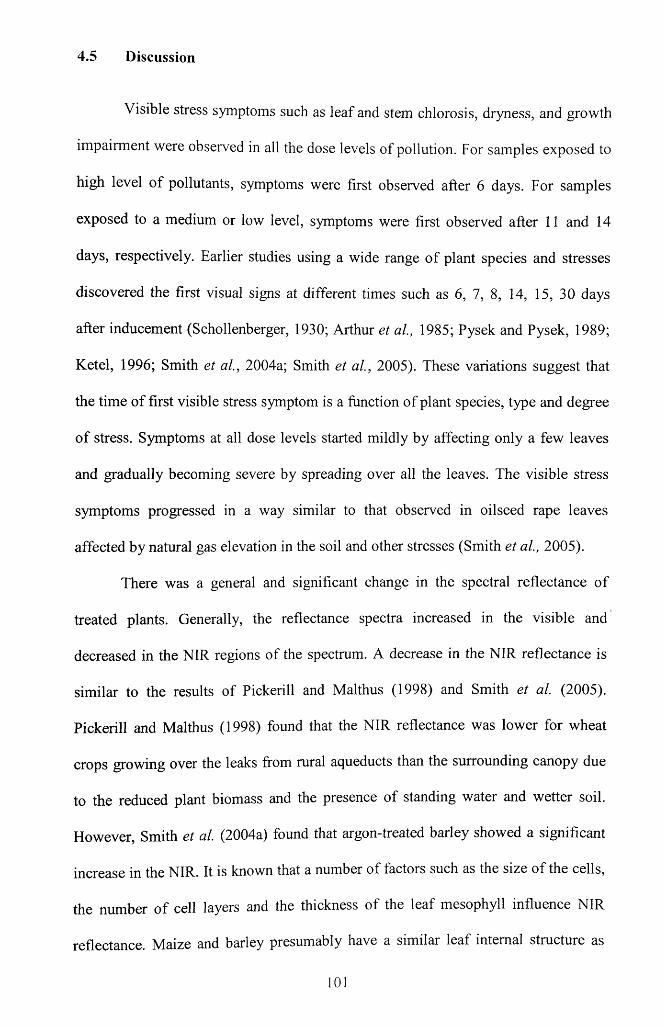
4.5 Discussion
Visible stress symptoms such as leaf and stem chlorosis, dryness, and growth
impairment were observed in all the dose levels of pollution. For samples exposed to
high level o f pollutants, symptoms were first observed after 6 days. For samples
exposed to a medium or low level, symptoms were first observed after 11 and 14
days, respectively. Earlier studies using a wide range o f plant species and stresses
discovered the first visual signs at different times such as 6, 7, 8, 14, 15, 30 days
after inducement (Schollenberger, 1930; Arthur et al., 1985; Pysek and Pysek, 1989;
Ketel, 1996; Smith et al., 2004a; Smith et al., 2005). These variations suggest that
the time o f first visible stress symptom is a function o f plant species, type and degree
o f stress. Symptoms at all dose levels started mildly by affecting only a few leaves
and gradually becoming severe by spreading over all the leaves. The visible stress
symptoms progressed in a way similar to that observed in oilseed rape leaves
affected by natural gas elevation in the soil and other stresses (Smith et al., 2005).
There was a general and significant change in the spectral reflectance o f
treated plants. Generally, the reflectance spectra increased in the visible and
decreased in the NIR regions o f the spectrum. A decrease in the NIR reflectance is
similar to the results of Pickerill and Malthus (1998) and Smith et al. (2005).
Pickerill and Malthus (1998) found that the NIR reflectance was lower for wheat
crops growing over the leaks from rural aqueducts than the surrounding canopy due
to the reduced plant biomass and the presence o f standing water and wetter soil.
However, Smith et al. (2004a) found that argon-treated barley showed a significant
increase in the NIR. It is known that a number o f factors such as the size o f the cells,
the number o f cell layers and the thickness o f the leaf mesophyll influence NIR
reflectance. Maize and barley presumably have a similar leaf internal structure as
101
monocotyledons, thus, reflectance ditferences exhibited by the two plant species may
be associated with the extent of damage in the leaf internal structure. The effects of
the stressors on the leaf internal structure may have varied due to their different
chemical compositions. Differences in the NIR response could also be related to their
different surface characteristics such as hairs/waxes and moisture content. The leaf o f
a monocotyledon is more compacted with fewer air spaces (Gausman, 1985)
consequently, these have lower NIR reflectance. In this case, the air spaces may have
further been closed-up by oil if oil is being transported from the roots to the leaves or
the cellular turgor and leaf structure may have deteriorated due to indirect effects o f
the oil on the plant water relations. In a field experiment that investigated the
physical and chemical effects of oils on mangrove, it was found that the
concentrations o f hydrocarbons in leaves increased with increasing oil application to
the sediments, although the effects varied in the different species (Suprayogi and
Murray, 1999).
Significant spectral reflectance change was found mainly in the red-edge
region o f the spectrum particularly across 650nm to 720nm. A study by Carter
(1993) found that increased reflectance in the 685 to 700nm wavelengths range was
constantly sensitive to different stresses across species. Changes in the spectral
reflectance were not significant towards the longer wavelengths o f the near-infrared,
particularly at the early stage and as dose levels decreased. Carter (1993) found that
the infrared reflectance shorter than 1400 nm was comparatively unresponsive to
stress. This suggests that the spectral reflectance at the longer wavelengths may not
be a good diagnostic measure for monitoring oil pollution in leaves. Individual
narrow wavebands around R70o were more consistent in sensitivity than those around
R65o and the shorter wavelengths. While wavebands around 700 nm could show
102
significant changes in spectral reflectance at all dose levels, those around 650 nm
only responded significantly to higher dose levels. Similarly, the blue (R450) and
green (R550) only responded significantly to higher dose levels o f pollution at the
later stages o f the experiment. The NIR (R750, Rsso, R950) did not perform very well
in their response to oil pollution irrespective o f the dose level.
The red and green waveband ratio R685/R 530 significantly increased as stress
progressed and was sensitive to medium and high treatments at later stages o f the
experiment but not to the low dose level. This observation was similar to findings o f
Smith et al. (2005) where the ratio increased rapidly in the gas and herbicide-stressed
plants. This could be related to increases in reflectance in the strong chlorophyll
absorption region due to a decrease in pigment contents and high reflectance in the
green region resulting from a weaker absorption o f the pigments. A stable and high
sensitivity shown by the simple ratios that ranged between R715 - 760 and R695 - R 716
concurred with the findings o f (Tarpley et al., 2000). Tarpley et al. (2000) noted that
a combination o f the red-edge measure with a waveband o f high reflectance in the
NIR region could improve precision and accuracy in predicting cotton leaf nitrogen
concentrations. The normalised difference ratio (R755-R7i6)/(R755+R7i6) that
combined these two wavebands was highly sensitive in terms o f temporal change and
consistency in sensitivity. This index showed a significant change 2 days after
treatments in high and medium dose levels whereas stress symptoms were visually
shown only 6 and 11 days after for the high and medium dose levels respectively.
While this index showed changes after 4 days for the low dose level, stress
symptoms were seen visually some 14 days after stress initiation. Coops et al.
(2003); Goel et al. (2003); Ferri et al. (2004); Zhao et al. (2005) when working on a
103
single crop type/species recognised the superiority and efficiency o f a normalised
difference ratio that employs just two narrow wavebands.
A consistent and significant shift o f the REP to shorter wavelengths in treated
plants showed that this was a reliable spectral parameter for early detection o f oil-
induced stress. The shift o f the REP was strongly related to a decrease in
photosynthesis and thus, chlorophyll contents and other biochemical concentrations.
Rock et al. (1988) showed that the REP o f foliage stress o f spruce trees caused by air
pollution shifted to shorter wavelengths. Other physiological factors like the stomatal
conductance and transpiration may have influenced the REP in some way given the
correlation found in the regression analysis. A study showed that the REP is
dependent not only on chlorophyll content, but also on additional effects such as leaf
developmental stage, leaf layering or stacking and leaf water content (Horler et a l,
1983). Early shift o f the REP to shorter wavelengths after contamination indicates its
potentials for early stress detection. Interestingly, this might not be true in all cases
because the REP of the controls also made early shifts to shorter wavelengths.
However, as stress persists, the control suddenly shifted to longer wavelength while
treated plants maintained shifts to shorter wavelength.
Similarly, Smith et al. (2004a) found that the position o f the red-edge moved
to longer wavelengths for control bean plants as they matured, but not for treated
plants. Leaf developmental stage is likely to be a suitable argument in case o f various
shifts o f the REP in control given variation in plant age during the period o f spectral
measurements. Plant leaves in their early immature and later senescent phases are
associated with low concentrations o f pigments (Blackburn, 2007). Furthermore, past
studies showed that the red-edge shifts associated with phenological crop
104
development were towards longer wavelengths as chlorophyll concentration
increased with crop maturity (Horler et a l, 1983; Miller et a l, 1991).
The results indicate that the REP is a valuable technique not only for early
stress detection at varied levels of oil pollution but also for long term stress
monitoring owing to its continuous and significant shifts to shorter wavelengths
found at the early and later stages in treated plants. Several studies found a shift to
shorter wavelengths o f the REP by natural vegetation with low chlorophyll content
due to long term stress (Lang et a l, 1985a, 1985b; Crawford, 1986; Reid, 1988;
McCoy et a l, 1989; Cwick et a l, 1995; De Oliveria and Crosta, 1996).
The amplitude o f the first derivative reflectance in the region o f the red edge
showed no significant increase or decrease in treated plants. Although there was the
tendency for the amplitude to be either minimally changed or to decrease, with only
low treatment showing pronounced increment at later stages o f the experiment.
Smith et a l (2004a) found similar results where changes in the amplitude o f the first
derivative at the position o f the red-edge was not consistent, and could either
increase or decrease relative to the control. The inconsistency could be related to a
variation in steepness of the double peaks which either increases or decreases.
Change in steepness of one of the double peaks tends to affect the other in the
opposite way. This was observed particularly in treated plants where the steepness o f
the first o f the double peaks increased with a decrease in the second peak. It is
recognized that the absorption features o f pigments and other biochemical
constituents overlap (Blackburn, 2007), and variation in amplitude may have resulted
from change in the ratio of chlorophyll a and b contents o f the leaf.
An increase in the steepness of the first o f the double peaks also causes a shift
o f the red-edge to shorter wavelengths. This may be attributed to a possible
105
narrowing of the strong chlorophyll absorption feature due to a decreased amount o f
chlorophyll. When the steepness o f the second peak increased, there tends to be shift
o f the red-edge to longer wavelengths. This was observed in control plants at the
later stages o f the experiment which corresponds with the time when there was a
sudden shift o f the REP to longer wavelengths and a sharp decrease in reflectance at
high chlorophyll absorption wavelengths. This implies that the positions o f the
double features could serve as possible indicators of oil stress. Llewellyn and Curran
(1999) found that the dominance o f the shorter wavelength feature indicated
grasslands with high levels o f soil contamination whereas the longer wavelength
feature indicated lower levels o f contamination. Thus, dominance o f the first peak
means low chlorophyll content whereas dominance o f the second peak corresponds
with high chlorophyll levels (Lamb et a l, 2002). These findings help in
understanding the behavioral pattern o f the first and second o f the double features in
first derivative recorded in the present experiment. The positions o f the first o f the
double peaks performed as well as the distance between the double features and both
were superior to visual observations as early stress indicators.
Leaf temperature fluctuated as stress progressed irrespective o f dose level and
did not differ significantly between treated and control plants. Similarly, a field
experimental study o f herbicide-induced stress in a mixed stand o f 5 year old loblolly
pine (Pinus taeda L.) and slash pine (Pinus elliottii Engelm) did not show a
significant difference in canopy temperatures between the treated and control plots
(Carter et al., 1996). The study attributed this to a coupling o f leaf temperatures with
air temperature, and an equalization of temperatures among treatments due to wind
and environmental moisture. Grant et al. (2006) detected no significant differences
between the leaf temperature o f grapevine subjected to water stress and those well
106
ted with water. This was related to greater environmental variation inevitable in an
experiment with relatively large plants across a greenhouse. This may well explain
the inconsistency in thermal responses observed in this study.
The consistent decrease in the thermal index (/c) o f treated plants as
percentage o f control is likely to be responding to the reduction in the transpiration
and stomatal conductance of treated plants. This implies that Iq is a more sensitive
parameter for quantifying plant stress induced by oil pollution than ordinary leaf
temperature. Theoretically, I q is expected to be linearly related to stomatal
conductance (Jones, 1999) and this was the case in the present study. Tilling et al.
(2007) found that nitrogen treatments had no effect on canopy temperature o f field
grown wheat. Generally, the influence o f nitrogen treatments on canopy temperature
was minor compared with the effect o f water treatment. Several workers have
successfully applied techniques of thermography to monitor water stress, across a
wide range o f species in controlled environments and field conditions (Leinonen and
Jones, 2004; Cohen et al., 2005; Grant et a l, 2007; Moller et al., 2007;). Thus, most
applications o f thermal imaging have related to monitoring plant responses to water
deficit stress (Jones, 2004). Greater levels o f confidence have been established about
thermal techniques for acquiring accurate information about plant water status than
any other stresses. With regard to the present experiment, to explore if the
inconsistency in absolute temperature o f treated plants was mainly due to effects o f
variations in environmental conditions and/or instrumental error or mere insensitivity
to oil pollution, there is the need to measure and compare plant thermal responses to
both water and oil-induced stress within a more constrained environment. This could
be achieved by taking measurements in a dark room where only an artificial source
o f illumination is provided.
107
From these results, it has been shown that spectral reflectance is a more
sensitive and reliable parameter for detection of refined oil-induced stress in maize
than the visual observations and thermal responses. Significant changes in spectral
reflectance were detected at all dose levels before visual stress signs were seen.
W hile there was consistent and significant changes in spectral reflectance
particularly around 700 nm, changes in absolute temperature were neither consistent
nor significant. However, the Iq showed potential in detecting oil pollution in maize.
4.6 Conclusion
There was a very strong positive relationship between reflectance spectra and
the physiological parameters. These include: a strong positive linear relationship
between the reflectance at several individual narrow wavebands and photosynthesis,
a strong positive linear relationship between (R755-R7i6)/(R755+R7 i6) and
photosynthesis, and a strong positive linear relationship between the REP and
photosynthesis. These results suggested that the spectral reflectance o f leaves has
potential in detection of oil pollution. A stronger positive linear relationship between
the last two factors (i.e. REP and (R755-R7 i6)/(R755+R7 i6)) and photosynthesis can be
valuable indicators for early detection of oil pollution irrespective o f the intensity o f
pollution. Results from thermal response suggest that while the absolute leaf
temperature has minimal potential for detecting oil pollution in plants, thermal index
I g is promising. While the REP was superior to visual observations and other red-
edge features, the normalised-difference spectral indices that combines a waveband
in the red-edge with one of high reflectance in the NIR region: (R755-
R 716)/(R 755+R 715) performed best comparatively to all the tested diagnostic stress
108
indicators viz the individual narrow wavebands, the simple ratios, the red-edge
features, and the visible stress symptoms.
In terms of time and consistency, (R755-R716)/(R755+R7i6) was found to be
optimal for early detection of oil-induced stress at varied levels o f pollution.
Therefore, its application could enhance precision and accuracy for early detection o f
oil pollution via plant stress responses. Further studies plan to test the capability o f
this approach for early detection and discrimination between oil- and water related
stress such as waterlogging and water deficit in plants as both are important naturally
occurring stress factors. Thus, the next chapter deals with detection and
discrimination o f stress in bean (.Phaseolus vulgaris ‘Tendergreen ’) caused by oil
pollution and waterlogging using spectral and thermal remote sensing.
109
Chapter 5*
DETECTION AND DISCRIMINATION OF STRESS IN BEAN (Phaseolus
vulgaris 'Tendergreen1) CAUSED BY OIL POLLUTION AND
WATERLOGGING USING SPECTRAL AND THERMAL RESPONSES
5.1 Introduction
Waterlogging is known as one o f the important natural stresses affecting
plants. It can cause stress in plants by displacing the oxygen in soil by filling the soil
spaces with water and thus limiting oxygen supply to roots and preventing carbon
dioxide from diffusing away (Smith, 2004a). Gases such as 0 2 and C 0 2 diffuse very
slowly in water (Gibbs and Greenway, 2003) thus; replacement o f these gases from
the surface is slower. Removal of gaseous products produced in the waterlogged soil
will also be slower through the water and there may be a build-up o f toxic chemicals
that could have an effect on the plants (Smith, 2004a). For example, Godwin and
Mercer (1983) noted that ethylene concentrations are known to increase in
waterlogged soils and this has deleterious effects on plant growth causing inhibition
o f root growth, allowing the invasion of decay organisms. Since a major function o f
roots is supplying plants with water and nutrients (Lynch, 1995), waterlogging has a
subsequent effect on the above-ground parts o f a plant as they are unable to obtain
enough water and nutrients through the roots.
A number of studies have sought to understand the effects o f waterlogging in
plants. Manabu et al. (1999) found that the growth of tropical forage legumes called
Urb. cv. Siratro. decreased with long periods o f waterlogging treatment when
* Part o f this chapter has been published in Proceedings o f the Arts, Science and Applications o f Reflectance Spectroscopy Symposium, Boulder, Colorado, USA. 23-25' February, 2010.
110
compared with controls. While studying the effects o f waterlogging on root systems
o f soybean Morita et al. (2004) discovered that waterlogging prohibits the growth o f
the taproot and its lateral roots. It has been noted that few plants will survive
prolonged periods in ground saturated with water unless they have special roots that
are adapted to acquire oxygen in waterlogged conditions (The Royal Horticulture
Society, 2009).
Since waterlogging can instigate malfunctioning o f the root, it is expected
that such conditions could result in reflectance changes commonly related to plant
stress, such as increased reflectance in the chlorophyll and water absorption regions
(Carter, 1993; Lichtenhaler et al., 1996). Indeed, some studies have shown that
waterlogging can be detected in plants using changes in reflectance spectra.
Anderson and Perry (1996) found that flooded trees in wetland areas showed
elevated reflectance at 550 nm and in the NIR at 770 nm when compared to non
flooded trees. Pickering and Malthus (1998) worked on a small leak from an
aqueduct, which showed severe waterlogging o f the soil and vegetation within the
area was stunted, yellow and sparse. The centre o f the leak had a higher visible
reflectance and lower NIR reflectance compared to the surrounding unstressed
vegetation. Smith et al. (2004a) found that soil oxygen displacement by waterlogging
caused a significant increase in reflectance in the visible between 508- 654nm and in
the red-edge region between 692-742nm with little change in the NIR in bean. The
REP o f the waterlogged bean shifted towards shorter wavelengths compared to the
controls.
Although there is evidence in the effectiveness o f spectral reflectance for
detecting plant stress caused by waterlogging, there is a poor understanding o f the
capabilities o f spectral and thermal remote sensing for discriminating between oil
pollution and waterlogging stresses. Furthermore, in the previous chapter (4) spectral
and thermal responses of plants were identified that are o f value for early detection
o f stress caused by oil pollution alone. It is now important to determine whether
remote sensing can be used for the detection and discrimination o f concomitant oil
and waterlogging stresses. Thus, this chapter investigates the spectral and thermal
responses o f bean (Phaseolus vulgaris ‘Tendergreen ’) plants subjected to three stress
regimes: oil pollution, waterlogging and the combination o f oil pollution and
waterlogging. Bean is used as model specie as it is economically important and
forms a major source o f protein particularly in developing countries like Nigeria
where oil pollution o f farmlands is common. It also provided a compact, dense
canopy which is amenable to growth, manipulation and measurement at the canopy
scale in laboratory conditions. The crop is widely grown in other parts o f the world
such as countries o f Central and South America, and Central and East Africa where
animal protein is limited and beans are consumed in large quantities (Shellie-Dessert
and Bliss, 1991).
The objective was to identify the optimum set o f responses which could be
used for early, non-destructive quantification and discrimination o f each o f these two
stresses.
5.2. Methods
The methodology described in chapter 3 was adopted in this experiment
except that canopy thermal images were acquired in a darkroom (provided with an
artificial illumination (see chapter 3, section 3.5) mounted in a fixed position at nadir
70cm away from each canopy to be measured), with the camera positioned at nadir
112
75cm above the plant canopy. Thirty two well established plants were selected for
treatment. Four treatments, comprised of eight replicates, were established namely:
control, oil, waterlogging and a combination o f oil and waterlogging.
A GER 1500 Spectroradiometer (Geophysical & Environmental Research
Corp., Millbrook, NY) already described in chapter three (section 3.5) was used to
acquire reflectance spectra o f treated and control plants. In this experiment, the
instrument was positioned at nadir 20cm above the plant canopy, giving a FOV o f
approximately 3cm diameter and the light source was at a 45° zenith angle. Eight
spectral measurements were captured for each plant canopy by making small
movements to the position and rotation of the pot between each measurement. Leaf
pigments and water content were not measured in this experiment.
Spectral indices were generated from the individual narrow wavebands by
means o f ratioing all possible two-band combinations. The optimal index found in
the results o f chapter four was also added into the analysis.
5.3 Results
5.3.1 Visual stress observations
Stress symptoms were first visually observed in plants on day 8 for oil and
the combined oil and waterlogging treatments and on day 10 for waterlogging
treatment (alone). Symptoms worsened with time and included leaf chlorosis, rolling
and wilting, the thinning o f canopies and slower growth (figure 5.0). The control
plants did not show visual stress symptoms.
113
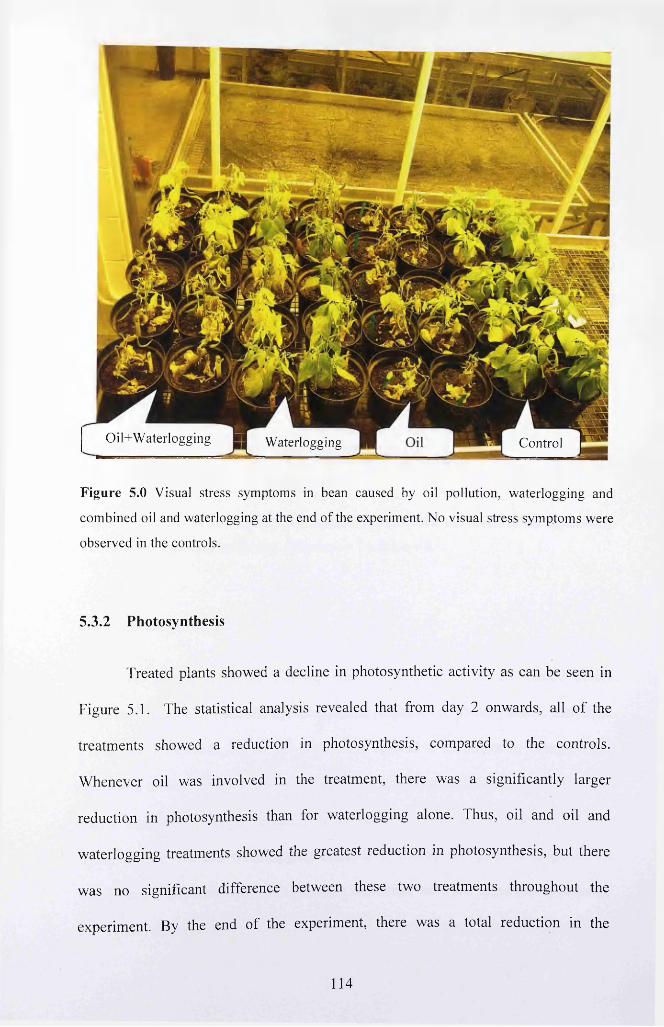
Oil+Waterlogging Waterlogging Control
Figure 5.0 Visual stress symptoms in bean caused by oil pollution, waterlogging and
combined oil and waterlogging at the end o f the experiment. No visual stress symptoms were
observed in the controls.
5.3.2 Photosynthesis
Treated plants showed a decline in photo synthetic activity as can be seen in
Figure 5.1. The statistical analysis revealed that from day 2 onwards, all o f the
treatments showed a reduction in photosynthesis, compared to the controls.
Whenever oil was involved in the treatment, there was a significantly larger
reduction in photosynthesis than for waterlogging alone. Thus, oil and oil and
waterlogging treatments showed the greatest reduction in photosynthesis, but there
was no significant difference between these two treatments throughout the
experiment. By the end of the experiment, there was a total reduction in the
114
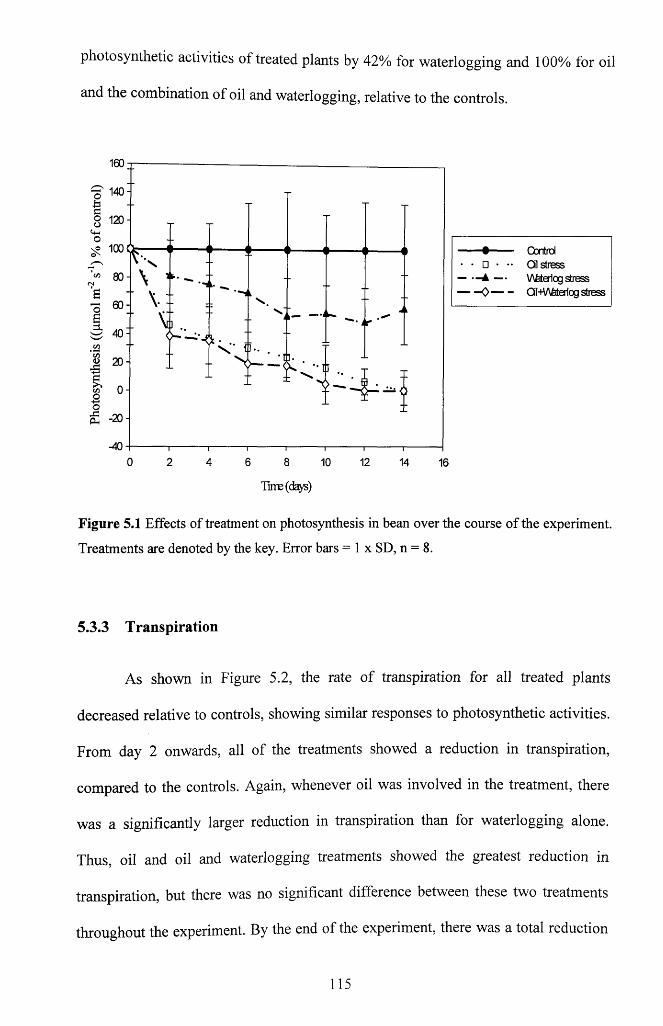
photosynthetic activities of treated plants by 42% for waterlogging and 100% for oil
and the combination of oil and waterlogging, relative to the controls.
O '
160;
140-
120 -
100 <> <>-------<>-------II-------II-------II-------II
' t ' - 4 -V ::
<DB
oXiOh
20
0-
- 2 0 -
- 4 0 - ~i i i i i i r6 8 10
Time (days)
12 14
9 Control• □ • •• Oil stress•-A — \Afeter1og stress—0 Oil-HAfeterlog stress
16
Figure 5.1 Effects of treatment on photosynthesis in bean over the course of the experiment.
Treatments are denoted by the key. Error bars = 1 x SD, n = 8.
5.3.3 Transpiration
As shown in Figure 5.2, the rate o f transpiration for all treated plants
decreased relative to controls, showing similar responses to photosynthetic activities.
From day 2 onwards, all of the treatments showed a reduction in transpiration,
compared to the controls. Again, whenever oil was involved in the treatment, there
was a significantly larger reduction in transpiration than for waterlogging alone.
Thus, oil and oil and waterlogging treatments showed the greatest reduction in
transpiration, but there was no significant difference between these two treatments
throughout the experiment. By the end of the experiment, there was a total reduction
115
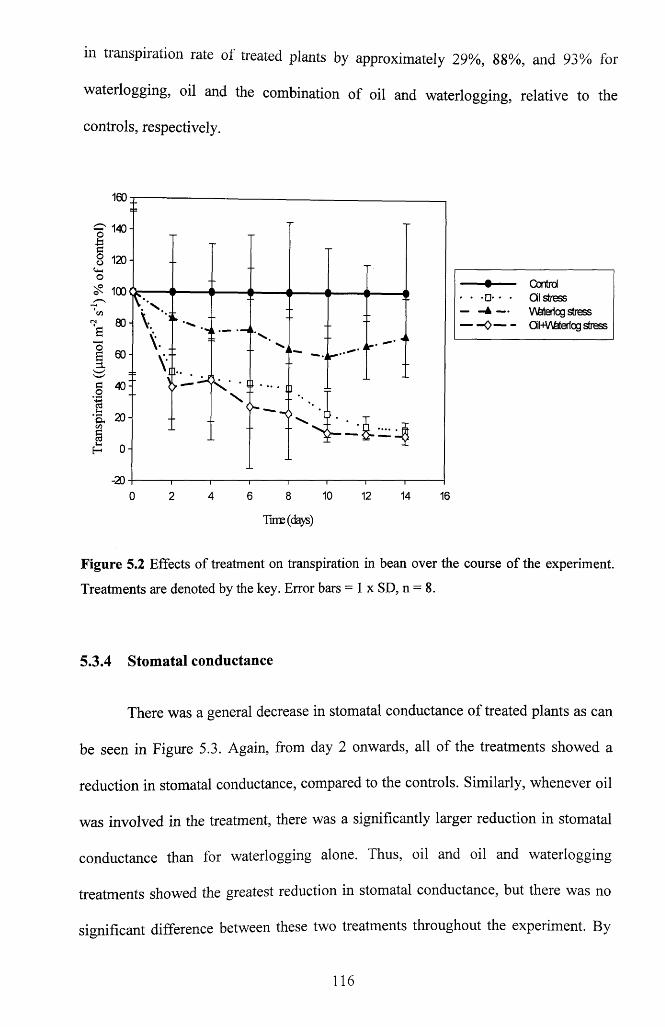
in transpiration rate of treated plants by approximately 29%, 88%, and 93% for
waterlogging, oil and the combination of oil and waterlogging, relative to the
controls, respectively.
6 8 10 12
Tirre(days)
------• ------ Controldistress
------A — V\6ter1og stress------ 0 — - O'l-HAMeriog stress
Figure 5.2 Effects of treatment on transpiration in bean over the course of the experiment.
Treatments are denoted by the key. Error bars = 1 x SD, n = 8.
5.3.4 Stomatal conductance
There was a general decrease in stomatal conductance o f treated plants as can
be seen in Figure 5.3. Again, from day 2 onwards, all o f the treatments showed a
reduction in stomatal conductance, compared to the controls. Similarly, whenever oil
was involved in the treatment, there was a significantly larger reduction in stomatal
conductance than for waterlogging alone. Thus, oil and oil and waterlogging
treatments showed the greatest reduction in stomatal conductance, but there was no
significant difference between these two treatments throughout the experiment. By
116
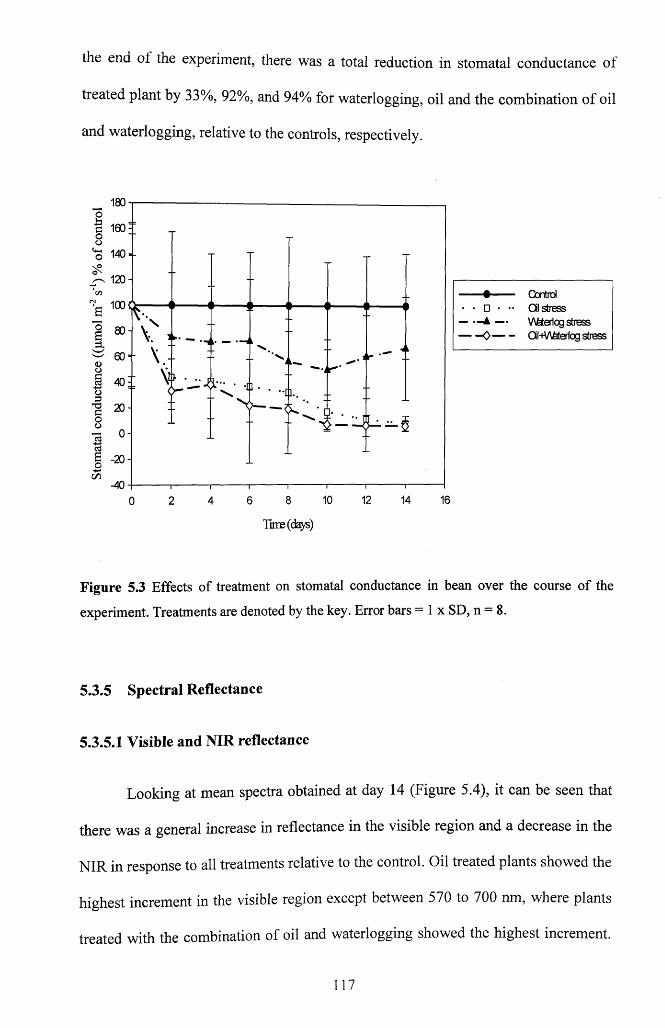
the end o f the experiment, there was a total reduction in stomatal conductance o f
treated plant by 33%, 92%, and 94% for waterlogging, oil and the combination o f oil
and waterlogging, relative to the controls, respectively.
o■§ 160• o0
140.ox
^ 120-*CO"a 1001^ 00 <D01 40-;
2 0 -
0
o£T3
Oo
W\
\
I§ -20
-40
\
<> II II It
il • . -II..—i .
------• ------ ControlOil stress
----- A — Wfeterlog stress— - o — - QI+V\Meriog stress
1 --------------- 1--------------- 1--------------- r
6 8 10 12 14 16
Time (days)
Figure 5.3 Effects of treatment on stomatal conductance in bean over the course of the
experiment. Treatments are denoted by the key. Error bars = 1 x SD, n = 8.
5.3.5 Spectral Reflectance
5.3.5.1 Visible and NIR reflectance
Looking at mean spectra obtained at day 14 (Figure 5.4), it can be seen that
there was a general increase in reflectance in the visible region and a decrease in the
N IR in response to all treatments relative to the control. Oil treated plants showed the
highest increment in the visible region except between 570 to 700 nm, where plants
treated with the combination of oil and waterlogging showed the highest increment.
117
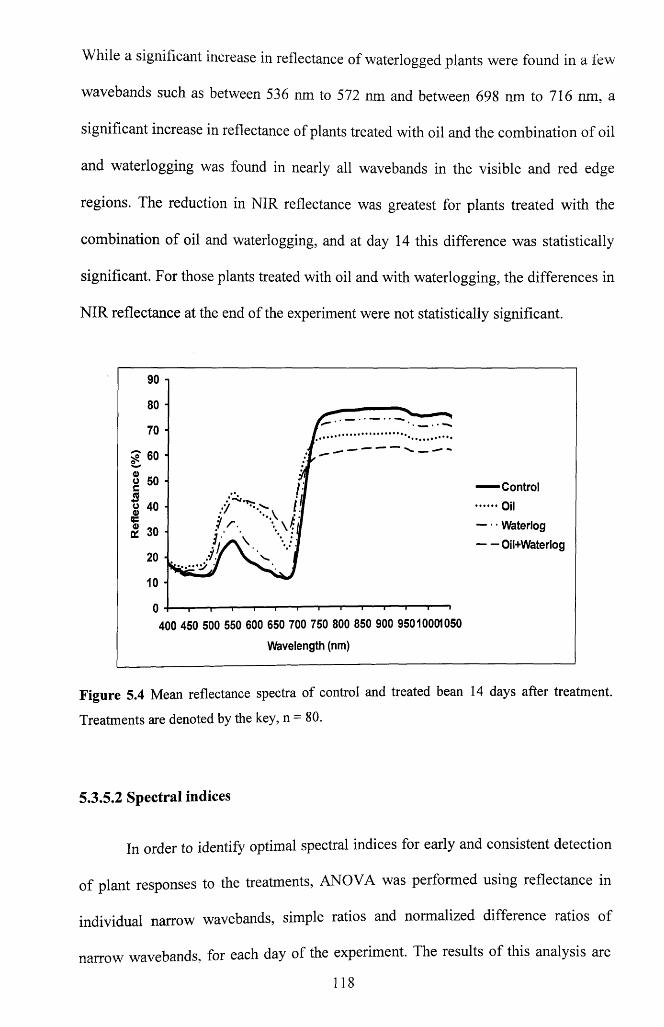
While a significant increase in reflectance of waterlogged plants were found in a few
wavebands such as between 536 nm to 572 nm and between 698 nm to 716 nm, a
significant increase in reflectance of plants treated with oil and the combination o f oil
and waterlogging was found in nearly all wavebands in the visible and red edge
regions. The reduction in NIR reflectance was greatest for plants treated with the
combination o f oil and waterlogging, and at day 14 this difference was statistically
significant. For those plants treated with oil and with waterlogging, the differences in
N IR reflectance at the end o f the experiment were not statistically significant.
90
80
70
o 50
o 40sit
20
10
0400 450 500 550 600 650 700 750 800 850 900 95010001050
— Control ... Oil
• • Waterlog
— Oil+Waterlog
Wavelength (nm)
Figure 5.4 Mean reflectance spectra of control and treated bean 14 days after treatment.
Treatments are denoted by the key, n = 80.
5.3.5.2 Spectral indices
In order to identify optimal spectral indices for early and consistent detection
of plant responses to the treatments, ANOVA was performed using reflectance in
individual narrow wavebands, simple ratios and normalized difference ratios of
narrow wavebands, for each day of the experiment. The results o f this analysis are
118
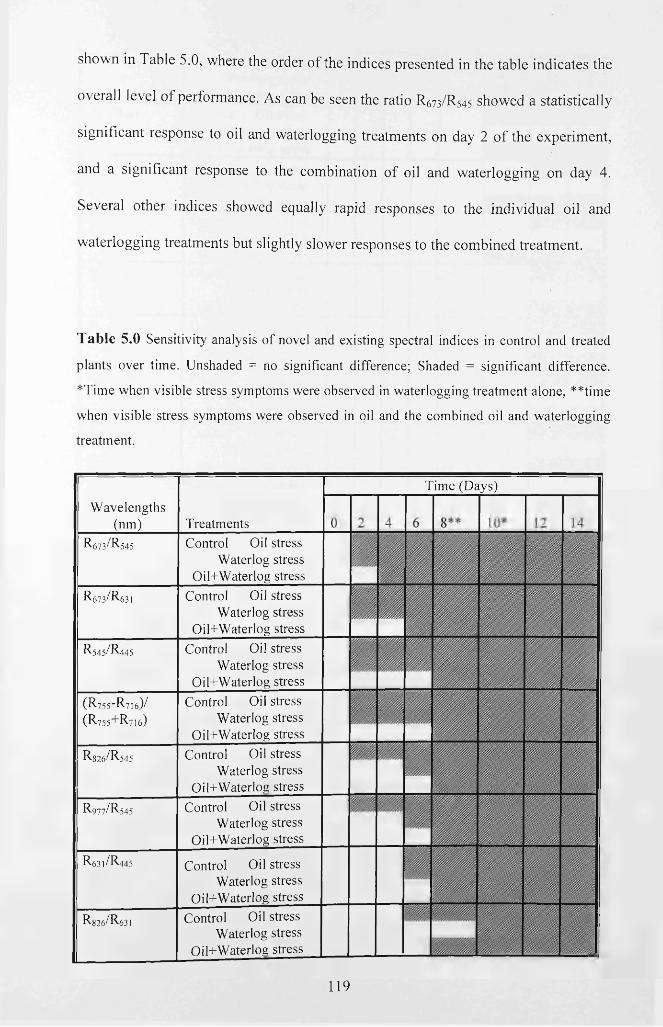
shown in Table 5.0, where the order of the indices presented in the table indicates the
overall level of performance. As can be seen the ratio R .673/R 545 showed a statistically
significant response to oil and waterlogging treatments on day 2 o f the experiment,
and a significant response to the combination of oil and waterlogging on day 4.
Several other indices showed equally rapid responses to the individual oil and
waterlogging treatments but slightly slower responses to the combined treatment.
Table 5.0 S en sitiv ity an a ly s is o f n ove l and ex is tin g spectral in d ices in con tro l and treated
plants ov er tim e. U nshaded = no sign ifican t d ifference; Shaded = s ig n ifica n t d ifferen ce .
* T im e w h en v is ib le stress sym p tom s w ere ob served in w a ter lo g g in g treatm ent a lo n e , ** tim e
w h en v is ib le stress sym p tom s w ere ob served in o il and the co m b in ed o il and w a ter lo g g in g
treatm ent.
R 673/R 545 C ontrol O il stressW aterlog stress
O il+ W aterlog stress
R673/R631 C ontrol O il stress W aterlog stress
O il+ W aterlog stress
R 5 4 5 / R 4 4 5 C ontrol O il stressW aterlog stress
O il+ W aterlog stress
( R 7 5 5 - R 7 i 6 ) / C ontrol O il stress ( R 7 5 5 + R 7 i 6 ) W aterlog stress
O il+ W aterlog stress
R 826/R 545 C ontrol O il stressW aterlog stress
O il+ W aterlog stress
R977/R545 C ontrol O il stressW aterlog stress
O il+ W aterlog stress
R 631/R 445 C ontrol O il stressW aterlog stress
O il+ W aterlog stress
W a v e len g th s(n m ) T reatm ents
R826/R631 C ontrol O il stress W aterlog stress
O il+ W aterlog stress
T im e (D a y s)
119
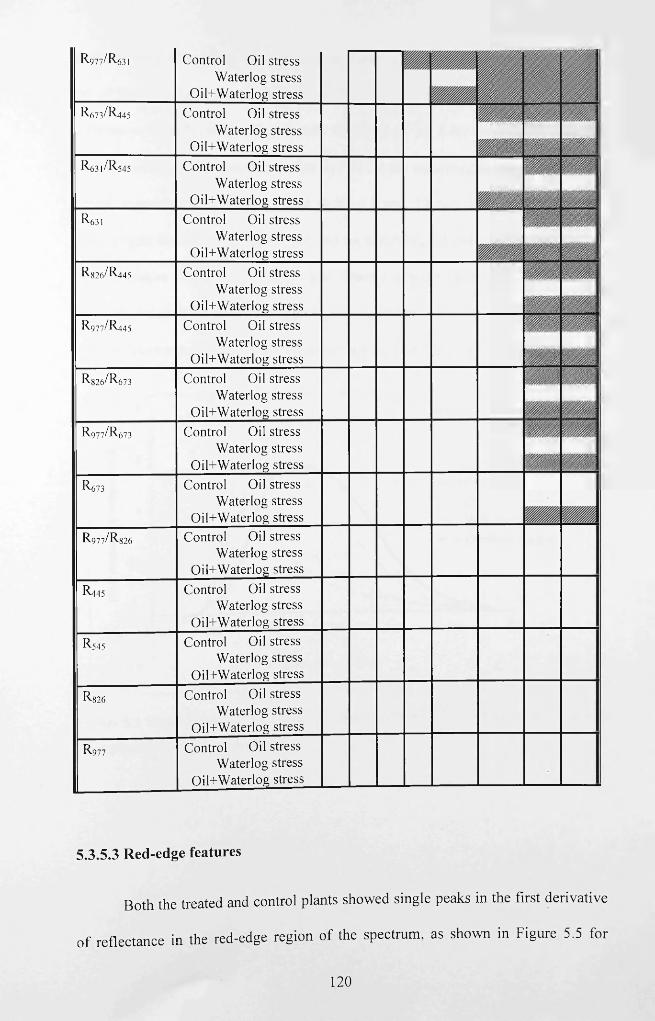
R977/R-631 Control Oil stress Waterlog stress
Oil+Waterlog stressR-673/R445 Control Oil stress
Waterlog stress Oil+Waterlog stress
R631/R545 Control Oil stress Waterlog stress
Oil+Waterlog stressR,631 Control Oil stress
Waterlog stress Oil+Waterlog stress
R826/R445 Control Oil stress Waterlog stress
Oil+Waterlog stressR 9 7 7 / R 4 4 5 Control Oil stress
Waterlog stress Oil+Waterlog stress
R826/R673 Control Oil stress Waterlog stress
Oil+Waterlog stress
R977/R673 Control Oil stress Waterlog stress
Oil+Waterlog stress
R,673 Control Oil stress Waterlog stress
Oil+Waterlog stress
R977/R826 Control Oil stress Waterlog stress
Oil+Waterlog stress
R445 Control Oil stress Waterlog stress
Oi 1+Waterlog stress
R545 Control Oil stress Waterlog stress
Oi 1+Waterlog stress
R826 Control Oil stress Waterlog stress
Oil+Waterlog stress
R.977 Control Oil stress Waterlog stress
Oil+Waterlog stress
S.3.5.3 Red-edge features
B oth the treated and control p lants show ed single peaks in the first derivative
o f re flectance in the red-edge region o f the spectrum , as show n in F igure 5.5 fo r
120
2414
451539
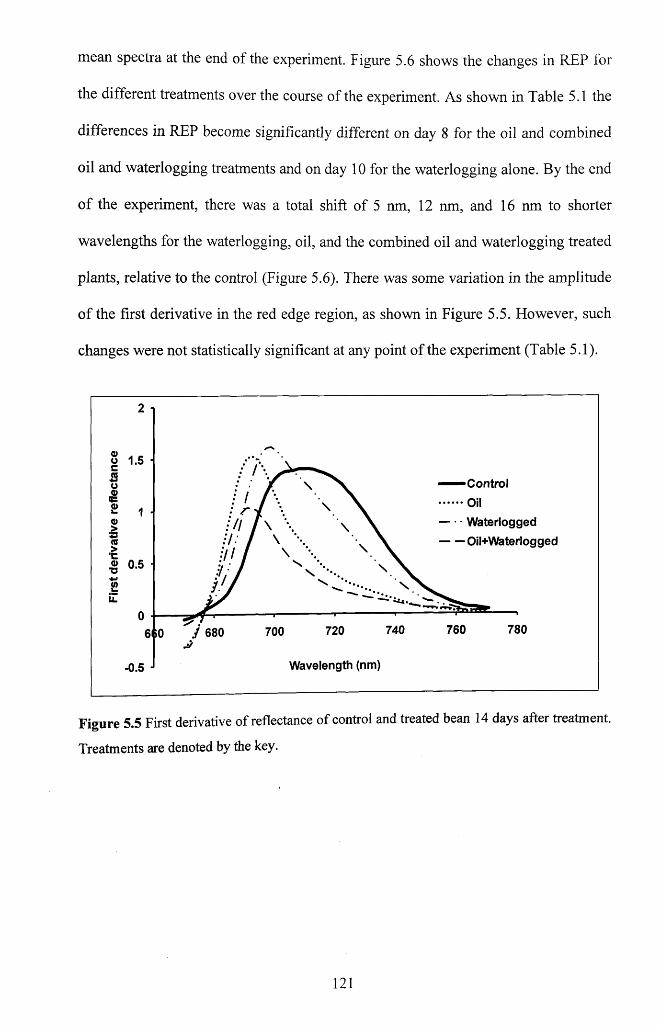
mean spectra at the end of the experiment. Figure 5.6 shows the changes in REP for
the different treatments over the course of the experiment. As shown in Table 5.1 the
differences in REP become significantly different on day 8 for the oil and combined
oil and waterlogging treatments and on day 10 for the waterlogging alone. By the end
o f the experiment, there was a total shift of 5 nm, 12 nm, and 16 nm to shorter
wavelengths for the waterlogging, oil, and the combined oil and waterlogging treated
plants, relative to the control (Figure 5.6). There was some variation in the amplitude
o f the first derivative in the red edge region, as shown in Figure 5.5. Flowever, such
changes were not statistically significant at any point of the experiment (Table 5.1).
11 Control
Oil
Waterlogged
Oil+Waterlogged
0.5
780760740720700
Wavelength (nm)-0.5
Figure 5.5 First derivative of reflectance of control and treated bean 14 days after treatment.
Treatments are denoted by the key.
121
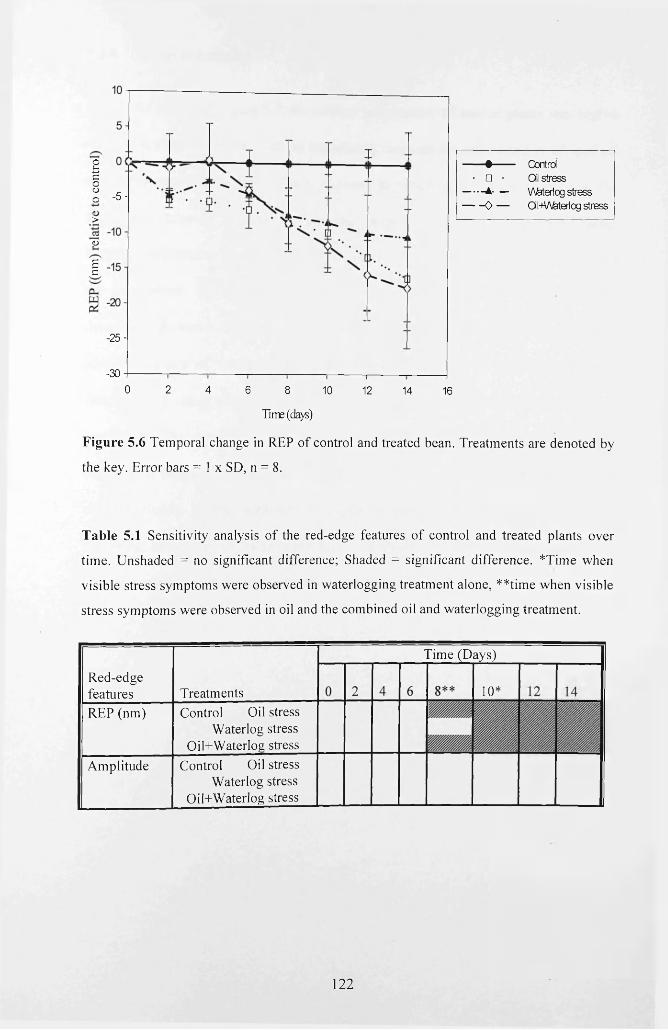
oJ3dooo
• Control• □ • O'l stress
A- — V\Merlog stress— - 0 — Ql+A&teilog stress
- 5 -
>
<L>6d
- 2 5 -
-300 2 4 6 8 10 12 14 16
Time (da s)
Figure 5.6 T em poral change in REP o f control and treated bean. T reatm ents are d en oted by
th e k ey . Error bars = 1 x SD , n = 8 .
Table 5.1 S en sitiv ity an a lysis o f the red -edge features o f control and treated p lants o v er
tim e . U n sh ad ed = no sign ifican t d ifference; Shaded = sig n ifica n t d ifferen ce . * T im e w h en
v is ib le stress sym p tom s w ere observed in w a ter logg in g treatm ent a lon e , * * tim e w h en v is ib le
stress sy m p to m s w ere ob served in o il and the com b in ed o il and w a ter lo g g in g treatm ent.
T im e (D a y s)
R ed -ed g efeatu res 1 0 *T reatm ents
C ontrol O il stress W aterlog stress
O il+ W aterlog stress
R EP (n m )
C ontrol O il stress W aterlog stress
O il+ W aterlog stress
A m p litu d e
122
5.3.6 Thermal imaging
As shown in Figure 5.7, the canopy temperature o f treated plants was higher
than the controls from day 2 of the experiment onwards for the oil and combined oil
and waterlogging treatments. Plants exposed to waterlogging stress showed a less
systematic response in terms of absolute canopy temperature, with significantly
higher temperatures than controls only occurring on certain days part way through
the experiment. Figure 5.8 shows that the treated plants showed a systematic
decrease in IG relative to the controls from day 2 onwards. This effect was consistent
across all types of treatment. It was apparent that IG of the waterlogged plants
decrease to a lesser extent than that of the oil and combined oil and waterlogging
treatments. The sensitivities of absolute temperature o f the canopy and IG that
occurred in bean due to oil, waterlogging and combined oil and waterlogging stress
and the timing o f the responses is given in Table 5.2. This demonstrates the
consistent sensitivity of temperature and IG to treatments that involved oil, but the
lack o f a consistent response to waterlogging alone.
123
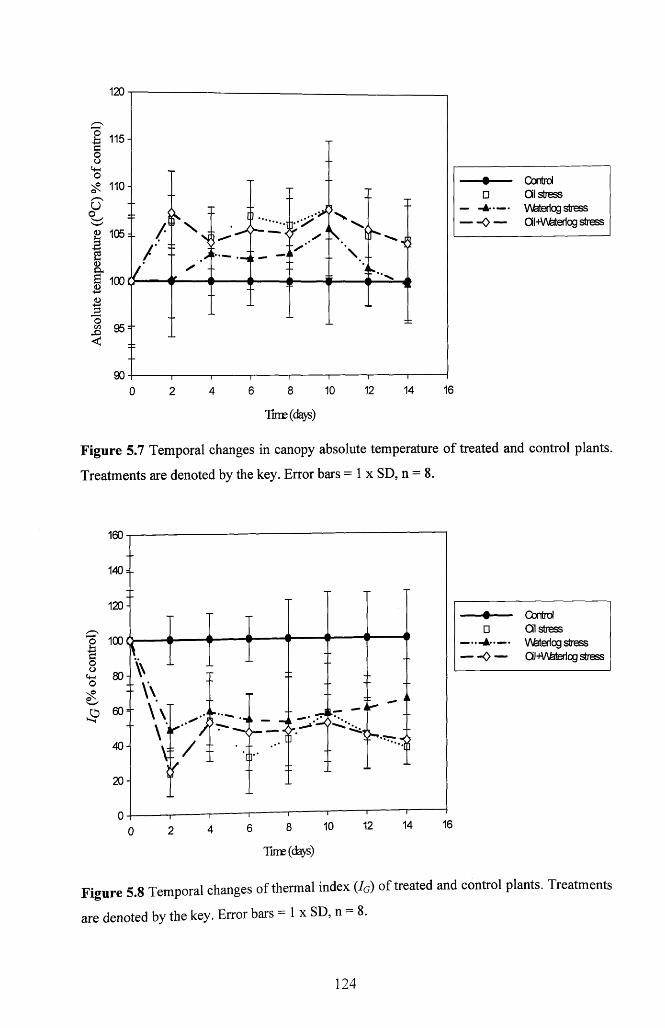
120
o€oot+Ho
115 -
110 -
o0' 'g 105
1<D£ 100(L)
I /■ / ' ?
t
J2OCO<I
95
90
\¥
/ -
__ — L I
■It"/ V /
y ' \ .. T
□- A - - —
^> —
Control Ql stress V\feter1og stress Ql-Mfeterlog stress
10 12 14 16
Time (days)
Figure 5.7 Temporal changes in canopy absolute temperature of treated and control plants.
Treatments are denoted by the key. Error bars = 1 x SD, n = 8.
1ooU-ioV®ox
5
□
-0 —
Control Ql stress V\feter1og stress QI+V\&teriog stress
4 6 8 10
Time (days)
Figure 5.8 Temporal changes of thermal index (JG) of treated and control plants. Treatments
denoted by the key. Error bars = 1 x SD, n - 8.are
124
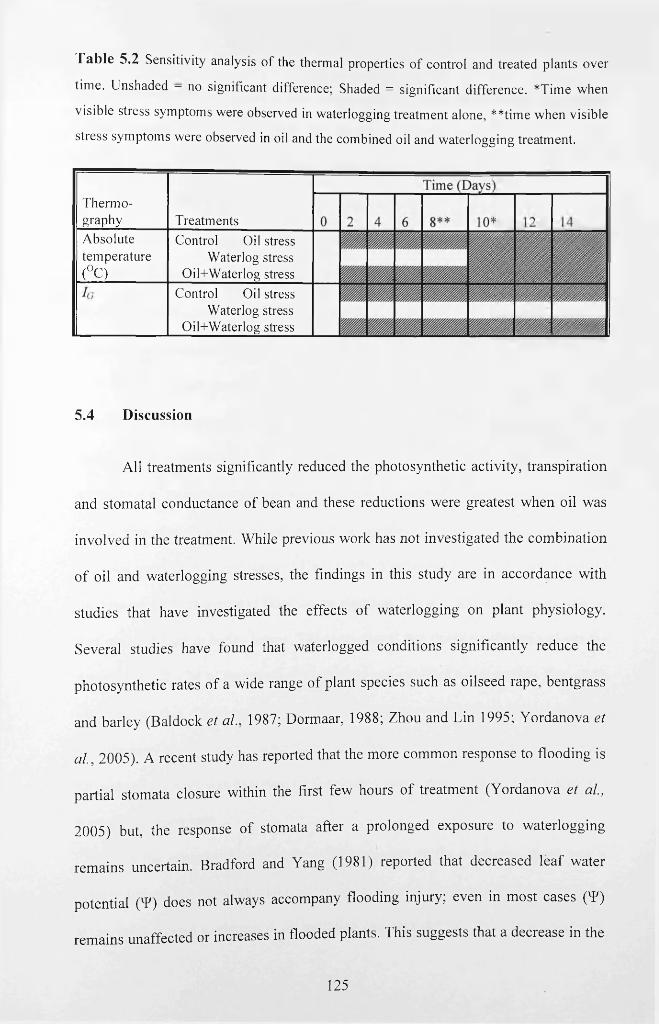
T able 5.2 Sensitivity analysis o f the thermal properties o f control and treated plants over
time. Unshaded — no significant difference; Shaded = significant difference. *Time when
visible stress symptoms were observed in waterlogging treatment alone, **time when visible
stress symptoms were observed in oil and the combined oil and waterlogging treatment.
Absolutetemperature(°C)
Control Oil stress Waterlog stress
Oil+Waterlog stressControl Oil stress
Waterlog stress Oil+Waterlog stress
Thermography T reatments
5.4 Discussion
A ll treatm ents significantly reduced the photosyn thetic activ ity , tran sp ira tio n
and stom atal conductance o f bean and these reductions w ere g reatest w hen oil w as
invo lved in the treatm ent. W hile previous w ork has not investigated the com bination
o f oil and w aterlogging stresses, the findings in this study are in accordance w ith
stud ies that have investigated the effects o f w aterlogging on p lan t physio logy .
Several studies have found that w aterlogged conditions sign ifican tly reduce the
pho tosyn thetic rates o f a w ide range o f p lant species such as o ilseed rape, ben tg rass
and barley (B aldock et al., 1987; D orm aar, 1988; Z hou and L in 1995; Y ordanova et
al. , 2005). A recent study has reported that the m ore com m on response to flood ing is
partia l stom ata closure w ithin the first few hours o f treatm ent (Y ordanova et al.,
2005) but, the response o f stom ata after a p ro longed exposure to w aterlogg ing
rem ains uncertain. B radford and Y ang (1981) reported that decreased le a f w ater
po ten tia l ( ¥ ) does not alw ays accom pany flooding injury; even in m ost cases (T )
rem ains unaffected or increases in flooded plants. This suggests that a decrease in the
125
photosynthetic rate of bean by waterlogging treatment observed in the present
experiment may be as a result of non-stomatal factors, such as soil oxygen depletion.
Similar observations were made by Bradford (1983) who reported that the
photosynthetic rate of flooded tomato plants remained constant or declined at high
intercellular CO2 concentrations. The author attributed this to non-stomatal
(biochemical) factors, such as an inability for Ribulose-l,5-bisphosphate (RuBP)
regeneration in the Calvin cycle. Indeed, it has been demonstrated that prolonged
flooding causes root injuries that restrict photosynthetic capacity by altering the
biochemical reactions of photosynthesis (Yordanova et al., 2005).
Many investigations on waterlogging have focused on the short term effects
on plants. For example, Else et al. (2001) found that soil flooding reduced stomatal
conductance, transpiration, CO2 uptake and leaf elongation in Ricinus communis
within 2-6 h. Zang and Zang (1994) found that in pea plants, stomata begin to close
in the first few hours of flooding with a parallel decrease in transpiration and
stomatal conductance (Jackson and Hall, 1987). Yordanova et al. (2005) investigated
the impact o f short-term soil flooding on stomatal function and morphology and on
leaf gas exchange in barley leaves. The study found that flooding o f barley plants for
a short time (2 - 24 h) decreased transpiration and stomatal conductance. The result
obtained in this study were based on the response o f prolonged waterlogging
conditions o f up to 2 weeks rather than a short-term effect, nevertheless a significant
physiological effect was observed on the second sampling occasion, 2 days after the
start o f the experiment.
In the present study, whenever oil is present in the treatment, there was a
greater impact on plant physiological rates than with the waterlogging treatment
alone. As indicated in chapter 4, oil pollution can have detrimental effects on plants,
126
tin ough a multitude of different mechanisms, such as soil oxygen depletion, reduced
water uptake and toxic effects (Rowell, 1977; De Song 1980; Jong, 1980;
Schumacher, 1996; Noomen et al., 2003; Wyszkowski et a l, 2004). In the case o f oil
pollution, soil oxygen is further reduced by an increase in demand for oxygen
brought about by the activities of oil-decomposing micro-organisms (Gudin and
Syratt, 1975) which may not occur in waterlogged conditions. Furthermore, oil
reduces the available nitrogen content of the soil (Sojka et al., 1975; Jong, 1980)
which results from consumption of all available nitrogen by bacteria and fungi
growing on a hydrocarbon medium thus, restricting the uptake o f these elements by
plants (Malachowska-Jutsz et al., 1997; Xu and Johnson, 1997). These effects are
exacerbated by depression in ammonification and nitrification processes triggered by
inhibition in the conversion of mineral and organic nitrogen compounds in soil by
petroleum derived compounds (Iwanow et a l, 1994; Amadi et al., 1996). Finally,
studies have shown that oil can have toxic effects on plants by penetrating into
plants/leaf tissue and consequently damaging cellular integrity and preventing leaf
and shoot regeneration (Webb, 1994; Pezeshki et a l , 1995; Pezeshki et a l , 2000).
This combination of effects from oil may well explain the greater impact o f
treatments involving oil than the waterlogging, found in the present study.
Substantial changes in spectral reflectance were observed in relation to all of
the treatments used in the present experiment. Waterlogging produced a significant
increase in reflectance in the visible in a region centred on 550nm and a second
region centred on 715nm. This concurs with the findings o f Anderson and Perry
(1996) where reflectance of trees was elevated at 550 n m a s a result o f flooding in
wetland areas. 550 nm and 715nm are regions o f weak absorption by total
chlorophyll (Zwiggelaar, 1998). As has been observed previously, reflectance is
more sensitive to high concentrations of pigments at wavelengths where the
absorption coefficients o f pigments are low (Jacquemoud and Baret, 1990; Yamada
and Fujimara, 1991). Hence, the reflectance changes observed indicate that
waterlogging caused a small decrease in chlorophyll but that overall concentrations
remained high.
Furthermore, the wavelength ranges (centred on 550 and 715nm) where there
was an increase in reflectance in waterlogging treated plants falls within the region
(from 508 to 654 nm and 692 to 742 nm) where Smith et al. (2004a) found a
significant increase in reflectance in dwarf bean (Phaseolus vulgaris) treated with
waterlogging. However, in barley Smith et al. (2004a) found that waterlogging stress
caused a significant decrease in reflectance across a wider wavelength range from
496 to 744 nm. The differences in the spectral responses o f bean and barley could be
attributed to their different genetic, biochemical or structural characteristics, as
dicotyledon and monocotyledon species, respectively. In the present experiment it
was found that the changes in spectral reflectance of bean treated with oil and the
combination o f oil and waterlogging occurred over a broad region within the visible
spectrum. This was similar to the findings of Smith et al. (2004a) for barley exposed
to waterlogging. This suggests that wavelength ranges 493 to 534 nm and 573 to 697
nm may serve as good indicators for discriminating between bean and barley when
stressed with waterlogging and for discriminating between stresses induced by oil
and waterlogging in bean. However, this needs further investigation probably on
diverse plant species under varied environmental stress conditions; when the stability
and dynamics of these spectral regions can be ascertained.
Various single stresses have been found to cause minimal reflectance change
in the NIR. Smith et al. (2004a) found a small change in the NIR reflectance in bean
128
and barley treated with waterlogging. In the present study there was no significant
reflectance difference in the wavelength ranges 723 to 1050 nm and between 717 to
1050 nm in plants treated with oil and waterlogging respectively. However, plants
treated with a combination of oil and waterlogging showed significant reflectance
differences in the wavelength ranges 739 to 1050 nm. This suggests that multiple
stresses such as the combination of oil and waterlogging expectedly may have done
greater damage to the leaf cellular structure of bean than just a single stress factor.
Results from the sensitivity analysis indicated that narrowband spectral ratio
indices were more sensitive in discriminating subtle signs o f stress arising from oil
pollution, waterlogging and the combined treatment, when compared with red-edge
features and thermal stress indices. Based on consistency and time o f detection, a
simple reflectance ratio R673/R545 that combined wavebands in the red and green
regions performed best. This ratio exploits those regions o f the visible which
correspond with the absorption maxima and minima o f chlorophyll.
In the present experiment all treatments resulted in plants showing single
peaks in the first derivative of reflectance in the red-edge region o f the spectrum. In a
similar way, single peaks were observed by Smith et al. (2004a) for bean treated with
different stresses such as waterlogging, natural gas and argon. On the contrary, Smith
et al. (2004a) found double peaks in barley treated with the same stresses as bean. It
has been suggested that differences between bean and barley in the shape o f the peak
that defines the red edge may be related to the different leaf structures of
monocotyledons and dicotyledons (Smith at al., 2004a). The study noted that the
internal structure of mono- and dicotyledons differs and that in dicotyledons, the
upper and lower epidermises are separated by the spongy mesophyll containing many
air spaces. The leaf of a monocotyledon is more compacted with fewer air spaces
(Gausman, 1985). Since the spongy mesophyll in a leaf o f dicotyledons is more
developed with many air spaces than the leaf of monocotyledons, their reflectance is
generally higher than those of monocotyledons (Gausman, 1985; Guyot, 1990) and
thus, allows more light scattering between the cell walls (Smith at al., 2004a). Since
the red edge is influenced by low reflectance caused by strong chlorophyll absorption
in the red region and high reflectance in the NIR caused by leaf cellular structure,
differences in reflectance due to leaf structure may affect the shape o f the peak o f the
red edge in the first derivative in this region (Smith at al., 2004a).
The REP o f bean which is defined by the wavelength o f the single peak in the
first derivative spectrum appears to be a stable indicator o f stress induced by the
three types o f treatment in bean, but only in the later stages o f impact. In the present
study, the REP shifted significantly towards shorter wavelengths for the plants
treated with oil and the combination of oil and waterlogging on day 8 and for the
waterlogged plants on day 10. This concurs with the previous findings presented in
chapter 4 where the REP of maize treated with oil shifted towards the shorter
wavelengths. Previous investigations have found that the REP shifted towards the
shorter wavelengths as plants became stressed (Lang et al., 1985a, 1985b; Crawford,
1986; Reid, 1988; McCoy et a l, 1989; Cwick et a l, 1995; De Oliveria and Crosta,
1996). The amplitude of the first derivative o f reflectance for the treated plants was
at no time significantly different to that o f the control plants. Soil oxygen
displacement was found to cause inconsistent change in the magnitude o f the first
derivative at the position of the red edge in bean and barley, which either increase or
decrease relative to the control (Smith et al., 2004a). As may have been the case in
the present study, the change was attributed not only to the decreasing amount o f

total chlorophyll but also to change in the ratio of chlorophyll a to chlorophyll b in
the exposed plants.
The absolute temperature of the canopy of bean under all treatments was
higher than the controls. This differs from the findings in chapter 4, where the leaf
temperature o f maize treated with oil fluctuated as stress progressed and did not
differ significantly from that of control plants. It was suggested in chapter 4 that the
inconsistency may have resulted from irregularities in the ambient temperature o f the
glasshouse that occurred at different times of measurement. Previous investigations
o f plant stress detection in the field using changes in canopy temperatures (as
discussed in section 4.5) have experienced some limitations due to the effects of
variation in air temperature, wind and environmental moisture. Greater
environmental variation inevitable in an experiment with relatively large plants
across a greenhouse was another identified setback. In the present study,
thermography was undertaken in a more controlled environment (dark room) where a
consistent source of illumination was used, ensuring that leaf temperature was a
useful indicator of stress.
The sensitivity of the absolute canopy temperature o f bean was significant
soon after oil treatment and about 6 days after the combined oil and waterlogged
treatments. Poor immiscibility between oil and water may have delayed the
downward flux of oil and penetration into the plant root zone which may have
delayed the effect of the combined oil and waterlogged stress in bean. The absolute
canopy temperature was not consistently sensitive to waterlogging stress in bean and
this can be explained by the smaller response o f transpiration and stomatal
conductance to waterlogging than to the treatments involving oil.
131
The Iq of plants treated with oil and combined oil and waterlogging was
consistently lower than those of the controls. As stated earlier, the Iq is theoretically
proportional to the stomatal conductance thus, is likely to be responding to the
reduction in stomatal conductance caused by oil. In chapter 4, the I q was identified as
a potentially valuable index for early detection of oil pollution in maize. Similarly to
the absolute canopy temperature, the I q changed significantly soon after oil treatment
and 6 days after the combined oil and waterlogged treatments. Again, the poor
immiscibility between oil and water may have caused the slower response to the
combined oil and waterlogged stress. The Iq was not consistently sensitive to
waterlogging in bean, which is again explicable in terms o f the reduced response of
transpiration and stomatal conductance to waterlogging as opposed to treatments
involving oil.
5.5 Conclusion
The spectral reflectance and thermal properties o f bean effectively
distinguished subtle signs of stress induced by oil pollution and waterlogging. There
was a significant increase in reflectance across the visible region for plants treated
with oil and combined oil and waterlogging. However, for plants treated with
waterlogging alone, there was only a significant increase in reflectance in two
specific regions centred on 550nm and 715nm. Hence, it was deduced that these
waveband regions could serve as good indices for discriminating between stress
symptoms arising from oil or combined oil and waterlogging and those arising from
waterlogging alone. NIR reflectance could be used to discriminate between stress
induced in bean by single and multiple factors as it was found that the combined oil
and waterlogging treatment caused a significant decrease in NIR reflectance while
the individual oil and waterlogging treatments did not invoke such a response.
Among various spectral and thermal indices tested for detecting stress
symptoms caused by oil and waterlogging, a simple ratio o f reflectance that
combined narrow wavebands in the green and red regions (R673/R 545) was most
sensitive. The REP was sensitive to oil and waterlogged induced stress in bean but
only at later stages of impact. While the canopy absolute temperature and the thermal
index (7g) were good indicators of developing oil and combined oil and waterlogging
stress in bean, they were poor indicators of stress caused by waterlogging. Thus, by
combining spectral and thermal information, oil-induced stress could be
discriminated from waterlogging. In addition to waterlogging, the other major form
o f water-related stress which plants experience is that o f water deficit. In the next
chapter, we will investigate the performances and stability o f thermal and spectral
remote sensing for distinguishing between oil pollution and water deficit.
133
Chapter 6*
EXPLOITING SPECTRAL AND THERMAL RESPONSES OF MAIZE (Zea
mays L.) FOR EARLY DETECTION AND DISCRIMINATION OF
STRESSES CAUSED BY OIL POLLUTION AND W ATER DEFICIT
6.1 Introduction
Water is essential for plant metabolism, and any limitation in its availability
affects almost all plant functions, including the assimilation and partitioning of
carbon (Deng et al., 1990; Onillon et al., 1995). Under field conditions, crops are
exposed to a wide range of abiotic, biotic and anthropogenic stress inducing factors
within the growth environment, which consequently alter their physiological and
biochemical functioning. Oil pollution has been noted as one o f the major causes o f
environmental degradation and can arise from spills o f crude and refined oil in
aquatic and terrestrial environments (Ogboghodo et al., 2004). In regions where oil is
extracted and refined, plants are vulnerable to oil pollution due to leakages from
pipelines and other facilities. For example, in developing countries such as Nigeria,
where oil pipelines crisscross the country passing through different land surfaces
such as swampy and dry terrain, oil pollution regularly affects subsistence crops and
natural vegetation growing across a range of hydrological settings from wetlands
through to arid environments. Hence, any single plant may be simultaneously
exposed to both oil and water stress and we need a means o f discriminating between
the two.
* Part o f this chapter has been published in Proceedings o f the Remote Sensing and Photogrammetry Society (RSPsoc) Annual Conference, Leicester, United Kingdom, 8 -1 1th September 2009.
134
Recent studies have shown that petroleum toxicity conditions in plants are
known to alter leaf pigmentation properties and cause changes in the reflectance
spectrum (Rosso et al., 2005) that can be detected before symptoms can be observed
visually (Carter et al., 1996). Indeed, reflectance measurements can be useful for
detecting a wide range of vegetation changes associated with various factors
affecting plant growth and productivity. However, similar spectral responses result
from different stresses which make it difficult to discriminate between these factors.
For example, Smith et al. (2005) found that in oilseed rape (.Brassica napus), there
was no difference between the spectral reflectance pattern of plants stressed via
elevated concentration of natural gas and those stressed via herbicide application.
Likewise, several other studies have suggested that it may not be possible to
distinguish between different causes of stress using spectral remote sensing alone
(Carter, 1993; Massoni et al., 1996; Smith et a l., 2005).
Recent applications of thermal imaging techniques have shown that water
stress can be detected through an increase in leaf temperature as a result o f stomatal
closure in response to soil drying during a water deficit (Jones, 1999; Grant et al.,
2006). Using such techniques, Olga et al. (2007) were able to distinguish between
irrigated and non-irrigated grapevine canopies, and even between different deficit
irrigation treatments. When leaf or canopy photosynthesis is compromised due to
stress, stomatal conductance is expected to decrease because o f a decrease in demand
for atmospheric C 0 2 (Farquhar and Sharkey, 1982). If transpiration is restricted due
to stomatal closure, leaf temperatures will increase (Nobel, 1991; Pezeshki and
DeLaune, 1993) because of less cooling by transpired water as it evaporates from the
leaf surfaces. Thus, changes in leaf temperature may occur as a direct effect o f soil
135
water deficit or as an indirect consequence of a decrease in photosynthesis that may
result from a range of different types of stress.
Hence, while spectral and thermal sensing individually may be inadequate for
discriminating the effects of different types of stress in plants, the combination o f the
two techniques may hold promise. Indeed, as reported in Chapter 5, it was found that
spectral and thermal sensing can effectively distinguish between stress induced by oil
pollution and waterlogging in bean (Phaseolus vulgaris ‘Tendergreen’). The
combined effect of oil pollution and water deficit (the more widespread form o f
water-related stress) now needs to be addressed. Hence, the objective o f the present
study was to explore the physiological/biochemical basis o f thermal and spectral
properties o f maize crops for the early detection and discrimination between oil
contamination and water deficit.
6.2 Methods
In this experiment, four treatments comprising ten replicates were
established, namely: control, oil, water deficit and the combination o f oil and water
deficit. Canopy thermal images were acquired in a darkroom (with an artificial
illumination provided by a halogen lamp (see chapter 3, section 3.5). The light
source was mounted in a fixed position at nadir 70cm away from each leaf to be
measured. The camera was positioned at nadir 75cm above the plant canopy. An
ASD FieldSpec® Pro Spectroradiometer (Boulder, CO 80301 USA) already described
in chapter 3, section 3.5 was used for all reflectance measurements. Ten spectral
measurements were captured per leaf for each of the 10 replicates per treatment.
136
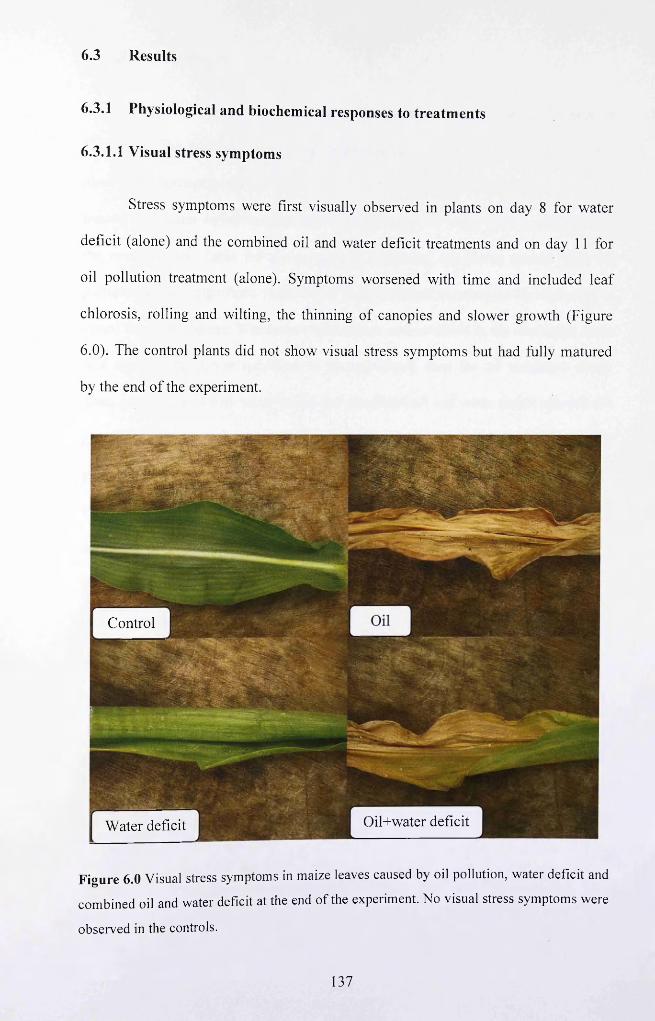
6.3 Results
6.3.1 Physiological and biochemical responses to treatm ents
6.3.1.1 Visual stress symptoms
Stress sym ptom s w ere first v isually observed in p lan ts on day 8 fo r w a te r
defic it (alone) and the com bined oil and w ater deficit treatm ents and on day 11 fo r
oil po llu tion treatm ent (alone). Sym ptom s w orsened w ith tim e and included le a f
ch lo rosis, ro lling and w ilting, the thinning o f canopies and slow er grow th (F igure
6.0). T he control plants did not show visual stress sym ptom s bu t had fully m atu red
by the end o f the experim ent.
C ontrol
O il+w ater deficitW ater deficit
Figure 6.0 Visual stress symptoms in maize leaves caused by oil pollution, water deficit and
combined oil and water deficit at the end of the experiment. No visual stress symptoms were
observed in the controls.
137
6.3.1.2 Photosynthesis
Treated plants showed a decline in photosynthetic activity as can be seen in
Figure 6.1. The statistical analysis revealed that before visual stress symptoms were
observed, photosynthesis showed a significant reduction (on day 4) in the plants
treated with water deficit and combined oil pollution and water deficit, compared to
the controls (see Table 6.0 on page 141). However, for plants treated with oil
pollution alone, a significant reduction in photosynthesis occurred on the same day as
visual stress symptoms. Whenever water deficit was involved in the treatment, there
is a significantly larger reduction in photosynthesis than for oil treatment alone.
Thus, plants treated with water deficit and combined oil and water deficit showed the
greatest reduction in photosynthesis, but there was no significant difference in
photosynthesis between these two treatments throughout the experiment.
Photosynthetic activity ceased on day 8 for the plants treated with water deficit and
combined oil and water deficit, while photosynthesis ended on day 18 for the plants
treated with oil alone.
138
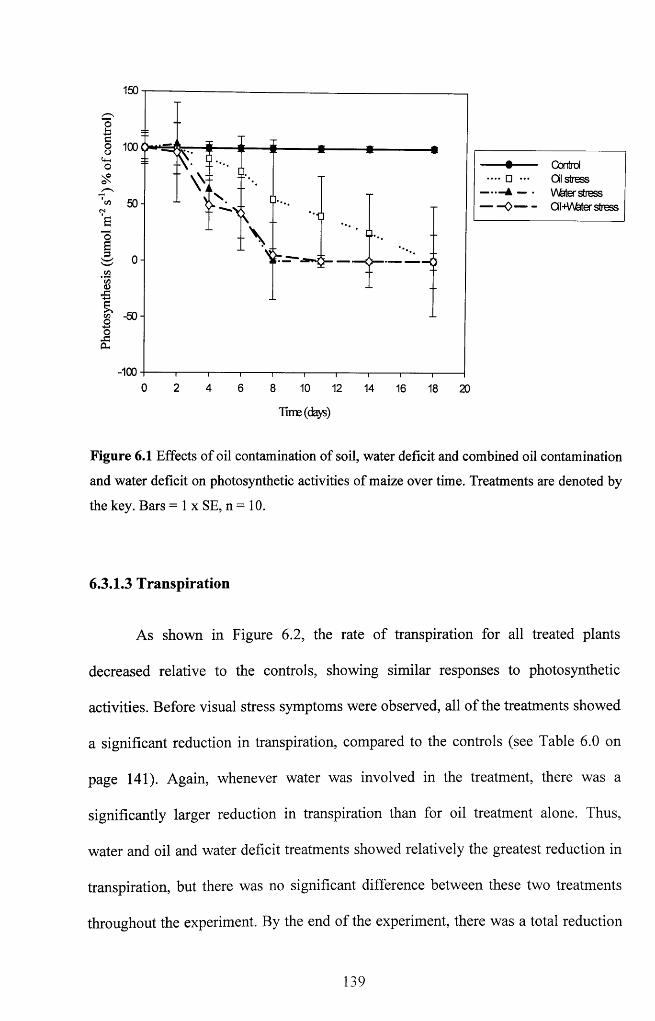
150
01oat4—ION®
<Dl50-
2 -50-
-100
\ Q-."0
- v--------6---------
•• □
—A-O'
— Control Oil stress V\feter stress
- OihWkter stress
8 10 12
Time (days)
14 16 18 20
Figure 6.1 Effects of oil contamination of soil, water deficit and combined oil contamination
and water deficit on photosynthetic activities of maize over time. Treatments are denoted by
the key. Bars = 1 x SE, n = 10.
6.3.1.3 Transpiration
As shown in Figure 6.2, the rate o f transpiration for all treated plants
decreased relative to the controls, showing similar responses to photosynthetic
activities. Before visual stress symptoms were observed, all o f the treatments showed
a significant reduction in transpiration, compared to the controls (see Table 6.0 on
page 141). Again, whenever water was involved in the treatment, there was a
significantly larger reduction in transpiration than for oil treatment alone. Thus,
water and oil and water deficit treatments showed relatively the greatest reduction in
transpiration, but there was no significant difference between these two treatments
throughout the experiment. By the end of the experiment, there was a total reduction
139
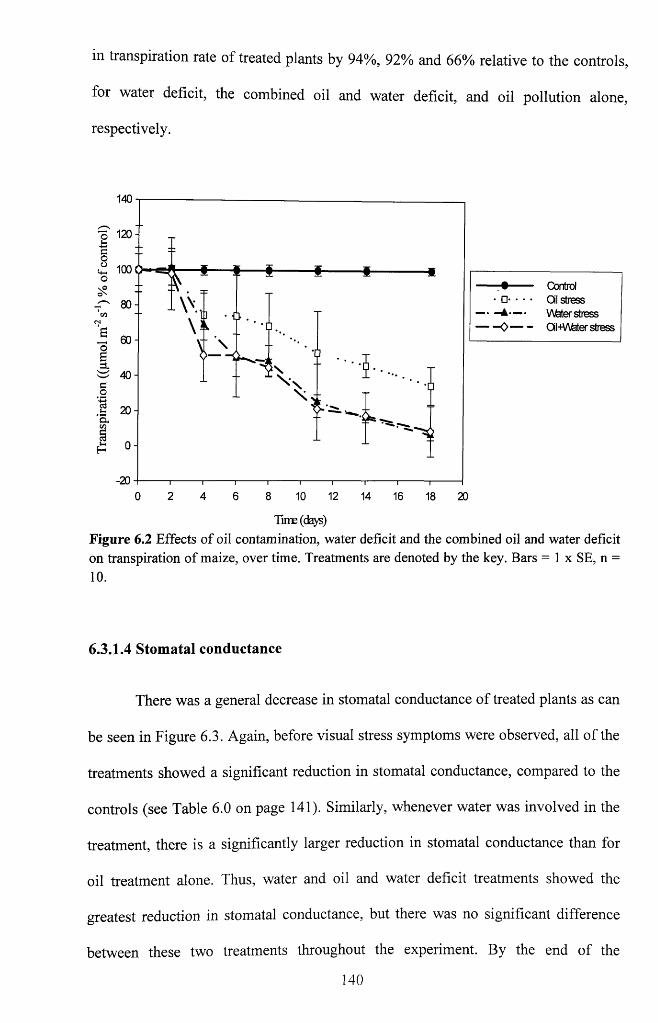
in transpiration rate of treated plants by 94%, 92% and 66% relative to the controls,
for water deficit, the combined oil and water deficit, and oil pollution alone,
respectively.
-A—
— Control• Oil stress
Vteter stress- Oil+V\Mer stress
0 2 4 6 8 10 12 14 16 18 20
Time (days)
Figure 6.2 Effects of oil contamination, water deficit and the combined oil and water deficit on transpiration of maize, over time. Treatments are denoted by the key. Bars = 1 x SE, n = 10 .
6.3.1.4 Stomatal conductance
There was a general decrease in stomatal conductance o f treated plants as can
be seen in Figure 6.3. Again, before visual stress symptoms were observed, all o f the
treatments showed a significant reduction in stomatal conductance, compared to the
controls (see Table 6.0 on page 141). Similarly, whenever water was involved in the
treatment, there is a significantly larger reduction in stomatal conductance than for
oil treatment alone. Thus, water and oil and water deficit treatments showed the
greatest reduction in stomatal conductance, but there was no significant difference
between these two treatments throughout the experiment. By the end of the
140
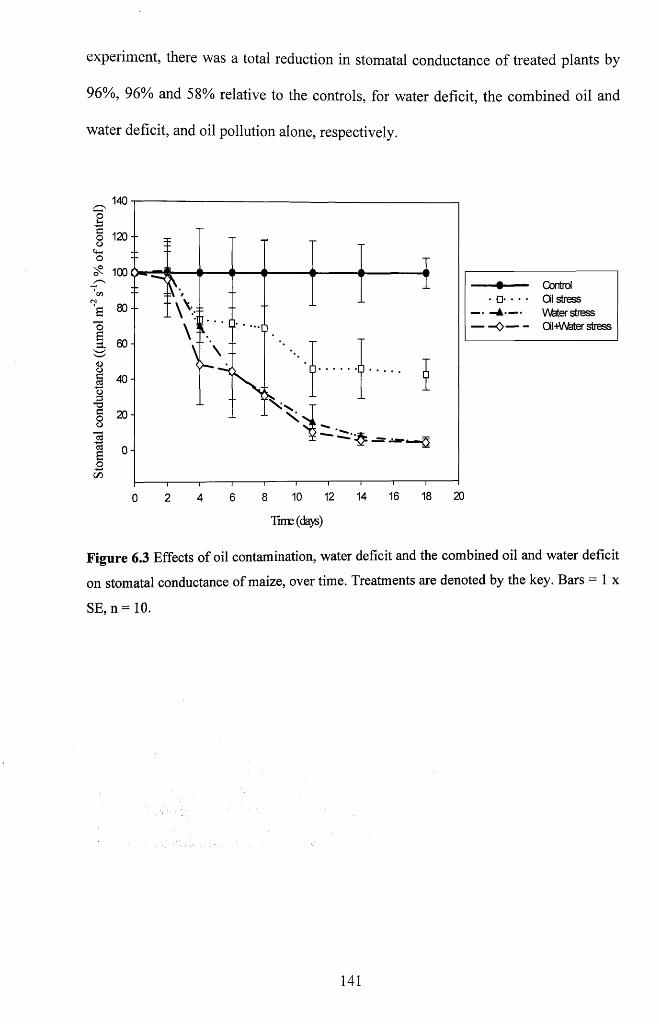
experiment, there was a total reduction in stomatal conductance o f treated plants by
96%, 96% and 58% relative to the controls, for water deficit, the combined oil and
water deficit, and oil pollution alone, respectively.
140
o 1 2 0 -
Contrd Gl stress V\Mer stress OiHV\fater stress
8 0 -
2 0 -
(Z)18 2 014 1612106 82 40
Time (days)
Figure 6.3 Effects of oil contamination, water deficit and the combined oil and water deficit
on stomatal conductance of maize, over time. Treatments are denoted by the key. Bars = 1 x
SE, n = 10.
141
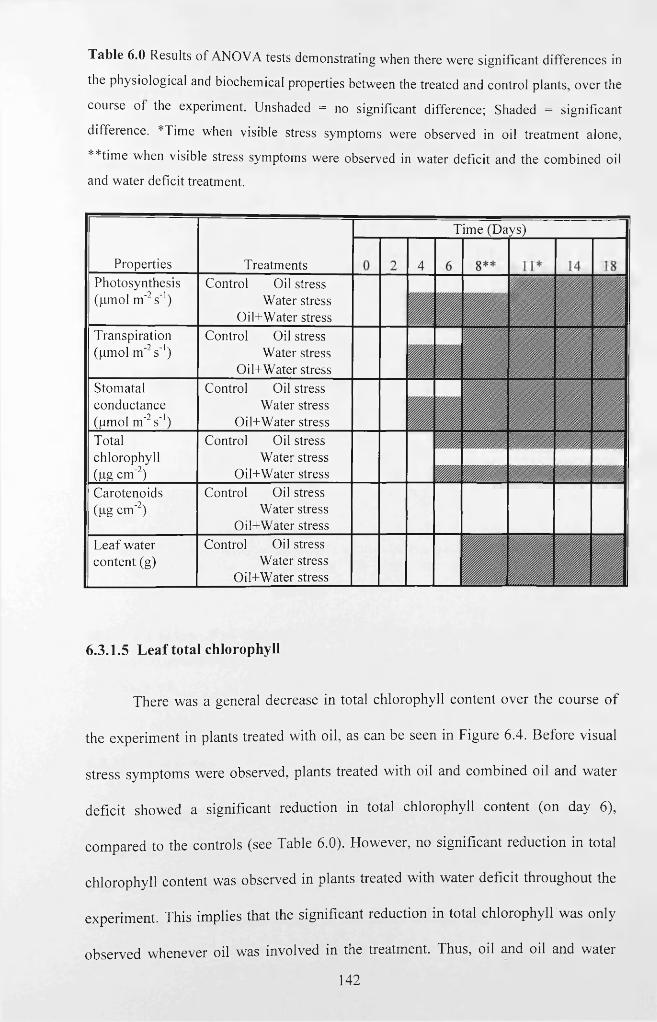
Table 6.0 Results o f ANOVA tests demonstrating when there were significant differences in
the physiological and biochemical properties between the treated and control plants, over the
course ol the experiment. Unshaded = no significant difference; Shaded = significant
difference. *Time when visible stress symptoms were observed in oil treatment alone,
**time when visible stress symptoms were observed in water deficit and the combined oil
and water deficit treatment.
Properties Photosynthesis (pmol m '2 s '1)
Transpiration (pmol m '2 s '1)
Stomatal conductance (pmol m~2 s '1) Totalchlorophyll(Pg cm~2) Carotenoids (pg cm '2)
Leaf water content(g)
TreatmentsControl Oil stress
Water stress Oil+Water stressControl Oil stress
Water stress Oil+Water stressControl Oil stress
Water stress Oil+Water stress
Control Oil stressWater stress
Oil+Water stress Control Oil stress
Water stress Oil+Water stress
Control Oil stressWater stress
Oil+Water stress
Time (Days)
6.3.1.5 L eaf total chlorophyll
There was a general decrease in total chlorophyll conten t over the course o f
the experim ent in p lants treated w ith oil, as can be seen in F igure 6.4. B efore v isual
stress sym ptom s w ere observed, p lants treated w ith oil and com bined oil and w ater
defic it show ed a significant reduction in total chlorophyll conten t (on day 6),
com pared to the controls (see Table 6.0). H ow ever, no significant reduction in to tal
ch lo rophy ll content w as observed in p lants treated w ith w ater deficit th roughout the
experim ent. This im plies that the significant reduction in total ch lo ro p h y ll'w as only
observed w henever oil w as involved in the treatm ent. Thus, oil and oil and w ater
142
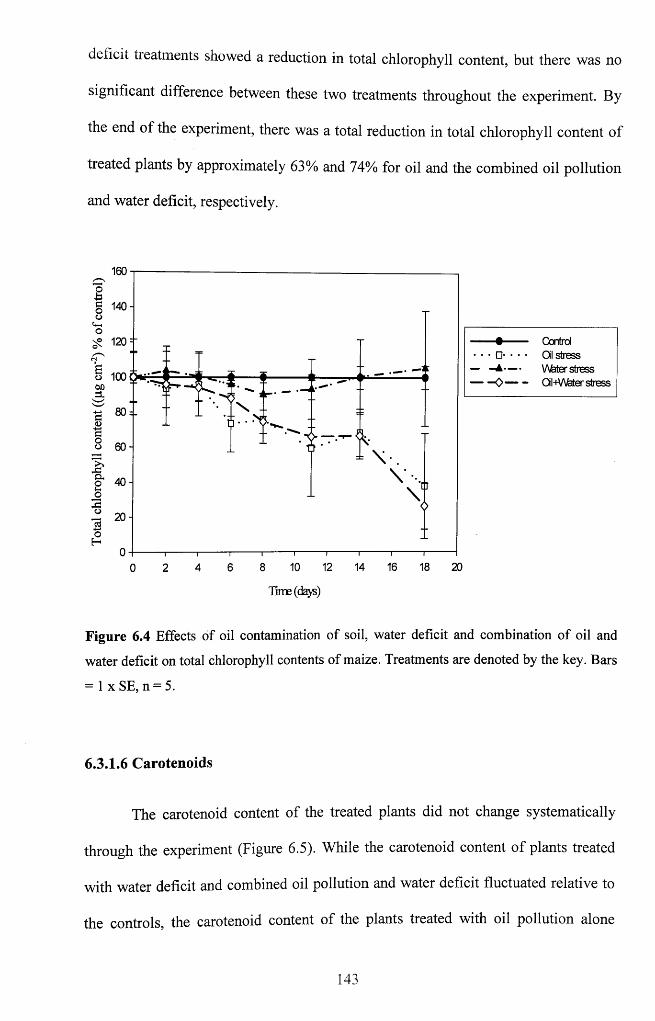
deficit treatments showed a reduction in total chlorophyll content, but there was no
significant difference between these two treatments throughout the experiment. By
the end o f the experiment, there was a total reduction in total chlorophyll content of
treated plants by approximately 63% and 74% for oil and the combined oil pollution
and water deficit, respectively.
160
140 -
Control Oil stress V\feter stress Oil+V\fefer stressoo
60-
o 40-
12 14 16 18 2 08 1062 40
Time (days)
Figure 6.4 Effects of oil contamination of soil, water deficit and combination of oil and
water deficit on total chlorophyll contents of maize. Treatments are denoted by the key. Bars
= 1 xSE, n = 5.
6.3.1.6 Carotenoids
The carotenoid content of the treated plants did not change systematically
through the experiment (Figure 6.5). While the carotenoid content o f plants treated
with water deficit and combined oil pollution and water deficit fluctuated relative to
the controls, the carotenoid content of the plants treated with oil pollution alone
143
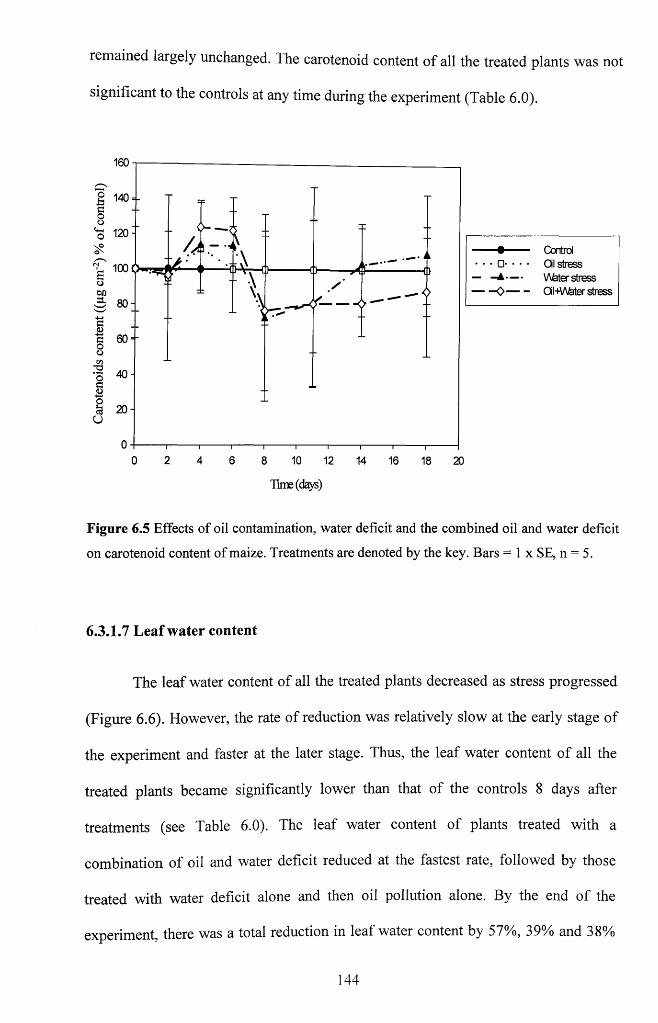
remained largely unchanged. The carotenoid content o f all the treated plants was not
significant to the controls at any time during the experiment (Table 6.0).
160
g 1 4 0 -
120:Control Oil stress V\feter stress QI-HAMer stress
a
— 780-
0 2 6 10 12 14 164 8 18 2 0
Time (days)
Figure 6.5 Effects of oil contamination, water deficit and the combined oil and water deficit
on carotenoid content of maize. Treatments are denoted by the key. Bars = 1 x SE, n = 5.
6.3.1.7 Leaf water content
The leaf water content of all the treated plants decreased as stress progressed
(Figure 6.6). However, the rate of reduction was relatively slow at the early stage o f
the experiment and faster at the later stage. Thus, the leaf water content o f all the
treated plants became significantly lower than that of the controls 8 days after
treatments (see Table 6.0). The leaf water content of plants treated with a
combination of oil and water deficit reduced at the fastest rate, followed by those
treated with water deficit alone and then oil pollution alone. By the end o f the
experiment, there was a total reduction in leaf water content by 57%, 39% and 38%
144
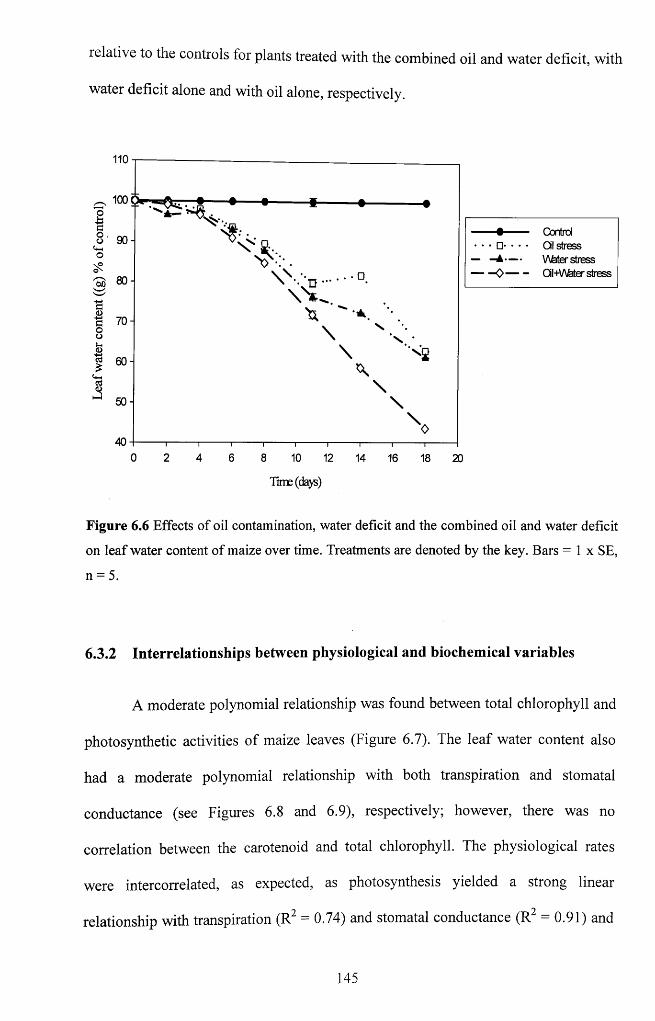
relative to the controls for plants treated with the combined oil and water deficit, with
water deficit alone and with oil alone, respectively.
110
100 (k # # >
1 o . oUhoN®ox
'so
Kt<DhJ
90
70-
60-
50-
40
V-:-.\ N s s •
* " • * . \\ ' x
\\
\V
•
—A'-o-
— Control• • Oil stress
V\feter stress- QI-HAfeter stress
i i i i i i i--------------1--------------1---------
0 2 4 6 8 10 12 14 16 18 20
Time (days)
Figure 6.6 Effects of oil contamination, water deficit and the combined oil and water deficit
on leaf water content of maize over time. Treatments are denoted by the key. Bars = 1 x SE,
n = 5.
6.3.2 Interrelationships between physiological and biochemical variables
A moderate polynomial relationship was found between total chlorophyll and
photosynthetic activities of maize leaves (Figure 6.7). The leaf water content also
had a moderate polynomial relationship with both transpiration and stomatal
conductance (see Figures 6.8 and 6.9), respectively; however, there was no
correlation between the carotenoid and total chlorophyll. The physiological rates
were intercorrelated, as expected, as photosynthesis yielded a strong linear
relationship with transpiration (R2 = 0.74) and stomatal conductance (R2 = 0.91) and
145
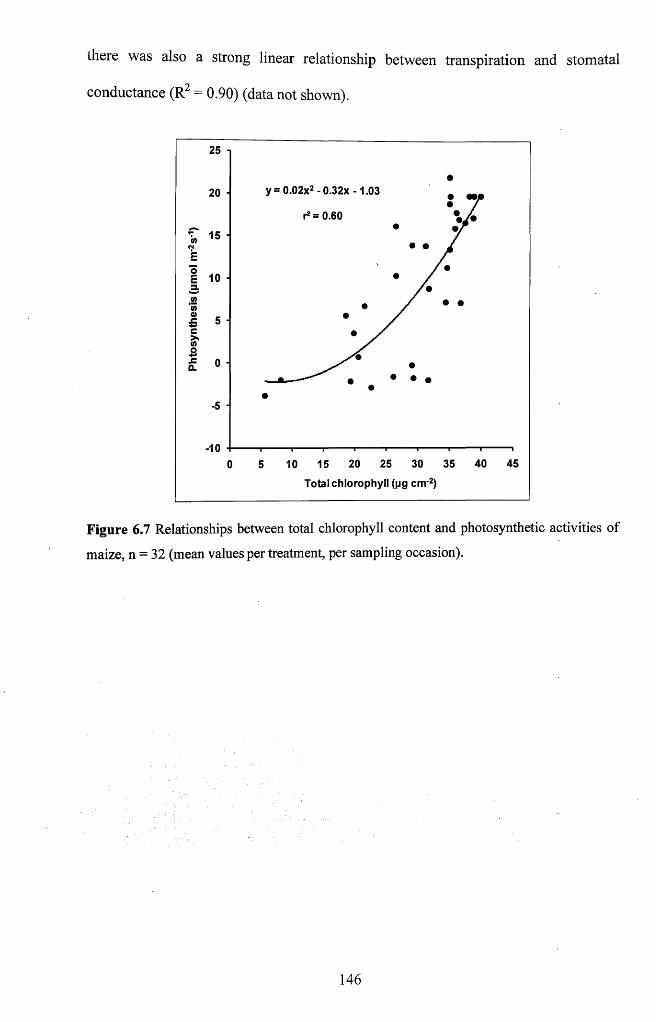
there was also a strong linear relationship between transpiration and stomatal
conductance (R2 = 0.90) (data not shown).
y = 0.02x2 - 0.32x -1.03
r2 = 0.60
15 ■
=L
-1040 45
Total chlorophyll (pg cnrr2)
Figure 6.7 Relationships between total chlorophyll content and photosynthetic activities of
maize, n = 32 (mean values per treatment, per sampling occasion).
146
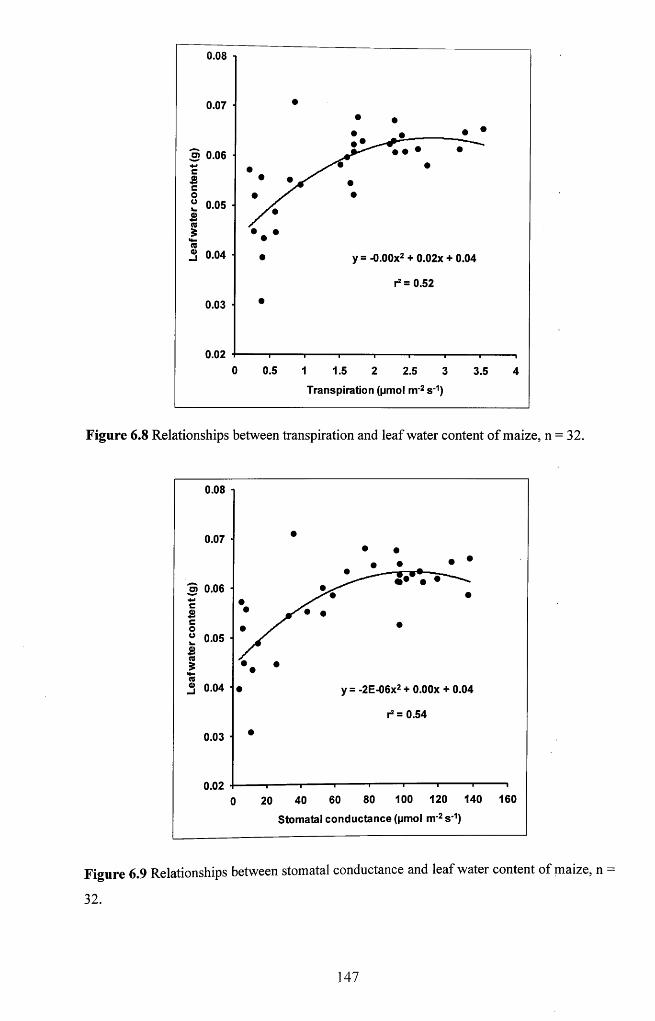
0.08
0.07
3 0.06ce" 0.05 ■ Bra5na>_j 0.04 • y = -O.OOx2 + 0.02x + 0.04
r2 = 0.52
0.03
0.020 0.5 1 1.5 2 2.5 3 3.5 4
Transpiration (pmol nr2 s _1)
Figure 6.8 Relationships between transpiration and leaf water content of maize, n = 32.
0.08
0.07
ra 0.06 ■
0.05 ■
0.04 y=-2E-06x2+ O.OOx + 0.04
r2 = 0.54
0.03 ■
0.02100 120 140 16040
Stomatal conductance (pmol nv2s'1)
Figure 6.9 Relationships between stomatal conductance and leaf water content of maize, n =
32.
147
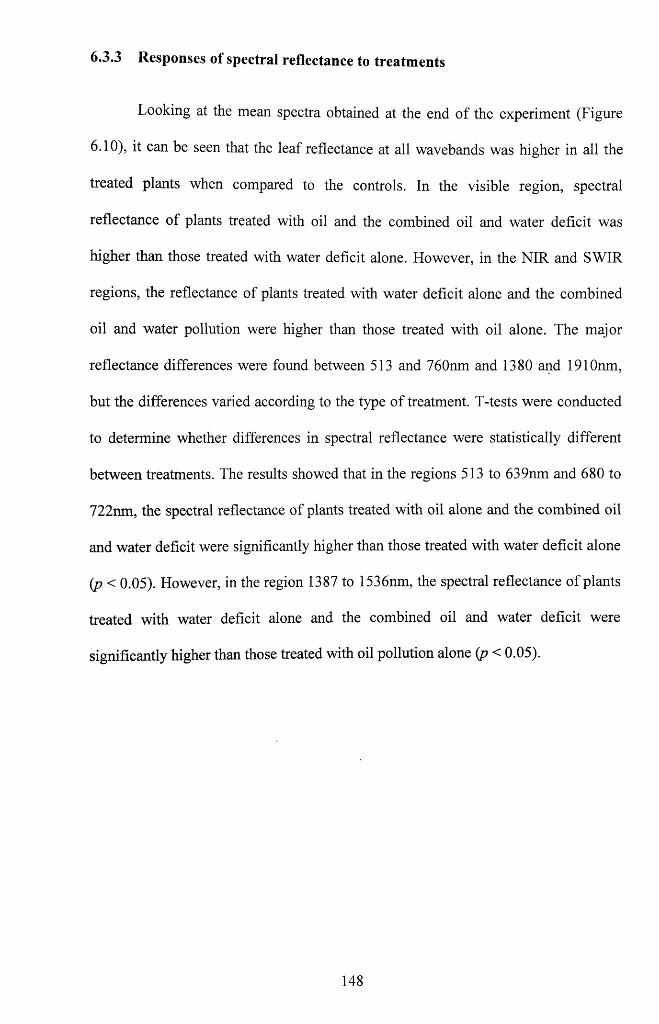
6.3.3 Responses of spectral reflectance to treatments
Looking at the mean spectra obtained at the end o f the experiment (Figure
6.10), it can be seen that the leaf reflectance at all wavebands was higher in all the
treated plants when compared to the controls. In the visible region, spectral
reflectance of plants treated with oil and the combined oil and water deficit was
higher than those treated with water deficit alone. However, in the NIR and SWIR
regions, the reflectance of plants treated with water deficit alone and the combined
oil and water pollution were higher than those treated with oil alone. The major
reflectance differences were found between 513 and 760nm and 1380 and 1910nm,
but the differences varied according to the type o f treatment. T-tests were conducted
to determine whether differences in spectral reflectance were statistically different
between treatments. The results showed that in the regions 513 to 639nm and 680 to
722nm, the spectral reflectance of plants treated with oil alone and the combined oil
and water deficit were significantly higher than those treated with water deficit alone
(P< 0 .05). However, in the region 1387 to 1536nm, the spectral reflectance o f plants
treated with water deficit alone and the combined oil and water deficit were
significantly higher than those treated with oil pollution alone (p < 0.05).
148
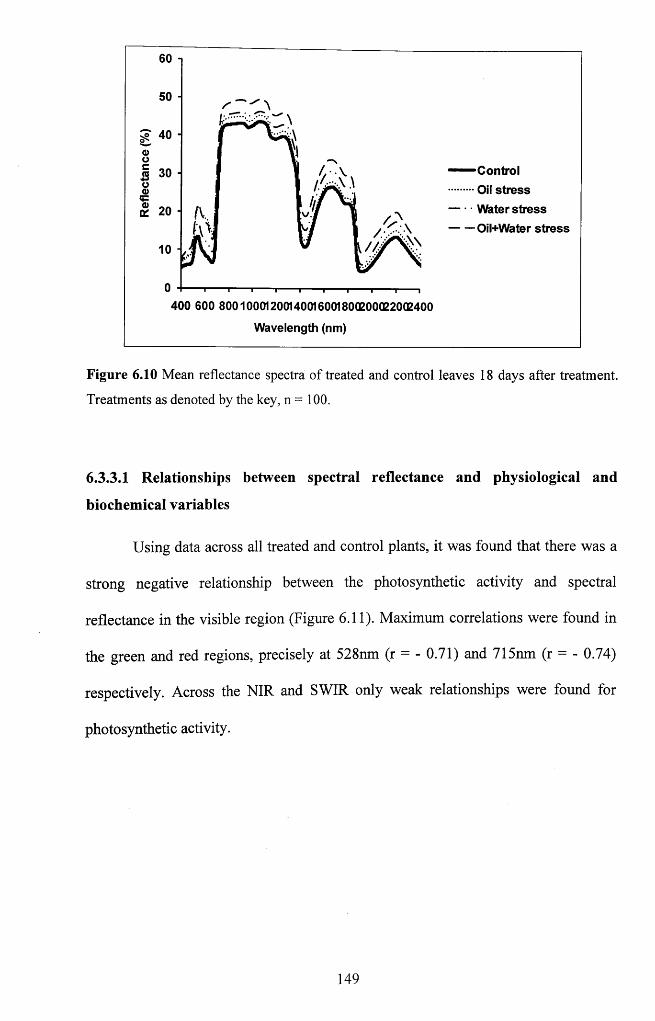
50 ■
1 Control
Oil stress
Water stress
Oil+Water stresstv..
400 600 8001000120014001600180(200022002400
Wavelength (nm)
Figure 6.10 Mean reflectance spectra of treated and control leaves 18 days after treatment.
Treatments as denoted by the key, n = 100.
6.3.3.1 Relationships between spectral reflectance and physiological and
biochemical variables
Using data across all treated and control plants, it was found that there was a
strong negative relationship between the photosynthetic activity and spectral
reflectance in the visible region (Figure 6.11). Maximum correlations were found in
the green and red regions, precisely at 528nm (r = - 0.71) and 715nm (r = - 0.74)
respectively. Across the NIR and SWIR only weak relationships were found for
photosynthetic activity.
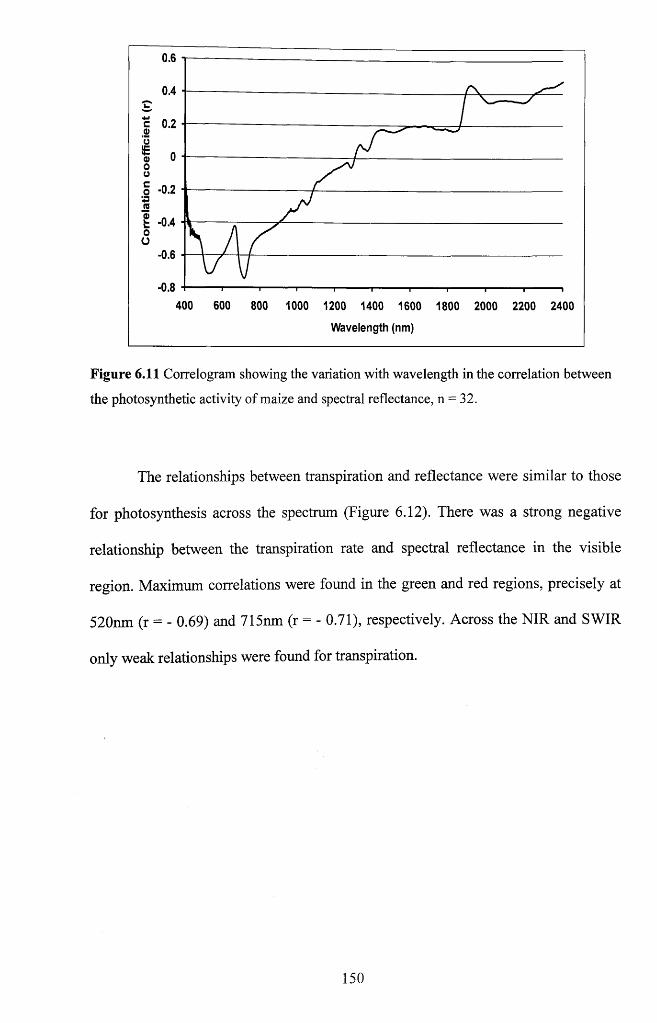
0.6
0.4
E -0.4
- 0.6
- 0.8
400 600
Wavelength (nm)
Figure 6.11 Correlogram showing the variation with wavelength in the correlation between
the photosynthetic activity of maize and spectral reflectance, n = 32.
The relationships between transpiration and reflectance were similar to those
for photosynthesis across the spectrum (Figure 6.12). There was a strong negative
relationship between the transpiration rate and spectral reflectance in the visible
region. Maximum correlations were found in the green and red regions, precisely at
520nm (r = - 0.69) and 715nm (r = - 0.71), respectively. Across the NIR and SWIR
only weak relationships were found for transpiration.
150
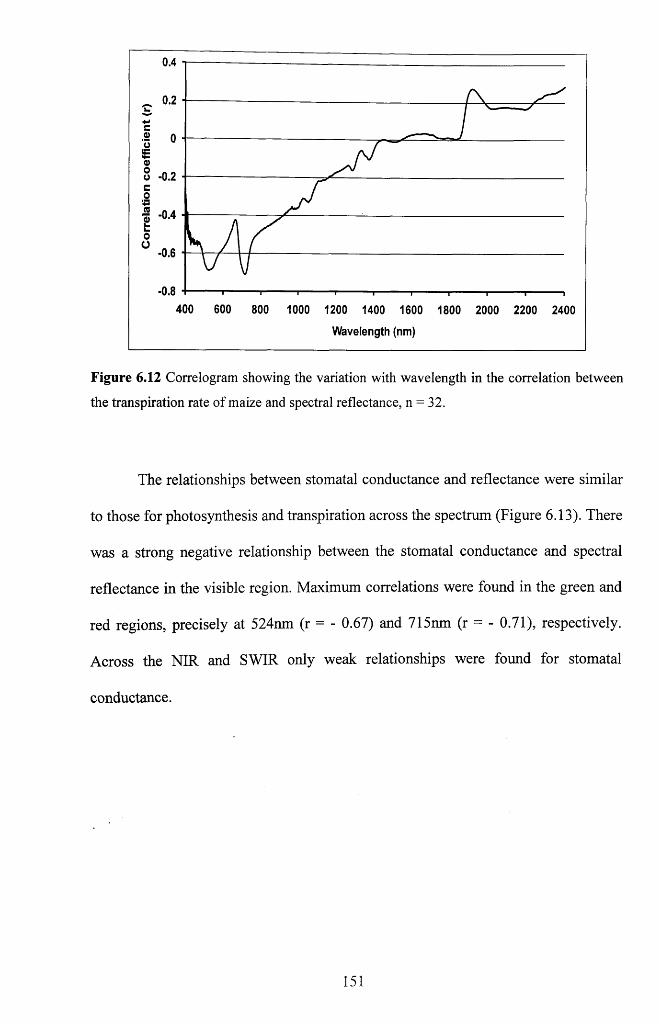
0.4
o -0.2
-0.4
- 0.6
- 0.8
400 600
Wavelength (nm)
Figure 6.12 Correlogram showing the variation with wavelength in the correlation between
the transpiration rate of maize and spectral reflectance, n = 32.
The relationships between stomatal conductance and reflectance were similar
to those for photosynthesis and transpiration across the spectrum (Figure 6.13). There
was a strong negative relationship between the stomatal conductance and spectral
reflectance in the visible region. Maximum correlations were found in the green and
red regions, precisely at 524nm (r = - 0.67) and 715nm (r = - 0.71), respectively.
Across the NIR and SWIR only weak relationships were found for stomatal
conductance.
151
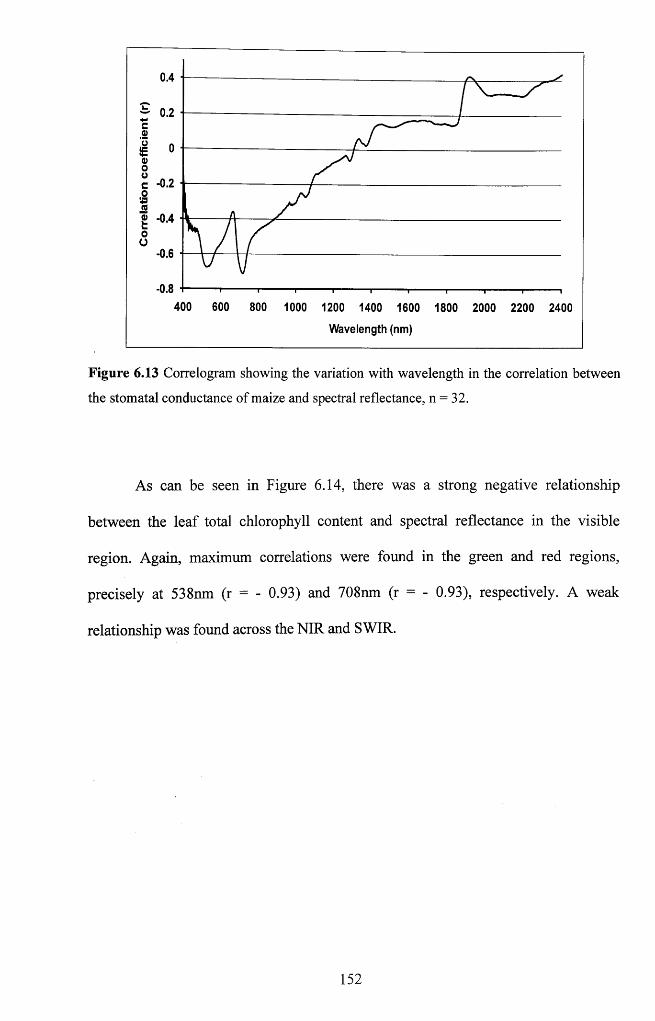
0.4
- 0.2
£ -0.4
- 0.6
- 0.8
400 600
Wavelength (nm)
Figure 6.13 Correlogram showing the variation with wavelength in the correlation between
the stomatal conductance of maize and spectral reflectance, n = 32.
As can be seen in Figure 6.14, there was a strong negative relationship
between the leaf total chlorophyll content and spectral reflectance in the visible
region. Again, maximum correlations were found in the green and red regions,
precisely at 538nm (r = - 0.93) and 708nm (r = - 0.93), respectively. A weak
relationship was found across the NIR and SWIR.
152
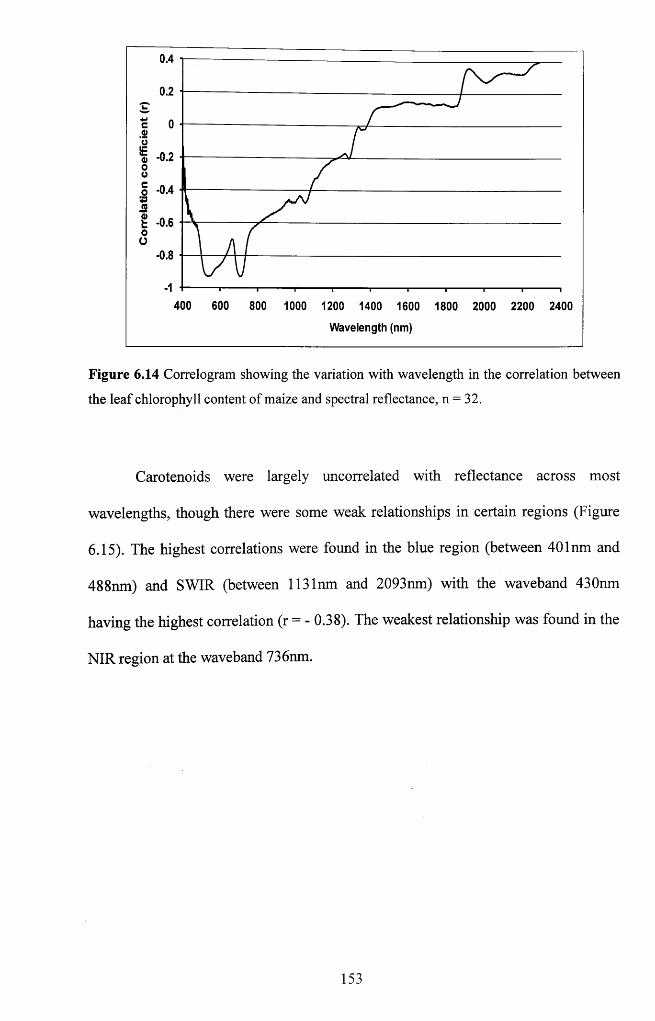
0.4
0.2
- 0.2
- 0.8
400 600
Wavelength (nm)
Figure 6.14 Correlogram showing the variation with wavelength in the correlation between
the leaf chlorophyll content of maize and spectral reflectance, n = 32.
Carotenoids were largely uncorrelated with reflectance across most
wavelengths, though there were some weak relationships in certain regions (Figure
6.15). The highest correlations were found in the blue region (between 401nm and
488nm) and SWIR (between 1131nm and 2093nm) with the waveband 430nm
having the highest correlation (r = - 0.38). The weakest relationship was found in the
N IR region at the waveband 736nm.
153
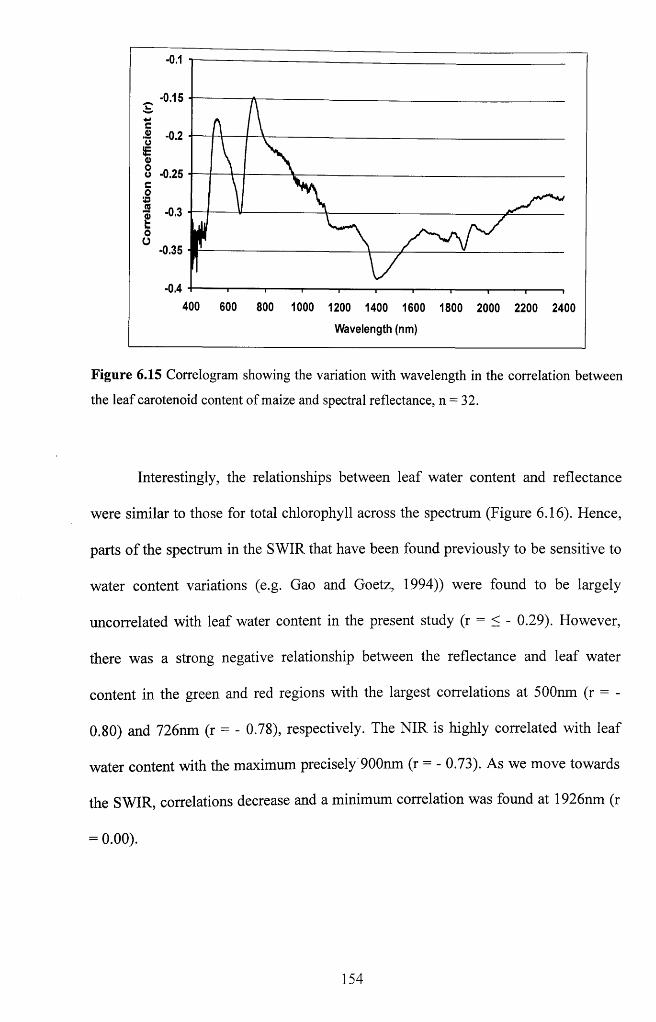
-0.1
-0.15
o -0.25
-0.3
-0.35
-0.4
400 600 800 1000 1200 1400 1600 1800 2000 2200 2400
Wavelength (nm)
Figure 6.15 Correlogram showing the variation with wavelength in the correlation between
the leaf carotenoid content of maize and spectral reflectance, n = 32.
Interestingly, the relationships between leaf water content and reflectance
were similar to those for total chlorophyll across the spectrum (Figure 6.16). Hence,
parts o f the spectrum in the SWIR that have been found previously to be sensitive to
water content variations (e.g. Gao and Goetz, 1994)) were found to be largely
uncorrelated with leaf water content in the present study (r = < - 0.29). However,
there was a strong negative relationship between the reflectance and leaf water
content in the green and red regions with the largest correlations at 500nm (r = -
0.80) and 726nm (r = - 0.78), respectively. The NIR is highly correlated with leaf
water content with the maximum precisely 900nm (r = - 0.73). As we move towards
the SWIR, correlations decrease and a minimum correlation was found at 1926nm (r
= 0 .00).
154
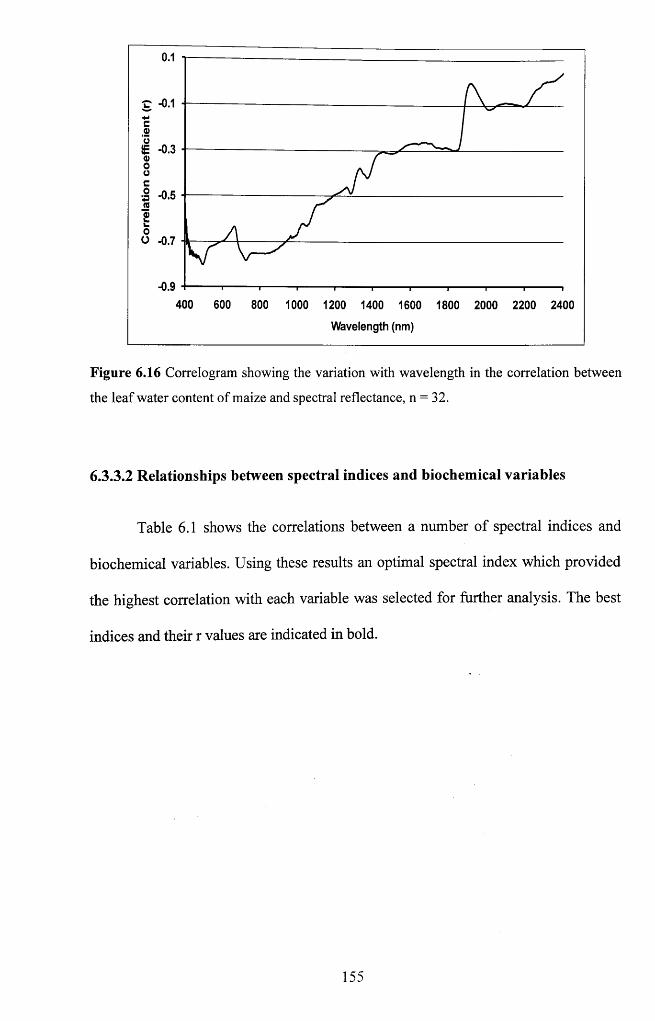
-0.3
-0.5
-0.9
400 600
Wavelength (nm)
Figure 6.16 Correlogram showing the variation with wavelength in the correlation between
the leaf water content of maize and spectral reflectance, n = 32.
6.3.3.2 Relationships between spectral indices and biochemical variables
Table 6.1 shows the correlations between a number o f spectral indices and
biochemical variables. Using these results an optimal spectral index which provided
the highest correlation with each variable was selected for further analysis. The best
indices and their r values are indicated in bold.
155
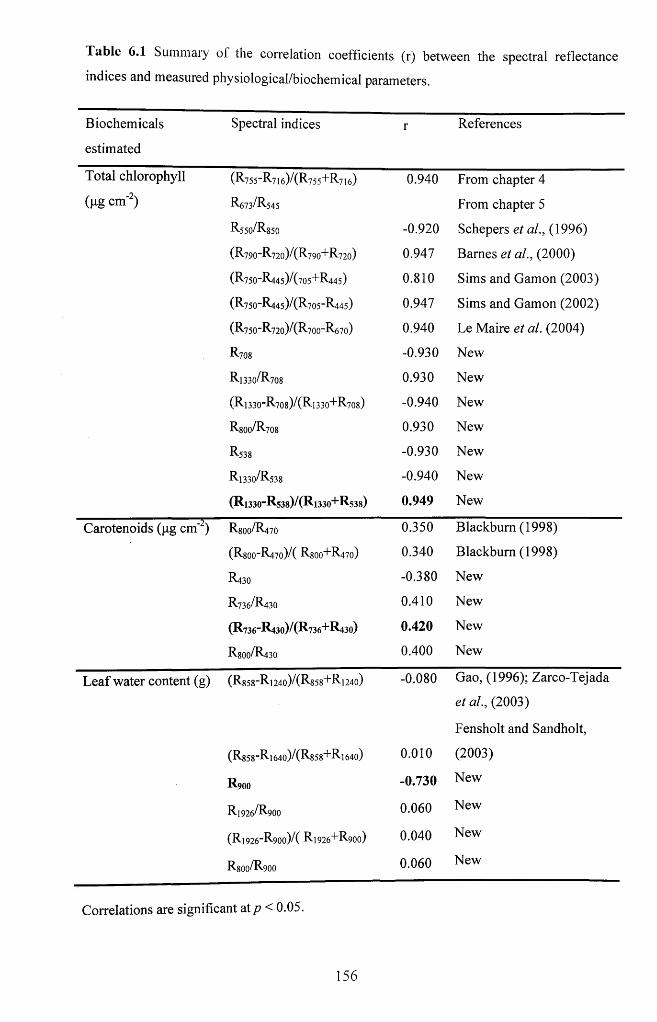
Table 6.1 Summary of the correlation coefficients (r) between the spectral reflectance
indices and measured physiological/biochemical parameters.
Biochemicals
estimated
Spectral indices r References
Total chlorophyll (R 7 5 5 -R 7 16) / (R 7 5 5 + R 7 16) 0.940 From chapter 4(fig cm'2) R673/R545 From chapter 5
R550/R850 -0.920 Schepers et al., (1996)
(R 790-R 720)/(R 790+R 720) 0.947 Barnes et al., (2000)
(R75O -R445)/(705+ R 445) 0.810 Sims and Gamon (2003)
(R 75O -R445)/(R 705-R 445) 0.947 Sims and Gamon (2002)
(R 75O -R 720)/(R 700-R 670) 0.940 Le Maire et al. (2004)
S’
O 00 -0.930 New
R1330/R708 0.930 New
( R l 330- R 708) / ( R l 330+ R 708) -0.940 New
R8O0/R7O8 0.930 New
R 538 -0.930 New
R1330/R538 -0.940 New
(R 1 33O -R 538)/(R l330+ R 538) 0.949 New
Carotenoids (pg cm'2) R 80o /R 470 0.350 Blackburn (1998)
( R 800- R 47o ) /( R 800+ R 470) 0.340 Blackburn (1998)
R t 30 -0.380 New
R736/R43O 0.410 New
( R 736“R 43o)/(R 736+ R 430) 0.420 New
R8O0/R43O 0.400 New
Leaf water content (g) (R g 58- R l 240)/( R 858+ R l 24o) -0.080 Gao, (1996); Zarco-Tejada
et al., (2003)
Fensholt and Sandholt,
( R 858“R l 640) / ( R 858+ R l 64o) 0.010 (2003)
R9OO -0.730 New
R l 926/ R 900 0.060 New
( R l 926" R 900) / ( R l 926+ R 900) 0.040 New
R8O0/R9OO 0.060 New
Correlations are significant atp< 0.05.
156
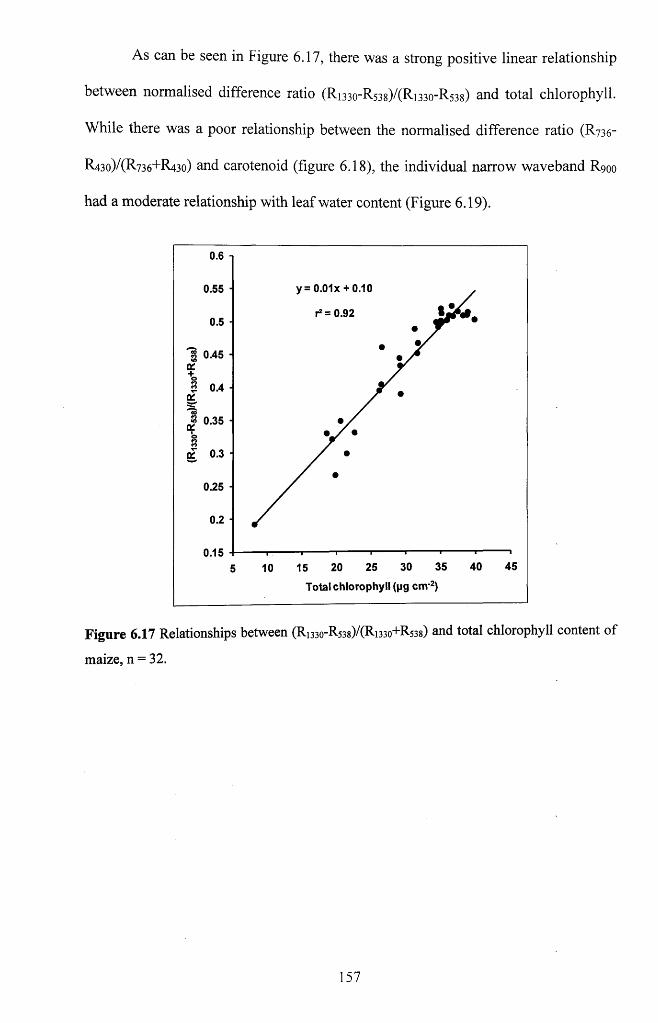
As can be seen in Figure 6.17, there was a strong positive linear relationship
between normalised difference ratio (Ri330-R538)/(Ri330-R538) and total chlorophyll.
While there was a poor relationship between the normalised difference ratio (R736-
R43o)/(R736+R43o) and carotenoid (figure 6.18), the individual narrow waveband R900
had a moderate relationship with leaf water content (Figure 6.19).
y= 0.01x + 0.100.55 ■
r* = 0.92
8 0.45 ■
0.35 ■
0.25 ■
0.154540
Total chlorophyll (pg cm’2)
Figure 6.17 Relationships between (Ri330-R538)/(Ri330+R538) and total chlorophyll content of
maize, n = 32.
157
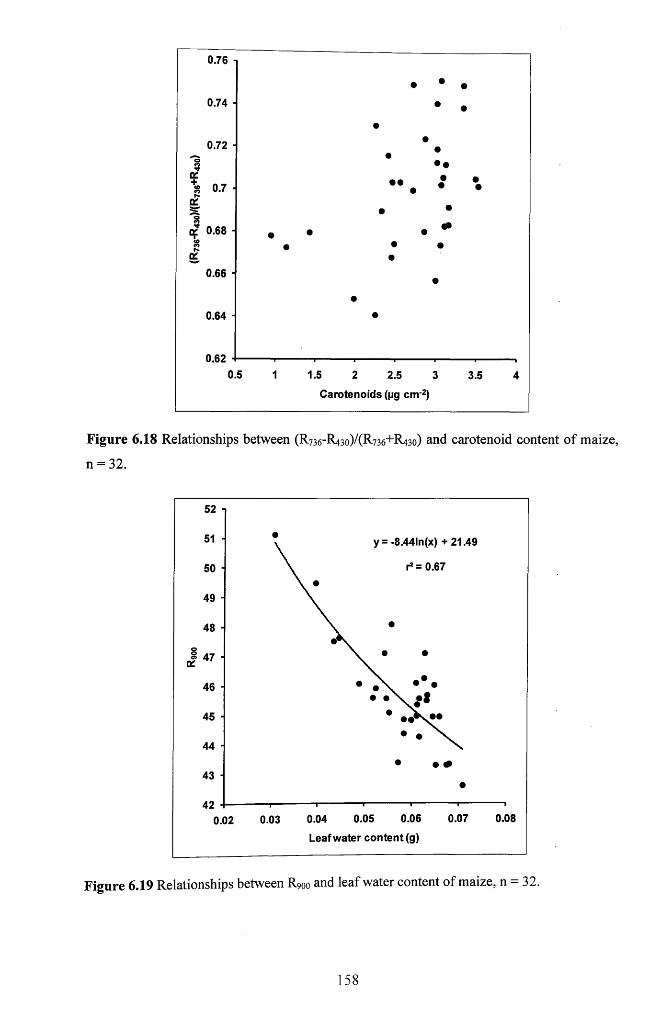
0.76 !
0.74 ■
0.72 ■
9?<0«9h-
CL
0.66 -
0.64 -
0.620.5 1 1.5 2 2.5 3 3.5 4
C arotenoids (pg cm 2)
Figure 6.18 Relationships between (R736-R43o)/(R736+R43o) and carotenoid content of maize,
n = 32.
y=-8.44ln(x) + 21.49
r2 = 0.67
45 ■
44 ■
• #43 -
0.06 0.07 0.080.05
Leaf w ater co n ten t (g)
0.040.030.02
Figure 6.19 R elation sh ip s b etw een R 9oo and le a f w ater con ten t o f m a ize , n = 32 .
158

6.3.3.3 Temporal response of optimal spectral indices
As can be seen in Figure 6.20, the optimal chlorophyll index (R1330-
R-538)/(Ri330+R538) decreased in treated plants as stress progressed. Before visual
stress symptoms were observed, the index significantly reduced for plants treated
with oil and combined oil and water deficit (on day 6), compared to the controls (see
Table 6.2). However, no significant reduction in the index was observed in plants
treated with water deficit throughout the experiment. This implies that a significant
reduction in (Ri330-R538)/(Ri330+R538) was only observed whenever oil was involved
in the treatment. Thus, oil and oil and water deficit treatments showed a reduction in
(Ri330-R538)/(Ri330+R538), but there was no significant difference between these two
treatments throughout the experiment. By the end of the experiment, there was a total
reduction o f the index of treated plants by approximately 44% and 42% for oil and
the combined oil pollution and water deficit, respectively.
140
120 -
40-
18 2 01612 141086420
------ • ------ Gontrol..... □ •••• Ql stress------A — V\feter stress— - 0 “ - QMAkter stress
Time (days)
Figure 6.20 Change in (Ri33o-R538)/(Ri33o+R538) with time. Treatments are denoted by the key. Bars = 1 x SE, n = 10.
159
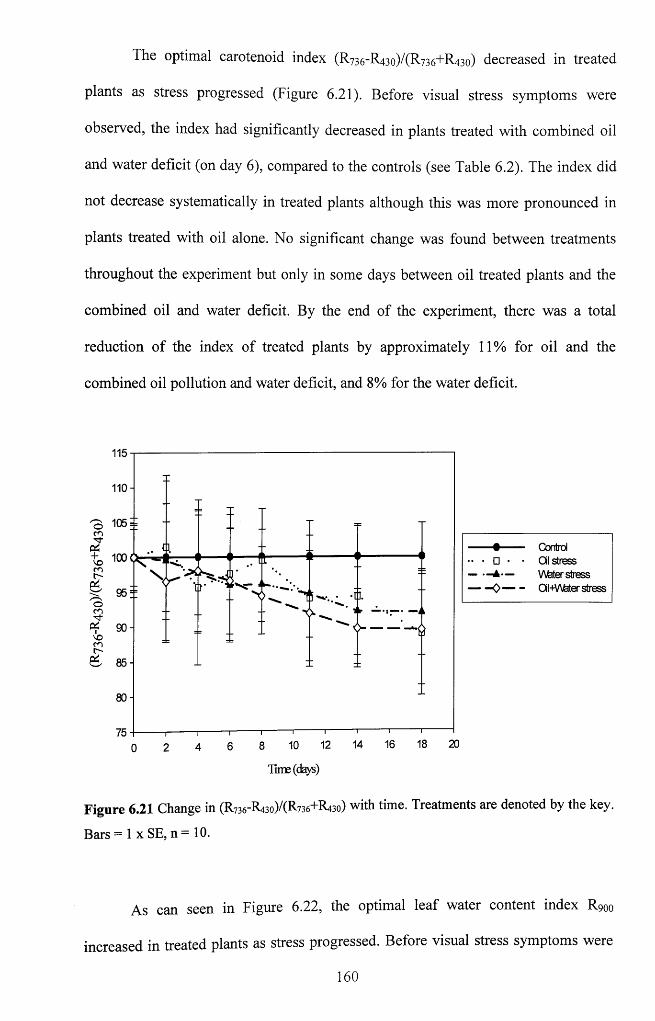
The optimal carotenoid index (R736-R43o)/(R736+R43o) decreased in treated
plants as stress progressed (Figure 6.21). Before visual stress symptoms were
observed, the index had significantly decreased in plants treated with combined oil
and water deficit (on day 6), compared to the controls (see Table 6.2). The index did
not decrease systematically in treated plants although this was more pronounced in
plants treated with oil alone. No significant change was found between treatments
throughout the experiment but only in some days between oil treated plants and the
combined oil and water deficit. By the end of the experiment, there was a total
reduction of the index of treated plants by approximately 11% for oil and the
combined oil pollution and water deficit, and 8% for the water deficit.
110 -
3 105 TCO
? A •• to W O iV -COI » ±oCO
9CHVO COty
& 85 -]
. . ' S r * ,
11
- ■"If * V
E— — — A
<(-------- ’- i
80 H
75
----- • ----- Control. • Oil stress
----- A— V\Mer stress------0 ----- Oil+V\feter stress
0 2 4 6 8 10 12 14 16 18 20
Time (days)
Figure 6.21 Change in (R736-R43o)/(R736+R43o) with time. Treatments are denoted by the key.
Bars = 1 x SE, n = 10.
As can seen in Figure 6.22, the optimal leaf water content index R90o
increased in treated plants as stress progressed. Before visual stress symptoms were
160
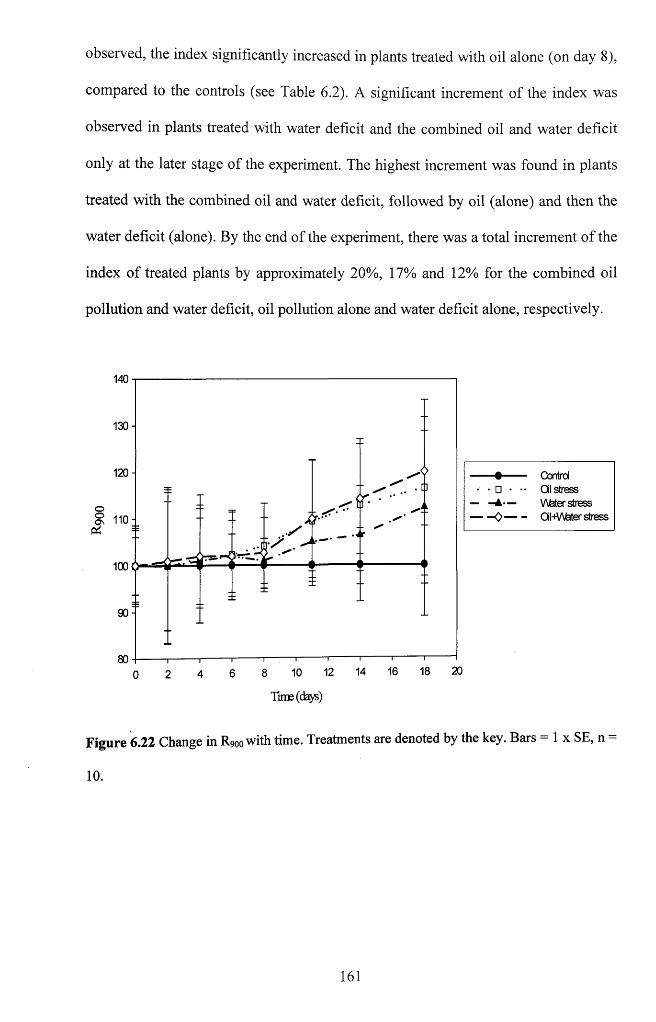
observed, the index significantly increased in plants treated with oil alone (on day 8),
compared to the controls (see Table 6.2). A significant increment of the index was
observed in plants treated with water deficit and the combined oil and water deficit
only at the later stage of the experiment. The highest increment was found in plants
treated with the combined oil and water deficit, followed by oil (alone) and then the
water deficit (alone). By the end of the experiment, there was a total increment o f the
index o f treated plants by approximately 20%, 17% and 12% for the combined oil
pollution and water deficit, oil pollution alone and water deficit alone, respectively.
140
130 -
120 -
100 q ■
90-
18 2 0161412108
Time (days)
------ • ------ ControlOil stress
_ - A — V\feter stress------ 0 ----- OiHV\feter stress
Figure 6.22 Change in R900 with time. Treatments are denoted by the key. Bars - 1 x SE, n -
10.
161
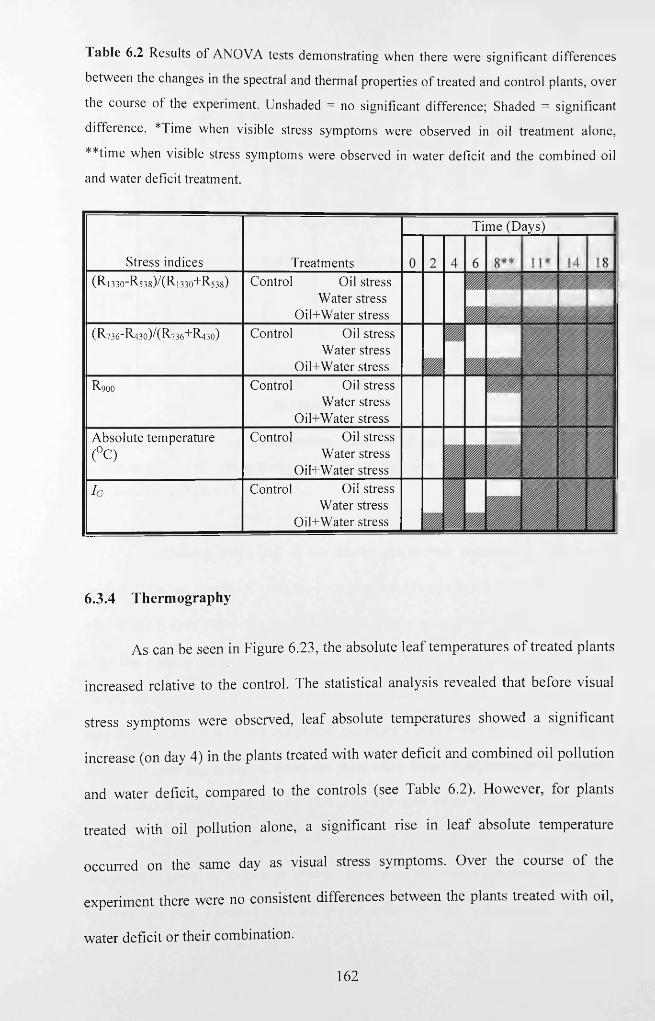
Table 6.2 Results of ANOVA tests demonstrating when there were significant differences
between the changes in the spectral and thermal properties o f treated and control plants, over
the course o f the experiment. Unshaded = no significant difference; Shaded = significant
difference. *Time when visible stress symptoms were observed in oil treatment alone,
**time when visible stress symptoms were observed in water deficit and the combined oil
and water deficit treatment.
Stress indices Treatments(R l3 3 0 -R 5 3 8 ) / (R l3 3 0 + R 5 3 8 ) Control Oil stress
Water stress Oil+Water stress
(R 7 3 6 -R 4 3 0 )/(R 736+ R 430) Control Oil stressWater stress
Oil+Water stressR,■900 Control Oil stress
Water stress Oil+Water stress
Absolute temperature(°C)
Control Oil stressWater stress
Oil+Water stress
In Control Oil stressWater stress
Oil+Water stress
6.3.4 Therm ography
A s can be seen in Figure 6.23, the absolute le a f tem peratures o f trea ted plan ts
increased relative to the control. The statistical analysis revealed that before visual
stress sym ptom s w ere observed, lea f absolute tem peratures show ed a sign ifican t
increase (on day 4) in the plants treated w ith w ater deficit and com bined oil po llu tion
and w ater deficit, com pared to the controls (see Table 6.2). H ow ever, for p lan ts
trea ted w ith oil po llu tion alone, a significant rise in le a f absolute tem peratu re
occurred on the sam e day as visual stress sym ptom s. O ver the course o f the
experim ent there w ere no consistent differences betw een the p lants trea ted w ith oil,
w ater deficit or their com bination.
162
Time (Days)
^9999999999999999999999
99999
098262
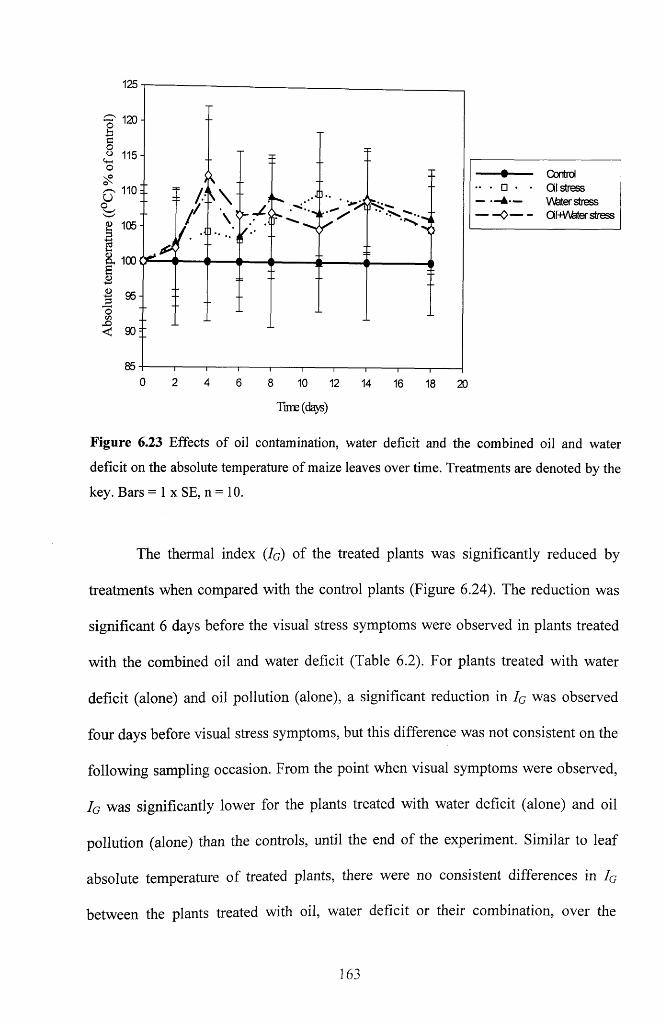
• □ • —A— —0 —
— Control• Oil stress
V\Mer stress- Oil-M&ter stress
8 10 12 14 16 18 20
Time(da>s)
Figure 6.23 Effects of oil contamination, water deficit and the combined oil and water
deficit on the absolute temperature of maize leaves over time. Treatments are denoted by the
key. Bars = 1 x SE, n = 10.
The thermal index (IG) of the treated plants was significantly reduced by
treatments when compared with the control plants (Figure 6.24). The reduction was
significant 6 days before the visual stress symptoms were observed in plants treated
with the combined oil and water deficit (Table 6.2). For plants treated with water
deficit (alone) and oil pollution (alone), a significant reduction in IG was observed
four days before visual stress symptoms, but this difference was not consistent on the
following sampling occasion. From the point when visual symptoms were observed,
Ig was significantly lower for the plants treated with water deficit (alone) and oil
pollution (alone) than the controls, until the end of the experiment. Similar to leaf
absolute temperature o f treated plants, there were no consistent differences in IG
between the plants treated with oil, water deficit or their combination, over the
163
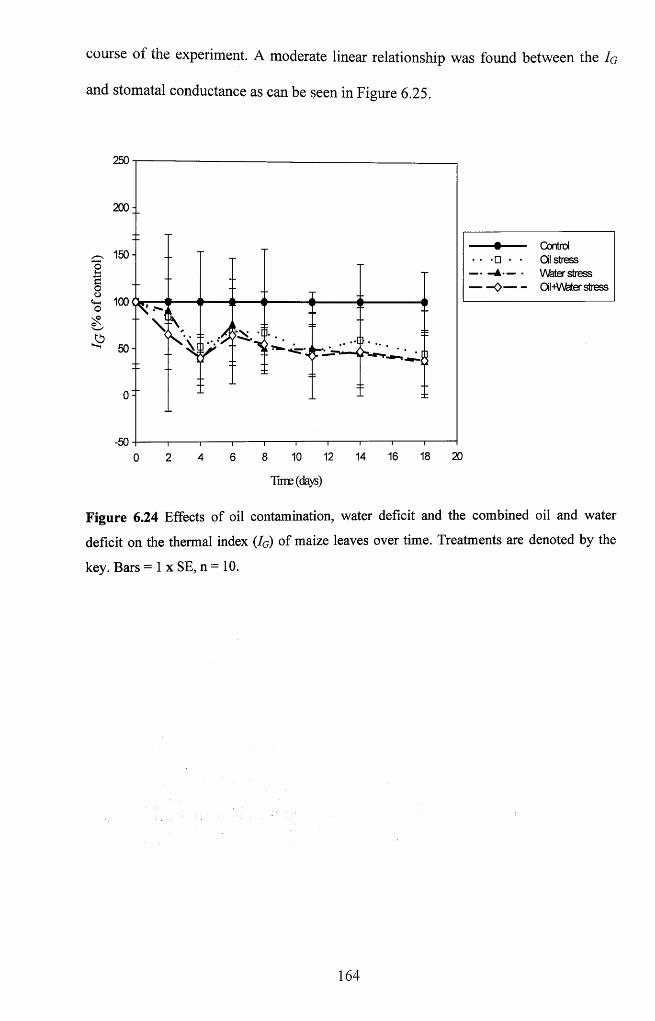
course of the experiment. A moderate linear relationship was found between the Ig
and stomatal conductance as can be seen in Figure 6.25.
250
200 -
Control Oil stress V\feter stress OiMAfeter stress
150 -
100
50-
-5016 18 2010 12 14860 2 4
Time (days)
Figure 6.24 Effects of oil contamination, water deficit and the combined oil and water
deficit on the thermal index (/G) of maize leaves over time. Treatments are denoted by the
key. Bars = 1 x SE, n = 10.
164
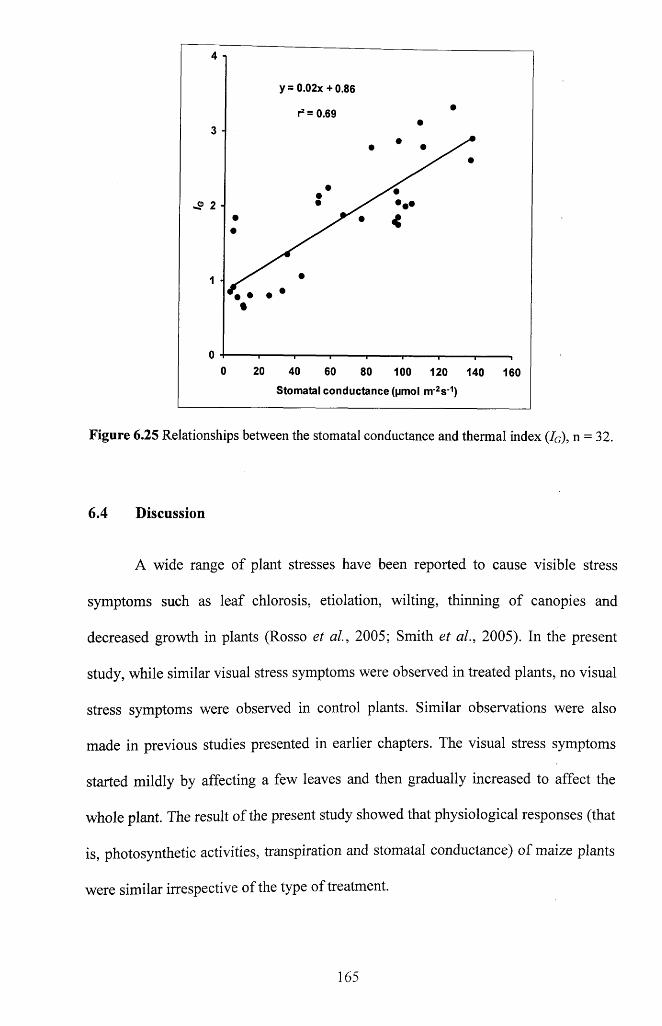
4
y= 0.02x +0.86
ra = 0.693
• • •
1
00 20 40 60 80 100 120 140 160
Stomatal conductance (pmol m 2S '1)
Figure 6.25 Relationships between the stomatal conductance and thermal index (IG), n = 32.
6.4 Discussion
A wide range of plant stresses have been reported to cause visible stress
symptoms such as leaf chlorosis, etiolation, wilting, thinning o f canopies and
decreased growth in plants (Rosso et al., 2005; Smith et al., 2005). In the present
study, while similar visual stress symptoms were observed in treated plants, no visual
stress symptoms were observed in control plants. Similar observations were also
made in previous studies presented in earlier chapters. The visual stress symptoms
started mildly by affecting a few leaves and then gradually increased to affect the
whole plant. The result of the present study showed that physiological responses (that
is, photosynthetic activities, transpiration and stomatal conductance) o f maize plants
were similar irrespective of the type of treatment.
165
For all of the physiological variables, plants treated with water deficit alone
and the combined oil and water deficit responded at a faster rate than those treated
with oil pollution. A recent study found that when irrigation was withheld to induce
severe soil drying, gas exchange decreased and then stopped in three Mediterranean
cedar species: Cedrus atlantica, C. Brevifolia and C. Libani (Ladjal et al., 2007). An
empirical study by Ray and Sinclair (1998) found that the overriding factor
determining transpirational response in maize (Zea mays L.) and soyabean (Glycine
max L.) to drought stress was soil dryness. A recent study attributed reduced
transpiration in plants to soil water limitation as well-irrigated crops can usually
supply enough water to the leaves to satisfy transpiration demand (Tilling et al.,
2007). In the present study, treatments may have reduced soil water needed to sustain
transpiration processes and thus, can explain the decrease in transpiration rates of
plants. When transpiration is restricted due to lack o f water, stomata closure is
induced resulting in less water evaporating from the leaf surface (Jackson, 1986).
Not surprisingly similar responses were found for transpiration and stomatal
conductance in the present study and this is explained by the strong linear
relationship found between transpiration and stomatal conductance.
Maize plants treated with oil pollution alone also experienced a reduction in
both the transpiration and stomatal conductance. It is known that oil can reduce water
uptake by wheat (Jong, 1980) and thus, oil may have indirectly caused a reduction in
transpiration and stomatal conductance in maize. It was observed that the
physiological properties of plants treated with oil alone reduced at a slower rate than
those treated with water deficit and the combined oil and water deficit. The different
method of stress application used can explain this situation. For oil treatment, a
single application was made while water deficit stress was instigated by continuously
166
decreasing the amount of water plants may require for growth. Consequently, oil
treatment affected plant physiology at a slower rate compared to water deficit which
rapidly decreases plant physiology.
The total chlorophyll content of plants treated with oil pollution decreased
significantly in contrast with those treated with water deficit alone. A significant
change in total chlorophyll content of plants treated with oil occurred before visual
stress symptoms were observed. This is in contrast with total chlorophyll content of
plants treated with water deficit which at no time showed a significant change. This
implies that by quantifying the total chlorophyll content, plant stress caused by oil
pollution can be detected early and also could be discriminated from water deficit
stress. The reduction in total chlorophyll content of plants treated with oil may
possibly be attributed to the toxic effects of oil as it destroys cell membranes. Indeed,
previous studies have found that oil can penetrate plants/leaf tissue and consequently,
destroy cellular integrity, and prevent leaf and shoot regeneration (Webb, 1994;
Pezeshki et a l , 1995; Pezeshki et al., 2000). Earlier work has also noted that changes
in chlorophyll content can be caused not only by water stress but also by the
phenological status of the plant, atmospheric pollution, nutrient deficiency, toxicity,
plant diseases, and radiation stress (Larcher, 1995). However, several studies have
shown that chlorophyll does not always relate to water content. In a temperate forest,
no correlation was found between the chlorophyll and water content for five different
species (Gond et al., 1999). It was reported that while the chlorophyll concentration
decreases in autumn due to the phenological status of the plant in some of the
species, the water content remained constant (Gond et al., 1999).
In the present study, while the photosynthetic activities of plants treated with
water deficit reduced significantly, their total chlorophyll content did not change
167
significantly. The result obtained in this study concurs with the findings of Maracci
et al., (1991) where maize (Zea mays L.) subjected to drought stress experienced
some disturbances in the photosynthetic functioning of the plant without a change in
the pigment concentration. Maracci et al. (1991) reported that while the chlorophyll
concentration remains unchanged, the net photo synthetic activity o f the maize plants
decreases with increasing water deficiency. Earlier works also found that the
stomatal closure reduces leaf photosynthesis because of restricted entry o f CO2
through stomatal pores (Pezeshki and DeLaune, 1993; Webb, 1994; Pezeshki et al.,
1995). Furthermore, water stress may cause closure of leaf stomata and a reduction in
CO2 supply (Jackson and Ezra 1995). This evidence can explain the findings
concerning the disruption in photosynthetic activities o f plants treated with water
deficit which may be attributed to stomatal closure and/or accumulation of internal
CO2 rather than a decrease in chlorophyll content. Thus, this suggests that the
photosynthetic response of plants treated with water deficit may indicate indirect
effects of a reduction in transpiration and stomatal conductance rather than a
reduction in photosynthetic pigments.
It is known that carotenoids generally decline less quickly than chlorophyll
(Sims and Gamon, 2002), perhaps due to its role as a photoprotective pigment
(Demming-Adams and Adams, 1996; Hartel and Grimm, 1998). Additionally, it has
been found that the concentrations of carotenoids are usually high enough in stressed
leaves that absorption in the 400 to 500nm range remains similar to that in healthy
leaves (Merzlyak et al., 1999). These concepts possibly explain the inconsistency
and insignificant change in carotenoid content of treated plants in the present study.
The few occasions where carotenoid content of treated plants were higher than those
o f the control, may possibly be attributed to the damaging effect of the stresses.
168
Interestingly from the results, there is an indication that carotenoids were able to
perform the photoprotective function irrespective of stress type.
The reduction in leaf water content of treated plants was not significant until
8 days after treatment. This concurs with Beaumont (1995) who found that the water
content o f sunflower leaves did not change much due to moderate water stress since
the plant tried to maintain a level compatible with its basic functioning. Past studies
indicate that a reduction in transpiration helps to conserve available water (Larcher,
1995), as does the stomatal conductance as explained earlier in this section. Thus, the
insignificant change in leaf water content of the treated plants identified at the early
stage o f plant stress may be attributed to plant water conservation mechanisms as
both transpiration and stomatal conductance are reduced. A significant change in leaf
water content did not occur until the later stage of the experiment when plants
perhaps could no longer conserve water. At that point, visual stress symptoms caused
by oil pollution, water deficit and the combined oil and water were manifest.
The results of the present study indicated that spectral reflectances o f treated
plants were sensitive to various stresses and this conforms to the findings of
numerous studies that used a wide range of plant stresses such as water logging,
natural gas, nutrient stress, heavy metal toxicity and soil oxygen deficiency
(Woolley, 1971; Horler et a l, 1983; Milton et a l, 1989; Carter, 1993; Carter and
Miller, 1994; Anderson and Perry, 1996; Noomen et a l, 2003; Smith et al., 2004). It
has long been known that stress generally increases reflectance in the visible region
due to a decrease in the dominant absorption features such as the photosynthetic
pigments. Thus, light reflected by vegetation in the visible region o f the spectrum is
predominantly influenced by the presence of chlorophyll pigments in the leaf tissues
(Haboudane et a l, 2002). Similar to the result of this study, Carter (1993) noted that
169
foi individual leaves; increased reflectance at visible wavelengths (400 — 700nm) is
generally the most consistent response to stress within the 400 - 2500nm range.
Expectedly, the relationships between photosynthesis, total chlorophyll and
carotenoids of treated plants and reflectance were strongest in the visible region. The
sensitivity o f other physiological and biochemical variables such as the leaf water
content, transpiration and stomatal conductance were expected to be found at the
other regions of the spectrum (Ceccato et al., 2001). On the contrary, their
relationships with reflectance were also found to be strongest in the visible region.
The reason for this may be due to the interrelationship found between the leaf water
content and total chlorophyll and the fact that the total chlorophyll was changing
over a much wider range (86%) than leaf water content (57%). Thus indirect
relationships were observed between water content reflectance in the visible region.
The NIR reflectance is influenced principally by the internal cell structure of
the leaf (Ceccato et al., 2001; Tilling et al., 2007). Well-hydrated, healthy spongy
mesophyll cells strongly reflect infrared wavelengths (Gates et al., 1965). Leaf turgor
is associated with cellular growth and function (Graeff and Claupein, 2007). When
turgor becomes zero under strong water deficiency, the cells collapse and the leaf
wilts. Turgor can be maintained by cell wall hardening during the development o f a
water deficit. While cell wall hardening helps to sustain turgor, it impedes cell
growth. Structural changes in the arrangement of the spongy mesophyll structure, as
described by Ripple (1986) and Boyer et al. (1988), may occur as a consequence o f a
loss o f cell turgor pressure and this has implications for leaf reflectance. As the leaf
internal structure may have deteriorated due to a reduction in transpiration and
stomatal conductance, other factors may have biased the relationship that was found
between the transpiration/stomatal conductance and reflectance in the NIR and
170
SWIR regions such as the leaf dry matter content. Additionally, the leaf internal
structure which Ceccato et al. (2001) found to have the greatest influence for
reflectance at 1600nm may have added to the weak relationships found in the SWIR.
Similar to the results found in the present study, Woolley (1971), Bowman
(1989), Carter et al. (1989) and Graeff and Claupein (2007) also found that
reflectance tends to increase in the 400 - 1300nm region, when water is lost from a
leaf. The reason for the increase of reflectance in the 400 - 1300nm region has been
inferred as the changing of the internal structure of the leaf besides water loss
(Sinclair et al., 1971; Gausman and Allen, 1973; Graeff and Claupein, 2007). In the
visible wavelengths, absorption by leaf water content is weak and changes in
reflectance resulting directly from leaf water loss will not be directly detectable
(Danson and Aldakheel 2000). This concurs with the results o f this study as
reflectance in the visible region by plants treated with water deficit alone was
insignificant when compared to those treated with oil or the combined oil and water
deficit. Furthermore, the incidental increase in reflectance in the visible region by
plants treated with water deficit may be attributed indirectly to the apparent stomata
closure and consequential reduction in C 0 2 supply. Similarly, earlier workers noted
that closure of leaf stomata and a reduction in C 0 2 supply may lead to increased
visible reflectance (Jackson and Ezra, 1995).
For individual leaves, there is normally a negative relationship between the
leaf water content and reflectance in the near and middle infrared wavelengths
(Danson et al., 1992; Aldakheel and Danson, 1997). This concurs with our
correlation in the NIR region but disagrees with the ones in the visible and the SWIR
regions where correlations were strongest and weakest respectively. These studies
attributed the strong relationships as a direct function of the absorption
171
characteristics of water, which dominate the spectral response of vegetation in that
region. The weak correlation found between reflectance and the leaf water content in
the SWIR region may be due to other factors influencing reflectance at that region
such as the leaf dry matter and the leaf internal structure (Ceccato et al., 2001). An
empirical study by Cheng et al. (2006) found that at the leaf scale, changes in dry
matter content produced more errors in water content than other leaf biochemical
properties. Studies have reported extensive influences caused by both dry matter
content and leaf internal structure parameter on reflectance in the NIR and SWIR
regions simulated by the PROSPECT leaf reflectance model (Ceccato et al., 2001;
Bacour et al., 2002). A study by Cheng et al., (2006) demonstrated that more
significant changes in leaf reflectance are introduced by changes in leaf dry matter
than by leaf internal structure. Therefore, the correlation between reflectance and the
leaf water content in the SWIR region may have been further complicated by
variations in the leaf dry matter content. However, the strong correlation found
between reflectance and the leaf water content in the visible region may indirectly be
related to the influence of strong absorption by the chlorophylls and carotenoid at
that spectral region as discussed previously in this section.
Based on the spectral indices tested, additional evidence was found about the
relationships between reflectance and the measured physiological/biochemical
variables. A normalized-difference spectral indices (Ri330-R538)/(Ri330+R538) that
combined a waveband in the green with one in the NIR region had a strong
relationship with total chlorophyll content. Several studies have shown similar results
where the leaf reflectance values around 580 and 700nm wavelengths were closely
related with leaf chlorophyll level (Jacquemoud and Baret, 1990; Daughtry et a l,
2000; Carter and Spiering, 2002; Zhao et a l, 2003). Thus, earlier studies noted that
172
the green-peak and red-edge spectral regions are generally critical for the detection
o f plant stress (Schepers et al., 1996; Carter and Knapp, 2001). Furthermore, an
empirical study by Zhao et al. (2005) found that among other reflectance ratios, the
one that combined reflectance values in the green or red regions with one in the NIR
had the strongest relationship with chlorophyll concentrations in cotton (Gossypium
hirsutum L.). Additionally, the index significantly decreased in plants treated with oil
and the combined oil and water deficit before visual stress symptoms were observed
when compared with the control. On the contrary, the index did not show significant
change in plants treated with water deficit alone when compared with the control.
The weak relationships found in the present study between the carotenoid
spectral indices and carotenoid concentration concurs with the findings of Blackburn
(1998b). While identifying the optimum wavebands for pigment indices using leaves
o f four different deciduous tree species at different phenological stage, the author
found no relationships between carotenoid specific simple/normalised difference
ratios and carotenoids concentration. The result was attributed to the effects of
convolution of carotenoid absorption maxima with other pigments. This may
possibly be the case in the present study a stronger relationship was also found
between chlorophylls and reflectance (R = - 0.49) in the same region where
carotenoid absorption maxima was found (see figure 6.14). This may also be
responsible for the significant decrease of the carotenoids index (R736-
R43o)/(R736+R43o) of treated plants when compared with the controls. Previous work
noted that chlorophyll has strong absorption peaks not only in the red regions o f the
spectrum but also in the blue region where its absorption peak overlaps with the
absorbance of the carotenoid (Sims and Gamon, 2002). However, results from
further work undertaken by Blackburn (1998a) show much better relationships
173
between carotenoid specific simple/normalised difference ratios and carotenoid
concentration in bracken (Pteridium aquilinum) canopy. The author attributed this to
an increased range o f carotenoid concentrations per unit area used in the canopy
scale experiment compared to the deciduous tree leaves study.
Regarding thermal responses o f leaves to treatments, the consistent increase
in the absolute temperatures of the treated plants in relation to the controls is likely to
be due to the reduction in the transpiration and stomatal conductance o f treated
plants. The early significant difference found between the absolute leaf temperatures
o f plants treated with water deficit and the combined oil and water deficit treated
plants and control plants as presented in Table 6.3 show that, a change in the absolute
temperature of the leaf in response to stress may be useful for early detection of
water deficit stress in plant. However, the results indicate that absolute leaf
temperature may only be useful for detecting plant stress caused by oil pollution after
a prolonged period of stress. The inconsistent and insignificant differences found
between the absolute temperature of plants subjected to different types of treatment
indicates the limitation in this remotely-sensed parameter in predicting accurately the
type o f stress affecting the plants i.e. it is difficult to discriminate between oil and
water deficit stress. Therefore, prior knowledge about the type o f stress affecting
plant may be required for accurate detection of stress using the leaf absolute
temperature. The response in absolute temperature to treatments in this study differ
from that found in chapter four where no significant difference was found between
the leaf absolute temperature of the treated plants and the control. One possible
explanation to this is that, unlike in chapter four where, environmental variation may
have influenced absolute leaf temperatures (which is inevitable in an experiment with
relatively large plants distributed across a greenhouse), in this study, thermal
174
measurements were undertaken in a more confined environment (dark room) where
environmental variation was minimal.
Generally, the results show that the thermal index (Ig) can detect oil pollution
and water deficit stress in maize. Similar to the leaf absolute temperature, the
consistent decrease in the thermal index (Ig) o f treated plants as percentage o f control
is likely to be responding to the reduction in the transpiration and stomatal
conductance of treated plants. The time of response of the Ig to treatments suggests
that the Ig may be useful for early detection of stress caused by the combined oil and
water deficit. However, this is not the case for plants treated with oil alone and water
deficit alone, as their Ig was found to be consistently and significantly different from
the control on the same day as visible stress symptoms. Like the leaf absolute
temperature, it may be difficult to accurately predict the type of stress affecting the
plant due to inconsistency and insignificant differences found between the Ig o f the
plants exposed to different types of treatment. Again, this suggests that there may be
the need for prior knowledge of stress affecting plants before accurate discrimination
can be achieved using the Ig. The relationships found between the stomatal
conductance and the Ig in this chapter was similar to that found in chapter four,
although an exponential relationship was found in the present study. The difference
between the form of the relationship may be attributed to the use of larger dataset,
incorporating a wider range of values in this study compared to the previous study.
In summary, by using spectral reflectance in chlorophyll absorption bands
particularly in the regions 513 to 639nm and 680 to 722nm, it was possible to
discriminate between oil and water deficit stress in maize as reflectance associated
with oil pollution was significantly higher than that associated with water deficit in
these wavebands. Also, the water absorption wavebands in the regions 1387 to
175
1536nm can be used to discriminate between oil and water deficit stress in maize as
reflectance associated with water stress was significantly higher than that associated
with oil pollution in this wavebands. Additionally, while the chlorophyll index
(Ri330-R538)/(Ri330+R538) can detect oil-related stress but not water deficit stress, the
leaf absolute temperature can detect water deficit and Iq can detect combined oil and
water deficit stress in maize, respectively. This suggests that the combination of
hyperspectral and thermal remote sensing can not only detect oil and water deficit
stress in maize before visual stress symptoms manifest, but also can effectively
discriminate between the two stresses.
6.5 Conclusion
The results of this study indicate that the concept of measuring leaf spectral
reflectance and thermal responses for early detection and discrimination between oil
and water deficit stresses in plant is sound. It was demonstrated that hyperspectral
remote sensing can accurately measure the chlorophyll concentration in leaves. This
study shows that oil pollution adversely affects leaf chlorophyll content and
therefore, plant stress caused by oil pollution can be detected remotely. Remote
sensing of carotenoid concentration alone is not sufficient both for early detection
and discrimination between oil pollution and water deficit stress. However, it can
provide additional information about plant stress particularly as carotenoids maintain
some degree o f stability while chlorophyll content is decreasing. Hyperspectral
remote sensing may not be suitable for assessment of stress in maize caused by water
deficit alone. This is because plants may show signs of stress including reduced
evapotranspiration without experiencing a reduction in chlorophyll content.
176
However, results show that chlorophyll index (Ri33o-R538)/(Ri330TR538) can detect oil
related stress before visual stress symptoms are observed.
Interestingly, thermography appears to have some potential in this regard.
While changes in leaf absolute temperature can indicate water deficit stress in maize
prior to visual stress symptoms, it may be difficult to discriminate between oil and
water deficit stress using this measure. Indirect measurement of the stomatal
conductance using Iq has potential in pre-visual detection of stress caused by the
combined oil and water deficit but, again, this lacks the ability to discriminate
between oil and water deficit stress. Thus, the findings suggest that the combination
o f hyperspectral and thermal remote sensing has potential in the early detection and
discrimination between oil and water deficit stress in maize. The results obtained in
this study were based entirely on single leaf measurements of leaves that experienced
rapid and severe responses to stress. Therefore, in the next chapter, the robustness of
this approach shall be tested on a different species both at leaf and canopy scales.
177
Chapter 7*
ASSESSING THE PERFORMANCE AND STABILITY OF SPECTRAL AND
THERMAL RESPONSES IN BEAN (.Phaseolus vulgaris ‘Tendergreen ’)
TREATED WITH OIL AND WATER DEFICIT AT LEAF AND CANOPY
SCALES
7.1 Introduction
In chapter 6, it was found that the combination of hyperspectral and thermal
remote sensing has potential in the early detection and discrimination between oil
and water deficit stress in maize. Thus, there is the need to test the robustness and
extendibility of this technique using different plant species and measuring both at
leaf and canopy scales. The leaf is a basic and often predominant element in a plant
and thus, the estimation o f its biochemical contents is very meaningful in ecological
studies (Shi et al., 2005). Several studies have noted that the absolute and relative
concentrations of pigments dictate the photo synthetic potential of a leaf and provide
valuable information about the physiological status o f plants (Blackburn, 1998a;
Sims and Gamon, 2002; Gitelson et al., 2003). On the other hand, plant canopies are
structured to maximize canopy photosynthesis under a given irradiance regime
(Monsi and Saeki, 1953). Essentially, the plant canopy plays an important role in the
exchange o f water, energy and greenhouse gases between vegetation and the
atmosphere (Blackburn, 1998b). These processes are dependant on leaf biochemistry
such as chlorophyll, nitrogen concentrations and leaf hydration state (Asner, 1998).
Thus, information about leaf biochemistry could help predict these processes at the
* Part o f this chapter has been published in Proceedings o f the Remote Sensing and Photogrammetry Society (RSPsoc) Annual Conference, Leicester, United Kingdom, 8 -11th September 2009.
178
canopy scale (Sobhan, 2007). Additionally, previous investigations have noted that
canopy reflectance primarily depends on foliar spectral properties (Gates et al., 1965;
Boochs et a l, 1990; Yoder and Pettigrew-Crosby, 1995; Blackburn, 1998b).
Scaling of leaf optical properties to the canopy level is not straightforward
due to a number o f factors. There is non-uniformity in the distribution o f chemical
constituents across a given leaf surface and, in turn, across various leaves within a
plant canopy (Yoder and Pettigrew-Crosby, 1995). This is due to the organisation of
cells and organelles as most proteins and all chlorophylls are packed into chloroplast
that migrate and clump, depending on the light environment (Yoder and Pettigrew-
Crosby, 1995). Furthermore, the non-uniformity can lead to differential absorbance
and reflectance across a leaf surface just as non-uniform vegetation results in
variations in optical properties across a landscape. There are several other factors
which control canopy reflectance including the LAI, soil background, canopy
structure and/or architecture. Interestingly, most of these factors can be controlled in
the laboratory; yet, most laboratory studies about the use o f optical reflectance in
response to specific stressors are limited to the leaf scale. Currently, there is a poor
understanding as to whether plant stress detected at the leaf scale can translate to the
canopy. Accurate quantitative estimates of biochemical properties o f vegetation
canopies are important applications of remote sensing for terrestrial ecology (Gao
and Goetz, 1995). In real systems, most ecological applications of remote sensing are
at a large scale where data are acquired at the canopy level. For this reason, further
work is needed that extends remote sensing of plant stress from leaf scale
measurements to the canopy.
The previous chapter (6) demonstrated the potential o f the spectral and
thermal responses of leaves for early detection and discrimination between oil and
179
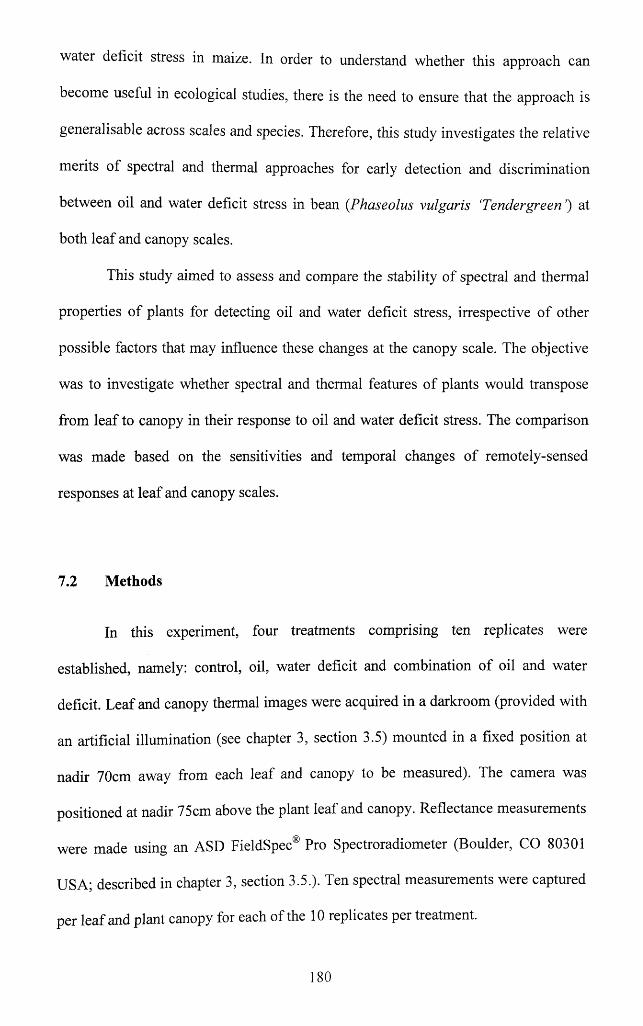
water deficit stress in maize. In order to understand whether this approach can
become useful in ecological studies, there is the need to ensure that the approach is
generalisable across scales and species. Therefore, this study investigates the relative
merits o f spectral and thermal approaches for early detection and discrimination
between oil and water deficit stress in bean (Phaseolus vulgaris ‘Tendergreen ’) at
both leaf and canopy scales.
This study aimed to assess and compare the stability of spectral and thermal
properties o f plants for detecting oil and water deficit stress, irrespective o f other
possible factors that may influence these changes at the canopy scale. The objective
was to investigate whether spectral and thermal features o f plants would transpose
from leaf to canopy in their response to oil and water deficit stress. The comparison
was made based on the sensitivities and temporal changes o f remotely-sensed
responses at leaf and canopy scales.
7.2 Methods
In this experiment, four treatments comprising ten replicates were
established, namely: control, oil, water deficit and combination of oil and water
deficit. Leaf and canopy thermal images were acquired in a darkroom (provided with
an artificial illumination (see chapter 3, section 3.5) mounted in a fixed position at
nadir 70cm away from each leaf and canopy to be measured). The camera was
positioned at nadir 75cm above the plant leaf and canopy. Reflectance measurements
were made using an ASD FieldSpec® Pro Spectroradiometer (Boulder, CO 80301
USA; described in chapter 3, section 3.5.). Ten spectral measurements were captured
per leaf and plant canopy for each of the 10 replicates per treatment.
180
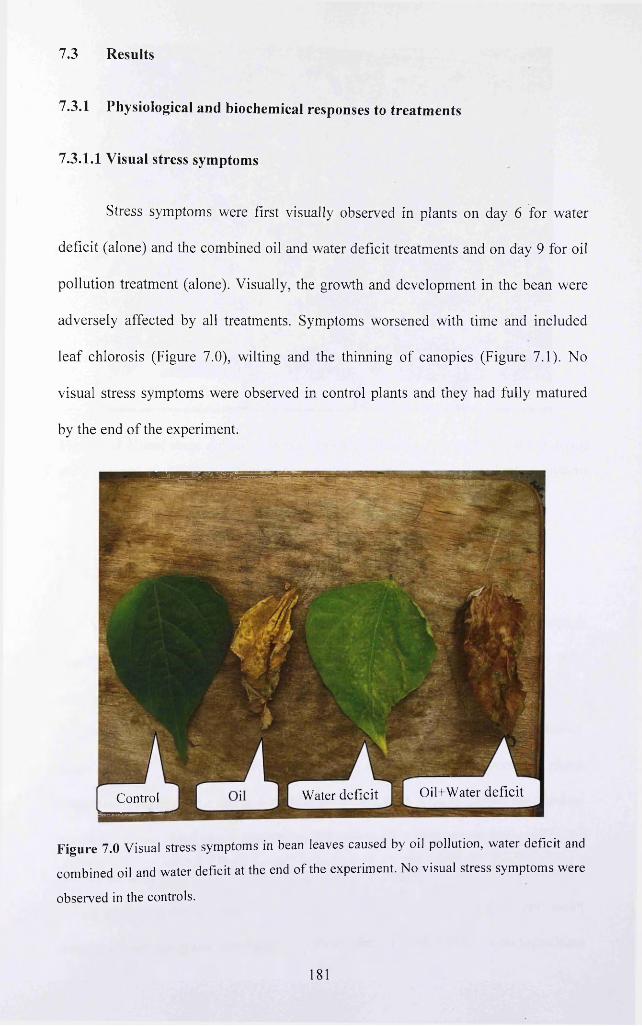
7.3 Results
7.3.1 Physiological and biochemical responses to treatm ents
7.3.1.1 Visual stress symptoms
Stress sym ptom s w ere first visually observed in p lants on day 6 for w ater
defic it (alone) and the com bined oil and w ater deficit treatm ents and on day 9 fo r oil
p o llu tion trea tm ent (alone). V isually, the grow th and developm ent in the bean w ere
adversely affected by all treatm ents. Sym ptom s w orsened w ith tim e and included
le a f chlorosis (F igure 7.0), w ilting and the th inn ing o f canopies (F igure 7.1). N o
v isual stress sym ptom s w ere observed in control p lants and they had fully m atured
by the end o f the experim ent.
Oil+Water deficitWater deficitControl
Figure 7.0 Visual stress symptoms in bean leaves caused by oil pollution, water deficit and
combined oil and water deficit at the end o f the experiment. No visual stress symptoms were
observed in the controls.
181
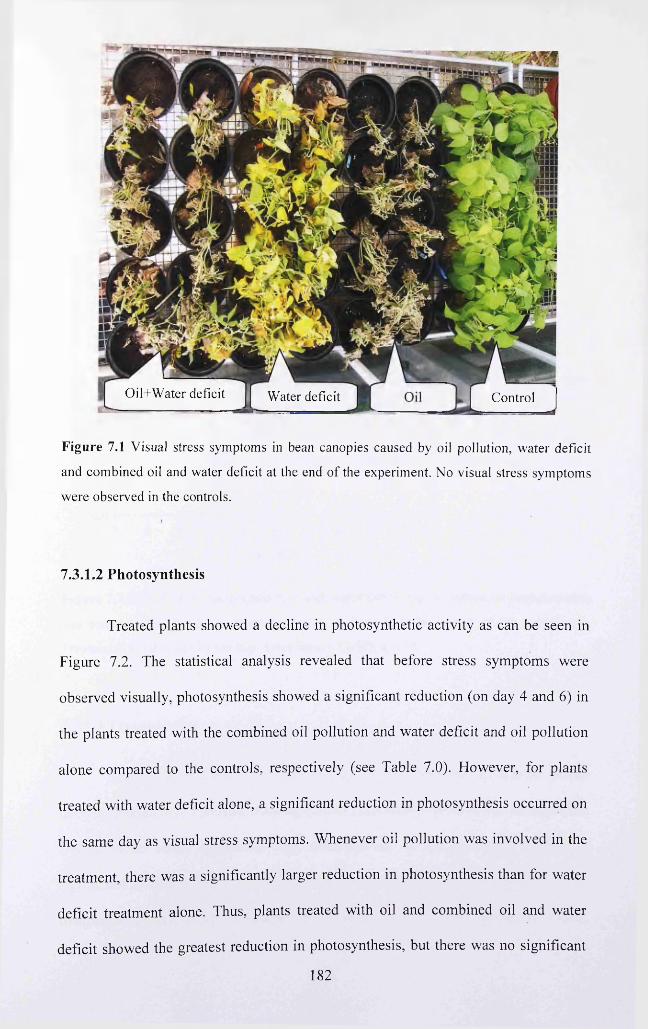
Oil+Water deficit Water deficit Control
Figure 7.1 Visual stress symptoms in bean canopies caused by oil pollution, water deficit
and combined oil and water deficit at the end o f the experiment. No visual stress symptoms
were observed in the controls.
7.3.1.2 Photosynthesis
T reated plants show ed a decline in photo synthetic activ ity as can be seen in
F igure 7.2. The statistical analysis revealed that before stress sym ptom s w ere
observed visually , photosynthesis show ed a significant reduction (on day 4 and 6) in
the p lants treated w ith the com bined oil pollu tion and w ater deficit and oil po llu tion
alone com pared to the controls, respectively (see Table 7.0). H ow ever, for p lants
treated w ith w ater deficit alone, a significant reduction in photosynthesis occurred on
the sam e day as visual stress sym ptom s. W henever oil po llu tion w as involved in the
treatm ent, there was a significantly larger reduction in photosynthesis than for w ater
defic it treatm ent alone. Thus, plants treated w ith oil and com bined oil and w ater
defic it show ed the greatest reduction in photosynthesis, but there w as no significan t
182
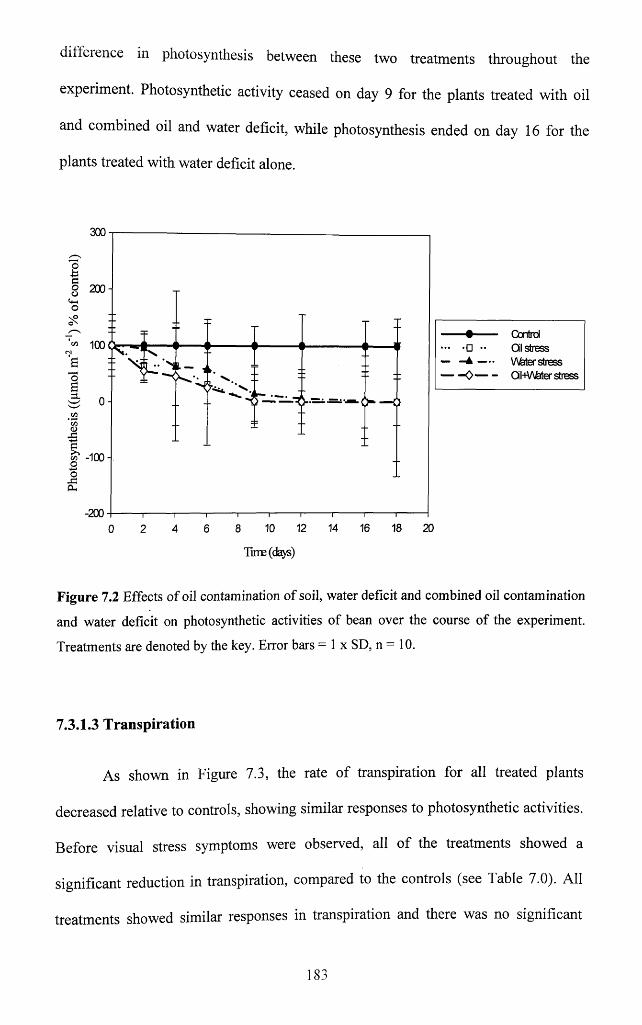
difference in photosynthesis between these two treatments throughout the
experiment. Photosynthetic activity ceased on day 9 for the plants treated with oil
and combined oil and water deficit, while photosynthesis ended on day 16 for the
plants treated with water deficit alone.
300
g 200-I
100
g -100-
-20010 12 14 16 18 206 80 2 4
Time (days)
------ • ------ Control. . . . . distress--------------4 — V\feter stress— - 0 ----- OiHV\feter stress
Figure 7.2 Effects of oil contamination of soil, water deficit and combined oil contamination
and water deficit on photosynthetic activities of bean over the course of the experiment.
Treatments are denoted by the key. Error bars = 1 x SD, n = 10.
7.3.1.3 Transpiration
As shown in Figure 7.3, the rate o f transpiration for all treated plants
decreased relative to controls, showing similar responses to photosynthetic activities.
Before visual stress symptoms were observed, all o f the treatments showed a
significant reduction in transpiration, compared to the controls (see Table 7.0). All
treatments showed similar responses in transpiration and there was no significant
183
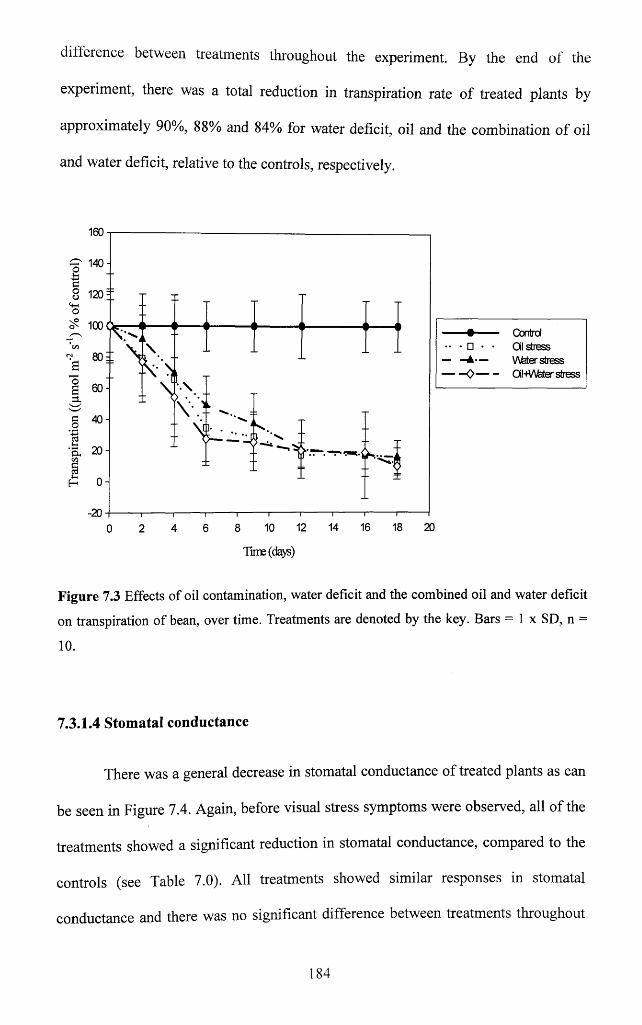
difference between treatments throughout the experiment. By the end o f the
experiment, there was a total reduction in transpiration rate o f treated plants by
approximately 90%, 88% and 84% for water deficit, oil and the combination o f oil
and water deficit, relative to the controls, respectively.
160
c/5(N£1 60- rL
§ 40-
-2010 12 14 16 18 2 06 82 4
Time (days)
------ • ------ ControlOil stress
------A — V\feter stress------ 0 ----- Oil+\Afeter stress
Figure 7.3 Effects of oil contamination, water deficit and the combined oil and water deficit
on transpiration of bean, over time. Treatments are denoted by the key. Bars = 1 x SD, n =
10 .
7.3.1.4 Stomatal conductance
There was a general decrease in stomatal conductance of treated plants as can
be seen in Figure 7.4. Again, before visual stress symptoms were observed, all of the
treatments showed a significant reduction in stomatal conductance, compared to the
controls (see Table 7.0). All treatments showed similar responses in stomatal
conductance and there was no significant difference between treatments throughout
184
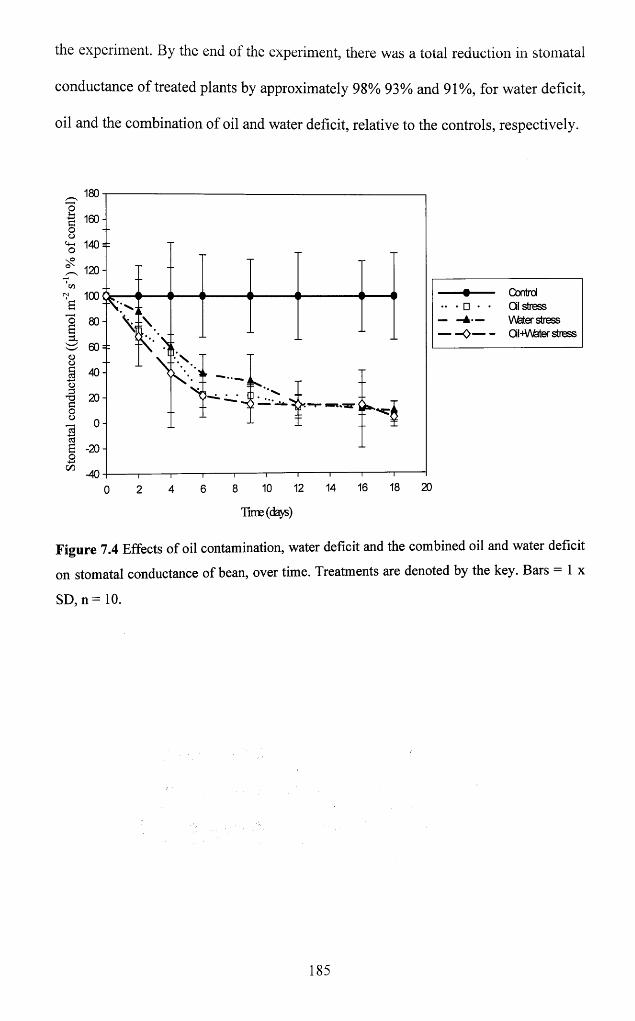
the experiment. By the end of the experiment, there was a total reduction in stomatal
conductance of treated plants by approximately 98% 93% and 91%, for water deficit,
oil and the combination of oil and water deficit, relative to the controls, respectively.
Vn 140 si
— Control Oil stress V\feter stress
- OihV\fater stress
0 2 4 6 8 10 12 14 16 18 20
Time (days)
Figure 7.4 Effects of oil contamination, water deficit and the combined oil and water deficit
on stomatal conductance of bean, over time. Treatments are denoted by the key. Bars = 1 x
SD ,n= 10.
185
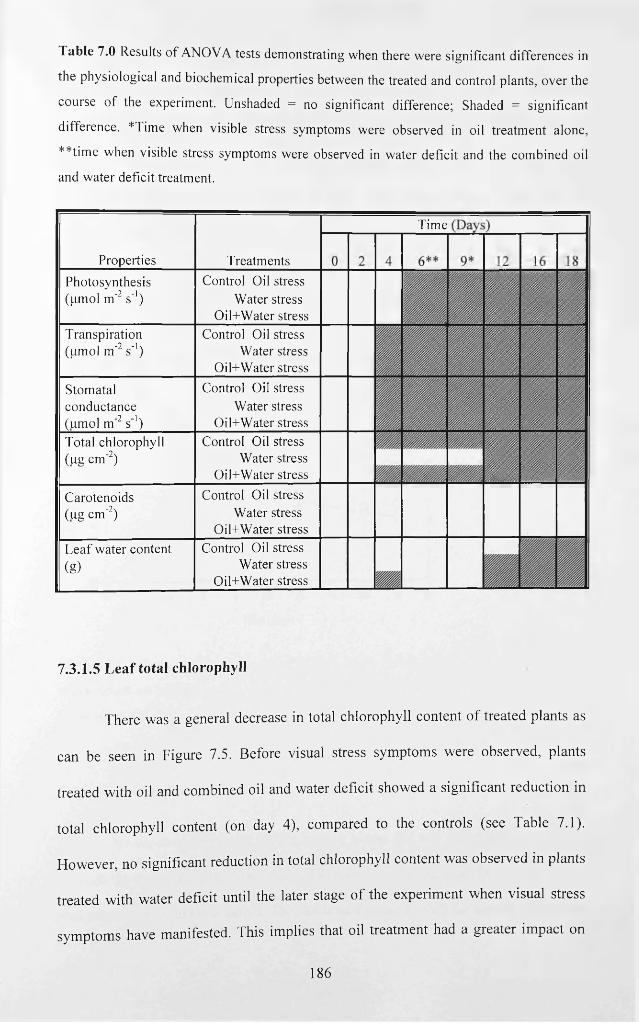
Table 7.0 Results o f ANOVA tests demonstrating when there were significant differences in
the physiological and biochemical properties between the treated and control plants, over the
course o f the experiment. Unshaded = no significant difference; Shaded = significant
difference. *Time when visible stress symptoms were observed in oil treatment alone,
**time when visible stress symptoms were observed in water deficit and the combined oil
and water deficit treatment.
Properties
Photosynthesis (pmol n f2 s"1)
Transpiration (pmol m '2 s '1)
Stomatal conductance (pmol m~2 s '1) Total chlorophyll (pg cm '2)
Carotenoids (pg cm '2)
Leaf water content (g)
Treatments Control Oil stress
Water stress Oil+Water stress
Control Oil stress Water stress
Oil+Water stress Control Oil stress
Water stress Oil+Water stress
Control Oil stress Water stress
Oil+Water stressControl Oil stress
Water stress Oil+Water stress
Control Oil stress Water stress
Oil+Water stress
Time
7.3.1.5 L eaf total chlorophyll
There w as a general decrease in total chlorophyll content o f trea ted p lants as
can be seen in Figure 7.5. B efore visual stress sym ptom s w ere observed, p lants
trea ted w ith oil and com bined oil and w ater deficit show ed a significant reduction in
to tal chlorophyll content (on day 4), com pared to the contro ls (see Table 7.1).
H ow ever, no significant reduction in total chlorophyll content w as observed in p lants
trea ted w ith w ater deficit until the later stage o f the experim ent w hen visual stress
sym ptom s have m anifested. This im plies that oil treatm ent had a greater im pact on
186
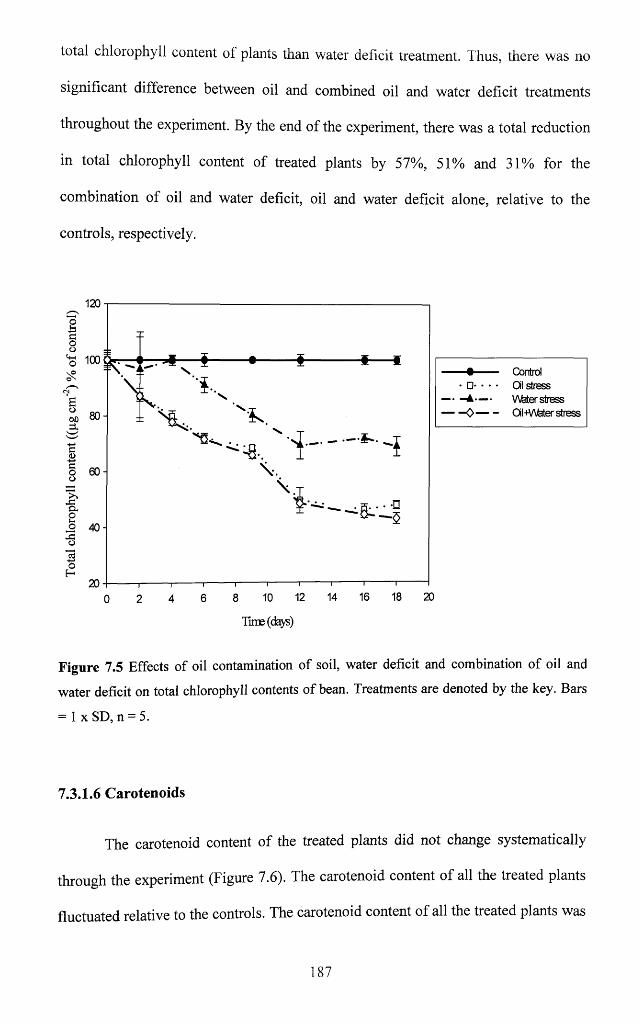
total chlorophyll content of plants than water deficit treatment. Thus, there was no
significant difference between oil and combined oil and water deficit treatments
throughout the experiment. By the end of the experiment, there was a total reduction
in total chlorophyll content of treated plants by 57%, 51% and 31% for the
combination of oil and water deficit, oil and water deficit alone, relative to the
controls, respectively.
120
*8 100
'n.00 80-
18 201610 12 14862 40
•-A-“ O'
— Control• • Oil stress
V\feter stress- Oil-fV\feter stress
Tims (days)
Figure 7.5 Effects of oil contamination of soil, water deficit and combination of oil and
water deficit on total chlorophyll contents of bean. Treatments are denoted by the key. Bars
= 1 x SD, n = 5.
7.3.1.6 Carotenoids
The carotenoid content of the treated plants did not change systematically
through the experiment (Figure 7.6). The carotenoid content of all the treated plants
fluctuated relative to the controls. The carotenoid content o f all the treated plants was
187
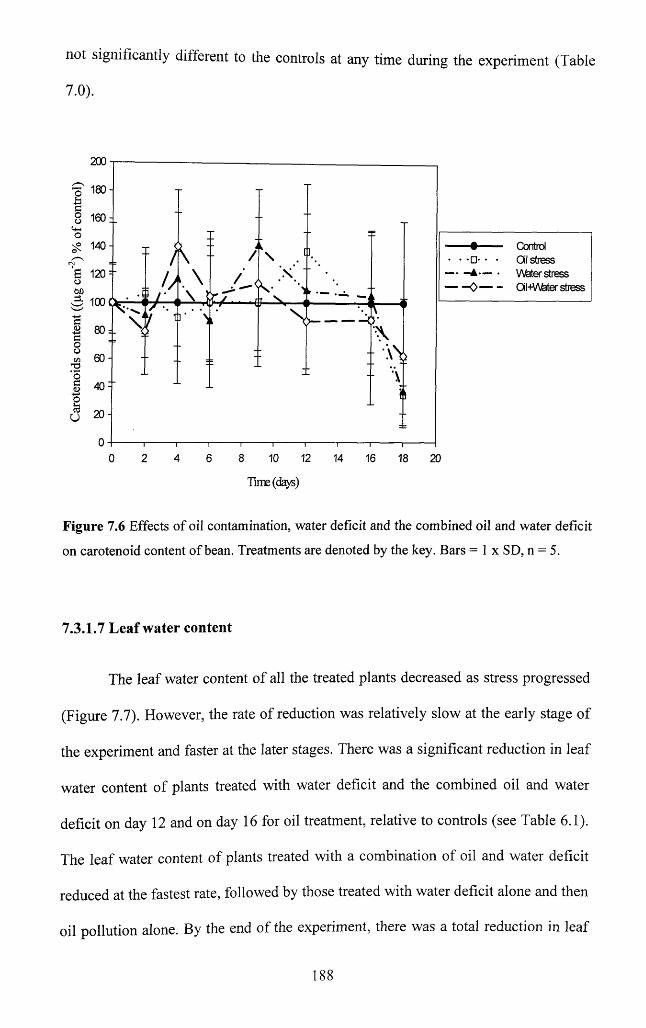
not significantly different to the controls at any time during the experiment (Table
7.0).
200
*3 180- ci8 160:
£ 140- Control Oil stress V\Mer stress OihV\feter stress
N $
§u 2 0 -
2 6 8 10 12 18 2 00 4 14 16
Eire (days)
Figure 7.6 Effects of oil contamination, water deficit and the combined oil and water deficit
on carotenoid content of bean. Treatments are denoted by the key. Bars = 1 x SD, n = 5.
7.3.1.7 Leaf water content
The leaf water content of all the treated plants decreased as stress progressed
(Figure 7.7). However, the rate of reduction was relatively slow at the early stage of
the experiment and faster at the later stages. There was a significant reduction in leaf
water content of plants treated with water deficit and the combined oil and water
deficit on day 12 and on day 16 for oil treatment, relative to controls (see Table 6.1).
The leaf water content of plants treated with a combination of oil and water deficit
reduced at the fastest rate, followed by those treated with water deficit alone and then
oil pollution alone. By the end of the experiment, there was a total reduction in leaf
188
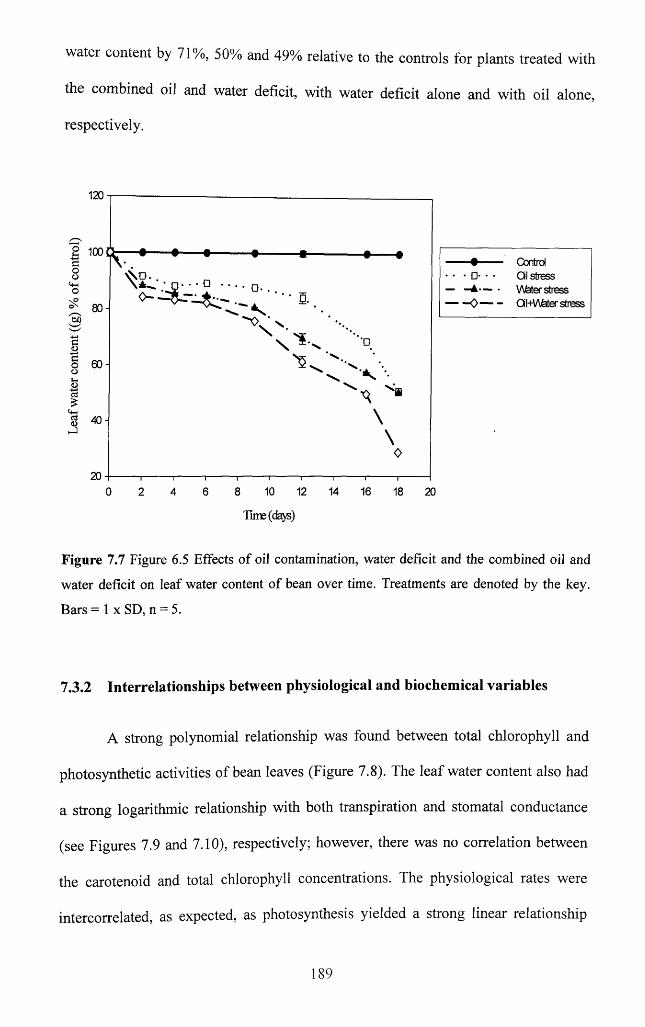
water content by 71%, 50% and 49% relative to the controls for plants treated with
the combined oil and water deficit, with water deficit alone and with oil alone,
respectively.
120
2 100Control Oil stress V\feter stress aW/VHer stress
oo
40-
0 6 8 10 12 14 16 18 2 02 4
Time (days)
Figure 7.7 Figure 6.5 Effects of oil contamination, water deficit and the combined oil and
water deficit on leaf water content of bean over time. Treatments are denoted by the key.
Bars = 1 x SD, n = 5.
7.3.2 Interrelationships between physiological and biochemical variables
A strong polynomial relationship was found between total chlorophyll and
photosynthetic activities of bean leaves (Figure 7.8). The leaf water content also had
a strong logarithmic relationship with both transpiration and stomatal conductance
(see Figures 7.9 and 7.10), respectively; however, there was no correlation between
the carotenoid and total chlorophyll concentrations. The physiological rates were
intercorrelated, as expected, as photosynthesis yielded a strong linear relationship
189
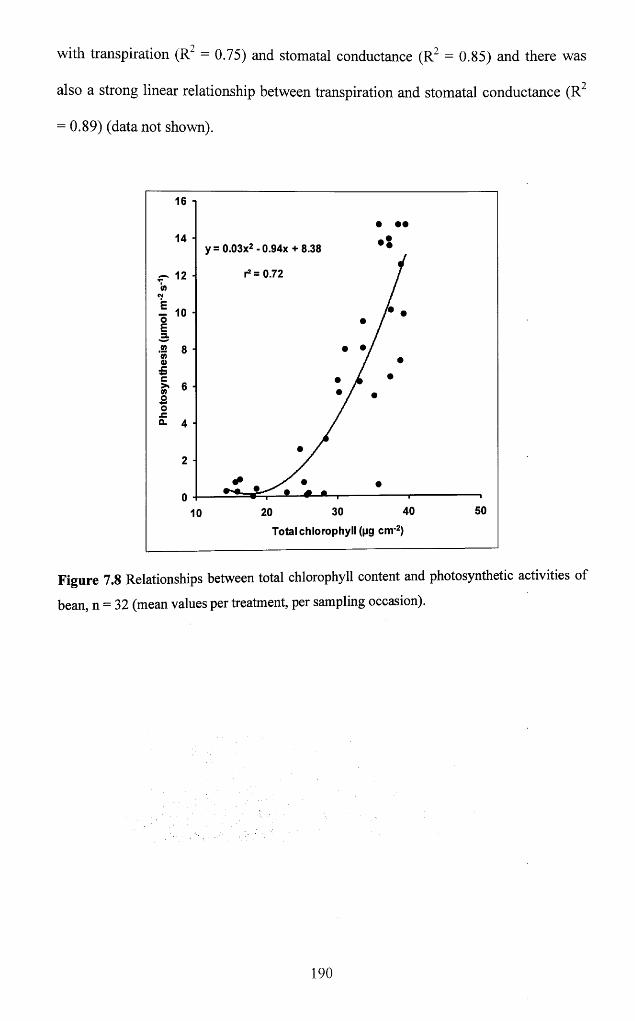
with transpiration (R^ = 0.75) and stomatal conductance (R2 = 0.85) and there was
also a strong linear relationship between transpiration and stomatal conductance (R2
= 0.89) (data not shown).
16
14y = 0.03x2 - 0.94x + 8.38
r2 = 0.7212
10
3 .
8
6
4
2
05040302010
Total chlorophyll (pg cnr2)
Figure 7.8 Relationships between total chlorophyll content and photosynthetic activities of
bean, n = 32 (mean values per treatment, per sampling occasion).
190

0.09 -
0.08 -
0.07 ■TO0.06 -
0.05 -
0.04 -
y=0.02ln(x) +0.050.03 ■
r2 = 0.660.02 ■
0.01 ■
Transpiration (pmol nv2 s -1)
Figure 7.9 Relationships between transpiration and leaf water content of bean, n = 32.
0.1
0.09
0.08
0.07TO
0.06
0.05
0.04
y = 0.01 ln(x) -0.000.03
r2 = 0.710.02
0.01
200 250150 300i0 100
Stom atal conductance (pmol n r2 S'1)
Figure 7.10 Relationships between stomatal conductance and leaf water content of bean, n =
32.
191
7.3.3 Responses of spectral reflectance to treatments
Looking at the mean spectra obtained at the end o f the experiment (Figures
7.11 and 7.12), it can be seen that for all treatments, the leaf and canopy reflectance
was higher in the visible and SWIR regions and lower in the NIR when compared
with the controls, except in the SWIR where canopy reflectance o f plants treated
with water deficit alone was not significantly higher than the controls. Also in the
visible region, the leaf and canopy reflectance spectra o f plants treated with water
deficit alone were not distinctly higher than the controls.
Major reflectance differences were found across the whole spectrum except
in the visible region where there was no distinct spectral reflectance difference
between plants treated with water deficit (alone) and the controls. T-tests were
conducted to determine whether differences in spectral reflectance were statistically
significant between treatments and controls. The results showed that there was a
significant difference in reflectance of each of the stresses in relation to the controls
across the spectrum except in the region between 601nm - 700nm where the spectral
reflectance of plants treated with water deficit alone did not significantly differ from
the controls (p < 0.05).
192
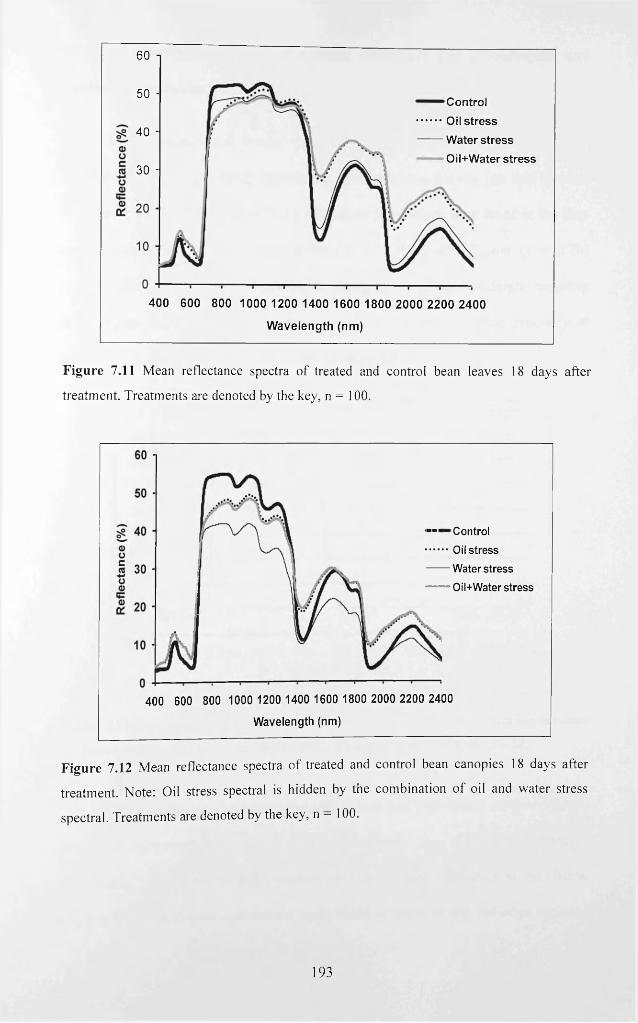
60 n
50 -Control Oil stress Water stress Oil+Water stress
40 -
30 -
400 600 800 1000 1200 1400 1600 1800 2000 2200 2400
Wavelength (nm)
Figure 7.11 Mean reflectance spectra of treated and control bean leaves 18 days after
treatment. Treatments are denoted by the key, n = 100.
■■■ Control distress Water stress—— Oil+Water stress
400 600 800 1000 1200 1400 1600 1800 2000 2200 2400
Wavelength (nm)
Figure 7.12 Mean reflectance spectra of treated and control bean canopies 18 days after
treatment. Note: Oil stress spectral is hidden by the combination o f oil and water stress
spectral. Treatments are denoted by the key, n — 100.
193
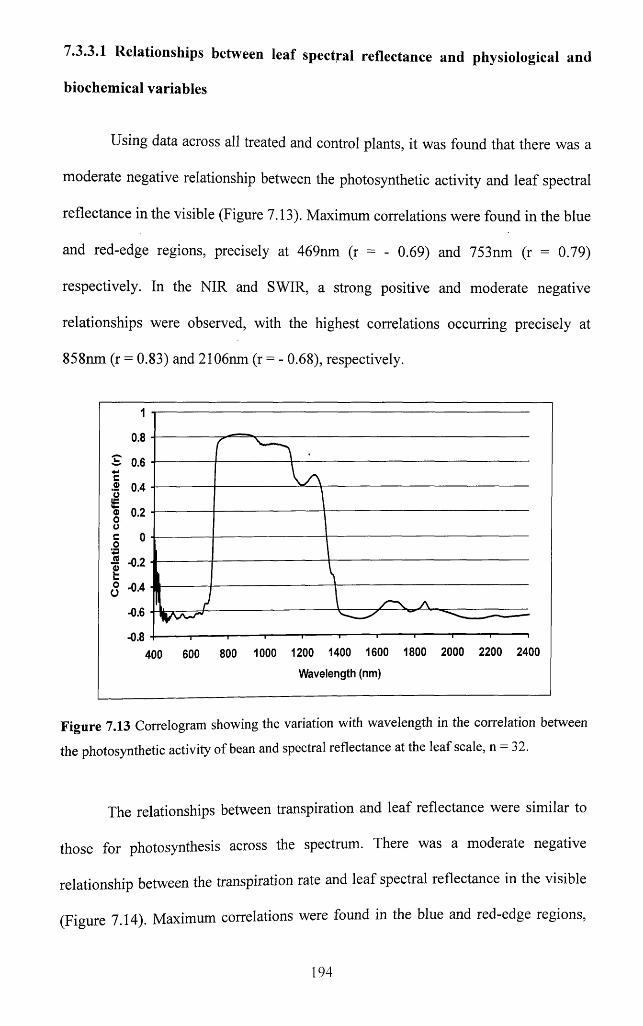
7.3.3.1 Relationships between leaf spectral reflectance and physiological and
biochemical variables
Using data across all treated and control plants, it was found that there was a
moderate negative relationship between the photo synthetic activity and leaf spectral
reflectance in the visible (Figure 7.13). Maximum correlations were found in the blue
and red-edge regions, precisely at 469nm (r = - 0.69) and 753nm (r = 0.79)
respectively. In the NIR and SWIR, a strong positive and moderate negative
relationships were observed, with the highest correlations occurring precisely at
858nm (r = 0.83) and 2106nm (r = - 0.68), respectively.
0.8
0.6
-0.6
- 0.8
Wavelength (nm)
Figure 7.13 C orrelogram sh ow in g the variation w ith w a v e len g th in the correlation b etw een
th e p h otosyn th etic activ ity o f bean and spectral reflectan ce at the le a f sca le , n 32 .
The relationships between transpiration and leaf reflectance were similar to
those for photosynthesis across the spectrum. There was a moderate negative
relationship between the transpiration rate and leaf spectral reflectance in the visible
(Figure 7.14). Maximum correlations were found in the blue and red-edge regions,
194
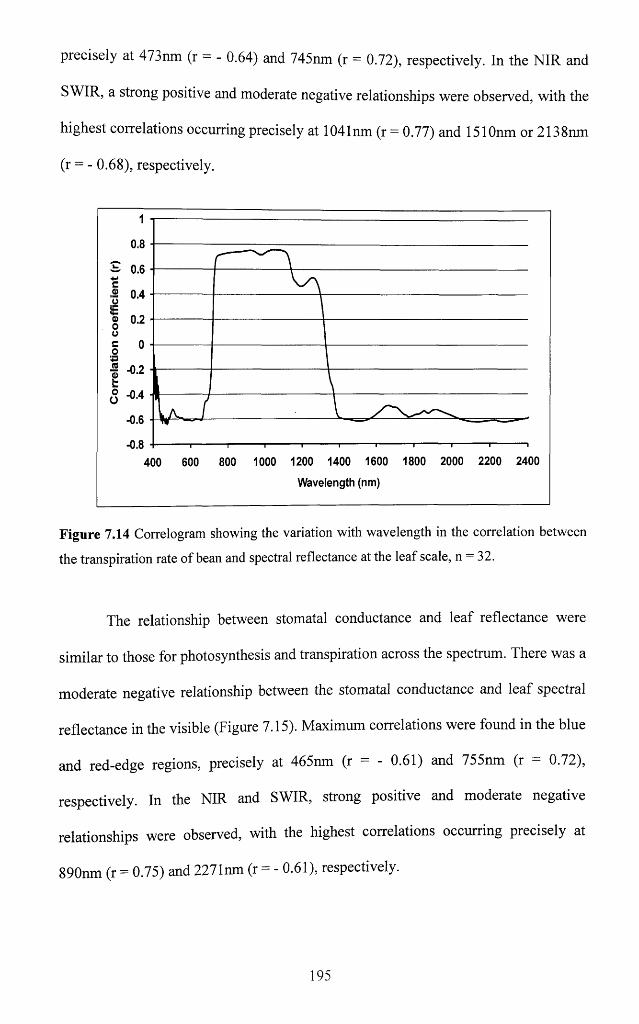
precisely at 473nm (r - 0.64) and 745nm (r - 0.72), respectively. In the NIR and
SWIR, a strong positive and moderate negative relationships were observed, with the
highest correlations occurring precisely at 1041nm (r = 0.77) and 1510nm or 2138nm
(r = - 0.68), respectively.
0.8
c.2oIE0)oocon»2L.oo
- 0.8400 600 800 1000 1200 1400 1600 1800 2000 2200 2400
Wavelength (nm)
Figure 7.14 Correlogram showing the variation with wavelength in the correlation between
the transpiration rate of bean and spectral reflectance at the leaf scale, n = 32.
The relationship between stomatal conductance and leaf reflectance were
similar to those for photosynthesis and transpiration across the spectrum. There was a
moderate negative relationship between the stomatal conductance and leaf spectral
reflectance in the visible (Figure 7.15). Maximum correlations were found in the blue
and red-edge regions, precisely at 465nm (r — - 0.61) and 755nm (r — 0.72),
respectively. In the NIR and SWIR, strong positive and moderate negative
relationships were observed, with the highest correlations occurring precisely at
890nm (r = 0.75) and 2271nm (r = - 0.61), respectively.
195
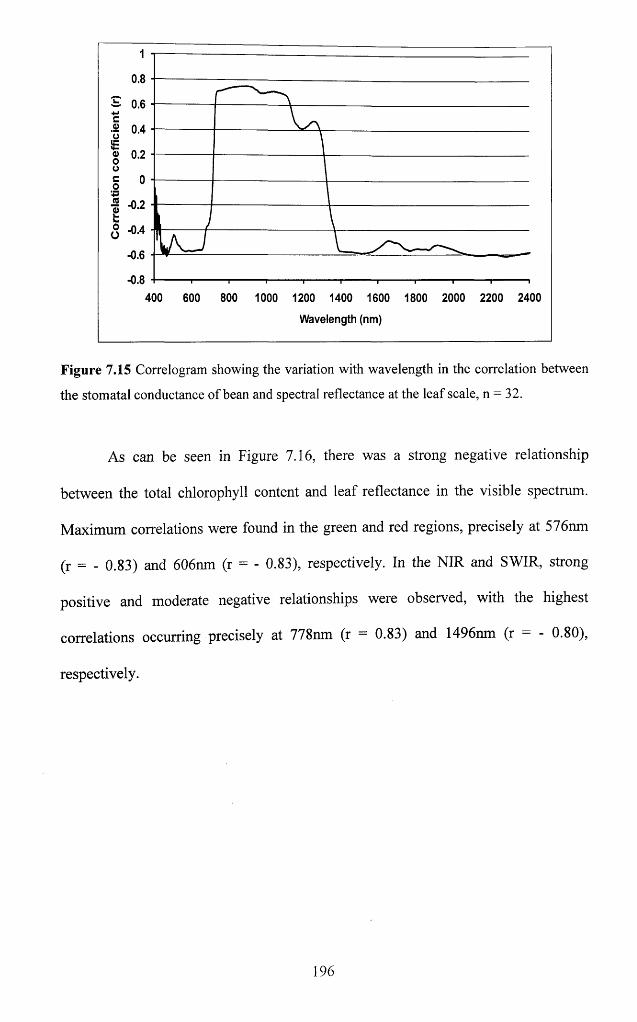
0.8
- 0.8400 600 800 1000 1200 1400 1600 1800 2000 2200 2400
Wavelength (nm)
Figure 7.15 Correlogram showing the variation with wavelength in the correlation between
the stomatal conductance of bean and spectral reflectance at the leaf scale, n = 32.
As can be seen in Figure 7.16, there was a strong negative relationship
between the total chlorophyll content and leaf reflectance in the visible spectrum.
Maximum correlations were found in the green and red regions, precisely at 576nm
(r = - 0.83) and 606nm (r = - 0.83), respectively. In the NIR and SWIR, strong
positive and moderate negative relationships were observed, with the highest
correlations occurring precisely at 778nm (r = 0.83) and 1496nm (r = - 0.80),
respectively.
196
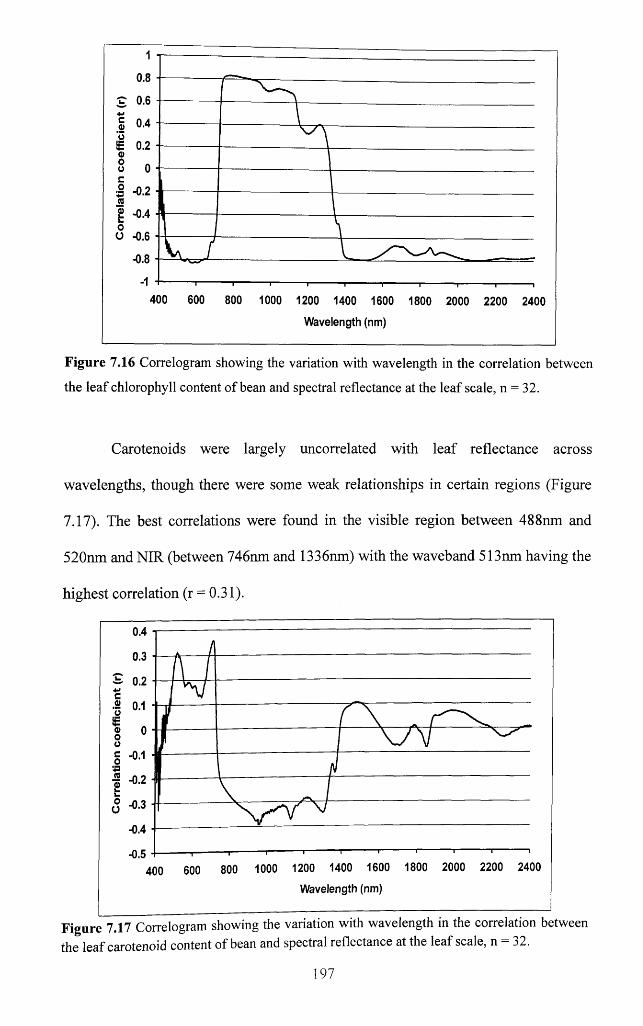
10.8
1 °-4£ 0.2<u8 o S -0.2
g -0.4 oO -0.6
- 0.8
400 600 800 1000 1200 1400 1600 1800 2000 2200 2400
Wavelength (nm)
Figure 7.16 Correlogram showing the variation with wavelength in the correlation between
the leaf chlorophyll content o f bean and spectral reflectance at the leaf scale, n = 32.
Carotenoids were largely uncorrelated with leaf reflectance across
wavelengths, though there were some weak relationships in certain regions (Figure
7.17). The best correlations were found in the visible region between 488nm and
520nm and NIR (between 746nm and 1336nm) with the waveband 513nm having the
highest correlation (r = 0.31).
0.4
0.3
0.2
- 0.1
- 0.2
-0.3
-0.4
-0.5
Wavelength (nm)
Figure 7.17 Correlogram showing the variation with wavelength in the correlation between the leaf carotenoid content o f bean and spectral reflectance at the leaf scale, n = 32.
197
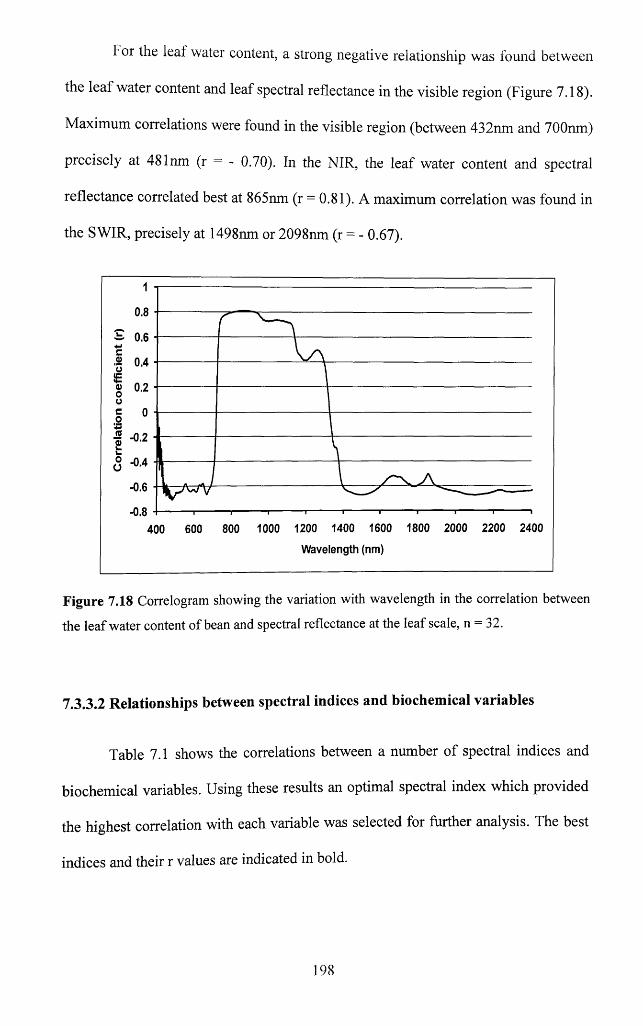
For the leaf water content, a strong negative relationship was found between
the leaf water content and leaf spectral reflectance in the visible region (Figure 7.18).
Maximum correlations were found in the visible region (between 432nm and 700nm)
precisely at 481nm (r = - 0.70). In the NIR, the leaf water content and spectral
reflectance correlated best at 865nm (r = 0.81). A maximum correlation was found in
the SWIR, precisely at 1498nm or 2098nm (r = - 0.67).
0.8
0.6
0.4
0.2
- 0.6
- 0.8400 600
Wavelength (nm)
Figure 7.18 Correlogram showing the variation with wavelength in the correlation between
the leaf water content o f bean and spectral reflectance at the leaf scale, n = 32.
7.3.3.2 Relationships between spectral indices and biochemical variables
Table 7.1 shows the correlations between a number of spectral indices and
biochemical variables. Using these results an optimal spectral index which provided
the highest correlation with each variable was selected for further analysis. The best
indices and their r values are indicated in bold.
198
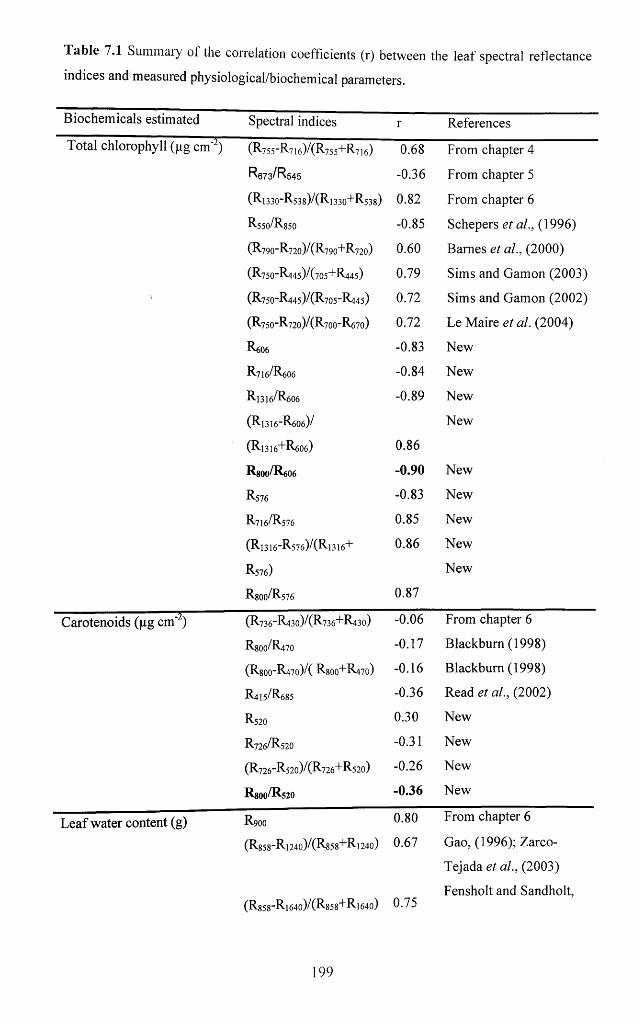
Table 7.1 Summaiy of the correlation coefficients (r) between the leaf spectral reflectance
indices and measured physiological/biochemical parameters.
Biochemicals estimated Spectral indices r References
Total chlorophyll (pg cm'2) (R755-R716)/(R 7 5 5 + R 7 16) 0.68 From chapter 4
R 673/R 545 -0.36 From chapter 5
( R l 330- R 538) / ( R l 330+ R 538) 0.82 From chapter 6
R 550/ R 850 -0.85 Schepers et al., (1996)
(R 79O -R 720)/(R 790+ R 720) 0.60 Barnes et al., (2000)
(R75O -R445)/(705+ R 445) 0.79 Sims and Gamon (2003)
' (R75O-R445)/(R7O5-R445) 0.72 Sims and Gamon (2002)
(R 75O -R 720)/(R 700-R 670) 0.72 Le Maire et al. (2004)
R 606 -0.83 New
R7I6/R6O6 -0.84 New
R l 316/ R 606 -0.89 New
( R l 316"R 606) / New
( R l 316+ R 606) 0.86
R8O0/R6O6 -0.90 New
R 576 -0.83 New
R7I6/R576 0.85 New
( R i 316 -R 5 7 6 )/(R i 316+ 0.86 New
R576) New
R800/R576 0.87
Carotenoids (pg cm'2) (R 736-R 430)/(R 736+R 430) -0.06 From chapter 6
R800/R470 -0.17 Blackburn (1998)
( R 800_R 47o )/( R 800+ R 47o) -0.16 Blackburn (1998)
R4I5/R685 -0.36 Read et al., (2002)
R 520 0.30 New
R 726/ R 520 -0.31 New
(R 726-R 520)/(R 726+ R 520) -0.26 New
R8O0/R52O -0.36 New
Leaf water content (g) R 900 0.80 From chapter 6
(R g 58- R l 240)/( R 858+ R l 24o) 0.67 Gao, (1996); Zarco-
Tejada et al., (2003)
( R 858" R l64o ) / (R 858"^ R l64o) 0.75Fensholt and Sandholt,
199
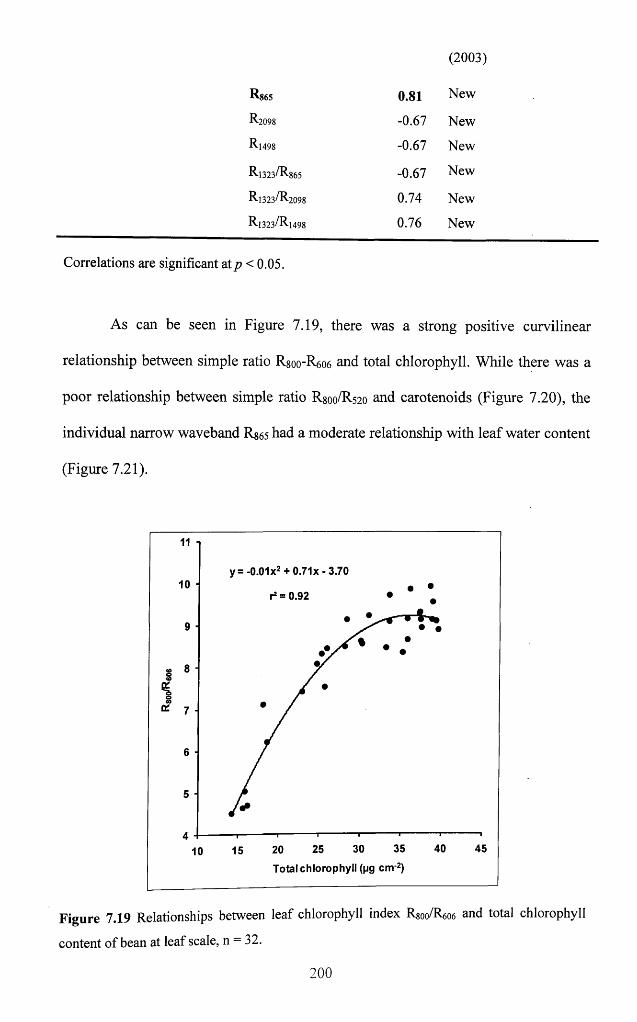
(2003)
^8 6 5 0.81 New
R 2098 -0.67 New
R l 498 -0.67 New
R l 323/ R 865 -0.67 New
R1323/R2098 0.74 New
R l 323/ R l 498 0.76 New
Correlations are significant atp< 0.05.
As can be seen in Figure 7.19, there was a strong positive curvilinear
relationship between simple ratio Rsoo-R606 and total chlorophyll. While there was a
poor relationship between simple ratio R.800/R520 and carotenoids (Figure 7.20), the
individual narrow waveband Rs65 had a moderate relationship with leaf water content
(Figure 7.21).
11
y= -0.01x2 + 0.71x - 3.70
r2 = 0.9210
9
8
7
6
5
435 40 453025201510
Total chlorophyll (pg cm 2)
Figure 7.19 R elation sh ip s b etw een le a f ch lorop h yll in d ex R 800/R 6O6 and total ch lorop h y ll
con ten t o f bean at le a f sca le , n = 32.
2 0 0
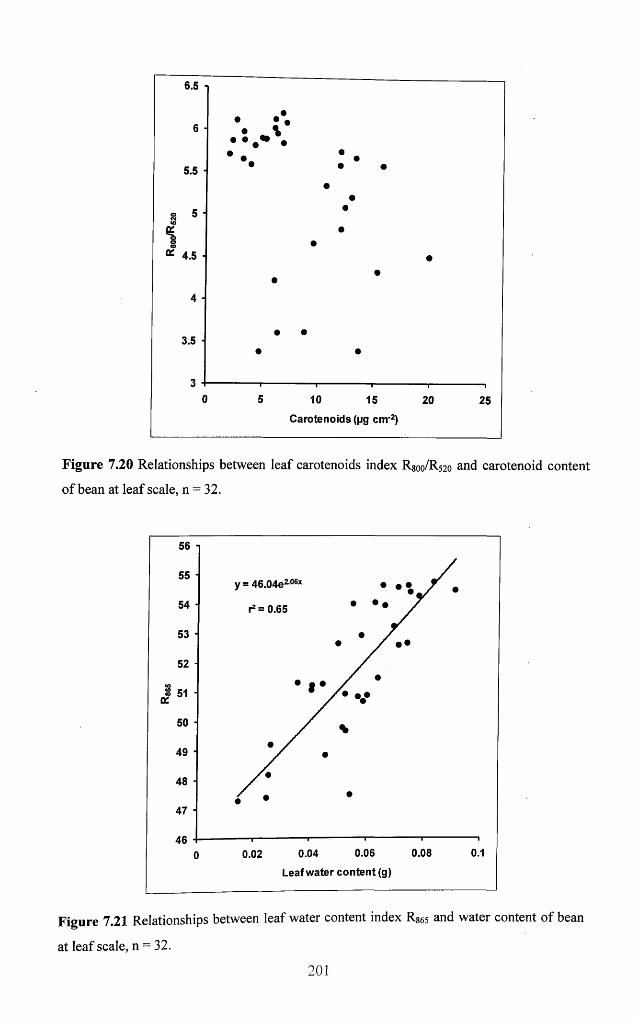
6.5 -i
5.5 ■
o 5CMU>
%o00
K 4.5
4 ■
3.5 ■
*•• • • • •
• •
10 15
Carotenoids (pg cm 2)
20 25
Figure 7.20 Relationships between leaf carotenoids index R800/R520 and carotenoid content
of bean at leaf scale, n = 32.
47 ■
0.10.06 0.080.04
Leaf water content (g)0.02
Figure 7.21 Relationships between leaf water content index R865 and water content of bean
at leaf scale, n = 32.
201
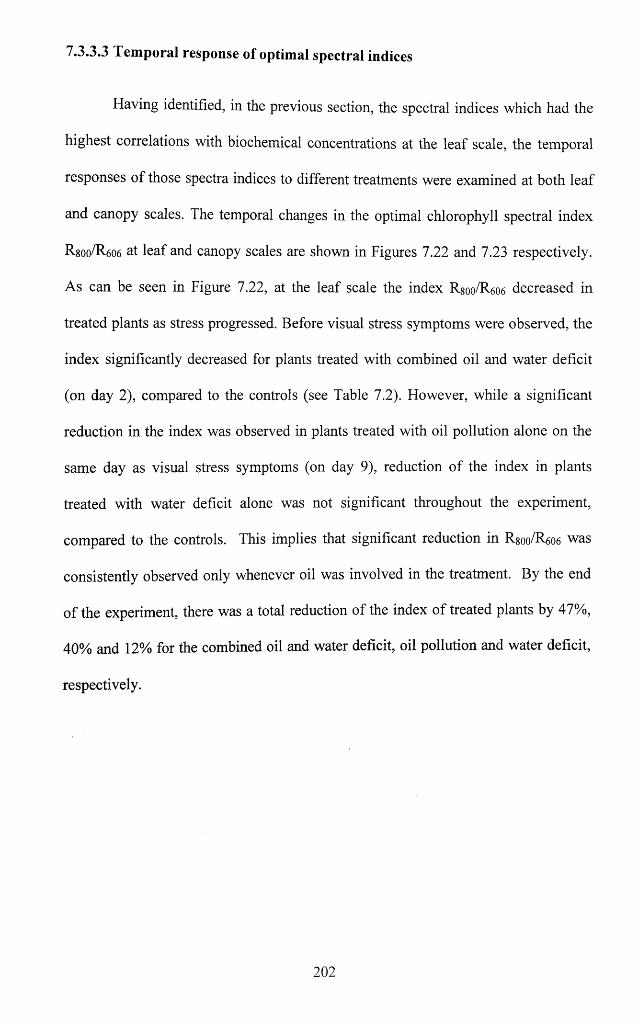
7.3.3.3 Temporal response of optimal spectral indices
Having identified, in the previous section, the spectral indices which had the
highest correlations with biochemical concentrations at the leaf scale, the temporal
responses o f those spectra indices to different treatments were examined at both leaf
and canopy scales. The temporal changes in the optimal chlorophyll spectral index
R-800/R 606 at leaf and canopy scales are shown in Figures 7.22 and 7.23 respectively.
As can be seen in Figure 7.22, at the leaf scale the index R8oo/R606 decreased in
treated plants as stress progressed. Before visual stress symptoms were observed, the
index significantly decreased for plants treated with combined oil and water deficit
(on day 2), compared to the controls (see Table 7.2). However, while a significant
reduction in the index was observed in plants treated with oil pollution alone on the
same day as visual stress symptoms (on day 9), reduction of the index in plants
treated with water deficit alone was not significant throughout the experiment,
compared to the controls. This implies that significant reduction in R800/R606 was
consistently observed only whenever oil was involved in the treatment. By the end
o f the experiment, there was a total reduction of the index o f treated plants by 47%,
40% and 12% for the combined oil and water deficit, oil pollution and water deficit,
respectively.
202
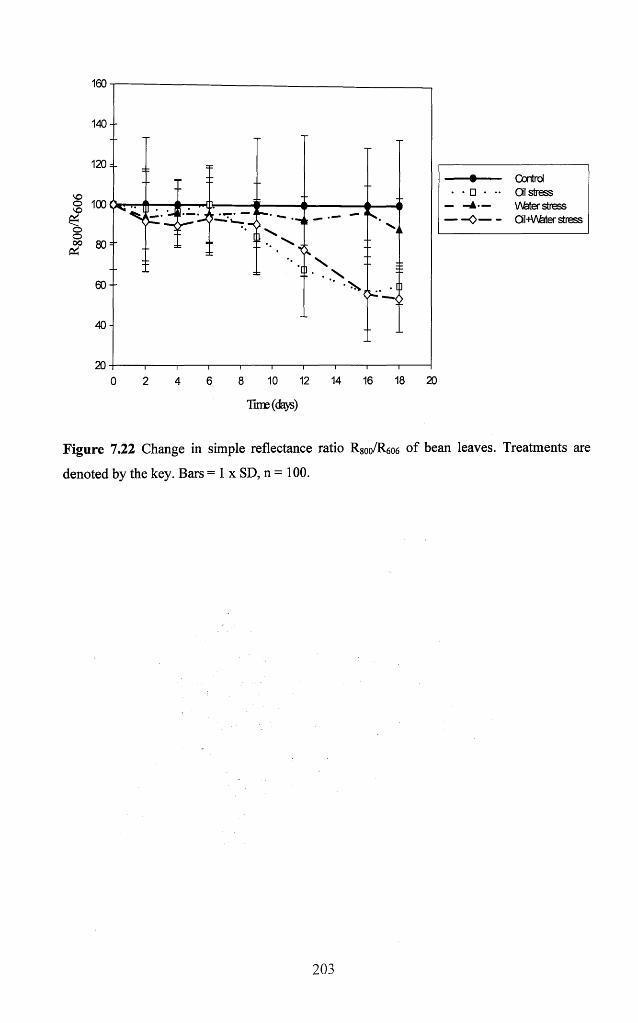
160
1 4 0 -
120 = -
100
80
60
40
200 2 4 6 8 10 12 14 16 18 20
Time (days)
------ • ------ ControlOil stress
— - A — V\feter stress------ 0 ----- QI-HAfeter stress
Figure 7.22 Change in simple reflectance ratio Rgoo/R606 of bean leaves. Treatments are
denoted by the key. Bars = 1 x SD, n = 100.
Table 7.2 Results o f ANOVA tests demonstrating when there were significant differences
between the changes in the spectral and thermal properties of treated and control plants, over
the couise o f the experiment. Unshaded = no significant difference; Shaded = significant
difference. *Time when visible stress symptoms were observed in oil treatment alone,
time when visible stress symptoms were observed in water deficit and the combined oil
and water deficit treatment.
Canopy_Rgoo/R606 Control Oil stress Water stress
Oil+Water stressLeaf R sno/R800 ' *'-520 Control Oil stress
Water stress Oil+Water stress
Canopy_R8oo/R52o Control Oil stress Water stress
Oil+Water stressLeaf_R865 Control Oil stress
Water stress Oil+Water stress
Canopy_Rg65 Control Oil stress Water stress
Oil+Water stressLeaf absolute Control Oil stress temperature (°C) Water stress
Oil+Water stressCanopy absolute Control Oil stresstemperature (°C) Water stress
Oil+Water stressLeaf I q Control Oil stress
Water stress Oil+Water stress
Canopy Iq Control Oil stress Water stress
Oil+Water stress
Leaf Rson/R,800 ' 1^606 Control Oil stress Water stress
Oil+Water stress
Time (Days)
Stress indices Treatments
A t the canopy scale, it was observed that change in the chlorophyll spectral
index R 8oo/R606 differed from that at the lea f scale. A s can be seen in F igure 7.23,
there w as inconsistency in the change o f the ratio for all the treated plants at the early
204
C67B
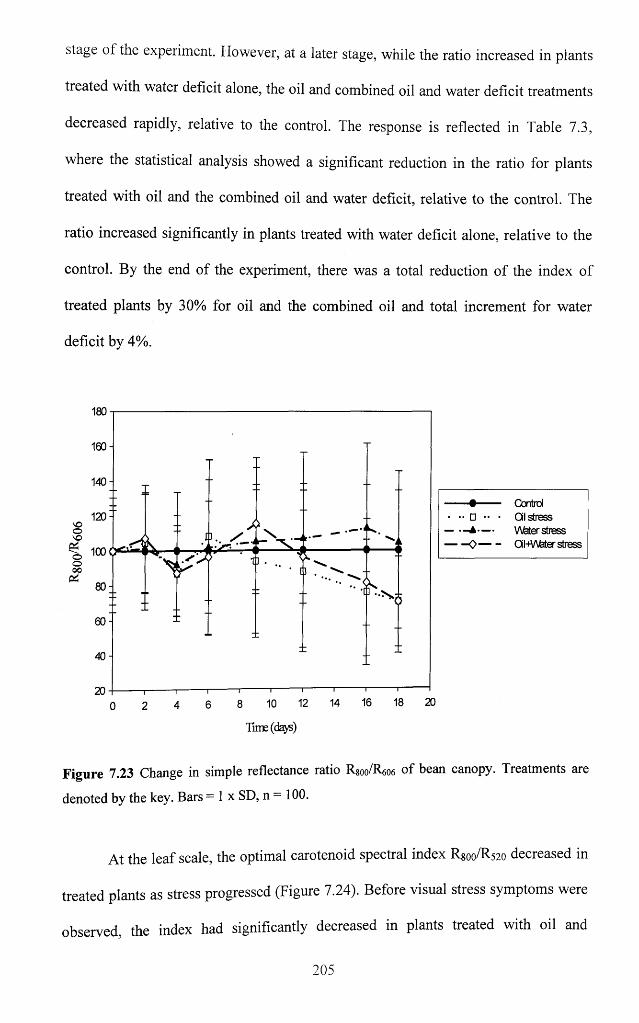
stage of the experiment. However, at a later stage, while the ratio increased in plants
treated with water deficit alone, the oil and combined oil and water deficit treatments
decreased rapidly, relative to the control. The response is reflected in Table 7.3,
where the statistical analysis showed a significant reduction in the ratio for plants
treated with oil and the combined oil and water deficit, relative to the control. The
ratio increased significantly in plants treated with water deficit alone, relative to the
control. By the end of the experiment, there was a total reduction of the index of
treated plants by 30% for oil and the combined oil and total increment for water
deficit by 4%.
180
160 -
140-
120 -
o
^ 100 tUi-ooo
pH80-
60-
40-
18 201612 141086420
. . D . .
. - A —
— Control• Oil stress
V\feter stress- OiMAfeter stress
Tune (days)
Figure 7.23 Change in simple reflectance ratio Rgoo/R606 of bean canopy. Treatments are
denoted by the key. Bars = 1 x SD, n = 100.
At the leaf scale, the optimal carotenoid spectral index R.800/R520 decreased in
treated plants as stress progressed (Figure 7.24). Before visual stress symptoms were
observed, the index had significantly decreased in plants treated with oil and
205
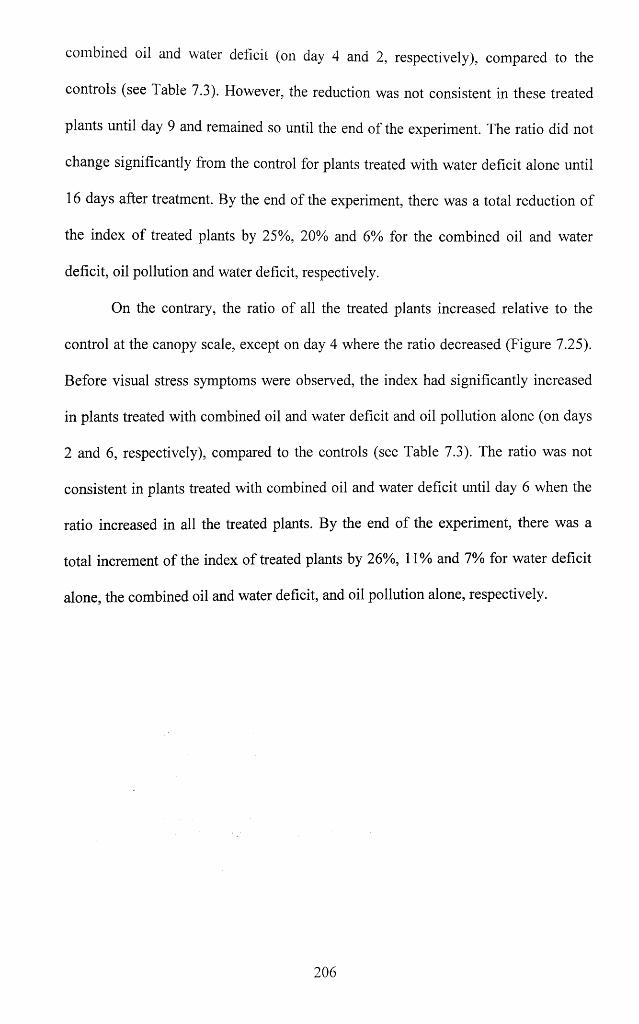
combined oil and water deficit (on day 4 and 2, respectively), compared to the
controls (see Table 7.3). However, the reduction was not consistent in these treated
plants until day 9 and remained so until the end of the experiment. The ratio did not
change significantly from the control for plants treated with water deficit alone until
16 days after treatment. By the end of the experiment, there was a total reduction of
the index o f treated plants by 25%, 20% and 6% for the combined oil and water
deficit, oil pollution and water deficit, respectively.
On the contrary, the ratio of all the treated plants increased relative to the
control at the canopy scale, except on day 4 where the ratio decreased (Figure 7.25).
Before visual stress symptoms were observed, the index had significantly increased
in plants treated with combined oil and water deficit and oil pollution alone (on days
2 and 6, respectively), compared to the controls (see Table 7.3). The ratio was not
consistent in plants treated with combined oil and water deficit until day 6 when the
ratio increased in all the treated plants. By the end o f the experiment, there was a
total increment of the index of treated plants by 26%, 11% and 7% for water deficit
alone, the combined oil and water deficit, and oil pollution alone, respectively.
206
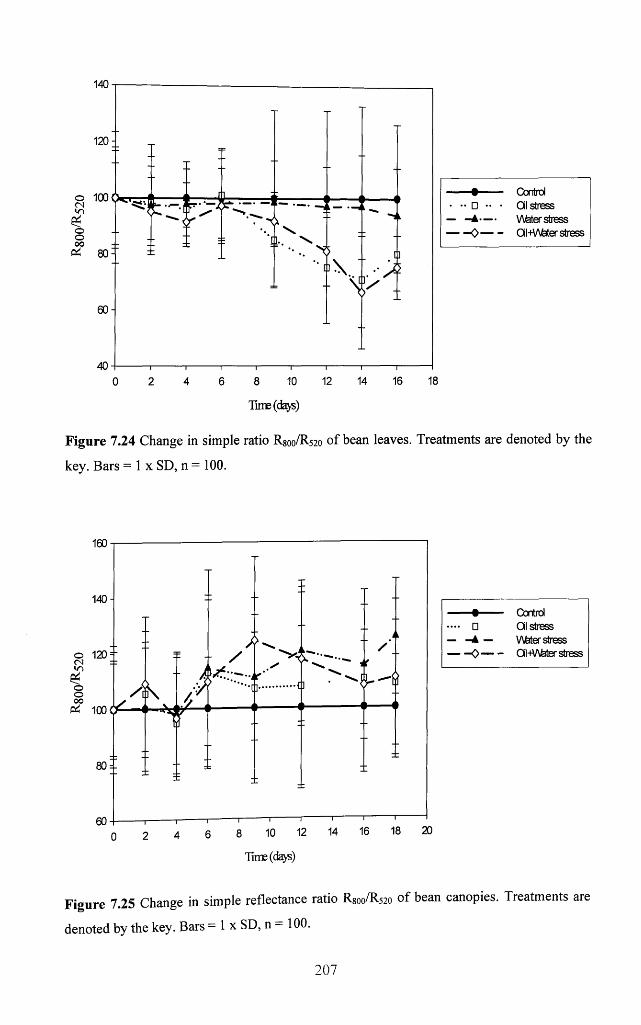
140
120 -
• ------- ControlOil stress
— -A — V\Mer stress— —0 Oil+V\feter stress
00
" A
60-
1812 14 166 8 100 2 4
Tims(da s)
Figure 7.24 Change in simple ratio R800/R520 of bean leaves. Treatments are denoted by the
key. Bars = 1 x SD, n = 100.
160
140-------• ------ Control.... □ Oil stress------▲ — V\Mer stress— 0 — QHV\feter stress
Figure 7.25 Change in simple reflectance ratio R800/R520 of bean canopies. Treatments are
denoted by the key. Bars = 1 x SD, n — 100.
207
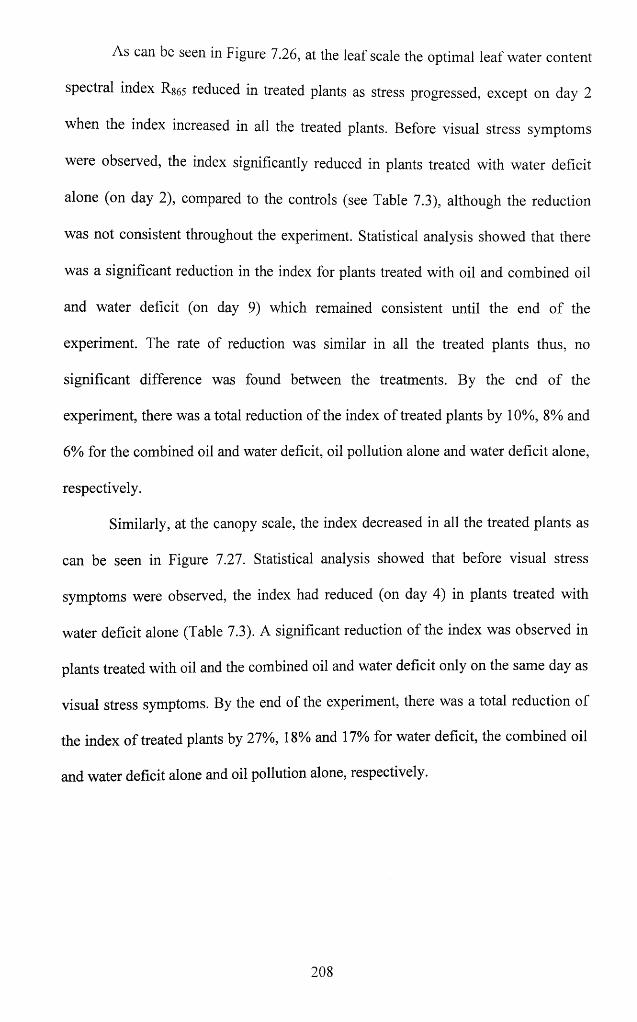
As can be seen in Figure 7.26, at the leaf scale the optimal leaf water content
spectral index R.865 reduced in treated plants as stress progressed, except on day 2
when the index increased in all the treated plants. Before visual stress symptoms
were observed, the index significantly reduced in plants treated with water deficit
alone (on day 2), compared to the controls (see Table 7.3), although the reduction
was not consistent throughout the experiment. Statistical analysis showed that there
was a significant reduction in the index for plants treated with oil and combined oil
and water deficit (on day 9) which remained consistent until the end o f the
experiment. The rate of reduction was similar in all the treated plants thus, no
significant difference was found between the treatments. By the end of the
experiment, there was a total reduction of the index of treated plants by 10%, 8% and
6% for the combined oil and water deficit, oil pollution alone and water deficit alone,
respectively.
Similarly, at the canopy scale, the index decreased in all the treated plants as
can be seen in Figure 7.27. Statistical analysis showed that before visual stress
symptoms were observed, the index had reduced (on day 4) in plants treated with
water deficit alone (Table 7.3). A significant reduction of the index was observed in
plants treated with oil and the combined oil and water deficit only on the same day as
visual stress symptoms. By the end of the experiment, there was a total reduction of
the index o f treated plants by 27%, 18% and 17% for water deficit, the combined oil
and water deficit alone and oil pollution alone, respectively.
208
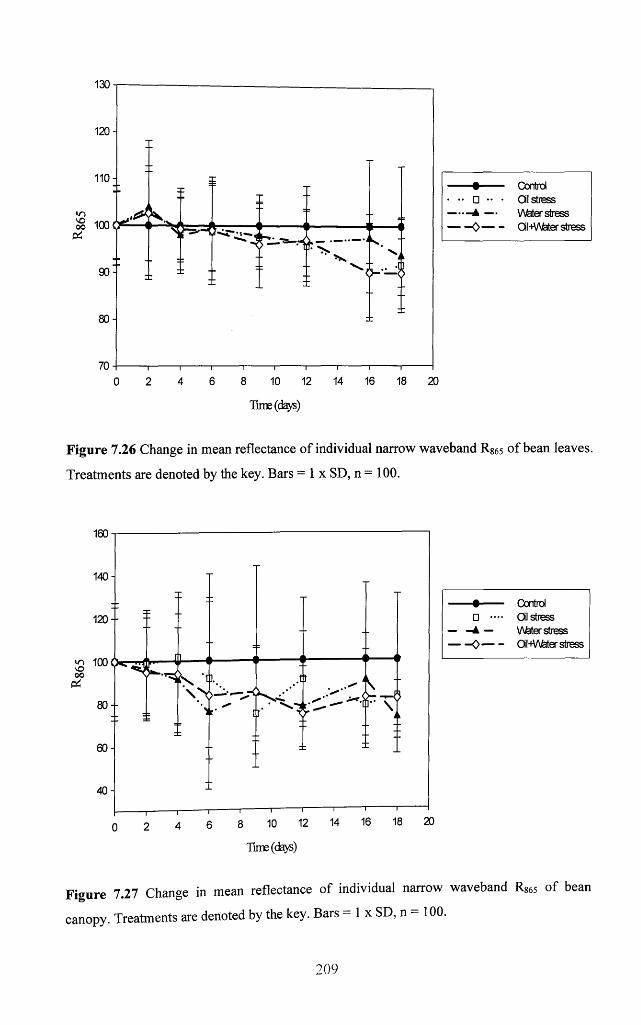
130
120 -
110
00 100 pi
90-
80-
70
- ^ . • = - 4 - — — f . -
“0 - —i
u II
------ • ------ ControlOil stress
----- A — Wfeter stress— - 0 — - Oil-Mfater stress
I -------------1------------ 1------------ 1------------ 1------------ 1------------ 1------------ r
4 6 8 10 12 14 16 18 20
Time (days)
Figure 7.26 Change in mean reflectance of individual narrow waveband Rg65 of bean leaves.
Treatments are denoted by the key. Bars = 1 x SD, n = 100.
•O 100 O c'u
- • - - - ‘K i '.ft
v.
8 10 12
Time(da>5)
------•------ Corrtnol□ —• Oil stress
— —A — V\Mer stress------0 — OiMV\feter stress
14 16 18 20
Figure 7.27 Change in mean reflectance of individual narrow waveband Rses of bean
canopy. Treatments are denoted by the key. Bars = 1 x SD, n = 100.
209
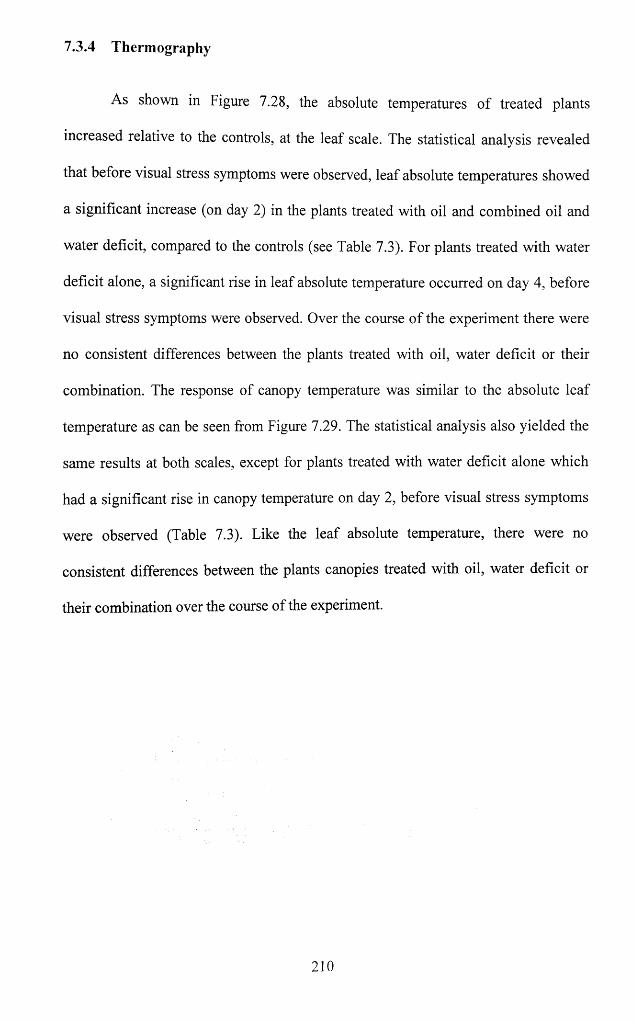
7.3.4 Thermography
As shown in Figure 7.28, the absolute temperatures of treated plants
increased relative to the controls, at the leaf scale. The statistical analysis revealed
that before visual stress symptoms were observed, leaf absolute temperatures showed
a significant increase (on day 2) in the plants treated with oil and combined oil and
water deficit, compared to the controls (see Table 7.3). For plants treated with water
deficit alone, a significant rise in leaf absolute temperature occurred on day 4, before
visual stress symptoms were observed. Over the course o f the experiment there were
no consistent differences between the plants treated with oil, water deficit or their
combination. The response of canopy temperature was similar to the absolute leaf
temperature as can be seen from Figure 7.29. The statistical analysis also yielded the
same results at both scales, except for plants treated with water deficit alone which
had a significant rise in canopy temperature on day 2, before visual stress symptoms
were observed (Table 7.3). Like the leaf absolute temperature, there were no
consistent differences between the plants canopies treated with oil, water deficit or
their combination over the course of the experiment.
21 0
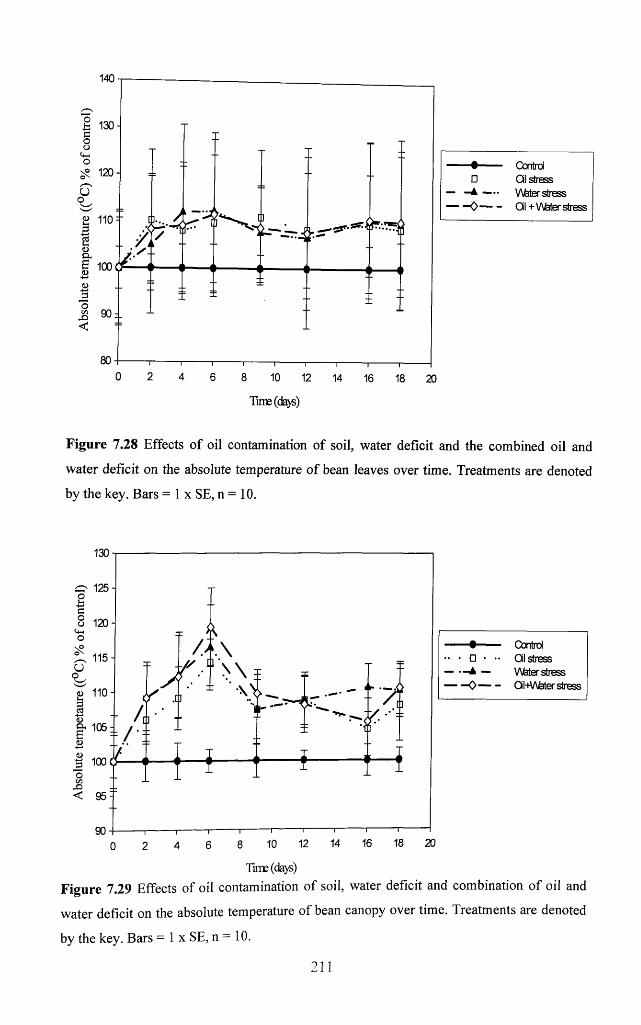
140
8 130 c o o'o £ 120 -/—s0 o_
g 110 =
1<Da,S 1004 )
<D-/-*3 OC/5
<
A
90 :. ±
/
Control□ distress
----- 4 — V\feter stress— 0 — - Ql+V\feter stress
80I 10 12
Time(<%s)
14 16 18 20
Figure 7.28 Effects of oil contamination of soil, water deficit and the combined oil and
water deficit on the absolute temperature of bean leaves over time. Treatments are denoted
by the key. Bars = 1 x SE, n = 10.
• □ •
— 4k —
- 0 —
— Control•• Oil stress
V\feter stress- Oil+V\Mer stress
0 2 4 6 8 10 12 14 16
Time (days)
Figure 7.29 Effects of oil contamination of soil, water deficit and combination of oil and
water deficit on the absolute temperature of bean canopy over time. Treatments are denoted
by the key. Bars = 1 x SE, n = 10.
211
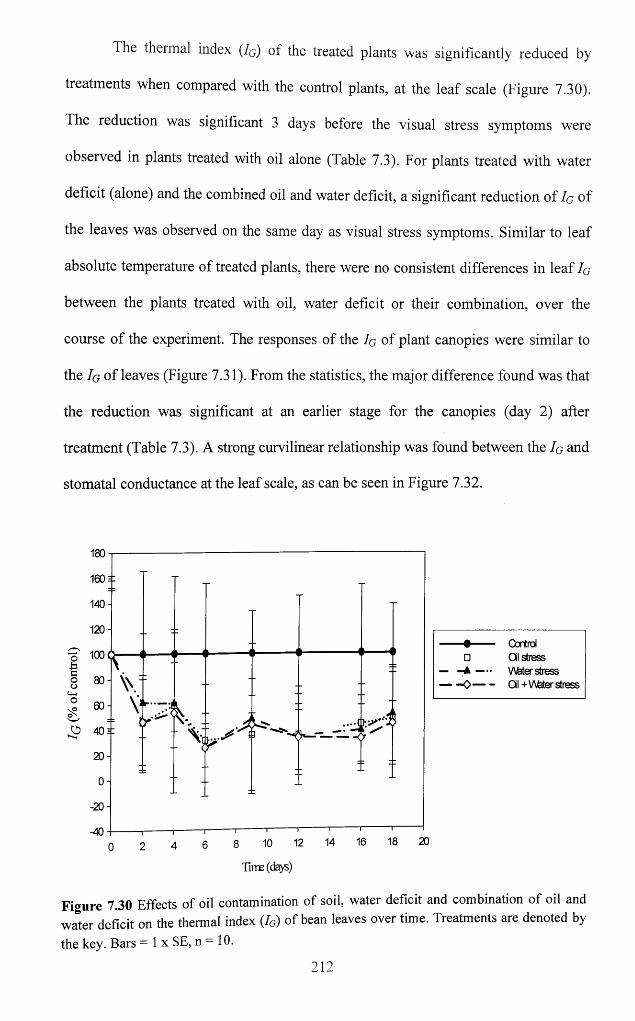
The thermal index (Iq ) of the treated plants was significantly reduced by
treatments when compared with the control plants, at the leaf scale (Figure 7.30).
The reduction was significant 3 days before the visual stress symptoms were
observed in plants treated with oil alone (Table 7.3). For plants treated with water
deficit (alone) and the combined oil and water deficit, a significant reduction o f I q of
the leaves was observed on the same day as visual stress symptoms. Similar to leaf
absolute temperature of treated plants, there were no consistent differences in leaf Iq
between the plants treated with oil, water deficit or their combination, over the
course of the experiment. The responses of the Iq of plant canopies were similar to
the I q of leaves (Figure 7.31). From the statistics, the major difference found was that
the reduction was significant at an earlier stage for the canopies (day 2) after
treatment (Table 7.3). A strong curvilinear relationship was found between the I q and
stomatal conductance at the leaf scale, as can be seen in Figure 7.32.
• ------- Control□ Oil stress
— -A — V\feter stress— - 0 Oil +V\Mer stress
0 2 4 6 8 10 12 14 16 18 20
Time (da>«)
Figure 7.30 Effects of oil contamination of soil, water deficit and combination of oil and water deficit on the thermal index (IG) of bean leaves over time. Treatments are denoted by the key. Bars = 1 x SE, n = 10.
2 1 2
itsu
160 =fc
140
120
o£cooUioox'w '
100
80
60
40 =
20-
0
-20-| A C \
cr'
V\
::. . . S n
—i----------- r~ -i------ 1------ 1 i r
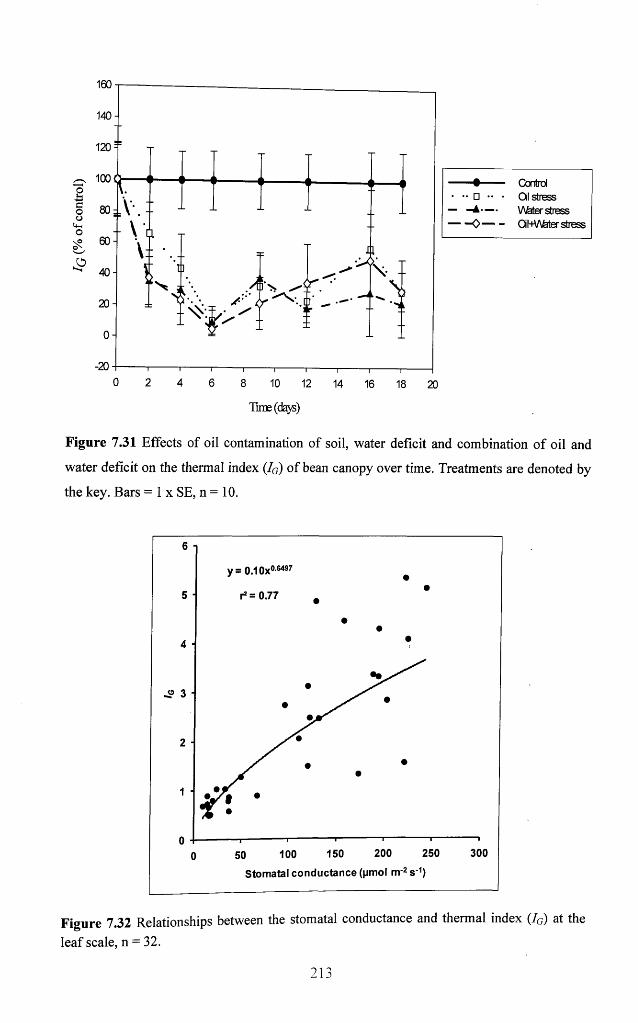
t ControlOil stress
— -A — V\fefer stress— —0 OI-HAfeter stress
0 2 4 6 8 10 12 14 16 18 20
Time (daijs)
Figure 7.31 Effects of oil contamination of soil, water deficit and combination of oil and
water deficit on the thermal index (IG) of bean canopy over time. Treatments are denoted by
the key. Bars = 1 x SE, n = 10.
6
5
4
o 3
2
1
0200 250 300150100500
Stomatal conductance (pmol n r2s 1)
Figure 7.32 R elation sh ip s b etw een the stom atal condu ctance and therm al in d ex (IG) at the
le a f sca le , n = 32.
213
7.4 Discussion
Similar to findings in previous chapters, treatments adversely affected bean
growth and development. While treatments caused leaf chlorosis and wilting in bean
plants, no visual stress symptoms were observed in the controls. Symptoms in all
treated plants started mildly by affecting only a few leaves and then gradually spread
over all the leaves. As reported in previous chapters, a wide range o f plant stresses
have been found to cause various visible stress symptoms (Rosso et a l, 2005; Smith
et al., 2005).
The photo synthetic activities, transpiration and stomatal conductance o f bean
leaves were adversely affected by all treatments. The effects of oil pollution on
plants including soil oxygen depletion, reduced water uptake and toxic effects have
been documented and discussed in previous chapters. Indeed, studies found that
accumulation of oil in the soil lead to the death of Spartina alterniflora plants (Krebs
and Tanner, 1981; Alexander and Webb, 1987) and that the leaves of the same plant
died after some days of oil contamination (Pezeshki et a l , 1995). Also, it has been
found that oil pollution reduces plant transpiration and carbon fixation which
increases plant mortality (Pezeshki and Delaune, 1993). Furthermore, a recent study
found that when irrigation was withheld to induce severe soil drying, gas exchange
decreased and then stopped in three Mediterranean cedar species: Cedrus atlantica,
C. Brevifolia and C. Libani (Ladjal et al., 2007). When soil oxygen required for the
correct functioning of plant roots (Smith, 2002) is depleted due to oil pollution
(Noomen et al., 2003), plant growth is inhibited and leaves undergo chlorosis,
dehydration and death. This can explain the reduction in photosynthetic activities of
plants treated with oil pollution in the present study.
214
It has been noted that accumulation of oil in the soil can increase the CO2
concentration in the soil (Hillel, 1998) and can also reduce water uptake by plants
(Jong, 1980). Work by Smith (2002) noted that water absorption by plants may be
inhibited after long periods of anaerobis and thus, can reduce transpiration and
instigate stomatal closure. Furthermore, it has been found that stomatal closure
restricts entry of CO2 into plant leaves and consequently reduces leaf photosynthesis
(Webb, 1994; Pezeshki et al., 1995). Reduction in transpiration has also been
attributed to soil water limitation (Tilling et al., 2007). Thus, this evidence and the
strong positive relationships found between these variables in the present study, can
explain the reduction in physiological properties of treated plants found in response
to both oil and water treatments in this investigation.
Treatments significantly reduced the total foliar chlorophyll content although
a greater impact was found in plants treated with oil and the combined oil and water
deficit than water deficit treatment alone. As an important photosynthetic pigment,
reduction in total chlorophyll concentration may further explain the reduction in
photosynthetic activities of treated plants as a strong positive correlation was found
between the two variables. In chapter 5, it was found that whenever oil was present
in the treatment, there was a greater impact on bean physiological rates than with the
waterlogging treatment alone. This is similar to the result of the present study where
treatments involving oil had greater impact on bean physiological rates and total
chlorophyll contents than with the water deficit treatment alone. This was possibly
attributed to a combination of effects from oil such as toxicity, soil oxygen depletion
and reduced water uptake.
However, in chapter 6, it was found that whenever water deficit was present
in the treatment, there was a greater impact on maize physiological rates than with
215
the oil treatment alone. In maize and sunflower, it was found that soil drying results
in the increase of synthesis of abscisic acid (ABA) which moves in the transpiration
stream to the shoots to inhibit stomatal opening and leaf growth (Zhang et al., 1987;
Zhang and Davies, 1989, 1990a). An increase in ABA quantitatively accounts for the
reduction in stomatal conductance and restriction of leaf growth (Zhang and Davies,
1990a, 1990b). The concentration of ABA was also found to increase in the roots of
two cultivars o f Phaseolus vulgaris L. (cv. Cacahuate-72 and Michoacan-12A3) in
the first 10cm of unwatered soil (Trejo and Davies, 1991). Furthermore, the increase
progressed to deeper roots in accordance with soil dehydration. This concurs with the
early findings by Walton et al. (1976) where, dehydration increased the ABA
concentration in roots of Phaseolus vulgaris L. Trejo and Davies (1991) used large
soil columns to promote a gradual drying of the soil from the top to the bottom.
Drying o f the soil caused stomata closure in Phaseolus vulgaris L. even though there
was no reduction in total water potential ( ¥ w) or turgor potential (T p) o f the shoots
because the roots of the plants had reached about 50cm in depth by the time the first
10 or 20cm of the soil showed a significant reduction in water content. Even though
the first layers of soil showed a considerable reduction in water content, the roots at
50cm, where there is plenty of water available, can supply enough water to the aerial
part o f the plant to keep the (Tw) in the leaves at a considerable value to that of well-
watered plants (Davies et al., 1990). These findings suggest that ABA concentration
can increase in plants due to soil dehydration irrespective of species.
Therefore, the discrepancies found between the physiological responses of
maize and bean to water deficit treatments in the present experiment and that
reported in chapter 6, may be attributable to the use of the same pot size and soil
volume in both experiments. Maize plants grew much larger, developing larger roots
216
and stems than bean. Thus, in chapter 6, the multiple effects o f plant size including
leaf size, roots and stems may have increased demand for water needed for growth
by maize compared to the bean plants used in chapter 5 and in the present study. In
addition, water deficit treatment may have also reduced the total water potential (TV)
or turgor potential (Tp) of the maize shoots as the roots were deeper and stronger
than those o f bean. Indeed, while reviewing cellular and molecular responses to
water deficit, and their influence on plant dehydration tolerance, workers found that
the responses o f plants to drought vary greatly depending on species and stress
severity (Mullet and Whitsitt, 1996).
The photoprotective function of carotenoids as explained in chapter 6, may
possibly explain the inconsistency and insignificant changes in carotenoid content of
treated plants found in the present study. Thus, despite the large variations in
reflectance in response to treatment, leaf carotenoid content was largely uncorrelated
with reflectance across the whole spectrum. The reduction in leaf water content o f
treated plants was not significant until 12 days after treatment for both water deficit
and combined oil and water deficit and 16 days for the oil pollution alone. As
explained in chapter 6, reduction in transpiration helps to conserve available water in
plants (Larcher, 1995), as does the stomatal conductance. Thus, the insignificant
change in leaf water content of the treated plants found at the early stage o f plant
stress in the present study may be attributed to the reduction in both transpiration and
stomatal conductance at this stage.
An earlier study found that the water content per unit area o f sunflower did
not change much due to moderate water stress since the plant tried to maintain a level
compatible with its basic functioning (Beaumont, 1995). An empirical study by Trejo
and Davies (1991) found an early reduction in stomatal conductance in young
217
seedlings o f two cultivars o f Phaseolus vulgaris L. (cv. Cacahuate-72 and
Michoacan-12A3) in response to soil drying when the water supply to the soil was
withheld. It was noted that the stomata o f these plants started to close before any leaf
water deficit could be detected. The cultivar Cacahuate-72 showed a significant
reduction in stomatal conductance by day 3, while the cultivar Michoacan-12A3
showed a significant reduction in this variable only by day 5 after treatment. This is
similar to the result o f the present study where a reduction in stomatal conductance
became significant 4 days after treatment with water deficit alone and 2 days after oil
and combined oil and water deficit treatments.
Substantial changes in spectral reflectance were observed in relation to all of
the treatments used in the present experiment. The results show that treatments
increased leaf and canopy reflectance both in the visible and SWIR (except in the
regions between 601 and 700nm where the spectral reflectance o f plants treated with
water deficit alone was not significant compared with the control) and decreased in
the NIR for all treatments. The result o f the present study is similar to the findings of
previous workers who investigated the spectral responses o f a wide range o f plant
species to different stressors. Smith et al. (2004a) found that the reflectance spectra
o f vegetation exposed to high concentrations o f natural gas in the soil increased in
the visible and decreased in the near infrared.
As noted earlier, while the visible region is principally influenced by the
photo synthetic pigments, the NIR and SWIR are heavily influenced by the internal
cell structure o f the leaf and water in plant tissue respectively (Gausman et a l, 1970;
Gausman, 1985; Bowman, 1989; Ceccato et al., 2001; Ceccato et a l, 2002; Tilling et
al., 2007). In the present study a strong negative relationship was found between the
total chlorophyll and visible reflectance. The most pronounced reflectance difference
218
found between leaf and canopy scales was that water deficit impacted the NIR more
at the canopy scale than at the leaf scale and vice versa in the SWIR. This suggests
that factors such as variation in leaf age as typically found in a plant canopy and leaf
wilting may have also affected the internal structure o f canopies resulting in a greater
change in NIR reflectance found at the canopy scale. However, such changes appear
not to have affected canopy SWIR reflectance, which remains low as the plant
tissues continue to contain sufficient water content to absorb most incident SWIR
radiation.
As discussed in chapter 6, Aldakheel and Danson (1997) and Danson et al.
(1992) noted that for individual leaves, there is normally a negative relationship
between the leaf water content and reflectance in the near and SWIR wavelengths.
This concurs with our correlation in the SWIR region but disagrees with the finding
in the NIR regions where leaf water content correlated positively with reflectance.
The strong negative relationships were attributed to water absorption, which
dominates the spectral response o f vegetation in those regions. A strong positive
relationship between NIR reflectance and leaf water content found in the present
study may be attributed to leaf structural changes. It has been noted earlier that NIR
is strongly affected by the size o f the cells, the number o f cell layers and the
thickness o f the leaf mesophyll. In dicotyledons, the upper and lower epidermises are
separated by the spongy mesophyll containing many spaces (Smith et a l., 2004a).
Leaves o f dicotyledons generally have higher reflectance than monocotyledons
because the spongy mesophyll is more developed (Gausman, 1985; Guyot, 1990) and
allows more light scattering between the cell walls (Smith et al., 2004a). In the
present study, treatments may have damaged the spongy mesophyll thus, reducing
light scattering which may have caused lower NIR reflectance in treated plants.
219
Thus, a strong positive relationship was found between the leaf water content and
reflectance in the NIR region.
The response o f leaf and canopy absolute temperature to treatments in the
present study concurs with that in chapter 6. The consistent increase in absolute
temperatures o f the treated plants in relation to controls is likely to be due to the
reduction in the transpiration and stomatal conductance o f treated plants. The
increase in leaf and canopy absolute temperatures o f the treated plants were
significant before visual stress symptoms were observed suggesting that it can be
useful in the early detection of oil pollution, the combined oil and water deficit and
water deficit. As explained in chapter 6, the inconsistent and insignificant differences
found between the leaf absolute temperature o f plants subjected to different types of
treatment indicates the limitation in this remotely-sensed parameter in predicting
accurately the type o f stress affecting the plants i.e. it is difficult to discriminate
between oil and water deficit stress. The results show that the thermal index (Ig) can
detect oil pollution and the combined oil and water deficit in bean. Similar to the leaf
absolute temperature, the consistent decrease in the thermal index (Ig) of treated
plants as a percentage of control is likely to be responding to the reduction in the
transpiration and stomatal conductance o f treated plants. While the Ig significantly
decreased in plants treated with oil pollution alone before visual stress symptoms
were observed, the combined oil and water deficit and water deficit were observed
the same day as visual stress symptoms. This suggests that in the present study, the
index I g can be useful in the early detection o f oil pollution in bean. However, it may
be difficult to discriminate between oil pollution and water deficit using Ig due to
inconsistency and insignificant differences found between the indexes o f plants
subjected to different types of treatment.
220
In order to understand whether spectral and thermal properties o f plants
translate from leaf to canopy scale, the temporal responses, sensitivity and
relationships between the optimal indices and biochemical properties were examined
at both the leaf and canopy scales. The total chlorophyll index R800/R 606 was
consistently sensitive to oil and combined oil and water deficit and detected the
combined oil and water deficit stress prior to visual stress symptoms. While the
index was sensitive to oil pollution on the same day as visual stress symptoms, no
consistent sensitivity was observed for water deficit. This was not the case at the
canopy scale as the index was consistently sensitive to all treatments but only at the
later stages o f the experiment. This suggests that while the index has potential for
early detection o f stress caused by combined oil and water deficit at the leaf scale, it
can only translate at the canopy scale at the later stage o f oil pollution, water deficit
and combined oil and water deficit. While a strong positive relationship was found
between the index and total chlorophyll content at the leaf scale (r2 = 0.92), a
moderate relationship was found at the canopy scale (r = 0.66).
At the leaf scale, the carotenoids spectral index was sensitive to oil and the
combined oil and water deficit before visual stress symptoms were observed.
Although the sensitivity was not consistent until after visual stress symptoms were
observed. The same observation was made at the canopy scale except that oil
pollution was detected prior to visual stress symptoms. A better relationship
(although weak) was found between the index and carotenoids content at the canopy
scale than at the leaf scale. Based on these findings, it would have been possible to
translate the use o f this spectral index from leaf to canopy scale but the major
difference found between the temporal response of the index at the leaf and canopy
scales hampers this possibility. The differences in the responses o f this index to
221
treatment at the leaf and canopy scales could be attributable to a multitude of
possibly interacting effects related to leaf age, leaf and canopy structure and
differential carotenoid concentrations throughout the canopy.
The leaf water content spectral index Rg65 showed similar sensitivity to oil
and combined oil and water deficit at the leaf scale although not before stress
symptoms were observed. The index was not consistently sensitive to water deficit
alone. At the canopy scale, the index was consistently sensitive to all treatments and
responded before visual stress symptoms were observed for oil pollution (alone) and
water deficit (alone). This suggests that the sensitivity o f the index improved at the
canopy scale. Based on the results o f the present study, the responses o f both the leaf
absolute temperature and Iq to treatments o f oil, water deficit and the combined oil
and water deficit can translate from leaf to canopy scale, and, indeed, in some cases
their performance improved at the canopy scale.
7.5 Conclusion
The present study confirms that hyperspectral and thermal remote sensing
have potential for early detection and discrimination between oil and water deficit
stress in plants. From the results o f the present study, the absolute temperature was
optimal for early detection o f oil pollution, water deficit and the combination o f oil
and water deficit stress in bean at the leaf scale. In terms of consistency and time of
detection, the absolute temperature performed best as it detected oil pollution, the
combined oil and water deficit and water deficit stresses 7, 4 and 2 days before visual
stress symptoms were observed, respectively. However, it was difficult to
discriminate between the oil and water stresses using this index. As found in chapter
222
6, for maize leaves absolute temperature was also optimal index for early detection
o f water deficit and the combined oil and water deficit.
The spectral indices Rgoo/R606 and Rs65 detected oil-related stress but did not
detect water deficit at the leaf scale. This suggests that these spectral indices have the
ability to discriminate between oil pollution and water deficit stress. This finding
concurs with that in chapter 6, where the spectral index (Ri33o-R538)/(Ri330+R538)
detected oil pollution and the combined oil and water deficit in maize at the leaf scale
but was unresponsive to water deficit stress alone. In the present chapter, it was
found that the spectral index R800/R6O6 was sensitive to oil-related stress at both the
leaf and canopy scale but changes were only detectable at the canopy scale at more
advanced stages of stress. On the contrary, other indices such as Rsoo/R52o5 Rs65,
absolute temperature and Ig, were able to detect stress earlier when measured at the
canopy scale than when measured at the leaf scale. Overall, the study has
demonstrated that the optimal remotely-sensed index for detection o f oil and water-
related stresses varies according to the plant species under investigation and the
effectiveness o f any particular approach varies between leaf and canopy scales.
223
Chapter 8
CONCLUSIONS AND FUTURE W ORK
8.1 Conclusions
This chapter gives a summary o f the research findings, a discussion o f the
overall contribution o f the thesis in the context o f existing works, and makes
suggestions for future research priorities. For the accurate monitoring o f plant stress
caused by oil pollution, there is a need to develop an approach that is sensitive to
physiological changes prior to visual stress observation. Such an approach needs to
have the ability to discriminate between oil pollution and other possible concomitant
stresses such as waterlogging and water deficit. Thus, this study had the primary
objective o f investigating the potential value of hyperspectral reflectance and thermal
imaging to detect and quantify plant stress caused by oil pollution along with the
ability to discriminate between different stresses. In order to achieve this aim, four
sets o f laboratory experiments were undertaken which tackled four major research
questions, as reported in chapters 4, 5, 6 and 7. The four questions are answered in
turn here, using the evidence provided in this study:
8.1.1 What is the optimum remotely-sensed index for early detection of oil-
induced stress in plants at lethal and sub-lethal levels?
■ There was a significant change in spectral reflectance at lethal and sub lethal
levels of oil pollution and as early as 4, 9, and 10 days in high, medium and
low treatments, respectively before visual stress symptoms were seen (e.g. as
in Table 4.6).
224
■ The simple ratios using combinations of narrow wavebands that ranged
between R715 - 760 and R695 - R716 were stable and highly sensitive to lethal
and sub lethal levels o f oil stress in maize.
■ A normalised-difference spectral index that combined a waveband in the red-
edge with one o f high reflectance in the N IR region: (R755-R7i6)/(R755+R7i5)
was optimal in pre-visual detection o f oil pollution in maize at lethal and sub-
lethal levels (see Table 4.6).
■ There was a strong positive linear relationship between (R755-
R7 i6)/(R755+R7 i6) and photosynthesis (see Figure 4.11).
■ Absolute leaf temperature has minimal potential for detecting oil pollution in
maize (see Figure 4.16).
■ This study concludes that the application o f hyperspectral remote sensing
using (R755-R716)/(R755 R716) can enhance precision and accuracy for the
early detection o f oil pollution via plant stress response. This indicates that by
detecting plant stress, hyperspectral remote sensing has considerable potential
for the timely detection o f oil pollution in the environment.
8.1.2 What is the optimum set of spectral and thermal responses that can be
used for early, non-destructive quantification and discrimination between oil
pollution and waterlogging stress in plants?
■ The spectral reflectance and thermal properties o f bean canopies effectively
distinguished between subtle signs o f stress induced by oil pollution and
waterlogging.
225
■ There was a significant increase in reflectance across the visible region for
plants treated with oil and a combined oil and waterlogging treatment (see
Figure 5.4).
■ For plants exposed to waterlogging alone, a significant increase in reflectance
in two specific regions centred on 550nm and 715nm was observed (see
Figure 5.4).
■ The study suggests that these waveband regions could serve as good indices
for discriminating between stress symptoms arising from oil or a combined
oil and waterlogging treatment and those arising from waterlogging alone.
■ NIR reflectance could be used to discriminate between stress induced in bean
by single and multiple factors as it was found that the combined oil and
waterlogging treatment caused a significant decrease in NIR reflectance while
the individual oil and waterlogging treatments did not invoke such a response
(see Figure 5.4).
■ A simple ratio o f reflectance that combined narrow wavebands in the green
and red regions (R673/R 545) was most sensitive in the early detection of stress
symptoms caused by oil and waterlogging (e.g. as in Table 5.0).
■ The canopy absolute temperature and the thermal index (Iq) were good
indicators o f developing oil and combined oil and waterlogging stress in
bean, and poor indicators o f stress caused by waterlogging (see Figure 5.7).
■ The study concludes that by combining spectral and thermal information, oil-
induced stress could be discriminated from a combined waterlogging stress
effect.
226
8.1.3 What is the optimum set of spectral and thermal responses that can be
used for early, non-destructive quantification of and discrimination between oil
pollution and water deficit stress?
■ Hyperspectral remote sensing can accurately measure the pigment
concentration in plants.
■ Oil pollution adversely affects chlorophyll contents in plants and therefore,
plant stress caused by oil pollution can be detected remotely (e.g. as in Table
6.0).
■ Remote sensing of carotenoid concentration alone is not sufficient for early
detection or discrimination between oil pollution and water deficit stress.
However, it can provide additional information about plant stress particularly
as carotenoids maintain some degree o f stability while chlorophyll content
decreases due to stress (e.g. as in Table 6.0).
■ Hyperspectral remote sensing may not be suitable for early detection o f stress
in maize caused by water deficit alone.
■ The spectral index (Ri33o-R538)/(Ri330+Rs38) was optimal for the early
detection o f stress caused by oil pollution in maize (e.g. as in Table 6.1).
■ The leaf absolute temperature was optimal for early detection of stress caused
by water deficit in maize (e.g. as in Table 6.2).
■ The leaf absolute temperature and Iq lack the ability to discriminate between
a combined oil and water deficit stress.
■ Thus, the combination o f hyperspectral and thermal remote sensing has
potential in the early stress detection and discrimination between oil and
water deficit stress in maize.
227
8.1.4 How consistent are the spectral and thermal responses of plants to oil
and water deficit stress between species and across leaf and canopy scales?
■ This investigation confirms that hyperspectral and thermal remote sensing
have potential for the early detection and discrimination between oil and
water deficit stress in plants.
■ Absolute temperature was optimal for early detection of oil pollution, water
deficit and the combination o f oil and water deficit stress in bean at the leaf
scale (e.g. as in Table 7.2) while spectral index (Ri33o-R538)/(Ri330+R538) was
optimal in the early detection o f oil stress in maize at the same scale (e.g. as
in Table 6.1)..
■ Spectral indices detected oil-related pollution in both maize and bean at the
leaf scale but did not detect water deficit (e.g. as in Table 6.1 & 7.2,
respectively). Thus, spectral reflectance has the ability to discriminate
between oil pollution and water deficit stress in both species.
■ Similar to the maize species, it was difficult to discriminate between oil and
water deficit stress in bean using leaf thermal features (see Figure 7.2).
■ The spectral index Rgoo/R606 was sensitive to oil-related stress at both leaf and
canopy scales, although in the latter, changes were only detectable at more
advanced stages o f stress (see Figure 7.2).
■ Other indices such as R800/R520, Rs65, absolute temperature and Iq, were able
to detect stress earlier when measured at the canopy scale than when
measured at the leaf scale (see Figure 7.2).
■ The study concludes that the optimal remotely-sensed index for detection and
discrimination between oil and water-related stresses varies according to the
plant species under investigation and the effectiveness o f any particular
228

approach varies between leaf and canopy scales. However, this can be
surmounted by using a combination of spectral and thermal remote sensing.
8.2 Synthesis of results
Oil pollution, waterlogging and water deficit can cause stresses in plants which
are detrimental to their physiological function and which result in changes in spectral
and thermal responses (Figure 8.0). There was a strong relationship between
physiological parameters and spectral indices. The form o f these relationships was
similar for different physiological parameters, being asymptotic on most occasions.
Thus, spectral indices would have limitations in predicting changes to physiological
parameters beyond certain thresholds, such as 1 mol m ' 2 s' 1 for transpiration,
indicating that the approach has some limitations. However, the thermal index (Iq)
showed a linear response to stomatal conductance, and this was consistent across
species. Thus, this relationship provides a means to support remote sensing strategies
for the early detection and discrimination of different types o f stress in plants.
229
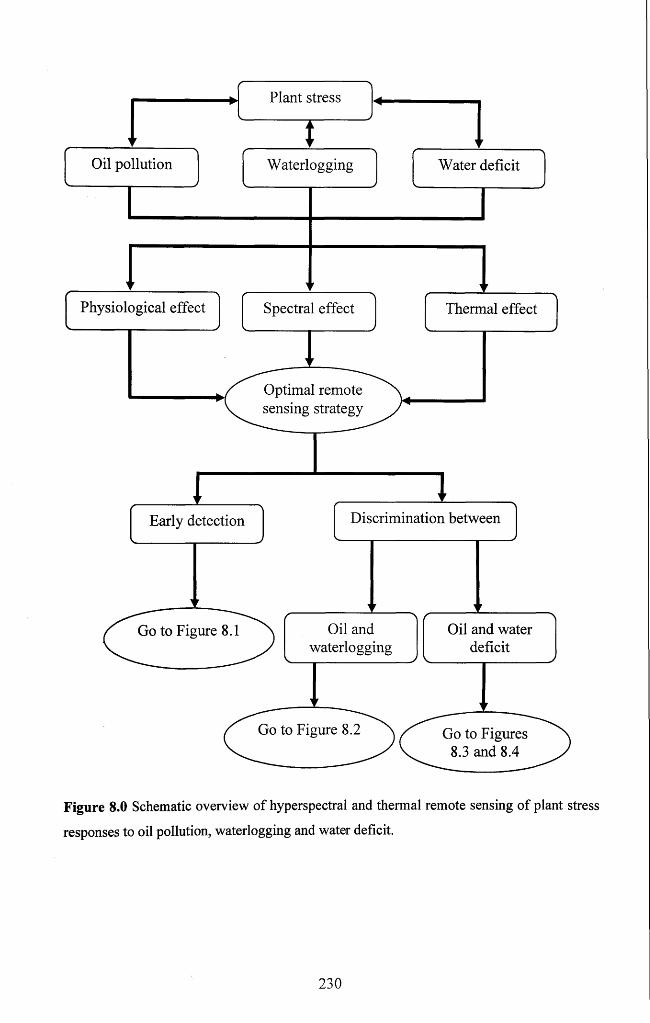
1
-------------------- ►\
r
rianx stressJ
tOil pollution
^— j
f >Waterlogging
-\Water deficit
yr yr y
Physiological effect'
r ■>Spectral effect
^ J
Thermal effectV .y
^ Optimal remote sensing strategy
Discrimination betweenEarly detection
Oil and Oil and waterGo to Figure 8.1waterlogging deficit
Go to Figure 8.2 Go to Figures 8.3 and 8.4
Figure 8.0 Schematic overview of hyperspectral and thermal remote sensing of plant stress
responses to oil pollution, waterlogging and water deficit.
230
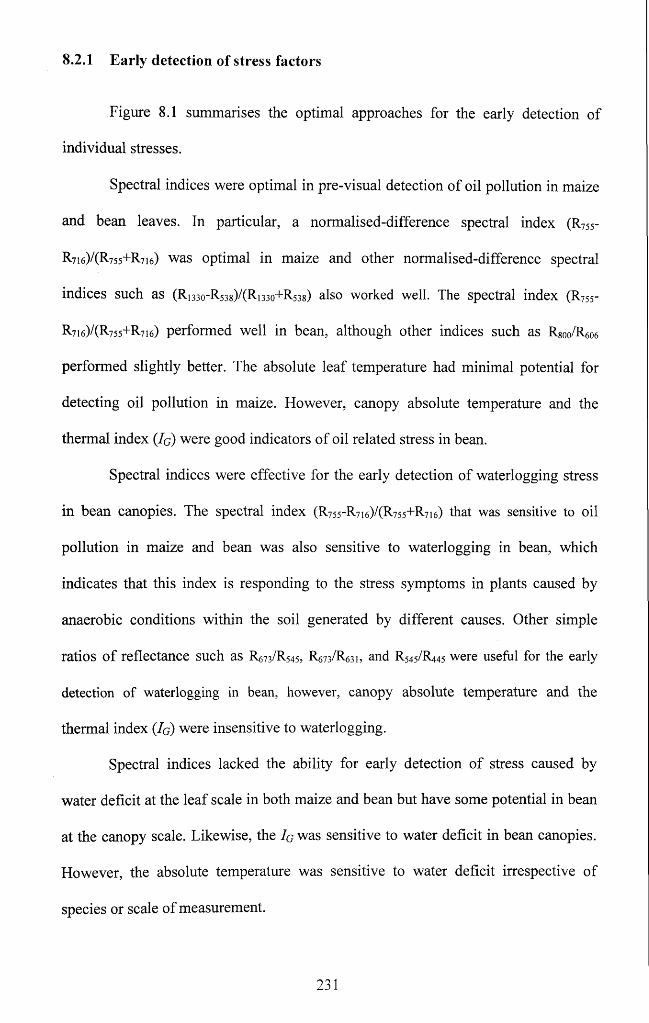
8.2.1 Early detection of stress factors
Figure 8.1 summarises the optimal approaches for the early detection of
individual stresses.
Spectral indices were optimal in pre-visual detection o f oil pollution in maize
and bean leaves. In particular, a normalised-difference spectral index (R755-
R7i6)/(R755+R7i6) was optimal in maize and other normalised-difference spectral
indices such as (Ri33o-R538)/(Ri33o+R538) also worked well. The spectral index (R755-
R7i6)/(R755+R7i6) performed well in bean, although other indices such as R800/R606
performed slightly better. The absolute leaf temperature had minimal potential for
detecting oil pollution in maize. However, canopy absolute temperature and the
thermal index (Ig) were good indicators o f oil related stress in bean.
Spectral indices were effective for the early detection o f waterlogging stress
in bean canopies. The spectral index (R755-R716)/(R755+R716) t h a t w a s s e n s i t i v e to oil
pollution in maize and bean was also sensitive to waterlogging in bean, which
indicates that this index is responding to the stress symptoms in plants caused by
anaerobic conditions within the soil generated by different causes. Other simple
ratios o f reflectance such as R673/R545, R ^ /R ^i, a n d R545/R445 w e r e u s e f u l for t h e e a r l y
detection of waterlogging in b e a n , h o w e v e r , canopy absolute temperature and the
thermal index ( Ig) were insensitive to waterlogging.
Spectral indices lacked the ability for early detection o f stress caused by
water deficit at the leaf scale in both maize and bean but have some potential in bean
at the canopy scale. Likewise, the I g was sensitive to water deficit in bean canopies.
However, the absolute temperature was sensitive to water deficit irrespective of
species or scale of measurement.
231
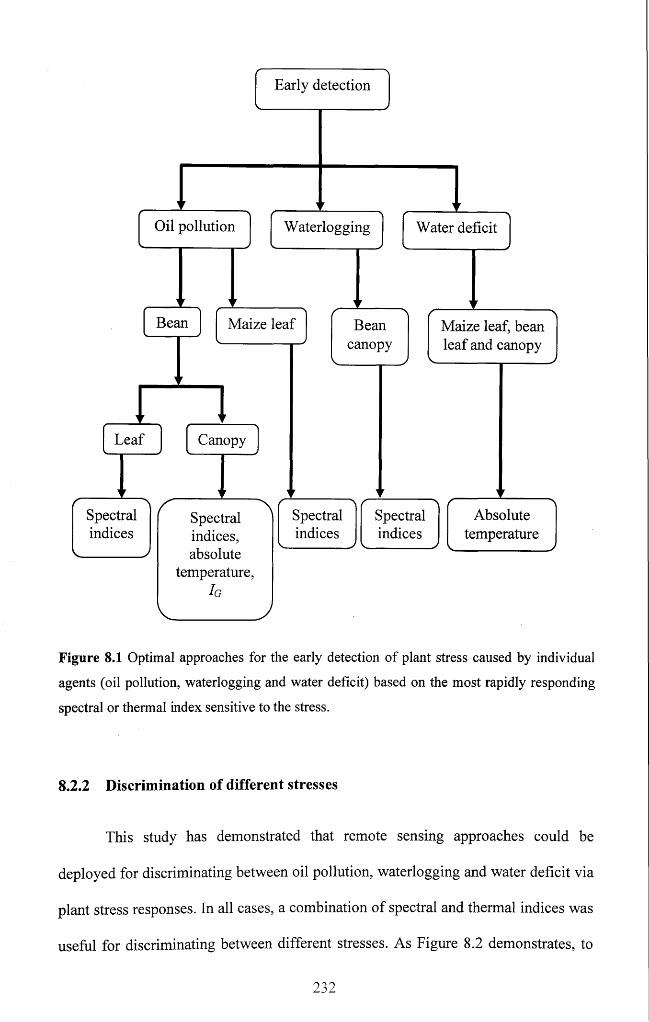
Spectralindices,absolute
temperature,
Bean
Leaf Canopy
Maize leaf
Water deficitOil pollution Waterlogging
Beancanopy
Spectralindices
Early detection
Absolutetemperature
Maize leaf, bean leaf and canopy
Spectralindices
Spectralindices
Figure 8.1 Optimal approaches for the early detection of plant stress caused by individual
agents (oil pollution, waterlogging and water deficit) based on the most rapidly responding
spectral or thermal index sensitive to the stress.
8.2.2 Discrimination of different stresses
This study has demonstrated that remote sensing approaches could be
deployed for discriminating between oil pollution, waterlogging and water deficit via
plant stress responses. In all cases, a combination o f spectral and thermal indices was
useful for discriminating between different stresses. As Figure 8.2 demonstrates, to
2 3 2
discriminate between oil pollution and waterlogging in bean canopies, a combination
o f Iq and spectral information could be used. If the Iq decreases, then this indicates
that the stress is caused by oil pollution but if the Ig does not change and a spectral
index such as R673/R 543 increases, then the stress is caused by waterlogging. If there
is no change in the spectral index, then there is neither oil pollution nor waterlogging
stress. As figures 8.3 and 8.4 demonstrate, to discriminate between oil pollution and
water deficit a combination o f spectral indices and absolute temperature can be used.
Indicators o f oil-induced stress are spectral indices such as (R755-R7i6)/(R755+R7i6) or
(Ri330-R538)/(Ri330+R538) for maize leaves, and R 800/R6O6 for bean leaves. If these
indices do not change and the absolute temperature increases, then the stress is
caused by water deficit. If there is no change in the absolute temperature, then there
is neither oil pollution nor water deficit stress.
At the canopy scale for beans, a NIR narrow waveband Rg65 responded faster
to water deficit stress than it did for oil pollution. This suggests that water deficit
damaged plant cellular and canopy structure more rapidly than the oil pollution and
thus, may potentially be a good indicator for discriminating between the two stresses.
Since the spectral indices, absolute temperature and Ig were sensitive to oil pollution
and water-related stress, additional information, for example concerning changes in
plant geometrical structure, may be required to improve a way o f discriminating
between oil pollution and water deficit stress at canopy scale.
233
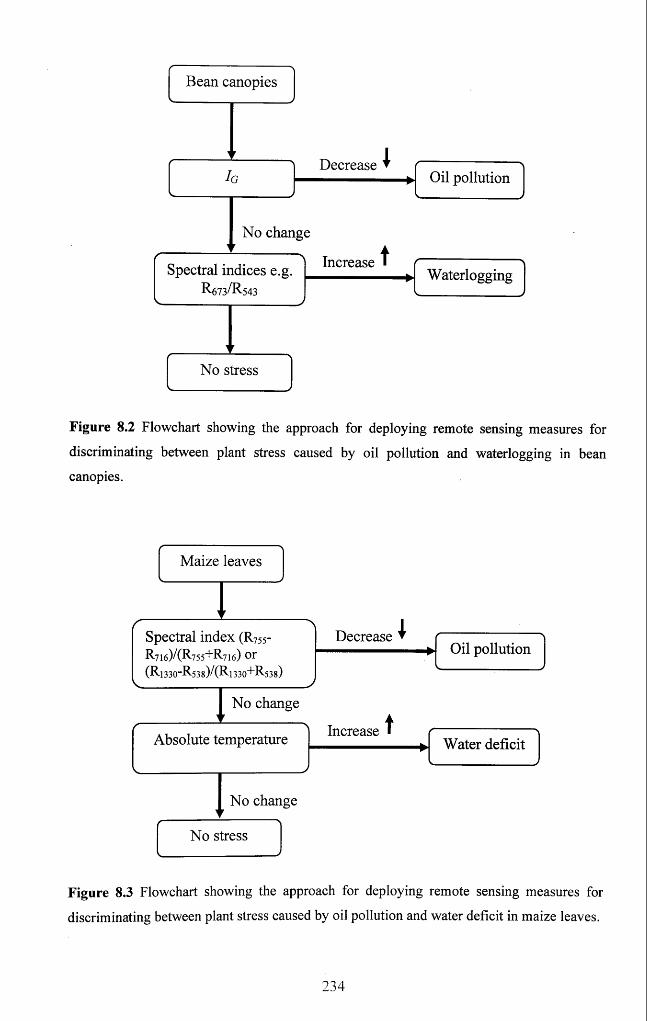
Decrease
No change
Increase
Oil pollution
Waterlogging
No stress
Bean canopies
Spectral indices e.g.R673/R543
Figure 8.2 Flowchart showing the approach for deploying remote sensing measures for
discriminating between plant stress caused by oil pollution and waterlogging in bean
canopies.
Decrease
No change
Increase
No change
Oil pollution
Water deficit
Maize leaves
No stress
Absolute temperature
Spectral index (R 755-
R-716)/(R755+ R716) Or (Rl 330-R53 8) / (R 1330+R538)
Figure 8.3 Flowchart showing the approach for deploying remote sensing measures for
discriminating between plant stress caused by oil pollution and water deficit in maize leaves.
234
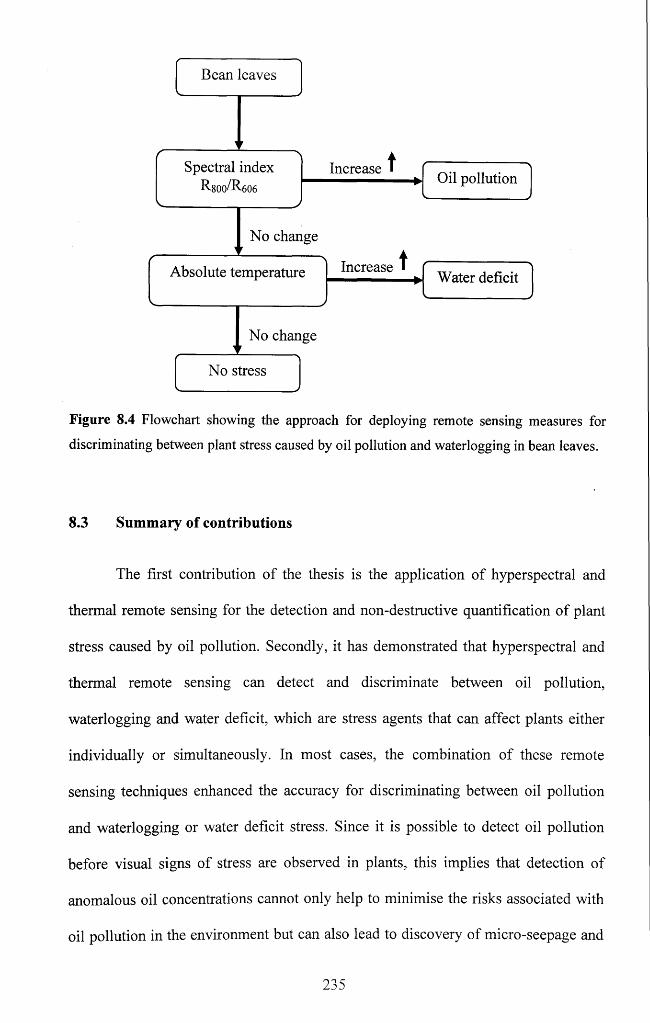
Increase
No change
Increase
No change
Oil pollution
W a t e r d e f i c i t
No stress
Bean leaves
Spectral indexR-800/R606
Absolute temperature
Figure 8.4 Flowchart showing the approach for deploying remote sensing measures for
discriminating between plant stress caused by oil pollution and waterlogging in bean leaves.
8.3 Summary of contributions
The first contribution o f the thesis is the application o f hyperspectral and
thermal remote sensing for the detection and non-destructive quantification o f plant
stress caused by oil pollution. Secondly, it has demonstrated that hyperspectral and
thermal remote sensing can detect and discriminate between oil pollution,
waterlogging and water deficit, which are stress agents that can affect plants either
individually or simultaneously. In most cases, the combination o f these remote
sensing techniques enhanced the accuracy for discriminating between oil pollution
and waterlogging or water deficit stress. Since it is possible to detect oil pollution
before visual signs of stress are observed in plants, this implies that detection of
anomalous oil concentrations cannot only help to minimise the risks associated with
oil pollution in the environment but can also lead to discovery of micro-seepage and
235
related oil reservoirs. The use o f this technique could help to speed up and improve
response to an oil spill and could significantly reduce the environmental impact and
severity o f a spill. It can also help to prioritise effort in clean-up operations in the
event o f an oil spill and can provide information about protection priorities for the
affected areas which is one o f the most important elements o f contingency plans.
8.4 Limitations of the study
While this study has shown evidence about the possibility to detect and
discriminate between plant stresses caused by oil pollution, waterlogging and water
deficit under controlled environment, there may be issues and problems associated
with their field-based application. For example, the pot-based experiments did not
include continuous oiling o f plants that may happen in the field during oil spillage.
Instead, the study adopted one-time oiling treatment which may not be considered
truly representative o f conditions that plants would encounter during oil spill events.
Thus, it may be difficult to translate the general responses o f these plants to oil stress
in the present experiments as such stress condition may occur at varying intensity
and duration in field situations. Additionally, other stress factors such as nutrient
deficiency may also be affecting plants growing in the field at the same time with the
stresses used in this study.
A slower spectral and thermal response o f plants to stress may be expected in
field situation because o f possible dilution o f treatments. Plant spectral and thermal
responses o f pot-based experiment may also vary from the responses obtained in
field situation due to variation in soil structure on which they grow in the field. For
pot-based experiments, plants were grown on the same soil type (compost), but in the
236
field, plants usually grow on different soil types. In chapter 2, section 2.3.1, it was
noted that the physical, chemical and geological characteristics o f soil play
significant roles in the degree o f its vulnerability to an oil spill (Gundlach and Hayes,
1978). Similarly, Pezeshki et al. (2000) noted that factors such as soil type, soil
organic matter, size fraction o f soil mineral matter and soil texture play significant
roles in the fate o f hydrocarbon in the soil. While it may be easier for oil to penetrate
rapidly within a given soil type (e.g. fine, coarse-grained sand, mixed sand and
gravel, sheltered rocky and tidal flat and salt marsh and mangrove forest), most of
the oil will not adhere to, nor penetrate into a compacted soil type.
Furthermore, this study used single crop species and thus, their responses to
stress may not have adequately represented the type o f stress response plant would
encounter under field condition. Based on these limitations, this study proposes the
following future works.
8.5 Future research directions
This research has provided a basis for the study o f plant stress caused by oil
pollution. It has also shown that oil, waterlogging and water deficit stress in plant can
be detected, quantified and discriminated using hyperspectral and thermal remote
sensing. Based on the nature of, and findings in this thesis, the following proposals
are made:
■ There is a need to test this approach under field conditions since the results o f
this study were obtained based exclusively on research in the laboratory. This
will help to establish whether subtle spectral and thermal features relating to
leaf physiological and biochemical changes in laboratory spectrometry and
237
thermography are detectable in spectra and thermography of leaves and plant
canopies in the field situation. It may be worthwhile to investigate if the same
treatment dose o f stresses will have the same effect on plants growing in
different pot sizes. This will help to ascertain whether plants stress responses
to various stresses could translate from pot-based laboratory experiment to
field situation.
■ Under field conditions, factors such as the complexity o f the canopy
structure, soil background, atmospheric, and illumination variation due to
sensor-sun geometry have a considerable and specific impact on the
vegetation spectrum (Delalieux et al., 2008). However, it is possible to
minimise these effects by combining single-band reflectances into a
vegetation index that is sensitive to the plant canopy and not to the soil
(Leblon, 2010). Ratioing allows removal o f the disturbances affecting, in the
same way, reflectances in each band. Indeed, work remains to be done to
scale this approach to larger scale remote sensing applications. Atmospheric
disturbances affect space-borne reflectance measurements; however, this can
be overcome by calibrating the remote sensing imagery to reflectance
percentage of the target being measured. Furthermore, other environmental
and meteorological factors such as wind speed, humidity, cloud, ambient
temperature and irradiance that may affect thermal measurements in the field
can be overcome by using wet and dry references (as demonstrated in this
study). In particular, in order to improve the ability to discriminate between
oil and water-related stresses at canopy scale, the potential for collecting
additional information on vegetation canopies such as the structure and
geometry using LiD AR imagery could be explored.
238
■ In order to operationalise the techniques developed in this study, high spatial,
spectral and temporal resolution airborne or satellite remote sensing is
required. High spatial resolutions in the order o f one metre or less would be
required to be able to locate small features such as oil pipelines. If the
spectral resolution of the sensor is high in the visible, NIR and SWIR then,
subtle differences arising from oil pollution and other causes o f plant stress
such as waterlogging and water deficit could be discriminated. This is
because information about the general health status of plants is often
embedded in narrow spectral features. With high temporal resolutions, it may
be possible to detect oil, waterlogging and water deficit stress in plants before
stress symptoms are seen. With high resolution remote sensing imagery, it
may be possible to capture the spatial variations of stress indices proposed in
this study, map oil, waterlogging and water deficit stresses and develop time
series of spectral and thermal responses of plants to these stresses.
■ For safety reasons, this study used 15W/40 diesel engine oil (Unipart,
Crawley, UK) (which is not highly flammable) in all experiments to model
oil stress in plants. Thus, there may be the need to use crude and/or other
refined oil products typically stored and transported through pipelines (e.g
petrol and diesel), to confirm consistency in spectral responses.
■ It is worthwhile to investigate the potential of this approach for the early
detection, non-destructive quantification and discrimination between oil
pollution and nutrient deficiency in plants, as some form o f nutrient
deficiency is prevalent in almost all ecosystems.
■ While single crop species have been used in this study, it is important to
investigate the possibility o f applying the remotely-sensed approaches for
239
monitoring natural vegetation communities. Hence, the use o f a mixture of
plant species at different growing stages to closely mimic natural vegetation
communities is proposed for future investigations.
240
References
Aina, E. O. A., and Adedipe, N. O., 1991. The making o f Nigerian environmental
policy. Federal Environmental Protection Agency, Lagos, p. 329.
Al-abbas, A. H., Barr, R., Hall, J. D., Crane, F. L., and Baumgardner, M. F., 1974.
Spectra o f normal and nutrient-deficient maize leaves. Agron. J. 66, pp. 16-20.
Aldakheel, Y. Y., and Danson, F. M., 1997. Spectral reflectance o f dehydrating leaves:
measurements and modeling. International Journal o f Remote Sensing 18, pp.
3683-3690.
Alexander, S. K., Webb Jr., J. W., 1987. Relationship o f Spartina altemiflora to
sediment oil content following an oil spill. In: Proceedings o f the 1987 Oil Spill
Conference. American Petroleum Institute, Washington, D.C, pp. 445-449.
Amadi, A., Abbey, S. D., Nma, A., 1996. Chronic effects o f oil spill on soil properties
and microflora o f rain-forest ecosystem in Nigeria. Water Air Soil Pollutant, 86,
pp. 1-11.
Amadi, A., Dickson, A. A., and Maate, G. O., 1993. Remediation of polluted soil I.
Effect o f organic and inorganic nutrient supplements on the performance o f maize
(zea mays). Water, Air and Soil Pollution, 66, pp. 59-76.
Amakiri, J. O., Onoteghara, F. A., 1984. Effects o f crude oil pollution on the growth o f
Zea Mays, Abelmosvhus esculentus and Capsicum frutescans. Oil and Petroleum
Pollution, 1(3), pp. 199-206.
Anderson, J. E., and Perry, J. E., 1996. Characterization o f wetland plant stress using
leaf spectral reflectance: implication o f wetland remote sensing. Wetlands, 16 (4),
pp. 477-487.
241
Anoliefo, G. O., and Okoloko, G. E., 2000. Comparative toxicity o f forcados blend
crude oil and its water soluble fraction on seedlings o f Cucumeropsis Manni
Naudin. Nigeria Journal o f Applied Science, 18, pp. 39-49.
Anoliefo, G. O., Vwioko, D. E., and Mpamah, P., 2003. Regeneration o f Chromolaena
Odorata (1) K. and R. incrude oil polluted soil: a possible phytoremediating agent.
Benin Science Digest, 1, pp. 78-82.
Arthur, J. J., Leone, I. A., and Flower, F. B., 1985. The response o f tomato plants to
simulated landfill gas mixtures. Journal o f Environmental science and Health, 20,
pp. 913-925.
Asner, G. P., 1998. Biophysical and biochemical sources o f variability in canopy
reflectance, Remote Sensing o f Environment, 64(3), pp. 234-253.
Asner, G. P., 2004. Biophysical Remote Sensing Signatures o f Arid and Semiarid
Ecosystems. In: Ustin S.L. (Ed.), Remote Sensing for Natural Resources
Management and Environmental Monitoring: Manual o f Remote Sensing, 3 ed.,
Vol. 4, pp. 53-109. John Wiley & Sons, Inc.
Asner, G. P., and Vitousek, P. M., 2005. Remote analysis o f biological invasion and
biogeochemical change. Proceedings o f the National Academy o f Sciences, USA,
102, pp. 4383-4386.
Audesirk, T., and Audesirk, G., 1999. Biology: Life on Earth. Prentice Hall. Upper
Saddle River, NJ.
Bacour, C., Jacquemoud, S., Tourbier, Y., Dechmbre, M., and Frangi, J. P., 2002.
Design and analysis of numerical experiments to compare four canopy reflectance
models. Remote Sensing o f Environment, 79 (1), pp. 72-83.
Baker, J. M., 1976. (Ed.), Marine Ecology and Oil Pollution. Applied science
Publishers Ltd., Essex England, pp. 483-536.
242
Baker, J. M., 1970. The effects o f crude oil on plants. Environmental pollution, 1, pp.
27-44.
Baldock, J. A., Kay, B. D., Schnitzer, M., 1987. Influnce of cropping treatments on the
monosaccharide content o f the hydrolysates o f a soil and its aggregate fractions.
CanJ. o f Soil Sci., 67, pp. 489-499.
Baltzer, J. L., and Thomas, S. C., 2005. Leaf optical responses to light and soil nutrient
availability in temperate deciduous trees. American Journal o f Botany, 92, pp. 214-
223.
Bammel, B. H., and Bimie R. W., 1994. Spectral response o f big sagebrush to
hydrocarbon-induced stress in the Bighorn Basin, Wyoming. Photogrammetric
Engineering and Remote Sensing, 60, pp. 87-96.
Barnes, E. M., Clarke, T. R., and Richards, S. E., 2000, Coincident detection o f crop
water stress, nitrogen status and canopy density using ground based multi-spectral
data. In: Proceedings o f the 5th International conference on Precision Agriculture,
Bloomington, MN, USA.
Beaumont, P., 1995. Reflectance foliaire et acclimatation a un deficit hydique: cas des
feuilles de toumesol. PhD Thesis, Ecophysiologie vegetale et Teledetection,
Universite Paul Sabatier, Toulouse, France, pp. 129.
Belanger, M., Miller, J. R., and Boyer, M. G., 1995. Comparative relationships between
some red-edge parameters and seasonal leaf chlorophyll concentrations. Canadian
Journal o f Remote Sensing, 21 (1), pp. 16-21.
Berry, H., and Ritter, R., 1997. Puget Sound intertidal habitat inventory 1995:
Vegetation and shoreline characteristics classification methods, pp. 34. Report for
Washington Department of Natural Resources, Aquatic Resources Division,
Olympia, WA, USA.
243
Blackburn, G. A., 2006. Hyperspectral remote sensing o f plant pigments. Journal o f
Experimental Botany, 58 (4), pp. 855-867.
Blackburn, G. A., 1999. Relationships between spectral reflectance and pigment
concentrations in stacks o f deciduous broadleaves. Remote Sensing o f
Environment, 70(2), pp. 224-237.
Blackburn, G. A., 1993. Remote sensing o f deciduous woodlands: a tool for ecological
investigations, Ph. D. thesis, University o f Southampton, UK.
Blackburn, G. A., 1998a. Spectral indices for estimating photosynthetic pigment
concentrations: a test using senescent tree leaves. International Journal o f Remote
Sensing, 19(4), pp. 657-675.
Blackburn, G. A., 1998b. Quantifying chlorophylls and carotenoids from leaf to canopy
scales: an evaluation o f some hyperspectral approaches. Remote Sensing o f
Environment, 66 (3), pp. 273-285.
Blackburn, G. A., 2002. Remote sensing o f forest pigments using airborne imaging
spectrometer and LIDAR imagery. Remote Sensing o f Environment, 82, pp. 311-
321.
Blackburn, G. A., 2006. Hyperspectral remote sensing o f plant pigments. Journal o f
Experimental Botany, pp. 1-13.
Blackburn, G. A., 2007. Hyperspectral remote sensing o f plant pigments. Journal o f
Experimental Botany, 58 (4), pp. 855-867.
Bonham-Carter, G. F., 1988. Numerical procedures and computer program for fitting
an inverted Gaussian model to vegetation reflectance data. Computers and
Geosciences, 14 (3), pp. 339-356.
Boochs, F., Kupfer, G., Dockter, K., and Kuhbauch, W., 1990. Shape o f the red-edge as
vitality indicator for plants. International Journal o f Remote Sensing, 11(10),
244
1741-1753.
Bossert, I., and Bartha, R., 1984. The fate o f petroleum in soil ecosystem. In: Petrol
Microbiol. Atlas, R. M. (Ed.). Macmillian Publishers Ltd., New York, pp. 435-479.
Bowman, W. D., 1989. The relationship between leaf water status, gas exchange, and
spectral reflectance in cotton leaves. Remote Sensing o f Environment, 30, pp. 49-
255.
Boyer, M, Miller, J., Belanger, M., Hare, E., and Wu, J., 1988. Senescence and spectral
reflection in leaves o f northern pin oak (Uerus palustirs Muenchh.) Remote Sensing
o f Environment, 25, pp. 71-87.
Bradford, K. J., 1983. Effect o f soil flooding on leaf gas exchange o f tomato plants.
Plant Physiology, 73, pp. 475-479.
Bradford, K. J., and Yang, S. F., 1981. Physiological responses o f plants to
waterlogging. HortScience, 16, pp. 322-326.
Broge, N. H., and Mortensen, J. V., 2002. Deriving green crop area index and canopy
chlorophyll density of winter wheat from spectral reflectance data. Remote Sensing
o f Environment, 81, pp. 45-57.
Buschmann, C., 1999. Thermal dissipation during photosynthetic induction and
subsequent dark recovery as measured by photo-acoustic signals. Photosynthetica,
36, pp. 149-161.
Buschmann, C., and Lichtenthaler, H. K., 1988. Reflectance and chlorophyll
fluorescence signatures o f leaves. In: Applications o f chlorophyll fluorescence in
photosynthesis research, stress physiology, hydrobiology and remote sensing;
Lichtenthaler, H. K., Ed.; Kluwer Academic Press, pp. 325-332.
Buschmann, C., Rinderle, U., and Lichtenthaler, H. K., 1991. Detection o f stress in
coniferous forest trees with the VIRAF spectrometer. IEEE Transactions o f
245
Geoscience and Remote Sensing, 29, pp. 96-100.
Campbell, J. B., 1996. Introduction to remote sensing. 2nd edition. Taylor & Francis
Ltd. London.
Campbell, P. K. E., Middleton, E. M., McMurtrey, J. E., Corp, L. A., and Chappelle, E.
W., 2007. Assessment o f vegetation stress using reflectance or fluorescence
measurements. Journal o f Environmental Quality, 36, pp. 832-845.
Carter, G. A., 1991. Primary and second effects o f water content on the spectral
reflectance o f leaves. American Journal o f Botany, 78, pp. 916-924.
Carter, G. A., 1993. Responses o f leaf spectral reflectance to plant stress. American
Journal o f Botany 80, pp. 239-243.
Carter, G. A., 1994. Ratios o f leaf reflectances in narrow wavebands as indicators o f
plant stress. International Journal o f Remote Sensing, 15, pp. 697-703.
Carter, G. A., Bahadur, R., and Norby, R. J., 2000. Effects o f elevated atmosphere CO2
and temperature on leaf optical properties in Acer saccharum. Environmental and
Experimental Botany, 43, pp. 267-273.
Carter, G. A., Cibula, W. G., Miller, R. L., 1996. Narrow-band reflectance imagery
compared with thermal imagery for early detection o f plant stress. Journal o f plant
physiology, 148, 5, pp. 515-522.
Carter, G. A., and Knapp, A. K., 2001. Leaf optical properties in higher plants: linking
spectral characteristics to stress and chlorophyll concentration, American Journal
o f Botany, 88, pp. 677-684.
Carter, G. A., and Miller, R. L., 1994. Early detection o f plant stress by digital imaging
within narrow stress-sensitive wavebands. Remote Sensing o f Environment, 50, pp.
295-302.
246
Carter, G. A., Paliwal, K., Pathre, U, Green, T. H., Mitschell, R. J., and Gjerstad, D. H.,
1989. Effect o f competition and leaf age on visible and infrared reflectance in pine
foliage. Plant Cell Environment, 12, pp. 309-315.
Carter, G. A., and Spiering, B. A., 2002. Optical properties o f intact leaves for
estimating chlorophyll concentration. Journal o f Environmental Quality, 31, pp.
1424-1432.
Ceccato, P., Flasse, S., Tarantola, S., Jacquemond, S, and Gregoire, J. M., 2001.
Detecting vegetation leaf water content using reflectance in the optical domain.
Remote Sensing o f Environment, 11 (1), pp. 22-33.
Ceccato, P., Gobron, N., Stephane, F., Bernard, P., Tarantola, S., 2002. Designing a
spectral index to estimate vegetation water content from remote sensing data: Part
1 Theoritical approach. Remote Sensing o f Environment, 82, pp. 188-197.
Chaerle, L., Leinonen I., Jones H. G., Van Der Straeten D., 2007. Monitoring and
screening plant population with combined thermal and chlorophyll Fluorescence
imaging. Journal o f Experimental Botany, 58 (4), pp. 773-784.
Chaerle, L., Saibo, N., and Van Der Straeten D., 2005. Tuning the Pores: towards
engineering plants for improved water use efficiency. Trends in Biotechnology 23,
pp. 308-315.
Chaerle, L., Van Caeneghem W., Messens E., Lambers H., Van Montagu M., and Van
Der Straeten D., 1999. Presymptomatic visualization o f plant-virus interactions by
thermography. Nature Biotechnology, 17, pp. 813-816.
Chalker-Scott, L., 1999. Environmental significance o f anthocyanins in plant stress
responses. Photochemistry and Photobiology, 70, pp. 1-9.
Cheng, Y., Zarco-Tejada, P. J., Riano, D., Rueda, C. A., and Ustin, S. L., 2006.
Estimating vegetation water content with hyperspectral data for different canopy
247
scenarios: Relationship between AVRIS and MODIS indexes. Remote Sensing o f
Environment, 105, pp. 354-366.
Cho, M. A., and Skidmore, A. K., 2006. A new technique for extracting the red-edge
position from hyperspectral data: The linear extrapolation method. Remote Sensing
o f Environment, 101(2), pp. 181-193.
Cibula, W. G., and Carter, G. A., 1992. Identification o f a far-red reflectance response
to ectomycorrhizae in slash pine. International Journal o f Remote Sensing, 13, pp.
925-932.
Clark, R. N., 1999. Spectroscopy o f rocks and minerals, and principles o f spectroscopy.
In: A.N. Rencz (Ed.), Remote Sensing for the Earth Sciences. Manual o f Remote
Sensing, vol. 3. John Wiley & Sons, New York, NY, pp. 3-58.
Cohen, Y., Alchanatis, V., Meron, M., Satanga, Y., and Tsipris, J., 2005. Estimation of
leaf water potential by thermal imagery and spatial analysis. Journal o f
Environmental Botany, 56 {AM) pp. 1843-1852.
Coley, P, and Aide, T., 1989. Red colouration o f tropica young leaves: a possible anti-
fungal defence? Journal o f Tropical Ecology, 5, pp. 283-300.
Collins, W., 1978. Remote Sensing o f crop type and maturity. Photogrammetric
Engineering and Remote Sensing, 44, pp. 43-55.
Cook, F. O., and Westlake, D. W. S., 1974. Microbial degeneration o f northern crude
oils. Environment-Social Program, Northern Pipelines Task Force Report, pp. 71-
74.
Curran, P. J., 2001. Imaging spectrometry for ecological applications, International
Journal o f Applied Earth Observation and Geoinformation, 3 (4), pp. 305-312.
Cwick, G. J., Bishop, M. P., Howe, R. C., Mausel, P. W., Everitt, J. H., and Escobar, D.
E., 1995. Multispectral video data for detecting biochemical conditions at an
248
Albama oil field site. Geocarto Intrenational, 10, pp. 59-66.
Danson, F. M., and Aldakheel, Y. Y., 2000. Diurnal water stress in sugar beet: spectral
reflectance measurements and modeling. Agronomie, 20, pp. 31-39.
Danson, F. M., Steven, M. D., Malthus, T. J., and Clark, J. A., 1992. High spectral
resolution data for monitoring leaf water content. International Journal o f Remote
Sensing, 13, pp. 461-470.
Datt, B., 1999. Visible/near infrared reflectance and chlorophyll content in eucalyptus
leaves. International Journal o f Remote Sensing, 20(14), pp. 2741-2749.
Daughtry, C. H. T., Walthall, C. L., Kim, M. S., de Colstoun, E. B., and McMurtrey III,
J. E., 2000. Estimating com leaf chlorophyll concentration from leaf and canopy
reflectance. Remote Sensing o f Environment, 74, pp. 229-239.
Davies, K. M., 2004. Plant pigments and their manipulation. Annual plant reviews, vol.
14. Oxford, UK: Blackwell Publishing.
Davies, W. J., Atkinson, C. J., and Zhang, J., 1990. Perception o f soil drying via the
increased synthesis of abscisic acid in roots. In mechanisms o f plant perception and
response to environmental stimuli. Eds. H. T. Tudor and R. S. Aileen. British
Society o f Plant Growth Regulation, Monograph, 20, pp. 85-96.
Dawson, T.P., and Curran, P.J., 1998. A new technique for interpolating the reflectance
red-edge position. International Journal o f Remote Sensing, 19 (11), pp. 2133-
2139.
Delalieux, S., Somers, B., Verstraeten, W. W., Keulemans, W., and Coppin, P., 2008.
Hyperspectral canopy measurements under artificial illumination. International
Journal o f Remote Sensing, 29 (19-20), pp. 6051-6058.
Demming-Adams, B., and Adams, W. W., 1996. The role o f xanthophyll cycle
carotenoids in the protection o f photosynthesis. Trends in Plant Science, 1, pp. 21-
249
27.
Deng, X., Joly, R. J., and Hahn, D. T., 1990. The influence o f plant water deficit on
distribution o f 14C- labelled assimilates in cocoa seedlings. Annals o f Botany, 6,
pp. 211-217.
De Oliveria, W. J., and Crosta, A. P., 1996. Detection of hydrocarbon seepage in the
Sao Francisco basin, Brazil, through Landsat TM, soil geochemistry and
airborne/field spectrometry data integration. Proceedings o f the eleventh Thematic
Conference and Workshops on Applied Geologic Remote Sensing, Las Vegas,
Nevada, 27-29 February, 1996, Vol. 1 (Ann Arbor: Environmental Research
Institute o f Michigan), pp. 155-165.
De Oliveira, W.J., Crosta, A.P., and Goncalves, J. L. M., 1997. Spectral characteristics
o f soils and vegetation affected by hydrocarbon gas: a greenhouse simulation o f
the Remansa Do Gogo seepage. Twefth International Conference and Workshops
on Applied Geologic Remote Sensing, Denver, Colorado, 17-19 November 1997,
l , pp . 17-19.
Deng, X., Joly, R. J., and Hahn, D. T., 1990. The influence o f plant water deficit on
distribution o f 14C- labelled assimilates in cocoa seedlings. Annals o f Botany, 6,
pp. 211-217.
De Jong, E., 1980. The effect o f a crude oil spill on cereals. Environmental Pollution ,
22, pp. 187-196.
De Wit, 1978. Morphology and function o f root and shoot growth o f crop plants under
oxygen deficiency. In: Plant Life in Anaerobic Environments. Ed. D. D. Hook and
R. M. H. Crawford. Ann Arbor Science.
DeLaune, R. D., Patrick Jr., W. H. and Buresh, R. J., 1979. Effect o f crude oil on a
Louisiana Spartina altemiflora salt marsh. Environmental Pollution, 20, pp. 21-31.
250
De la Torre, A. A., 1987. Drainage and land reclamation in Peru, In: Proceedings, 25th
Symposium on International course on Land Drainage, edited by J. Vos. Publ. 42,
ILRI, Wageningen.
Dobrowski, S. Z., Pushnik, J. C., Zarco-Tejada, P. J., and Ustin, S. L., 2005. Simple
reflectance indices track heat and water-stress induced changes in steady-state
chlorophyll fluorescence at the canopy level. Remote Sensing o f Environment, 97,
pp. 403-414.
Dormaar, J. F., 1988. Effects o f plant root on chemical and biochemical properties o f
surrounding discrete soil zones. Can. J. Soil, 68, pp. 233-242.
Drew, M. C., and Sisworo, E. J., 1979. The development o f water logging damage in
young barley plants in relation to plant nutrient status and changes in soil
properties. New Phytologist, 82, pp. 301-314.
Edem, E., 2008. Nigeria: 1,260 oil spills identified in Niger Delta, www.allafrica.com.
Edema, N. E., Obadoni, B. O., Erheni, H., and Osakwuni, U. E., 2009. Eco-
phytochemical studies o f plants in a crude oil polluted terrestrial habitat located at
Iwhrekan, Ugheli North Locan Government Area o f Delta State. Nature and
Science, 7(9), pp. 49-52.
Edge, R., McGarvey, D. J., and Truscotte, T. G., 1997. The carotenoids as anti
oxidants. Journal o f Photochemical Photobiology (B), 41, pp. 189-200.
Ehrler, W.L., 1973. Cotton leaf temperatures as related to soil water depletion and
meteorological factors. Agron. Journal, 65, pp. 404-409.
Else, M. A., Coupland, D., Dutton, L., and Jackson, M. B., 2001. Decreased root
hydraulic conductivity reduces leaf water potential, initiates stomatal closure and
slows leaf expansion in flooded plants of castor oil (Ricinus communis) despite
diminished delivery o f ABA from the roots to shoots in xylem sap. Physiol. Plant,
251
I l l , pp. 46-54.
Elvidge, C.D., 1990. Visible and near infrared reflectance characteristics o f dry plant
materials. International Journal o f Remote Sensing, 11 (10), pp. 1775-1795.
Entcheva, P., 2000. Remote sensing o f forest damage in the Czech Republic using
hyperspectral methods. Ph.D. dissertation, University of New Hampshire, Durham.
European Space Agency, 2007. Earthnet online earth observation.
http://earth.esa.int/applications/data_util/SARDOCS
Everett, K. R., 1978. Some effects o f oil on the physical and chemical characteristics o f
wet Tundra soil. Arctic, 31 (3), pp. 260-276.
Fan L. M., Zhao Z. X., and Assmann S. M., 2004. Guard cells: a dynamic signaling
model. Current Opinion in Plant Biology, 7, pp. 537-546.
Ferri, C. P., Formaggio, A. R., and Schiavinato, M. A., 2004. Narrow band spectral
indexes for chlorophyll determination in soyabean canopies [Glycine max (L.)
Merril]. Brazilian Journal o f Plant Physiology, 16, pp. 131-136.
Farquhar, G. D., and Sharkey, T. D., 1982. Stomatal conductance and photosynthesis.
Annual Review o f Plant Physiology, 33, pp. 317-345.
Fensholt, R., and Sandholt, I., 2003. Derivation o f shortwave infrared water stress index
from MODIS near-and shortwave infrared data in a semiarid environment. Remote
Sensing o f Environment, 87(1), pp. 111-121.
Filella, I., and Penuelas, J., 1994. The red edge position and shape as indicators o f plant
chlorophyll content, biomass and hydric status. International Journal o f Remote
Sensing, 15, pp. 1459-1470.
Fourty, T., and Baret, F., 1997. Vegetation water and dry matter contents estimated
from top-of-the-atmosphere reflectance data: a simulation study. Remote Sensing o f
Environment, 61, pp. 34-45.
252
Fourty, T., Baret, F., Jacquemoud, S., Schmuck, G., and Verdebout, J., 1996. Leaf
optical properties with explicit description o f its biochemical composition:direct
and inverse problems. Remote Sensing o f Environment, 56, pp. 104-117.
Freudenrich, C., 2008. How oil refining works at http://science.howstuffworks.com/oil-
refming3.htm.
Gamon, J., and Surfus, J., 1999. Assessing leaf pigment content and activity with a
reflectometer. New Phytologist, 143, pp. 105-117.
Gao, B. -C., 1996. NDW I-A normalized difference water index for remote sensing of
vegetation liquid water from space. Remote Sensing o f Environment, 58 (3), pp.
257-266.
Gao, B. -C ., and Goetz, A. F. H., 1995. Retrieval o f equivalent water thickness and
information related to biochemical components o f vegetation canopies from
AVIRIS data. Remote Sensing o f Environment, 52(3), pp. 155-162.
Gao, B. -C., and Goetz, A. F. H., 1994. Extraction o f dry leaf spectral features from
reflectance spectra o f green vegetation. Remote Sensing o f Environment, 47, pp.
369-374.
Gastellu-Etchegorry, J. P., Guillevic, P., Zagolski, F., Demarez, V., Trichon, V.,
Deering, D., and Leroy, M., 1999. Modelling BRF and radiation regime o f boreal
and tropical forests: I. BRF. Remote Sensing o f Environment, 68, pp. 281-316.
Gates, D. M., Keegan, H. J., Schelter, J. C., and Weidner, V. R., 1965. Spectral
properties o f plants. Applied Optics, 4 (1), pp. 11-20.
Gausman, H. W., 1985. Plant leaf optical properties in visible and near-infrared light.
Graduate Studies, Texas Tech University, Texas Tech Press, Lubbock, Texas, 29,
pp. 78.
Gausman, H. W., and Allen, W. A., 1973. Optical parameters of leaves o f 30 plant
253
species. Plant Physiology, 52, pp. 57-62.
Gausman, H. W., Allen, W. A., Cardenas, R., and Richardson, A. J., 1970. Relation of
light reflectance to histological and physical evaluation o f cotton leaf maturity.
Applied Optics, 9, pp. 545-552.
Gausman, H. W., Quisenberry, J. E., 1990. Spectrophotometric detection o f plant leaf
stress. In: Katterman, F., ed. Environmental Injury to Plants. San Diego: Academic
Press, pp. 257-280.
Gibbs, J., and Greenway, H., 2003. Review: Mechanisms o f anoxia tolerance in plants.
I. growth, survival and anaerobic catabolism. Funct. Plant Biol., 30, pp. 1-47.
Gilfillan, E. S., Page, D. S., Bass, A. E., Foster, J. C., Fickett, P. M., Ellis, W. G. H.,
Rusk, S., and Brown, C., 1989. Use o f NA/K ratios in leaf tissues to determine
effects o f petroleum on salt exclusion in marine halophytes. Marine Pollution
Bulletin, 20, pp. 272-276.
Gill, L. S., Nyawuame, H. G. K., and Ehikhametaor, A. O., 1992. Effects o f crude oil
on the growth and anatomical features o f Chromolaena odorata. Journal o f
Chromolaena, 5, pp. 1-9.
Gitelson, A. A., Gritz, Y., and Merzlyak, M. N., 2003. Relationships between leaf
chlorophyll content and spectral reflectance and algorithms for non-destructive
chlorophyll assessment in higher plant leaves. Journal o f Plant Physiology, 160,
pp. 271-282.
Godwin R., Abouguendia Z., and Thorpe J., 1990. Response o f soils and plants to
natural gas migration from two wells in the Lloyd Minster Area, Saskatchewan
Research Council, pp. 85.
Godwin, T. W. and Mercer, E. I., 1983. Introduction to plant biochemistry. Oxford:
Pergamon Press.
254
Goel, P. K., Prasher, S. O., Landry, J. A., Patel, R. M., Viau, A. A., and Miller, J. R.,
2003. Estimation o f crop biophysical parameters through airborne and field
hyperspectral remote sensing. Trans-actions o f theASAE, 46, pp. 1235-1246.
Goetz, A. F. H., Rock, B. N., and Rowan, L. C., 1983. Remote sensing for exploration:
an overview. Economic Geology, 78, pp. 573-590.
Goetz, S. J., Prince, S. D., Goward, S. N., Thawley, M. M., and Small, J., 1999.
Satellite remote sensing of primary production: an improved production efficiency
modelling approach. Ecological Modelling, 122, pp. 239-255.
Gond, V., De Pury, D. G. G., Veroustraete, F. and Ceulemans, R., 1999. Seasonal
variations in leaf area index, leaf chlorophyll, and water content; scaling-up to
estimate fAPAR and carbon balance in a multilayer, multispecies temperate forest.
Tree Physiology, 19, pp. 673-679.
Gong, P., Pu, R., and Heald, R.C., 2002. Analysis o f in situ hyperspectral data for
nutrient estimation of giant sequoia. International Journal o f Remote Sensing, 23,
(9,) pp. 1827-1850.
Gould, K., Kuhn, D., Lee, D., and Oberbauer, S., 1995. Why leaves are sometimes red.
Nature, 378, pp. 241-242.
Goulden, K. S., McKelvie, J., and Markham, K. R., 2002. Do anthocyanims function as
antioxidants in leaves? Imaging o f H2O2 in red and green leaves after mechanical
injury. Plant, Cell and Environment, 25, pp. 1261-1269.
Graeff, S., and Claupein, W., 2007. Identification and discrimination o f water stress in
wheat leaves (Triticum aestvum L.) by means o f reflectance measurements.
Irrigation Science, 26, pp. 61-70.
Grant, O. M., Chaves, M. M., and Jones, H. G., 2006. Optimizing thermal imaging as a
technique for detecting stomatal closure induced by drought stress under
255
greenhouse conditions. Physiologia Plantarum, 127, pp. 507-518.
Grant, O. M., Tronina, L., Jones, H. G., and Chaves, M. M., 2007. Exploring thermal
imaging variables for the detection o f stress responses in grapevine under different
irrigation regimes. Journal o f Experimental Botany, 58, (4), pp. 815-825.
Griffeth III, T. J., 2009. Hyperspectral reflectance as an indicator o f foliar nutrient
levels in hybrid poplar clone O P-367 grown on biosolid amended soil. An M.Sc.
thesis submitted to the faculty o f the graduate school o f the University of
Maryland, College park, USA.
Gudin, C. and Syratt, W. J., 1975. Biological aspects o f land rehabilitation following
hydrocarbon contamination. Environmental Pollution , 8, pp. 107-112.
Gundlach E. R., and Hayes M. O., 1978. Classification o f coastal environments in
terms o f potential vulnerability to oil spill impacts. Marine Technology Society
Journal, 12, (4), pp. 18-27.
Gunther, T., Domberger, Utz., Fritsche, W., 1996. Effects o f ryegrass on
biodegradation o f hydrocarbons in soil. Chemosphere, 33, (2), pp. 203-215.
Guyot, G., 1990. Optical properties o f vegetation canopies. In Applications o f Remote
Sensing in Agriculture, edited by M. D. Steven and J. A. Clark (London:
Butterworths), pp. 19-39.
Haboudane, D., Miller, J. R., Tremblay, N., Zarco-Tejada, P. J., and Dextraze, L., 2002.
Integrated narrow-band vegetation indices for prediction o f crop chlorophyll
content for application in precision agriculture. Remote Sensing o f Environment 81,
pp. 416-426.
Hartel, H., and Grimm, B., 1998. Consequences o f chlorophyll deficiency for leaf
carotenoids composition in tobacco synthesizing glutamate 1-semialdehyde
aminotransferase antisense RNA: dependency on developmental age and growth
256
light. Journal o f Experimental Botany, 49, pp. 535-546.
Hillel, D., 1998. Environmental Soil Physics. Academic press.
Hoeks, J. 1972. Changes in composition o f soil air near leaks in natural gas mains. Soil
Science, 113, pp. 46-54.
Hoffer, R. M., 1978. Biological and physiological considerations in applying computer-
aided analysis techniques to remote sensor data. In: Swain, P. H. and Davis, S. M.,
(Eds.), Remote Sensing: The Quantitative Approach, McGraw-Hill.
Holt, S., Rabalais, S., Rabalais, N., Cornelius, S., and Holland, J. S., 1978. Effects o f an
oil spill on salt marshes at Harbor Island, Texas. I. Biological. In: Proceedings,
Conference on the Assessment o f Ecological Impacts of Oil Spills. American
Institute of Biological Science, pp. 344-352.
Horler, D. N. H., Dockray, M., and Barber, J., 1983. The red-edge of plant leaf
reflectance. International Journal o f Remote Sensing, 4 (2), pp. 273-288.
Isirimah, N. O., Zoufa, K., and Loganathan, P., 1989. Effect o f crude oil on maize
performance and soil chemical properties in the humid forest zone o f Nigeria.
Discovery and Innovation, 1(3), 95-98.
Iwanow, W. N., Dylgierow, A. N., and Stabnikowa, E., 1994. Aktivnost niekatorych
ekologo-troficzieskich grup mikroorganizmow pri zagraznienii cziemoziema
obyknowiennowo ygliewodorami niefci. M ikrobiol Zurn., 6, pp. 59-63.
Jackson, R. D., 1986. Remote Sensing o f biotic and abiotic plant stress. Annual Review
o f Phytopathology, 24, pp. 265-287.
Jackson, R. D. and Ezra, C. E., 1995. Spectral response o f cotton to suddenly induced
water stress. International Journal o f Remote Sensing, 6, pp. 177-185.
Jackson, R. D., Idso, S. B., Reginato, R. J., 1977. Remote sensing o f crop canopy
temperatures for scheduling irrigation and estimating yield. In: Proceedings o f the
257
Symposium on Remote Sensing o f natural Resources, Utah State Univ., Logan, UT.
Jackson, M. B., and Hall, K. C., 1987. Early stomatal closure in waterlogged pea plants
is mediated by abscisic acid in the absence o f foliar water deficits. Plant, Cell and
Environment, 10, pp. 121-130.
Jacquemoud, S., 1993. Inversion o f the PROSPECT + SAIL canopy from AVIRIS
equivalent spectra: theoretical study. Remote Sensing o f Environment, 30, pp. 43-
54.
Jacquemoud, S., and Baret, F., 1990. PROSPECT: A model o f leaf optical properties
spectra. Remote Sensing o f Environment, 34, pp. 75-91.
Jacquemoud, S., Bacour, C., Poilve, H., and Frangi, J. P., 2000. Comparison of four
radiative transfer models to simulate plant canopies reflectance - direct and inverse
mode. Remote Sensing o f Environment, 74 (3), pp. 471- 481.
Jacquemoud, S., and Baret, F., 1990. PROSPECT: a model o f leaf optical properties
spectra. Remote Sensing o f Environment, 34, pp. 75-91.
Jacquemoud, S., Ustin S. L., Verdebout, J., Schmuck G., Andreoli, G., Hosgood, B.
1996. Estimating leaf biochemistry using the PROSPECT leaf optical properties
model. Remote Sensing o f Environment, 56, pp. 194-202.
Jago, R. A., and Curran, P. J., 1996. Estimating the chlorophyll concentration o f a
grassland canopy for chemical monitoring using remotely sensed data. Paper
presented at the remote sensing and industry conference, remote sensing society,
University o f Nottingham.
Jones, H. G., 2004. Application o f thermal imaging and infrared sensing in plant
physiology and ecophysiology. Advances in Botanical Research, 41, 107-163.
Advances in Botanical Research Incorporating Advances in Plant Pathology, 41,
pp. 107-163.
258
Jones, H. G., 1999a. Use o f thermography for quantitative studies o f spatial and
temporal variation o f stomatal conductance over leaf surfaces. Plant Cell
Environment, 22, pp. 1043-1055.
Jones, H. G., 1999b. Use o f infrared thermometry for estimation of stomatal
conductance in irrigation scheduling. Agr fo r M eteor, 95, pp. 135-149.
Jong, E. de, 1980. The effect o f a crude spill on cereals. Environmental Pollution Series
A, Ecological and Biological, 22 (3), pp. 187-196.
Kasischke, E. S., Goetz S., Hansen M.C., Ustin S. L., Ozdogan M., Woodcock C. E.,
and Rogan, J., 2004. Temperate and boreal forests. In: Ustin S.L. (Ed.), Remote
Sensing for Natural Resources Management and Environmental Monitoring:
M anual o f Remote Sensing, 3 ed., vol. 4, pp. 147-238. John Wiley & Sons, Inc.
Kempeneers, P., De Backer, S., Debruyn, W., Coppin P., and Scheunders, P., 2005.
Generic wavelet based hyperspectral classification applied to vegetation stress
detection. IEEE Transactions on Geoscience and Remote Sensing, 43 (3), pp. 610-
614.
Ketel, D. H., 1996. Effect o f low doses of metamitron and glyphosphate on growth and
chlorophyll content of common lambsquarters (Chenopodium album). Weed
Science, 44, pp. 1-6.
Knipling, E. B., 1970. Physical and physiological basis for the reflectance o f visible
and near-infrared radiation from vegetation. Remote Sensing o f Environment 1, pp.
155-159.
Krebs, C. T. Tanner, C. E., 1981. Cost analysis o f marsh restoration through sediment
stripping and Spartina propagation. In: Proceedings of the 1981 Oil Spill
Conference. American Petroleum Institute, Washington, D.C, pp. 375-385.
Kucharski, J., Wyszkowska, J., 2001. Microbiological properties o f soil contaminated
259
with diesel oil. Acta Agrophis., 51, pp. 113-120.
Ladjal, M., Deloche, N., Hue, R., and Ducrey, M., 2007. Effects o f soil and air drought
on growth, plant water status and leaf gas exchange in three Mediterranean cedar
species: Cedrus atlantica , C. Brevifolia and C. Libani. Trees, 21, pp. 201-213.
Lamb, D. W., Steyn-Ross, M., Schaares, P., Hanna, M. M., Silvester, W., and Steyn-
Ross, A., 2002. Estimating leaf nitrogen concentration in rye-grass (Lolium spp)
pasture using the chlorophyll red-edge: Modelling and experimental observations.
International Journal o f Remote Sensing, 23 (18), pp. 3619-3648.
Lang, H. R., Aldeman, W. H., and Sabins, F. F. JR., 1985a. Patrick Draw, Wyoming -
petroleum test case report. In the Joint NASA/Geosat test case project: Final
Report, edited by M. J. Abrams, J. E. Conel, H. R. Lang, and H. N. Paley (Tulsa,
Oklahoma: The American Association of Petroleum Geologists). AAPG Special
Publication, 2, XI, 1-28.
Lang, H. R., Curtis, J. B., and Kovacs, J. C., 1985b, Lost river, West Virginia -
petroleum test site report. In the Joint NASA/Geosat test case project: Final
Report, edited by M. J. Abrams, J. E. Conel, H. R. Lang, and H. N. Paley (Tulsa,
Oklahoma: The American Association o f Petroleum Geologists). AAPG Special
Publication, 2, XII, 1-96.
Larcher, W., 1995. Physiological plant ecology. Ecophysiology and stress, physiology
o f functional groups (3rd ed.) pp. 528. New York: Springer.
Lawlor, D. W., 2001. Photosynthesis, 3rd edition BIOS Scientific Publishers Inc.,
Oxford, UK.
Le Maire, G., Francois, C., Dufrene, E., 2004. Towards universal broad leaf chlorophyll
indices using PROSPECT simulated database and hyperspectral reflectance
measurements. Remote Sensing o f Environment, 89, pp. 1-28.
260
Leblon, B., 2010. Soil and vegetation optical properties: applications on remote
sensing, volume 4, University o f New Brunswick, Fredericton (NB), Canada,
w w w .rscc.umn.edu/rscc/volume4/leblon/leblon.htm.
Lee, E., and Banks, M. K., 1993. Biodegradation o f petroleum contaminated soil using
vegetation: A microbial study. Journal o f Environmental Science Health, A28, pp.
2187-2198.
Leinonen, I., and Jones, H. G., 2004. Conbining thermal and visible imagery for
estimating canopy temperature and identifying plant stress. Journal o f
Environmental Botany, 55 (401), pp. 1423-1431.
Lenk, S., Chaerle L., Pfundel, E. E., Langsdorf G., Hagenbeek, D., Lichtenthaler, H. K.,
Van Der Straeten, D., and Buschmann C., 2007. Multispectral fluorescence and
reflectance imaging at the leaf level and its possible applications. Journal o f
Experimental Botany, 58 (4), pp. 807-814.
Li S., Assmann, S. M., Albert, R., 2006. Predicting essential components o f signal
transduction networks: a dynamic model o f guard cell abscisic acid signaling.
PLoS Biology, 4, pp. 312.
Lichtenthaler, H. K., 1987. Chlorophylls and carotenoids: pigments o f photosynthesis
biomembranes. Methods in Enzymology, 148, pp. 3 5 0 -3 8 3 .
Lichtenthaler, H. K., 1998. Vegetation stress: an introduction to the stress concept.
Journal o f Plant Physiology, 148, pp. 4-14.
Lichtenhaler, H. K., Lang, M., Sowinska, M., Heisel, F., and Mieh, J. A., 1996.
Detection o f vegetation stress via a new high resolution fluorescence imaging
system. Journal o f Plant Physiology, 148, pp. 599-612.
Liew, O. W., Chong, P. C. J., Li, B., and Asundi, A. K., 2008. Signature optical cues:
Emerging technologies for monitoring plant health. Sensors, 8, pp. 3205-3239.
261
Lim K., Treitz P., Wulder M., St-Onge B., and Flood M., 2003. LIDAR Remote
Sensing o f Forest Structure. Progress in Physical Geography, 27 (1), pp. 88-106.
Lin, Q., Mendelssohn, I. A., Suidan, M. T., Lee, K., and Venosa, A. D., 2002. The
dose-response relationship between No. 2 fuel oil and the growth o f the salt marsh
grass, Spartina alterniflora. Marine Pollution Bulletin, 44, pp. 897-902.
Llewellyn, G. M., and Curran, P. J., 1999. Understanding the grassland red-edge using
a combined leaf and canopy model. Paper presented at the 25th annual conference
o f The Remote Sensing Society 25th: From data to information, University of
Cardiff.
Luther, J. E., Carrol, A. L., 1999. Development o f an index o f balsam fir vigor by foliar
spectral reflectance - a measure o f tree vigor, Remote Sensing o f Environment, 69
(3), pp. 241-252.
Lynch, J. 1995., Root architecture and plant productivity. Plant Physiology, 109, pp. 7-
13.
Maas, S. J., and Dunlap, J. R., 1989. Reflectance, transmittance, and absorptance of
light by normal, etiolated, and albino com leaves. Agronomy Journal, 81, pp. 105-
110.
Malachowska-Jutsz, A., Mrozowska, J., Kozielska, M., and Miksch, K., 1997.
Aktywnosc enzymatyczna w glebie skazonej zwi^zkami ropopochodnymi w
procesie jej detoksykacji. Biotechnoi, 36, pp. 79-91.
Manabu, T., Yasuhiro, K., and Yasuhisa, M., 1999. Effects o f waterlogging treatment
on growth and nitrogen fixation o f tropical forage legumes, Genus Aeschynomene
and Macroptilium. Grassl Science, 45(3), pp. 238-247.
Maracci, G., Schmuck, G., Hosgood, B., and Andreoli, G., 1991. Interpretation of
reflectance spectra by plant physiological parameters. In: Proceeding o f
262
International Geosciences and remote Sensing Symposium (IGARSS ’91), Remote
Sensing: Global Monitoring fo r Earth Management. Helsinki University o f
Technology, Espoo (Finland), 3-6 June 1991 (pp. 2303-2306). New York:IEEE.
Martin, M., 1994. Measurements o f foliar chemistry using laboratory and airborne high
spectral resolution visible and infrared data. Ph.D. diss. Univ. o f New Hampshire,
Durham.
Masoni, A., Ercoli, L., and Mariotti, M., 1996. Spectral properties o f leaves deficient in
iron, sulphur, magnesium and manganese. Agronomy Journal, 88, pp. 937-943.
Massoni, A., Ercoli, L., and Masoni, A., 1996. Spectral properties o f iron-deficient com
and sunflower leaves. Remote Sensing o f Environment, 58, pp. 282-288.
McCoy, R. M., Scott, L. F., and Hardin, P., 1989. The spectral response of sagebmsh in
areas o f hydrocarbon production. Proceedings o f the Seventh Thematic Conference
on Remote Sensing fo r Exploration Geology, Ann Arbor, Michigan, Environment
Research Institute (Ann Arbor: Environmental Research Institute of Michigan),
pp.751-756.
Mendelssohn, I. A., McKee, K. L., and Kong T., 2001. A Comparison o f physiological
indicators o f sublethal cadmium stress in wetland plants. Environmental and
Experimental Botany 46, pp. 263-275.
Mendelssohn, I. A., McKee, K. L., and Kong, T., 1993. An evaluation o f indicators of
wetland vegetation stress and their relationship to biological endpoints. Office o f
exploratory research, US EPA, Washington, D. C.
Merzlyak, M. N., Gitelson, A. A., Chivkunova, O. B., and Rakitin, Y. Y., 1999. N on
destructive optical changes during leaf senescence and fruit ripening. Physiologia
Plantarum, 106, pp. 135-141.
Merzlyak, M. N., Solovchenko, A. E., and Gitelson, A. A., 2003. Reflectance spectral
263
features and non-destructive estimation o f chlorophyll, carotenoids and
anthocyanin content in apple fruit. Postharvest Biology and Technology, 27, pp.
197-211.
Miller, J. R., Hare, E. W., and Wu, J., 1990. Quantitative characterization of vegetation
red-edge reflectance 1: An Inverted-Gaussian reflectance model. International
Journal o f Remote Sensing, 11 (10), pp. 1755-1774.
Miller, J. R., Wu, J., Boyer, M. G., Belanger, M., and Hare, E. W., 1991. Seasonal
pattern in leaf reflectance red-edge characteristics. International Journal o f Remote
Sensing, 12(7), pp. 1509-1523.
Milton, E. J., 1987. Principles o f field spectroscopy. International Journal o f Remote
Sensing , 8 (12), pp. 1807-1827.
Milton, E. J., and Wardley, N. W., 1987. Vegetation canopy reflectance models: A
Review. Discussion paper No. 31, Department o f Geography, University of
Southampton, UK.
Milton, N. M., Ager, C. M., Eisworth, B. A., and Power, M. S., 1989. Arsenic- and
selenium-induced changes in spectral reflectance and morphology o f soyabean
plants. Remote Sensing o f Environment, 30, pp. 263-269.
Mirani, M., and Memon, Y., 2001. Farmers’ participation in the sustainable land use for
rural poverty alleviation in Sindh. Paper presented in roots conference organized
by RICS foundation.
Moller, M., Alchanatis, V., Cohen, Y., Meron, M., Tsipris, J., Naor, A., Ostrovsky, V.,
Sprintsin, M., and Cohen, S., 2007. Use o f thermal and visible imagery for
estimating crop water status o f irrigated grapevine. Journal o f Environmental
Botany, 58 (4), pp. 827-838.
Monsi, M., and Saeki, T., 1953. Uber den lichtfaktor in den pflanzengesellschaften und
264
seine bedeutung fur die stoffproduktion. Japanese Journal o f Botany, 14, pp. 22-
52.
Moran M. S., Maas S. J., Vanderbilt V. C., Barnes E. M., Miller S. N., and Clarke T.
R., 2004. Application o f image-based remote sensing to irrigated agriculture. In:
Ustin S.L. (Ed.), Remote Sensing fo r Natural Resources Management and
Environmental Monitoring: Manual o f Remote Sensing, 3 ed., 4, pp. 617-676. John
Wiley & Sons, Inc.
Morita, S, Abe, J., Furubayashi, S., Lux, A., and Tajima, R., 2004. Effects of
waterlogging on root system of soyabean. In proceedings o f the 4th International
Crop Science Congress, Brisbane, Australia, September 26 - October 1.
Mullet, J. E., and Whitsitt, M. S., 1996. Plant cellular responses to water deficit. Plant
Growth Regulation, 20 (2), pp. 119-124.
Mutanga, O., Skidmore, A., and Van Wieren, S., 2003. Discriminating tropical grass
(Cenchrus ciliaris) canopies grown under different nitrogen treatments using
spectroradiometry. ISPRS Journal o f Photogrammetry & Remote Sensing, 57, pp.
263-272.
Myers, V. I., 1970. Soil, water and plant relations in remote sensing. National Academy
o f Sciences, Washington, D.C., pp. 253-297.
Natural Resources Canada, http://www.ccrs.nrcan.gc.ca. Accessed on 4/09/2008.
NERC Earth observation data centre, http://www.neodc.rl.ac.uk. Accessed on
4/09/2008.
Nobel, P. S., 1991. Physicochemical and environmental plant physiology. Academic
Press, San Diego.
Noomen M. F., Skidmore A. K., and Van der Meer F. D., 2003. Detecting the influence
o f gas seepage on vegetation, using hyperspectral remote sensing. Presented at the
265
3rd EARSel workshop on imaging spectoscopy, Herrsching, 13-16 May, pp. 252-
256.
Noomen, M. F., Skidmore, A. K., Van der Meer, F. D., and Prins, H. H. T., 2006.
Continuum removed band depth analysis for detecting the effects o f natural gas,
methane and ethane on maize reflectance. Remote Sensing o f Environment, 105
(3), pp. 262-270.
Nwankwo, J. N. and Ifeadi, C. N., 1986. Oil spill incidents in Nigerian petroleum
industry: a critical analysis, in the Quarterly magazine o f the NNPC, 8 (4),
published by Public Affairs Department, NNPC, Lagos, Nigeria.
Nwilo, P. C. and Badejo, O. T., 2004. Management o f oil spill dispersal along the
Nigerian coastal areas, OceanDocs, E-repository o f ocean publications,
http://hdl.handle.netA 834/267.
Odu, C. T., 1981. Degradation and weathering o f crude oil under tropical condition.
The petroleum industry and the Nigerian environment. In: Proceedings o f the
International Seminar by the NNPC, PTI, Warri, pp. 164-170.
Odu, C. T., 1977. Oil pollution and the environment. Bulletin Science Association o f
Nigeria , 3, pp. 23-29.
Odu, C. T., Nwoboshi, L. C., and Esuruoso, O. F., 1985. Environmental studies (soils
and vegetation) of the Nigerian Agip Oil Company operation, areas. In:
Proceedings o f an International Seminar on the Petroleum Industry and the
Nigerian Environment, NNPC, Lagos, Nigeria. Pp. 274-283.
Odu, C. T. and Offodum, I., 1986. Oil pollution and the environment. Bulletin o f
Science Association o f Nigeria, 3(2), pp. 282-289.
Ogboghodo, I. A., Erebor, E. B., Osemwota, I. O., and Isitekhale, H. H., 2004. The
effects o f application o f poultry manure to crude oil polluted soils on maize (Zea
266
mays L.) growth and soil properties. Environmental Monitoring and Assessment,
96, pp. 153-161.
Okin, G. S., and Roberts D. A., 2004. Remote Sensing in Arid Regions: Challenges and
Opportunities. In: Ustin S.L. (Ed.), Remote Sensing for Natural Resources
Management and Environmental Monitoring: Manual o f Remote Sensing, 3 ed., 4,
pp. 111-145. John Wiley & Sons, Inc.
Olga, M. G., Tronina, L., Jones, H. G., and Chaves, M. M., 2007. Exploring thermal
imaging variables for the detection o f stress responses in grapevine under different
irrigation regimes. Journal o f Experimental Botany, 58(4), pp. 815-825.
Omosun, G., Markson, A. A., and Mbanasor, O., 2008. Growth and anatomy o f
Amatanthus Hybridus as affected by different crude oil concentrations. American-
Eurasian Journal o f Scientific Research, 3(1), pp. 70-74.
Onillon, B., Durand, J. L., Gastel., F., and Tournebize, R., 1995. Drought effects on
growth and carbon partitioning in a tall fescue sward grown at different rates of
nitrogen fertilization. European Journal o f Agronomy, 4, pp. 91-99.
Osuji, L. C., and Ezebuiro, P. E., 2006a. Hydrocarbon contamination o f a typical
mangrove floor in Niger Delta, Nigeria. International Journal o f Environ. Sci.
Tech., 3 (3), pp. 313-320.
Osuji, L. C., Egbuson, E. J. G., and Ojinnaka, C. M., 2005. Chemical reclamation of
crude-oil inundated soils from Niger Delta, Nigeria. Chem. Ecol., 21(1), pp. 1-10.
Osuji, L. C., Iniobong, D. I. and Ojinnaka, C. M., 2006b. Preliminary investigation of
Mgbede-20 oil polluted site in Niger Delta, Nigeria. Chem. Biodiv., 3, pp. 568-577.
Osuji, L. C., and Nwoye, I., 2007. An appraisal o f the impact o f petroleum
hydrocarbons on soil fertility: the Owaza experience. African Journal o f
Agricultural Research, 2(7), pp. 318-324.
267
Palett, K. E., and Young, A. J., 1993. Carotenoids. In: Alscher, R. G., Hess, J. L. (Eds.),
Antioxidants in Higher Plants. CRC Press, Boca Raton, pp. 60-89.
Penuelas, J., Isla, R., Filella, I., and Araus, J. L., 1997. Visible and near-infrared
reflectance assessment o f salinity effects on barley. Crop Science, 37, pp. 198-
202.
Peterson, U., 1992. Reflectance factor dynamics o f boreal forest clear-cut communities
during early secondary succession. International Journal o f Remote Sensing , 13
(12), pp. 2247-2262.
Peterson, U., and Nilson, T., 1993. Successional reflectance trajectories in northern
temperate forests. International Journal o f Remote Sensing, 14(13), pp. 609-613.
Pezeshki, S. R. and Delaune, R. D., 1993. Effect o f crude oil on gas exchange functions
o f Juncus roemerianus and Spartina altemiflora. Water, Air, and Soil Pollution, 68,
pp. 461-468.
Pezeshki, S. R., Delaune, R. D., Nyman, J. A., Lessard, R. R., and Canevari, G. P.,
1995. Removing oil and saving oiled marsh grass using a shoreline cleaner
(Publication No. 4620). International Oil Spill Conference. American Petroleum
Institute, Washington, D. C., pp. 203-209.
Pezeshki, S. R., Hester, M. W., Lin, Q., and Nyman, J. A., 2000. The effects o f oil spill
and clean-up on dominant US Golf coast marsh macrophytes: a review.
Environmental Pollution, 108, pp. 129-139.
Pickerill, J. M., and Malthus, T. J., 1998. Leak detection from rural aqueducts using
airborne remote sensing techniques. International Journal o f Remote Sensing, 19,
pp. 2427-2433.
Pingali, P. L., 2001, Meeting world maize needs: technological opportunities and
priorities for the public sector, CIMMYT 1999-2000 world maize facts and trends.
268
Mexico, D.F.: CIMMYT, pp. 67.
Pysek, P. and Pysek, A., 1989. Changes in vegetation caused by experimental leakage
o f natural gas. Weed Research, 29, pp. 193-204.
Quinones-Aquilar, E. E., Ferra-Cerrato, R., Gavi, R. F., Fernandez, L., Rodriguez, V.
R., and Alarcom, A., 2003. Emergence and growth o f maize in a crude oil polluted
soil. Agrociencia, 37, pp. 585-594.
Racine, C. H., 1993. Long-term recovery o f vegetation on two experimental crude oil
spills in interior Alaska black spruce taiga. Canadian Journal o f Botany, 72, pp.
1171-1177.
Ranwell, D. S., 1968. Extent o f damage to coastal habitats due to the Torrey Canyon
incident. In: the biological effects o f oil pollution in littoral communities. Field
Studies Council, London, pp. 39-47.
Raun, W. R., Solie, J. B., Stone, M. L., Martin, K. L., Freeman, K. W., Mullen, R. W.,
Zhang, H., Schepers, J. S., and Johnson, G. V., 2005. Optical sensor-based
algorithm for crop nitrogen fertilization. Commun. Soil Plant Anal., 36, pp. 2759-
2781.
Ray, J. D., and Sinclair, T. R., 1998. The effect o f pot size on growth and transpiration
o f maize and soyabean during water deficit stress. Journal o f Experimental Botany
49 (325), pp. 1381-1386.
Read, J. J., Tarpley, L., McKinion, J. M., and Reddy, K. R., 2002. Narrow-waveband
reflectance ratios for remote estimation o f nitrogen status in cotton. Journal o f
Environmental Quality, 31, pp. 1442-1452.
Reid, N., Iwashita, A., Yamashita, Y., and Thompson, K., 1988. High resolution
imaging o f geobotanical anomalies associated with sub-surface hydrcarbons.
Proceedings o f the sixth thematic conference on remote sensing fo r exploration
269
geology, Huston, Texas, vol. (Ann Arbor: Environmental Research Institute of
Michigan), pp. 213-223.
Riedell, W. E., and Blackmer, T. M., 1999. Leaf reflectance spectra o f cereal aphid-
damaged wheat. Crop Science, 39, pp. 1835-1840.
Riano D., Valladares F., Condes S., and Chuvieco E., 2004. Estimation o f leaf area
index and covered ground from airborne laser scanner (Lidar) in two contrasting
forests. Agricultural and Forest Meteorology, 124, pp. 269-275.
Ripple, W. P., 1986. Spectral reflectance relationships to leaf water stress.
Photogrammetry and Engineering Remote Sensing, 52, pp. 1669-1675.
Rock, B. N., Hoshizaki, T., and Miller, J. R., 1988. Comparison of in situ and airborne
spectral measurements o f the blue shift associated with forest decline. Remote
Sensing o f Environment, 24, pp. 109-127.
Rosso, P. H., Pushnik, J. C., Lay, M., and Ustin S. L., 2005. Reflectance properties and
physiological responses o f Salicornia virginica to heavy metal and petroleum
contamination. Environmental Pollution, 137, pp. 241-252.
Rowell, M. J., 1977. The effects o f crude oil spills on soils. In the reclamation of
agricultural soils after oil spills (J. A. Good, ed.) pp. 1-33. Edmonton: Department
o f soil science, University o f Alberta.
Sari, M., Sonmez, N. K., Kurklu, A., 2005. Determination o f seasonal variations in
solar energy utilization by the leaves o f Washington navel orange trees (Citrus
Sinensis L. Osbeck). International Journal o f Remote Sensing, 26, pp. 3295-3307.
Satellite imaging corporation, http://www.satimagingcorp.com. Accessed on 4/09/2008.
Schepers, J. S., Blackmer, T. M., Wilhelm, W. W., and Resende, M., 1996.
Transmittance and reflectance measurements o f com leaves from plants with
different nitrogen and water supply. Journal o f plant physiology, 148, pp. 523-529.
270
Schollenberger, C. J., 1930. Effect o f leaking gas upon the soil. Soil Science, 29, pp.
260-266.
Schumacher, D., 1996. Hydrocarbon-induced alteration o f soils and sediments. In:
Schumacher D., Abrams, M.A. (eds.): Hydrocarbon migration and its near-surface
expression: AAPG Memoir 66, pp. 71-89.
Shellie-Dessert, K. C., and Bliss, F. A., 1991. Genetic improvement o f food quality
factors. In: common beans: Research for crop improvement, Schoonhoven, A. V.
and Voysest, O. (eds.). Redwood Press Limited Pubishers, Melksham, Wiltshire,
UK.
Shi, R., Zhuang, D., Li, S., and Niu, Z., 2005. Study on the extraction of plant
biochemical information from canopy reflectance spectra. Geoscience and Remote
Sensing Symposium, IGARSS Proceedings, IEEE International, 5, pp. 3132-3134.
Sims, D. A., and Gamon, J. A., 2003, Estimation o f vegetation water content and
photosynthetic tissue area from spectral reflectance: a comparison o f indices based
on liquid water and chlorophyll absorption features. Remote Sensing o f
Environment, 84, pp. 526-537.
Sims, D. A. and Gamon, J. A., 2002. Relationships between leaf pigment content and
spectral reflectance across a wide range o f species, leaf structures and
developmental stages. Remote Sensing o f Environment, 81, pp. 337-354.
Sinclair, T. R., Hoffer, R. M., and Schreiber, M. M., 1971. Reflectance and internal
structure o f leaves from several crops during a growing season. Agronomy Journal,
63, pp. 864-868.
Slaton, M. R., Hunt, E. R. Jr., and Smith, W. K., 2001. Estimating near-infrared leaf
reflectance from leaf structural characreristics. American Journal o f Botany, 88,
p p . 2 7 8 - 2 8 4 .
271
Smith, K. L., 2002. Remote sensing o f leaf responses to leaking underground natural
gas, Ph.D thesis, University o f Nottingham, pp. 4.
Smith, K. L., Colls J. J., and Steven M. D., 2005. A facility to investigate effects of
elevated soil gas concentration on vegetation. Water, A ir and Soil Pollution, 161,
pp. 75-96.
Smith, K. L., Steven, M. D., and Colls, J. J., 2005. Plant spectral responses to gas leaks
and other stresses. International Journal o f Remote Sensing, 26 (18), pp. 4067-
4081.
Smith, K. L., Steven, M. D. and Colls, J. J., 2004a. Spectral responses o f pot-grown
plants to displacement o f soil oxygen. International Journal o f Remote Sensing, 25
(20), pp. 4395-4410.
Smith, K. L., Steven, M. D., and Colls, J. J., 2004b. Use of hyperspectral derivative
ratios in the red-edge region to identify plant stress responses to gas leaks. Remote
Sensing o f Environment, 92, 204-217.
Smith, K. L., Steven, M. D., and Colls, J. J., 2000. Remote sensing o f vegetation stress
due to leaking underground pipelines. Aspects o f Applied Biology, 60, pp. 209-212.
Sobhan, M. I., 2007. Species discrimination from a hyperspectral perspective. Thesis
submitted for the degree o f doctor o f philosophy o f the Rector Magnificus of
Wageningen University, ITC, Enschede the Netherlands.
Sojka, R. E., Stolzy, L. H., and Kaufmann, M. R., 1975. Wheat growth related to
rhizoshere temperature and oxygen levels. Agronomy Journal, 67 (5), pp. 591-596.
Solberg, S., Nassset, E., Aurdal, L., Lange, H., Bollandsas, O. M., and Solberg, R.,
2005. Remote sensing o f foliar mass and chlorophyll as indicators o f forest health:
preliminary results from a project in Norway. In: Olsson El, ed. Proceedings o f
forestsat 2005, Boras, 31 May-3 June, pp. 105-109.
272
Sparrow, S. D., and Sparrow, E. B., 1988. Microbial biomass and activity in a subartic
soil ten years after crude oil spills. Journal o f Environmental Quality, 17, pp. 304-
309.
Steven, M. D., Werker, R., and Milnes, M., (1997). Assimilation o f satellite data in
crop monitoring and yield prediction. In: (eds.) G. Guyot, T. Phulpin, A. A.
Balkema, Physical measurements and signatures in remote Sensing.
Suprayogi, B. and Murray, F., 1999. A field experiment o f the physical and chemical
effects o f two oils on mangroves. Environmental and Experimental Botany, 42(3),
pp. 221-229.
Tarpley, L., Reddy, K. R., and Sassenrath-Cole, G. F., 2000. Reflectance indices with
precision and accuracy in predicting cotton leaf nitrogen concentration. Crop
Science. 40, pp. 1814-1819.
Terge, K., 1984. Effect o f oil pollution in the germination and vegetative growth o f five
species o f vascular plants. Oil and Petroleum Journal, 2, pp. 25-30.
The Royal Horticulture Society, 2009. http://www.rhs.org.uk/advice/profilesl001/
waterlogging.asp
Thomas, S. C., 2005. Increased leaf reflectance in tropical trees under elevated C02.
Global Change Biol., 11, pp. 197-202.
Thomas, J. R., and Gausman, H. W., 1977. Leaf reflectance vs. leaf chlorophyll and
carotenoids concentrations for eight crops. Agron. J., 69, pp. 799-802.
Thenkabail, P. S., Smith, R. B. and De Pauw, E., 2000. Hyperspectral vegetation
indices and their relationships with agricultural crop characteristics. Remote
Sensing o f Environment, 71, pp. 158-182.
Tilling, A. K., O'Leary, G. J., Ferwerda, J. G., Jones, S. D., Fitzgerald, G. J., Rodriguez,
D., and Belford, R., 2007. Remote sensing o f nitrogen and water stress in wheat.
273
Journal o f Field Crops Research, 104, pp.77-85.
Toogood, J. A., 1977. Effects o f oil spills on physical properties o f soils. In
Reclamation o f Agricultural Soils After Oil Spills. Part 1. Research. J. A. Toogood
(ed.). Alberta Institute o f Pedology Publication No. M-77-11. University o f
Alberta, Edmonton, Alberta: 108-115.).
Treitz, P. M., and Howarth, P. J., 1999. Hyperspectral remote sensing for estimating
biophysical parameters o f forest ecosystems. Progress in Physical Geography, 23,
3, pp. 359-390.
Trejo, C. L., and Davies, W. J., 1991. Drought-induced closure o f Phaseolus vulgaris
L. stomata precedes leaf water deficit and any increase in Xylem ABA
concentration. Journal o f Experimental Botany, 42 (245), pp. 1507-1515.
Trought, M. C. T., and Drew, M. C., 1980a. The development o f waterlogging damage
in wheat seedlings (Tritium Aestivum L.) I. Shoot and root growth in relation to
changes in the concentrations o f dissolved gases and solutes in the soil solution.
Plant and Soil, 54, pp. 77-94.
Trought, M. C. T., and Drew, M. C., 1980b. The development o f waterlogging damage
in wheat seedlings (Tritium Aestivum L.) II. Accumulation and redistribution of
nutrients by the shoot. Plant and Soil, 56, pp. 187-199.
Tucker, C. J., 1980. Remote sensing o f leaf water content in the near infrared. Remote
Sensing o f Environment, 10, pp. 23-32.
Tyczkowski, A., 1993. Usuwanie zanieczyszczen ropopochodnych z gleby i wod
gruntowych metodami fizykochemicznymi I biotechnologicznymi. Ekol. Techn., 3,
pp. 10-13.
Udo, E. J., and Fayemi, A. A., 1975. The effect o f oil pollution o f soil on germination,
growth and nutrient uptake of com. Journal o f Environmental Quality, 4, pp. 537-
274
540.
Ustin, S. L., Smith, M. O., Jacquemoud, S., Verstraete, M., and Govaerts, Y., 1999.
Geobotany: Vegetation mapping for earth sciences. In: Rencz A. (Ed.), Third
edition remote sensing for the earth sciences, vol. 3, John Wiley & Sons, pp. 189-
248.
Ustin, S. L., Smith, M. O., Jacquemoud, S., Zarco-Tejada, S., and Asner, G. P., 2004.
Remote sensing o f the environment: state o f the science and new directions. In:
Ustin, S. L. (Ed), third edition, Remote Sensing fo r the Earth Sciences, vol. 4 John
Wiley & Sons, pp. 679-730.
Vaiphasa, C., Ongsomwang, S., Vaiphasa, T. and Skidmore, A. K., 2005. Tropical
mangrove species discrimination using hyperspectral data: A laboratory study.
Estuarine, Coastal and Shelf Science, 65, pp. 371-379.
Van der Meer, F., Van Dijk, P., Van der W erff H., Yang H., 2002. Remote sensing and
petroleum seepage: a review and case study. Terra Nova, 14, 1-17. Blackwell
Science Ltd.
Van der Meijde, M., Van der W erff H., and Kooistra J., 2004. Detection of spectral
features o f anomalous vegetation from reflectance spectroscopy related to pipeline
leakages. In Proceedings o f SPIE , San Francisco, American Geophysical Union.
Vogelman, J. E., Rock, B. N. and Moss, D. M., 1993. Red-edge spectral measurements
from sugar maple leaves. International Journal o f Remote Sensing, 14 (8), pp.
1563-1575.
Volgelmann, T. C., 1993. Plant tissue optics. Annual review o f p lant physiology and
plant molecular biology, 44 (1), pp. 231-251.
Webb, J. W., 1994. Effects of oil on saltmarshes. Symp. Proc. Gulf o f Mexico and
Caribbean oil spill in coastal ecosystems: assessing effects, natural recovery and
275
progress in remediation research. US Department o f the interior, minerals
management service, OCS Study/MMS 95-0063, New Orleans, LA, pp. 55-61.
Wessman, C. A., 1990. Evaluation o f canopy biochemistry. In: Hobbs, R. J., Mooney,
H. A. (Eds.), Remote Sensing o f Biosphere Functioning. Springer-Verlag, New
York, pp. 135-156.
West J. D., Peak D., Peterson J. Q., and Mott K. A., 2005. Dynamics o f stomatal
patches for a single surface o f Xanthium strumarium L. leaves observed with
fluorescence and thermal images. Plant, Cell andEnvironmnent, 28, pp. 633-641.
Winter, K., Daniel, R. O., Batterlon, J. C., and Ballon, C., 1976. Water-soluble
components o f four oil chemical characteristics and effects on growth o f water
plants. Marine Biology, 36, pp. 269-276.
Woolley, J. T., 1971. Reflectance and transmittance o f light by leaves. Plant
Physiology, 47, pp. 656-662.
World Bank, 1994. Pakistan irrigation and national drainage: issues and options,
agriculture operations division, Afghanistan, Maldives, Pakistan and Sri Lanka
department South Asia Region, Report no. 11884-PAK, Washington, DC, USA.
Wulder, M., 1998. Optical remote sensing techniques for the assessment o f forest
inventory and biophysical parameters. Progress in Physical Geography, 22, pp.
. 449-476.
Wulder, M., Niemann, K. O., and Goodenough, D. G., 2000. Local maximum filtering
for the extraction of tree locations and basal area from high spatial resolution
imagery. Remote Sensing o f Environment, 73, pp. 103-114.
Wyszkowska, J., Kucharski, J., Jastrzqbska, E., and Hlasko, A., 2001. The biological
properties o f the soil as influenced by chromium contamination. Polish Journal o f
Environmental Studies, 10, pp. 37-42.
276
Wyszkowska, J., Kucharski, J., Waldowska, E. 2002. The influence o f diesel oil
contamination on soil enzymes activity. Rostl. Vyr., 48, pp. 58-62.
Wyszkowski, M. J., Wyszkowska, J., and Ziolkowska, A., 2004. Effect o f soil
contamination with diesel oil on yellow lupine yield and macroelements content.
Plant Soil Environment, 50 (5), pp. 218-226.
Xu, J. G., and Johnson, R. L., 1997. Nitrogen dynamics in soils with different
hydrocarbon contents planted to barley and field pea. Canadian Journal o f Soil
Science, 77, 458-463.
Yang, H., Zhang J., Van der Meer, F, and Kroonenberg, S. B., 2000. Imaging
spectrometry data correlated to hydrocarbon microseepage. International Journal
o f Remote Sensing, 21, pp. 197-120.
Yang, H., Zhang J., Van der Meer, F., and Kroonenberg§ S. B., 1999. Spectral
characteristics o f wheat associated with hydrocarbon microseepages. International
Journal o f Remote Sensing, 20 (4), pp. 807-813.
Yoder, B. J., and Pettigrew-Crosby, R. E., 1995. Predicting nitrogen and chlorophyll
content and concentrations from reflectance spectra (400-2500 nm) at leaf and
canopy scales. Remote Sensing o f Environment, 53(3), pp. 199-211.
Yo-Essien, L. P. E., 2008. Oil spill management in Nigeria: challenges o f pipeline
vandalism in the Niger Delta region o f Nigeria, www.ipec.utulsa.edu/conf2008.
Zhao, D., Reddy, K. R., Kakani, V. G., Read, J. J., and Koti, S., 2005. Selection of
optimum reflectance ratios for estimating leaf nitrogen and chlorophyll
concentrations o f field- grown cotton. Agronomy Journal, 97, pp. 89-98.
Zang, J. and Zang, X., 1994. Can early wilting o f old leaves account for much o f the
ABA accumulation in flooded pea plants? Journal o f Experimental Botany, 45, pp.
1335-1342.
277
Zarco-Tejada, P. J., Pushnik, J. C., Dobrowski, S., and Ustin, S. L., 2003. Steady-state
chlorophyll a fluorescence detection from canopy derivative reflectance and
double-peak red-edge effects. Remote Sensing o f Environment, 84(2), pp. 283-294.
Zarco-Tejada, P. J., Rueda, C. A., and Ustin, S. L., 2003. Water content estimation in
vegetation with MODIS reflectance data and model inversion methods. Remote
Sensing o f Environment 85(1), pp. 109-124.
Zhang, J., and Davies, W. J., 1987. Increased synthesis o f ABA in partially dehydrated
root tips and ABA transport from roots to leaves. Journal o f Environmental
Botany, 38, pp. 2015-2023.
Zhang, J., and Davies, W. J., 1989. Abscisic acid produced in dehydrating roots may
enable the plant to measure the water status of the soil. Plant, Cell and
Environment, 12, pp. 73-81.
Zhang, J., and Davies, W. J., 1990a. Changes in the concentration o f ABA in xylem sap
as a function o f changing soil water status can account for changes in leaf
conductance and growth. Plant, Cell and Environment, 13, pp. 277-285.
Zhang, J., and Davies, W. J., 1990b. Does ABA in the xylem control the rate o f leaf
growth in soil-dried maize and sunflower plants? Journal o f Experimental Botany,
41, pp. 1125-1132.
Zhou, W., and Lin, X., 1995. Effects o f waterlogging at different growth stages on
physiological characteristics and seed yield o f winter rape (Brassica napus L.).
Field Crop Research, 44, pp. 103-110.
Zhao, D., Reddy, K. R., Kakani, V. G., Read, J. J., and Carter, G. A., 2003. Com (Zea
mays L.) growth, leaf pigment concentration, photosynthesis and leaf hyperspectral
reflectance properties as affected by nitrogen supply. Plant Soil, 257, pp. 205-217.
Zhao, D., Reddy, K. R., Kakani, V. G., Read, J. J., and Koti, S., 2005. Selection of
278
optimum reflectance ratios for estimating leaf nitrogen and chlorophyll
concentrations o f field-grown cotton. Agronomy Journal, 97, pp. 89-98.
Zwiggelaar, R., 1998. A review o f the spectral properties o f plants and their potential
use for crop/weed discrimination in row-crops. Crop Protection , 17 (3), pp. 189-
206.
279
Related Documents