HYPERSPECTRAL AND GEOCHEMICAL SIGNATURES ON CORUNDUM BEARING ROCKS IN PART OF SOUTHERN KARNATAKA, INDIA. By Mr. MARUTHI N.E Under the Guidance of Prof. H.T. BASAVARAJAPPA DEPARTMENT OF STUDIES IN EARTH SCIENCE, CENTRE FOR ADVANCED STUDIES IN PRECAMBRIAN GEOLOGY MANASAGANGOTHRI, MYSURU – 570006 May 2019 THESIS SUBMITTED TO THE UNIVERSITY OF MYSORE FOR THE AWARD OF THE DEGREE OF DOCTOR OF PHILOSOPHY IN EARTH SCIENCE

Welcome message from author
This document is posted to help you gain knowledge. Please leave a comment to let me know what you think about it! Share it to your friends and learn new things together.
Transcript

HYPERSPECTRAL AND GEOCHEMICAL
SIGNATURES ON CORUNDUM BEARING ROCKS
IN PART OF SOUTHERN KARNATAKA, INDIA.
By
Mr. MARUTHI N.E
Under the Guidance of
Prof. H.T. BASAVARAJAPPA
DEPARTMENT OF STUDIES IN EARTH SCIENCE,
CENTRE FOR ADVANCED STUDIES IN PRECAMBRIAN GEOLOGY
MANASAGANGOTHRI, MYSURU – 570006
May 2019
THESIS SUBMITTED TO
THE UNIVERSITY OF MYSORE FOR THE AWARD OF
THE DEGREE OF
DOCTOR OF PHILOSOPHY
IN
EARTH SCIENCE

DECLARATION
I do hereby declare that this Research work entitled
“HYPERSPECTRAL AND GEOCHEMICAL SIGNATURES ON
CORUNDUM BEARING ROCKS IN PART OF SOUTHERN
KARNATAKA, INDIA” is completely carried out by me and submitted to
the University of Mysore, Mysuru for the award of the Degree of DOCTOR
OF PHILOSOPHY in EARTH SCIENCE. This is the original research work
carried out in the Department of Studies in Earth Science, University of
Mysore, Manasagangothri, Mysuru, under the research guidance of
Prof. H.T. Basavarajappa, Earth Science. I further declare that the present
work has not been submitted for the award of any degree in this University or
any other University.
Date:
Place:
MARUTHI N.E
(Research Candidate)

# No.77, 25t h
Cross, 3r d
arena, ‘B’ Block Vijayanagara, MYSORE -17
DEPARTMENT OF STUDIES IN EARTH SCIENCE CENTRE FOR ADVANCED STUDIES IN PRECAMBRIAN GEOLOGY
UNIVERSITY OF MYSORE Manasagangothri, Mysore-570006, INDIA
Ph.No: (O) 0821 - 2419718/2419724 (Res) 0821-2412740, Mobile-9448800520
Dr. H.T. BASAVARAJAPPA, M.Sc, Ph.D, FMSI, FISG, FISCA, FIAEME Professor of Earth Science, Former Chairman & Head, Co-ordinator: Centre for Advanced Studies (CAS) Chairman: ISG-Mysore Chapter President: Geology Alumni Association, MGM Treasure: Mineralogical Society of India Principal Investigator: UGC-MRP Co-PI: ISRO/NRSC-MRP
MEMBER OF THE ACADEMIC COUNCIL, UNIVERSITY OF MYSORE
CERTIFICATE
I do hereby declare that the thesis entitled " HYPERSPECTRAL AND
GEOCHEMICAL SIGNATURES ON CORUNDUM BEARING ROCKS
IN PART OF SOUTHERN KARNATAKA, INDIA" submitted by
Mr. MARUTHI N.E, for the award of the Doctor of Philosophy in Earth
Science, Department of Studies in Earth Science, Centre for Advanced Studies
in Precambrian Geology, University of Mysore, Manasagangothri, Mysuru -
570 006 was carried out in this Department under my Guidance and Supervision
after fulfilling the basic requirements specified by the University of Mysore.
Place: Mysuru
Date:
RESEARCH SUPERVISOR

ACKNOWLEDGEMENTS
I get more pleasure to recall the inspiration, encouragement, moral support and
overwhelming help rendered by teachers, friends, near and dear ones for the completion
of this research and thesis work.
I express my sincere and heartful gratitude to Prof. H.T. BASAVARAJAPPA,
for his valuable guidance, help and encouragement that enabled me to sustain my efforts.
Out of my heavy debt, my sincere thanks and gratitude to
Prof. M.S. SETHUMADHAV, Chairman, Department of Studies in Earth Science,
Centre for Advanced Studies in Precambrian Geology, University of Mysore, Mysuru –
570 006.
I would like to thank Board of Studies Chairman Prof. P. MADESH and
members of the doctoral committee Prof. K.G. ASHAMANJARI and Prof. K.N.
PRAKASH NARSIMHA for their advice and valuable technical suggestion during the
research work.
I proudly announce my pleasure, to tender my thanks to
Prof. A. BALASUBRAMANIAN; Prof. D. NAGARAJU and Prof. B.V. SURESH
KUMAR, Department of Studies in Earth Science, Centre for Advanced Studies in
Precambrian Geology, University of Mysore, Manasagangothri, Mysuru – 570 006 and
all the Non-teaching staffs for their timely help and source of inspiration during my
research work.
My grateful thanks to The Deputy Secretary, NFST - UGC, New Delhi for
providing the financial support with successful completion of the grades Junior & Senior
Research Fellowships and my sincere thanks to the Deputy Registrar, SC/ST Special cell,
University of Mysore, Mysuru for their kind service.
With great pleasure, I submit my sincere thanks to Geological Survey of India,
Bengaluru; Geological Survey of India Training Institute, Hyderabad; Chitradurga;
NRSC-ISRO, Hyderabad and United State Geological Survey (USGS) website.

My expressions in sincerity, gratitude and special thanks from the bottom of my
heart to my research colleagues, Dr. Manjunatha M.C; Dr. Jeevan L;
Mr. Harshavardhana A.S; Mr. Siddaraju M.S; and Mr. Reza Ravanshad and to my
Research seniors for their cooperation and encouragement in the department.
I indepthly thank Dr. M. Sundararajan, Faculty; Mr. R.G. Rejith; Research
Scholar Materials Science & Technology Division, National Institute for Interdisplinary
Science and Technology (NIIST) Thiruvananthapuram, Kerala, India. for providing
Geochemical analysis data of collected Samples from Southern Karnata and valuable
discussions and suggestions.
In this auspicious moment, my deep appreciation, commemoration and thankful
remembrance to my ancestors.
I am particularly indebted to my beloved Father Mr. Eranna and My mother Smt.
Varalakshmamma, my Younger Sister Smt. Shruthi N.E my brother-in-law
Mr. C. Papanna; and my Niece, Indu Shree and Sindu Shree and all the family
members giving me their constructive encouragement and support for liberty to educate
and initiate to sustain throughout this research work.
MARUTHI N.E

ABSTRACT
Corundum-bearing rocks are associated with metamorphosed mafic rocks in a
metamorphic terrain mainly of metasedimentary rocks including gneiss, schist,
amphibolite, and minor iron formation. Un oriented corundum crystals surrounded by
alkali feldspar halos formed by replacement of the gneiss with the addition of Al and K in
Granulite facies metamorphism of an aluminous sediment produced biotite syenite
gneiss. Corundum also occurs in cordierite sillimanite schist, gneisses round closepet
granite, contact of ultramafics Pegmatite's, Aplite veins disseminated grains in
anorthosite kyanite/ staurolite schist, high grade pelitic schist gravel beds and stream
sediments as a placer. It’s generally associated with spinel, garnet, kyanite, and high-
calcium feldspars in plutonic pegmatite and metamorphic rocks. Some of its varieties are
oriental amethyst, oriental emerald, oriental topaz, sapphire, ruby (gemstones) and emery
(massive). Karnataka state, Dharwar Craton is composed of an active and dynamic
geological setting with prospects of many different kinds of economic mineral deposits,
including shear zones bearing valuable minerals and gemstones in Precambrian basement
rocks. The study area Southern Karnataka covers 20 districts, Field observation using
ground truth check , Geochemical analysis data and Hyperspectral data demarcated the
Corundum bearing horizons in the Study area. Hyperspectral (350-2500nm) is a special
type of multispectral imaging scanner which provides a high spectral resolution data to
bring out diagnostic features on lithological contacts for better discrimination and rapid
demarcated the Corundum bearing rocks across Southern Karnataka. The hyperspectral
data on lithological contacts and themes like geomorphology, geology, structure, soil,
rocks and minerals will be studied using high resolution satellite data such as Landsat 8
is a high multispectral imaging radiometer consists of three separate subsystems, Visible
near InfraRed (VNIR-15m), Short Wave InfraRed (SWIR-30m) and Thermal InfraRed
(TIR-90m) that have become potential tool for mapping of precious gemstones in
between lithological contacts and mineralized zones.
The present study aims to integrate the advent hi-tech tools of hyperspectral
Remote Sensing (RS), Geochemical analysis data, EDS analysis data and Geographical
Information System (GIS) in demarcating, exploration, scientific surveying of corundum
bearing litho units in Precambrian basement rocks of Southern Karnataka.

TABLE OF CONTENTS
Page No.
CHAPTER - I
1.1. INTRODUCTION 1
1.2. NOMENCLATURE OF CORUNDUM 3
1.3. TYPES OF CORUNDUM 6
1.4. PHYSICAL PROPERTIES OF CORUNDUM 7
1.5. OPTICAL PROPERTIES OF CORUNDUM 8
1.6. CHEMICAL COMPOSITION OF CORUNDUM 9
1.7. INTERNAL STRUCTURE OF CORUNDUM 9
1.8. GEOLOGICAL OCCURRENCE OF CORUNDUM 12
1.9. HYPERSPECTRAL STUDY 15
1.10. REMOTE SENSING AND GIS TECHNIQUES 16
1.11. PETRO – CHEMICAL CHARECTISTICS 23
1.12. OBJECTIVES 24
1.13. METHODOLOGY 24
1.14. GEOGRAPHICAL LOCATION OF THE STUDY AREA 25
1.15. LITERATURE REVIEW 26
1.16. OUTLINE OF THE THESIS 35
CHAPTER – II
2.1. GEOLOGY OF INDIA 38
2.2. GEOLOGY OF SOUTHERN INDIA 42
2.3. DHARWAR CRATON 46
2.4. GEOLOGY OF KARNATAKA 48
2.5. GEOLOGY OF THE STUDY AREA 53
2.6. ORIGIN OF CORUNDUM DEPOSITS 55
2.7. CORUNDUM LOCATIONS OF THE STUDY AREA 66

CHAPTER – III
3.1. FIELD GEOLOGY AND PETROGRAPHY 72
3.2. OBSERVATION AND INFERENCE 72
3.3. FIELD EQUIPMENTS 72
3.4. FIELD INVISTIGATION 75
3.5. CORUNDUM BEARING LITHO-UNITS OF STUDY AREA 76
3.6. PETROGRAPHY STUDY
87
CHAPTER – IV
4.1. GEOCHEMISTRY 104
4.2. ANALYTICAL METHOD 105
4.3. WHOLE ROCK GEOCHEMICAL ANALYSIS OF CORUNDUM
BEARING ROCKS AROUND CHITRADURGA DISTRICT 106
4.4. WHOLE ROCK GEOCHEMICAL ANALYSIS OF CORUNDUM
BEARING ROCKS AROUND TUMKUR DISTRICT 109
4.5. WHOLE ROCK GEOCHEMICAL ANALYSIS OF CORUNDUM
BEARING ROCKS AROUND CHIKBALLAPURA DISTRICT 112
4.6. WHOLE ROCK GEOCHEMICAL ANALYSIS OF CORUNDUM
BEARING ROCKS AROUND HASSAN DISTRICT 114
4.7. WHOLE ROCK GEOCHEMICAL ANALYSIS OF CORUNDUM
BEARING ROCKS AROUND CHIKMAGALUR DISTRICT 116
4.8. WHOLE ROCK GEOCHEMICAL ANALYSIS OF CORUNDUM
BEARING ROCKS AROUND DAKSHINA KANNADA DISTRICT 118
4.9. WHOLE ROCK GEOCHEMICAL ANALYSIS OF CORUNDUM
BEARING ROCKS AROUND MYSURU DISTRICT 120
4.10. WHOLE ROCK GEOCHEMICAL ANALYSIS OF CORUNDUM
BEARING ROCKS AROUND MANDYA DISTRICT 123
4.11. WHOLE ROCK GEOCHEMICAL ANALYSIS OF CORUNDUM
BEARING ROCKS AROUND RAMNAGARA DISTRICT 125

4.12. WHOLE ROCK GEOCHEMICAL ANALYSIS OF CORUNDUM
BEARING ROCKS AROUND CHAMARAJANAGARA DISTRICT 127
4.13. WHOLE ROCK GEOCHEMICAL ANALYSIS OF CORUNDUM
BEARING ROCKS AROUND KOLARA DISTRICT 129
CHAPTER – V
5.1. HYPERSPECTRAL REMOTESENSING 131
5.2. SPECTROSCOPY 137
5.3. SPECTRORADIOMETER 145
5.4. HYPERSPECTRAL SIGNATURE STUDY ON ROCK SAMPLES
AROUND CHITRADURGA DISTRICT. 151
5.5. HYPERSPECTRAL SIGNATURE STUDY ON ROCK SAMPLES
AROUND TUMKUR DISTRICT 154
5.6. HYPERSPECTRAL SIGNATURE STUDY ON ROCK SAMPLES
AROUND CHIKBALLAPURA DISTRICT 156
5.7. HYPERSPECTRAL SIGNATURE STUDY ON ROCK SAMPLES
AROUND HASSAN DISTRICT 158
5.8. HYPERSPECTRAL SIGNATURE STUDY ON ROCK SAMPLES
AROUND CHIKMAGALUR DISTRICT 160
5.9. HYPERSPECTRAL SIGNATURE STUDY ON ROCK SAMPLES
AROUND DAKSHINA KANNADA DISTRICT 162
5.10. HYPERSPECTRAL SIGNATURE STUDY ON ROCK SAMPLES
AROUND MYSURU DISTRICT. 164
5.11. HYPERSPECTRAL SIGNATURE STUDY ON ROCK SAMPLES
AROUND MANDYA DISTRICT. 166
5.12. HYPERSPECTRAL SIGNATURE STUDY ON ROCK SAMPLES
AROUND RAMANAGARA DISTRICT. 168
5.13. HYPERSPECTRAL SIGNATURE STUDY ON ROCK SAMPLES
AROUND CHAMARAJANAGARA DISTRICT. 170
5.14. HYPERSPECTRAL SIGNATURE STUDY ON ROCK SAMPLES
AROUND KOLARA DISTRICT. 172

CHAPTER – VI
6.1. RESULT AND DISCUSSION 174
6.2. INTIGRATION OF GEOCHEMISTRY AND REFLECTANCE SPECTRA 175
6.3. ENERGY – DISPERSIVE X-RAY SPECCTROSCOPY (EDS) 180
6.4. EDS ANALYSIS AND ELEMENTAL MAP OF CORUNDUM BEARING
ROCK AROUND CHITRADURGA DISTRICT 181
6.5. EDS ANALYSIS AND ELEMENTAL MAP OF CORUNDUM BEARING
ROCK AROUND TUMKUR DISTRICT 184
6.6. EDS ANALYSIS AND ELEMENTAL MAP OF CORUNDUM BEARING
ROCK AROUND MYSURU DISTRICT 186
6.7. EDS ANALYSIS AND ELEMENTAL MAP OF CORUNDUM BEARING
ROCK AROUND DAKSHINA KANNADA DISTRICT 188
CHAPTER – VII
7.1. SUMMARY AND CONCLUSION 191
BIBLOGRAPHY 195

LIST OF FIGURES
Page No
Fig.1.1. Polyhedral model of Corundum 10
Fig.1.2. Crystalline forms of Corundum mineral 11
Fig.1.3. Remote Sensing Process 17
Fig.1.4. Electromagnetic Spectrum Wavelength Regions 17
Fig.1.5. Electromagnetic radiation 19
Fig.1.6. Wavelength and frequency 19
Fig.1.7. Electromagnetic radiation interactions with different surface features 20
Fig.1.8. Location Map of the Study area 26
Fig.2.1. Geological map of India. 41
Fig.2.2. Geological map of Southern India. 46
Fig.2.3. Geological map of Dharwar Craton 47
Fig.2.4. Geological map of Karnataka 49
Fig.2.5. Geological map of the Study area. 54
Fig.2.6. Corundum Deposition and Process 56
Fig. 2.7. Classification of Primary Corundum Magmatic Deposits 57
Fig. 2.8. Classification scheme for Gem Corundum Deposits 58
Fig. 2.9. Classification of Primary Corundum Metamorphic Deposits 63
Fig.2.10. Corundum bearing litho-unit locations of the study area 66
Fig.3.1. GPS Garmin-72 73
Fig.3.2. Brunton Compass 74
Fig.3.3. Photographs of Corundum Ullarthi area and Corundum bearing Amphibolite
schist Kyadigunte around Chitradurga district, Sl no 1 – 2.a. 77
Fig.3.4. Photographs of Corundum samples around Tumkur District Sl no 3 – 15. 78
Fig.3.5. Photographs of Corundum samples around Chikballapur
District, Sl no 16 – 21.a. 79
Fig.3.6. Photographs of (a) Corundum (b) Corundum bearing Amphibolite schist
(c) Corundum bearing Chlorite schist (d) Gneiss around Hassan
District, Sl no 22 –27. 80
Fig.3.7. Photographs of Corundum and Corundum bearing Amphibolites
Schist around Chikmagalur District, Sl no 28 - 32. 81

Fig.3.8. Photographs of Corundum and Corundum bearing Amphibolites
Schist around Dakshina Kannada District, Sl no 33 – 35. 82
Fig.3.9. Photographs of (a) Corundum bearing Ruby (b) Actinolite Schist
(c) Pyroxene Granulate (d Amphibolite Schist collected samples
around Mysuru district, Sl no 36 – 51. 83
Fig.3.10. Photographs of Corundum and Corundum bearing Amphibolites
Schist around Mandya District, Sl no 52 – 64. 84
Fig.3.11. Photographs of Corundum and Corundum bearing Amphibolites
Schist around Ramanagara District, Sl no 65 – 70. 85
Fig.3.12. Photographs of (a) Corundum Garnet bearing mylonite
(b) Fe, Garnet rich Corundum rock and (c) Corundum
bearing Pelitic rock around Chamarajanagara districts, Sl no 71 – 71.a. 86
Fig.3.13. Photographs of Corundum and Corundum bearing Amphibolites
Schist around Kolara district, Sl no 72 – 73.a. 87
Fig.3.14. Research Microscope 87
Fig.3.15. Photomicrographs of a and b Corundum samples (xpl and ppl)
C and d Corundum Bearing Amphibolites Schist around Chitradurga
district, Sl no 1 – 2.a. 88
Fig.3.16. Photomicrographs of a and b Corundum samples (xpl and ppl)
C and d Corundum Bearing Closepet granite around Tumakur
District, Sl no 3 – 15. 90
Fig.3.17. Photomicrographs of corundum samples (XPL and PPL) around
Chikballapura district, Sl no 16 – 21.a. 91
Fig.3.18. Photomicrographs of a and b Corundum samples (xpl and ppl) c and d
Corundum bearing Chlorite schist, e and f Corundum bearing
Hornblende Schist and g and h Amphibolite schist with sphene
around Hassan district, Sl no 22 – 27. 93
Fig.3.19. Photomicrographs of a and b Corundum samples (xpl and ppl)
c and d Corundum bearing Amphibolite schist around Chikmagalur
district, Sl no 28 – 32.
94
Fig.3.20. Photomicrographs of a and b Corundum samples (xpl and ppl)
c and d Corundum bearing Amphibolite schist around Dakshina

Kannada district, Sl no 33 – 35. 95
Fig.3.21. Photomicrographs of a and b Corundum samples (xpl and ppl)
c and d Corundum bearing Amphibolite schist, e and f Corundum
Bearing Pyroxene Granulate and g and h Corundum with Staurolite
Around Mysuru district, Sl no 36 – 51. 97
Fig.3.22. Photomicrographs of a and b Corundum samples (xpl and ppl)
c and d Corundum bearing Amphibolite schist around
Mandya district, Sl no 52 – 64. 99
Fig.3.23. Photomicrographs of a and b Corundum samples (xpl and ppl) c and d
Corundum bearing Amphibolite schist around Ramanagara
district, Sl no 65 – 70. 100
Fig.3.24 Photomicrographs of a and b Corundum bearing Pelitic rock (xpl and ppl)
c and d Fe Garnet rich Corundum rock and e and f Corundum Garnet
Bearing Mylonite around Chamarajanagara district, Sl no 71 – 71.a. 101
Fig.3.25. Photomicrographs of a and b Corundum samples (xpl and ppl) b and c
Corundum Bearing Amphibolite schist around Kolara districts,
Sl no 72 – 73.a. 103
Fig.4.1. XRF Instrument CSIR lab Thiruvananthapuram Kerala 105
Fig.4.2. (a) and (b) Ternary diagrams showing rock involved in the
Corundum formation at Chitradurga District 108
Fig.4.3. (a), (b), (c) and (d) Bulk rock geochemical analysis and binary
plots of Chitradurga district samples. 108
Fig.4.4. (a) and (b) Ternary diagrams showing rock involved in the
Corundum formation at Tumkur District 111
Fig.4.5. (a), (b), (c) and (d) Bulk rock geochemical analysis and binary
plots of Tumkur district samples. 111
Fig.4.6. (a) and (b) Ternary diagrams showing rock involved in the
Corundum formation at Chikballapura District 113
Fig.4.7. (a), (b), (c) and (d) Bulk rock geochemical analysis and
binary plots of Chikballapura district samples. 113
Fig.4.8. (a) and (b) Ternary diagrams showing rock involved in the
Corundum formation at Hassan District 115

Fig.4.9. (a), (b), (c) and (d) Bulk rock geochemical analysis and binary
plots of Hassan district samples 115
Fig.4.10. (a) and (b) Ternary diagrams showing rock involved in the
Corundum formation at Chikmagalur District. 117
Fig.4.11. (a), (b), (c) and (d) Bulk rock geochemical analysis and binary
plots of Chikmagalur district samples. 117
Fig.4.12. (a) and (b) Ternary diagrams showing rock involved in the
Corundum formation at Dakshina Kannada District. 119
Fig.4.13. (a), (b), (c) and (d) Bulk rock geochemical analysis and binary
plots of Dakshina Kannada district samples. 119
Fig.4.14. (a) and (b) Ternary diagrams showing rock involved in the
Corundum formation at Mysuru District. 122
Fig.4.15. (a), (b), (c) and (d) Bulk rock geochemical analysis and binary
plots of Mysuru district samples. 122
Fig.4.16. (a) and (b) Ternary diagrams showing rock involved in the
Corundum formation at Mandya District 124
Fig.4.17. (a), (b), (c) and (d) Bulk rock geochemical analysis and binary
plots of Mandya district samples 124
Fig.4.18. (a) and (b) Ternary diagrams showing rock involved in the
Corundum formation at Ramanagara District 126
Fig.4.19. (a), (b), (c) and (d) Bulk rock geochemical analysis and binary
plots of Ramanagara district samples 126
Fig.4.20. (a) and (b) Ternary diagrams showing rock involved in the
Corundum formation at Chamarajanagara District 128
Fig.4.21. (a) and (b) Ternary diagrams showing rock involved in the
Corundum formation at Kolar District 130
Fig.4.22. (a), (b), (c) and (d) Bulk rock geochemical analysis and binary
plots of Kolara district samples. 130
Fig.5.1. Relationship among Radiometric, Spectrometric, and Imaging Techniques 132
Fig.5.2. Hyperspectral instrument laboratory setup, Department of Earth Science 147
Fig.5.3. Landsat-8, Satellite image showing sample locations of the Study area 149
Fig.5.4. SPOT-7 Satellite image shows sample locations of the Study area 150
Fig.5.5. Lab Spectral signatures of Corundum bearing rocks. 153

Fig.5.6. EZ-ID Match analysis of Corundum 153
Fig.5.7. EZ-ID Match analysis of Amphibolite schist 153
Fig.5.8. Lab Spectral signatures of Corundum bearing rocks 155
Fig.5.9. Fig.5.6. EZ-ID Match analysis of Corundum 155
Fig.5.10. EZ-ID Match analysis of Closepet granite 155
Fig.5.11. Lab Spectral signatures of Corundum bearing rocks 157
Fig.5.12. Fig.5.6. EZ-ID Match analysis of Corundum 157
Fig.5.13. EZ-ID Match analysis of Closepet granite 157
Fig.5.14. Lab Spectral signatures of Corundum bearing rocks 159
Fig.5.15. Fig.5.6. EZ-ID Match analysis of Corundum 159
Fig.5.16. EZ-ID Match analysis of Amphibolite schist 159
Fig.5.17. Lab Spectral signatures of Corundum bearing rocks 161
Fig.5.18. Fig.5.6. EZ-ID Match analysis of Corundum 161
Fig.5.19. EZ-ID Match analysis of Amphibolite schist 161
Fig.5.20. Lab Spectral signatures of Corundum bearing rocks 163
Fig.5.21. Fig.5.6. EZ-ID Match analysis of Corundum 163
Fig.5.22. EZ-ID Match analysis of Amphibolite schist 163
Fig.5.23. Lab Spectral signatures of Corundum bearing rocks 165
Fig.5.24. Fig.5.6. EZ-ID Match analysis of Corundum 165
Fig.5.25. EZ-ID Match analysis of Amphibolite schist 165
Fig.5.26. Lab Spectral signatures of Corundum bearing rocks 167
Fig.5.27. Fig.5.6. EZ-ID Match analysis of Corundum 167
Fig.5.28. EZ-ID Match analysis of Amphibolite schist 167
Fig.5.29. Lab Spectral signatures of Corundum bearing rocks 169
Fig.5.30. Fig.5.6. EZ-ID Match analysis of Corundum 169
Fig.5.31. EZ-ID Match analysis of Amphibolite schist 169
Fig.5.32. Lab Spectral signatures of Corundum bearing rocks 171
Fig.5.33. Fig.5.6. EZ-ID Match analysis of Corundum bearing pelitic rock 171
Fig.5.34. EZ-ID Match analysis of Fe garnet rich corundum 171
Fig.5.35. Lab Spectral signatures of Corundum bearing rocks 173
Fig.5.36. Fig.5.6. EZ-ID Match analysis of Corundum 173
Fig.5.37. EZ-ID Match analysis of Amphibolite schist 173
Fig.6.1. EDS instrument UOM 180

Fig.6.2. EDS spectrum Corundum rock of Chitradurga region 182
Fig.6.3. Elemental map of Corundum sample, (a) polished surface
EDS image, (b) polished sample (c) field sample of corundum 183
Fig.6.4. EDS spectrum Corundum rock of Tumkur region 184
Fig.6.5. Elemental map of Corundum sample, (a) polished surface
EDS image, (b) field sample of corundum (c) polished sample 185
Fig.6.6. EDS spectrum Corundum rock of Mysuru region 186
Fig.6.7. Elemental map of Corundum sample, (a) polished surface
EDS image, (b) Polished sample of corundum 187
Fig.6.8. EDS spectrum Corundum rock of Dakshina Kannada region 188
Fig.6.9. Elemental map of Corundum sample, (a) polished surface
EDS image, (b) Polished sample of corundum bearing rock 189

LIST OF TABLES
Page No.
Table.1. Specific Electromagnetic Radiations Wavelength Range (nm) and uses 22
Table.2.1. Generalized Geological succession of the study area 52
Table.2.2. Samples collected and its GPS Location 67
Table.3.1. Corundum deposit tract of the study area 76
Table: 4.1. Bulk-rock geochemical Analysis Data of Corundum bearing
samples around Chitradurga area. 107
Table: 4.2. Bulk-rock geochemical analysis data of Corundum bearing
samples around Tumakur area. 110
Table: 4.3. Bulk-rock geochemical data of Corundum bearing
samples around Chikballapura area. 112
Table: 4.4. Bulk-rock geochemical analysis data of Corundum bearing
samples around Hassan area 114
Table: 4.5. Bulk-rock geochemical data of Corundum bearing
samples around Chikmagalur area 116
Table: 4.6. Bulk-rock geochemical analysis data of Corundum bearing
samples around Dakshina Kannada area 118
Table: 4.7. Bulk-rock geochemical analysis data of Corundum bearing
samples around Mysuru area. 120
Table: 4.8. Bulk-rock geochemical analysis data of Corundum bearing
samples around Mandya area 123
Table: 4.9. Bulk-rock geochemical data of Corundum bearing
samples around Ramanagara area 127
Table:4.10. Bulk-rock geochemical analysis data of Corundum
bearing samples around Chamarajanagara area 128
Table:4.11. Bulk-rock geochemical data of Corundum bearing samples
from Kolara area 129
Table.5.1. Airborne Hyperspectral Sensors (AHS) 135
Table.5.2. Spaceborne Hyperspectral Sensors (SHS) 136
Table.5.3. Spectral features of different Rock types with
characteristic absorption signature 143

Table. 5.4. Absorption peaks of various cat ions and anions in
different regions of EMS 144
Table.5.5. Specifications of Spectral Evolution RS-3500 148
Table.6.1. Integration of Geochemical data and Spectral Analysis of
Corundum samples of the Study area 178
Table.6.2. Integration of Geochemical data and spectral analysis of
Corundum bearing litho units samples of the Study area 179
Table.6.3. Phase fractions (wt%) Corundum composition measured by EDS 182
Table.6.4. Phase fractions (wt%) Corundum composition measured by EDS 184
Table.6.5. Phase fractions (wt%) Corundum composition measured by EDS 186
Table.6.6. Phase fractions (wt %) Corundum composition measured by EDS 188

1
CHAPTER-I
1.1. INTRODUCTION
Precambrian basement rocks of Karnataka Dharwars are composed of the active
and dynamic geological settings with enormous economic mineral deposits and variety
of gemstones. These gemstones were noticed all along the lithological contacts of Green
Schist Belts, younger granites, Granodiorites and granitoids of DharwarCraton. Minerals
are important natural, finite and non-renewable resources essential for mankind.
Minerals are the treasures of the state, therefore systematic, scientific and sustainable
harnessing of minerals wealth should be the cornerstone of development objectives of
the state. The utilization of these minerals has to be guided by long term goals and
perspectives. All these goals and perspectives are dynamic and responsive to the
economics in scenario, the Karnataka mineral policy has to evolve. (Karnataka mineral
policy 2008) Gems can be defined as generally a fine-quality or superlative, rarity and
durability specimen usable in gem industry to make jewels or ornaments. The chemical
makeup of such specimens can be of inorganic or organic origin or a fashioned stone
which possesses quality, beauty and durability for in jewelry, such as Diamond, Pearl,
Ruby, etc. (Dictionary of Gemology 2004). Gem deposits including a gem bearing
gravel or placer containing amounts of gem minerals that were formed from preexisting
rocks found in river or lake beds associated with other minerals such as garnets,
sapphires, rubies, etc. There is also host rocks which should be identified and mapped
therefore there is a need for inclusive and accurate scientific mapping using new
technologies to meet the goals
Corundum first named corinvindum in 1725 by John Woodward and derived from
the Sanskrit, Kuruvinda (Ruby). Richard Kirwan used the current spelling corundum in
1794. Known by many names in ancient time‘s adamant, sapphire, ruby, hyacinthos,
asteria. Corundum is a crystalline form of aluminium oxide (Al2O3) that is found
in igneous, metamorphic, and sedimentary rocks. It is one of the naturally clear
transparent material, but can have different colors such as, red, blue, white, grey, green,
yellow, or brown-based on when impurities are present usually contains various
impurities such as the oxides of iron and chromium and mica pinite and other silicates, It

2
occurs in hexagonal crystals usually in double ended pyramids the faces of which are
often curved and give the crystals the shape of an elongated barrel (Basavarajappa et al.,
2017). Transparent specimens are used as gems, called ruby if red and padparadscha if
pink-orange. All other colors are called sapphire example green sapphire for a green
specimen. The red color is caused by minor amounts of trivalent Cr replacing Al in the
crystal structure, the mineral is widely known for its extreme hardness and for the fact
that it is sometimes found as beautiful transparent crystals in many different colors. The
extreme hardness makes corundum an excellent abrasive, and when that hardness found
crystals is the perfect material for cutting gemstones (Maruthi et al., 2018). The ruby and
sapphire are mineralogical mere colored crystals of corundum, whose mineral
composition on chemical analysis is shown to consist of earth alumina in crystallized
state nearly in pure condition, In addition to its hardness of up to 9 on Mohs scale,
corundum's density of 4.02 g/cm3 is unusually high for a transparent mineral composed
of low atomic mass elements, such as, aluminium and oxygen, the bulk of the corundum,
thus collected is of abrasive (industrial) quality and a very small proportion of them form
gem quality popularly known as ruby and sapphire (Basavarajappa and Maruthi., 2018).
Ruby, from ruber (latin for red) it is commonly known as Manak or Lal in Hindi
and Manikya in Kannada. It is the transparent red-colored variety of corundum mineral.
The word corundum is derived from the Sanskrit word Kuruvinda and in Sanskrit ruby
stands for Ratnaraj which means something like king of the gemstones. Ruby is
distinguished for its bright red color, being the most famed and fabled red gemstone.
Besides, its bright color, it is a most desirable gem due to its magnificent color, excellent
hardness and outstanding brilliance, durability, luster and rarity. Transparent rubies of
large sizes are even rarer than diamonds and ruby is found in hexagonal prisms and
blades forms (Basavarajappa et al., 2018). The ruby, which sprays out red rays in the
sunlight and glow in darkness, is considered a superior quality gemstone. Ruby when
rubbed on a stone and the stone shows signs of rubbing and also the ruby does not lose its
weight, it is considered to be of a superior quality. The chemical formula for ruby is,
Al2O3, sp. gr., 3.9-4.1 and its hardness is 9 (Basavarajappa and Maruthi, 2018).

3
Trace amounts of iron and titanium can produce a blue color in corundum. Blue
corundum are known as "sapphires." The name "sapphire" is used for corundum that
range from a very light blue to a very dark blue color. The blue can range from a greenish
blue to violetish blue. Gems with a rich blue to violetish blue color are the most desirable.
Gem-quality corundum occurs in a wide range of other colors, including pink, purple,
orange, yellow, and green. These gems are known as "fancy sapphires." It is surprising
that a single mineral can produce gemstones of so many different colors.
Sapphire in true sense is the blue, transparent, gem variety of corundum but in trade
parlance all gem varieties other than red are called as sapphire. Natural sapphire has low
dispersion and hence no fire. Some of them are characterized by the presence of fine
parallel fibres as inclusions exhibiting the phenomenon of 'Silk'. With an abnormal
amount of silk developed along the lines of crystallization and when the crystal is cut in
en-cabochon fashion, it shows 'asterism' i.e. a white, six-rayed star seen on the surface
when examined in light. The blue color of sapphire is considered to be due to the
presence of titanium. Sapphire occurs as disseminated crystals formed by the 1.
Magmatic segregation in basic/ultrabasicigneous rocks.2. Desilication of pegmatite dykes
intruded intobasic igneous rocks.3. Metamorphism of highly aluminous rocks.It also
occurs in alluvial placers. Though theresources of sapphire are confined only in Jammu
&Kashmir, its occurrences are reported from AndhraPradesh, Karnataka, Kerala and
Tamil Nadu also.Basis of Grade ClassificationSapphire is the prime gem varieties of
corundum.This is the most fascinating gem stone after diamond.
1.2. NOMENCLATURE OF CORUNDUM
There are now recognized three varieties of corundum, depending on purity, degree of
crystallization, and structure. These are: (a) Sapphire, including all the highly colored
varieties of corundum which are transparent to translucent and are of value as gems; (b)
Corundum, including all those varieties of dark and dull colors and also the massive
lighter-colored varieties that are not transparent, as the blue to gray, brown, and white;
and (c) emery, including the intimate mixture of very fine granular corundum with
magnetite and sometimes with hematite, in appearance very similar to a fine-grained iron
ore (Viswanatha., 1972). The varieties that are brought under this head are, with the

4
exception of emery, all those that cannot be used as gems. As a commercial product there
are differences, such as texture, purity, etc., that have considerable influence upon its
value, in the same way in which color and transparency affect the gem corundum. In
1805 Haiiyformally united these different varieties under the one species, corundum.
Various names derived from its color, hardness, parting, structure, etc., have been applied
to corundum. The following names have been used to designate the different varieties of
this mineral (Joseph Hyde Pratt, 1906).
Names that have been applied to corundum, sapphire, and emery.
CORUNDUM
Adamant (Kirwan). Adamantine spar (Kirwan).
Adamas siderites (Pliny). Alumina.
Anthrax. Armenian stone (King).
Gorindon (Haiiy). Corindon adamantine (Brougniart).
Corindonharmophane (Haiiy). Corivindum.
Corivindum (Woodward). Corundite.
Corundum (Greville). Demantspath (Klaproth).
Diamond spar. Gyrasole (Kirwan).
Hard spar. Imperfect corundum (Greville-Bournon).
Karuud (Hind). Korund (Werner).
Kurund (India). Rhombohedral corundum (James).
Rhombohedrischercorund (Mobs). Soimonite.
Spath adamantine (Delameth). Thoneride.
SAPPHIRE
Amethisteorientale. Cat sapphire.
Anthrax (Theophrastus). Chlor sapphire.
Apyrote. Corindonhyalin .
Asterie. Corindon perfect.
Asteria (Pliny). Corindontelesle (Brongniart).

5
Asteriated sapphire. Emerald.
Barklyite (Stephen). Emeraude.
Bleu du rol. Emeraudeorientale.
Blue sapphire. Green sapphire.
Bronze corundum. Hyacinth.
Carbunculus (Pliny). Hyacinthos (Pliny).
Hyaline. Jacut (Arabian).
Lichnis (Pliny). Luchssaphir.
Luchs sapphire. Lychnis (Pliny).
Lynx sapphire. Occidental amethyst.
Opalescent sapphire. Opaline.
Oriental aquamarine. Oriental chrysolite.
Oriental emerald. Oriental hyacinthe.
Oriental peridot. Oriental ruby.
Oriental sapphire. Oriental topaz.
Orieutaliskrubin (Wallerius). Pink sapphire.
Pearl corundum . Rubieetoile.
Rubin. Rubis.
Rubis oriental (Werner). Sagenite corundum.
Salamstein (Werner). Salamstone.
Saphir (Werner). Saphirasteria.
Saphirblanc. Saphir de chat.
Saphiretoile. Sapphire.
Sapphirus (Wallerius). Spath adamantine (Delameth).
Star sapphire. Star stone.
Telesia (Haiiy). Telesie (Haiiy).
White sapphire. Yellow sapphire.

6
EMERY
Acone ex Armenia (Theophrastus). Armenian stone.
Armenian whetstone. Corindongranuleux (Haiiy).
Emeri. Emeril (Haiiy).
Emerite (Shepard). Emery.
Feroxydequartzifere (Haiiy). Granular corundum.
Grinding spar. Naxium (Pliny).
Naxium ex Armenia (Pliny). Pyrites vivus (Pliny).
Schmergel. Schmirgel.
Smergel (Wallerius). Smirgel.
Smiris (Agricola). Smirisferrea (Wallerius).
Smyris (Agricola and Dioscorides).
The list has been compiled from Dana's System of Mineralogy, sixth edition;
Dictionaryof the Names of Minerals, by Chester; Catalogue of Minerals and Synonyms,
byEgleston, and from the names used by the lapidaries.
1.3. TYPES OF CORUNDUM
Althoughthe hardness of the pure corundum is practically the same that is, 9 the cutting
qualities of corundum vary, has already been stated,according to the alteration that has
taken place in the mineral andto the development of parting planes (Joseph Hyde Pratt,
1906). The usual colors of this ordinary corundum are gray to white, shades of blue,
white mottled with blue, and also the darker colors, brown to black. According to its
structure, corundum is divided into three groups, known as (1) Block corundum, (2)
Crystal corundum, and (3) Sandcorundum.
(1) Block corundum includes the massive corundum, whether in small or large masses.
In some of the deposits the Block corundum is often intermixed with feldspar,
hornblende, muscovite, margarite, or chlorite, according to the characterof the rock in
which it occurs, so that the separation of thecorundum from these foreign minerals is
sometimes a rather difficultprocess. Where the corundum occurs in masses of

7
considerableweight, there is often great inconvenience in mining, as, on accountof its
toughness and hardness, it is not always readily broken and itis almost impossible to drill
through it. The Block corundum,.which shows but little development of the parting
planes already referredto and no ingrowth of muscovite, margarite, or chlorite in cracksor
seams, makes the best corundum ore, and the difficulty of cleaningis reduced to a
minimum (Joseph Hyde Pratt, 1906).
(2) Crystal Corundum. Under this head are included all the crystal varieties of
corundum. These are present in deposits of both Sand and Block corundum. Atmany of
the localities the crystals show the hexagonal prism merginginto the pyramid, thus
causing the crystal, as it tapers toward the end, to assume the form known as barrel
corundum. At anumber of mines loose, tapering crystals of rather indefinite formare
found, which are inclosed by compact margarite. At many of the veins the crystals occur
in a mass of feldspar, at others in biotite or muscovite, and at still others in chlorite
(Joseph Hyde Pratt, 1906).
(3) Sand Corundum consists of very small to minute crystals and small irregular grains,
such as are found in the chlorites and vermiculites. developed in the ore bodies occurring
between the peridotite and other rocks, such as gneisses and schists (Smeeth, and
SampathIyengar 1916).
1.4. PHYSICAL PROPERTIES OF CORUNDUM
Chemical Classification Oxide
Chemical Composition Al2 O3
Color Typically gray to brown. Colorless when pure, but trace amounts of
various metals produce almost any color. Chromium produces reed
(ruby) and
combinations of iron and titanium produce blue (sapphire).
Streak Colorless (harder than the streak plate)

8
Luster Admantine to vitreous
Diaphanety Transparent to translucent
Cleavage None. Corundum does display parting perpendicular to the c-axis.
Mohs Hardness 9
Specific Gravity 3.9 to 4.1 (very high for a nonmetallic mineral)
Diagonostic Properties Hardness, high specific gravity, hexagonal crystals sometimes tapering to
a pyramid, parting luster, conchoidal fracture
Crystal System Hexagonal
Geological application Used in abrasives, jewelries, pigments, electrical items and medical
purpas
1.5. OPTICAL PROPERTIES OF CORUNDUM
The luster of corundum is adamantine to vitreous, while that of emery is metallic to sub
metallic. On the basal surface of corundumthe luster is sometimes pearly. Pleochroism in
ordinary light is very strongly marked in the deeplycolored varieties, especially the
sapphires and rubies, the ruby showinga deep red color when viewed in the direction of
the verticalaxis, and a much lighter color to nearly colorless in some instanceswhen
viewed at right angles to this axis. The sapphire exhibits adeep blue color when viewed in
the direction of the vertical axis, and agreenish to greenish white or bluish whitewhen
viewed at right angles.By means of this pleochroism exhibited by corundum, the stones
arereadily distinguished from spinel, garnet, and other gem minerals,which resemble
some of the corundum gems.The action of the Roentgen rays or X rays upon corundum
gems isanother means of distinguishing the ruby and the sapphire from otherminerals
which resemble them, and from artificial or imitation stones.Corundum allows these rays
to pass through it freely, being exceededin this respect only by the diamond, which
allows the passage of tenlimes as much light. According to their resistance to the passage
ofthe X rays, Doctor Doelter has arranged the minerals into the followinggroups, the
diamond allowing the most light to pass through it: Corundum is normally uniaxial with

9
negative double refraction.The mean index of refraction is high, being' about 1.765. The
double refraction of corundum is0.008 to 0.009, or about the same as quartz. Some
varieties of corundumhave been observed that are abnormally biaxial (Joseph Hyde Pratt,
1906).
1.6. CHEMICAL COMPOSITION OF CORUNDUM
Theoretically pure corundum contains only alumina, Al2O3 butwith few exceptions, all
the specimens that have been examined showthe presence to a greater or less degree of
other chemical compounds,the principal ones being silica (SiO2), water (H2O), and ferric
oxide(Fe2O3 ). Water is almost always present in amounts from a traceto 2 percent or
more. The silica and ferric oxide also vary fromnothing in some corundum to as much as
5 percent in others. Ofcourse this does not apply to emery, which is a mechanical mixture
ofcorundum and magnetite; but it does apply to the corundum whenseparated from the
mixture, and the impurity in this corundum isusually ferric oxide. The purest known form
of corundum is thetransparent crystallized variety, or what might be called the sapphireor
gem variety (Joseph Hyde Pratt, 1906).
1.7. INTERNAL STRUCTURE OF CORUNDUM
Corundum is the crystalline form of aluminum oxide. Its hardness is next to diamond
andfor this reason it is used in manufacturing abrasive materials and also as a precious
stone.Corundum in purest form is colourless having tetragonal structure. The oxygen
atoms lieon planes in nearly hexagonal closed packed configuration with their cations
betweenthese planes in octahedral coordination (Hughes, 1991), For every three
octahedral, two distortedcations are occupied by an aluminum atom in an orderly
arrangement; thus eachaluminum atom is surrounded by six oxygen atoms. The
polyhedron model of corundumis shown in ( Fig. 1). The internal structure of corundum
is having three oxygen atoms above the aluminum are closer to each other than the three
oxygen atoms below, and the aluminum atom is a little lower than halfway down.

10
Half of the aluminum atoms have this arrangement, and the other half have an inverted
arrangement. If this arrangement is viewed in terms of ionic bonds, then the positive
aluminum ion is surrounded by six negative charges (oxygen ions). Each aluminum atom
donates three electrons to become Al3+
and has no unoccupied energy levels, while each
oxygen atom receives two electrons, ensuring that it has no unoccupied energy levels.
Therefore, two aluminum atoms donate a total of six electrons, and three oxygen atoms
receive a total of six electrons, to produce Al2O3.In pure corundum, all electrons are
paired and there is no absorption of light. Once one out of every hundred aluminum
atoms is replaced by chromium atoms, negatively charged oxygen ions surround the
aluminum ion (which has donated 3 electrons), so a chromium atom must donate three
electrons to become Cr3+
, replacing Al3+
, in order for the charge to remain the same. In
Al3+
there are no partially filled energy levels or orbitals. However, in Cr3+
there are
partially filled energy levels or orbital‘s. It is these electrons that can be excited and that
cause absorption of certain wavelengths of light, resulting in color (Joseph Hyde Pratt,
1906).
Fig.1.1. Polyhedral model of Corundum (Hughes, 1990)
The same corundum structure is also seen in Cr2O3, V2O3, Ti2O3, Fe203etc; some ofthese
when found along with Al2O3 in the earth‘s crust during the formation ofcorundum, the
position of A1 atom in the lattice is replaced by Cr3+
, V3+
, Ti3+
, Fe3+
ions.When A1 atom
is replaced by Cr atom in the lattice structure, red colour ruby are obtained(Hughes,
1991). Transition metal causes colour because of their unpaired electrons and

11
variablevalence. These impurities when present even in traces greatly influence the
appearance of gems (Hughes, 1991). Transparent gem varieties of corundum are known
as Ruby and Sapphire. Gemcorundum other than red in colouris generally called sapphire
(Hughes, 1991).The known methods for identification of gemstones utilize the
knowledge of RefractiveIndex (RI), Specific Gravity (SG), Double Refraction (DR),
hardness, color, luster, spark andappearance(Peter, 1983).
Corundum belongs to the hematite group (X2O3) of rhombohedral oxides
comprising hematite (Fe2O3), corundum (Al2O3), eskolaite (Cr2O3), karelianite (V2O3),
and tistarite (Ti2O3). There are no solid solutions between any of the five species but they
have the same type of structure. Hematite group mineral structures are based upon
hexagonal closest packing of O atoms, with cat ions in octahedral coordination (Cesbron
et al., 2002). Euhedral crystals can present different faces (Fig.1.2) that correspond to
seven crystalline forms (Cesbron et al. 2002) the pinacoid {00.1}, the first order
hexagonal prism {10.1} and second order {11.0}, the hexagonal prism {kk.0}, the
hexagonal dipyramid {hh.l}, the ditrigonal scalenohedron {hk.l} and the
rhombohedron {h0.l}. The first five crystalline general forms are also present in the
classes that belong to the hexagonal system. Corundum can also crystallize in a particular
texture called trapiche (Sunagawa et al., 1999, Garnier et al., 2002).
Fig.1.2. Crystalline forms of the 3 2/m class of the rhombohedral system (after Cesbron et
al. 2002). A, positive rhombohedron {10.1}; B, negative rhombohedron {01.1}; C, hexagonal
dipyramid {hh.l}; D, pinacoid {00.1}; E, hexagonal prism of first order {10.1}; F, hexagonal
prism of second order {11.0}; G, dihexagonal prism {hk.0}; H, ditrigonal scalenohedron{hk.l}.

12
1.8. GEOLOGICAL OCCURRENCE OF CORUNDUM
Corundum is found as a primary mineral in Igneous rocks such as syenite,
nephelinesyenite, and pegmatite. Some of the world's most important ruby and sapphire
deposits are found where the gems have weathered from basalt flows and are now found
in the downslope soils and sediments. Corundum is also found in Metamorphic rocks in
locations where aluminous shales or bauxites have been exposed to contact
metamorphism. Schist, gneiss, and marble produced by regional metamorphism will
sometimes contain corundum. Some of the sapphires and rubies of highest quality, color,
and clarity are formed in marble along the edges of subsurface magma bodies.
Corundum's toughness, high hardness, and chemical resistance enable it to persist in
sediments long after other minerals have been destroyed. This is why it is often found
concentrated in alluvial deposits. These deposits are the most important source of rubies
and sapphires in several parts of the world. Traditional sources of alluvial rubies and
sapphires include Burma, Cambodia, Sri Lanka, India, Afghanistan, Montana, and other
areas. In the past few decades, several parts of Africa, including Madagascar, Kenya,
Tanzania, Nigeria, and Malawi(Joseph Hyde Pratt, 1906).Corundum mines In the USA,
from Chester, Hampden Co., Massachusetts; the Cortland district, Westchester Co., New
York; at Franklin, Sussex Co., New Jersey; large crystals from Hogback Mountain,
Jackson Co., and Buck Creek, Clay Co., North Carolina; and from the Laurel Creek mine,
Rabun Co., Georgia. At Bancroft and Haliburton, Ontario, Canada.On Naxos and Samos
Islands, Greece.Large crystals from around the Soutpansberg, Transvaal, South Africa.
Red gems from: the Mogok district, Myanmar (Burma). In the Ratnapura district, Sri
Lanka.Around Mysore Dharwarcraton Karnataka, India.In the Jegdalek marble, near
Sorobi, Laghman Province, Afghanistan.At Merkestein, near Longido, and the Morogoro
district, Tanzania.From Ampanihy, Madagascar. Blue, green, and yellow gems from:
Chanthaburi and Trat, Thailand. Around Bottambang and Pailin, Cambodia.In the Umba
Valley, Tanzania.From around Andranondambo and Antsiermene, Madagascar.At
Anakie, Queensland, Australia. From Yogo Gulch, 25 km southwest of Utica, Fergus
Co., Montana, USA, have become important producers of ruby and sapphire.

13
1.8.1. Corundum Resources in India
India is considered as a country with big potential for gemstones. Many kinds
ofgemstones have been found and mined in different areas of the country. Among
thesegemstones, diamonds, rubies and sapphire are of most importance. Corundum is
found inmetamorphosed shale and unsaturated igneous rocks (Karanth, 2000). It is found
in association withkyanite and sillimanite in Assam, Meghalaya and Maharashtra. Ruby
and Sapphirefound From the Zanskar district, Kashmir, India. It occurs in syenites
andultrabasic rocks in Andhra Pradesh (Karanth, 2000). Pegmatites containing corundum
occur in Bastardistrict, Chhattisgarh and Morena district of Madhya Pradesh. In
Chhattisgarh corundum occurs in Bhopalpatnam and Sukma areas of Dantewara district,
minor occurrences are also reported from Deobog area of Raipur district and small areas
Kuchnoor, Ulloor, Dampaya area, Dhangal, Chikudapalli, Yapla and SonakukanarSukma
area. Occurrences of sapphirehave been reported from Katamalkailakat-Baberi-Amera,
Bhujipadar and Ghumur-Sargigunda belts in Kalahandi district of Orissa. Occurrence of
Ruby has been reportedfrom Jillingdhar in Kalahandi district of Orissa. Precious and
semi-preciousvarieties of corundum have also been reported from Tamil Nadu in
Kangeyam beltstretching over Karur and Kulithalai Tehsils in Tiruchirapalli district, and
Vedachandurtehsil in Dindigul district of Tamil Nadu (Karanth, 2000).
1.8.2. Corundum Deposits of Karnataka
Corundum occurrences in karnataka Bellary, Chitradurga, Shivamogga, Bangaluru,
Tumahur, Chikballapura, Chikmagalur, Kodagu, Hassan, Dakshina Kannada, Mysuru,
Mandya, Ramanagara, Chamarajanagara and Kolar districts.
1.8.3. Corundum Resources in Study area
Corundum occurrences are alsoreported from study area of Bangalore, Chickmagalur,
Hassan, Mysore, Corundum occurs in peliticschists and gravel derived Kupya, Varuna,
Bannur,H.D.Kote and Sargur Reddish Corundum crystalsoccur in a north-south trending
linear tract of 210 km length extending from Kupya of Narsipur taluka of Mysore district
to Mandya, In different area of Mysore, bright red ruby crystals embedded in a thinlayer
of white surrounding rocks have also been reported (Karanth, 2000) Corundum is widely

14
distributed in the district mining appears to have been attempted on a large scale in
Heggadadevankote Mysuru and Hunsurtaluks large sized barrel shaped crystals are
embedded in a tough kayanite matrix at Pilhalli,Heggadadevankotetaluk at
Singamaranhalli, Nadapanhalli and Voddarahosahalli in Hunsurtaluk, corundum occurs
in soft grey talcose schist Manikpur, Yarekalmonti, Gollabidu, Gumsihalli, Chattanhalli
and Kyatanhalli are villages in Mysore taluk where corundum is reported to occur in
abundance of Mysuru district. At Budipadaga, corundum occurs in Pilitic granulites of
B.R hills high grade granulites of regional metamorphic terrain (Basavarajappa et al.,
2008) (Basavarajappa and Maruthi., 2018). Important deposits are reported from Satanur
near Mandya, Erehalli, Kirangur and Ramanahalli areas. There are several reported
occurences of corundum in this district specially near Bellundigere, 6km NE of Mandya
Nelimakanhalli and Gurudevarahalli in Malavalli taluk Arsinkere, Basaralu, Satnuru,
Yerehalli, Tarasanhalli and Kirlgandur. Corundum gems occurring at the contact of
ultramafic rocks and pegmatite in Kollur, Maddur tract and Malavalli Doddi tract of
Mandya district. Another tract with corundum deposits extends about 60 km. from near
Ramanagaram to Malavalli (Karanth, 2000). Occurrence of corundum in nepheline
syenite has been reprted from Kanakapura of Bangalore district. Good ruby corundum
along with kayanite is seen in tremolite schist near Kadaneru in Sringeritaluk, ruby
corundum is also found at Melkoppa in the Koppataluk of Chikmagalur district.
Corundum occurs in the Challakere taluk, Loose barrel shaped crystals of pink corundum
are reported to be scattered in the soil cap in the Ullavarti – kaval east of Challakere, so
for these have not been commercially exploited on a large scale this type of Corundum
seen in the Ullavartikaval of Challakere taluk of Chitradurga district. Corundum has been
reported from several places in the Uppinangadi taluk as at Pachera, Pilenki and at
Keladka in Puttur taluk of Dakshin Kannada district. Important occurrences are near the
village of Kalyadi and Undiganhal to the south and southwest of Arsikere. There is a
good show of corundiferous rock and also a number of old working in the hill to the west
of Kalyadi grey corundum in the form of radiating bunches occurs in a kaolinized
pegmatite cutting amphibolite. Dark sapphire blue granular corundum in pegmatite is
seen near Adihalli about 3km ENE of Bageshpura other occurences are near Doddenhalli,
Arasikeretaluk near Basavanpura and Agrahara in the Channarayapatna taluk, near

15
Hardur, granular pink corundum occurs together with circular radiating patches of
kayanite weathered schist is washed near Kikkeri for the recovery of red ruby corundum
of Hassan district. Workable deposits of corundum are found at Dodderi 3km NNW of
Kamasamudra and at Doddenur and Yelesandra in the Bangarpet taluk from the size of
excavations, it is evident considerable quantities of pink granular corundum appear to
have been recovered several abandoned shafts are also seen corundum is found as an
ingredient of cordierite sillimanite gneiss, corundum is also reported to be available in
large quantities near Marahalli near Thondebhavi stray crystals of corundum are reported
from several parts of Sidlaghatta and Chintamani taluk of Kolar district. A number of
shallow working for corundum are seen at Baichapura and Alpenhalli in Kortageretaluk
there are many reported occurrences especially in the region bordering the closepet
granites in parts of Sira, Madhugiri and Pavagada taluks, corundum gem occurring at the
contact of ultramafic rocks and pegmatite Honmachanahalli, Bandihalli and tract of
Tumkur-Pavagada and Baichapurr-Madhugiri of Tumkur district. Gems occurring at the
granulites in Budipadaga of Chamarajnagar district.
1.9. HYPERSPECTRAL STUDY
Hyperspectral (350-2500nm) is a special type of multispectral imaging scanner
which provides a high spectral resolution data to bring out diagnostic features on
lithological contacts for better discrimination and rapid mapping across the Study area.
The hyperspectral data on Mineral targeting, lithological contacts and themes like
geomorphology, geology/ mineral mapping, structure, soil, drainage, lineament, slope,
landuse/land cover will be studied using high resolution satellite data such as Landsat 8
OLI, SPOT resolution the area coverage that have become potential tool for mapping of
precious gemstones in between lithological contacts and mineralized zones.
Hyperspectral imaging has been an area of active research and development, and
hyperspectral images have been available only to researchers. With the recent appearance
of commercial airborne hyperspectral imaging systems, hyperspectral imaging is poised
to enter the mainstream of remote sensing.Hyperspectral images will find many
applications in resource management, agriculture, mineral exploration, and
environmental monitoring. But effective use of hyperspectral images requires an

16
understanding of the nature and limitations of the data and of various strategies for
processing and interpreting it.Hyperspectral images are produced by instruments called
imaging spectrometers. Spectroradiometers are instruments designed to measure the
spectral power distributions of illuminants. They operate almost like spectrophotometers
in the visible region. They are commonly used to evaluate and categorize lighting for
sales by the manufacturer, or for the customers to confirm the lamp they decided to
purchase is within their specifications.Spectroradiometers are frequently used to calibrate
LCD and CRT displays such as on laptops and HDTVs. CIE color values are measured
and compared to predefined values, to ensure that the color displayed is correct, thus
removing color variance between multiple displays.
Spectral signature measures all types of wavelengths that reflect, absorb, transmit and
emit electromagnetic energy from the objects of the earth surface (Ali M. Qaid et al.,
2009). Specral Evolution (SR-3500) Spectro-radiometer instrument has the ability to
measure the spectral signatures of different rocks/ minerals. The SR-3500 operate in the
wavelength range of 350–2500 nm with three detector elements: a 512-element Si PDA
(Photodiode Array) covering the visible range and part of the near infrared (up to
1000nm) and two 256-element InGaAs arrays extending detection to 2500nm.The
spectral signatures of the representative samples were compared with mineral spectra of
USGS spectral library in DARWin SP.V.1.3.0 (Hunt et al., 1971). Absorption spectral
values obtained from the DARWin software lab Spectra is the one character helps in the
study of major and minor mineral constituents.
1.10. REMOTE SENSING AND GIS TECHNIQUES
Remote Sensing is based on the measurement of Electromagnetic (EM) energy.
EM energy can take several different forms. The most obvious form of EM energy that is
experienced is light. All forms of electromagnetic radiation, including light, behave both
as waves and as particles (Dury: 1987, AL-Daghastani: 2003). EM energy travels at the
speed of light (3 x 10⁸ m/sec). It is commonly treated as a wave with both electric and
magnetic fields, which are perpendicular to the propagation direction (Hunt: 1980, Harris
and Bertolucci: 1989).

17
Fig.1.3. Remote Sensing Process
Fig.1.4. Electromagnetic Spectrum Wavelength Regions.
This study deals only with the visible, near-infrared, short wave infrared and
thermal regions. Enhancement Thematic Mapper Plus (ETM+) measures reflected
radiation in 6 bands between 0.45 and 2.35 μ m (VNIR and SWIR), and emits radiation
in one band in the 10.40-12.50 μ m range (Ali et al-2008, 2009).

18
Our eyes are sensitive to just a small portion of the electromagnetic spectrum.The
sun, normal incandescent bulbs, and most fluorescent bulbs produce nearly whitelight by
mixing all the frequencies (colours) together. White light can be separatedinto its
component colours, called a spectrum, by passing the light through a prism ora
diffraction grating. If a light source produces all the visible frequencies (such as thesun),
the spectrum is called a Continuous Emission Spectrum (CES). If the sourcesproduce
only certain frequency (such as a gas at low pressure, neon sign for example,the resulting
spectrum is called a Bright Line Emission Spectrum (BLES). If atransparent substance
(such as stained glass) absorbs or removes certain frequenciesfrom white light, the
spectrum produced is called an Absorption Spectrum (AS).
Fig.1.4. explains the EMS wavelength regions and region of EMS which isutilized in the
application of Remote Sensing technology. Visible and Infrared regionsare most usable
radiation in the field of remote sensing. Atmospheric window is therange of wavelengths
at which radiation is slightly absorbed by the water vapor andcloud.Electromagnetic
waves can be described in terms of velocity, wavelength andfrequency:
Velocity: The speed of light, c = 3×10⁸ m/sec).
Wavelength (l): the distance from any position in a cycle to the same position
inthe next cycle, measured in the standard metric system (Fig.1.6). Two units
areusually used: the micrometer (mm, 10-6 m) and the nanometer (nm, 10-9 m).
Frequency (n): the number of wave crests passing a given point in specific unit
oftime, with one hertz being the unit for a frequency of one cycle per second.
Wavelength and frequency are related by the following formula:c = l × n
Electro-Magnetic radiation consists of an electrical field (E) which varies inmagnitude in
a direction perpendicular to the direction in which the radiation istraveling, and a
magnetic field (M) oriented at right angles to the electrical field (Fig.1.5). Both these
fields travel at the speed of light (c).

19
Fig.1.5. Electromagnetic radiation.
Fig.1.6. Wavelength and frequency.
1.10.1. ENERGY INTERACTION MECHANISMS WITH THE MATTER
Number of interactions is possible when Electromagnetic energy encounters
matter irrespective of it physical nature like, solid, liquid and/or gas. The interactions that
take place at the surface of a substance are called surface phenomena. Penetration of
Electromagnetic radiation beneath the surface of a substance results in interactions called
volume phenomena.
The surface and volume interactions with matter can produce a number of changes in the
incident Electromagnetic radiation; primarily changes of magnitude, direction,
wavelength, polarization and phase. The science of Remote Sensing detects and records

20
of these changes. The resulting images and data are interpreted according to the changes
recorded remotely to identify the characteristics of the matter that areproduced through
Electromagnetic radiation.
The common interactions occurred in the surface is given below:
Radiation may be transmitted, that is, passed through the substance. The velocity of
Electromagnetic radiation changes as it is transmitted from air, or a vacuum into other
substances. A substance can absorb the radiation by give up its energy largely to
heatingthe substance. Radiation may be emitted by a substance as a function of its
chemical structure and temperature interaction. At absolute temperature all the matters
interacts with light energy will emit some source of energy above to the absolute zero
degree kelvin (0° K), emitted energy can be detectable in the advance techniques of
Remote Sensing.
Fig.1.7. Electromagnetic radiation interactions with different surface features.
Radiation may be scattered i.e deflected in all directions and lost ultimately to absorption
or further scattering (as light is scattered in the atmosphere).
Radiation may be reflected. If it is returned unchanged from the surface of a substance
with the angle equal and opposite to the angle of incidence, it is termed specular
reflectance (as in a mirror). If radiation is reflected equally in all directions, it is termed

21
as diffuse. The EMR interaction with different surficial feature is given in the Fig.1.7
explains the direction of propagation of reflected light.
The interactions with any particular form of matter are selective with regard tothe
Electromagnetic radiation and to the specific matters, depending primarily upon surface
properties, chemical constituents, atomic and molecular structure of the matter.
The Electromagnetic radiation is divided by specific wavelength region and according to
the application and interaction of the radiation, the radiation division name, wavelength
range, interesting facts and related uses are listed in the table 1.
Reflected IR radiation is commonly used in remote sensing application, divide in to
following regions:
Near Infra-Red (NIR) between 0.7 to 1.1 μm.
Middle Infra-Red (MIR) between 1.3 to 1.6 μm
Short Wave Infra-Red (SWIR) between 2 to 2.5 μm.
Remote Sensing and GIS have been more widely used as an important tool for analysis in
the areas of mineral exploration. They have become important tools for locating mineral
deposits, in their own right, when the primary and secondary processes of mineralization
result in the formation of spectral anomalies. Additionally, some factors can be mitigated
with ground support during over flights and field validation to improve statistical
mapping methods. High resolution data are available, which can help in detecting small
objects.The introduction of GIS to the geological sciences has provided powerful tools to
help geologists to manage and analyze geological data much more efficiently than ever
before. Several examples exist of GIS applications in the geosciences where multiple data
sets are integrated to provide new information to users. Some of these studies used GIS
for prospecting areas of mineral potential (Bonham-carter et al., 1988; Rencz et al., 1994)
and land-use planning and management (Madigan et al., 1988).

22
Table.1. Specific Electromagnetic Radiations Wavelength Range (nm) and uses
RADIATIONS WAVELENGTH
RANGE
INTERESTING
FACTS
APPLICATIONS / RELATED
CAREERS
RADAR
0.3 to 300 cm Object detection system mainly uses radio waves.
Active mode of microwave Remote Sensing.
Determines direction, or speed, altitude, range, of both
moving and fixed objects examples like aircraft, ships,
spacecraft, guided missiles, motor vehicles, and
weather formations.
MICROWAVE 0.3 to 300 cm These longer wavelengths can penetrate clouds and fog.
Imagerymay be acquired in the active or passive mode.
cooking; long distance TV
and phone; Microwave Remote sensing
THERMAL IR
3 to 5 mm
8 to 14 mm
These are the principal atmospheric windows in the
ThermalRegion. Imagery at these wavelengths is acquired
through the useof optical-mechanical scanners, not by film.
Track active Volcanoes, Forest Fires, and Quantitative
information of Forest Canopy structure, age and
Biomass.
REFLECTED IR
0.7 µm to 3 mm This is primarily reflected solar radiation and contains
noinformation about thermal properties of materials.
NIR,SWIR and Long wave IR
Mainly used in Satellite remote sensing for mineral
exploration.
INFRARED(IR)
0.7 µm to 300
mm
Interaction with matter varies with wavelength.
AtmosphericTransmission windows are separated by absorption
bands.
heating & drying; "night vision" cameras; TV & garage
door remotes;
VISIBLE
0.4 to 0.7 µm Detected with film and photodetectors. Includes earth
reflectance
peak at about 0.5 mm.
what the eye and typicalfilm can ―see‖; optometrist
PHOTOGRAPHIC UV 0.3 to 0.4 µm Transmitted through the atmosphere. Detectable with film and
Photodetectors, but atmospheric scattering is severe.
Detection of skin disorder, and it reveals many artifacts
ULTRAVIOLET(UV) 3 nm to 0.4 µm Incoming UV radiation atmosphere wavelengths 0.3 mm
isCompletely absorbed by ozone in the upper atmosphere.
Germicidal, photochemical,Photo-electriceffects;
hardening casts inMedicine.
X-RAY 0.03 to 0.3 µm Incoming radiation is completely absorbed by atmosphere.
NotEmployed in Remote Sensing.
Medicine; crystallography;astrophysicist
GAMMA
<0.03 nm Incoming radiation from the sun is completely absorbed by the
Upper atmosphere, and is not available for Remote Sensing.
Gamma radiation from radioactive minerals is detected by low
flying. Aircraft as a prospecting method.
Research into structure ofnucleus; geophysics;mineral
exploration

23
GIS offers as a potential tool for accomplishing the acquiring, managing, analyzing,
integrating and visualizing of the large volumes of geosciences data collected from a
variety of sources (Harris et al., 2001).
GIS can be regarded as a set of tools to analyze spatial data- meaning the space around
us, where there is live and function. Specifically, a GIS is an automated system that can
capture store, retrieve, analyze and display spatial data from actual surrounding for a
particular objective (Burrough and McDonnell, 1988). GIS is often described as
integration of data, hardware and software designed for management, processing,
analysis and visualization of georeferenced data (Neteler and Mitasove, 2007). Remote
Sensing played a part in the development of GIS, as a source of technology as well as a
source of data (Paul et al., 2005). GIS is widely used to manage data that have a special
component. A digital GIS offers more viewing flexibility than a simple paper map, and
also has tools to enable data analysis. Remotely sensed data from the earth observation
satellites are particularly well suited for use in GIS since satellite imagery is already in a
digital form.
In this work, the GIS software system such as Arc GIS 10.3 provide anexcellent graphic
user interface for visualizing spatial data, the complexity ofgeospatial data and some
specific application such as visualization of sub pixelmineral abundance images,
nevertheless call for new visualization technique. Themost of the work done in this thesis
is carried by the Digital Image Processingmethods and spectral radiometer with spectral
signatures.
1.11. PETRO – CHEMICAL CHARECTISTICS
Petrography is a branch of petrology that focuses on detailed descriptions of rocks.
The mineral content and the textural relationships within the rock are described in detail.
Petrographic descriptions start with the field notes at the outcrop and include megascopic
description of hand specimens. However, the most important tool for the Petrographer is
the petrographic microscope. The detailed analysis of minerals by optical mineralogy
in thinsection and the micro-texture and structure are critical to understanding the origin
of the rock.

24
Geochemistry: Geochemistry in the study of composition, structure, processes, and other
physical aspects of the Earth and its parts (Crust, Mantle and Core). To understand and
examine the distribution of chemical elements in rocks and minerals, as well as the
movement of these elements into soil and water systems.There is a wealth of information
buried in the liquids, gases, and mineral deposits of rocks soil and water. The
geochemistry is deals with understanding this information and make informed decisions
on a range of extensive industrial and scientific research applications. Understanding the
chemical composition of rocks of earth crust Geochemistry is the science that uses the
tools and principles of chemistry to explain the mechanisms behind major geological
systems such as the Earth's crust and oceans floares. The realm of geochemistry extends
beyond the Earth, encompassing the entire Solar System and has made important
contributions to the understanding of a number of processes including mantle convection,
the formation of planets and the origins and composition of hole earth like crust, mantle
and the core.
1.12. OBJECTIVES
1) To demarcate the corundum bearing horizons the study area.
2) To identify the spectral characteristics and different types of corundum bearing
associated rocks.
3) To understand the geochemical signatures.
4) To Integrate and Correlate Geochemistry.
1.13. METHODOLOGY
Collection of base line information and preparation of base/location maps of the study
area and to study the existed literatures on the application of hyperspectral remote
sensing spectral signatures. To Study the Field Geological and Petrological work on
Corundum bearing rocks of the study area. Interpretation of spectral reflectance
characteristics of Corundum bearing rocks and associated lithological mineralization on
hyperspectral satellite data for the understanding of their distribution, association, etc. by

25
visual interpretation, image processing, GIS, geo-spatial techniques.Interpretation of
corundum associated mineralization zones and lithological contacts using Hyperspectral
Instrument (SR-3500).Measurement of field hyperspectral signatures using
Spectroradiometer and collection of GPS based geo-referenced samples for Ground Truth
check. Analysis using Arc-GIS on spectral matching techniques, sub-pixel immixing
retrieval techniques and identification of end member spectra etc then Discrimination of
corundum mineral associated litho units and to validate the hyperspectral signatures data.
Study the physical, optical and chemical characters of samples using sophisticated
analytical instruments and comparison and characterizing of their hyperspectral
signatures obtained by spetroradiometr.
FinalyIntegration of all results Geological, Petrological, Geochemical and Hyperspectral
Signatures on corundum bearing litho-units of the study area, detailed understanding of
their distribution, association, etc. by visual interpretation, image processing (ERDAS
2014), GIS (Arc map10.3), Hyperspectral (ENVI 4.6) and GPS geo-spatial techniques
has done.
OUTCOME OF THE RESEARCH
The Research Study Aims to carry out on corundum bearing horizons and their detail
Mapping through hyperspectral and with the mineralization, its characterization is
particular the types of corundum is precious and semi-precious to utilization in Gem
Industry, which is having gemology and Gemstone in Industrial Applications of the state
and Indian region.
10.14. GEOGRAPHICAL LOCATION OF THE STUDY AREA
The Karnataka is located within 11°30' to 18°30' North latitudes and 74° to 78°30' East
longitude is southern part of Indian sub-continent. The state covers an area of 191,976
square kilometres (74,122 sq mi), or 5.83 per cent of the total geographical area of India.
It is situated on a tableland where the Western Ghats ranges converge into the Nilgiri hill
complex, in the western part of the Deccan Peninsular region of India. The State is
bounded by Maharashtra and Goa States in the north and northwest; by the Arabian Sea

26
in the west; by Kerala and Tamil Nadu States in the south and by the States of Andhra
Pradesh in the east. Karnataka extends to about 750 km from north to south and about
400 km from east to west.
The study area particularly in Southern Karnataka located between11°30' to 15°00' North
latitudes and 74° 00’ to 78°30' East longitude, covering 20 districts with an aerial extent of
95,988sq km (Fig.1.8).
Fig.1.8: Location Map of the Study area
1. 15. LITERATURE REVIEW
Literature Review is a consideration of reports of information found related to selected
area of study to constrain a theoretical framework for a present research topic. It provides
an up to date understanding of a subject and significance of different techniques at
present condition; Identifies the method used by previous researchers ona topic and
provides a comparisons for own research findings. This literature review understanding
of the research topic and it helps to identify the potentiality of the methods adopted in the
Remote Sensing (RS) for mapping and advancement in the mapping of geological
features and finally it gives information of a study area and similar work done so far
within the area. A detailed review on the study sites, mineral exploration and mapping,

27
image processing, multispectral and hyperspectral Remote Sensing for mineral mapping
and ground truth spectroradiometry has been carried out to furnish the upcoming
chapters.
Zen, (1981) the mineral assemblages from metamorphosed slightly calcic Pelitic rocks of
the Taconic Range in southwestern Massachusetts and adjacent areas of Connecticut and
New York were studied petrographically and chemically. These rocks vary in
metamorphic grade from those below the chloritoid zone through the chloritoid and
garnet zones into the kyanite-staurolitezone.Microprobe data on the ferromagnesian
minerals show that the sequence of increasing Fe/ (Fe+Mg) value is, from the lowest,
chlorite, biotite, hornblende, chloritoid, staurolite, garnet. Hornblende, epidote, garnet,
and plagioclase are the most common minerals that carry significant calcium. Muscovite
contains small though persistent amounts of iron and magnesium in octahedral positions
but has a variable K/Na ratio, which is potentially useful as a geothermometer.
Kruse F.A, (1988) done Classical geologic mapping and mineral exploration utilizingthe
physical characteristics of rocks and soils such as mineralogy, weatheringcharacteristics,
geochemical signatures, and landforms to determine the nature anddistribution of
geologic units and to determine exploration targets for metals andindustrial minerals.
Subtle mineralogical differences, often important for makingdistinctions between rock
formations, or for defining barren ground versus potentialeconomic ore, are often
difficult to map in the field. Hyperspectral Remote Sensing,the measurement of the
Earth‘s surface in up to hundreds of spectral images and fieldinvestigated spectral
signatures, provides a unique means of Remotely MappingMineralogy (RMM). A wide
variety of hyperspectral data are now available, alongwith operational methods for
quantitatively analyzing the data and producing mineralmaps. This review paper serves to
illustrate the potential of these data and how theycan be used as a tool to aid detailed
geologic mapping and exploration.
Alvaro P Crosta et al., (1998) used hyperspectral remote sensing for mineralmapping at
Alto paraiso DE Goias area at Central Brazil. Here the authors examinethe capability of
hyperspectral data acquired by AVIRIS airborne instrument over anarea comprises

28
Proterozoic metasediments with little mineralogical variations andalthough it does not
represent an ideal side for the use of hyperspectral data, someinteresting results were
found in terms of mineral identification in portions of theimage where enough ground
exposure existed. Mineral deposits always holds themixture of primary and secondary
minerals, related to later weathering process wereidentified in the imagery based on
spectral signatures of pure pixels this mixturecomprised mainly hematite, goethite,
halloysite, kaolinite and Na montmorillonite.AVIRIS data and the efficiency of the
methods employed for mineral targetingincludes digital image processing (DIP) and the
results are confirmed by laboratoryreflectance measurement and Scanning Electron
Microscope (SEM) analysis of soilsamples.
Tomoaki Morishita and Shoji Arai (2001) corundum bearing mafic rocks study in the
Horoman complex, they studied type II mafic rocks based on their chemical composition
and structures show their cumulus origin with primary minerals assemblage controlled by
crystallization of olivine plagioclase and clinopyroxene indicative of a low pressure
origin.
Parikh et al., (2002) they are studied the Cr–K-edge XANES and EXAFS in natural
Indian rubies from two sources and a synthetic ruby at ESRF. Weight % of various
constituents in them is determined using EDAX measurements.Taking the results from
the three techniques together we are able to demonstrate their feasibility in quantitative
study of precious stones. They are made EDAX, XANES and EXAFS measurements
(Cr–K-edge) on three ruby crystals from different sources, two natural and one synthetic.
The results from three measurements show very good agreement and taking all of them
together we are able to successfully demonstrate how these techniques can be used in
study of the precious stones.
Peter Bajcsy et al., (2004) done methodology for hyperspectral band selection.
Whilehyperspectral data are very rich in information, processing the hyperspectral
dataposes several challenges regarding computational requirements,
informationredundancy removal, relevant information identification, and modeling
accuracy. Inthis paper the authors present a new methodology for combining

29
unsupervised andsupervised methods under classification accuracy and computational
requirementconstraints that is designed to perform hyperspectral band (wavelength range)
selection and statistical modeling method selection. The band and method selectionsare
utilized for prediction of continuous ground variables using airborne
hyperspectralmeasurements. The novelty of the proposed work is in combining strengths
ofunsupervised and supervised band selection methods to build a
computationallyefficient and accurate band selection system. The outcomes of the
analysis led to aconclusion that the optimum number of bands in this domain is the top 4
to 8 bandsobtained by the entropy unsupervised method followed by the regression
treesupervised method evaluation. Although the proposed band selection approach in
thispaper is demonstrated with a data set from the precision agriculture domain, it
appliesin other hyperspectral application domains.
Tomoaki Morishita et al., (2004) Coronitic textures around corundum in the sample
suggest that corundum was not stable in mafic rock compositions during the late-stage P–
T conditions recorded in the complex. Based on the experimental results, corundum is
stable in aluminous mafic compositions at pressures of 2–3 GPa under dry conditions
suggesting that the corundum-bearing mineral assemblages developed under upper-
mantle conditions, probably within the surrounding peridotite Variations in the trace-
element compositions of the corundum-bearing mafic rock and related rocks can be
controlled by modal variations of plagioclase, clinopyroxene and olivine, suggesting that
they formed as gabbroic rocks at low-pressure conditions They show no evidence for
partial melting after their formation as low-pressure cumulates. TheHoroman complex is
an example of a large peridotite body containing possible remnants of subducted oceanic
lithosphere still retaining their origin geochemical signatures without chemical
modification during Subduction and exhumation.
Fernando et al., (2005) Sri Lanka has long been renowned for its wide variety of
gemstones dominated by varieties of corundum, chrysoberyl, garnet, spinel, tourmaline,
zircon etc. Most of the gem deposits occur in stream valleys as placer deposits.A peculiar
kind of corundum-spinel-scheelite-taafeite occurrence has been found associated with
marble at Bakamuna within the central granulite belt of Sri Lanka Althoughscheelite and

30
taaffeite are found in Sri Lankan alluvial plains, this is the first reported in-situ
occurreces of scheelite and taaffeite (Fernando &Hofmeister, 2000). Corundum deposits
localized in marbles are widely known in history as a source of precious stones in many
countries including Burma, Kashmir, Afghanistan, Tanzania and as well as the Urals and
the Pamirs deposits
Prakash et al., (2013). They report a new occurrence of sapphirine-spinel-corundum
bearing granulite‘s enclosed in granitic gneisses near Jagtiyal in the Eastern
DharwarCraton (EDC). These granulite‘s are very important in deciphering the
prehistory of the thermal peak of metamorphism due to the presence of refractory
phasesThe P–T evolution of these sapphirinegranulite‘s has been constrained through
the use of thermocalcprogram.Temperature of formation of sapphirine-spinel
assemblages is high, around 800 °C, and pressure ranges from 5-7 kbars, suggesting that
sapphirine formation took place during decompression stage.
Ali Mohammad Qaid and Basavarajappa (2008) studied the VNIR, SWIR and
TIRbands of Multispectral Remote Sensing Satellite images such as ASTER and
Landsat-7 ETM+ to reveal their capabilities in mapping hydrothermal alterations and
otherPrecambrian rocks in North East of Hajjah, Yemen. The results of the
chemicalanalyses revealed high anomalies of potentially economic minerals like Au, Ni,
Cuand Zn. Empirical Line Method on ASTER and ETM+ showed high
satisfactoryresults. PCA, band ratio, lineaments analyses and laboratory spectral
reflectanceyielded a good correlation with the marked areas in presence of
hydrothermallyaltered zones. In the band ratios 5/7 and 3/1 of ETM+ and their equivalent
4/6 and 2/1of ASTER data altered clays and iron oxide were mapped successfully.
Tangestani and Hosseinjani (2008) used Spectral Angle Mapping (SAM) and
LinearSpectral Unmixing (LSU) algorithms to map alteration minerals using the
imagespectra and the spectra selected from USGS library. Spectra of the image
wereextracted using the "spectral end-member selection" procedures, including
MinimumNoise Fraction (MNF), Pixel Purity Index (PPI) and n-dimensional
visualization.Linear Spectral Unmixing (LSU) using the image spectra obtained

31
reasonable resultsand successfully discriminated pixels with highest proportions of
alteration minerals, around copper deposits; while the abundance values of endmembers
selected from theUSGS spectral library were not satisfied for output pixels. The study
concluded thatoutputs obtained from the SAM and LSU algorithms were more reliable
when usingthe ASTER image spectra in comparison to using spectra from the USGS
library.Furthermore, LSU and SAM algorithms discriminated similar regions for
eachalteration zone when using the image spectra.
Ian Graham et al., (2008). Recent discoveries over the last decade of new gemfields,
exploitation of new and existing deposits, and application of relatively new techniques
have greatly increased our knowledge of the basalt-derived gem sapphire–ruby–zircon
deposits in West Pacific continental margins. they also critically review existing data on
the gem corundum deposits, in order to further refine a model for their origin Some fields
only produce a simple eruptive and zircon/corundum crystallization event while others
contained multiple eruptive events, but only one or two zircon crystallization events.
Ali et al., (2009) use the spectral reflectance of 18 samples fromthe Precambrian
basement for mapping the mineral resources in the north east ofHajjah, here the authors
tried to map the altered system using VNIR-SWIR regions ofelectromagnetic spectrum
and said reflectance is a physical property of materials thatdescribes how light in a
continuous electromagnetic spectrum interacts with thematerial.
Raja et al., (2010) The spectral absorption characters of magnetite iron ore of study area
are studied by the collection of spectral signatures using portable field based Ground
Truth ASD(Analytical Spectral Device) Spectroradiometer working in the wavelength
range of 350-2500nm with 10 nm band widths.The results of analyses in the
Hyperspectral of Magnetite Iron ore is strong absorption in 0.91.0μm , (VNIR)
wavelength regions and compared with the spectral library like this USGS, JPL(Jet
Propulsion Laboratory), and JHU(Johns Hopkins Library). The result of analysis for
magnetite iron ore is best matched between laboratory hyperspectral signature and
library hyperspectral signature

32
Narayana and Pavanaguru, (2013) Khammam Schist Belt in Andhra Pradesh is
considered as a northern extension of the Nellore Schist Belt (NSB). Both KSB and NSB
are referred to a single unit of 600 km long westvergent Nellore-Khammam Schist Belt
(NKSB) occurring as a paleo - proterozoic/late archaean greenstone belt on the basis of
similar geological and structural setup in the Precambrian terrain of South India The
Nellore Khammam Schist Belt (NKSB) is considered to be the equivalent of Sargur
Schist Belt (3.3 Ga,).The pelitic meta-sediments such as sillimanite-kyaniteschists,
sillimanite-cordierite orthopyroxene- corundum bearing rocks, pegmatites and banded
iron formations (quart-magnetites).The KSB is endowed with economically viable
corundum (ruby variety) and podiform chromite occurrences; however, they are
significantly controlled by both lithology and structure.
Basavarajappa et al., (2015) used Landsat 7 ETM+ for discriminationof Banded
Magnetite Quartzite and associated Precambrian Rock around Chkkanayakanahalli area
in the southern part Chitradurga Schist Belt. Here theauthors implemented different
image processing method like PCA, Mineral Composite and Band Ratio to delineate
Manganese, Iron and Limestone deposits ofthe study area.
Basavarajappa et al., (2017) analyzed the spectral sensitivity of Visible to SWIR region
of electromagnetic spectrum for Komatiite samples from the Kummanagattaarea,
Gattihosahalli Schist Belt Chitradurga using ASD spectral radiometer. Here theauthors
given application of spectral signature obtained in the SWIR region andabsorption in the
wavelength region 1500 nm to 2500nm.
Basavarajappa et al., (2017) recently carried out the spectral studies for the Corundum
bearing lithounits of the Arisikere area using ASD spectral radiometer and laterally did
the Petrographic studies to identify the corundum presence in the Amphibolite schist
rock.
Manjunatha and Basavarajappa (2017) they carried out hyperspectral charectrization
and mapping of iron ore deposits in Chitradurga district. ASD spectral radiometer and
laterally did the Petrographic studies to identify the iron presence and deposited in the
parts of chitradurga district.
33
Jeevan and Basavarajappa (2018) recently carried out the spectral studies for the
hydrothermal alteration zone of southern part of Chitradurga schist belt. ASD spectral
radiometer data and Hyperspectral Remote Sensing data in field and laboratory environ
ment and did the image processing it is helps to identify the hydrothermal alteration
zones.
Chris Yakymchuk and Kristoffer Szilas (2018). Corundum is known to have formed in
situ within Archean metamorphic rocks at several localities in the North Atlantic Craton
of Greenland they studied two types of corundum bearing horizons one is Maniitsoq
region, where kyanite paragneiss hosts ruby corundum, and second is Nuuk region, where
sillimanite gneiss hosts ruby corundum. The bulk-rock geochemistry of the ruby-bearing
rocks is consistent with significant depletion of SiO2 in combination with addition of
Al2O3, MgO, K2O, Th and Sr relative to an assumed aluminous precursor metapelite.
1.15.1. EARLIER WORKS PERTAINING ON STUDY AREA
Foote, (1886) first gave the name ‗Dharwar‘ to the highly altered crystalline schists of
Archaean age and grouped them in to separate system, younger than the associated
granitoid gneisses, having been laid over the eroded edges of the gneisses
unconformably.
Smeeth, (1916) classified the Dharwar Succession in to two broad division- an older
hornblendic and a younger chloritic division. This proved convenient for mapping and for
representing the two distinct associations – one largely volcanic occupying
stratigraphically lower position and other mainly sedimentary, made up of argillite,
phyllite, limestone and greywacke, forming a younger less metamorphosed, and
andchloritic group occupying the upper part of Dharwar Craton.
Fermor, (1909) grouped the Archaean provinces of India in to Charnockitic and
noncharnockitic regions based on the charnockitisation occurred in the southern India.
Ram Rao (1940) and Pichumuthu (1946) based on the presence of the unconformities
and Conglomerate within the succession classified Dharwar system in to three groups-
Lower, Middle and Upper.

34
Radhakrishna, (1967) mentioned that Dharwar itself undergone more than one orogenic
cycle hence he disagreed the classification made by using the prefixes upper, middle and
lower. Based on lithostratigraphy and classification of Dharwar in to five series he treated
the basement for the dharwar is peninsular gneisses.
The Precambrian terrains in worldwide occurrences and compared to southern India
made in to two broad categories namely low greenstone and high grade granulite terrain
(Radhakrishna and Vasudev 1977). Later Chadwick et al., (1981) considered the
above mentioned terminology cumbersome prefer to describe the terrains as composed of
gneiss and supracrustal rocks.
In the recent year a new classification has been proposed based on the rock type and the
order of superposition following the internationally accepted code of stratigraphic
nomenclature, the entire Dharwar succession is divided in to two main groups- the
Bababudan group occupying a basal position and the Chitradurga group an upper
position.
Schistose rocks were first separated from the granitic gneiss; all the schists are stretched
linearly grouped under the Dharwar system. The first attempt in the past years divide the
supracrustal of the craton into the Dharwar type of the western block and Keewatian type
of eastern block these blocks are separated geologically the linear Closepet granite
(Anhaeusser et al., 1969; Ramkrishnan et al., 1976; Swami Nath et al.,
1976).Viswanatha and Ramakrishnan (1976) distinguished a third unit called it as
Sargur group of rocks.
The occurrence of large volume of clastic sediments from shallow water shelf horizon
and conglomerate distinguishes the Dharwar Supercrustals from the greenstone belts of
other shield area. Therefore these are named as Dharwar type greenstone (Shackleton
1976, Goodwin 1974); younger greenstones (Radhkrishna1976, Radhakrishna and
Vasudev 1977); secondary greenstones (Glikson, 1976) and Geosynclinals piles (Naqvi,
1978). Ramakrishnan et al., 1976 dissociate these belts from the greenstone concept and
designated Proterozoic basins and geosynclines together as Dharwar Super group.

35
Peninsular Gneiss are controversial and many workers tried to establish therelative age of
the gneiss and schists since the two rock types occur together. Smeeth(1916),
SampathIyengar(1920), Fermor (1936), Ram Rao (1936), Pichamuthu(1947) and
Srinivasan and Sreenivas (1968) found numerous instance of gneissic intrusion into the
schists and therefore they considered the schistose formation to be older.
According to Foote (1886, 1900), Radhakrishna (1967, 1976, 1977), Nautiyal (1966)
and Iyengar and Jayaram (1970) the basement nature Peninsular Gneiss Complex
overlain by the greenstone rocks is the oldest. Further there is evidence of post dharwar
mobilization of older granite gneiss producing local intrusive contacts with the overlying
Dharwar rocks. A gradual withdrawal from the above extreme position is evident and it
has been suggested that gneisses while intruding the high-grade schist form the basement
of the younger schist (Radhakrishna 1977, Swami Nath et al., 1976, Ramakrishnan et
al., 1978). Picharnuthu (1951), Naganna (1975), Radhakrishna (1967), Srinivasan
and Sreenivas (1968) have been worked for studying the Stratigraphy, Structure and
Mineral deposits of the study area: Devaraju and Anantamurthy (1977, 1984) have
studied and done the mapping of manganese and iron ores and carbonates of the southern
part of Chitradurga schist belt. Mukhopadhyay and Baral (1974) explained the
structural and intra-tectonic history of the study area.
1.16. OUTLINE OF THE THESIS
The present work of ―Hyperspectral and Geochemical Signatures on Corundum Bearing
Rocks in part of Southern Karnataka, India‖ involves the evaluation of various
fields/high-tech tools and technologies. These various techniques of the work undertaken
in the present studyare presented in 7 chapters. The relevant tables and figures in
different chapters have been prepared using appropriate software‘s and hardware‘s.
There are 7 chapters, which consolidate the thesis and help in achieving theaim and
objectives of this research. Brief descriptions of these chapters are presented as follows:
Chapter 1 Introduction deals with the research problem, Basics of mineral Corundum,
nomenclature, internal structure, petro- chemical charectistics and types of Corundum.
Basic software‘s used in RemoteSensing, Hyperspectral Radiometer. The Objectives and

36
Methodology of thepresent study are listed and given the brief detail on the location of
the study area. Detailed collection of base line information, previous literature undertaken
byvarious authors and scientists on Hyperspectral Remote Sensing spectral signatures has
beendiscussed in this chapter.
Chapter 2 Deals with the detail explain geology of the study area, explains thelitho-units
in detail, Geological settings & regional traverses and the corundum bearing lithology
and contacts with physiographic setting, origin and occurances of corundum minerals,
geomorphologies tectonic setting of the study area and detail location map of the study
area.
Chapter 3 Deals with information on field investigations, sample collections and field
photos, Petrography for the selected rock samples collected during the fieldinvestigation.
Ground truth chek using GPS and base maps of the study area.
Chapter 4 Deals with the concentrates on geochemical signatures and charectistics of
corundum bearing litho units of the study area. Geochemistry XRF analysis using
PANalytical Epsilon3 Omnian software‘s helps to find out a whole rock geochemistry
data. Origin pro 8.5 and TRIDRAW saftwares give the results bring Chemical
characteristics, genisis and discrimination of corundum bearing rocks. This Result shows
purity of the corundum mineral present in the Precambrian basement rocks of the
Southern Karnataka.
Chapter 5 Deals with the Spectral signature measures all types of wavelengths that
reflect, absorb, transmit and emit electromagnetic energy from the objects of the earth
surface. Hyperspectral signatures analyses for all samples were carried out using Lab
Spectro-radiometer instrument (Spectral Evolution SR-3500). Spectro-radiometer
instrument has the ability to measure the spectral signatures of different rocks/ minerals.
The SR-3500 operate in the wavelength range of 350–2500 nm andDARWin SP.V.1.3.0
software is well utilized in analyzing each spectral curves obtained from the collected
samples (average of 4 spectral curves from each samples) and well correlated with the
standard curves of USGS, JPL and JHU.

37
Chapter 6 gives overall the result and discussion and correlate the geochemistry data and
hyperspectral signature data correlated with help of software‘s.
Chapter 7 highlights the overall summary, conclusions on the results and
recommendations of the proposed research study.

38
CHAPTER-II
CORUNDUM LOCATIONS AND GEOLOGICAL SETTING OF THE
STUDY AREA
2.1. GEOLOGY OF INDIA
The Geological History of India began with the geographical transformation of other
parts of the earth, to be precise, 4.57 Ga (billion years back). India is famous for its
varied geological features. Various parts of India are made up of rocks of all categories of
several geologic periods (Ramakrishnan and Vaidyanadhan., 2010). A few of the rocks
are poorly malformed and metamorphosed. At the same time, other types of rocks are
newly silted alluvial soils that are still to go through chemical and physical changes
(Radhakrishna and Naqvi., 1986). Source of minerals of significant diversity is seen in
the subcontinent area in substantial amount. Even the fossil evidences are remarkable that
contain invertebrates, stromatolites, and plant and vertebrates fossils.
To begin with, the Deccan Trap encompasses nearly the whole area of
Maharashtra and parts of Karnataka, Gujarat, Andhra Pradesh, and Madhya Pradesh to
some extent. It is assumed that the Deccan Trap was created as a consequence of sub
aerial volcanic operations related to the tectonic shift in this portion of the earth in the
Mesozoic period (Ramakrishnan and Vaidyanadhan., 2010). This is the reason why rocks
seen in this area are usually of igneous category. At the time of its passage to the north
following its separation from the remainder of Gondwana, the Indian tectonic plate went
above a geologic hotspot, which is known as the Reunion hotspot (Radhakrishna and
Naqvi., 1986). This resulted in widespread melting below the Indian craton. The melted
materials penetrated the shell of the craton in a huge flood basalt occurrence, forming
what is named as the Deccan Trap. It is also believed that Reunion Hotspot resulted in the
partition of India and Madagascar. The Vindhyan and Gondwana contain within its
crease areas of Chhattisgarh, Madhya Pradesh, Bihar, Orissa, Andhra Pradesh, West
Bengal, Jammu and Kashmir, Maharashtra , Himachal Pradesh, Punjab, Uttaranchal, and
Rajasthan. The GondwanaSupergroup creates an exclusive series of fluviatile stones
deposited in Permo-Carboniferous period. Rajmahal hills and Sone and Damodar river

39
basins in the eastern India are reservoirs of the Gondwana rocks (Swaminath and
Ramakrishnan, 1981).
The oldest stage of tectonic evolution was identified by the chilling and hardening
of the outermost layer of the shell of the earth in the Archaean period (earlier than 2.5
billion years), which is characterized by the presence of granites and gneisses,
particularly on the peninsular area (Basavarajappa., 1992; Rama Rao, 1945;
Ravindrakumar, 1982; Srikantappa and Hensen., 1992). These rocks create the center of
the Indian craton. The Aravalli Mountain Range is the remains of a prehistoric
Proterozoic geological formation, known as the Aravalli-Delhi geologic formation, which
coupled the two earlier parts that comprise the Indian craton (Ramakrishnan and
Vaidyanadhan., 2010). It stretches for about 311 miles or 500 km from its northernmost
tip to remote hills and stony crests into Haryana, culminating close to Delhi
(Radhakrishna and Naqvi., 1986).
2.1.1. PRECAMBRIAN SUPER-EON
A substantial territory of peninsular India, which is also known as the Indian Shield,
comprises schists and Archean gneisses and these are the earliest forms of rocks seen in
India. The Precambrian rocks of India are categorized into two systems and they are as
follows. The Archean System the Dharwar System the stones of the Dharwar System are
mostly sedimentary rocks. They are typically found in Mysore and Bellary in Karnataka
and Aravalli Mountain Range, Rajputana, Rajasthan. These rocks serve as sources of
minerals like iron ore and manganese. Gold is found in the Kolar gold mines in Kolar,
Karnataka (Ramakrishnan and Vaidyanadhan., 2010) (Basavarajappa., 1992; Rama Rao,
1945; Ravindrakumar, 1982; Srikantappa and Hensen., 1992). The Vaikrita System,
located to the west and north of India, which exists in Kumaon, Hundes, and Spiti
territories, the Shillong sequence in Assam and the Dailing sequence in Sikkim, are
assumed to be of the equal age as the Dharwarsystem.The gneisses or metamorphic
stones can be further categorized into the Bundelkhand gneiss, the Bengal gneiss, and the
Nilgiri gneiss. The Niligiri system is made up of Charnockites varying from granites to
granular intrusive rocks (Swaminath and Ramakrishnan, 1981).

40
2.1.2. PHANEROZOIC
Lower Paleozoic – Stones of the oldest Cambrian era are seen in Spiti in the central
Himalayan ranges and the Salt range in Punjab. These areas comprise a dense series of
fossilized layers. The Pseudomorph Area in the Salt Range is made up of sandstones and
dolomites (Radhakrishna and Naqvi., 1986). The sediments in Spiti are named as
Haimanta system and they are made up of dolomitic limestones, micaceous quartzite, and
slates. The Ordovician stones consist of limestones, flexible shales, quartzites, red
quartzites, puddingstones, and sandstones. Silurian stones which include distinctive
Siluria fauna are also seen in the Vihi district in Kashmir (Ramakrishnan and
Vaidyanadhan., 2010).
Upper Paleozoic: Corals and Devonian fossils are seen in black-colored calciferous
limestone in the Chitral region and grey-colored calciferous sedimentary rocks in the
Central Himalayan Mountain Ranges. The Carboniferous consists of two separate series
and they are - lower Carboniferous Lipak and upper Carboniferous (Swaminath and
Ramakrishnan, 1981). Trilobites and brachiopods fossils are seen in the calcareous and
arenaceous stones of the Lipak sequence. In Kashmir, the Syringothyris limestone also is
a part of the Lipak. The genus of limestones is broadly denoted as productus limestone.
This limestone has its source in the ocean and can be categorized into the Late Permian
Chideru (with high ammonite content), the Middle Permian Amb division, and the Late
Middle PermainVirgal (Ramakrishnan and Vaidyanadhan. 2010).
2.1.3. MESOZOIC
During the Triassic periods, the Ceratitestonebeds were formed, which derived their
name from the ammonite ceratite. They comprise marls, calcareous sandstones, and
sandy limestones. The Jurassic comprises two separate divisions – the upper Jurassic and
the middle Jurassic. The Upper Jurassic is characterized by the black shales in Spiti and
expanses from Sikkim to the Karakoram. Cretaceous stones encompass a huge territory in
India.In South India, the sedimentary rocks are categorized into four types; the Ariyalur,
the Niniyur, the Utatur, and the Trichinopoly phases (Ramakrishnan and Vaidyanadhan.,
2010).

41
Fig.2.1.Geological map of India (after Geological Survey of India, 1993).
2.1.4. CENOZOIC
Tertiary period – This is the era when the Himalayan geological process started and the
volcanic activities related to the Deccan Traps gone on. The rocks of this period have
priceless deposits of coal and petroleum. Granites or sandstones are seen in Punjab. In
Shimla, three types of stones are found – the Sabathu Series (Grey and red shales), the
Kasauli Series (sandstones), and the DagshaiSeries (bright red clays). You will see
Nummulitic limestone in the Khasi hills to the east of Assam. Beside the foothills of the

42
Himalayas, there are puddingstones, sandstones, and shales, collectively known as the
Siwalik Molasse (Ramakrishnan and Vaidyanadhan., 2010).
Quaternary Period – The alluvial soil seen in the Indo-Gangetic basin is of this period.
The alluvial deposits are categorized into older alluvium and newer alluvium. The newer
alluvial soil is known as Khaddar and the older alluvial soil is known as Bhangar. This
soil is worn down from the Himalayas and is one of the productive soils in the country
(Ramakrishnan and Vaidyanadhan., 2010).
2.2. GEOLOGY OF SOUTHERN INDIA
The high-grade metamorphic rocks of the Precambrian terrain of south India is
predominately composed of orthopyroxene bearing, greenish grey to brownish grey
coloured, greasy looking rocks, generally termed as Charnockites (Holland 1900). Based
on petrographic and mineralogical studies, these rocks have been classified as
chamockitic, chamo-enderbitic and enderbitic granulites which show major and trace
element composition of granitic, tonalitic to trondhjemitic composition. Associated with
these rocks are numerous basic granulites (two pyroxene-plagioclase ± garnet granulites)
and ultramafic rocks. Quartz-plagioclase-sillimanite/ kyanite-k-feldspar-gamet
(khondalites); quartzplagioclase- k-feldspar -garnet bearing gneisses (leptynites) and
other metasedimentary like banded magnetite quartzite, marbles and quartzite occur
associated with chamockites charnoeuderbites. The southern Indian Peninsular shield has
been divided into the Dharwar Cratonic nuclei, surroimded by mobile belts of varying
ages (Radhakrishna and Naqvi, 1986). The granulite facies rocks in southern India is
divided into two distinct crustal blocks viz. Northern Granulite Terrain (NGT) and
Southem Granulite Terrain (SGT), separated by a major E-W trending Palghat Cauvery
Shear System (PCSS) (Fig.2.1). The Archaean Dharwarcraton (DC) is essentially
composed of granite-greenstone belts within the peninsular gneissic complex in the
central part with granulite facies rocks occurring all along the western and southern
margins of the craton. These granulites are distinctly of Archaean age and considered to
be post-accretional type granulites (protoliths age of 3.400.m.y) and metamorphosed
around 2500.m.y. (Peucat et al., 1989). These granulites are variously termed as Biligiri
43
Rangan Granulites (BRG) Basavarajappa and Srikantappa., 2014, Satnur-Halagur
Granulites (SHG), Male Mahadeshwara Granulites (MMG), including the Mercara
Granulites (MG). In addition to these, the late Archaeansyn-accretional type of granulites
(accreted and metamorphosed around 2500 m.y. ago), termed as the Nilgiri Granulite
(NG) and Salem- Madras Granulites (SMG) occur within the NGT. The Moyar-Bhavani
shear zone (MBSZ), which separates the early-Archaean DC with the late Archaean NG
is considered as a major terrane boundary in southem India (Srikantappa et al., 1986;
Raith et al., 1990; 1999).The southern granulite terrain (SGT), also termed as Pandiyan
mobile belt, (PMB;Ramakrishnan, 1993 and 1998) include chamockites, both
banded/gneissic and massivetypes, two pyroxene granulites interlayered with high grade
homblende-biotite gneisses.Pre-deformational, pre-metamorphic intrusives of" peridotite-
pyroxenite gabbroanorthosite complexes are significant. Post-deformational, post-
metamorphic intrusives gabbro-anorthosite plutons to alkali carbonatite complexes and
granite plutons as wellas dolerite dyke (Gopalakrishnan, 1994). Within the SGT, different
granulite blocks like Madurai Granulite block, Kodaikanal Granulite Block (KGB)
bounded by Palghat Cauvery Shear Zone (PCSZ) in the north and Achankovil Shear
Zone (ACSZ) in the south occur. The Kerala Khondalite belt (KKB), south of the ACSZ
upto Kannyakumari is composed of two granuliteblock viz., Trivandrum Granulite Block
(TGB) and Nagercoil Granulite Block (NGB) (Srikantappa et al.,1985; Yoshida and
Santosh, 1996). The southern granulite terrain (SGT) comprises ancrustal domains of
contrasting composition and tectonothermal evolution (Buhl, 1987;Peucat et al., 1989;
Choudary et al., 1992; Harris et al., 1994; Raith et al., 1999).Two types of chamo-
enderbiticgranulites have been recorded in the Precambrian terrane of south India
viz..Massive Banded Chamockite (MBC) and Incipient Chamockite (IC). Patchy
charnockites of Kabbaldurga and Kerala. Charnoenerbites, Basavarajappa., 1992; and
Prekash Narasimha., 1992; sheared controlled incipient charnockites of Kollegala Shear
Zone (KSZ) in Northern Granulite terrain of Biligirirangan Hill ranges Basavarajappa et
al., 1992; Basavarajappa., 2015.
"Massive/Banded" Chamockite (MBC): The medium to coarse grained, Massive Banded
Charnockite (MBC), which are generally massive (look homogeneous in outcrop occur
asmappable units) covering large areas and generally occupy upland regions (could be

44
upliftedmasses during neotectonism). Numerous basic enclaves occur as boundins or
layers parallelto foliation planes imparting banded structures in the field. These rocks
show evidence of atleast two periods of deformation as seen in BiligjriRangan granulite
and Nilgiri granulite inthe northern granulite terrain (NGT). Typical examples of Massive
to Banded Chamockites (MBC) occur in the Biligiri Rangan Granulite (BRG), Nilgiri
Granulites (NG), Mercaragranulites (MEG) and Kerala Khondalitebeh (KKB)."Incipient"
Chamockite (IC) are orthopyroxene bearing acid granulites which have beendeveloped
locally as veins, patches or lenses within the predominately amphibolite faciesgneisses.
IC are considered to represent an arrested stage of transformation of an amphibolite
facies gneiss to granulite. Two typical examples of IC formation documented inthe
Precambrian terrane of southem India viz. The protoliths for the Kabbai type
incipientchamockite veining is an ortho-gneiss (Pichamutu, 1960; Janardhan et al., 1979;
Stable etal., 1987), whereas in the Ponmudi type, it is a para-gneiss (Srikantappa et al.,
1985; Ravindra Kumar et al., 1985; Hansen et al., 1987; Santosh et al., 1991).
South Indian Precambrian crystalline complex consists of schistose and gneissose
type rocks form the hypogene series by Newbold in 1846. Bruse Foot (1886) separated
the crystalline schistose rock from the association of gneisses and named it as ‗Dharwar
System‘ to include all the schistose rocks. The ‗Great Eparchaean Unconformity‘
underling in the gneisses and schistose makes the Dharwar schist group same as
crystalline gneisses of Archaean age (Holland 1900). Fermor (1909) while endorsing the
thought of Holland modified the term Dharwar to embrace all meta-sedimentary schists
lying below the unconformity. Later with respect to lithological forms Smeeth (1916)
divided the Dharwars in to two groups- a lower hornblendic group and an upper chloritic
group. Smith‘s classification is totally agreed by Jayaram (1920). An Archean province
of Indian is divided as Charnokite and Non- charnokite region by Fermor (1936).
RamoRao (1940) identified different group of schist belt and he made this schistose in to
five groups and presented three fold classification of the Dharwar system. Nautiyal
(1966) divided the Dharwars in to Upper, Middle and Lower with respect to lithology,
tectonic cycle and metamorphism. Radhakrishna (1967) after field studies recognized the
number of orogenic cycle within in the Dharwar region itself hence he said it is improper

45
method to give the term upper, middle and lower. Further while classifying he considered
the Peninsular Gneisses as the basement for the Dharwar group.
In 1946 Pichamuthu investigated a geosynclinals development in the Dharwar
group and given the detail about two cycle of sedimentation with attendant magmatism.
Srinivasan and Sreenivas in 1968 recorded a geosynclinals history in Chitradurga Schist
Belt starting with a pre-geosynclinal shelf facies, followed by a flysh-geosynclinals facies
and finally ending with the apogeosynclinalmolasse-faceis. In 1972 based on the
atmospheric evolution and tectono-magmatic activity they divided Dharwar in to four
divisions.
Radhakrishna and Vasudev (1977) compared the Precambrian terrain of south
India to the similar ones in the rest of the world and they come across the two main
categories called granite-greenstone of low grade rock and granulite terrains of high
grade rock. Chadwick et al 1981considered this terminologies and oriented to describe
the terrains as composed of gneisses and supracrustal rocks.Anhaeusser et al (1969),
Ramakrishnan, Swaminath (1976) following the green belt concepts, made these
schistose rocks in to two groups of supracrustal unit named as Dharwar type of Western
Block and Keewatian type of Eastern Block and these blocks are separated by linear
closepet granite. The Sargur group of supracrustal rocks with their distinct high grade
metamorphic characteristics and Ramakrishna et al. 1976 and Swaminath et al. 1976 were
compared these rocks in to high grade metamorphites of other cratontaken the name
sargursupracrustal rocks, but Naqvi in 1978 treats this high grades also as a true
greenstones, to resolve this conflicts Ramakrishna and Swaminath (1981) suggested to
treat these rocks as ancient supracrustal (Bridgwater et al.1974). In the later part Glikson
(1976) also suggested not to consider the oldest supracrustal occurring as an enclaves and
xenoliths within the peninsular gneiss in to the primary greenstone belt.

46
Fig.2.2. Geological map of Southern India (after Chardon et al., 2008).
2.3. DHARWAR CRATON
The Dharwar Cratonis bounded in the N 12º 00' to 17º 00' latitude and E 74º 00'
to 79º 00' longitude and geographically it covers an area of~4,00,000 km2. Spatially we
can see the Proterozoic sediments and Deccan traps in the northern end, Cuddapah basin
and Easter Ghats Mobile Belt (EGMB) towards the eastern margin, the fault planes
dipping steeply covered by the Arabian sea is occurred in the western side and Southern
Granulite is mostly covers over the southern end of the peninsula demarcates the
Dharwar super group with well noticed boundaries. Dharwar Craton made of greenstone
belts, supracrustal and granitic gneiss basements are well exposed and most of the green
stone belts are mineralized by gold and copper sulfide deposits. Radhakrishnaet al.
(1967); Narayanaswamyet al. (1970);Swaminath and Ramakrishnan, 1981; Naqviet al.

47
1974explained the two different green schist rocks one with preserving the oldest rocks
that made up the early continental crust and another with the younger greenstone belts
divided the main Dharwar Craton into two blocks named as, eastern and western blocks
(Figure 2.3) considered that these two blocks were separated byelongated K-rich plutonic
bodies known as ―Closepet Granites‖ of an age 2500 Ma old. Closepet Granites were
emplaced along a network of vertical shear zones representing boundary between two
blocks (Moyenet al. 2003).
Fig.2.3. Geological map of Dharwar Craton (after Srinivasan., 1991).

48
2.4. GEOLOGY OF KARNATAKA
Karnataka state is located in the wedge shaped Indian peninsular as per the
geological map prepared by Geological Survey of India (1981) and extents the area of
2,10,000 Km2 representing the major parts of Dharwar Craton (Karnataka Craton)
(Swaminath and Ramakrishnan, 1981). Geologically, it consists of linear to curvilinear
subparallel series of schist belts within the peninsular gneiss. These schist belts are
bounded by (i) Sedimentary basins of Kaladgi and Badami group and Deccan volcanics
in the north (ii) to the west by phanerozoic sediments along the coast and (iii) by the
Charnockite Biligiri-Ranganahill ranges in the south and north-eastern parts of Koorg hill
ranges and parts of Mysore (Basavarajappa., 1992; Rama Rao, 1945; Ravindrakumar,
1982; Srikantappa and Hensen., 1992).
The geological history of Karnataka is mainly confined to the two major oldest
eras namely the Archaean and Proterozoic. Minor sediments of recent age are also
exposed along the western coastal margin according to the regional changes lithological
variations differences in volcano-sedimentary environments and grades of
metamorphism, the Karnataka Craton can be divided into the two blocks as i) the western
block, characterized by a larger (Dharwar type) schist belts, showing evidences of having
accumulated in distinct sedimentary basins and, ii) An Eastern block, characterized by
reworked and mobilized gneisses with remnants and slivers of schist belt (Kolar type)
which are auriferous and developed in an oceanic environment. The N-S trending
Closepet granite demarcates the boundary between the two blocks (Fig.2.4) (Jayananda et
al., 1995).
The early Precambrian rocks preserved in the Karnataka Craton encompassing
cycles of magmatism, volcanism, sedimentation, metamorphism and deformation. The
Dharwar Craton is described as a compact elliptical region bordered by a string of K-rich
granites (Radhakrishna and Naqvi., 1986). The present work is concerned with the
application of Hyperspectral Remote Sensing and GIS on major rock/ mineral/ ore types
in Chitradurga district, Dharwar Craton. The granite-greenstone belts which constitute the
Dharwar nuclei have been well studied and it can be stated based on the earlier workers

49
that the Dharwar Craton can be divided into two groups: the older Sargur group and the
younger Dharwar super group (Swaminath and Ramakrishna, 1981).
Fig.2.4. Geological map of Karnataka (after Radhakrishna et al., 1994)

50
The age of Sargur Supracustal sequence ranges between 3450 and 3100m.y
(Nutman et al., 1992) and consists of volcano sedimentary rocks intruded by ultramafic,
mafic complex, peninsular gneisses of 2950-3000m.y separate the older Sargur
Supracrustals from the younger Dharwar greenstone belts. The age of Dharwar super
group is 2900 m.y and consist volcano sedimentary sequence formed in an intra-
continental rift basin setting. The top most sequence of this group gives an age of 2650
m.y (Crawford., 1969). Younger granites intrude these sequences of rocks at 2600 m.y,
which constraints the upper age limit of Dharwars.
Three major categories of Archaean Supracustal sequence of Karnataka are (a)
The ancient Supracustal enclaves (b) The Auriferous Schist belts of Karnataka (c) The
Dharwar type Schist belts of Western Karnataka sequence. The important feature of the
Archaean sequence is their actual N-S trends with convexity towards east. The schist
belts are wider in the north, tapering down towards the south younger and younger
sequences get exposed towards north, one of the explanations offered is that the
peninsula as a whole has got tilted to the north, with the result deeper and deeper sections
are exposed to the south (Radhakrishna and Vaidyanathan., 1997) (Fig.2.4).
2.4.1. CHITRADURGA GROUP
The study area is represented by Chitradurga group which unconformably overlies
the Bababuddan group and PGC. This group comprises of in ascending order Vanivilas,
Ingaldhal and Hiriyur formations (Swaminath and Ramakrishnan., 1981). The Vanivilas
formation exposed along the western margin of the belt includes the Talya conglomerate,
chlorite schist, quartzite limestone, dolomite and banded Mn-Fe chert (Rama Rao., 1962).
These litho-units are well exposed around the Sirankatte gneissic dome. The Ingaldhal
formation comprising basic to acidic lavas, pyroclastics, Banded Iron Formation (BIF)
and fine grained clasts (argillite) is exposed mainly in the south and eastern parts of
Chitradurga (Ramakrishnan and Vaidyanadhan., 2010). The Hiriyur formation is
represented by the greywacke-argillite suite, interspersed with BIF, metabasalt and
polymictic conglomerate. A persistent polymictic conglomerate zone at Kuruba-
Maradikere popularly known as K.M.Kere conglomerate forms the lower unit of this
formation. It is succeeded by the volcanic of Maradihalli, Narenahalu and Bellara areas.

51
The greywacke suite well exposed around Aimangala and Hosakere is characterized by
the presence of polymictic (GSI Memoir., 1981).
2.4.2. SARGUR GROUP
Sargur Group is represented in the Chitradurga belt by a varied assemblage of
lithologies in the sub-belts of Ghattihasahalli, Nagamangala, Mayasandra, Neralakere,
Sasivala, Honakere, Sunkiapur, Javanahalli and Yadiyur-Karighatta which occupy the
flanks and extensions of the main schist belt (GSI Memoir., 1981). These rocks are
isoclinally folded, highly metamorphosed and are devoid of clues as to top and bottom
direction, thus preventing the establishment of their stratigraphic order of superposition
(Ramakrishnan and Vaidyanadhan., 2010).
2.4.3. PENINSULAR GNEISS
Peninsular gneiss was termed to emphasize its extensive distribution throughout
the Indian Peninsula (Smeeth W.F., 1916). This name is widely used to represent the
complex of gneisses and associated granitoids with their own set of pegmatites and
aplites giving evidences of successive injections extending over a long and protracted
period of plutonic activity (Ramakrishnan and Vaidyanadhan., 2010). The Peninsular
Gneiss flanks the schist belt to the east and west and also occurs as diapiric domes within
the belt (GSI Memoir., 1981). In its typical form, the Peninsular Gneiss is a migmatite
consisting of bands of melanosomes and leucosomes. Various degree of mobilization of
the neosomes in the migmatite has given rise to assorted structures such as stromatic,
surreitic, folded, ptygmatic, ophthalmic, schlieric, and nebulitic (Mehnert., 1973). The
gneissic complex encloses several lenticular bodies of ultramafite adjoining and parallel
to the schist belt as near Chikkanayakanahalli. These were considered related to the
geosynclinals episode of the main schist belt (Jayaram B.N., 1965).
2.4.4. DHARWAR SUPERGROUP
Chitradurga schist belt is the only belt in the lower part of the Bababuddan Group,
characterized by rhythmic metabasalt-quartzite suite is well represented. The
Chitradurga Group overlies the Bababuddan Group and Peninsular Gneisses with

52
Table.2.1. Generalized Geological succession of the study area
(After Seshadri et al., in Swaminathan and Ramakrishnan., 1981)
DH
AR
WA
R S
UP
ER
GR
OU
P
CH
ITR
AD
UR
GA
GR
OU
P
Basic dyke gabbro and dolerite Younger granites (Chitradurga, Hosadurga
and Jampalnaikankote)
Hiriyur
Formation
Basic Dykes (Gabbro and Dolerite) Younger granite (Chitradurga,
Hosadurga and J.N.Kote) Greywacke – argillite suit + Basic to
intermediate volcanic Banded ferruginous chert and Polymict
Conglomerates (Aimangala and Holelkere) K.M Kere and G.R.
Halli conglomerates
--------------Disconformity-----------------------
Ingaldhal
Formation
Basic, intermediate/ acid lavas/ pyritiferouschert argillite
Chloriticphyllite
Banded ferrugionouschert Limestone and dolomite
Vanivilas
Formation
Chlorite- biotite + garnet Phyllite/ Quartizite and quartz schist
Talya conglomerate
-------------------Unconformity-----------------------
BA
BA
BU
DA
N
GR
OU
P
AmygdularMetabasalt closely interbeded with cross bedded and ripple marked
quartzite ultramafite (Talc-tremolite chlorite and serpentinite) and thin beds of
iron stones oligomictic conglomerate (Neralakatte)
----------------------------Unconformity--------------------------------------
PGC Peninsular Gnessic Complex
SA
RG
U
R
33
00
M.a
Gattihosahalli belt Fuchsite quartzite with barites Aluminous quartz schist
Meta-ultramafite Amphibolite
Chlorite- biotite + garnet
Phyllite/ Quartzite and quartz schist
Talya conglomerate
-------------------Unconformity------------------------

53
a prominent unconformity and constitutes the major part of the
DharwarSupergroup (Ramakrishnan and Vaidyanadhan., 2010). The Chitradurga Group
extends as a continuous chain of hills/ bandsfrom Dodguni village in the south to
Chitradurga village in the north and further northward, these band were wraps around the
Chitradurga plutonicgranite forming the U-curve of Chitradurga area. The western arm
extends for a short distance up to Mayakondavillage and the eastern arm continues up to
Gadagtalukin the north.
2.4.5. BABABUDAN GROUP
Bababudan group of rocks occupy an area of 2,650 sq.km spread in parts of
Hassan, Shimoga, Dharwar, Chikmagalur, and north districts of Karnataka and neighbor
state Goa. The litho units of Bababudan group commences with basal conglomerate and
quartz phenoclasts resting unconformly on gneissic basement. The Bababudan group is
exposed in the sub-belts of Kibbanahalli, Madadkere-Mayakonda, Halekal and Yadiyur-
Karighatta (GSI Memoir., 1981).
2.5. GEOLOGY OF THE STUDY AREA
South Karnataka is occupied by vast areas of Peninsular Gneiss along with two
prominent superbelts of Bababuddan- Western Ghats-Shimoga and Chitradurga-Gadag
belonging to the Dharwar Super group. In the southern part, there is a group of narrow,
linear schist belts belonging to the older Sargur Group, like Hole Narsipur, Nuggihalli,
Krishnarajpet, Mayasandra, Nagamangala and Melikote, Karighatta as well as
innumerable medium to high-grade schistose enclaves within Peninsular Gneiss, as at
Sargur, Mercara and their extentions in Kerala (Ramakrishnan and Vaidyanadhan., 2010).
Geologically constituted of Southern Karnataka comprises of greenstone-granite belts,
Gneisses and granulites (Swaminath and Ramakrishnan., 1981). Greenstone belts
essentially consist of meta-volcano sedimentary Sequences surrounded and dissected by
Peninsular Gneiss (GSI Memoir., 1981). At the southern end of the craton these give way
to granulite suite of rocks. The craton preserves a billion year orogenic history from 3400
m.a. to 2400 m.a, Younger granites (~2600 Ma) like Chitradurga, Hosadurga, Arsikere
and Banavara occur as isolated plutons in the gneissic country. An undated layered basic

54
intrusion (Konkanahundi or Thagaduru) and a syenite ring intrusion (KunduruBetta) are
also seen. Proterozoic basic dykes are also abundant. Rarely, Neoproterozoic granite
(Chamundi granite) and associated alkaline dykes are seen near Mysore and Harohalli.
Pan-African syenite-carbonatite complexes (e.g., Dharmapuri) (Radhakrishna and Naqvi.,
1986). The oldest Gneiss in Western DharwarCraton is a site of trondhjemitic gneiss with
associated tonolites and granodiorites called as Gorur Gneiss. The gneiss yields whole
rock Rb-Sr and Pb-Pb isochrones at 3300-3600Ma. Still older SHRIMP U-Pb zircon and
other isotopes model ages of 3500 to 3600Ma in Western DharwarCraton do not srelate
to any known rocks, but are suggestive of earlier events (Ramakrishnan and
Vaidyanadhan., 2010).
Fig.2.5. Geological map of the Study area (after Swami Nath et al., 1981).

55
2.6. ORIGIN OF CORUNDUM DEPOSITS
Corundum (sapphire and ruby) is a crystalline form of the aluminum oxide, that can be
found in three main geological environments (Aydogan and Moazzen, 2012): (1)
magmatic, mainly in syenites, monzonites, and lamprophyres; as xenocrysts and in
xenoliths in alkali basalts; but rarely in granites (2) metamorphic, mainly in marbles,
skarns, granulites, cordieritites, gneisses, migmatites, mafic-ultramafic metamorphites,
and metabauxites; and (3) secondary alluvial, colluvial and eluvial deposits. Corundum
crystals are usually closely associated with Tertiary alkaline basalt, basanite, nephelinit,
which occurs as flows, plugs, and pyroclasts (Sutherland, 1998a). They have been found
as corroded megacrysts in these basaltic rocks, along, with numerous xenoliths; including
metasediments, granulite, granite, anorthosite, pyroxenite or lherzolite. Corundum crystal
has been found as inclusion in clinopyroxenocrystal in Nong Bon alkali basalts in eastern
Thailand and in diamond (Kepezhinskas, 2011). Corundum, as a mineral, is encountered
in a range of rocks. It is relatively common in many metamorphic rocks of varied
lithologies and its P–T stability domain is vast. For example, this mineral appears during
forest fires on bauxite soils, and is observed as a high pressure phase in diamonds and
eclogites. Non-gem corundum may also be a hydrothermal alteration product, for
example of andalusite. Because of its chemical composition, it is present in alumina rich,
silica-poor rocks. Corundum–quartz bearing assemblages are rare and these minerals are
usually not in contact. Exceptions, in which quartz and corundum form a stable or
metastable assemblage, are known in high pressure and high temperature granulites and
in hydrothermally altered quartziferous porphyry.
Magmatic deposits Corundum in magmatic deposits is found in plutonic and volcanic
rocks. In plutonic rocks, corundum is associated with rocks deficient in silica and their
pegmatites, especially syenite and nepheline syenite. Corundum is formed by direct
crystallization from the magmatic melt as an accessory mineral phase. The classical
examples are the syenite pluton from Haliburton and Bancroft (Moyd., 1949), and the
Kangayansyenite (Coimbatore district, Madras, India, Hughes 1997). In addition,
aluminous rocks carried as xenoliths by plutonic rocks can lead to the formation of
corundum, as in the xenoliths of biotite schist carried by a monzonite at San Jacinto, in

56
Southern California (Murdoch and Webb 1942). Corundum is found also as an accessory
mineral in porphyry Cu deposits (Botril 1998).
In volcanic rocks, sapphire and less commonly ruby are found in continental alkali basalt
extrusions (Sutherland et al. 1998a). Corundum is found as xenocrysts in lava flows and
plugs of subalkaline olivine basalt, high alumina alkali basalt, and basanite. The sapphire
is blue-green-yellow (BGY) and the deposits only have economic importance because
advanced weathering in tropical regions concentrates sapphire in eluvial and especially
large alluvial placers. Sapphire also occurs in alkaline basic lamprophyre (Brownlow and
Komorowski 1988) as mafic dikes of biotitemonchiquite (lamprophyre characterized by
the abundance of phlogopite and brown amphibole, olivine, clinopyroxene, analcime),
ouachitite and diamond-bearing kimberlite.
Fig.2.6. Corundum Deposition and Process (Giuliani et al., 2014).

57
FIG. 2.7.Classification of Primary Corundum Deposits based on the lithology of the corundum-host rocks.A, The magmatic deposits with their main types. For
each type the origin of ruby and/or sapphire is precised: magmatic versus metamorphic. Photographs respectively 1 courtesy of F. Fontan, 2 and 6 of L.-D.
Bayle, 3 and 5 G. Giuliani, and 4 of S. Rakotosamizanani.
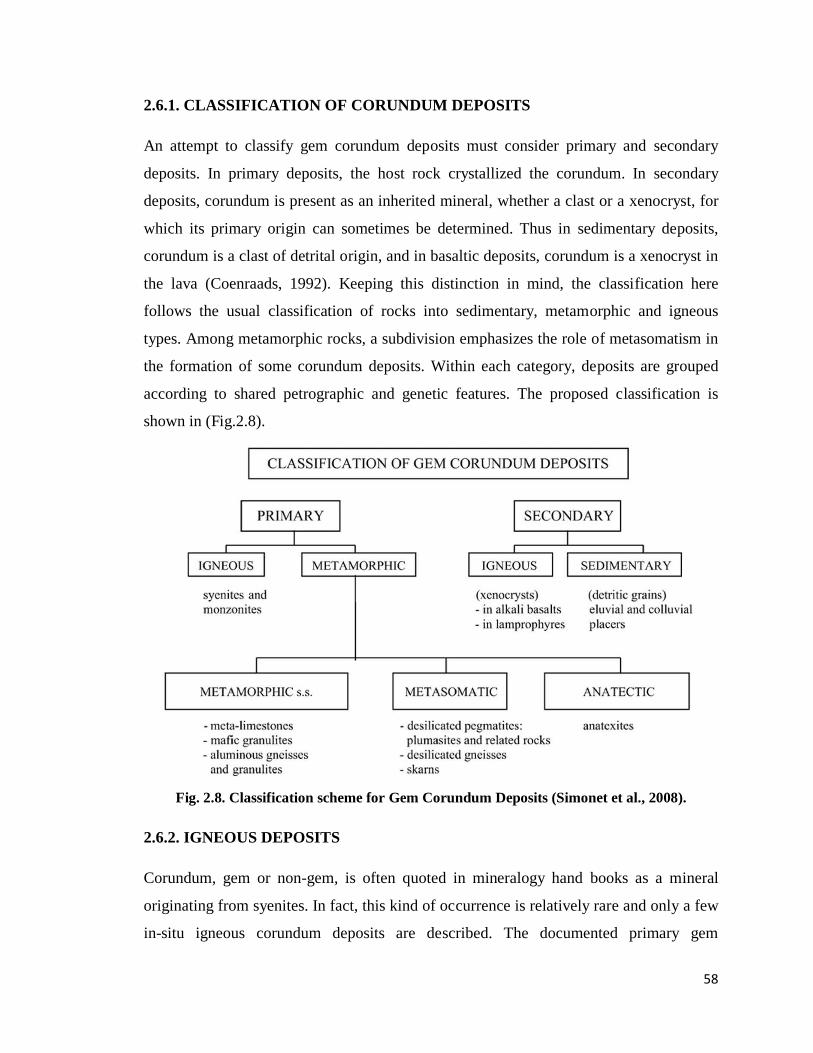
58
2.6.1. CLASSIFICATION OF CORUNDUM DEPOSITS
An attempt to classify gem corundum deposits must consider primary and secondary
deposits. In primary deposits, the host rock crystallized the corundum. In secondary
deposits, corundum is present as an inherited mineral, whether a clast or a xenocryst, for
which its primary origin can sometimes be determined. Thus in sedimentary deposits,
corundum is a clast of detrital origin, and in basaltic deposits, corundum is a xenocryst in
the lava (Coenraads, 1992). Keeping this distinction in mind, the classification here
follows the usual classification of rocks into sedimentary, metamorphic and igneous
types. Among metamorphic rocks, a subdivision emphasizes the role of metasomatism in
the formation of some corundum deposits. Within each category, deposits are grouped
according to shared petrographic and genetic features. The proposed classification is
shown in (Fig.2.8).
Fig. 2.8. Classification scheme for Gem Corundum Deposits (Simonet et al., 2008).
2.6.2. IGNEOUS DEPOSITS
Corundum, gem or non-gem, is often quoted in mineralogy hand books as a mineral
originating from syenites. In fact, this kind of occurrence is relatively rare and only a few
in-situ igneous corundum deposits are described. The documented primary gem

59
corundum deposits include the alkaline igneous rock of the Garba Tula deposit in Central
Kenya (Simonet et al., 2008). Originally believed to be a monzonite, it is now realized
that the rock is a syenite. There, sapphires are mined from a vertical dike emplaced in a
series of biotite and hornblende-bearing gneisses of the Mozambique Belt. Sapphires
display colors from a dark ink blue to a golden yellow, through various shades of blue
and green. Crystals appear as barrels or as truncated bipyramids, and may reach more
than 100mm in length. They contain about 1 wt.% FeO and traces of TiO2 and Ga2O3.
Corundum-bearing magmatic xenoliths have sometimes been noticed in various types of
lava. Brousse and Varet (1966) described sub-gem blue sapphire barrels in anorthoclasite
xenoliths from a trachyte dome in Cantal, and considered these enclaves and the host
trachyte as homogenetic. Robertson and Sutherland (1992) described sapphire–
anorthoclasite xenoliths from a basalt plug in central Queensland, Australia. Upton et al.
(1999) described rare corundum-bearing anorthoclasite xenoliths in alkali basalt sills and
dikes from Scotland. Corundum, of barrel-shaped habit, is dark blue andshows some
characteristics similar to sapphires from basaltic (secondary) deposits. Upton et al. (1999)
considered that these xenoliths have crystallized from a trachytic liquid of mantle origin.
2.6.3. METAMORPHIC DEPOSITS
Metamorphic rocks are a major source of high-quality gem corundum. As a mineral,
corundum is relatively common in these rocks and appears in a wide range of pressure
and temperature conditions. Generally speaking, factors that will allow or prevent the
appearance of corundum are P, T, the protolith mineralogy and chemistry, the presence or
absence of fluids, and their chemical characteristics. This last point emphasizes the role
of metasomatism. The omnipresence of fluids in the Earth's crust means that
metamorphism rarely occurs in a closed system, and metasomatism is critical to the
genesis of many gem corundum deposits. Three sub-categories of metamorphic deposits
are considered here in: metamorphic sandstone, metasomatic and anatectic. In
metamorphic deposits sandstone corundum crystallized as a result of isochemical
metamorphic reactions in silica-poor or alumina-rich rocks. This happened mainly in
closed systems, although in some cases large-scale chemical exchanges may have
assisted crystallization of corundum. However, such chemical exchanges are often

60
difficult to identify and quantify when samples of non-metasomatized protolith are not
available. The geometry of such deposits follows that of the protolith and their size can
be hundreds of m to km in scale. Gem corundum-bearing aluminous gneisses and
granulites are an important source of sapphire, ruby, and other gemstones, and are the
source of major sedimentary deposits, leading to large corundum provinces. The best
known example is that of southern Sri Lanka, where numerous authors recognized the
importance of granulites and charnockites of the Highlands Group as the main source for
this country's alluvial and eluvial deposits. The rare in-situ deposits are corundum-
bearing gneisses containing aluminous minerals such as garnet, spinel, sapphirine,
cordierite and sillimanite. They have been subjected to high temperatures and moderate
pressures (amphibolite facies to low pressure granulite facies). Generally, the existence of
these aluminous minerals is ascribed to the existence of locally Al-enriched layers in the
metasediments, but some authors consider possible a wide-scale desilication owed to
mafic granulites. The Highlands Group, and most of Sri Lanka's Precambrian rocks, are
now largely considered as an eastern extension of the Mozambique Belt. It is therefore
not surprising that the rest of the Mozambique Belt is also known for its granulite-hosted
gem corundum deposits. Ruby and/or sapphire-bearing gneisses are particularly frequent
in southern Kenya (Simonet et al., 2008) and are also the main source of corundum in the
alluvial deposits of Tunduru-Songea (Southern Tanzania) and Ilakaka (Madagascar).
Gem corundum from such granulites is dipyramidal, and more rarely prismatic or tabular.
It is often blue or yellow although virtually all colors may be found. Rubies occurring in
marbles are of high repute for their superior quality, for example the ―pigeon blood‖
color. The chemical composition of rubies from marbles is characterized by a high Cr2O3
content (up to 2.5 wt. %) and a low FeO content (typically less than 0.04wt.%) which is
considered to be responsible for the quality and purity of their red color. Vanadium traces
are also often present. Ruby is sometimes associated with mauve, pink, and more rarely
blue sapphire, and in most cases has rhombohedral or tabular habit, sometimes prismatic
or truncated dipyramidal. Associated minerals include red or blue gem spinel, and various
Al-, Mg or Ca-silicates, as well as sulfides and oxides. This type of deposit must not be
confused with corundum-bearing skarns, which also occur in a marble environment.
Ruby and/or sapphire-bearing marbles occur in Myanmar, Afghanistan (Hughes, 1997),

61
Pakistan, Tajikistan, Nepal, Urals, Tanzania (Morogoro deposits) and Vietnam. The
origin of this type of deposit remains problematic, the main question being that of the
origin of aluminum and chromium. Several authors proposed that non carbonate minerals
in marbles come from mineral impurities in the pre-metamorphic limestone. However,
Kissin (1994) notes that the marble's alumina content is not a critical factor for the
presence of corundum, but that magnesium activity strongly influences the stability of
spinel with regard to corundum. Since it is difficult to explain the presence of detrital
chromian minerals in the pre-metamorphic carbonated sediment, that has been seldom
documented, it is likely that chromium in the marble is of exogenetic origin, which
implies that ruby-bearing marbles are at least partially the result of metasomatism.
Although chromium is usually considered as an immobile element in such conditions, the
mobility of this element can in some cases be high, especially if anions such as F or Cl
are present in the fluid phase. Some authors such as Terekhov et al. (1999) and Koltsov
(2001) advocate a metasomatic origin for this type of deposit. P–T formation conditions
of these deposits are often not precisely known. Koltsov (2001) gives conditions of
amphibolite facies for the formation of ruby in marbles from Kashmir and Afghanistan.
In most cases, the marbles and their host rocks underwent amphibolite to granulite facies
metamorphism. Ruby-bearing mafic granulites are mostly known for their ornamental
qualities, under such names as the ―anyolite‖ from Longido, Tanzania, or the
―rubysmaragdite‖ from North Carolina. Ruby-bearing mafic granulites have also been
described from Chantel in France by (Lasnier, 1977). Faceting-quality rubies are rarely
encountered in this type of deposit, which explains why they are often overlooked as a
ruby source, except in the Losongonoi deposit (Tanzania) which yielded significant
quantities of gemqualityruby (Simonet et al., 2008) and the Chimwadzulu Hills area of
Malawi. Also, the non-transparent star rubies from the Mysore area, Karnataka, India, are
found in an amphibolite. These granulites are generally vivid green rocks because of the
high Cr content of the rock-forming aluminosilicates (pargasitic amphibole, zoisite).
Corundum is pink to dark red and has a typical tabular habit (blades). It is rich in Cr2O3
(up to 1.7 wt.%) and FeO (up to 0.8 wt.%). In most deposits, it is associated with
pargasite, gedrite, calcic plagioclase and spinel. When present, sapphirine is regarded as a
higher-grade mineral than corundum. These rocks result from the hydration of

62
plagioclase-rich rocks (anorthosites, troctolites and norites) under granulite facies
conditions. They are systematically associated with mafic–ultramafic complexes, either
layered intrusions or ophiolitic remnants. Metasomatic deposits result from the
introduction of reactive fluids along a tectonic structure (channelized metasomatism), or
from the accidental contact between two chemically different rocks (contact
metasomatism). In both cases the mineralization is essentially planar and of relatively
small size, with typically a m-scale thickness and a 10 m scale lateral extension. Sharp
mineral zonations with limits parallel to the mineralization plane characterize these types
of deposits. Small-scale metasomatic events responsible for the formation of gem
corundum deposits are usually desilication phenomena. They involve a silica-deficient
rock and a silica- and alumina-rich rock or fluid (silica-aluminous component). The
silica-deficient component can be an ultramafic rock (serpentinite or sagvandite), a mafic
rock, a metacarbonate, or a fluid equilibrated with ultramafic rocks. The silica-aluminous
component can be an intrusive granitic or syenitic pegmatite, gneiss, or a fluid
equilibrated with silicic rocks (meta-pelite, granite, etc...). In most cases, the silica
aluminous component undergoes a desilication, the silica being ―pumped out‖ by the
silica-deficient unit. Alumina, which is less mobile, remains in the protolith and
recrystallizes as Corundum, spinel, kyanite and other alumina-rich silicates. The most
common geological settings are summarized below (Fig.2.10). Plumasites and related
rocks.Plumasite originally described by (Lawson, 1903) is an example of Corundum
bearing metasomatic rock. A plumasitesensustricto consists of greyor bluish Corundum,
oligoclase and biotite, but the term has been widened to include rocks with alkali
feldspars and other minerals. Corundum is usually not of gemquality, except in some
deposits such as the Kinyiki sapphire deposit in southern Kenya. Such rocks result from
the desilication of pegmatites that have intruded ultramafic rocks. Desilication causes
quartz to react out and aids the crystallization of Corundum in the pegmatite.
Concomitant silication of the host ultrabasite causes the development of anthophyllite
and phlogopite ―blackwalls‖ along the pegmatite. Gem corundum-bearing metasomatized
pegmatites closely related to plumasites include Kashmir sapphire deposits (Peretti et al.,
1990) and Umba fancy sapphire deposits in Tanzania. The host rocks in Kashmir and
Umba differ from proper plumasites by different mineral assemblages, the presence of

63
gem quality Corundum, and its colors. Ruby deposits of the Mangare area (Simonet et al.,
2008) originate from more complex desilicationphenomena involving pegmatites and
ultrabasites. Characteristics of the crystals vary from one deposit to the other.
Kinyiki sapphires appear as truncated dipyramids and Kashmir sapphire asdipyramids.
These sapphires contain small amounts of iron (typically <0.5 wt. %FeO) and their blue
color is mostly due to charge transfers between Fe2+
and Ti4+
. Umba sapphires often have
a prismatic habit, and their color as well as their chemical composition varies from one
vein to the other. Rubies from the Mangare area are typically dipyramids and contain up
to 0.4 wt. % Cr2O3 and less than 0.05 wt. % FeO. Metasomatic alteration, including
desilication, can also affect felsic rocks such as gneisses or other quartzofeldspathic rocks
that have been tectonically put in contact with ultramafites. Examples of such rocks
include the Kangerdluarssuk ruby deposit (Greenland), the ―Goodletite‖ of New Zealand,
and some ruby and sapphire deposits of southern Kenya (Simonetet al., 2008).Corundum-
bearing skarns form from reactions between pegmatites, or metapelite-equilibrated fluids,
with metalimestones. The desilication reaction is initiated by the silica-deficient host
rock, which is in this case a meta-carbonate instead of an ultramafic rock. The geometry
of the mineralization, with phyllosilicate ―blackwalls‖, is strikingly similar to that of
plumasitic deposits. Sapphire-bearing skarns have been described from Sri Lanka and
East Africa (Simonet et al., 2008). The south-eastern Madagascar sapphire deposits near
Andranondambo have been described as due to desilicatedpegmatites, but were
reinterpreted as skarns (Peretti and Hahn., 2013). Crystals typically have a dipyramidal
habit. This type of deposit should not be confused with ruby-bearing meta-limestones,
although both types of deposits can co-exist.

64
FIG.2.9. Classification of Primary Corundum Deposits based on the lithology of the corundum-host rocks. B, The metamorphic deposits
with their main types.Photographs respectively 1 to 4, and 6 courtesy of G. Giuliani, 5 and 6 of L.-D. Bayle.

65
2.6.4. SEDIMENTARY DEPOSITS
To the best of our knowledge, there are no examples of authigenic (primary) gem
corundum in sedimentary rocks. Gem corundum sedimentary deposits are eluvial or
colluvial accumulations, alluvial and marine placers. They may or may not be
consolidated depending on their age. Corundum crystals are present as clasts inherited
from other types of deposits. These deposits are a major source of gem corundum
(Garnier et al., 2004a), especially in Sri Lanka, eastern Australia, east Africa. The
formation of gem corundum alluvial deposits obeys the same depositional rules as for
other heavy mineral deposits. Concentration of gem-quality corundum in such deposits is
higher than in primary deposits, due to a filtering process during erosion and transport,
the most included and fractured stones being more rapidly destroyed. (Garnier et al.,
2004a). The formation of gem corundum alluvial deposits obeys the same depositional
rules as for other heavy mineral deposits. Concentration of gem-quality corundum in such
deposits is higher than in primary deposits, due to a filtering process during erosion and
transport, the most included and fractured stones being more rapidly destroyed.
Sutherland et al. (1998a) proposed a genetic model in four stages for the formation of
'magmatic' sapphire from eastern Australia. The lithosphere is displaced above a mantle
plume. A low rate of initial fusion generated felsic magma enriched in volatile elements
in zones where the lithosphere is rich in amphibole, allowing the crystallization of
corundum and zircon. This magma can also be derived from a mantle enriched
inamphibole and mica, or from a mantle enriched in felsic components, at between 45
and 90 km depth. When the lithosphere is located above the plume, a high rate of partial
fusion produces alkali basaltic magma that extracts and carries assemblages with
corundum as xenocrysts and in xenoliths. When the lithosphere moves away from the
plume, the rates of fusion decrease and lead again to the crystallization of corundum and
zircon. This model explains the enrichment of Hf, Nb, and Ta, generally observed in
minerals cogenetic with corundum, and in amphibole veins found in the peridotite
xenoliths (Sutherland et al. 1998b).
The presence of a mantle plume under the lithosphere is a main geodynamic feature for
thegenesis of such "magmatic corundum", but the mechanism of generation of the Al-rich

66
magma is not yet constrained.Pin et al. (2006). Pin et al. (2006) observed that the Si––
Al––Na-dominated bulk composition is similar to that of certain glass inclusions included
in peridotitic xenoliths in alkali basalt. In addition, the extreme enrichment of
incompatible elements in the albitite implies premelting metasomatism by a fluid or a
melt. These rocks are interpreted to be products of very low degree of partial melting of a
harzburgite source previously enriched by carbonatite-related metasomatism. The
presence of volatile phases such as H2O and CO2 may account for the variation of the
solubility of SiO2 and Al2O3 in mantle fluids and the consequent precipitation of
corundum in some batches of felsic magma.
2.7. CORUNDUM LOCATIONS OF THE STUDY AREA
Fig.2.10. Corundum bearing litho-unit locations of the study area.

67
Table.2.2. Samples collected and it’s GPS Location
CHITRADURGA
Sl No Samples Name Villages name Latitude Longitude
01 Corundum Ullarti kaval 14022.360‘ 76
0 43.206‘
02 Corundum Kyadigunte 14011.492‘ 76
0 59.261‘
2.A Corundum bearing
Amphibolite schist
Kyadigunte 14011.650‘ 76
0 59.762‘
TUMAKUR DISTRICT
Sl No Samples Name Villages name Latitude Longitude
03 Corundum Bettadakelaginahalli 14015.176‘ 77
0 19.767‘
04 Corundum Kyathaganakere 14013.074‘ 77
0 21.440‘
05 Corundum bearing
closepet granite
Thimmapura 14008.230‘ 77
0 17.436‘
06 Corundum Veerammanahalli 14008.470‘ 77
0 16.414‘
07 Corundum Kanikalabande 14009.237‘ 77
0 14.814‘
08 Corundum Channamallanahalli 13046.799‘ 77
0 16.204‘
09 Corundum bearing
closepet granite
ChinakaVajra 13037.913‘ 77
0 13.286‘
10 Corundum Bittanakurke 13041.709‘ 77
0 07.682‘
11 Corundum Basmangikaval 13043.944‘ 77
0 02.036‘
12 Corundum Molanahalli 13036.693‘ 77
0 52.604‘
13 Corundum Chickthimmanahalli 13035.987‘ 77
0 06.838‘
14 Corundum Devalapura 13029.156‘ 77
0 06.860‘
15 Corundum Devarayanadurga 13022.012‘ 77
0 13.318‘

68
CHIKBALLAPURA
Sl No Samples Name Villages name Latitude Longitude
16 Corundum Hunasavadi 13037.207‘ 77
0 20.451‘
17 Corundum Malenahalli 13039.764‘ 77
0 29.199‘
18 Corundum Kachamachanahalli 13034.033‘ 77
0 28.429‘
19 Corundum Kadiridevarahalli 13030.321‘ 77
0 33.176‘
20 Corundum bearing
closepet granite
Neralemaradalli 13036.321‘ 77
0 53.419‘
21 Corundum Poolakuntahalli 13031.424‘ 77
0 58.476‘
21.a Corundum bearing
closepet granite
Sidlaghatta 13024.122‘ 77
0 50.791‘
HASSAN DISTRICT
Sl No Samples Name Villages name Latitude Longitude
22 Corundum Makanahalli 13013.893‘ 76
0 14.807‘
23 Corundum Undiganalu 13015.555‘ 76
0 06.574‘
24 Corundum bearing
Amphibolite schist
Dasagodanahalli 13010.802‘ 76
0 02.980‘
25 Corundum bearing
chlorite schist
Nandihalli 13008.551‘ 76
0 15.237‘
26 Corundum Dyavalapura 13003.508‘ 76
0 27.968‘
27 Corundum Belagumba 13013.843‘ 77
0 19.390‘
CHIKMAGALUR DISTRICT
Sl No Samples Name Villages name Latitude Longitude
28 Corundum Melukoppa 13027.310‘ 75
0 15.201‘
29 Corundum Kogodu 13025.751‘ 75
0 11.931‘
30 Corundum Malanadu 13021.283‘ 75
0 15.719‘
31 Corundum bearing Kunchebylu 13023.135‘ 75
0 18.207‘

69
Amphibolite schist
32 Corundum bearing
Amphibolite schist
Heggaru 13020.798‘ 75
0 17.929‘
DAKSHINA KANNADA DISRICT
Sl No Samples Name Villages name Latitude Longitude
33 Corundum Uppinangadi 12049.886‘ 75
0 15.502‘
34 Corundum Koila 12048.563‘ 75
0 17.700‘
35 Corundum bearing
Amphibolite schist
Shanthigodu 12046.687‘ 75
0 15.750‘
MYSURU DISTRICT
Sl No Samples Name Villages name Latitude Longitude
36 Corundum Honnenahalli 12034.065‘ 76
0 14.663‘
37 Corundum Bylapura 12031.650‘ 76
0 16.545‘
38 Corundum bearing
Amphibolite schist
Krishnarajanagara 12026.364‘ 76
0 21.714‘
39 Corundum Uddukaval 12015.405‘ 76
0 20.843‘
40 Corundum Padukotekaval 12009.888‘ 76
0 19.571‘
41 Corundum Adahalli 12040.770‘ 76
0 25.783‘
42 Corundum Katur 12030.651‘ 76
0 25.385‘
43 Corundum bearing
Amphibolite schist
Halasur 12000.272‘ 76
0 25.907‘
44 Corundum Hanumanthapura 12018.898‘ 76
0 24.731‘
45 Corundum Handanahalli 12012.326‘ 76
0 29.440‘
46 Corundum Mavinahalli 12012.077‘ 76
0 31.274‘
47 Corundum bearing
Amphibolite schist
Someshwarapura 12013.264‘ 76
0 42.049‘
48 Corundum Varuna 12015.712‘ 76
0 44.168‘

70
49 Corundum Kuppya 12017.487‘ 76
0 48.778‘
50 Corundum Bommanayakanahalli 12015.242‘ 76
0 50.014‘
51 Corundum Eswaragowdanahalli 12011.234‘ 76
0 51.309‘
MANDYA DISTRICT
Sl No Samples Name Villages name Latitude Longitude
52 Corundum Machaholalu 12036.712‘ 76
0 23.531‘
53 Corundum bearing
Amphibolite schist
Adaguru 12032.063‘ 76
0 25.722‘
54 Corundum Bannur 12020.025‘ 76
0 53.430‘
55 Corundum Hemmige 12013.631‘ 77
0 00.720‘
56 Corundum Ballegere 12015.670‘ 77
0 01.594‘
57 Corundum Doddaboovalli 12018.729‘ 77
0 01.371‘
58 Corundum Malavalli 11021.666‘ 77
0 06.582‘
59 Corundum Nelamakanahalli 12025.686‘ 77
0 02.731‘
60 Corundum Ahasale 12027.243‘ 76
0 57.716‘
61 Corundum bearing
Amphibolite schist
Tharanagere 12041.376‘ 76
0 49.747‘
62 Corundum Kesthur 11041.929‘ 77
0 03.292‘
63 Corundum Hanumanthapura 12039.377‘ 77
0 04.437‘
64 Corundum Maddur 12032.920‘ 77
0 06.651‘
RAMANAGARA DISTRICT
Sl No Samples Name Villages name Latitude Longitude
65 Corundum Huthridurga 12056.764‘ 77
0 07.143‘
66 Corundum Varthehalli 12053.311‘ 77
0 08.403‘
67 Corundum Akkur 12049.398‘ 77
0 09.966‘
68 Corundum Hosahalli 12052.658‘ 77
0 02.182‘
69 Corundum bearing Lakkashettypura 12049.402‘ 77
0 03.596‘

71
Amphibolite schist
70 Corundum bearing
Amphibolite schist
Byranaikanahalli 12046.710‘ 77
0 02.061‘
CHAMARAJANAGAR DISTRICT
Sl No Samples Name Villages name Latitude Longitude
71 Corundum bearing
Pelitic rock
Budipadaga 11047.122‘ 77
0 04.375‘
71.a Fe, Garnet rich
Corundum rock
B.R.Hills 11047.583‘ 77
0 03.076‘
KOLAR
Sl No Samples Name Villages name Latitude Longitude
72 Corundum Yelesandra 12053.160‘ 78
0 10.276‘
73 Corundum Kammasandra 13000.660‘ 78
0 10.276‘

72
CHAPTER-III
3.1. FIELD GEOLOGY AND PETROGRAPHY
When rocks and rock materials are investigated in their natural environment and
in their natural relations to one another, the study is called field geology. Field geology
seeks to describe and explain the surface features and underground structure of the
lithosphere. Physiography and structural geology are equally important in the science of
field geology. Subsurface geology, likewise very important, pertains to the study of rock
relationships by the use of data obtained underground, as in mines or from drilled wells.
It is in contrast to surface geology, which is the-collection and study of superficial
evidences (Frederich., 1941).
3.2. OBSERVATION AND INFERENCE
Necessarily Field geology founded upon observation and inference. Only features
that' are superficial can be observed; all else must be inferred. We may study the surface
of an outcrop, of a valley, or of a corundum origin, but in attempting to explain the
internal structure of the outcrop, or what underlies the valley, or how the corundum grain
was fashioned, we are forming inferences by interpreting certain visible facts.
The ability to infer and to infer correctly is the goal of training in field geology,
for one's proficiency as a geologist is measured by one's skill in drawing safe and
reasonable conclusions from observed phenomena. Southern Karnataka mainly formed
high granulitic terrain and composition of green stone belts, in this terrain most of the
amphibolite schist contact and associated with corundum mineral, some places without
hosting rock corundum occur and pelitic rock also hosting corundum we seen in the study
area.
3.3. FIELD EQUIPMENTS
3.3.1. Base Maps: Before starting any field work it is important to be clear about the aim
of the investigation for this decision will guide the choice of map scale and control the
nature of the techniques which are needed to cover the area in the detail necessary to

73
resolve the problem. For most kinds of geologic field work, some sort of a preliminary
map of the region is of great advantage. a good topographic contour map, or an aerial
photographic map, which has been previously prepared and on which the geologist can
ploting data in the field, is termed a base map or a working map. Study area contain 17
Quadrangle Geology maps (48j, 48k, 48l, 48m, 48n, 48o, 48p, 57b, 57c, 57d, 57f, 57g,
57h, 57k, 57l, 58a and 58e) of 1:2,50,000 scale is used and helps to better understanding
corundum bearing litho-units in field and demarcation of corundum presence in the map.
3.3.2. Global Positioning Systems (GPS)
Global Positioning Systems (GPS) use ultra high -
frequency radio wave signals from satellites to
trigonometrically derive your position to within a few
metres laterally. Global Positioning Systems units do not
work in deep ravines and on some coastal sections; they are
also not particularly accurate for altitude. The GPS can be
set up for the particular grid system that you are working
with or for a global reference that is based on latitude and
longitude. The global reference World Geodetic System
1984 (WGS84) is the most commonly used. The unit may
take some time to locate the satellites if the GPS has been
moved hundreds of kilometers. We used GPS together Fig.3.1. GPS Garmin-72
with hard copy maps on our main location device in the field and accurately plot the
position. In this study used Garmin- 72 GPS model this GPS is a burgeoning technology,
which provides unequalled accuracy and flexibility of positioning for navigation,
surveying and GIS data capture. Garmin GPS Navigation Satellite Timing and Ranging
Global Positioning System (NAVSTAR) is a satellite-based navigation, timing and
positioning system. This GPS provides continuous three-dimensional positioning 24 hrs a
day throughout the world. The technology seems to be beneficiary to the GPS user
community in terms of obtaining accurate data up to about 100m for navigation, meter-
level for mapping, and down to millimeter level for geodetic positioning. This GPS
technology has tremendous applications if GIS data collection, surveying and mapping.

74
3.3.3. Brunton Compass
The Brunton compass is used by more
geologists for field mapping of geological
objects. The Brunton compass was originally
designed by a Canadian geologist named D.W.
Brunton, and built by William Ainsworth
Company in Denver, Colorado. Despite its
tough design, its delicate mirror and glass
components are vulnerable to shock and Fig.3.2. Brunton Compass
Moisture requiring care and periodic maintenance for proper application. See Compton,
1985 for maintaining the compass. Since 1972, genuine Bruntons are manufactured by
the Brunton Company in Riverton, Wyoming, which was acquired by Silva Production,
AB of Sweden in 1996 (Babaie., 2001) . In this study brunton compass used for
identification dip and strike direction of rock body and Detailed measurement of
geological objects, such as fold hingeline, axial trace, and axial plane, and geological
mapping. Mainly its helps to determining the magnetic declination then attitude of linear
and planar geological objects and measuring vertical angles height and distance.
3.3.4. Additional Equipment:
In addition to the instruments which may be used, the geologist will need various
equipments. The hand lens is an essential piece of equipment for the detailed observation
of all rock Types and we used a good hand lens with a moderate magnification (x10) is
absolutely essential for the examination of a fresh rock surface to determine such features
as mineral content grain shape and micro structures in a rock. We used hammer this is
also very needful equipment in the field. Hammer is a critical tool for obtaining rock
specimens for laboratory work and for chipping away weathered rock surface. Field note
book information that cannot be recorded on the geological map is written in the note
book and we used black pencils to record orientation data and colored pencils are used to
record rock litho-logy on the field map. Finally the work necessitates the collection of
rock specimens, we carried our self hammer, a collecting bag, small paper bags or
newspapers in which the specimens can be collected. The last but not the list Camera is

75
almost an essential part of a geologist's field equipment. There is considerable divergence
of opinion as to which is the most satisfactory kind to use for field photos.
3.4. FIELD INVISTIGATIONS
Corundum is of common occurrence in Karnataka but transparent gem quality corundum
colored blue, green, yellow and violet is rare. The name ruby is reserved for the red
transparent variety and sapphire for the blue transparent red ruby corundum was explored
near Budipadaga in Chamarajanagar district. Red colored corundum not quite transparent
but opaque when polished in to cabochons displays asterism such varieties are called star
ruby or star corundum many corundum crystals collected in Mysuru, Mandya, and
Tumkur districts displays this character, gem quality ruby corundum is occasionally
found at Kadamane, corundum is associated with gem quality kyanite. The mineral
occurs in decomposed granite gneiss in the form of loose crystals up to half an inch in
length, pink to amethyst colored corundum from weathered pegmatite near
Kamasamudra, Kolar district. Corundum from near Kalyadi in Hassan district is blue in
color and shows well developed basal sections with pronounced asterism, corundum
crystals from near Undiganhalu close to Kalyadi are blood red in color.
Numerous occurrences of ruby corundum lie within a tract nearly 250km long and having
a width of 30 – 40km restricted to the eastern and western margins of the N-S trending
closepet granite, LANDSAT color composites have revealed numerous dark toned areas
which represent exposures of basic schist not delineated in the geological map, these
enclaves are the host rocks for ruby corundum.
Two types of occurrences noticed are (1) in-situ corundum related to intrusive pegmatites
laying within metamorphic rocks mainly amphibolites and meta-gabbro, talc-chlorite
schists and calc-silicate rocks and (2) placer corundum within gravels of older alluvium.
Nine tracts have been identified with potential for the occurrence of gem quality
corundum and other precious stones

76
Table.3.1. Corundum deposit tract of the study area
Sl. No Tract Extent in km2
1 Kunigal – T-Narsipura 1905
2 Madhugiri – Dodballapura 392
3 Madhugiri – Doddaladbetta 400
4 Pavagada 252
5 Hosahudya and surroundings 26
6 Bangarpet – Kamasamudra 66
7 Arsikere – Heggadadevanakote 2072
8 Gundlupete – Chamarajanagar & surroundings 121
9 Sringeri 18
Total 5252 km2
Among these tracts, the occurrences noticed at Tarur, Kuntegowdanahalli and
Irabommanhalli in Sira taluk. Chikunda in Hunsur taluk, Jakkanahalli and Jagankote in
Heggadadevanakote taluk have been studied and the corundum tested for its gemological
properties and it is stated that there is good potential for star variety as well as light
colored translucent variety the Chikunda occurrence was reported favorably with
possibility of finding transparent good quality red ruby corundum.
3.5. CORUNDUM BEARING LITHO-UNITS OF THE STUDY AREA
3.5.1. Field traverse in Chitradurga District
Chitradurga Geologicaly famous in Chitradurga District of Chitradurga schist belt
its start from Gadag to Srirangapatna. Chitradurga mainly consist of fractured granitic-
gneisses, gneisses and hornblende-schists rocks form, another major iron ore deposited
and Soil types of the district comprise deep and shallow black soil, mixed red and black
soil, red loamy and sandy soil. Physiographically the district comprises of undulating
plains, interspersed with sporadic ranges and isolated low ranges of rocky hills.
Corundum occurs in the Challakere taluk, Loose barrel shaped crystals of pink corundum
scattered in the soil cap in the Ullavarti – Kaval east of Challakere, so for these have not

77
been commercially exploited on a large scale (fig.3.3). Kyadigunte it is also village of
Challakere taluk and it is near to Closepet zone in field investigation ruby occurs with
hornblend schist this the geologicaly contact zone of Closepet granite and Chitradurga
schist along this belt mafic magma activity helps to corundum reaches to surface the
contact zone and wall rock alteration, migmatization and pegmatite veins also helps
corundum reaches to the surface this deposition we seen the 2km away from south west
direction of the village and adjacent to the this deposition dolerite dyke travel along with
corundum bearing hornblende schist (fig.3.3).
Fig.3.3. Photographs of corundum Ullarthi area and corundum bearing Amphibolite schist
Kyadigunte around Chitradurga district, Sl no 1 – 2.a.
3.5.2. Field traverse in Tumakur District
Tumkur District exposes mainly rock types belonging to the Peninsular Gneissic
Complex (PGC), schistose rocks of Sargur group and Dharwar super group, younger
intrusives (Closepet Granite and basic dykes) and thin patches of quaternary gravels,
Corundum bearing cordierite-sillimanite schist/gneiss occur on either side of Closepet
Granite as enclaves in Peninsular Gneisses and eastern border of Closepet Granite in
which Corundum is sporadically distributed in a stretch of 60 km extending from
Koratagere to Pavagada. These schists are intensely altered and new minerals like
diopside, hypersthene varieties of garnets, cordierite, sillimanite and corundum have
developed giving rise to several interesting rock types. All these rock types are
considered to be highly metamorphosed phases of impure argillitic sediments preserved

78
here and there as remnants of the original schists in the gneissic complex (Swaminath and
Ramakrishnan, 1981). Field observation a number of shallow working for corundum are
seen at Baichapura and Alpenhalli in Kortagere taluk occurrences especially in the region
bordering the Closepet Granites in parts of Sira, Madhugiri and Pavagada taluks,
corundum gem occurring at the contact of ultramafic rocks and pegmatite
Honmachanahalli, Bandihalli and tract of Tumkur-Pavagada and Baichapurr-Madhugiri,
other field investigation observed corundum bearing Closepet Granite deposited
Thimmapura, ChinakaVajra and Devalapura area and corundum occurs Bittanakurke,
Bettadakelaginahalli, Kyathaganakere, Veerammanahalli, Kanikalabande,
Channamallanahalli, Basmangikaval, Molanahalli, Chickthimmanahalli and
Devarayanadurga area (fig.3.4).
Fig.3.4. Photographs of corundum samples around Tumkur District Sl no 3 – 15.
3.5.3. Field traverse in Chikaballapur District:
Chikballapur district is the eastern gateway to Karnataka. It formed by bifurcating old
Kolar district in to Chikballapur and Kolar districts. It is land locked district and hard
rock terrain of Karnataka in the Maiden (plain) region and covers an area of 4207 sq.km.
The general elevation varies from 250 to 909 m above mean sea leve. The district lies
almost in the central part of Peninsular India, which has immensely bearing on its
geoclimatic conditions. This district experiences tropical climate throughout the year. The
soils of Chickballapur district occur on different landforms such as hills, ridges,
pediments, plains and valleys. The types of soils distributed range from red loamy soil to

79
red sandy soil and lateritic soil. Field observation of this district exposes mainly rock
types of Granites, gneisses, schists; laterites and alluvium underlie the district. Basic
dykes intrude the above formations at places. Granites and gneisses occupy major portion
of the district. Schists are mostly confined to the northwestern part of Gauribidanur taluk.
Laterites occupy small portions in Chickballapur, and Sidlaghatta taluks. Alluvium is
confined to river courses. Corundum bearing Closepet Granite occurs Neralemaradalli
area and corundum occurs Hunasavadi, Malenahalli, Kachamachanahalli,
Kadiridevarahalli and Poolakuntahalli area. Fractures or lineaments occupy well defined
structural valleys and majority of them trend NE-SW (fig.3.5).
Fig.3.5. Photographs of Gorundum samples around Chikballapur District, Sl no 16 – 21.a.
3.5.4. Field traverse in Hassan District
Hassan district is located on the border of the Western Ghats, in the southern part of
Karnataka state. It is located between 12° 30‘ and 13° 35‘ North latitude and 75° 15‘ and
76° 40‘ East longitude. The major part of the district is in Cauvery main basin drained by
Cauvery, Hemavathy and Yagachi rivers, which flow towards east to join the Bay of
Bengal. The district is divided into three distinct geomorphic units i.e. the Western and
North-Eastern hilly terrains constituting part of the Western Ghats, the Central Transition
Zone and the Eastern Maidan (plain) region. The soils of the district display a wide
diversity and are quite fertile. The main soil types are Red soil, Red sandy soil, Mixed
soil and Silty clay soil. The soils in the western taluks are derived from granites, laterites
and schists. These soils are shallow to medium in depth and the color changes with depth

80
from red at the surface and red and yellow mottles at depth. In the eastern taluks, the soils
are red sandy type, which are derived from granite, gneisses and schists. Field
observation the district exposes mainly composition of Holenarasipura and Nuggihalli
schist belts and this area belongs to Sargur group of rocks which comprises corundum
bearing rocks were principally made up of interspersed by lands tremolite schist,
hornblende gneiss, amphibolites schist along with intrusive dykes of dolerite and reefs of
quartzite. Corundum occurs Makanahalli, Undiganalu, Dyavalapura and Belagumba area.
Corundum bearing Amphibolite schist occurs Dasagodanahalli area and Corundum
bearing chlorite schist occurs Nandihalli area (fig.3.6).
Fig.3.6. Photographs of (a) corundum (b) Corundum bearing Amphibolite schist (c)
Corundum bearing Chlorite schist (d) Gneiss around Hassan District, Sl no 22 –27.
3.5.5. Field traverse in Chikmagalur District
Geologically the Chikmagalur area made up of Archean Schists and basement
Gneissic rocks. The Dharwar schists occupy 50% of the area of the district and occur as
three distinct belts, The Kudremukh Gangamwla belt, the koppa belt and Baba budan belt
(Manjunatha and Harry., 1994). The district encompasses rich economic minerals such as
iron ore, kaolin, kyanite, asbestos, bauxite, chromite, clay, copper, corundum, garnet,
a b
c d

81
graphite, limestone, manganese, mica. Among these minerals, iron ore is being exploited
on a large scale. Nearly 70% of the area in Sringeri taluk is covered by gneiss and rest of
the area is occupied by schist formation. Weathered, fractured and jointed gneiss and
schist rocks (Ramakrishnan and Vaidyanadhan., 2008). And further these rocks have
specks of Corundum bearing units.
Fig.3.7. Photographs of corundum and corundum bearing amphibolites schist around
Chikmagalur District, Sl no 28 - 32.
In field investigation district has six kinds of litho units with economically viable
minerals including gemstones varieties particularly in contact zones of ultramafics,
Banded Iron Formation, amphibolite schist with gneiss and metabasalt & amphibolite -
metagabbro. Random samples were collected such as amphibolite, gneiss and corundum
within basement crystalline rocks through GTC (Ground Truth Check) corundum occurs
Melukoppa, Kogodu and Malanadu area. Corundum bearing amphibolites schist occurs
Kunchebylu and Heggaru area (fig.3.7).
3.5.6. Field traverse in Dakshina Kannada District
The district exposes mainly rock types migmatites and granodioritic to tonalitic Gneiss,
schistose rocks, younger granite, kyanite sillimanite schist. The coastal stretch and the
adjacent Western Ghats are composed of Precambrian (Archeaen) rocks and the
Phanerozoic formations. Sargur group is composed of high grade metamorphic rocks of
upper amphibolitic to lower granulitic facies, occurring within gneisses and granites
(Swaminath and Ramakrishnan, 1981). Awasthi and Krishnamurthy, (1979) and Ravindra

82
and Janardhan, (1981), in their study reported the presence of rock type equivalent to
Sargur group in the southern most part of coastal Karnataka such as Puttur, Sullia and
Dharmasthala.
Fig.3.8. Photographs of Corundum and Corundum bearing Amphibolite schist around
Dakshina Kannada District, Sl no 33 – 35.
The greater part of the Sullia taluk is laterite covered. Beneath this cover, major rock
types encountered are gneisses and granulites containing enclaves of kyanite-sillimanite ±
corundum schist; kyanite-sillimanite-garnet-graphite schist; quartz-chlorite-biotite schist;
quartzite; chlorite-tale-actinolite schist and amphibolites (Ravindra and Janardhan, 1981).
Field observation carried out corundum occurs Uppinangadi and Koila area. Corundum
bearing amphibolites schist occurs Shanthigodu and Sullia area (fig.3.8).
3.5.7. Field traverse in Mysuru District
The district is mainly composed of igneous and metamorphic rocks of Precambrian age
either exposed at the surface or covered with a thin mantle of residual and transported
soils (Ramakrishnan and Vaidyanadhan., 2008). And its has a vast expanse of Magnetite
gneisses. This high-grade schist is considered as oldest group of supracrustal rocks. These
high-grade schists are noticed as rafts within the gneissic complex in the southern parts of
the districts and form the type which belongs to Sargur group (Chandrashekhar, H. and
Nazeer Ahmed, 1994). Chamundi hill and Varuna area is essentially a flat lying basement
gneisses, ultramafic and amphibolite schist, These rocks are of great economic
importance because of the presence of corundum and garnets. Sargur area also mainly
occupying the rock type‘s Gneiss, ultramafics, metapelites and amphibolites schistose

83
rocks, these rocks are of great economic importance because of the presence of graphite,
corundum and garnets in them. They extend from Bilikere region up to the southern
border of the district in the south-southwest direction for nearly 50 km (Swaminath and
Ramakrishnan, 1981). In field investigation Mavinalli area belongs to Sargur group of
rocks, main rock types in contact zones of ultramafics, fuchsite quartzite with kayanite,
Amphiolite and hornblende schist with crystaline limestone, Banded iron formation with
high grade metapelites and grey migmatite granodiorite tonalitic banded gneiss.These
rocks are of great economic importance because of the presence of corundum and
garnets. Overall district field observation and collected samples corundum occurs
Honnenahalli, Bylapura, Uddukaval, Padukotekaval, Adahalli, Katur, Hanumanthapura,
Handanahalli, Mavinahalli, Varuna, Kuppya, Bommanayakanahalli and
Eswaragowdanahalli area. Corundum bearing amphibolites schist occurs
Krishnarajanagara, Halasur and Someshwarapura area (fig.3.9).
Fig.3.9. Photographs of (a) Corundum (b) Actinolite Schist (c) Pyroxene Granulate (d)
Amphibolite Schist collected samples around Mysuru district, Sl no 36 – 51.
a

84
3.5.8. Field traverse in Mandya District
The district belongs to Archaean era. They have been subjected to deformation
and have undergone metamorphism. They have varied chemical compositions and are
most complex and aptly designated as Archaean complex and consist of a wide variety of
granite, gneisses and schist with associated quartzite and limestone (Ramakrishnan and
Vaidyanadhan., 2008). Maddur area mainly occupying the rock type‘s graniitoid gneiss,
ultramafics, Banded Magnetite Quartzite (BMQ) and basic dyke, these rocks are of great
economic importance because of the presence of corundum. Important deposits are
reported from Satanur near Mandya, Erehalli, Kirangur and Ramanahalli areas
(Ramakrishnan and Vaidyanadhan., 2008). In field observation in the district most part, is
made up of gneisses which are generally gray in colour with well developed gneissosity.
Corundum occurs Machaholalu, Bannur, Hemmige, Ballegere, Doddaboovalli, Malavalli,
Nelamakanahalli, Ahasale, Kesthur, Hanumanthapura and Maddur area. Corundum
bearing amphibolites schist occurs Adaguru and Tharanagere area (fig.3.10).
Fig.3.10. Photographs of Corundum and Corundum bearing Amphibolites schist around
Mandya District, Sl no 52 – 64.
3.5.9. Field traverse in Ramanagara District
The district mainly comprise rocks belong to Sargur group, granulite group, Peninsular
Gneissic Complex (PGC), Closepet granite, and basic and younger intrusives of the
Precambrian era (Ramakrishnan and Vaidyanadhan., 2008). Granulite and migmatites,
Sargur group comprises ultramafic rocks, amphibolites, banded magnetite quartzites,

85
occurring as small bands, and lenses within the migmatite and gneisses (Radhakrishna
and Naqvi, 1986). Field observation Ramanagara district, it has three kinds of litho units
with economically viable minerals including gemstones varieties particularly in contact
zones of ultramafics, amphibolite schist with gneiss and younger granites, samples were
collected such as gneiss, and corundum bearing amphibolite schist through GTC (Ground
Truth Check). Corundum occurs Huthridurga, Varthehalli, Akkur and Hosahalli area.
Corundum bearing amphibolites schist occurs Lakkashettypura and Byranaikanahalli
area.
Fig.3.11. Photographs of Corundum and Corundum bearing Amphibolites schist around
Ramanagara District, Sl no 65 – 70.
3.5.10. Field traverse in Chamarajanagara District
Geologically the district is mainly self-possessed of igneous and metamorphic rocks of
Precambrian age either exposed at the surface or covered with a thin mantle of residual
and transported soil (Basavarajappa., 1992). The rock formation of the district falls into
mainly three groups (a) Amphibolite Facies Gneissic equalent to Sargur group. (b)
Amphibolite gneiss mixed with incipient and retrograde charnockite equalent to high
grade shear zone (c) high grade massive and banded charnockitic granulites equalant to
Archean type NGT (Northern Granulite Terrain) charnockite series and granite gneiss or
genesis granite (Basavarajappa and Srikantappa., 1998,1999). A fairly wide area of the
district consists of Chamockites series of rocks particularly along the southeastern border
of Yalandur taluk and Biligirirangana Hills (Basavarajappa et al., 2004). Field

86
observation the area occupying the corundum bearing pelitic rocks vary in thickness from
few cms to meters well exposed around Budipadaga, generally they trend in NS direction,
pelites consists of qtz+plag+k.felds+bio+corun+stau+gt (Basavarajappa et al., 2004).
Corundum bearing pelitic rock occurs Budipadaga area. Fe, Garnet rich corundum
bearing rock and Corundum, Garnet bearing Mylonite occurs Biligirirangana Hills.
(fig.3.12).
Fig.3.12. Photographs of (a) Corundum Garnet bearing mylonite (b) Fe,
Garnet rich Corundum rock and (c) Corundum bearing pelitic rock around
Chamarajanagara districts, Sl no 71 – 71.a.
3.5.10. Field traverse in Kolar District
Kolar belongs to the Maidan (plains) group of districts as distinct from the western
portions of the State called ma1nad and it is the eastern most district of Karnataka State.
Granites, gneisses, schists, laterites and alluvium underlie the district. Basic dykes intrude
the above formations at places. Granites and gneisses occupy major portion of the
district. Schists are mostly confined to two places - around Kolar Gold Fields and in the
northwestern part of Gauribidanur taluk. Laterites occupy small portions in Kolar,
Srinivaspura and Sidlaghatta taluks. Alluvium is confined to river courses. Fractures or
lineaments occupy welldefined structural valleys and majority of them trend NE-SW.
Field observation the topography of the district is undulating to plain. The central and
eastern parts of the district forming the valley of Palar Basin, are well cultivated. The
soils of Kolar district occur on different landforms such as hills, ridges, pediments, plains
and valleys. Workable deposits of corundum are found at Dodderi 3km NNW of
Kamasamudra and at Doddenur and Yelesandra in the Bangarpet taluk from the size of
excavations, it is evident considerable quantities of pink granular corundum appear to
c

87
have been recovered several abandoned shafts are also seen corundum is found as an
ingredient of cordierite sillimanite gneiss, corundum is also reported to be available in
large quantities near Marahalli near Thondebhavi. Corundum occurs Yelesandra and
Kammasandra area. Corundum bearing Amphibolite schist occurs near Kammasandra
area (fig.3.13).
Fig.3.13. Photographs of Corundum and Corundum bearing Amphibolites Schist around
Kolara district, Sl no 72 – 73.a.
3.6. PETROGRAPHIC STUDY
In this study corundum bearing litho - units
carried carefully to the research Petrographic
Laboratory at Department of Studies in Earth
Science, University of Mysore, Mysuru, to make
thin section for petrographic work. A thin section
of rock is cut from the sample with a diamond
saw & ground optically flat and mounted on a
glass slide. Then the ground parts of the samples
were made smooth using progressively finer
abrasive grit until the sample is only 30 μm thick.
Petrographic characters of all the section were
carried out using Leitz XPL-2 petro-microscope
Lawrence and Mayo (Fig.3.14). Fig.3.14. Research Microscope

88
3.6.1. Corundum bearing Samples around Chitradurga District
The corundum optical properties show Color: colorless, blue, pink to light red colored
The red color is caused by the mineral chromium and shows brownish tone due to the
presence of iron. Relief shows high to very high. Prismatic, tabular or skeletal crystals
and Rhombohedral parting/ cleavages are common. pleochroism is very strong in
ordinary light and shows deep red color when viewed in the direction of vertical axis and
a much lighter color to nearly colorless in view at right angles to this axis. Birefringence
weak, Uniaxial negative. but often up to low II order due to extra thickness of ultra-hard
corundum. Parallel extinction. In hornfelses, high grade pelites and syenitic gneisses,
environment contact and regionally metamorphosed rocks (Fig.3.15).
Fig.3.15. Photomicrographs of a and b Corundum samples (xpl and ppl) c and d Corundum
Bearing Amphibolites Schist around Chitradurga district, Sl no 1 – 2.a.
Sericite optical properties shows Color: Brown or turbid pale greyish, Monoclinic
system, anisotropic, Pleochrosim – nil Relief weak, Cleavage very good in one direction
in basal sections have no cleavage, Biaxial high birefringence sericite also fills the micro
fractures in plagioclase, but it does it in elongated crystals, unlike the rather equant
hematite crystals. Sericite is a fine-grained variety of muscovite, with the same
a
c d
b

89
composition KAl 2(AlSi3O10)(OH)2. It usually forms by hydrothermal alteration of K-
feldspars, which provide the necessary potassium. It grows in pre-existing microfractures
where the fluids can penetrate, or in fractures created by the fluid pressure., sericite fills
cracks around and across plagioclase crystals, sericite that probably has replaced feldspar
(Fig.3.15).
Amphibole is usually strongly green in colour, yellow-blue, blue-green and brown. It
shows strong pleochroic, moderate relief, high cleavage, birefringence biaxial and
pleochroic appears in various shades of green and brown. In plane polarized light, the
mineral colour of amphibole ranges from yellowish green to dark green in Colour. The
central part is associated corundum which shows pale blue color; uniaxial; low
birefringence and surface relief is high (Fig.3.15). Various shades of yellowish green and
reddish brown to dark brown are observed in hornblende gneiss showing Slender
prismatic to bladed crystals, with 4 or 6 sided cross section which exhibit amphibole
cleavage also has anhedral irregular grains which shows moderate to high positive relief.
Hornblende cleavages on intersection at fragment shape is controlled by cleavage;
birefringence; interference colors usually has higher first or lower second order. The
mineral shows simple and lamellar twinning; biaxial and shows alteration to biotite &
chlorite or other Fe-Mg silicates. Corundum shows pale yellow colour; uniaxial; low
birefringence, surface relief is high (Fig.3.15). The corner edge part is associated
corundum which shows pale blue color; uniaxial; low birefringence and surface relief is
high (Fig.3.15).
3.6.2. Corundum bearing Samples around Tumkur District
The corundum optical properties show Color: colorless, pink to blood-red colored. Relief
shows high to very high. Prismatic, tabular or skeletal crystals and Rhombohedral
parting/ cleavages are common. pleochroism is very strong in ordinary light and shows
deep red color when viewed in the direction of vertical axis and a much lighter color to
nearly colorless in view at right angles to this axis. Birefringence weak, Uniaxial
negative. but often up to low II order due to extra thickness of ultra-hard corundum.
Parallel extinction. In hornfelses, high grade pelites and syenitic gneisses, environment
contact and regionally metamorphosed rocks (Fig.3.16). Sericite optical properties shows

90
Color: Brown or turbid pale greyish, Monoclinic system, anisotropic, Pleochrosim – nill
Relief weeak, Cleavage very good in one direction in basal sections have no cleavage,
Biaxial high birefringence sericite also fills the micro fractures in plagioclase, but it does
it in elongated crystals, unlike the rather equant hematite crystals (Fig.3.16).
Fig.3.16. Photomicrographs of a and b Corundum samples (xpl and ppl) c and d Corundum
Bearing Closepet Granite around Tumakur district, Sl no 3 – 15.
Granite composed of Qurtz + K- Felspar + Biotite mica. Quartz shows Colorless,
transparent and unaltered. Cleavage absent, Relief low positive, so that the outlines of the
grains are not well marked with smooth surface. Birefringence weak, uniaxial positive.
Feldspar shows central part of micro section (Fig.3.16), colorless, but often cloudy due to
alteration. Cleavage is visible as thin lines in two directions nearly 900 other grains will
show no cleavage or one direction only and Relief low negative. Birefringence weak,
simple twinning, mineral distinguished from quartz by its cloudy appearance due to
alteration, shows low negative relief, presence of cleavage and by simple twinning.
Biotite is Silicate of magnesium, iron, aluminium and potassium with hydroxyl fluorine.
Colour brown, yellowish brown, reddish brown, dark brown, green or dark green.
Cleavage perfect in one direction basal sections do not show any cleavage. Birefringence
strong, parallel extinction (Fig.3.16).
a b
c d

91
3.6.3. Corundum bearing Samples around Chikballapura District
The corundum optical properties show Color: colorless, pink to light pink colored
Relief shows high to very high. Prismatic, tabular or skeletal crystals and Rhombohedral
parting cleavages are common. pleochroism is very strong in ordinary light and shows
deep pink color when viewed in the direction of vertical axis and a much lighter color to
nearly colorless in view at right angles to this axis. Birefringence weak, Uniaxial
negative. but often up to low II order due to extra thickness of ultra-hard corundum.
Parallel extinction. (Fig.3.17).
Fig.3.17. Photomicrographs of Corundum (XPL and PPL) around
Chikballapura district, Sl no 16 – 21.a.
3.6.4. Corundum bearing Samples around Hassan District
Corundum: The corundum shows similar color appearance in both plane and crossed
polarized lights. Corundum is depicted by pink to blood-red colored and can vary within
each gem variety of the mineral Corundum. The red color is caused by the mineral
chromium and shows brownish tone due to the presence of iron. It shows uniaxial,
birefringence & pleochroism is very strong in ordinary light and shows deep red color
when viewed in the direction of vertical axis and a much lighter color to nearly colorless
in view at right angles to this axis (Fig.3.18 a and b)
Corundum bearing Chlorite Schist: The mineral chlorite is a hydrous silicate of
aluminium, iron and magnesium optical properties shows colourless or pale green to deep
green faintly to moderately pleochroic in shades of green and yellow. Prominent cleavage
traces parallel to the length; birefringence is weak; extinction parallel to the cleavage
trace are observed in most of the chlorite minerals and crystal system is monoclinic.

92
Tremolite is a mineral that is typically associated with secondary alteration processes in
igneous rocks as well as in metamorphic rocks in the form of typical mineral facies of
green schists. It occurs as a result of alteration of micas, although it is commonly found
as alteration of amphiboles and pyroxenes. The pleochroic property shows light green to
colorless; while medium relief interference color shows berlin blue color. The second
order interference color is depicted by the mineral mica. The central part is associated
corundum which shows pale blue color; uniaxial; low birefringence and surface relief is
high (Fig.3.18 c and d)
Corundum bearing Hornblende gneiss: Various shades of yellowish green and reddish
brown to dark brown are observed in hornblende gneiss showing Slender prismatic to
bladed crystals, with 4 or 6 sided cross section which exhibit amphibole cleavage also has
anhedral irregular grains which shows moderate to high positive relief. Hornblende
cleavages on intersection at fragment shape is controlled by cleavage; birefringence;
interference colors usually has higher first or lower second order. The mineral shows
simple and lamellar twinning; biaxial and shows alteration to biotite & chlorite or other
Fe-Mg silicates. Corundum shows pale yellow colour; uniaxial; low birefringence,
surface relief is high (Fig.3.18 e and f).
Amphibolite schist with sphane: Hornblende is the commonest amphibole found in
igneous rocks and is most abundant in acid and intermediate rocks. It is less common in
ultrabasic and basic rocks where other amphiboles are more commonly found. Most of
the minerals show abundant in high grade regional metamorphic rocks such as schist,
gneiss and granulite. It can also be found within immature sediments as clastic grains.
Hornblende often alters to an intergrowth of tremolite and actinolite sometimes with
epidote, giving a blue-green appearance in hand specimen. Amphibole is usually strongly
green in coloure, yellow-blue, blue-green and brown. It shows strong pleochroic,
moderate relief, high cleavage, birefringence biaxial and pleochroic appears in various
shades of green and brown. In plane polarized light, the mineral colour of amphibole
ranges from yellowish green to dark green in Colour (Fig.3.18 g and h).
Sphene mineral appears as slightly brownish color with extremely high relief and
high interference colors. Euhedral forms having acute rhombic (elongated diamond-

93
Fig.3.18. Photomicrographs of a and b Corundum (xpl and ppl) c and d Corundum bearing
Chlorite schist, e and f Corundum bearing Hornblende schist and g and h Amphibolite
schist with sphene around Hassan district, Sl no 22 – 27.
shaped) cross sections. Birefringence very strong high order white interference
colours but are usually masked by the strong body colour or destroyed by total reflection,
biaxial positive. Rhombic sections have symmetrical extinction. It does not extinguish
a b
c d
e f
g h

94
completely on rotation of stage does not show complete darkness in extinction positions
due to strong dispersion. It shows acute rhombic cross sections with extremely high relief
(Fig.3.18 g and h).
3.6.5. Corundum bearing Samples around Chikmagalur District
Corundum: The corundum optical properties show Color: pink to blood-red colored
(some time spotted in red – Ruby or blue-Sapphire) The red color is caused by the
mineral chromium and shows brownish tone due to the presence of iron. Relief shows
high to very high. Prismatic, tabular or skeletal crystals and Rhombohedral parting/
cleavages are common. pleochroism is very strong in ordinary light and shows deep red
color when viewed in the direction of vertical axis and a much lighter color to nearly
colorless in view at right angles to this axis. Birefringence weak, Uniaxial negative. but
often up to low II order due to extra thickness of ultra-hard corundum (Fig.3.19 a and b).
Fig.3.19. Photomicrographs of a and b Corundum samples (xpl and ppl) c and d Corundum
bearing Amphibolite schist around Chikmagalur district, Sl no 28 – 32.
The central part is associated corundum which pink to blood-red colored; uniaxial; low
birefringence and surface relief is high. Amphibole is usually strongly green in coloure,
a b
c d

95
yellow-blue, blue-green and brown. It shows strong pleochroic, moderate relief, high
cleavage, birefringence biaxial and pleochroic appears in various shades of green and
brown. In plane polarized light, the mineral colour of amphibole ranges from yellowish
green to dark green in Colour (Fig.3.19 b and c).
3.6.6. Corundum bearing Samples around Dakshina Kannada District
Corundum: The corundum optical properties show Color: colorless, pink to blood-red
colored the red color is caused by the mineral chromium and shows brownish tone due to
the presence of iron. Relief shows high to very high. Prismatic, tabular or skeletal crystals
and Rhombohedral parting/ cleavages are common. pleochroism is very strong in
ordinary light and shows deep red color when viewed in the direction of vertical axis and
a much lighter color to nearly colorless in view at right angles to this axis. Birefringence
weak, Uniaxial negative, but often up to low II order due to extra thickness of ultra-hard
corundum, Parallel extinction. In hornfelses, high grade pelites and syenitic gneisses and
regionally metamorphosed rocks (Fig.3.20 a and b).
Fig.3.20. Photomicrographs of a and b Corundum samples (xpl and ppl) c and d Corundum
bearing Amphibolite schist around Dakshina Kannada district, Sl no 33 – 35.
a b
c d

96
Corundum bearing Amphibolite schist: Amphibole is usually strongly green in
coloure, yellow-blue, blue-green, dark greenish and brown. It shows strong pleochroic,
moderate relief, high cleavage, birefringence biaxial and pleochroic appears in various
shades of green and brown. In plane polarized light, the mineral colour of amphibole
ranges from yellowish green to dark green in Colour. The corner part is associated
corundum which shows pinkish red color; uniaxial; low birefringence and surface relief is
high (Fig.3.20 c and d). Amphibolite hosted Corundum shows various shades of
yellowish green and reddish brown to dark brown are observed in hornblende showing
Slender prismatic to bladed crystals, with 4 or 6 sided cross section which exhibit
amphibole cleavage also has anhedral irregular grains which shows moderate to high
positive relief. Hornblende cleavages on intersection at fragment shape is controlled by
cleavage; birefringence; interference colors usually has higher first or lower second order.
The mineral shows simple and lamellar twinning; biaxial and shows alteration to biotite
& chlorite or other Fe-Mg silicates. Corundum shows pale yellow colour; uniaxial; low
birefringence, surface relief is high (Fig.3.20 c and d).
3.6.7. Corundum bearing Samples around Mysuru District
The corundum optical properties show Color: pink to blood-red colored. Relief shows
high to very high. Prismatic, tabular or skeletal crystals and rhombohedral parting/
cleavages are common. Pleochroism is very strong in ordinary light and shows deep red
color when viewed in the direction of vertical axis and a much lighter color to nearly
colorless in view at right angles to this axis. Birefringence weak, uniaxial negative but
often up to low II order due to extra thickness of ultra-hard corundum (Fig.3.21 a and b).
Amphibole is usually strongly green in coloure, yellow-blue, blue-green and brown. In
plane polarized light, the mineral colour of amphibole ranges from yellowish green to
dark green in Colour. The central part is associated corundum which shows pale blue
color; uniaxial; low birefringence and surface relief is high (Fig.3.21 c and d).
The Central par Corundum shows red, pale blue and pale yellow colour; uniaxial;
low birefringence, surface relief is high. Hypersthene is an iron magnesium silicate with
more than 15% FeSio3, (Mg, Fe) Sio3 Color: body colour more marked than in enstatite,

97
Fig.3.21. Photomicrographs of a and b Corundum samples (xpl and ppl) c and d Corundum
bearing Amphibolite schist, e and f Corundum Bearing Pyroxene Granulate and g and h
Corundum with Staurolite around Mysuru district, Sl no 36 – 51.
colorless to pale green or pale red. Form usually as prismatic grains the cross sections are
nearly square. Well developed one set of cleavage traces in prismatic grains and two sets
of cleavage traces at right angles to each other in (cross section) grains having nearly
square shape. Relief high. Birefringence weak ( slightly stronger than in enstatite) yellow
a b
c d
e f
g h

98
to red of the I order interference colors positive elongation, biaxial negative. Extinction
parallel in most sections. (fig 3.21 e and f).
Staurolite shows Porphyroblast and Staurolite grain at extinction, where the
diamond shape is clearly visible. Color pale honey yellow or brown, pleochroism weak to
moderate in honey yellow, relief high and cleavage weak, its shows anisotropic and
biaxial Twinning not obvious in thin section, Distinguishing Features Staurolite's yellow
color, pleochroism, relief and habit make it distinguishing. It is vitreous and has a grey
streak. Staurolite's hand sample has characteristic penetration twinning and unique crystal
habit. The crystals are brown, red or yellow in color. May resemble tourmaline in thin
section, but tourmaline is uniaxial. Occurrence Staurolite is found in medium-grade
pelitic metamorphic rock, and is used as an index mineral in metamorphic zoning.
Staurolite may be found with garnet, cordierite, kyanite, muscovite, biotite and quartz. It
is in the lower to middle amphibolite facies. (Fig3.21 g and h).
The corundum shows Pinkish red color appearance in plane polarized light.
Corundum is depicted by pink to blood-red colored and can vary within each gem variety
of the mineral Corundum. It shows uniaxial, birefringence & pleochroism is very strong
in ordinary light and shows deep red color when viewed in the direction of vertical axis
and a much lighter color to nearly colorless in view at right angles to this axis (Fig.3.21 g
and h)
3.6.8. Corundum bearing Samples around Mandya District
Corundum: The corundum optical properties show Color: colorless, pink to blood-red
colored The red color is caused by the mineral chromium and shows brownish tone due
to the presence of iron. Relief shows high to very high. Prismatic, tabular or skeletal
crystals and Rhombohedral parting cleavages are common. pleochroism is very strong in
ordinary light and shows deep red color when viewed in the direction of vertical axis and
a much lighter color to nearly colorless in view at right angles to this axis. Birefringence
weak, Uniaxial negative. but often up to low II order due to extra thickness of ultra-hard
corundum. Parallel extinction. (Fig.3.22 a and b).

99
Sericite optical properties shows Color: Brown or turbid pale greyish, Monoclinic
system, anisotropic, Pleochrosim – nill Relief weeak, Cleavage very good in one
direction in basal sections have no cleavage, Biaxial high birefringence sericite also fills
the micro fractures in plagioclase, but it does it in elongated crystals, unlike the rather
equant hematite crystals. Sericite is a fine-grained variety of muscovite, with the same
composition KAl 2(AlSi3O10)(OH)2. It usually forms by hydrothermal alteration of K-
feldspars, which provide the necessary potassium (Basavarajappa and Maruthi., 2018). It
grows in pre-existing microfractures where the fluids can penetrate, or in fractures
created by the fluid pressure., sericite fills cracks around and across plagioclase crystals,
sericite that probably has replaced feldspar (Maruthi et al., 2018) (Fig.3.22 a and b).
Amphibole is usually strongly green in coloure, yellow-blue, blue-green and
brown. It shows strong pleochroic, moderate relief, high cleavage, birefringence biaxial
and pleochroic appears in various shades of green and brown. In plane polarized light, the
mineral colour of amphibole ranges from yellowish green to dark green in Colour. The
central part is associated corundum which pink to blood-red colored; uniaxial; low
birefringence and surface relief is high (Fig.3.22 c and d).
Fig.3.22. Photomicrographs of a and b Corundum samples (xpl and ppl) c and d Corundum
bearing Amphibolite schist around Mandya district, Sl no 52 – 64.
a b
c d

100
3.6.9. Corundum bearing Samples around Ramanagara District
Corundum: The corundum optical properties show Color: pink to blood-red colored
(some time spotted in red – Ruby or blue-Sapphire) The red color is caused by the
mineral chromium and shows brownish tone due to the presence of iron. Relief shows
high to very high. Prismatic, tabular or skeletal crystals and Rhombohedral parting/
cleavages are common. pleochroism is very strong in ordinary light and shows deep red
color when viewed in the direction of vertical axis and a much lighter color to nearly
colorless in view at right angles to this axis. Birefringence weak, Uniaxial negative. but
often up to low II order due to extra thickness of ultra-hard corundum (Fig.3.23 a and b).
The central part is associated corundum which pink to blood-red colored; uniaxial; low
birefringence and surface relief is high. Amphibole is usually strongly green in coloure,
yellow-blue, blue-green and brown. It shows strong pleochroic, moderate relief, high
cleavage, birefringence biaxial and pleochroic appears in various shades of green and
brown. In plane polarized light, the mineral colour of amphibole ranges from yellowish
green to dark green in Colour (Fig.3.23 c and d).
Fig.3.23. Photomicrographs of a and b Corundum samples (xpl and ppl) c and d Corundum
bearing Amphibolite schist around Ramanagara district, Sl no 65 – 70.
a b
c d

101
3.6.10. Corundum bearing Samples around Chamarajanagara District
Corundum bearing Pelitic gneiss: The corundum optical properties show Color:
colorless, to gray colored Relief shows high to very high. Prismatic, tabular or skeletal
crystals and rhombohedral parting/ cleavages are common. Pleochroism is very strong in
ordinary light and shows gray color when viewed in the direction of vertical axis and a
much lighter color to nearly colorless in view at right angles to this axis. Birefringence
Fig.3.24. Photomicrographs of a and b Corundum bearing Pelitic rock (xpl and ppl) c and d
Fe Garnet rich Corundum rock and e and f Corundum Garnet bearing Mylonite around
Chamarajanagara district, Sl no 71 – 71.a.
weak, Uniaxial negative, but often up to low II order due to extra thickness of ultra-hard
corundum, Parallel extinction. In hornfelses, high grade pelites and syenitic gneisses and
regionally metamorphosed rocks (Maruthi et al., 2018) (Fig.3.24 a and b). primary quartz
a b
c d
e f

102
occure as bigger grains and are stretched and elongated. Plagioclase and K.feldspar occur
as alternate bands within the schistose fabric in the pelites, tabular crystals of biotite
occure with serrated margins and exibit bent lamellae, biotite are pleochroic from brown
to dark brown color, porphyroblast garnets occur with inclusions of corundum, quartz,
plagioclase and biotite (Basavarajappa et al., 2004) (Fig.3.24 a and b).
Iron rich Garnet shows rounded brown color shape, under microscope it‘s a silicate of
various divalent metals (Aluminium,ferrous iron, and chromium) and trivalent metals (
calcium, magnesium. Ferric iron and manganese) brown color with pitted appearance and
inclusions of other minerals. Form as rounded polygonal section. Traversed by cracks.
Cleavage nill. Very high relief and birefringence nill, istropic, its form very high relief
and isotropism are characteristic. It is distinguished from olivine by its forms absence of
alteration in to serpentine and isotropism ( Fig.3.24 c and d).
Ultra mylonite also high defers and highly sheared the corundum shows color: colorless,
Relief shows high to very high. Birefringence weak, Uniaxial negative, but often up to
low II order due to extra thickness of ultra-hard corundum. Garnet shows rounded brown
color shape, under microscope, Very high relief and birefringence nill, istropic, its form
very high relief and isotropism are characteristic ( Fig.3.24 e and f).
3.6.11. Corundum bearing Samples around Kolara District
Corundum: The corundum optical properties show Color: colorless, pink to blood-red
colored (some time spotted in red – Ruby or blue-Sapphire) the red color is caused by the
mineral chromium and shows brownish tone due to the presence of iron. Relief shows
high to very high. Prismatic, tabular or skeletal crystals and rhombohedral parting/
cleavages are common. Pleochroism is very strong in ordinary light and shows deep red
color when viewed in the direction of vertical axis and a much lighter color to nearly
colorless in view at right angles to this axis. Birefringence weak, Uniaxial negative. but
often up to low II order due to extra thickness of ultra-hard corundum. Parallel extinction.
In hornfelses, high grade pelites and syenitic gneisses, environment contact and
regionally metamorphosed rocks (Fig.3.25 a and b).

103
Sericite optical properties shows Color: colorless or turbid pale greyish, Monoclinic
system, anisotropic, Pleochrosim – nill Relief weeak, Cleavage very good in one
direction in basal sections have no cleavage, Biaxial high birefringence sericite also fills
the micro fractures in plagioclase, but it does it in elongated crystals, unlike the rather
equant hematite crystals. Sericite is a fine-grained variety of muscovite, with the same
composition KAl 2(AlSi3O10)(OH)2. It usually forms by hydrothermal alteration of K-
feldspars, which provide the necessary potassium. It grows in pre-existing microfractures
where the fluids can penetrate, or in fractures created by the fluid pressure., sericite fills
cracks around and across plagioclase crystals, sericite that probably has replaced feldspar
(Fig.3.25 a and b).
Fig.3.25. Photomicrographs of a and b Corundum samples (xpl and ppl) b and c
Corundum bearing Amphibolite schist around Kolara districts, Sl no 72 – 73.a.
corundum shows color: red to blood red, Relief shows high to very high. Birefringence
weak, Uniaxial negative. Amphibole is usually strongly green in coloure, yellow-blue,
blue-green and brown. It shows strong pleochroic, moderate relief, high cleavage,
birefringence biaxial and pleochroic appears in various shades of green and brown. In
plane polarized light, the mineral colour of amphibole ranges from yellowish green to
dark green in Colour (Fig.3.25 c and d).
a b
c d

104
CHAPTER-IV 4.1. GEOCHEMISTRY
Geochemistry is the branch of Earth Science that applies chemical principles to deepen
an understanding of the Earth system and systems of other planets. Geochemistry is
the science that uses the tools and principles of chemistry to explain the mechanisms
behind major geological systems such as the Earth's crust and its oceans (Albarede
Francis., 2007). The realm of geochemistry extends beyond the Earth, encompassing the
entire Solar System (McSween et al., 2010) and has made important contributions to the
understanding of a number of processes including mantle convection, the formation
of planets and the origins of granite and basalt (Albarede Francis., 2007). The
term geochemistry was first used by the Swiss-German chemist Christian Friedrich
Schonbein in 1838 a comparative geochemistry ought to be launched, before
geochemistry can become geology, and before the mystery of the genesis of our planets
and their inorganic matter may be revealed (Kragh, Helge., 2008) However, for the rest
of the century the more common term was "chemical geology", and there was little
contact between geologists and chemists (Kragh, Helge., 2008).
Corundum (sapphire and ruby) is a crystalline form of the aluminum oxide. When
aluminum oxides are pure, the mineral is colorless, but the presence of trivalent cations
(as Ti3+, V3+, Cr3+, Fe3+) or conveniently compensated, divalent (such as Fe2+) or
tetravalent (Mn4+) ions substituting Al3+ in its lattice site gives the typical colors
(including blue, red, violet, pink, green, yellow, orange, gray, white or black) of
gemstones varieties (Khin Zaw et al., 2014). They are called ruby if red, while, all other
colors are called sapphire. Chromium oxide is the coloring matter for ruby (Harlow and
Bender, 2013). The color of blue sapphire results from the combination of titanium and
iron oxides, when Fe2+ and Ti4+ substitute the Al3+ or when a Fe3+ and Ti4+
substitutes the Al3+. With the decreasing of titanium contents the color tends towards
green and yellow (Harlow and Bender, 2013).
The obtained geochemical data allow the characterization of the corundum and
consequently help to determine genetic parameters. The geochemical features of the

105
studied corundum grains are discussed. Since these depend on the availability of elements
in the crystallization environment (Peucat et al., 2007) this suggests that the corundum
crystallized in an environment associated with: alkali and alkaline earth metals,
transitional metals, other metals and metalloids (Harlow and Bender, 2013).
4.2. ANALYTICAL METHOD
First randomly collected samples respective study area and purpose of know chemical
composition of rock samples we taken help of XRF instrument , before going to
instrument first prepare the rock sample convert to powder in department of Earth
Science University of Mysore using auget matter prepared sample is equal to talcum
powder. Elemental analysis with XRF is already the key to quality and production control
in industries analyzing a wide range of oxide materials. Finding enough standards to
setup reliable calibrations can be difficult and costly. That is why Malvern Panalytical
has developed a set of 19 synthetic, multi-element wide-range oxide (WROXI) standards.
4.2.1. The PANalytical Epsilon 3
The PANalytical Epsilon 3 is an X-ray Fluorescence Spectroscopy system that utilizes an
energy dispersive spectrometry (EDXRF) that has surpassed a technological barrier with
an elemental analysis for measuring elements ranging from Carbon (C) to Americium
(Am). Samples can be analyzed in various forms including powder, liquid, pressed pellet,
and fusion pellet. This instrument is equipped with an automated sample changer that
holds up to 10 samples and since each sample is isolated in an individual sample
container, there is almost no chance for cross contamination.
Fig.4.1. XRF Instrument CSIR lab Thiruvananthapuram Kerala

106
Working in PANalytical Epsilon 3 X-ray Fluorescence Spectroscopy lab at Materials
Science & Technology Division NIIST Thiruvananthapuram, Kerala. This instrument
Combining the latest excitation and detection technology and smart design, the analytical
performance of Epsilon 3 approaches that of more powerful and floor-standing
spectrometers. Selective excitation and careful matching of the X-ray tube output to the
capabilities of the detection system underlie the system‘s outstanding performance.
PANalytical Epsilon 3 is fast measurements are achieved by using the latest silicon drift
detector technology that produces significant higher intensities. Unique detector
electronics enable a linear count rate capacity to over 1,500,000 cps (at 50% deadtime)
and a count rate independent resolution typically better than 135 eV for better separation
of analytical lines in the spectrum. XRF is an ideal means of determining the chemical
composition of all kinds of materials. Measurements in Epsilon 3 are carried out directly
on the solid material (or liquid) with little to no sample preparation. There is no need for
any dilution or digestion and therefore no disposal of chemical waste. Epsilon 3
spectrometers can handle a large variety of sample types weighing from a few milligrams
to larger bulk samples. Samples can be measured as: Solids, Pressed powders, Loose
powders, Liquids, Fused beads, Slurries, Granules, Filters, Films and coatings.
PANalytical Epsilon 3 X-ray Fluorescence Spectroscopy instrument using powerful
Omnian software is ideal when there is no conventional calibration established for
materials that require analysis. When faced with non-routine samples or materials for
which there are no certified reference materials, Omnian provides excellent insight into
the elemental composition. Designed to provide fast and reliable quantification,
Omnian‘s advanced fundamental parameters (FP) algorithm automatically deals with the
analytical challenges posed by samples of widely differing types.
4.3. WHOLE ROCK GEOCHEMICAL ANALYSIS OF CORUNDUM BEARING
ROCKS AROUND CHITRADURGA DISTRICT
Bulk-rock major and trace element data for the samples from the Chitradurga region,
corundum and corundum bearing amphibolites schist geochemical data carried out from
lab Materials Science & Technology Division NIIST Thiruvananthapuram, Kerala
(Table. 4.1).

107
Table: 4.1. Bulk-rock geochemical Analysis Data of Corundum bearing samples around
Chitradurga area.
Major elements are in wt. %
Sl
no SiO2 Al2O3 Fe2O3 CaO MgO K2O Cr2O3 TiO2 MnO P2O5 Total
1 25.65 62.34 4.56 1.231 0 0.943 1.547 2.131 0.159 0.982 99.543
2 9.72 83.35 2.508 1.103 0 0.231 0.273 1.808 0.08 0.757 99.837
2.A 40.21 32.86 5.98 8.43 10.12 0.426 0.002 0.67 0.0322 0.595 99.3252
Minor and trace elements in ppm
Sl no CuO ZnO Ga2O3 Rb2O SrO ZrO2 NiO Eu2O3 V2O5 Yb2O3 ThO2
1 21.1 91.34 162 0 38.19 328.24 24.9 231.4 0 6.2 12.32
2 23.1 84.3 192 0 21.6 237.32 21.4 211.9 0 3.5 9.23
2.A 96.8 18 29.3 16.7 243.6 11 0.17 334.3 905.4 0 0
Whole – rock major element chemical compositions of the corundum bearing
rocks, deal with ternary diagrams using Origin pro 8.5 (a) and (b) Tridraw softwares.
(CaO+MgO) vs Al2O3 vs (Fe2O3 + TiO2) its shows alumina rich and Mg rich minerals.
Blue and red color symbols showas alumina rich rocks and green color symbol shows Mg
and Ca rich metamorphic rock. Metamorphic corundum deposits and associated
metamorphic/magmatic processes are closer to a transpersonal tectonic regime.
Chitradurga region ia near to closepet granite of transmission zone its effect on mantle
anomaly mark as asthenospheric mantle flows related to reworking and contact zone
corundum form and associated with metamorphic rocks, Al and Cr enriched metamorphic
corundum suit Ullarti kaval sample no 1 corundum Al, Si, Fe, Cr and Ti rich and Mg, Ca
and Mn poor in mineral assemblage. Kyadigunte sample no 2 corundum Al, Si, Ca, Fe
and Ti rich and Mg poor, and 2.a corundum bearing amphibolites schist Mg, Ca and Al
rich in mineral assemblages (Coenraada., 1992) (Fig.4.2) (Table.4.1).
The new geochemical data for the corundum bearing rocks are presented in Table 4.1 and
Fig.4.3 shows selected binary plots with trends towards the corundum bearing
amphibolites schist. Generally ultramafic rocks are Mg-rich and very depleted, although
it should be noted that several samples, which are rich in amphibole (tremolite) also have

108
Fig.4.2. (a) and (b) Ternary diagrams showing rock involved in the corundum formation at
Chitradurga District.
Fig.4.3. (a), (b), (c) and (d) Bulk rock geochemical analysis and binary plots of Chitradurga
district samples.

109
distinctly elevated SiO2 of up to 40 wt.%. The Amphibolite schist rich in SiO2 and Al2O3
with 40 wt.% and 32 wt.%, respectively. Corundum are characterized by having
unusually high Al2O3 of up to 83 wt. % in combination with very low SiO2 of down to 9
wt. %. There is also strong enrichment in components such as K2O, Sr and Th for the
corundum-bearing rocks Coenraads et al., 1990; Sutherland et al., 2002a.
Bulk-rock geochemical diagrams shows Oxides are in wt. %. (a) CaO vs. SiO2 showing a
significant drop in silica content from the supracrustal rocks to the corundum-bearing
rocks. (b) TiO2 vs. MgO showing a slight increase in MgO during the corundum
formation. (c) (Fe2O3 + TiO2) vs Al2O3 showing a strong enrichment in alumina for the
corundum-bearing rocks. (d) (CaO+MgO) vs Al2O3 showing a strong enrichment in Mg
for the corundum bearing amphibolite schist (Sutherland., 1996) (Fig.4.3).
4.4. WHOLE ROCK GEOCHEMICAL ANALYSIS OF CORUNDUM BEARING
ROCKS AROUND TUMKUR DISTRICT
Corundum bearing rock samples were collected and 13 samples were carried out
geochemical analysis of around Tumkur District. Chemical composition almost 78 wt%
of alumina rich corundum sample occurs in the study area (table.4.2). Sapphire genesis
related to melting of amphibole-bearing mantle source rocks at depths of 35 to 40 km,
near the crust mantle boundary, forming Si and Al-rich magmas with up to 5 wt.%
corundum either from basalt fractionation or directly (Sutherland et al., 1998a). Chemical
compositions of the corundum bearing rocks, deal with ternary diagrams. (CaO+MgO) vs
Al2O3 vs (Fe2O3 + TiO2) its shows alumina rich and Mg rich minerals. Blue and red color
symbols showas alumina rich rocks and green color symbol shows Mg and Ca rich
metamorphic rock (Fig.4.4).
Bulk-rock geochemical diagrams shows Oxides are in wt. %. (a) CaO vs. SiO2 showing a
significant drop in silica content from the corundum-bearing rocks. (b) TiO2 vs. MgO
showing a slight increase in MgO during the corundum formation in contact zone of
closepet granite. (c) (Fe2O3 + TiO2) vs Al2O3 showing a strong enrichment in alumina for
the corundum-bearing rocks in Bittanakurke, Bettadakelaginahalli, Kyathaganakere,
Veerammanahalli, Kanikalabande, Channamallanahalli Basmangikaval, Molanahalli,

110
Chickthimmanahalli and Devarayanadurga area of Tumkur district (d) (CaO+MgO) vs
Al2O3 showing a strong enrichment in Mg for the corundum bearing closepet granite
deposited Thimmapura, ChinakaVajra and Devalapura area of Tumkur district (fig.4.5).
Table: 4.2. Bulk-rock geochemical analysis data of Corundum bearing samples around
Tumakur area.
Major elements are in wt. %
Sl no SiO2 Al2O3 Fe2O3 CaO MgO K2O Cr2O3 TiO2 MnO P2O5 Total
3 10.72 81.35 2.873 1.152 0 0.246 0.39 1.91 0.07 0.651 99.362
4 16.98 76.298 3.878 0.872 0 0.343 0.1 1.245 0.03 0.233 99.979
5 61.38 24.78 3.399 1.381 0.259 7.479 0 0.276 0.026 0.773 99.753
6 9.723 83.354 2.508 1.103 0 0.231 0.273 1.808 0.08 0.757 99.837
7 11 80.123 4.132 1.243 0 0.678 0.321 1.783 0.04 0.583 99.903
8 13.11 79.92 2.061 1.987 0 0.192 0.453 1.685 0.032 0.432 99.872
9 65.12 19.2 4.916 2.521 0.665 5.615 0 0.433 0.52 0.992 99.982
10 16.212 78.21 2.321 1.234 0 0.123 0.321 1 0.029 0.395 99.846
11 8.23 84.23 2.698 1.128 0 0.243 0.272 1.794 0.03 0.679 99.304
12 9.223 83.12 2.124 1.137 0 0.213 0.269 1.782 0.05 0.721 98.639
13 10.876 81.93 2.432 1.187 0 0.219 0.281 1.802 0.07 0.723 99.52
14 61.321 26.987 2.294 1.763 0.137 6.332 0 0.174 0.014 0.773 99.795
15 8.21 85.21 2.29 1 0 0.214 0.283 1.803 0.03 0.743 99.885
Minor and trace elements in ppm
Sl no CuO ZnO Ga2O3 SrO Y2O3 ZrO2 NiO Eu2O3 Yb2O3 Rb2O ThO2
3 21.2 92.34 160 39.19 0 318.24 25.9 232.9 6.3 0 12.65
4 18.5 87.1 156 35.98 0 293.43 19.87 219.12 5.9 0 11.4
5 14.6 62 28.1 178.8 19 367.9 12.8 141.4 0 201 85.1
6 29.1 99.9 172 42.7 20.7 333.3 27.6 245.7 7.5 0 13.9
7 21.23 92.3 165 38.54 21.3 345.1 31.2 239.4 7.2 0 12.3
8 22.5 87.2 139 32.38 23.43 323.7 32.6 242.8 6.8 0 11.2
9 53.4 101.7 37.4 433.4 23.9 384.4 20.7 196.5 0 216.8 33
10 21.32 17 21.93 29.78 22.98 312.3 26.2 235.2 6.9 0 10.23
11 28.12 98.1 171 39.2 20.5 332.4 25.5 241.1 7.5 0 13.2
12 29.21 98.5 169 40.3 20.2 329.1 24.2 244.2 6.9 0 12.4
13 27.9 99.3 167 41.6 19.2 330.2 23.1 243.1 7.2 0 13.8
14 22.9 25.7 25.6 564.8 1.8 194.1 10.6 109.3 0 134 23.7
15 26.3 97.3 162 42.3 19.1 331.8 22.1 232.9 7.4 0 12.3

111
Fig.4.4. (a) and (b) Ternary diagrams showing rock involved in the corundum formation at
Tumkur District.
Fig.4.5. (a), (b), (c) and (d) Bulk rock geochemical analysis and binary plots of Tumkur
district samples.

112
4.5. WHOLE ROCK GEOCHEMICAL ANALYSIS OF CORUNDUM BEARING
ROCKS AROUND CHIKBALLAPURA DISTRICT
Chikballapura area around 6 corundum bearing samples collected and
Geochemical data carried out through laboratory environment (Table.4.3). This area
enriched alumina samples average Al 72 wt% of present in chikballapura area
Table: 4.3. Bulk-rock geochemical data of Corundum bearing samples around Chikballapura area.
Major elements are in wt. %
Sl no SiO2 Al2O3 Fe2O3 CaO MgO K2O Cr2O3 TiO2 MnO P2O5 Total
16 11.987 80.35 2.773 1.122 0 0.241 0.34 1.81 0.06 0.691 99.374
17 14.98 78.298 3.678 0.862 0 0.243 0.12 1.345 0.04 0.213 99.779
18 8.12 85.32 2.23 1.021 0 0.217 0.267 1.781 0.03 0.772 99.758
19 9.723 83.154 2.408 1.113 0 0.201 0.223 1.801 0.07 0.747 99.44
20 62.38 23.78 3.343 1.281 0.255 7.419 0 0.256 0.029 0.723 99.466
21 10.1 81.123 4.112 1.213 0 0.278 0.311 1.784 0.04 0.542 99.503
Minor and trace elements in ppm
Sl no CuO ZnO Ga2O3 Rb2O SrO Y2O3 ZrO2 NiO Eu2O3 Yb2O3 ThO2
16 20.2 91.34 162 0 39.29 0 328.24 24.9 242.9 6.1 12.12
17 19.5 88.1 123 0 36.98 0 283.43 18.87 239.1 6.9 11.9
18 27.7 91.1 155 0 41.1 18.4 323.2 24.2 211.2 7.8 12.4
19 29.2 98.9 172 0 42.2 21.7 323.1 26.5 235.7 7.4 14.9
20 13.6 61 27.1 202 168.8 18 357.9 13.8 131.4 0 75.1
21 20.29 92.3 162 0 37.54 21.6 355.2 32.2 229.4 7.5 12.4
Geochemical compositions of the corundum bearing rocks, deal with ternary diagrams.
(CaO+MgO) vs Al2O3 vs (Fe2O3 + TiO2) its shows alumina rich and Mg rich minerals.
Blue and red color symbols showas alumina rich rocks and green color symbol shows Mg
and Ca rich rock this ternary diagram shows Fe, Al and Cr rich mineral assemblages in
Chikballapura area (fig.4.6). Bulk-rock geochemical diagrams shows Oxides are in wt.
%. (a) CaO vs. SiO2 showing a significant drop in silica content from the corundum-
bearing rocks. (b) TiO2 vs. MgO showing a slight increase in MgO during the corundum
formation in contact zone of closepet granite. (c) (Fe2O3 + TiO2) vs Al2O3 showing a
strong enrichment in alumina for the corundum-bearing rocks in Hunasavadi,
Malenahalli, Kachamachanahalli, Kadiridevarahalli and Poolakuntahalli area of
Chikballapura distric. (d) (CaO+MgO) vs Al2O3 showing a strong enrichment in Mg for

113
the corundum bearing closepet granite deposited in Neralemaradalli area of
Chikballapura distric (fig.4.7).
Fig.4.6. (a) and (b) Ternary diagrams showing rock involved in the corundum formation at
Chikballapura District.
Fig.4.7. (a), (b), (c) and (d) Bulk rock geochemical analysis and binary plots of
Chikballapura district samples.

114
4.6. WHOLE ROCK GEOCHEMICAL ANALYSIS OF CORUNDUM BEARING
ROCKS AROUND HASSAN DISTRICT
Bulk-rock major and trace element data for the samples from the Hassan region,
corundum and corundum bearing amphibolites schist geochemical data carried out from
laboratory environment (Table. 4.4). Hassan district mainly covered Holenarasipura and
Nuggihalli schist belts and this area belongs to Sargur group of rocks which comprises
corundum bearing rocks were principally made up of interspersed by lands tremolite
schist, hornblende gneiss, amphibolites schist along with intrusive dykes of dolerite and
reefs of quartzite. Chemical compositions of the corundum bearing rocks, deal with
ternary diagrams using Origin pro 8.5 (a) and (b) Tridraw softwares. (CaO+MgO) vs
Al2O3 vs (Fe2O3 + TiO2) its shows alumina rich and Mg rich minerals. Blue and red color
symbols showas alumina rich rocks and green color symbol shows Mg and Ca rich
metamorphic rock. Alumina enriched corundum in Makanahalli, Undiganalu,
Dyavalapura and Belagumba area sample no 22, 23, 26 and 27 Al, Si, Fe, Cr and Ti rich
and Mg, Ca and
Table: 4.4. Bulk-rock geochemical analysis data of Corundum bearing samples around Hassan area.
Major elements are in wt. %
Sl no SiO2 Al2O3 Fe2O3 CaO MgO K2O Cr2O3 TiO2 MnO P2O5 Total
22 21.82 70.29 0.637 6.72 0 0.028 0.143 0.015 0.003 0.236 99.904
23 18.43 74.32 1.231 5.21 0 0.019 0.124 0.043 0.002 0.263 99.65
24 29 30.2 10.61 14.31
14.0
6 0.425 0.166 0.099 0.2 0.645 99.726
25 34.13 28.12 10.54 5.91
19.2
3 0.085 0.244 0.062 0.131 0.718 99.181
26 15.12 78.43 1.24 4.12 0 0.121 0.162 0.032 0.001 0.197 99.43
27 7.12 86.32 2.13 1.02 0 0.207 0.271 1.791 0.04 0.712 99.614
Minor and trace elements in ppm
Sl no CuO ZnO Ga2O3 Rb2O SrO ZrO2 BaO NiO Eu2O3 IrO2 V2O5
22 1.48 12.5 29.5 0 104.7 4.5 38.8 28.5 211.4 1.5 68.2
23 21.3 12.1 28.1 0 102.7 3.9 32.9 27.8 134.2 1.4 66.9
24 36.9 242.2 14.1 24.1 28.8 0.1 0.3 472.1 607.7 0 114.1
25 19.9 75 10.3 0 21.5 0.3 0.9 545.6 505.7 0 159.5
26 12.3 12.4 28.6 0 104.3 4,2 37.2 28.4 192.4 1.2 67.3
27 27.8 92.1 158 0 42.1 333.2 21.5 23.2 231.2 0 23.8

115
Fig.4.8. (a) and (b) Ternary diagrams showing rock involved in the corundum formation at
Hassan District.
Fig.4.9. (a), (b), (c) and (d) Bulk rock geochemical analysis and binary plots of Hassan
district samples.

116
Mn poor in mineral assemblage. Alumina enriched metamorphic corundum suit
Dasagodanahalli area and Corundum bearing chlorite schist occurs Nandihalli area
sample no 24 and 25 Mg, Ca and Al rich in mineral assemblages of Hassan district
(Fig.4.8) (Table.4.1).
Bulk-rock geochemical data diagrams shows Oxides are in wt. %. (a) CaO vs. SiO2
showing a significant drop in silica content from the corundum-bearing rocks. (b) TiO2
vs. MgO showing a slight increase in MgO during the corundum formation. (c) (Fe2O3 +
TiO2) vs Al2O3 showing a strong enrichment in alumina for the corundum-bearing rocks.
(d) (CaO+MgO) vs Al2O3 showing a strong enrichment in Mg for the corundum bearing
amphibolite schist (Fig.4.9).
4.7. WHOLE ROCK GEOCHEMICAL ANALYSIS OF CORUNDUM BEARING
ROCKS AROUND CHIKMAGALUR DISTRICT
Chikmagalur area around 5 corundum bearing samples collected and Geochemical data
carried out through laboratory environment (Table.4.5). This area enriched alumina
content average Al 60 wt% of present in Chikmagalur area samples.
Table: 4.5. Bulk-rock geochemical data of Corundum bearing samples around Chikmagalur area.
Major elements are in wt. %
Sl no SiO2 Al2O3 Fe2O3 CaO MgO K2O Cr2O3 TiO2 MnO P2O5 Total
28 13 81.2 1.4 1.2 0 0.19 0.37 1.5 0.076 0.85 99.78
29 14.29 79.35 1.56 1.7 0 0.15 0.55 1.18 0.03 0.62 99.43
30 15 78.95 1.35 1.4 0 0.21 0.76 1.35 0.021 0.43 99.47
31 31 28.75 10.21 10.22 9.56 0.13 8.77 0.31 0.16 0.32 99.43
32 35 30.96 8.98 7.32 10.78 0.14 4.95 0.76 0.17 0.56 99.62
Minor and trace elements in ppm
Sl no CuO ZnO Ga2O3 Rb2O SrO Y2O3 ZrO2 NiO Eu2O3 Yb2O3 ThO2
28 29.1 99.9 172 0.3 42.7 20.7 333.3 27.6 245.7 7.5 13.9
29 28.2 96.32 167 0.1 41.9 19.1 329.8 26.2 243.5 7.2 13.5
30 29.1 91.23 170 13.2 39.21 20.2 321.4 27.4 231.8 7.1 12.7
31 36.9 242.2 14.1 24.1 28.8 2.1 0.01 13.8 607.7 0 0
32 32.32 232.1 13.2 24.2 27.29 1.4 1.32 21.2 586.3 0 0
Geochemical compositions of the corundum bearing rocks, deal with ternary diagrams.
(CaO+MgO) vs Al2O3 vs (Fe2O3 + TiO2) its shows corundum formation of the study area.

117
Fig.4.10. (a) and (b) Ternary diagrams showing rock involved in the corundum formation at
Chikmagalur District.
Fig.4.11. (a), (b), (c) and (d) Bulk rock geochemical analysis and binary plots of
Chikmagalur district samples.

118
Blue and red color symbols showas alumina rich rocks and green color symbol shows Mg
and Ca rich rock (Fig.4.10). Bulk-rock geochemical diagrams shows Oxides are in wt. %.
(a) CaO vs. SiO2 showing a significant drop in silica content from the corundum-bearing
rocks. (b) TiO2 vs. MgO showing a slight increase in MgO during the corundum
formation. (c) (Fe2O3 + TiO2) vs Al2O3 showing a strong enrichment in alumina for the
corundum-bearing rocks in Melukoppa, Kogodu and Malanadu area. (d) (CaO+MgO) vs
Al2O3 showing a strong enrichment in Mg for the Corundum bearing amphibolites schist
deposited Kunchebylu and Heggaru area of Chikmagalur district (Fig.4.11).
4.8. WHOLE ROCK GEOCHEMICAL ANALYSIS OF CORUNDUM BEARING
ROCKS AROUND DAKSHINA KANNADA DISTRICT
Dakshina Kannada area around 3 corundum bearing samples collected and Geochemical
data carried out through laboratory environment (Table.4.6). This area enriched alumina
content average Al 60 wt% of present in Dakshina Kannada district area samples.
Table: 4.6. Bulk-rock geochemical analysis data of Corundum bearing samples around Dakshina Kannada area.
Major elements are in wt. %
Sl no SiO2 Al2O3 Fe2O3 CaO MgO K2O Cr2O3 TiO2 MnO P2O5 Total
33 18.14 73.68 0.63 5.42 0 0.28 0.14 0.15 0.36 0.23 99.03
34 14.21 77.96 1 4.23 0 0.32 0.18 0.45 0.32 0.21 99.31
35 18.12 38.21 12.12 10.56 10.47 0.147 8.55 0.38 0.17 0.56 99.31
Minor and trace elements in ppm
Sl no CuO ZnO Ga2O3 SrO Y2O3 ZrO2 NiO Eu2O3 IrO2 Yb2O3 ThO2
33 28.1 98.1 169 41.9 20.4 328 27.2 243.1 0.1 7.4 13.2
34 28.9 97.2 171 42.4 20.6 319 27.4 239.2 0.02 7.2 13.7
35 1.3 362.2 29.3 42.5 12.5 213 0.17 123 3.5 1.4 1.9
Chemical compositions of the corundum bearing rocks, deal with ternary diagrams.
(CaO+MgO) vs Al2O3 vs (Fe2O3 + TiO2), its shows corundum formation of the study
area. Blue and red color symbols showas alumina rich rocks and green color symbol
shows Mg and Ca rich rock (Fig.4.12). Bulk-rock geochemical diagrams shows Oxides
are in wt. %. (a) CaO vs. SiO2 showing a significant drop in silica content from the
corundum-bearing rocks. (b) TiO2 vs. MgO showing a slight increase in MgO during the
corundum formation. (c) (Fe2O3 + TiO2) vs Al2O3 showing a strong enrichment in
alumina for the corundum-bearing rocks in Melukoppa, Kogodu and Malanadu area. (d)
(CaO+MgO) vs Al2O3 showing a strong enrichment in Mg for the Corundum bearing

119
amphibolites schist deposited Kunchebylu and Heggaru area of Chikmagalur district
(Fig.4.13).
Fig.4.12. (a) and (b) Ternary diagrams showing rock involved in the corundum formation at
Dakshina Kannada District.
Fig.4.13. (a), (b), (c) and (d) Bulk rock geochemical analysis and binary plots of Dakshina
Kannada district samples.

120
4.9. WHOLE ROCK GEOCHEMICAL ANALYSIS OF CORUNDUM BEARING
ROCKS AROUND MYSURU DISTRICT
Table: 4.7. Bulk-rock geochemical analysis data of Corundum bearing samples around Mysuru area.
Major elements are in wt. %
Sl no SiO2 Al2O3 Fe2O3 CaO MgO K2O Cr2O3 TiO2 MnO P2O5 Total
36 4.246 93.25 0.31 1.12 0 0.11 0.34 0.231 0.13 0.21 99.947
37 3.94 92.82 0.53 0.24 0 0.13 1.15 0.606 0.045 0.04 99.501
38 24.13 41.21 11.121 9.526 10.21 0.137 1.459 0.484 0.19 0.552 99.019
39 3.17 94.82 0.33 0.16 0 0.12 0.83 0.071 0.03 0.01 99.541
40 4.81 93.42 0.612 0.15 0 0.113 0.061 0.191 0.12 0.02 99.497
41 4.31 83.55 2.61 2.1 0 0.14 4.31 1.87 0.21 0.05 99.15
42 1.66 95.27 0.41 0.12 0 0.23 1.23 0.074 0.02 0.03 99.044
43 25.12 39.21 10.12 10.43 10.58 0.137 2.559 0.284 0.18 0.572 99.188
44 8.21 84.92 1.01 1.93 0 0.231 1.54 1.21 0.04 0.432 99.523
45 24.82 29.18 34.67 1.474 7.96 0.01 0.126 0 0.787 0.701 99.731
46 13.32 80.91 1.32 1.24 0 0.231 1.03 1.12 0.32 0.321 99.812
47 25.32 40.22 10.42 10.12 10.48 0.137 1.559 0.374 0.18 0.552 99.358
48 12.89 81.072 1.934 1.45 0 0.237 0.412 1.138 0.024 0.725 99.882
49 15.12 79.92 1.23 1.21 0 0.236 0.321 1.02 0.021 0.724 99.802
50 9.1 85.32 1.92 1.12 0 0.132 0.411 1.136 0.019 0.583 99.741
51 7.9 87.12 1.32 1.01 0 0.324 0.392 1.121 0.022 0.721 99.93
Minor and trace elements in ppm
Sl no CuO ZnO Ga2O3 Rb2O SrO Y2O3 ZrO2 NiO V2O5 Yb2O3 Re
36 17.3 121.5 146 7.2 361.8 12 170.8 61.3 186.4 0.2 0.6
37 16.9 120.2 143 7.1 357.2 13 164.3 57.2 179.2 0.1 0.5
38 0 322.1 28.3 0 41.5 0 0 0.16 0 0 0
39 17.2 119.6 142 6.9 361.7 12 168.1 59.2 185.8 0.3 0.6
40 17.1 121.4 139 7.2 361.2 11 170.5 60.6 186.3 0.1 0.2
41 16.2 120.9 145 6.7 159.4 14 170.5 61.2 181.9 0.2 0.3
42 16.4 119.8 147 6.8 362.1 9 169.2 52.8 182.4 0.2 0.4
43 0 322.2 27.3 0 32.5 0 0 0.15 0 0 0
44 18.2 131.2 164 7.2 358.9 12 180.2 51.9 196.3 0.1 0.8
45 0 158.3 0 26.9 0 440.9 0 98.2 125.6 59.5 9
46 17.9 132.2 163 7.1 158.2 11 174.6 60.2 186.2 0.3 0.7
47 0 362.2 29.3 0 42.5 0 0 0.17 0 0 0
48 18.3 131.5 166 7.6 371.8 18 180.8 61.4 196.4 0.3 0.8
49 17.2 130.9 152 7.3 370.1 15 172.9 61.1 194.2 0.3 0.6
50 18.1 131.4 162 7.4 371.6 13 179.3 61.2 195.8 0.2 0.7
51 18.2 131.2 165 7.1 371.2 17 180.4 60.8 196.2 0.1 0.8

121
Bulk-rock major and trace element data for the samples from the Mysuru region,
corundum and corundum bearing amphibolites schist geochemical data carried out from
laboratory environment at Trivendrum, Kerala (Table. 4.7).
Chemical compositions of the corundum bearing rocks, deal with ternary diagrams using
Origin pro 8.5 (a) and (b) Tridraw softwares. (CaO+MgO) vs Al2O3 vs (Fe2O3 + TiO2) its
shows alumina rich and Mg rich minerals. Blue and red color symbols showas alumina
rich rocks and green color symbol shows Mg and Ca rich metamorphic rock. Alumina
enriched corundum in occurs Honnenahalli, Bylapura, Uddukaval, Padukotekaval,
Adahalli, Katur, Hanumanthapura, Handanahalli, Mavinahalli, Varuna, Kuppya,
Bommanayakanahalli and Eswaragowdanahalli area, sample no 36, 37, and 39 to 42 and
44 to 46 and 48 to 51 Al, Si, Fe, Cr and Ti rich and Mg, Ca and Mn poor in mineral
assemblage. Alumina enriched metamorphic corundum suit Corundum bearing
amphibolites sch ist occurs in Krishnarajanagara, Halasur and Someshwarapura area sample no
38, 43, 45 and 47 Mg, Ca and Al rich in mineral assemblages of Mysuru district area
(Fig.4.14) (Table.4.7).
Bulk-rock geochemical data diagrams shows Oxides are in wt. %. (a) CaO vs. SiO2
showing a significant drop in silica content from the corundum-bearing rocks. (b) TiO2
vs. MgO showing a slight increase in MgO magmatic deposition during the corundum
formation. (c) (Fe2O3 + TiO2) vs Al2O3 showing a strong enrichment in alumina for the
corundum-bearing rocks. (d) (CaO+MgO) vs Al2O3 showing a strong enrichment in Mg
for the metamorphic deposits of corundum bearing amphibolite schist (Fig.4.15).

122
Fig.4.14. (a) and (b) Ternary diagrams showing rock involved in the corundum formation at
Mysuru District.
Fig.4.15. (a), (b), (c) and (d) Bulk rock geochemical analysis and binary plots of Mysuru
district samples.

123
4.10. WHOLE ROCK GEOCHEMICAL ANALYSIS OF CORUNDUM BEARING
ROCKS AROUND MANDYA DISTRICT
Mandya area around 13 corundum bearing samples collected and geochemical data
carried out through laboratory environment (Table.4.6). This area enriched alumina
content average Al 76 wt% of present in Mandya district area samples.
Table: 4.8. Bulk-rock geochemical analysis data of Corundum bearing samples around Mandya area.
Major elements are in wt. %
sl no SiO2 Al2O3 Fe2O3 CaO MgO K2O Cr2O3 TiO2 MnO P2O5 Total
52 10.72 83.21 2.20 1.003 0 0.221 0.253 1.408 0.07 0.747 99.84
53 38.21 34.86 5.91 8.45 10.14 0.416 0.003 0.69 0.032 0.515 99.22
54 16.24 78.32 1.93 1.01 0 0.222 0.245 1.094 0.05 0.739 99.85
55 13.1 81.23 1.43 1.002 0 0.19 0.249 1.092 0.06 0.741 99.09
56 12.86 80.93 2.11 1.003 0 0.22 0.252 1.023 0.07 0.742 99.21
57 11.32 84.21 1.13 1.012 0 0.211 0.239 1.123 0.04 0.694 99.97
58 9.1 86.12 1.01 1.023 0 0.218 0.231 1.432 0.03 0.632 99.79
59 15.14 79.28 2.12 1.019 0 0.215 0.252 1.393 0.07 0.232 99.72
60 12.21 82.34 1.02 1.002 0 0.212 0.25 1.342 0.04 0.742 99.15
61 35.21 39.86 5.12 7.43 10.21 0.413 0.002 0.68 0.031 0.495 99.45
62 10.1 84.1 1.57 1.09 0 0.19 0.23 1.01 0.032 0.75 99.09
63 10.2 83.9 1.23 1.27 0 0.21 0.2 1.7 0.083 0.71 99.52
64 8.56 85.6 1.08 1.4 0 0.22 0.27 1.6 0.084 0.74 99.58
Minor and trace elements in ppm
sl no CuO ZnO Ga2O3 SrO Y2O3 ZrO2 NiO Nd2O3 Eu2O3 V2O5 Yb2O3
52 23.1 89.9 171 42.6 20.1 313.3 25.6 123.2 215.7 2.3 7.4
53 91.8 17 28.3 223.6 0 12 0.16 12.34 324.3 901.4 0
54 19.8 89.1 170 42.3 18.3 333.1 18.2 43.11 214.9 53.1 7.1
55 20.1 89.6 167 41.8 19.2 331.7 21.4 211.2 214.8 2.4 7.2
56 22.9 88.1 162 42.5 19.9 331.4 24.9 123.1 215.3 1.2 6.9
57 23.2 85.3 164 42.6 20.1 326.4 25.5 143.6 215.6 5.3 7.01
58 23.1 81.8 169 41.4 18.2 320.2 24.5 224.2 212.4 4.9 7.3
59 20.4 80.3 170 40.9 17.9 318.9 23.5 64.2 210.3 2.6 7.4
60 20.3 78.3 171 42.1 20.2 316.2 25.1 81.3 215.2 3.1 7.5
61 95.8 18 27.3 213.6 0 11 0.15 26.1 333.1 903.1 0
62 28.1 98.1 169 42.1 20.7 332.1 26.2 245.2 214.1 6.8 13.1
63 29.1 97.9 161 41.2 21.1 329.9 26.9 243.7 209.2 7.2 12.8
64 27.3 97.4 159 41.8 19.9 331.2 27.6 241.9 87.2 7.5 13

124
Fig.4.16. (a) and (b) Ternary diagrams showing rock involved in the corundum formation at
Mandya District.
Fig.4.17. (a), (b), (c) and (d) Bulk rock geochemical analysis and binary plots of Mandya
district samples.

125
Chemical compositions of the corundum bearing rocks, deal with ternary diagrams.
(CaO+MgO) vs Al2O3 vs (Fe2O3 + TiO2), its shows corundum formation of the study
area. Blue and red color symbols showas alumina rich granulate rocks and green color
symbol shows Mg and Ca rich rock (Fig.4.16).
Geochemical data diagrams shows Oxides are in wt. %. (a) CaO vs. SiO2 showing a
significant drop in silica content from the corundum-bearing rocks. (b) TiO2 vs. MgO
showing a slight increase in MgO during the corundum formation. (c) (Fe2O3 + TiO2) vs
Al2O3 showing a strong enrichment in alumina for magmatic deposition of the corundum-
bearing rocks in Machaholalu, Bannur, Hemmige, Ballegere, Doddaboovalli, Malavalli,
Nelamakanahalli, Ahasale, Kesthur, Hanumanthapura and Maddur area. (d) (CaO+MgO)
vs Al2O3 showing a strong enrichment in Mg for the Corundum bearing amphibolites
schist deposited Adaguru and Tharanagere area of Mandya district (Fig.4.17).
4.11. WHOLE ROCK GEOCHEMICAL ANALYSIS OF CORUNDUM BEARING
ROCKS AROUND RAMANAGARA DISTRICT
Bulk-rock major and trace element data for the samples from the Ramanagara region,
corundum and corundum bearing amphibolites schist geochemical data carried out lab at
Thiruvananthapuram, Kerala (Table. 4.9).
Whole – rock major element chemical compositions of the corundum bearing rocks, deal
with ternary diagrams using softwares. (CaO+MgO) vs Al2O3 vs (Fe2O3 + TiO2) its
shows alumina rich and Mg rich minerals. Blue and red color symbols showas alumina
rich rocks and green color symbol shows Mg and Ca rich metamorphic rocks.
Metamorphic corundum deposits and associated metamorphic/magmatic processes are
closer to a transpersonal tectonic regime. Ramanagara area is near to closepet granite of
transmission zone its effect on mantle anomaly mark as asthenospheric mantle flows
related to reworking and contact zone corundum form and associated with metamorphic
rocks, Al and Cr enriched metamorphic corundum suit. sample no 65 to 68 corundum Al,
Si, Fe, Cr and Ti rich and Mg, Ca and Mn poor in mineral assemblage. sample no 69 and
70 corundum bearing amphibolites schist Mg, Ca and Al rich in mineral assemblages
(Fig.4.18) (Table.4.9).

126
Fig.4.18. (a) and (b) Ternary diagrams showing rock involved in the corundum formation at
Ramanagara District.
Fig.4.19. (a), (b), (c) and (d) Bulk rock geochemical analysis and binary plots of
Ramanagara district samples.

127
Bulk-rock geochemical data diagrams shows Oxides are in wt. %. (a) CaO vs. SiO2
showing a significant drop in silica content from the corundum-bearing rocks. (b) TiO2
vs. MgO showing a slight increase in MgO metamorphic deposition during the corundum
formation. (c) (Fe2O3 + TiO2) vs Al2O3 showing a strong enrichment in alumina for the
corundum-bearing rocks in Huthridurga, Varthehalli, Akkur and Hosahalli area. (d)
(CaO+MgO) vs Al2O3 showing a strong enrichment in Mg for the metamorphic deposits
of corundum bearing amphibolite schist in Lakkashettypura and Byranaikanahalli area.
(Fig.4.19).
Table: 4.9. Bulk-rock geochemical data of Corundum bearing samples around Ramanagara area.
Major elements are in wt. %
sl no SiO2 Al2O3 Fe2O3 CaO MgO K2O Cr2O3 TiO2 MnO P2O5 Total
65 9.72 83.35 2.5 1.1 0 0.23 0.27 1.8 0.085 0.75 99.80
66 12.89 81.07 1.93 1.45 0 0.23 0.41 1.13 0.02 0.72 99.85
67 14.2 78.9 2.3 1.2 0 0.24 0.24 1.8 0.072 0.65 99.60
68 15.34 79.72 1.9 0.21 0 0.21 0.26 1.09 0.082 0.68 99.49
69 31.8 30.8 12.12 10.56 10.47 0.14 2.55 0.38 0.17 0.56 99.55
70 38.59 31.11 7.72 6.43 11.8 0.12 2.34 0.87 0.05 0.7 99.73
Minor and trace elements in ppm
sl no CuO ZnO Ga2O3 Rb2O SrO Y2O3 ZrO2 NiO Eu2O3 Yb2O3 ThO2
65 29.2 99.2 162 0.4 41.9 20.6 341.3 27.5 237.4 7.4 13.1
66 28.1 99.6 192 1.3 42.6 19.4 331.1 27.7 244.9 7.5 13.8
67 27.2 99.7 168 4.2 42.8 20.1 329.2 27.6 245.6 7.1 12.2
68 27.9 98.3 179 1.3 41.1 21.01 321.9 27.4 243.1 6.9 12.9
69 95.8 18 27.5 15.9 243.4 12.4 11 0.16 332.1 1.2 0
70 94.4 17 28.9 14.2 242.5 5.9 12 0.18 329.9 0.9 0
4.12. WHOLE ROCK GEOCHEMICAL ANALYSIS OF CORUNDUM BEARING
ROCKS AROUND CHAMARAJANAGARA DISTRICT
Chamarajanagara area one corundum bearing samples collected and Geochemical
data carried out through laboratory environment (Table.4.10). Chemical compositions of
the corundum bearing rocks, deal with ternary diagrams using geochemistry softwares.
(CaO+MgO) vs Al2O3 vs (Fe2O3 + TiO2) its shows alumina rich Fe and Mg rich minerals.
Blue and red color symbols showas alumina rich pelitic rock. Corundum bearing politic
rock occurs Budipadaga area, sample no 70 Alumina enriched metamorphic corundum

128
suit Fe, Mg, Ca and Al rich in mineral assemblages of Chamarajanagara district area
(Fig.4.20) (Table.4.10).
Table:4.10. Bulk-rock geochemical analysis data of Corundum bearing samples around
Chamarajanagara area.
Major elements are in wt. %
sl no SiO2 Al2O3 Fe2O3 CaO MgO K2O Cr2O3 TiO2 MnO P2O5 Total
71 39.1 32.89 11.95 2.624 7.333 3.643 0.076 0.82 0.181 0.881 99.501
Minor and trace elements in ppm
sl no CuO ZnO Ga2O3 Rb2O SrO Y2O3 ZrO2 NiO Eu2O3 IrO2 V2O5
71 87.3 95.6 29.1 124.6 234.7 32.6 132.6 380.4 779.5 2.3 531.8
Fig.4.20. (a) and (b) Ternary diagrams showing rock involved in the corundum formation at
Chamarajanagara District.

129
4.13. WHOLE ROCK GEOCHEMICAL ANALYSIS OF CORUNDUM BEARING
ROCKS AROUND KOLARA DISTRICT
Bulk-rock major and trace element data for the samples from the Kolara region,
corundum and corundum bearing litho units geochemical data carried out lab at
Thiruvananthapuram, Kerala (Table. 4.11).
Table:4.11. Bulk-rock geochemical data of Corundum bearing samples from Kolara area.
Major elements are in wt. %
sl no SiO2 Al2O3 Fe2O3 CaO MgO K2O Cr2O3 TiO2 MnO P2O5 Total
72 17.14 78.28 1.12 1.01 0 0.214 0.232 1.381 0.05 0.22 99.656
73 19.72 73.35 1.873 1.11 0 0.236 0.37 1.9 0.07 0.641 99.272
Minor and trace elements in ppm
sl no CuO ZnO Ga2O3 SrO Y2O3 ZrO2 NiO Eu2O3 Yb2O3 IrO2 V2O5
72 19.4 79.3 171 40.1 17.2 323.9 22.5 209.3 7.2 3.4 905.2
73 20.1 72.3 169 41.1 19.3 331.2 24.1 213.2 7.6 3.1 904.1
Whole – rock major element chemical compositions of the corundum bearing rocks, deal
with ternary diagrams using softwares. (CaO+MgO) vs Al2O3 vs (Fe2O3 + TiO2) its
shows alumina rich and Mg rich minerals. Blue and red color symbols showas alumina
rich rocks and green color symbol shows Mg and Ca rich metamorphic rocks (Fig.4.21)
Bulk-rock geochemical data diagrams shows Oxides are in wt. %. (a) CaO vs. SiO2
showing a significant drop in silica content from the corundum-bearing rocks. (b) TiO2
vs. MgO showing a slight increase in MgO metamorphic deposition during the corundum
formation. (c) (Fe2O3 + TiO2) vs Al2O3 showing a strong enrichment in alumina for the
corundum-bearing rocks in Yelasandra area. (d) (CaO+MgO) vs Al2O3 showing a strong
enrichment in Mg for the metamorphic deposits of corundum bearing amphibolite schist
in Kammasandra area. (Fig.4.22).

130
Fig.4.21. (a) and (b) Ternary diagrams showing rock involved in the corundum formation at
Kolar District.
Fig.4.22. (a), (b), (c) and (d) Bulk rock geochemical analysis and binary plots of Kolara
district samples.

131
CHAPTER-V
5.1. HYPERSPECTRAL REMOTESENSING
Hyperspectral remote sensing is one of the advance technology which began in early
1980s is one of the most significant break throughs in Remote Sensing. It emerged as a
promising technology in remote sensing for studying earth surface materials by two ways
spectrally & spatially (Varshney and Arora., 2004). In this technology imaging and
spectroscopy is combined in a single system so this is also known as imaging
spectroscopy (Curran Paul., 2001). This technology is developed by breaking a broad
band from the visible and infra-red into hundreds of spectral parts to obtain geochemical
information from inaccessible planetary surfaces (Goetz et al., 1985). Hyperspectral
remote sensing is able to provide a high level of performance in spectral & radiometric
calibration accuracy in the data sets. These high performing sensors data can be utilized
for extracting information in various quantitative and qualitative applications (Clark et
al., 1998). The ample spectral information provided by hyperspectral data is able to
identify and distinguish spectrally similar materials which enhance the capability of
distinguishing various ground objects in detail (Rechards et al., 1999). Hyperspectral
sensorscollect information as a series of narrow and contiguous wavelength bands at 10
to 20 nm intervals (Shippert., 2008). The spectra for a single pixel in hyperspectral data
appears similar like a laboratory quality spectra collected by a spectro-radiometer which
can be used for understanding the spectral characteristics of the material (Clark., 1998).
5.1.1. PRINCIPLE OF IMAGING SPECTROSCOPY
As Hyperspectral Remote Sensing technology is also known as Imaging Spectroscopy
which is considered to be as combination of three following photonic technologies:
1. Conventional Imaging,
2. Spectroscopy, &
3. Radiometry

132
Above three technologies are used to produce images for which a spectral signature is
associated with each pixel (Shih., 2004). The position of imaging spectroscopy and other
related technologies is shown in Figure 5.1. The datasets produced by hyperspectral
imager is in the form of a three dimensional data cube in which two dimensions
represents spatial information and third dimension represents spectral information
(Goetz., 1992). The values recorded by Spectral Imager Instrument (SII) can be
converted, via proper calibration, to radiometric quantities that are related to the scene
phenomenology.
Fig.5.1. Relationship among Radiometric, Spectrometric, and Imaging Techniques
(Elachi 1987)
Spectroscopy depends on the pretext that different materials are different because of the
difference in their morphology, constituents & structure and because of thae target
interact differently with light so they appear different (Goetz., 1992). The aim of Imaging
Spectroscopy is to understand the Earth's surface through the detailed analysis of its
reflected light, exploiting subtle variations in surface composition and structure in
support of real-world requirements. For spectroscopic study, hyperspectral data sets
provide ample spectral detail to discern the subtle differences in color distributions from
Earth surface materials ((Shippert., 2008). Because Earth's surface is populated with the
molecules of the solids and liquids and having characteristic spectral features generally

133
wider than some tens of nanometers, which establishes a practical definition for the
maximum spectral band size for a hyperspectral data set (Dyer Johen., 1994).
The reflectance spectra of most of the Earth's surface materials contain characteristic or
diagnostic absorption features in the spectral range of 350 to 2500 nm. Since these
diagnostic features are typically of a very narrow spectral appearance, those surface
materials can be identified directly, if the spectrum is sampled at sufficiently high
spectral resolution which becomes possible using imaging spectrometers. There are three
types of main absorption features found generally in the spectral range of 350 to 2500 nm
regions which should be understood to realize the requirement of hyperspectral imaging
system (Tong et al., 2001).
Charge transfer absorptions: These types of absorptions are caused by light at certain
wavelengths causing electrons to be transferred between atoms and generally occur in the
visible region of the spectrum, and. For example: Fe3+ and Fe2+. Light at the proper
wavelength causes an electron to be transferred from a Fe2+ atom to a Fe3+ atom and
due to that rusty objects appear red. Detection of this type of absorption is easy as they
are quite broad, so it is possible to detect thoseusing conventional multispectral sensors.
As there is overlap among the absorptions caused by different atoms, so Hyperspectral
sensors are required to tell them apart (Elachi., 1987) (Varshney and Arora., 2004).
Electron transition absorptions: In atoms with an incomplete electron shell, light at the
proper wavelength can bump electrons into different positions in the shell. These
absorptions tend to be narrower than the charge transfer absorptions and the type of atom
and the position and variety of its neighbors controls the wavelengths of the absorptions.
This feature is especially useful in geology, where the arrangement of atoms in a mineral
is very well defined. Since subtle variations in the position of the band centre are
important, it is necessary to have many narrowly spaced bands to take advantage of this
feature (Schowengerdt Robert., 1997).
Vibrational absorptions: When light at the same wavelength as a molecule (or part of a
molecule) strikes the molecule, it causes the molecule (or part of the molecule) to vibrate.
This leads to light absorption. In general these absorptions are very narrow, although
their widths and depths vary. Many of the absorptions seen in the 0.35 to 2.5µm region

134
actually originate at longer wavelengths, and what we are seeing are combinations and
overtones of the original wavelength. Most of these absorptions can be detected with a
multispectral sensor (Lillesand and Kiefer., 2002).
5.1.2. MULTISPECTRAL VS. HYPERSPECTRAL
Multispectral datasets are produced by sensors which record reflected electromagnetic
energy within some specific sections or broad bands of the electromagnetic spectrum
(Barry et al., 2001). These Sensors usually produce 3 to 10 number of spectral bands
which ranges from visible to near infrared region. However, the spectral resolution and
mineral discrimination power is very low. Example of Multispectral Satellite Sensors
(MSS) are Landsat, Spot and IRS satellites ((Pignatti et al., 2009).
Hyperspectral sensors measure energy in narrower and more numerous bands than
multispectral sensors. Hyperspectral data contains 100s or more narrow contiguous
spectral bands. The numerous narrow bands of hyperspectral sensors provide a
continuous spectral measurement across the entire electromagnetic spectrum and
therefore, are more sensitive to subtle variations in reflected energy. Images produced
from hyperspectral sensors contain much more data than images from multispectral
sensors and have a greater potential to detect differences among land and water features
(Liew et al., 2002). Hyperspectral sensors are having capability to detect and distinguish
individual absorption bands in mineral deposits, vegetation and man-made materials. This
discrimination is achieved by spectral sampling at approximately 10 nm intervals across
the spectrum. Multispectral images can be used to map forested areas, while
hyperspectral images can be used to map tree species within the forest.
Monitoring land cover using satellite sensors such as Landsat and SPOT has been
predominant in ecological applications since the 1970s (Pignatti et al., 2009).
Considerable advances in Remote Sensing Technology (RST) are driven by
environmental issues rapidly arising at regional scales. There is lack of literature on the
subject of spaceborne hyperspectral imagery comparison and the assessment of land
cover information, specifically in urban areas. By comparing hyperspectral and
multispectral imagery, accurate vegetation mapping is possible, especially at dense urban

135
scales (Liew et al., 2002). The spectral resolution is the main factor that distinguishes
hyperspectral imagery from multispectral imagery (Barry et al., 2001). Hyperspectral
sensors contain bands with narrow wavelengths while multispectral sensors contain bands
with broad wavelengths. The advantage of using hyperspectral data over multispectral
data is the ability to define surface features with a higher spectral resolution. A complete
list of spaceborne hyperspectral satellites currently in orbit and set to launch is found in
Buckingham and Staenz (2008).
Table.5.1. Airborne Hyperspectral Sensors (AHS)
Sensor Spectral
coverage(nm)
No.of
Bands
Band width
(nm)
Spatial
Resolution(m)
Image tech Country Launched
/developer
GERIS(Geophysical
Environment
Research
Imaging Spectrometer II)
400 - 1000
1400 - 1800
2000 - 2500
24
7
32
25.4
120.0
16.5
1-10
Whisk broom
USA
1987/GRE
corp.
AVIRIS(Airborne visible
infrared imaging
spectrometer)
380-2500
220
10
5-20
Whisk broom
USA
1987/JPL
CASI(Compact Airborne
Imaging Spectrometer)
400-800
288
1.8
30
Pushbroom
Canada
1988/ITRES
research Ltd
DAIS (Digital Airborne
Imaging Spectrometer)
400-1200
1500-1800
2000-2500
72
15-30
45
20
1-10
Pushbroom
Europe
1995/GRE
corp.
HYDICE(Hyperspectral
Data Image
Collection Experiment)
400 - 2500 10.2 210 3 Whisk broom USA 1996/Naval
research lab
HyMAP 400 - 2500 16 125 3-5 Whisk broom Australia HyVista Corp
AisaEAGLE 400 - 970 5 200 <1 Spectir Corp

136
Table.5.2. Spaceborne Hyperspectral Sensors (SHS)
Sensor
Spectral coverage
(nm)
No.of
Bands
Band width
(nm)
Spatial Resolution
(m)
Swath
(km)
launch Year Agency
Moderate Resolution
Imaging Spectrometer
(MODIS)- AQUA
400 - 800
32
250-1000
1500
May 2002
NASA
MODIS- TERA 800 - 1455 36 250-1000 2300 Dec 1999
MERIS (Medium
Resolution
410to1050 15 10 Ocean: 1040x ESA
Imaging Spectrometer) 1200, 1150
Land & coast:
260 x 300
Hyperion on EO-1 400-2500 220 10 3 7.5 Nov 2000 NASA
CHRIS (Compact High
Resolution
Imaging
Spectrometer on
PROBA-1)
438 -1035
18-64
1.25-
11
18-36
14-18
Oct 2001
ESA
HySI(Hyperspectral
Imager) on IMS-1
400 - 950 64 <15 550 128 Apr 2008 ISRO
Extraterrestrial hyperspectral sensors
Chandrayaan-1 HySI 400 - 920 64 15 80 20 2008 ISRO
Chandrayaan-1 M3
(Moon Mineralogy
Mapper)
400 - 3000 86 10-40 70-140 40 2008 ISRO
OMEGA(Observatoire
pour
la Mineralogie, l’Eau, le
Glace e l’Activite)
360 to5100 7-20 300-4000 8.8 NASA
CRISM (Compact 362-3920 545 6.55 15.7 to 19.7 9.4 - NASA
Reconnaissance Imaging 11.9
Spectrometer for Mars)
Hyperspectral Remote Sensing Sensors: Now-a-days there are many ground-based and
airborne hyperspectral sensors but very few spaceborne hyperspectral sensors are

137
available. Various airborne and spaceborne hyperspectral sensors developed by several
space agencies national & international are in Table 5.1 & Table 5. 2
5.1.3. HYPERSPECTRAL DATA PROCESSING
For effective utilization of Hyperspectral sensors data sets, different kind of processing
and analyzing techniques are required for various applications. All the Hyperspectral
sensors developed have enabled generation of remotely sensed laboratory spectra of
various materials such as rocks, soils, plants, snow, ice, water and man-made materials
(Varshney and Arora., 2004). These laboratory quality spectra have been used to obtain
compositional information of the earth surface as they are able to detect absorption
features caused by minerals in visible, Shallow Wave Infrared Range (SWIR) and
Thermal Infrared Range (TIR) region of electromagnetic spectrum. AVIRIS sensor by
NASA JPL has been used especially for the mapping of cations and anion for
identification of various minerals and rocks (Curran Paul., 2001). The large amount of
spectral information in hyperspectral data is useful for species level discrimination by
identifying components unique to certain species of plants. This hyperspectral technology
also provides a means for optical oceanographers to classify and quantify complex
oceanic environments (Clark et al., 1998).
5.2. SPECTROSCOPY
Spectroscopy is the study of light interaction as a function of wavelength,
interactions contain light emitting, reflection or scattering from any of the material or a
target. These principles are applied to get spectroscopy of the mineral and rocks with the
help of spectroradiometry is used to measure the radiometric quantities like radiance and
irradiance in a continuous bands of spectral ranges 0.35 to 2.5µ in the EMS. Imaging
spectroscopy may also called as imaging spectrometry, or hyperspectral by Remote
Sensing community, Imaging includes study of rock in the laboratory, a field study site
from an aircraft or a planet observation through spacecraft/ Earth based Telescope.
Hence, the name Hyperspectral Remote Sensing has taken for this chapter heading,
hyperspectral sensitiveness of different rocks and minerals from the Precambrian terrains
of southern part of Southern Karnataka has dealt and details are given with reference to

138
many earlier researchers (Goetz et al., 1985); (Green et al., 1988); (Roger Clark 1999)
(Clark et al., 1993) (Vane et al., 1993); (Kruse 1997) (Mustard and Sunshine., 1999) and
(Basavarajappa et al., 2019). The Imaging spectroscopy in this context is of purely the
spectroscopic studies of rock in the laboratory environment. Spectro-radiometer
instrument (Spectral Evolution SR-3500) is extensively used to measure the radiometric
quantities (reflection and absorption of radiance spectra) by extracting different
diagnostic spectral signature of the rock and minerals, the spectral signature studies and
interpretation techniques are utilized to differentiate the minerals and mineral assemblage
in the mixture Hunt and Salisbury (1970), Hunt et al., (1971), (Graham Hunt 1977), Hunt
and Ashley (1979) and (Kruse et al., 2003).
5.2.1. SPECTRAL REFLECTANCE
All the surficial features, naturally formed and manmade structures occurred on
the earth‘s surface or near surface reflects and emits the Electro Magnetic radiation with
respect to characteristics of their chemical composition and physical state, within the
range of Electro Magnetic 0.35 to 2.55 µm for the spectral signature (reflectance) studies.
Spectral reflectance of a material is described by the interaction of light in continuous
EM radiation due its physical phenomena and its inheritance optical property. The
measureable reflected light at a particular region of wavelength is a functional nature of
the elemental composition of the material and the wavelength covers from visible to near
infrared region (Hoover et al., 1993). The two process involved in this measurements are
electronic process and vibration process, like crystal field effect, charge transfer and
conduction band transitions can detected by electronic process with an example of Fe,
Mn, Cr absorption characteristics feature and with molecular vibrational process the
parameters of hydroxyl and carbonate is well studied by Rowan et al., 2004; Ali et al.,
2008 and Hunt 1977. Gaffey in 1986 said and enlightened the spectral reflectance studies
in the visible-near infrared portion of EMS as a rapid, non-destructive and inexpensive
technique in the field of mineralogical studies.
Spectral signatures are the representation of the spectral response of certain features
in a graphical manner as a function of wavelength and reflectance. According to the
elemental and mineralogical composition of a material the spectral curve gives the

139
different variation in the absorption and reflectance position and it serves to identify the
minerals and rock types and other useful information (Hunt, 1977). The present day
advanced remote sensing sensors like ASTER and Hyperion and Airborne Sensors taking
out the extensive application in the mapping of oxides, sulfides and hydrothermally
altered rock (Ferrier and Wadge, 1996). Many of this alterations host the presence of OH
and other hydroxyl bonds like Al-OH and Mg-OH will produce the distinctive absorption
feature near the SWIR (2-2.4µm) region of the spectrum (Borengasser et al., 2008). The
oxides mineral abundance shows the OH and other hydroxyl bond absorption (AL-OH) in
the SWIR region and Corundum shows in the region of visible and SWIR (0.65, 2.10,
2.20 and 2.30 µm) as a combination of internal vibration of the corundum mineral (Hunt
et al., 1971) (Hunt, 1977; Ferrier and Wadge, 1996) (Ali et al., 2008) (Manjunatha.,
2017) and (Jeevan., 2018).
Spectroscopy is the techniques firstly used by the astronomers for the planetary
studies further with advancement in the space research and increased awareness brings
the usage of spectroscopy, the first spectrometer utilized for imaging spectroscopy is
done by Goetz et al., 1982 and Vane et al., 1993. For an Earth Observation Studies
Airborne Imaging Spectrometer and Spaceborne Spectrometer activities have taken the
huge part and wide basis availabilities in the field of remote sensing and this can be seen
from last three decade early from 1990s (Goetz 1983; Kruse et al., 1990 and Green et
al.,1998). Reflectance, absorption and emittance of spectral curves are the three
properties of all surficial mineral gives the distribution of the key minerals and some
indication of the hidden treasures and emittance display the compositional variation in the
silicates of the main lithology (Rowan et al., 2005; Moghtaderi, et al., 2007). Reflectance
spectroscopy has proven to be most powerful and versatile Remote Sensing technique for
determining surface mineralogy, chemical compositions and lithologies of planetary
objects, as well as constituents of their atmosphere (Hunt 1980). Spectral reflectance
studies is the recent advanced technique used in mapping corundum original zones,
lithotypes, mineralization and vegetation. Spectroscopy gives a rich of information about
mineralogical content because of its great potentiality in a diagnostic tool which is very
sensitive to subtle changes in crystal structure or chemistry of the rock (Clark, 1999).

140
On the time of data acquisition the remotely sensed data and so called reflectance values
will get affected from the many factors includes the physical state of the surface and it
also depends on the orientation of the sensors towards the sun position (Ferrier et al.,
2002). In the spectral studies of minerals and rocks, the common variation is represented
by new or increases spectral structures due to hydroxyl group, ferric and ferrous ion,
carbonates and water. Vegetation, organic matters and manmade structures will affect the
accuracy and effectiveness of the spectral signature while studying the rocks and their
mineral composites. Discrimination of different rock types is simple if these noise factors
will not overcome the signal. The signal to noise ratio will permit the further studies in
the spectral analysis. Scattering, atmospheric absorption and noise also contribute to the
errors in spectral signature. Longshaw in 1974 studied the difference between lab based
spectral reflectance and field based reflectance studies for the same rocks and he noticed
the main features in both spectral curves and minor difference, and later he said that these
are not identical to each other in full region but exerts the main parameters. The
researchers like Hunt and Salisbury (1970); Hunt et al. (1971); Hunt et al. (1973);
Farmer (1974); Hunt and Ashley (1979); Hunt (1980); Clark (1999); Rowan et al (2004);
Rowan et al.(2005); Ali M Qaid and Basavarajappa., (2008); Ali et al., (2009); Rajendran
et al., (2011); Magendran and Sanjeevi., (2011); (Ali et al., 2008) (Manjunatha., 2017)
and (Jeevan., 2018) (Basavarajappa et al., 2018) amd (Maruthi and Basavarajappa.,
2018). basically started and given foremost contribution in the fundamental investigations
about the spectral feature of minerals and rocks from the last three decades.
5.2.2. SPECTRAL REFLECTANCE OF ROCKS
The internal molecular structure, cation and anions of the rock mixture are
variation factors will always give different spectral characteristics while studying the
spectral signatures of the rock. With the advent technology the spectrometry (spectral
measurements) made in both laboratory and field environment for different minerals
indicated the spectral variations in the both VNIR and SWIR. Visible and Near Infrared
regions, where 0.35 to 1.0 µm shows more variation due to the transition metals, such as
Fe, Mn, Cu, Ni, Cr etc., and in short wavelength infrared region it is quite dominated by
the hydroxyl ions, carbonates and water molecules. Oxides and Hydroxides mineral

141
zones are associated with corundum, Margaret, clays and hydrated silicates which shows
the main combination of hydroxyl ions with magnesium (Mg-OH) and aluminum (AL-
OH) diagnostically shows a vibrational absorption bands 2.3 and 2.2 µm respectively.
The kaolinite a clay mineral is going to have the combination of Mg-OH and AL-OH
which shows doublet variation with absorption dip at 2.3 µm and weaker one at 2.2 µm
(Shanks III W.C. Pat., 2010). Montmorillonite and muscovite contains the Mg-OH ion
combination gives the absorption band at 2.3 µm. The clay mineral occurrences in a
composite gives the peak of reflectance near 1.6 µm and beyond this it decreases due to
absorption bands, absorption bands due to water molecule presence gives at 1.4 µm and
1.9 µm. Calcite, dolomite, magnesite, siderite shows absorption variation in spectral
analyst at 1.9 µm, 2.35 µm, and 2.55 of SWIR region (Gupta 2003, Ravi and Gupta
2018).
The abundantly occurred silicates, oxides, nitrate and phosphates on the earth
surface do not have much diagnostic spectral features in the reflected regions (0.4 to 2.5
µm) of the EMS. For these mineral studies the thermal infrared region is more utilized to
characterize the spectral variation in EMS (Hunt, 1977, 1979, 1980; Salisbury and Wald,
1992; Gupta, 2003). The diagnostic spectral characteristics in terms of wavelength and by
absorption peak occurrences, the various cations and anions of different mineral and
metals absorption peaks occurrences in the EMS are summarized in the table 5.4 listed
by Gupta, 2003. However many minerals have their characteristic absorption features that
permit to direct identification of the specific mineral. The pioneering work of Graham
Hunt of the U.S. Geological survey documented the reflectance spectra of a wide range
minerals and ultimately led to the development if hyperspectral sensors(Goetz et al.,
1985). Spectral libraries are now available for a large variety of minerals and rocks
through the USGS (Clark et al., 2002 and NASA1999) spectral libraries. The spectra of
rocks depend on the spectra of the constituent minerals and their textural properties such
as grain size, packing, and mixing (Gupta, 2003). In semi-arid and arid areas the spectral
reflectance curves of rocks and minerals may be used directly to infer lithology and
corundum bearing litho units of the study area (Hunt et al., 1971) (Mather, 2004).

142
The range between 1.1 and 2.5µm called as Shortwave Infrared (SWIR) region of
the spectrum can provide more information about the mineralogical composition more
than the spectral features observed in the Visible and Near Infrared (VNIR) regions.
Opaque minerals have very distinct effect on the spectra of rocks, because it decreases
the total reflectance from the rocks and also quenches the reflectance spectra of the rocks.
Basic, mafic and intermediate igneous rocks show low reflectance compared with the
acidic igneous rocks (Al-Daghastani, 2003).
Igneous graphic granite displays the H2O and O-H bonds spectral absorption at
1.4µm, 1.9µm and 2.2µm, but biotite granites and granites have less water, and therefore
the OH absorption bands are weaker. Mafic rocks contain iron, pyroxenes, amphiboles
and magnetite, and therefore absorption band s corresponding to ferrous and ferric ion
appear at 0.7µm and 1.0µm, respectively (Gupta, 2003). The spectral features of
ultramafic rocks are dominated by the absorption of Fe, Mg-OH at 2.32µm and 2.38µm,
which is due to the phlogopite, biotite and hornblende. Ferrous – iron absorption in
olivine and pyroxene causes a broad absorption feature in the 1.00µm region of EMS
(Rowan et al., 2006). Sedimentary rocks normally take water absorption bands at 1.4µm
and 1.9µm, clay – shale have additional absorption features at 1.2-2.3µm regions,
carbonaceous shale and pure siliceous sand do not show any spectral features. Sandstone
containing iron oxide exhibits absorption feature at 0.87µm region which is related to
Fe3+
. Carbonate rocks (limestone and Dolomite) exhibit absorption range at 1.9µm and
2.35µm respectively with a shift on absorption according to CaCO3 and MgCaCO3
variation in the mineral chemistry, ferrous ions exhibits spectral feature at 1.0µm, which
is more common in dolomites due to the substitution of Mg2+
by Fe2+
(Rajesh, 2004).
Metamorphic of the deformed rock i.e. in low grade to medium grade
metamorphic rocks such as schistose, marbles and quartzite‘s, the spectral reflectance
curves exhibit absorption features at 1.4µm and 1.9µm, which are the ranges for water
and hydroxyls. Spectral reflectance curves of all metamorphic rocks reflect feature of
water or hydroxyl-like that of igneous rocks. Schistose rocks shows feature of ferric and
ferrous, which indicate the existence of chlorite and hornblende The different spectral
signatures of various rock types is listed in the table 5.3 (Al – Daghastani, 2003 and Ali
M Qaid and Basavarajappa., 2008).

143
Table.5.3. Spectral features of different Rock types with characteristic absorption signature.
Sl.
No
Rock
Name Signature details and cause of signature ROCK TYPE
1.
Granite
a) Absorption bands in 1.4, 1.9, 2.2 μm corresponding
to absorption bands in OH and H2O absorption
b) Absorption in 0.7 and 1 μm corresponding to
absorption for crystal field effect/ charge transfer in
ferrous (Fe+2
) and Fe+3
IGNEOUS ROCK Mafic rocks
a) 0.7 and 1.0 μm for absorption bands for ferrous Fe+2
and Fe+3
ion occurs mineral like pyroxene, amphibolite,
olive
Ultramafic
rocks
a) Absorption band at 1.0 and 2 μm specially for Fe+2
as
observed in rock like Dunite
2.
Sandstone
a) Absorption for Ferrous and Ferric ions. Fe rich
sandstone produces absorption in 0.87 μm. Greywacke
produce absorption due to fundamental/ overcome
vibration of clay minerals in 2.1 – 2.4 μm
SEDIMENTARY
ROCK
Shale
a) Mostly due to vibrational overtone combination in
OH and H2O and also due to vibrational absorption for
Al-OH and Mg-OH in 2.1 and 2.4 μm respectively
Limestone
& Dolomite
a) Absorption in 1.9 – 2.35 μm, latter being more
increase for combination overtone to the substitution of
Mg2+
by Fe2+
3.
Schist
a) Absorption signature in 0.7, 1, 2 μm general due to
ferrous and ferric iron and 2.1, 2.3, 2.4 for vibrational
absorption for Al-OH, Mg-OH bond in clay mineral
METAMORPHIC
ROCK Marble a) 1.9 – 2.5 μm latter being more intense for
combination overtone of vibration CO3 molecule.

144
Table. 5.4. Absorption peaks of various cat ions and anions in different regions of EMS
Sl.
No
Cations/ Anions Absorption peaks (μm)
Normal -Visible and Near Infrared (VNIR) Region
1. Ferric ion 0.40, 0.50, 0.70 and 0.87nm
2. Ferrous ion 0.43, 0.45, 0.57, 0.55, 1.00 and 1.80 – 2.00nm
3. Manganese 0.34, 0.37, 0.41, 0.45 and 0.55nm
4. Copper 0.80nm
5. Nickel 0.40, 0.74 and 1.25nm
6. Chromium 0.35, 0.45 and 0.55nm
Normal -Short Wavelength Infrared (SWIR) Region
7. Hydroxyl ions 1.44 and 2.74- 2.77nm
8. Al-OH 2.20nm
9. Mg-OH 2.30nm
10. Water molecules 1.40 and 1.90nm
11. Carbonates 1.90, 2.00, 2.16, 2.35 and 2.55nm
Thermal Infrared (TIR) Region
12. Silicates 9.00 – 11.50 (depending upon the crystal
structure)
13. Carbonates 7 (not used in Remote Sensing) and 11.30nm
14. Sulphates 9 and 16nm
15. Phosphates 9.25 and 10.30nm
16. Nitrates 7.20nm
17. Nitrites 8 and 11.8nm
18. Hydroxides 11nm

145
5.3. SPECTRORADIOMETER
Spectroradiometer is an optical instrument for measuring the radiant energy
(radiance or irradiance) from a source at each wavelength throughout spectrum of EMS.
A spectroradiometer is also a special kind of spectrometer. Spectrometer are commonly
used earlier and the same instrument with calibrated cable are called as
spectroradiometer. In 1970s Goetz first described the first portable field
spectroradiometer. Alex Goetz subsequently started the company called as ASD Inc
(Analytical Spectral device). ASD spectroradimeter is firstly utilized in the measurement
of physical quantity called as ‗Reflectance factor‘ a term coined by Nicodemus et al
in1977. Spectral reflectance studies for the study area samples are done using the
instrument Spectral evolution SR-3500 (Model: SR-3500 serial: 169-80 F7) field portable
spectroradiometer in well buildup laboratory environment. (Guha and Kumar., 2016).
RS-3500 compact, portable spectroradiometer Fast, full spectrum UV/VIS/NIR
measurements (350-2500nm) with a single scan, Autoshutter, autoexposure, and autodark
correction before each new scan, with no optimization step, for one-touch operation
Superior reliability no moving optical parts to break down. This instrument measured
three types 1. Direct Energy measurement (Spectroradiometry). 2. Reflectance
spectroscopy. and 3. Absorbance spectroscopy. Ergonomically designed pistol grip with
industry-standard Picatinny rail for mounting accessories, for example, a laser sight its
need AC universal power supply , this instrument used DARWin SP.V.1.3.0 Data
Acquisition software, Pelican protective case TENBA Shootout padded backpack 5x5
inch reflectance standard (99%) with aluminum case, cover and tripod mount, 1.2 meter
metal clad fiber optic with SMA-905 input connector (includes thumb-screw release
mount) NIST-traceable radiance cali-bration of 25 degree FOV fi-ber optic cable,
Rechargeable battery and universal AC charger (2 of each) Battery power cable,
Lightweight and compact the spectroradiometer weighs only 3.3kg/7.3lbs—small enough
to carry on-board a plane and around a field or forest. Rugged, handheld micro-computer
GETAC PS336 PDA with auto-focus digital camera, e-compass, altimeter, voice note
capability, GPS tagging, and sunlight readable VGA display DARWin SP Data
Acquisition software for one-touch scanning , automatically saves data as ASCII files for
use with 3rd party software (no post-processing), displays reflectance/transmittance data

146
(percentage) or absorbance (logarithmic) versus wavelength, and produces single and
multiple spectral plots . SR-3500— high resolution budget-friendly portable
spectroradiometer for a range of laboratory and field appli-cations including ground
truthing satellite and flyover data, solar radiance/irradiance measurements, albedo
measurements, vegetation studies and environmental research.
Spectral Evolution RS-3500 Spectroradiometer analysis carried out Department studies
in Earth Science, Centre for advanced studies in Precambrian geology, University of
Mysore and the instrument sponsored by UGC New Delhi. Spectralradiometer is used in
the field for a wide range of remote sensing applications, Including :Ground truthing
confirming, disputing, or interpreting hyperspectral or multi-spectral data, Environmental
research, Agricultural analysis, Ecosystem change, Forestry research, including canopy
studies, Glacial change and climate studies, Atmospheric research, Calibration transfer
and satellite sensor validation, Water body studies, Plant species identification, Urban
development , Crop health, including photosynthesis efficiency, Irrigation assessment,
Soil analysis, including topsoil fertility and erosion risks, Soil degradation, mapping, and
monitoring, Geological remote sensing, including surveying, mineral identification, and
geomorphology.
5.3.1. EZ – ID MINERAL IDENTIFICATION SOFTWARE
EZ-ID provides geologists, geoscientists, and geometallurgists with the tools to identify
minerals, create more accurate mineral maps and vector alteration to mineralization,
Sample identification has never been faster, easier, or more accurate than with EZ-ID
software from Spectral Evolution. EZ-ID provides sample identification capabilities built
into SPECTRAL EVOLUTION‘S field portable spectrometers and spectroradiometers
for applications ranging from vegetation studies, to soil research, crop health, raw
materials and plastics ID, minerals, and more. EZ-ID allows you to compare your target
scans with the USGS spectral library, other commer-cially available libraries, or your in-
house custom library. EZ-ID software can be used on unknown samples in the field or in
a lab. EZ-ID features Include: Fast and accurate identification of unknown target sample
to known library sample, Easy-to-use—just collect your scan using a SPECTRAL
EVOLUTION spectrometer or spectroradiometer and see results in real time, Simple,

147
consistent user-interface, Software provides a weighted score for best matches, Include or
exclude spectral regions of interest for optimal results, EZ-ID works through the
DARWin SP Data Acquisition software interface for all our spectrometers and
spectroradiometers.
Fig.5.2. Hyperspectral instrument laboratory setup, Department of Earth Science, Centre
for Advanced Studies in Precambrian Geology University of Mysore.
5.3.2. HYPERSPECTRAL SIGNATURS
Spectral signature measures all types of wavelengths that reflect, absorb, transmit and
emit electromagnetic energy from the objects of the earth surface (Ali M. Qaid et al.,
2009). Specral Evolution (SR-3500) Spectro-radiometer instrument has the ability to
measure the spectral signatures of different rocks/ minerals. The SR-3500 operate in the
wavelength range of 350–2500 nm with three detector elements: The first is a (512-
element) Si PDA (Photo Diode Array) element silicon array covering the spectral range
from 350 to 1000 nm (280–1000nm) (Maruthi et al., 2018). Two thermoelectrically
cooled InGaAs (Indium Gallium Arsenide) arrays of 256 elements each extend the
spectral range up to 1900nm and 2500nm respectively. The spectral signatures of the
representative samples were compared with mineral spectra of International standards for
minerals such as USGS spectral library in DARWin SP.V.1.3.0 (Hunt et al., 1971).
Absorption spectral values obtained from the DARWin software lab Spectra is the one
character helps in the study of major and minor mineral constituents (Hunt et al., 1971)
(basavarajappa et al., 2018). Ten spot observation per sample are recorded to the selected
samples from the study area, maximum of 3 to 4 best matched curves of a sample is given
in the spectral signature profiles.

148
Table.5.5. Specifications of Spectral Evolution RS-3500, DoS in Earth science,
Centre for advanced studies in Precambrian Geology University of Mysore.
Spectral Range 350-2500 nm
Spectral Resolution 3 nm @ 700 nm
8 nm @ 1500nm
6 nm @ 2100 nm
Sampling Interval 1.4 nm @ 350-1050 nm
2 nm @ 1000 – 2500 nm
Scanning time 100 millisecond
Wavelength
Reproducibility
0.1nm
Wavelength Accuracy
±0.5 bandwidth
Spectral Sampling
Bandwidth
Data output
Spectral Sampling Bandwidth in 1nm increments
2151 channels reported
Si Detectors
512 element Si photodiode array (350–1000nm)
InGaAs Detectors
(thermoelectrically
cooled)
256 element extended wavelength photodiode array (970–1910nm)
256 element extended wavelength photodiode array (1900-2500nm)
FOV Options
SMA-905 fiber end mount lenses: 1, 2, 3, 4, 5, 8 and 10° field of view, irradiance
diffuser
Noise
Equivalence
Radiance
(1.2 meter fiber
optic)
0.8x10⁻⁹
W/cm2/nm/sr @700nm
1.2x10⁻⁹
W/cm2/nm/sr @1400nm
1.8x10⁻⁹
W/cm2/nm/sr @2100nm
Input 1.5m fiber optic
250 field of view
Calibration
Accuracy
(NIST Traceable)
±5% @ 400nm
±4% @ 700nm
±7% @ 2200nm
Communications
interface
USB or Class I Bluetooth– laptop or PDA compatible
Size
8.5” x 12” x 3.5”
Weight 7.3 lbs (spectroradiometer only)
Calibration Wavelength, reflectance, radiance and irradiance
All calibration are NIST (National Institute of Standard and Technology)
traceable

149
The samples cut part given the best spectral curve respect to exposure surface of the
sample (Ali M. Qaid and Basavarajappa 2008) Basavarajappa et al., 2018; Basavarajappa
et al 2019.
Fig.5.3. Landsat-8, Satellite image showing sample locations of the Study area.
LOCATIONS:
Chitradurga District: 1. Ullarti kaval, 2. Kyadigunte and 2.a. Kyadigunte
Tumkur District: 3. Bettadakelaginahalli, 4. Kyathaganakere, 5. Thimmapura, 6.
Veerammanahalli, 7. Kanikalabande, 8. Channamallanahalli, 9. ChinakaVajra, 10.
Bittanakurke, 11. Basmangikaval, 12. Molanahalli, 13. Chickthimmanahalli, 14.
Devalapura and 15. Devarayanadurga.
Chikballapura District: 16. Hunasavadi, 17. Malenahalli, 18. Kachamachanahalli 19.
Kadiridevarahalli, 20. Neralemaradalli, 21. Poolakuntahalli and 21.a. Sidlaghatta.
Hassan District: 22. Makanahalli, 23. Undiganalu, 24. Dasagodanahalli, 25. Nandihalli,
26. Dyavalapura and 27. Belagumba.

150
Chikmagalur District: 28. Melukoppa, 29. Kogodu, 30. Malanadu, 31. Kunchebylu, and
32. Heggaru.
Dakshina Kannada District: 33. Uppinangadi, 34. Koila and 35. Shanthigodu.
Mysuru District: 36. Honnenahalli, 37. Bylapura, 38. Krishnarajanagara. 39. Uddukaval,
40. Padukotekaval, 41. Adahalli, 42. Katur, 43. Halasur, 44. Hanumanthapura, 45.
Handanahalli, 46. Mavinahalli, 47. Someshwarapura, 48. Varuna, 49. Kuppya, 50.
Bommanayakanahalli and 51. Eswaragowdanahalli.
Mandya District: 52. Machaholalu, 53. Adaguru, 54. Bannur, 55. Hemmige, 56.
Ballegere, 57. Doddaboovalli, 58. Malavalli, 59. Nelamakanahalli, 60. Ahasale, 61.
Tharanagere, 62. Kesthur, 63. Hanumanthapura and 64. Maddur.
Ramanagara District: 65. Huthridurga, 66. Varthehalli, 67. Akkur 68. Hosahalli, 69.
Lakkashettypura and 70. Byranaikanahalli.
Chamarajanagara Districts: 71. Budipadaga and 71.a. B.R.Hills.
Kolara Districts: 72. Yelesandra, 73. Kammasandra and 73.a. Near Kammasandra.
Fig.5.4. SPOT-7 Satellite image shows sample locations of the Study area.

151
Landsat 8 is an American Earth observation satellite launched on February 11, 2013. It is
the eighth satellite in the Landsat program. The satellite was built by Orbital Sciences
Corporation, who served as prime contractor for the mission, LANDSAT 8 satellite has
two main sensors: the Operational Land Imager (OLI) and the Thermal Infrared Sensor
(TIRS) OLI will collect images using nine spectral bands in different wavelengths of
visible, near-infrared, and shortwave light to observe a 185 kilometer (115 mile) wide
swath of the Earth in 15-30 meter resolution covering wide areas of the Earth's landscape
while providing sufficient resolution to distinguish features like urban centers, farms,
forests and other land uses, this satellite image shows corundum bearing litho units
locations after final remote sensing processing (fig.5.3).
SPOT is a commercial high-resolution Optical Imaging Earth Observation
Satellite System (OIEOSS) operating from space. The SPOT system includes a series of
satellites and ground control resources for satellite control and programming, image
production, and distribution. Earlier satellites were launched using the European Space
Agency's Ariane 2, 3, and 4 rockets, while SPOT 6 and SPOT 7 were launched by
the Indian PSLV this satellite image shows corundum bearing litho units locations after
final Remote Sensing processing (Fig.5.4).
5.4. HYPERSPECTRAL SIGNATURE STUDY ON ROCK SAMPLES AROUND
CHITRADURGA DISTRICT.
Corundum bearing rocks were determined at the using spectral signatures. The
spectrometer component is a crossed Czerny-Turner configuration using ruled gratings as
the dispersive elements. Energy enters the spectrometer and is collimated before being
reflected off the gratings and refocused onto the PDA (Photodiode Array) detectors. The
spectroradiometer and controlling electronics are contained in the housing. International
standards for minerals such as USGS were compared along with the major elements for
the field samples to check precision and accuracy of measurement. The certified and
analyzed values of USGS are given in the fig.5 along with major element abundances of
samples to check the error limits of measurement (Hunt et al., 1971).
Hyperspectral remote sensing for mineral targeting carried out spectral radiometer
instrument with help of DARwin software measured single and multiple plots. here we

152
taken multiple measurement plot of spectral analysis were carried out of samples of
Chitradurga District (fig.5.5).
EZ-ID mineral identification tool works to taken USGS standard signatures and
match the unknown raw mineral data based on mineral structure and composition give
the result based on percentage of mineral composition. Hyperspectral signatures
determined the graph showing alumina oxide, Fe and H2O presence in the sample.
Corundum Al2O3 mineral type - Oxide this sample prepared from crystals that were
brownish near the surface and bluish – green near in the interior. Very sharp corundum
reflections suggest excellent crystallinity and compostional homogeneity (Absorption
anomalies at wavelength regions of 0.55 µm and 0.9 µm of Fe3+ and Fe2+ ions are
observed respectively with low reflectance in the VNIR region (Ali M. Qaid et al., 2009)
(Fig.5.6). Major element content as Al2O3 content shows high range imparts a corundum
character with that of high aluminum content. Library spectrum corundum correlation
score 0.854 percent match the curve (Fig-5.6). composition discussion analysis showed
the sample to contain 0.27 and 1.54% Cr. 4.56% Fe and 25.65% Si with traces of Ti, V,
Mn, Mg, Ca and Cu the iron appears to be present on both ferrous (0.55. 0.45 and 1.1um
absorption features) and ferric (0.7. 0.45 and near 0.4um) from the Cr3+
ion contributes to
the 0.4. 0.55 and 0.7um (emission) features. Spectral discussion Sample plots are
correlated with standard USGS Spectral Library using absolute reflectance v/s
wavelength which provide strong absorption range in 2.20 µm and 0.65 µm representing
the mineral corundum shows intense absorption feature in 2.40 µm of the electromagnetic
spectrum (Hunt et al., 1971) (Fig.5.6). Absorption anomalies at wavelength regions of
0.55 µm and 0.9 µm of Fe3+ and Fe2+ ions are observed respectively with low
reflectance in the VNIR region (Ali M. Qaid et al., 2009). Major element content as
Al2O3 content shows high range imparts a corundum character with that of high
aluminum content. Library spectrum corundum correlation score 0.854 percent match the
curve (Fig-5.6).
Amphiboles are found principally in metamorphic and igneous rocks. They occur
in many metamorphic rocks, especially those derived from mafic igneous rocks (those
containing dark-coloured ferromagnesian minerals) and siliceous dolomites. Major and
minor element content of amphibolite schist shows SiO2 ranging 40.21% , MgO content

153
Fig.5.5.Lab Spectral signatures of Corundum bearing rocks.
Fig.5.6. EZ-ID Match analysis of Corundum.
Fig.5.7. EZ-ID Match analysis of Amphibolite schist.
is fairly low and ranges from 10.42%, Al2O3 content high ranges 32.86%, CaO content
is 8.43%, K2O content of ranges 0.426%; TiO2 content is fairly low 0.67% and P2O5
ranges 0.5957% (M. Qasim Jan 1988). Spectal discussion Sample plots provide strong
absorption range from 2.0 – 2.25 µm representing the mineral corundum whereas

154
amphibole shows intense absorption feature in 2.35 µm of the electromagnetic spectrum
(Hunt et al., 1971). Absorption anomalies at wavelength regions 0.55 µm and 0.9 µm of
Fe3+
and Fe2+
ions are observed respectively (Fig.5.7). Absorption range 1.4µm are
noticed due to the presence of water and hydroxyl molecules in the present sample (Ali
M.Qaid et al., 2009). Library spectrum Amphibolite Schist correlation score 0.983
percent match the curve (Fig-5.7). Lab spectra of corundum strong absorption range
identified in the wavelength of 2.10 µm and 2.20 µm and 0.65 µm representing the
mineral corundum shows intense absorption feature in 2.40 µm of the electromagnetic
spectrum (Hunt et al., 1971) (Fig-5.7).
5.5. HYPERSPECTRAL SIGNATURE STUDY ON ROCK SAMPLES AROUND
TUMKUR DISTRICT
Around 13 samples were carried out for spectra analysis each sample taken 4 targeting
and Darwin software give the multiple measurement plots (fig.5.8). in this plot taken EZ-
ID analysis tool took a average spectral signatures and give the results. Corundum Al2O3
mineral type - Oxide (Hematite group) this sample prepared from crystals that were
brownish near the surface. very sharp corundum reflections suggest excellent crystallinity
and compostional homogenety. Spectral discussion Sample plots are correlated with
standard USGS Spectral Library using absolute reflectance v/s wavelength which provide
strong absorption range in 2.20 µm and 0.65 µm representing the mineral corundum
shows intense absorption feature in 2.40 µm of the electromagnetic spectrum (Hunt et al.,
1971). Absorption anomalies at wavelength regions of 0.55 µm and 0.9 µm of Fe3+ and
Fe2+ ions are observed respectively with low reflectance in the VNIR region (Ali M.
Qaid et al., 2009) (Fig.5.9). Major element content as Al2O3 content shows high range
imparts a corundum character with that of high aluminum content. library spectrum
corundum correlation score 0.933 percent match the curve (Fig.5.9) .
Hyperspectral signatures determined the graph showing mainly the microcline spectra
shows fairly weak H2O features near 1.4 and 1.9µ, and a very weak feature near 2.2µ due
to the OH stretch-Al-OH bend combinatiion. It also displays a quite sharp drop off at
approximately 0.55µ which is typical of the ferric oxides. Sample is pinkish in color,
which is not due to an alteration coating of ferric oxide. Fe3+ may substitute for Al in

155
limited amount in normal alkali feldspars, but excess Fe3+ will exsolved either as
discrete particles of iron-bearing mineral, or as an iron staining on grain boundaries and
cleavage planes. The latter appears to be the case for this microcline, which explains the
ferric oxide type of visible spectrum. There is, however, insufficient ferric oxide present
to yield a discernible near-infrared feature (Hunt et al., 1973). Library spectrum Closepet
Granite correlation score 0.883 percent match the curve (Fig5.10)
Fig.5.8. Lab Spectral signatures of Corundum bearing rocks.
Fig.5.9. Fig.5.6. EZ-ID Match analysis of Corundum.
Fig.5.10. EZ-ID Match analysis of Closepet granite.

156
5.6. HYPERSPECTRAL SIGNATURE STUDY ON ROCK SAMPLES AROUND
CHIKBALLAPURA DISTRICT
Chikballapura district cover 7 corundum bearing litho units. Hyperspectral remote
sensing for mineral targeting carried out spectral radiometer instrument with help of
DARwin software measured single and multiple plots. here we taken multiple
measurement plot of Chikballapur area samples (fig.5.11).
Hyperspectral signatures determined the graph showing alumina oxide, Fe and H2O
presence in the sample. Corundum Al2O3 mineral type - Oxide this sample prepared from
crystals that were brownish near the surface and bluish – green near in the interior. Very
sharp corundum reflections suggest excellent crystallinity and compostional
homogeneity. composition discussion EZ-ID match analysis showed the sample to
contain Cr, Fe, Al, Si with traces of Ti, V, Mn, Mg, Ca and Cu the iron appears to be
present on both ferrous (0.55. 0.45 and 1.1um absorption features) and ferric (0.7. 0.45
and near 0.4um) from the Cr3+
ion contributes to the 0.4. 0.55 and 0.7um (emission)
features. Spectral discussion Sample plots are correlated with standard USGS Spectral
Library using absolute reflectance v/s wavelength which provide strong absorption range
in 2.20 µm and 0.65 µm representing the mineral corundum shows intense absorption
feature in 2.40 µm of the electromagnetic spectrum (Hunt et al., 1971). Absorption
anomalies at wavelength regions of 0.55 µm and 0.9 µm of Fe3+ and Fe2+ ions are
observed respectively with low reflectance in the VNIR region (Ali M. Qaid et al., 2009)
(Fig.5.12). Major element content as Al2O3 content shows high range imparts a corundum
character with that of high aluminum content. Library spectrum corundum correlation
score 0.902 percent match the curve (Fig5.12)
Hyperspectral signatures determined the graph showing mainly the microcline spectra
shows fairly weak H2O features near 1.4 and 1.9µ, and a very weak feature near 2.2µ due
to the OH stretch-AlOH bend combinatiion. It also displays a quite sharp drop off at
approximately 0.55µ which is typical of the ferric oxides. Sample is pinkish in color,
which is not due to an alteration coating of ferric oxide. Fe3+ may substitute for Al in
limited amount in normal alkali feldspars, but excess Fe3+ will exsolved either as
discrete particles of iron-bearing mineral, or as an iron staining on grain boundaries and
cleavage planes. The latter appears to be the case for this microcline, which explains the

157
ferric oxide type of visible spectrum. There is insufficient ferric oxide present to yield a
discernible near-infrared feature. Library spectrum Closepet Granite correlation score
0.821 percent match the curve (Fig5.13)
Fig.5.11. Lab Spectral signatures of Corundum bearing rocks.
Fig.5.12. Fig.5.6. EZ-ID Match analysis of Corundum.
Fig.5.13. EZ-ID Match analysis of Closepet granite.

158
5.7. HYPERSPECTRAL SIGNATURE STUDY ON ROCK SAMPLES AROUND
HASSAN DISTRICT
Hyperspectral remote sensing for mineral targeting carried out spectral radiometer
instrument with help of DARwin software measured single and multiple plots. here we
taken multiple measurement plot of Hassan area samples (fig.5.14).
In this plot took spectral signatures of DARWin software, EZ-ID analysis tool took a
average spectral curves and give the results. Corundum Al2O3 mineral type - Oxide
(Hematite group) this sample prepared from crystals that were brownish near the surface.
very sharp corundum reflections suggest excellent crystallinity and compostional
homogenety. spectral discussion Sample plots are correlated with standard USGS
Spectral Library using absolute reflectance v/s wavelength which provide strong
absorption range in 2.20 µm and 0.65 µm representing the mineral corundum shows
intense absorption feature in 2.40 µm of the electromagnetic spectrum. Absorption
anomalies at wavelength regions of 0.55 µm and 0.9 µm of Fe3+ and Fe2+ ions are
observed respectively with low reflectance in the VNIR region (Fig.5.15). Major element
content as Al2O3 content shows high range imparts a corundum character with that of
high aluminum content. library spectrum corundum correlation score 0.941 percent match
the curve (Fig.5.15)
Spectral signatures find the graph showing H2O content Al2O3 and Fe, Mg, OH minerals
presence in the Sample. Amphiboles are found principally in metamorphic and igneous
rocks. They occur in many metamorphic rocks, especially those derived from mafic
igneous rocks and siliceous dolomites. Spectal discussion Sample plots provide strong
absorption range from 2.0 – 2.25 µm representing the mineral corundum whereas
amphibole shows intense absorption feature in 2.35 µm of the electromagnetic spectrum
(Hunt et al., 1971). Absorption anomalies at wavelength regions 0.55 µm and 0.9 µm of
Fe3+
and Fe2+
ions are observed respectively (Fig.5.10). Absorption range 1.4µm is
noticed due to the presence of water and hydroxyl molecules in the present sample (Ali
M.Qaid et al., 2009). Library spectrums Corundum bearing Amphibolite Schist
correlation score 0.883 percent match the curve (Fig.5.10). Lab spectra of corundum
bearing amphibolites schist strong absorption range identified in the wavelength of 2.10

159
µm and 2.20 µm and 0.65 µm representing the mineral corundum shows intense
absorption feature in 2.40 µm of the electromagnetic spectrum (Hunt et al., 1971)
(Fig.5.10).
Fig.5.14. Lab Spectral signatures of Corundum bearing rocks.
Fig.5.15. Fig.5.6. EZ-ID Match analysis of Corundum.
Fig.5.16. EZ-ID Match analysis of Amphibolite schist.

160
5.8. HYPERSPECTRAL SIGNATURE STUDY ON ROCK SAMPLES AROUND
CHIKMAGALUR DISTRICT
Chikmagalur district cover 5 corundum bearing litho units . Hyperspectral
Remote Sensing for mineral targeting carried out spectral radiometer instrument with
help of DARwin software measured single and multiple plots. here we taken multiple
measurement curves plot of Chikmagalur area (Fig.5.17).
Hyperspectral signatures determined the graph showing alumina oxide, Fe and H2O
presence in the sample. Corundum Al2O3 mineral type - Oxide this sample prepared from
crystals that were brownish near the surface and bluish – green near in the interior. Very
sharp corundum reflections suggest excellent crystallinity and compostional
homogeneity. composition discussion EZ-ID match analysis showed the sample to
contain Cr, Fe, Al, Si with traces of Ti, V, Mn, Mg, Ca and Cu the iron appears to be
present on both ferrous (0.55. 0.45 and 1.1um absorption features) and ferric (0.7. 0.45
and near 0.4um) from the Cr3+
ion contributes to the 0.4. 0.55 and 0.7um (emission)
features. Spectral discussion Sample plots are correlated with standard USGS Spectral
Library using absolute reflectance v/s wavelength which provide strong absorption range
in 2.20 µm and 0.65 µm representing the mineral corundum shows intense absorption
feature in 2.40 µm of the electromagnetic spectrum (Hunt et al., 1971). Absorption
anomalies at wavelength regions of 0.55 µm and 0.9 µm of Fe3+ and Fe2+ ions are
observed respectively with low reflectance in the VNIR region (Ali M. Qaid et al., 2009)
(Fig.5.18). Major element content as Al2O3 content shows high range imparts a corundum
character with that of high aluminum content. Library spectrum corundum correlation
score 0.877 percent match the curve (Fig5.18)
Amphiboles occur in many metamorphic rocks, especially those derived from mafic
igneous rocks (those containing dark-coloured ferromagnesian minerals) and siliceous
dolomites. Major and minor element content of amphibolite schist shows SiO2, MgO
moderate ranging content is fairly low and ranges Al2O3 content high ranges CaO, K2O,
TiO2, and P2O5 (M. Qasim Jan 1988). Spectal discussion Sample plots provide strong
absorption range from 2.0 – 2.25 µm representing the mineral corundum whereas

161
amphibole shows intense absorption feature in 2.35 µm of the electromagnetic spectrum
(Hunt et al., 1971). Absorption anomalies at wavelength regions 0.55 µm and 0.9 µm of
Fig.5.17. Lab Spectral signatures of Corundum bearing rocks.
Fig.5.18. Fig.5.6. EZ-ID Match analysis of Corundum.
Fig.5.19. EZ-ID Match analysis of Amphibolite schist.
Fe3+
and Fe2+
ions are observed respectively (Fig.5.19). Absorption range 1.4µm are
noticed due to the presence of water and hydroxyl molecules in the present sample (Ali
M.Qaid et al., 2009). library spectrum Amphibolite Schist correlation score 0.941 percent
match the curve (Fig-5.19). Lab spectra of corundum strong absorption range identified

162
in the wavelength of 2.10 µm and 2.20 µm and 0.65 µm representing the mineral
corundum shows intense absorption feature in 2.40 µm of the electromagnetic spectrum
(Fig-5.19).
5.9. HYPERSPECTRAL SIGNATURE STUDY ON ROCK SAMPLES AROUND
DAKSHINA KANNADA DISTRICT
In Dakshina Kannada district about 3 samples were carried out spectral analysis
each sample taken 4 targeting and Darwin software give the multiple measurement plots
(fig.5.20). in this plot taken EZ-ID analysis tool took a average spectral signatures and
give the results. Corundum Al2O3 this sample prepared from crystals that were brownish
near the surface. very sharp corundum reflections suggest excellent crystallinity and
compostional homogenety. spectral discussion Sample plots are correlated with standard
USGS Spectral Library using absolute reflectance v/s wavelength which provide strong
absorption range in 2.20 µm and 0.65 µm representing the mineral corundum shows
intense absorption feature in 2.40 µm of the electromagnetic spectrum (Hunt et al., 1971).
Absorption anomalies at wavelength regions of 0.55 µm and 0.9 µm of Fe3+ and Fe2+
ions are observed respectively with low reflectance in the VNIR region (Ali M. Qaid et
al., 2009) (Fig.5.21). Major element content as Al2O3 content shows high range imparts a
corundum character with that of high aluminum content. library spectrum corundum
correlation score 0.908 percent match the curve (Fig.5.21)
Amphiboles occur in many metamorphic rocks, especially those derived from mafic
igneous rocks (those containing dark-coloured ferromagnesian minerals) and siliceous
dolomites. Major and minor element content of amphibolite schist shows SiO2, MgO
moderate ranging content is fairly low and ranges Al2O3 content high ranges CaO, K2O,
TiO2, and P2O5 (M. Qasim Jan 1988). Spectal discussion Sample plots provide strong
absorption range from 2.0 – 2.25 µm representing the mineral corundum whereas
amphibole shows intense absorption feature in 2.35 µm of the electromagnetic spectrum
(Hunt et al., 1971). Absorption anomalies at wavelength regions 0.55 µm and 0.9 µm of
Fe3+
and Fe2+
ions are observed respectively (Fig.5.22). Absorption range 1.4µm are
noticed due to the presence of water and hydroxyl molecules in the present sample (Ali
M.Qaid et al., 2009). library spectrum Amphibolite Schist correlation score 0.878 percent

163
match the curve (Fig-5.22). Lab spectra of corundum strong absorption range identified
in the wavelength of 2.10 µm and 2.20 µm and 0.65 µm representing the mineral
corundum shows intense absorption feature in 2.40 µm of the electromagnetic spectrum
Maruthi et al., 2018 (Fig-5.22).
Fig.5.20. Lab Spectral signatures of Corundum bearing rocks.
Fig.5.21. Fig.5.6. EZ-ID Match analysis of Corundum.
Fig.5.22. EZ-ID Match analysis of Amphibolite schist.

164
5.10. HYPERSPECTRAL SIGNATURE STUDY ON ROCK SAMPLES AROUND
MYSURU DISTRICT.
Hyperspectral remote sensing for mineral targeting carried out spectral radiometer
instrument with help of DARwin software measured single and multiple plots. Mysuru
area collected around 16 samples carried out spectra each sample taken 4 targeting and
Darwin software give the multiple measurement plots (fig.5.23).
EZ-ID mineral identification tool works to taken USGS standard signatures and match
the unknown raw mineral data based on mineral structure and composition give the result
based on percentage of mineral composition. Hyperspectral signatures determined the
graph showing alumina oxide, Fe and H2O presence in the sample. Corundum Al2O3
mineral type - Oxide this sample prepared from crystals that were brownish near the
surface and bluish – green near in the interior. Very sharp corundum reflections suggest
excellent crystallinity and compostional homogeneity (Absorption anomalies at
wavelength regions of 0.55 µm and 0.9 µm of Fe3+ and Fe2+ ions are observed
respectively with low reflectance in the VNIR region (Ali M. Qaid et al., 2009)
(Fig.5.24). Major element content as Al2O3 content shows high range imparts a corundum
character with that of high aluminum content. Library spectrum corundum correlation
score 0.936 percent match the curve (Fig5.24). composition discussion analysis showed
the sample to contain 41.2% to 95.27%Al. 0.34 and 2.55% Cr. 2.61% Fe and 4.26% Si
with traces of Ti, V, Mn, Mg, Ca and Cu the iron appears to be present on both ferrous
(0.55. 0.45 and 1.1um absorption features) and ferric (0.7. 0.45 and near 0.4um) from the
Cr3+
ion contributes to the 0.4. 0.55 and 0.7um (emission) features. Spectral discussion
Sample plots are correlated with standard USGS Spectral Library using absolute
reflectance v/s wavelength which provide strong absorption range in 2.20 µm and 0.65
µm representing the mineral corundum shows intense absorption feature in 2.40 µm of
the electromagnetic spectrum (Hunt et al., 1971) (Ali M. Qaid et al., 2009). Major
element content as Al2O3 content shows high range imparts a corundum character with
that of high aluminum content. Library spectrum corundum correlation score 0.936
percent match the curve (Fig.5.24) .
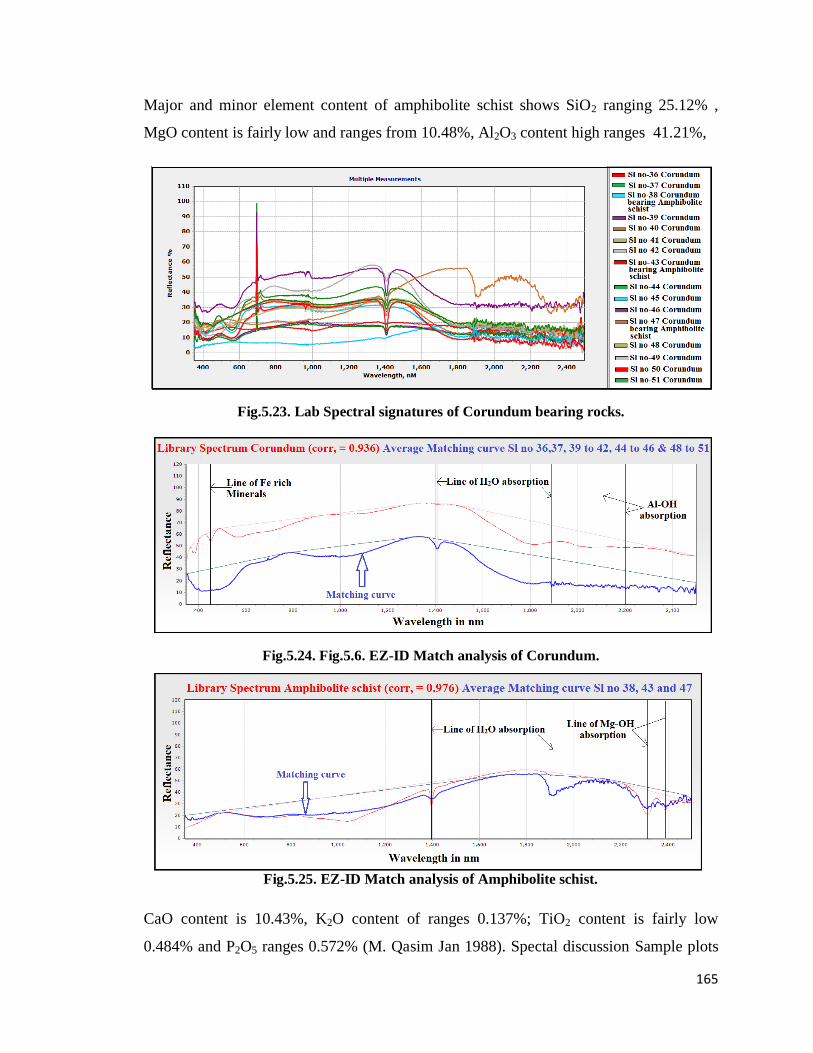
165
Major and minor element content of amphibolite schist shows SiO2 ranging 25.12% ,
MgO content is fairly low and ranges from 10.48%, Al2O3 content high ranges 41.21%,
Fig.5.23. Lab Spectral signatures of Corundum bearing rocks.
Fig.5.24. Fig.5.6. EZ-ID Match analysis of Corundum.
Fig.5.25. EZ-ID Match analysis of Amphibolite schist.
CaO content is 10.43%, K2O content of ranges 0.137%; TiO2 content is fairly low
0.484% and P2O5 ranges 0.572% (M. Qasim Jan 1988). Spectal discussion Sample plots

166
provide strong absorption range from 2.0 – 2.25 µm representing the mineral corundum
whereas amphibole shows intense absorption feature in 2.35 µm of the electromagnetic
spectrum (Hunt et al., 1971). Absorption anomalies at wavelength regions 0.55 µm and
0.9 µm of Fe3+
and Fe2+
ions are observed respectively (Fig.5.25). Absorption range
1.4µm are noticed due to the presence of water and hydroxyl molecules in the present
sample (Ali M.Qaid et al., 2009). library spectrum Amphibolite Schist correlation score
0.976 percent match the curve (Fig-5.25). Lab spectra of corundum strong absorption
range identified in the wavelength of 2.10 µm and 2.20 µm and 0.65 µm representing the
mineral corundum shows intense absorption feature in 2.40 µm of the electromagnetic
spectrum (Hunt et al., 1971) (Fig-5.25).
5.11. HYPERSPECTRAL SIGNATURE STUDY ON ROCK SAMPLES AROUND
MANDYA DISTRICT.
Mandya district covers 13 corundum bearing litho units locations. Spectral radiometer
instrument with help of DARwin software measured single and multiple plots. Here we
took multiple measurement curves of Mandya area samples (fig.5.26).
Hyperspectral signatures determined the graph showing alumina oxide, presence in the
sample. Corundum Al2O3 mineral type - Oxide this sample prepared from crystals that
were brownish near the surface and bluish – green near in the interior and compostional
homogeneity. composition discussion EZ-ID match analysis showed the sample to
contain Cr, Fe, Al, Si with traces of Ti, V, Mn, Mg, Ca and Cu the iron appears to be
present on both ferrous (0.55. 0.45 and 1.1um absorption features) and ferric (0.7. 0.45
and near 0.4um) from the Cr3+
ion contributes to the 0.4. 0.55 and 0.7um (emission)
features. Spectral discussion Sample plots are correlated with standard USGS Spectral
Library using absolute reflectance v/s wavelength which provide strong absorption range
in 2.20 µm and 0.65 µm representing the mineral corundum shows intense absorption
feature in 2.40 µm of the electromagnetic spectrum (Hunt et al., 1971). Major element
content as Al2O3 content shows high range imparts a corundum character with that of
high aluminum content. Library spectrum corundum correlation score 0.949 percent
match the curve (Fig5.27) Amphiboles occur in many metamorphic rocks, especially
those derived from mafic igneous rocks (those containing dark-coloured ferromagnesian

167
minerals) and siliceous dolomites. Major and minor element content of amphibolite schist
shows SiO2, MgO moderate ranging content is fairly low and ranges Al2O3 content high
ranges CaO, K2O, TiO2, and P2O5 (M. Qasim Jan 1988). Spectal discussion Sample
plots provide strong
Fig.5.26. Lab Spectral signatures of Corundum bearing rocks.
Fig.5.27. Fig.5.6. EZ-ID Match analysis of Corundum.
Fig.5.28. EZ-ID Match analysis of Amphibolite schist.
absorption range from 2.0 – 2.25 µm representing the mineral corundum whereas
amphibole shows intense absorption feature in 2.35 µm of the electromagnetic spectrum

168
(Hunt et al., 1971). Absorption range 1.4µm are noticed due to the presence of water and
hydroxyl molecules in the present sample (Ali M.Qaid et al., 2009). library spectrum
Amphibolite Schist correlation score 0.968 percent match the curve (Fig-5.28). Lab
spectra of corundum strong absorption range identified in the wavelength of 2.10 µm and
2.20 µm and 0.65 µm representing the mineral corundum shows intense absorption
feature in 2.40 µm of the electromagnetic spectrum (Hunt et al., 1971) (Fig-5.28).
5.12. HYPERSPECTRAL SIGNATURE STUDY ON ROCK SAMPLES AROUND
RAMANAGARA DISTRICT.
Ramanagara district covers 7 corundum bearing litho units locations it‘s a contact zone of
closepet granite. Spectral radiometer instrument with help of DARwin software measured
single and multiple plots. Here we took multiple measurement curves of Ramanagara
area samples (fig.5.29).
Hyperspectral signatures determined the graph showing alumina oxide, presence in the
sample. Corundum Al2O3 mineral type – Oxide, this sample composition discussion EZ-
ID match analysis showed the sample to contain Cr, Fe, Al, Si with traces of Ti, V, Mn,
Mg, Ca and Cu the iron appears to be present on both ferrous (0.55. 0.45 and 1.1um
absorption features) and ferric (0.7. 0.45 and near 0.4um) from the Cr3+
ion contributes to
the 0.4. 0.55 and 0.7um (emission) features. Spectral discussion Sample plots are
correlated with standard USGS Spectral Library using absolute reflectance v/s
wavelength which provide strong absorption range in 2.20 µm and 0.65 µm representing
the mineral corundum shows intense absorption feature in 2.40 µm of the electromagnetic
spectrum (Hunt et al., 1971). Major element content as Al2O3 content shows high range
imparts a corundum character with that of high aluminum content. Library spectrum
corundum correlation score 0.895 percent match the curve (Fig5.30)
Major and minor element content of amphibolite schist shows SiO2, MgO moderate
ranging content is fairly low and ranges Al2O3 content high ranges CaO, K2O, TiO2, and
P2O5 (M. Qasim Jan 1988). Spectal discussion Sample plots provide strong absorption
range from 2.0 – 2.25 µm representing the mineral corundum whereas amphibole shows
intense absorption feature in 2.35 µm of the electromagnetic spectrum (Hunt et al., 1971).

169
Fig.5.29. Lab Spectral signatures of Corundum bearing rocks.
Fig.5.30. Fig.5.6. EZ-ID Match analysis of Corundum.
Fig.5.31. EZ-ID Match analysis of Amphibolite schist.
Absorption range 1.4µm are noticed due to the presence of water and hydroxyl molecules
in the present sample (Ali M.Qaid et al., 2009). Library spectrum Amphibolite Schist
correlation score 0.949 percent match the curve (Fig-5.31). Lab spectra of corundum

170
strong absorption range identified in the wavelength of 2.10 µm and 2.20 µm and 0.65
µm representing the mineral corundum shows intense absorption feature in 2.40 µm of
the electromagnetic spectrum (Hunt et al., 1971) (Fig-5.31).
5.13. HYPERSPECTRAL SIGNATURE STUDY ON ROCK SAMPLES AROUND
CHAMARAJANAGARA DISTRICT.
Chamarajanagara area collected 2 corundum bearing litho unit locations. Fe garnet rich
Corundum rock occurs Biligirirangan hill ranges and Corundum bearing politic rock
occurs Budipadaga area. Spectral radiometer instrument measured single and multiple
plots. Here we took multiple measurement curves of Chamarajanagara area samples
(fig.5.32).
Pelites is a metamorphosed fine grained sedimentary rocks, its composition of is simple
and mostly contains hornblende, plagioclase quartz anthophyllite, garnet and epidote
plagioclase and typically include green pyroxene. Corundum bearing politic rock
composition discussion EZ-ID match analysis showed the sample to contain Cr, Fe, Al,
Si with traces of Ti, V, Mn, Mg, Ca and Cu the iron appears to be present on both ferrous
(0.55. 0.45 and 1.1um absorption features) and ferric (0.7. 0.45 and near 0.4um) from the
Cr3+
ion contributes to the 0.4. 0.55 and 0.7um (emission) features. Spectral discussion
Sample plots are correlated with standard USGS Spectral Library using absolute
reflectance v/s wavelength which provide strong absorption range in 2.20 µm and 0.65
µm representing the mineral corundum shows intense absorption feature in 2.40 µm of
the electromagnetic spectrum (Hunt et al., 1971). Major element content as Al2O3 content
shows high range imparts a corundum character with that of high aluminum content.
Library spectrum corundum bearing politic rock correlation score 0.893 percent match
the curve (Fig.5.33)
Fe Garnet rich Corundum rock associated with granulite zones. This sample is slightly
contaminated with (spectrally neutral) quartz (Wilbur et al., 1990). It displays typically
opaque behavior, decreasing in reflectivity with decreasing particle size. It is unusual in
that it also exhibits a very weak band near 1.0µm due to the ferrous ion (Friedman et al,.
1989). This sample shows SiO2, MgO moderate ranging content is fairly low and ranges
Al2O3 content high ranges CaO, K2O, TiO2, and P2O5 (M. Qasim Jan 1988). Spectal
discussion Sample plots provide strong absorption range from 2.0 – 2.25 µm representing

171
the mineral corundum whereas amphibole shows intense absorption feature in 2.35 µm of
the electromagnetic spectrum (Hunt et al., 1971). Library spectrum Fe Garnet rich
Corundum rock correlation score 0.911 percent match the curve (Fig-5.34).
Fig.5.32. Lab Spectral signatures of Corundum bearing rocks.
Fig.5.33. Fig.5.6. EZ-ID Match analysis of Corundum bearing pelitic rock.
Fig.5.34. EZ-ID Match analysis of Fe garnet rich corundum.

172
5.14. HYPERSPECTRAL SIGNATURE STUDY ON ROCK SAMPLES AROUND
KOLARA DISTRICT.
Kolara area collected 3 corundum bearing litho unit locations. Corundum rock occurs
Yelesandra and Kammasandra area, Corundum bearing mica schist occurs near
Kammasandra area. Spectral radiometer instrument measured single and multiple plots.
Here we took multiple measurement curves of Kolara area samples (fig.5.35).
Hyperspectral signatures determined the graph showing alumina oxide, presence in the
sample. Corundum Al2O3 mineral type – Oxide, this sample composition discussion EZ-
ID match analysis showed the sample to contain Cr, Fe, Al, Si with traces of Ti, V, Mn,
Mg, Ca and Cu the iron appears to be present on both ferrous (0.55. 0.45 and 1.1um
absorption features) and ferric (0.7. 0.45 and near 0.4um) from the Cr3+
ion contributes to
the 0.4. 0.55 and 0.7um (emission) features. Spectral discussion Sample plots are
correlated with standard USGS Spectral Library using absolute reflectance v/s
wavelength which provide strong absorption range in 2.20 µm and 0.65 µm representing
the mineral corundum shows intense absorption feature in 2.40 µm of the electromagnetic
spectrum (Hunt et al., 1971). Major element content as Al2O3 content shows high range
imparts a corundum character with that of high aluminum content. Library spectrum
corundum correlation score 0.941 percent match the curve (Fig.5.36)
Major and minor element content of Corundum bearing Amphibolite schist shows MgO,
SiO2 moderate ranging content is fairly low and ranges Al2O3 content high ranges K2O,
CaO, TiO2, and P2O5 (M. Qasim Jan 1988). Spectal discussion Sample plots provide
strong absorption range from 2.0 – 2.25 µm representing the mineral corundum whereas
amphibole shows intense absorption feature in 2.35 µm of the electromagnetic spectrum
(Hunt et al., 1971). Absorption range 1.4µm are noticed due to the presence of water and
hydroxyl molecules in the present sample (Ali M.Qaid et al., 2009). Library spectrum
Amphibolite Schist correlation score 0.853 percent match the curve (Fig-5.37). Lab
spectra of corundum strong absorption range identified in the wavelength of 2.10 µm and
2.20 µm and 0.65 µm representing the mineral corundum shows intense absorption
feature in 2.40 µm of the electromagnetic spectrum (Hunt et al., 1971) (Fig-5.37).

173
Fig.5.35. Lab Spectral signatures of Corundum bearing rocks.
Fig.5.36. Fig.5.6. EZ-ID Match analysis of Corundum.
Fig.5.37. EZ-ID Match analysis of Amphibolite schist.

174
CHAPTER-VI
6.1. RESULT AND DISCUSSION
Corundum bearing litho units are located in the state of Karnataka. its consist
major schist belts, migmatite zones, younger closepet granite zone and granulate terrains.
Study area comes to southern Karnataka region and its covers 20 districts. The purpose of
the present study is infer the petrology, geochemistry and spectral behavior of corundum
bearing rocks collected from the Study area Karnataka. Corundum is formed upper
mantle with high presser and temperature condition with help of magma and magma
flumes corundum reaches to surface. Corundum is a rock forming mineral that is found in
Igneous, Sedimentary and Metamorphic rocks and it has hexagonal crystal structure, it is
second hardest mineral after diamond (Basavarajappa et al., 2018). The corundum shows
similar color appearance in both plane and crossed polarized lights. Corundum is
depicted by pink to blood-red colored and can vary within each gem variety of the
mineral Corundum. The red color is caused by the mineral chromium and shows
brownish tone due to the presence of iron. Optical properties shows uniaxial,
birefringence & pleochroism is very strong in ordinary light and shows deep red color
when viewed in the direction of vertical axis and a much lighter color to nearly colorless
in view at right angles to this axis. In all 73 locations we have traced out the corundum in
the form of 99% of Al with impurities of variety of Corundum minerals in the Study area.
Results of demarcating the Corundum horizons in the map using Field petrography,
Geochemical signatures (XRF), EDS study and Hyperspectral study, Remote Sensing
technology with GIS tools Correlate and composition to analyze and integrate the Study
involved in the research to achieve the final results in the Proposed Research problem.
Karnataka before 2005 corundum deposits found only 15890 tonne, after 2010 these kind
of research work and ground truth checking finally corundum deposits found 646860
tonnes. This estimation shows we need more research on precious minerals, gemstones
and metals.

175
6.2. INTIGRATION OF GEOCHEMISTRY AND REFLECTANCE SPECTRA
X-Ray Fluorescence (XRF) analysis was carried out to estimate the major oxides in the
Corundum bearing rocks. The chemical composition of major and minor oxides of
southern Karnataka region corundum, corundum bearing amphibolites schist, corundum
bearing chlorite schist and corundum bearing pelitic rocks and contact of Closepet
granites and other litho units of the study area are presented in Table.6.1 and 6.2.
Aluminum, silicates, Fe and chromium oxides are the four major oxides normally
dominated in corundum composition. The percentages of these four oxides are aluminum
high is considered as a perfect analog composition for corundum bearing rocks. Slightly
observed southern Karnataka corundum composed and associated with metamorphic rock
geochemical data proves genesis of corundum deposits under deep seated that time mafic
magma along with corundum tacked out and cooled in subsurface then tectonic activity
of uplifment may happen Corundum bearing rocks seen in surface in the form of outcrops
of the study area.
Spectral reflectance measurements were being conducted as an additional tool to
determine surface mineralogical composition of corundum bearing litho units and oxides
through Remote Sensing Technique. The absorption features of specific rock forming
minerals in the spectral range of 0.35 to 2.5 μm were studied in detail by several workers
Adams and McCord, 1973; Adams 1974, 1975; Hunt and Salisbury 1977, Adams, 1977;
Charette., 1982; Pieters, 1986; Ali et al., 2008; Manjunatha and Basavarajappa., 2017;
Ranjendran et al., 2018; Jeeven and Basavarajappa., 2018; Maruthi and Basavarajappa.,
2018; Maruthi et al., 2018; Basavarajappa et al., 2018; Basavarajappa et al., 2019. Such
reflectance measurements were made for the corundum surface using laboratory
spectrometers. Spectral curves measures corundum wavelength/ reflectance of 2.10, 2.20,
2.40 0.65, 1.4, 1.9nm and corundum bearing amphibolie schist reflectance curve
observation 2.10, 2.20, 2.40, 0.65, 0.88, 1.4, 1.9, 2.25, 2.35nm.
The present study understanding the corundum bearing litho units of petrology,
geochemistry, mineralogy, Remote Sensing and spectral reflectance, integration of
spectral and geochemical data given table 6.1 and 6.2 district wise calculating and
average of all major elements and correlate the spectral data. Corundum at Chitradurga,

176
Tumakur, Chikballapura, Hassan, Chikmagalur, Dakshina Kannada, Mysuru, Mandya
Ramanagara, Chamarajanagara and Kolar of southern Karnataka area Samples plots are
correlated with standard USGS Spectral Library using absolute reflectance v/s
wavelength which provide strong absorption range in 0.65 µm and 2.20 µm representing
the mineral Corundum shows intense absorption feature in 2.40 µm of the
electromagnetic spectrum (Hunt et al., 1971).
Absorption anomalies at wavelength regions of 0.55 µm and 0.9 µm of Fe3+
and
Fe2+
ions are observed respectively with low reflectance in the VNIR region (Ali M. Qaid
et al., 2009). The chemical analysis of corundum shows the distribution of major element
content as Al2O3 content shows high range from 75.81% to 87.69%; and minor content as
SiO2 ranging between 1.31% and 3.53%; MgO content is fairly low, CaO content ranges
from 0.99% to 4.82%; K2O content ranges from 0.09% to 0.58%; TiO2 content is fairly
low and varies from 0.3% to 1.96%; P2O5 ranges from 0.35% to 0.86%. High Al2O3
(>80%), SiO2 (>3%) and low TiO2 (0.86%) content imparts a corundum character with
that of high aluminum content (Table.6.1).
Corundum bearing amphibolites schist at Chitradurga, Tumakur, Chikballapura,
Hassan, Chikmagalur, Dakshina Kannada, Mysuru, Mandya Ramanagara,
Chamarajanagara and Kolar area Sample plots provide strong absorption range from 2.0
– 2.25 µm representing the mineral corundum whereas amphibole shows intense
absorption feature in 2.35 µm of the electromagnetic spectrum (Hunt et al., 1971).
Absorption anomalies at wavelength regions 0.55 µm and 0.9 µm of Fe3+
and Fe2+
ions
are observed respectively . Absorption range from 1.4 – 1.9 µm are noticed due to the
presence of water and hydroxyl molecules in the present sample (Ali M.Qaid et al.,
2009). Major and minor element content of amphibolite schist shows SiO2 ranging
between 18.12% and 62.6%; MgO content is fairly low and ranges from 0.25% to
16.64%; Al2O3 content high ranges from 23.65% to 38.21%; CaO content is 0.35% to
10.11%; K2O content of ranges from 0.1% to 7.44%; TiO2 content is fairly low and varies
from 0.25% to 1.01% and P2O5 ranges from 0.032% to 0.88% (Table.6.2).
This integration study compare the geochemical data and hyperspectral data, it‘s give the
result outstanding performance of software work and ground truth checking is 95%

177
correlated geochemical data and hyperspectral laboratory data. Further studies
hyperspectral instrument helps to identifying unknown minerals need not to geochemical
data EZ-ID tool explain everything including percentage of composition also, table 6.1
and 6.2.
In future hyperspectral satellite data (hiperion and ali) using spectral signatures known
area to unknown area it‘s given 99% result after band combination color enhancing
particular minerals using ENVI software find the results.

178
Table.6.1. Integration of Geochemical data and Spectral Analysis of Corundum samples of the Study area
Chemical Elements
Sample numbers
Corundum Samples
Chitradurga
1 -2
Tumakur
3-4,6-8,10-15
Chikballapura
16-19 and 21
Hassan
22,23,26&27
Chikmagalur
28 - 30
Dakshina
Kannada
33 &34
Mysuru
36 - 51
Mandya
52 - 64
Ramanagar
a
65 - 68
Kolara
72 - 73
Average
Elements
wt%
SiO2 17.68 11.42 10.98 15.62 14.09 16.75 7.3 11.77 13.03 19.43
Al2O3 72.84 81.37 81.64 77.34 79.83 75.82 87.69 82.66 80.76 75.81
Fe2O3 3.53 2.72 3.04 1.31 1.43 1.03 1.12 1.53 2.15 1.49
CaO 1.16 1.2 1.06 4.26 1.43 4.82 0.98 1.07 0.99 1.06
MgO 0 0 0 0 0 0 0 0 0 0
K2O 0.58 0.26 0.23 0.09 0.18 0.3 0.18 0.21 0.22 0.22
Cr2O3 0.91 0.29 0.25 0.17 0.56 0.16 1 0.24 0.29 0.3
TiO2 1.96 1.65 1.7 0.47 1.34 0.3 0.81 1.29 1.45 1.64
MnO 0.11 0.04 0.04 0.01 0.04 0.34 0.08 0.05 0.06 0.06
P2O5 0.86 0.59 0.59 0.35 0.63 0.22 0.32 0.67 0.7 0.43
Total 99.79 99.54 99.53 99.62 99.53 99.74 99.48 99.49 99.65 100.44
Rock type
Corundum Corundum Corundum Corundum Corundum Corundum Corundum Corundum Corundum Corundum
Spectral Analysis
Correlation
score EZ-ID 0.854 0.933 0.902 0.941 0.877 0.908 0.936 0.949 0.895 0.941
Absorption
spectra
(µm)
Lab
spectral
signature
2.10, 2.20,
2.40 0.65,
1.4, 1.9
2.10, 2.20,
2.40 0.65,
1.4, 1.10
2.10, 2.20, 2.40
0.65, 1.4, 1.11
2.10, 2.20,
2.40 0.65,
1.4, 1.12
2.10, 2.20,
2.40 0.65, 1.4,
1.13
2.10, 2.20,
2.40 0.65,
1.4, 1.14
2.10, 2.20,
2.40 0.65,
1.4, 1.15
2.10, 2.20,
2.40 0.65,
1.4, 1.16
2.10, 2.20,
2.40 0.65, 1.4,
1.17
2.10,
2.20,
2.40
0.65,
1.4,
1.18
Best
matches to USGS Corundum Corundum corundum corundum corundum corundum corundum corundum corundum
corund
um

179
Table.6.2. Integration of Geochemical data and spectral analysis of corundum bearing litho units of the Study area
Chemical
Elements
Sample numbers
Corundum bearing Amphibolite schist and other Samples
Chitradurga
2.a
Tumakur
5 and 9
Chikballapura
20 and 22
Hassan
24 and 25
Chikmagalur
31 and 32
Dakshina
Kannada
35
Mysuru
38, 43& 47
Mandya
53 & 61
Ramanagar
a
69 & 70
Chamarajanag
ara
71 & 71.a
Avarage
Elements
wt%
SiO2 40.21 62.6 62.38 31.56 22 18.12 24.84 36.71 35.19 39.1
Al2O3 32.86 23.65 23.78 29.16 29.85 38.21 37.45 37.36 30.95 32.89
Fe2O3 5.98 1.88 3.343 10.58 9.59 12.121 16.58 5.51 9.92 11.953
CaO 8.43 0.35 1.281 10.11 8.77 10.566 7.88 7.94 8.49 2.624
MgO 10.12 6.47 0.255 16.64 10.17 10.476 9.8 10.17 11.13 7.333
K2O 0.42 0.21 7.419 0.25 0.13 0.147 0.1 0.41 0.13 3.643
Cr2O3 0.002 0 0 0.1 6.68 8.559 1.42 0.002 2.44 0.076
TiO2 1.01 0.29 0.256 0.08 0.53 0.384 0.28 0.68 0.62 0.82
MnO 0.67 0.18 0.029 0.16 0.16 0.17 0.33 0.03 0.11 0.181
P2O5 0.032 0.84 0.723 0.68 0.44 0.562 0.59 0.5 0.63 0.881
Total 99.32 96.47 99.46 99.32 88.32 99.31 99.27 99.31 99.61 99.5
Rock
type
Corundum
bearing
Amphibolit
e schist
Corundum
bearing
Closepet
granite
Corundum
bearing
Closepet
granite
Corundum
bearing
Amphibolite
schist
Corundum
bearing
Amphibolite
schist
Corundu
m bearing
Amphibol
ite schist
Corundum
bearing
Amphibolit
e schist
Corundum
bearing
Amphibolit
e schist
Corundum
bearing
Amphibolit
e schist
Corundum
bearing Pelitic
rock
Spectral Analysis
Absorpti
on
spectra
(µm)
Lab
spectral
signatu
re
2.10, 2.20,
2.40, 0.65,
0.88, 1.4,
1.9, 2.25,
2.35,
2.10, 2.20,
2.40, 0.65,
0.88, 1.4,
1.9, 2.25,
2.35,
2.10, 2.20,
2.40, 0.65,
0.88, 1.4,
1.9, 2.25,
2.35,
2.10, 2.20,
2.40, 0.65,
0.88, 1.4,
1.9, 2.25,
2.35,
2.10, 2.20,
2.40, 0.65,
0.88, 1.4,
1.9, 2.25,
2.35,
2.10, 2.20,
2.40, 0.65,
0.88, 1.4,
1.9, 2.25,
2.35,
2.10, 2.20,
2.40, 0.65,
0.88, 1.4,
1.9, 2.25,
2.35,
2.10, 2.20,
2.40, 0.65,
0.88, 1.4,
1.9, 2.25,
2.35,
2.10, 2.20,
2.40, 0.65,
0.88, 1.4,
1.9, 2.25,
2.35,
2.10, 2.20,
2.40, 0.65,
0.88, 1.4, 1.9,
2.25, 2.35,
Correlati
on score
EZ-ID 0.983 0.883 0.821 0.943 0.941 0.878 0.976 0.968 0.949 0.893
Best
matches
to
USGS Amphibole,
Corundum
Amphibole,
Corundum
Amphibole,
Corundum
Amphibole,
Corundum
Amphibole,
Corundum
Amphibole,
Corundum
Amphibole,
Corundum
Amphibole,
Corundum
Amphibole,
Corundum
Amphibole,
Corundum

180
6.3. Energy – Dispersive X-ray Specctroscopy (EDS)
Energy dispersive X-ray spectroscopy (EDS,
EDX, EDXS OR XEDS). sometimes called energy
dispersive X ray analysis (EDXA) or energy
dispersive X-ray microanalysis (EDXMA), is an
analytical technique used for the elemental analysis
or chemical characterization of a sample (Severin
Kenneth., 2004). it relies on an interaction of some
source of X-ray excitation and a sample. its
characterization capabilities are due in large part to
the fundamental principle that each element has a Fig.6.1. EDS instrument UOM
unique atomic structure allowing a unique set of peaks on its electromagnetic emission
spectrum (PinakiSengupta et al., 2008).
Interaction of an electron beam with a sample target produces a variety of emissions,
including x-rays (Severin Kenneth., 2004). An energy-dispersive (EDS) detector is used
to separate the characteristic x-rays of different elements into an energy spectrum, and
EDS system software is used to analyze the energy spectrum in order to determine the
abundance of specific elements (Goldstein., 2003). EDS can be used to find the chemical
composition of materials down to a spot size of a few microns, and to create element
composition maps over a much broader raster area (Reimer., 1998). Together, these
capabilities provide fundamental compositional information for a wide variety of
materials (Egerton., 2005).
An element map is an image showing the spatial distribution of elements in a sample.
because it is acquired from a polished section, it is a 2D section through the unknown
sample. Element maps are extremely useful for displaying element distributions in
textural context, particularly for showing compositional zonation (Santos and Brandno,
2005). one can use either an EDS or WDS system to produce an element map either way,
the image is produced by progressively rastering the electron beam point by point over an
area of interest (Clarke., 2002). Think of element map as a pixel by pixel (bitmap) image
based on chemical elements. Resolution is determined by how long the beam dwells on

181
each point (and of course the actual concentration). Greater distinction can be made by
longer analysis, but at the cost of time. In many cases, adequate element maps can be
acquired by EDS system (Clarke., 2002). This is typically a faster approach, but
sacrifices resolution and detection limits. the best element maps are acquired using a
WDS system on an electron microscope, but the trade-off in using the spectrometers is
longer acquisition time (PinakiSengupta et al., 2008).
6.4. EDS ANALYSIS AND ELEMENTAL MAP OF CORUNDUM BEARING
ROCK AROUND CHITRADURGA DISTRICT
Corundum bearing rock has high aluminum content and other elements also the
present study helps to better understanding chemical composition of rock with help of
EDS instrument (Hitachi S-3400N 5.00 kV model EVO LS15). EDS Analysis is a great
method for determining particle sizes and elemental composition. It is also a go-to
analytical technique for performing Nano characterization. Not only that, used in
conjunction with EDS it is possible to compare different chemical compositions between
each layer. The topography of films can at times mask the number of film layers in a
sample (Santos and Brandno, 2005). Energy Dispersive X‐ray Spectroscopy (EDS) as an
analysis method, corundum shows EDS lines at similar energies detect the chemical
composition of Al, Si, Ca, Cr, Cl, C and O, percentage of aluminum presence in 20.70%
and atom 12.78% (Fig.6.1)(Table.6.3). The EDS technique detects x-rays emitted from
the sample during bombardment by an electron beam to characterize the elemental
composition of the analyzed volume. Features or phases as small as 0.01 µm or less can
be analyzed. keep the electron beam stationary on a spot or series of spots and generate
spectra that will provide more localized elemental information, have the electron beam
follow a line drawn on the Corundum sample image and generate a plot of the relative
proportions of previously identified elements along that spatial gradient, defined elements
over the scanned area identify the elements of Al, Si, Ca, Cr, C and O (Fig.6.1)
(Table.6.3).
Elemental map its easily understanding the percentage of chemical composition and
which part is more aluminum content of particular sample, in this chitradurga region
sample EDS can be used in semi-quantitative mode to determine chemical composition

182
by peak-height ratio relative to a standard. This sample more in Al and O content and
other elements of Si, Ca, Cr, Cl and C, aluminum atomic number 13 and its atomic mass
26.982 is x-ray counts 1639 times its high energy observed in this map (Fig.6.2).
Table.6.3. Phase fractions (wt %) Corundum composition measured by EDS
Element
Line
Weight %
Weight %
Error
Atom %
C- K 16.44 ± 0.57 22.80
O- K 61.19 ± 0.47 63.71
Al -K 20.70 ± 0.19 12.78
Si -K 0.38 ± 0.06 0.23
Cl- K 0.27 ± 0.04 0.13
Ca- K 0.28 ± 0.04 0.12
Ca- L --- --- ---
Cr -K 0.73 ± 0.09 0.23
Total 100.00 100.00
Fig.6.2. EDS spectrum Corundum rock of Chitradurga region.
Typical EDS spectrum: y-axis depicts the number of counts and x-axis the energy (in
KeV) of the X-rays. The position of the peaks leads to the identification of the elements
and the peak height helps in the quantification of each element‘s concentration in the
Corundum sample (Fig.6.2).

183
Fig.6.3. Elemental map of Corundum sample, (a) polished surface EDS image, (b) polished
sample (c) field sample of corundum.

184
6.5. EDS ANALYSIS AND ELEMENTAL MAP OF CORUNDUM BEARING
ROCK AROUND TUMKUR DISTRICT
EDS analysis take over the Tumkur region corundum sample its Phase fractions
Corundum composition measured we seen (Table.6.4). Its shows elements and their
weight percentage and atom percentage, here O, Al and C is more composition in this
sample (Table.6.4). The graph shows x and y axis is measured x-ray counts and energy,
Al, 2006 X-ray counts observed, results shows high energy alumina content presence in
Tumkur region corundum sample (fig.6.4).
Table.6.4. Phase fractions (wt%) Corundum composition measured by EDS
Element
Line
Weight %
Weight %
Error
Atom %
C- K 19.82 ± 0.52 26.62
O -K 61.89 ± 0.43 62.40
Na- K 0.83 ± 0.10 0.58
Al- K 16.83 ± 0.16 10.06
Si -K 0.40 ± 0.05 0.23
Cl -K 0.24 ± 0.03 0.11
Total 100.00 100.00
Fig.6.4. EDS spectrum Corundum rock of Tumkur region.

185
Fig.6.5. Elemental map of Corundum sample, (a) polished surface EDS image, (b) field
sample of corundum (c) polished sample.
Elemental map its easily understanding the percentage of chemical composition and
which part is more aluminum content of particular sample, in this Tumkur region sample
EDS can be used in semi-quantitative mode to determine chemical composition by peak-
height ratio relative to a standard. This sample more in Al, O and C content and other
elements of Si, Ca, Na and Cl aluminum atomic number 13 and its atomic mass 26.982 is
x-ray counts 1639 times its high energy observed in this map (Fig.6.5).

186
6.6. EDS ANALYSIS AND ELEMENTAL MAP OF CORUNDUM BEARING
ROCK AROUND MYSURU DISTRICT
EDS analysis result take over the Mysuru district corundum sample its Phase fractions
Corundum composition measured we seen (Table.6.5). Its shows elements and their
weight percentage and atom percentage, here Al & O, is more composition observed in
this sample and minor elements observed C, Na, Si and Cl (Table.6.5).
The graph shows x and y axis is measured x-ray counts and energy, Al, 1459 X-ray
counts observed, results shows high energy alumina content presence in Mysuru District
corundum bearing rock (fig.6.6).
Table.6.5. Phase fractions (wt%) Corundum composition measured by EDS
Element
Line
Weight %
Weight %
Error
Atom %
C -K 7.93 ± 0.90 11.82
O- K 59.34 ± 0.62 66.41
Na- K 1.08 ± 0.15 0.84
Al -K 30.34 ± 0.28 20.13
Si- K 0.97 ± 0.10 0.62
Cl- K 0.34 ± 0.06 0.17
Total 100.00 100.00
Fig.6.6. EDS spectrum Corundum rock of Mysuru region.

187
Fig.6.7. Elemental map of Corundum sample, (a) polished surface EDS image, (b)
Polished sample of corundum
Elemental map it easily understands the result of chemical composition and which part is
more aluminum content of particular sample, in this Mysuru region sample EDS can be
used in elemental zoning and mapping of corundum rock. This rock more in Al, O and
Na content and other elements of Si, Ca, and Cl, aluminum atomic number 13 and its
atomic mass 26.982 is x-ray counts 1459 times its high energy alumina content observed
in this map (Fig.6.7).

188
6.7. EDS ANALYSIS AND ELEMENTAL MAP OF CORUNDUM BEARING
ROCK AROUND DAKSHINA KANNADA DISTRICT
EDS analysis result take over the Dakshina Kannada district corundum sample its Phase
fractions corundum composition measured we seen (Table.6.6). Its shows elements and
their weight percentage and atom percentage, here Al, Cr & O, is more composition
observed in this sample and minor elements observed C, Na, Si and Cl (Table.6.6).
The graph shows x and y axis is measured x-ray counts and energy, Al, 4410 X-ray
counts observed, results shows high energy alumina content presence in Dakshina
Kannada district corundum bearing rock (fig.6.8).
Table.6.6. Phase fractions (wt %) Corundum composition measured by EDS
Element
Line
Weight %
Weight %
Error
Atom %
C- K 0.00 --- 0.00
O- K 58.32 ± 0.35 70.52
Na -K 1.36 ± 0.10 1.14
Al -K 37.89 ± 0.21 27.17
Si- K 0.44 ± 0.07 0.30
Cl -K 0.53 ± 0.09 0.29
Ca- K 0.25 ± 0.05 0.12
Cr- K 1.21 ± 0.09 0.45
Total 100.00 100.00
Fig.6.8. EDS spectrum Corundum rock of Dakshina Kannada region.

189
Fig.6.9. Elemental map of Corundum sample, (a) polished surface EDS image, (b) Polished
sample of corundum bearing rock.

190
Elemental map it easily understands the result of chemical composition and which part is
more aluminum content of particular sample, in this Dakshina Karnataka sample EDS
can be used in elemental zoning and mapping of corundum sample. This sample more in
Al, O and Cr content and other elements of Si, Ca, Na, C and Cl, aluminum atomic
number 13 and its atomic mass 26.982 is x-ray counts 4410 times its high energy alumina
content observed in this map (Fig.6.9).
EDS study on corundum bearing samples majorly Sothern Karnataka high granulate
terrain and composition of highly sheared schist belts, here I am divided four region of
my study area a. Chitradurga b. Tumkur c. Mysuru and d. Dakshina kannada districts
these parts having more alumina content is observed particularly Dakshina Kannada
district having more alumina and chromium content because of this impurities corundum
shows more red color. Chitradurga al so field sample shows white color because less
impurities observed and it has high alumina content of magmatic deposition, Tumkur and
Mysuru region corundum samples occurs associated with metamorphic rocks, through
EDS observed these samples has a high alumina content observed.
Present research study better understanding crystal structure, optical properties, chemical
composition and spectral signature study on corundum bearing samples of southern
Karnataka region.

191
CHAPTER-VII
7.1. SUMMARY AND CONCLUSION
Southern Karnataka is located in the wedge shaped Indian peninsular and it comes to
Western Dharwar Craton part, the geological history of Karnataka is mainly confined to
the two major oldest eras namely the Archaean and Proterozoic. The study area
geological succession covers oldest Sargur group 3300my, Peninsular Gneissic Complex
and Dharwar super group covers the Bababudan group and Chitradurga group.
Southern Karnataka mainly consist of major schist belts like Chitradurga schist belt,
Holenarasipura schist belt, Nuggehalli schist belt, Sargur schist belt, Bababudan schist
belt, Kudremukh schist belt, Shimoga schist belt, Javanahalli schist belt, Kunigal schist
belt, Kolara schist belt, Kadiri and Ramgiri schist belt.
Corundum is a crystalline form of the Aluminium oxide, which can be found in three
main geological environments of Magmatic, Metamorphic and Sedimentary Deposits. In
the Study area almost corundum occurs magmatic and metamorphic deposits only, in
contact zone of Closepet Granite mafic magma carried out the corundum deposits to the
surface, in chapter 2 using ground truth checking data with help of Remote Sensing and
GIS techniques demarcated the Corundum locations in the study area.
Field geology and petrographic study understanding the surface features, underground
structure of lithosphere, composition and characterization of corundum bearing litho units
and geological aspects, in this area 11districts are demarcated the corundum horizons.
Chitradurga area, magmatic deposits found loose barrel shaped crystals of pink
corundum and metamorphic deposits of corundum bearing amphibolites schist occur in
Kyadigunte area.
Tumkur district demarcated 13 locations of corundum bearing rocks mainly occur in
contact zone of closepet granite.
In Chikballapura district also found corundum bearing closepet granite and corundum
occurs in 6 locations.

192
In Hassan district mainly in Arsikere region corundum found in magmatic deposits and
Belagumba area found corundum bearing amphibolites.
In Chikmagalur area found 5 locations of corundum bearing rocks.
In Dakshina Kannada district also mainly corundum occurs Uppinangadi and Koila area,
corundum bearing amphibolites schist occurs Shanthigodu and Sullia area.
In Mysuru district covers 16 locations have been identified corundum bearing horizons.
In Mandya also 13 locations are demarcated in corundum bearing rocks. Ramnagara 6
locations have been identified corundum deposits.
In Chamarajanagara district found corundum bearing pelitic rock in Budipadaga area and
Fe garnet rich corundum found in Biligirirangan hills.
Kolara occurs corundum deposits of Yelesandra and Kammasandra area.
Field observing ground truth check, physical and optical properties have been identified
as Corundum presence in the Study area.
After through examination and study of Geochemical, Spectral Signatures with
correlation of the optical Physical and petrological characteristic features of corundum in
pure and nearly very important deposits in all the locations of the Study area.
Geochemical data shows percentage of chemical composition that result carried out with
help of Orogin pro 8.5 and Tridraw softwares, geochemical study shows corundum has a
high alumina content and less Si, Cr, Fe, Ti, Ca, and Mg conents, in all the locations of
the Study area.
Hyperspectral remote sensing is one of the advance technology Spectroscopy is the study
of light interaction as a function of wavelength, interactions contain light emitting,
reflection or scattering from any of the material. Spectroradiometer Spectral Evolution
RS-3500 (DARWin SP.V.1.3.0 Data Acquisition software) is used to measure the
radiometric quantities like radiance and irradiance in continuous bands of spectral ranges
0.35 to 2.5µ in the EMS. EZ-ID provides geologists, geoscientists, and geometallurgists

193
with the tools to identify minerals, create more accurate mineral maps and vector
alteration to mineralization, Sample identification has never been faster, easier, or more
accurate than with EZ-ID software from Spectral Evolution.
Based on these spectral studies and relating them with the USGS spectral library, it was
observed that corundum, actinolite, hornblende, sericite, iron oxide and chromium are
more abundant corundum bearing rocks found in the study area.
Spectral analysis corundum absorption spectra (µm) 2.10, 2.20, 2.40 0.65, 1.4 and 1.9 nm
observed. Corundum bearing amphibolites schist spectral signatures observed 2.10, 2.20,
2.40, 0.65, 0.88, 1.4, 1.9, 2.25 and 2.35nm.
The integration study compare the geochemical data and hyperspectral data, it‘s give the
result outstanding performance of software work and ground truth checking is 95%
correlated geochemical data and hyperspectral laboratory data. Chitrdurga 72.84%,
Tumkur 81.64%, Chikballapura 81.64%, Hassan 77.34%, Chikmagalur 79.83, Dakshina
Kannada 87.69%, Mysuru 87.69%, Mandya 82.66, Ramanagara 80.76%,
Chamarajanagara 32.89% and Kolara 75.81% of districts has alumina content observed
in the study area. Finaly Geochemical results shows purity of the Corundum mineral
present in the Precambrian basement rocks of the Southern Karnataka.
Hyperspectral data has been used to identify and distinguish spectrally similar materials
having characteristic reflectance spectra. Due to the capability of distinguishing various
ground objects in detail, hyperspectral datasets are able to detect and map a wide variety
of materials in the study area. Spectral reflectance in visible and near-infrared offers a
rapid and inexpensive technique for determining the mineralogy of samples and obtaining
information on chemical composition.
The Research Study Aims to carry out on corundum bearing horizons and their detail
Mapping through hyperspectral and with the mineralization, its characterization is
particular the types of corundum is precious and semi-precious to utilization in Gem
Industry, which is having gemology and Gemstone in Industrial Applications of the state
and Indian region.

194
Purity of Corundum is all the demarcated areas percentage of AL content high and
oxygen is more than 60% based on the Al and oxygen present in the Corundum, at
present recent trends on this particular mineral not only used as a abrasive, precious and
gems industry . now Medical field, Electrical field, Watch industry, in Ayurveda bone,
mucels and body pain healing purpas used and add nano technology implementing the
paints al so this mineral is using.
Based on above Research problem we can store the Hyperspectral curves and further all
these curves may Indian Standerds of Hyperspectral library of Precambrian terrains for
further and futures researchers in the Department. All Geoscientist, throughout the world
feature works can use them as standards of ISI.
7.2. Recommendations for future Research
1. Apply the same study of other gemstone deposits in the study area.
2. Correlation work on between the Precambrian basement rocks of similar geological
Terrains and comparison studies for the corundum bearing litho units of the Indian
Continent.
3. Utilization of Hyperion, ALI and AVIRIS which provides 242 bands (350 to 2500nm)
Of high resolution satellite images and Airborne images are the advanced techniques
as to utilize for studying the Corundum bearing horizons.
4. Generate the Indian Spectral Library for major & minor minerals of recent dated rock
types to Precambrian rocks of the Indian terrain.
195
BIBLOGRAPHY
A. A. Green, M. Berman, P. Switzer and M. D. Craig (1988) ―A Transformation for
Ordering Multispectral Data in Terms of Image Quality with Implications for Noise
Removal,‖ IEEE Transactions on Geoscience and Remote Sensing, Vol. 26, No. 1, 1988,
Pp. 65-74.
Albarede, Francis (2007). Geochemistry : an introduction. Translated from the French.
(5th ed.). Cambridge: Cambridge Univ. Press. ISBN 9780521891486. Cambridge
University Press 978-0-521-88079-4 - Geochemisry: An Introduction: Second Edition
Francis Albarède Frontmatte.
AL-Daghastani, N. S. (2003) ―Remote sensing: principle and application‖, Dar Al-
Manaheeg for publication and deliveries, Amman, Jordanian, pp 473.
Ali M Qaid and Basavarajappa H.T., (2008). Application of Optimum Index Factor
Technique to LANDSAT-7 ETM+ data for geological mapping of North-East of Hajja,
Yemen, American Euratian Journal of Scientific Research, IDOSI Publication., Vol.3,
No.1, Pp: 84-91.
Ali M. Qaid, Basavarajappa H.T. and Rajendran S. (2009). Integration of VNIR and
SWIR Spectral Reflectance for Mapping Mineral Resources; A case study, North East of
Hajjah, Yemen, J. Indian. Soc. Remote Sens, Vol.37, Pp: 305-315.
Ali M. Qaid., Basavarajappa, H.T and Rajendran S. (2009). Application of Principal
Component Analysis to ASTER and ETM+ Data for Mapping the Alteration Zones in
North East of Hajjah, Yemen. Asian Journal of Geoinformatics, Vol.9, No.2, Pp: 15-21.
Alvaro P. Crosta, Charles Sabine and James V. Taranik. Hydrothermal alteration
mapping at Bodie California. Using AVIRIS Hyperspectral data.Elsevier science Inc.
Remote sensing environ, 65-309-319 (1998).
Analytical Spectral Devices Inc., (2002). Field Spec ® Pro: User Guide. Boulder Co.,
USA.

196
Aspen, P., Upton, B.G.J., Dicken, A.P., 1990. Anorthoclase, sanidine and associated
megacryts in Scottish alkali basalts: high pressure syenitic debris from upper mantle
sources European Journal of Mineralogy 2, 503–517
Awasthi SK, Krishnamurthy KV (1979). Geology of parts of Puttur and Sullia talucks,
South Kanara district, Karnataka. Progress report for the field season 1978-1979,
Geological Survey of India, Karnataka (South) Circle, 1-11.
Aydogan, S.M. and Moazzen, M., (2012): Origin and metamorphism of corundum-rich
metabauxites at Mt Ismail in the southern Menderes Massif, SW Turkey. Resource
Geology Journal, V.62, p.243-262.
B. M. Ravindra and A. S. Janardhan, (1981) Preliminary report on aegerine augite
bearing syenite near SuBia Town, Dakshina Kannada District Karnataka. Journal
Geological Society of India, Vol. 22, Aug. pp. 399 to 402.
Babaie Hassan A (2001) The Brunton compass and Geological objects. Georgia
Geological Society Guidebooks V,21. No1. October, P55-60.
Barry, P. Seqal, C., and Carman, S. 2001. EO-1 Hyperion science Data User‘s Guide.
TRW Space, Defense and Information Systems. Vol. 01, No. 077 pp: 1-65.
Basavarajappa H.T and Dinakar S, (2005). Land use and Land cover studies around
Kollegal taluk, Chamarajanagar district using Remote Sensing and GIS techniques., The
Indian Mineralogist, MSI, Special Vol.1, No.1, Pp: 89-94.
Basavarajappa H.T and Manjunatha M.C (2014). Geoinformatics Technique on Mapping
and Reclamation of Wastelands in Chitradurga district, Karnataka, India, International
Journal of Computer Engineering & Technology, Vol.5, Issue.7, Pp. 99-110.
Basavarajappa H.T and Manjunatha M.C (2015). ―Groundwater Quality Analysis in
Precambrian rocks of Chitradurga district, Karnataka, India using Geo-informatics
Technique‖, International Conference of Water Resources, Coastal and Ocean
Engineering (ICWRCOE-2015), Elsevier Aquatic Procedia, Vol.4, Pp: 1354-1365.

197
Basavarajappa H.T and Maruthi N.E (2018). Hyperspectral And Petro - Chemical
Signatures Study On Shear Zone Controlled Corundum Bearing Pelitic Rocks Of
Budipadaga Area, Chamarajanagara District, Karnataka, India. International Journal of
Research and analytical Reviews (IJRAR) Volume 5, Issue 3, pp. 906-913.
Basavarajappa H.T and Maruthi N.E (2018). Hyperspectral and Petro - Chemical
Signatures study on Corundum Bearing Litho-Units around Sringeri Area, Chikmagalur
District, Karnataka, India. RESEARCH REVIEW International Journal of
Multidisciplinary Volume 3, Issue10, pp. 899-904.
Basavarajappa H.T and Maruthi N.E (2018). Petro – Chemical And Spectral Signatures
On Corundum Bearing Precambrian Amphibolites In Sullia Area, Dakshina Kannada
District, Karnataka, India. Journal of Emerging Technologies and Innovative Research
(JETIR) Volume 5, Issue 7, pp. 75-83.
Basavarajappa H.T and Maruthi N.E (2018). Petrochemical characteristics and
Hyperspectral signatures on Corundum bearing Precambrian litho-units of Varuna area,
Mysuru district, Karnataka, India. International Journal of Creative Research Thoughts,
Volume6, Issue1, Pp.998-109.
Basavarajappa H.T, and Maruthi N.E (2018). Hyperspectral Signature Study Finds
Corundum Alters To Diaspore Influeance Of Climate Change Of Dharwar Craton
Arsikere Band Of Haranahalli, Hassan District, Karnataka, India. Journal of
Environmental Science, Computer Science and Engineering and Technology (JECET)
Volume 7, Issue 2, Pp.238-246.
Basavarajappa H.T, Dinakar S and Manjunatha M.C (2014 c). Analysis of Land use/ land
cover classification around Mysuru and Chamarajanagara district, Karnataka, India using
IRS-1D, PAN+LISSIII Satellite data, International Journal of Civil Engineering and
Technology (IJCIET), Vol.5, Issue.11, Pp: 79- 96.
Basavarajappa H.T, Dinakar S, Satish M.V and Honne Gowda H (2008). Morphometric
analysis of subwatersheds of river Suvarnavathi Catchment, using GIS, Chamarajanagara
District, Karnataka, Remote Sensing and GIS Applications, Edited Volume, University of
Mysore, Vol.1, No.1, Pp.45-53.

198
Basavarajappa H.T, Dinakar S, Satish M.V, Nagesh D, Balasubramanian A and
Manjunatha M.C (2013). Delineation of Groundwater Potential Zones in Hard Rock
Terrain of Kollegal Shear Zone (KSZ), South India, using Remote Sensing and GIS,
International Journal of Earth Sciences and Engineering (IJEE), Cafet-Innova, Hydrology
& Water Resource Management- special issue, Vol.6, No.5, Pp: 1185-1194.
Basavarajappa H.T, Jeevan L, Rajendran S and Manjunatha M.C. (2015). Discrimination
of Banded Magnetite Quartzite (BMQ) deposits and associated Lithology of parts of
Chikkanayakanahalli Schist Belt of Dharwar Craton, Karnataka, India using Remote
Sensing technique, International Journal of Advanced Remote Sensing and GIS, Cloud
Publications, Vol.4, Issue.1, Pp: 1033-1044.
Basavarajappa H.T, Jeevan L, Rajendran S and Manjunatha M.C., (2015 c).
Discrimination of Banded Magnetite Quartzite (BMQ) deposits and associated Lithology
of parts of Chikkanayakanahalli Schist Belt of Dharwar Craton, Karnataka, India using
Remote Sensing technique, International Journal of Advanced Remote Sensing and GIS,
Cloud Publications, Vol.4, Issue.1, Pp: 1033-1044.
Basavarajappa H.T, Manjunatha M.C and Jeevan L (2014 a). Application of
Geoinformatics in Delineation of Groundwater Potential Zones of Chitradurga District,
Karnataka, India, International Journal of Computer Engineering & Technology, Vol.5,
Issue.5, Pp. 94-108.
Basavarajappa H.T, Manjunatha M.C and Maruthi N.E (2016). Land Use/Land Cover
change detection analysis in Hosadurga taluk of Chitradurga district, Karnataka, India
using Geo-informatics technique, Journal of International Academic Research for
Multidisciplinary (IJARM), Vol.4, Issue.2, Pp: 304-314.
Basavarajappa H.T, Manjunatha M.C and Rajendran S (2015 a). Integration of
Hyperspectral Signatures and major elements of Iron Ore Deposits around Holalkere
range of Megalahalli, Chitradurga Schist Belt, Karnataka, India, Journal of The Indian
Mineralogist, MSI, Vol.49, No.1, Pp: 85-93.
Basavarajappa H.T, Manjunatha M.C and Rajendran S (2015). Integration of
Hyperspectral Signatures and major elements of Iron Ore Deposits around Holalkere

199
range of Megalahalli, Chitradurga Schist Belt, Karnataka, India, Journal of The Indian
Mineralogist, MSI, Vol.49, No.1, Pp: 85-93.
Basavarajappa H.T, Manjunatha M.C, Rajendran S and Jeevan L (2017) Determination of
Spectral Characteristics on Archaean Komatiites in Ghattihosahalli Schist Belt (GSB) of
Kumminagatta, Chitradurga District, Karnataka, India. International Journal of Advanced
Remote Sensing and GIS 2017, Volume 6, Issue 1, pp. 2416-2423.
Basavarajappa H.T, Maruthi N.E and Manjunatha M.C (2017). Hyperspectral Signatures
and Field Petrography of Corundum bearing litho-units in Arsikere band of Haranahalli,
Hassan District, Karnataka, India. International Journal of Creative Research Thoughts,
Volume5, Issue4, Pp.3791-3798.
Basavarajappa H.T, Maruthi N.E, Jeevan L and Manjunatha M.C (2018). Physico-
chemical charectristics and hyperspectral signature study using geomatics on gem verity
of corundum bearing precambrian litho-units of Mavinahalli area, Mysuru district,
Karnataka, India. International Journal of Computer Engineering and Technology(IJCET)
Volume 9, Issue 1, pp. 102-112.
Basavarajappa H.T, Maruthi N.E, Jeevan L and Manjunatha M.C.(2018). Physico-
chemical charectristics and hyperspectral signature study using geomatics on gem verity
of corundum bearing precambrian litho-units of Mavinahalli area, Mysuru district,
Karnataka, India. International Journal of Computer Engineering & Technology (IJCET)
ISSN: 0976–6375 Volume 9, Issue 1, Jan-Feb 2018, pp. 102–112.
Basavarajappa H.T, Pushpavathi K.N and Balasubramanian A (2009). Mapping of
Geological and geomorphological landforms of Chamarajanagar taluk, Karnataka, India,
by Remote Sensing and GIS techniques, Journal of Indian Academy of Geosciences,
Vol.52, No.1, Pp: 1-10.
Basavarajappa H.T, Pushpavathi K.N. Balasubramanian A and Manjunatha M.C, (2012).
Mapping and Integration of Geology and Geomorphological Landforms of Mysore
district, Karnataka, India using Remote Sensing and GIS Techniques, Frontiers of Earth
Science Research, Proceeding/Edited Vol.1, No.1, Pp.164-175.

200
Basavarajappa H.T., (1992). Petrology, Geochemistry and Fluid inclusions studies of
Charnockites and associated rocks around Biligiri-Rangan hills, Karnataka, India, Unpub
PhD Thesis, University of Mysore, Pp: 1-96.
Basavarajappa H.T., Pushpavathi K.N. and Manjunatha M.C., (2015 d). Climate Change
and its impact on Groundwater Table Fluctuation in Precambrian rocks of
Chamarajanagar district, Karnataka, India using Geomatics Technique, International
Journal of Geomatics and Geosciences (IJGG), Vol.5, No.3, Pp: 285-299.
Boardman JW, Kruse FA, Green RO (1995). Mapping target signatures via partial
unmixing of AVIRIS data, Summaries, Proceedings of the Fifth JPL Airborne Earth
Science Workshop, 23–26 January, Pasadena, California, JPL Publ., 95-1, 1: Pp. 23–26.
Borengasser, M., William, S., Hungate, W. S. and Watkins, R. (2008). Hyperspectral
Remote Sensing: Principles and Applications. Taylor and Francis Group Boca Raton
London New York, Pp 119.
BOTRILL, R.S. (1998): A corundum-quartz assemblage in altered volcanic rocks, Bond
Range, Tasmania. Mineral. Mag. 62, 325––332.
Brousse, R. and Varet, J., (1966): Les trachytes du Mont-Dore et du Cantal septentrional
etleurs enclaves. Bulletin of the Geological Society of France, V.7, p. 246–262.
BROWNLOW, A.H. & KOMOROWSKI, J.C. (1988): Geology and origin of the Yogo
sapphire deposit, Montana. Econ. Geol. 83, 875––880.
Bruce Foote R., (1882). Notes on a traverse across the Gold Fields of Mysore. Rec. Geol.,
Survey of India. Vol.15, No.4, Pp: 191-201.
Bruce Foote, R. (1886). Notes on the geology of parts of Bellary and Anantapur districts.
Rec. Geological survey of India. 19(2): Pp: 97-111.
Bruce Foote, R. (1900). Geological notes on traverses through the Mysore State. Mem.
Mysore Geol. Dept., 1; Pp. 103.

201
Bruce Foote. R, (1888) "The Dharwar System" the chief auriferous rocks in south India.
Rec. Geol. Surv. India, 21 (2): Pp 1-40.
Buckingham, R., and Staenz, K. 2008. Review of current and planned civilian space
hyperspectral sensors for EO. Canadian Journal of Remote Sensing. Vol. 34, pp: 187-
197.
Burrough P.A and McDonnell R.A (1998). Principles of Geographic Information
Systems, 2nd
Edition, New York, NY: Oxford University Press, Pp: 333.
CESBRON, F., LEBRUN, P., LE CLÉAC.‘H, J.M., NOTARI, F., GROBON, C. &
DEVILLE, J. (2002): Corindons et spinelles. Minéraux et Fossiles 15, Paris, France.
Chadwick B and Ramakrishnan M., (1891). The stratigraphy and structure of the
Chitradurga region: an illustration of cover-basement interaction in the late Archaean
evolution of the Karnataka Craton, Southern India., Precambrian Res.
Chadwick B, Ramakrishanan M., Vishwanatha M.N and Srinivasa Murthy V., (1978).
Structural studies in the Archaean Sargur and Dharwar Supracrustal rocks of the
Karnataka Craton., J. Geol. Soc. India., Vol.19, Pp: 531-549.
Chakrapani Naidu M.G. (1982). Optical Mineralogy Laboratory Manual, Pp: 41-48.
Chandrashekhar, H. and Nazeer Ahmed (1994). Ruby Corundum and garnet occurrence
in Karnataka. In: Geokarnataka, MGD Centenary volume, Karnataka Asst. Geologist
Association, Bangalore., pp.193-204.
Chris Yakymchuk , Kristoffer Szilas (2018) Corundum formation by metasomatic
reactions in Archean metapelite, SW Greenland: Exploration vectors for ruby deposits
within high-grade greenstone belts. Journal of ELSEVIER Geoscience Frontiers 9 (2018)
727-749.
Chris Yakymchuk, Kristoffer Szilas (2018). Corundum formation by metasomatic
reactions in Archean metapelite, SW Greenland: Exploration vectors for ruby deposits
within high-grade greenstone belts. ELSEVIER Geoscience Frontiers 9 (2018) 727e749.

202
Clark M.D, (1987). Geologic map of the Al Bad quadrangle, Sheet 28A, Kingdom of
Saudi Arabia, Saudi Arabian Deputy Ministry for mineral resources geoscience map,
GM-81C, Scale 1:250,000, Pp: 46.
Clark R.N & Roush T.L, (1984). Reflectance Spectroscopy: Quantitative Analysis
Techniques for Remote Sensing Applications, Journal of Geophysical Research, Vol.89,
Pp: 6329-6340.
Clark R.N, (1999). Spectroscopy of Rocks and Minerals and Principles of Spectroscopy,
in Manual of Remote Sensing, Vol.3, Remote Sensing for the Earth Sciences, (A.N.
Rencz, ed) John Wiley and Sons, New York, Pp: 3-58.
Clark R.N, Swayze G.A, Gallagher A, King T.V.V and Calvin W.M (1993). Digital
Spectral Library: Version 1: 0.2 to 3.0, U.S. Geological Survey, Open File Report, 93-
592, Pp: 1326.
Clark R.N, Swayze G.A, Livo K.E, Kokaly R.F, King T.V.V, Dalton J.B, Vance J.S,
Rockwell B.W, Hoefen T and McDougal R.R (2002). Surface Reflectance Calibration of
Terrestrial Imaging Spectroscopy Data: a Tutorial using AVIRIS, In proceedings of the
10th Airborn Earth Science workshop, R.O. Green (Ed), JPL publication, Vol.2, No.1.
Clark, R. N., S. Vance, K.E. Livo, and R. Green, Mineral Mapping with Imaging
Spectroscopy: the Ray Mine, AZ, Summaries of the 7th Annual JPL Airborne Earth
Science Workshop, R.O. Green, Ed., JPL Publication 97-21. pp 67-76, Jan 12-14, 1998.
Clark, R. N., S. Vance, K.E. Livo, and R. Green, Mineral Mapping with Imaging
Spectroscopy: the Ray Mine, AZ, Summaries of the 7th Annual JPL Airborne Earth
Science Workshop, R.O. Green, Ed., JPL Publication 97-21. pp 67-76, Jan 12-14, 1998.
Clark, R. N., Swayze, G. A., Gallagher, A, King, T. V. V. and Calvin, W. M. (1993).
Digital Spectral Library: Version 1: 0.2 to 3.0 μm, U.S. Geological Survey, Open File
Report 93-592, Pp. 1326.
Clarke, A. R. (2002) Microscopy techniques for materials science. CRC Press (electronic
resource).

203
Classification des gisements de corindon. Le Règne Mineral. V.55, p.4–47.
Coenraads, R.R., (1992): Sapphires and rubies associated with volcanic provinces:
inclusions and surface features shed light on their origin. Australian Gemmologist
Journal, V.18, p.70-78.
Coenraads, R.R., 1992. Sapphires and rubies associated with volcanic provinces:
inclusions and surface features shed new light on their origin. Australian Gemmologist 18
(3), 70–78.
Coenraads, R.R., Sutherland, F.L., Kinny, P.D., 1990. The origin of sapphires: U–Pb
dating of zircon inclusions sheds new light. Mineralogical Magazine 54, 113-122.
continental margins intraplate basaltic fields. Journal of ELSEVIER Ore Geology
Reviews 34 (2008) 200–215.
Crawford A. R., (1969). Reconnaissance Rb-Sr dating of the Precambrian rocks in
Southern Peninsular India., J.Geol.Soc. India., Vol.10, Pp: 117-166.
Curran, Paul. J. (2001). Imaging spectrometry for ecological application, JAG,Vol.3-
Issue 305-312.
Drury S A., (1987). Image Interpretation in Geology (London: Allen &Unwin), Pp: 1-
243.
Drury, S., (2001). Image Interpretation in Geology. Third Edition. Blackwell Science Inc.
Pp: 122-157.
Dyer, Johen.R., 1994: Application of absorption Spectroscopy of Organic Compounds,
Prentice Hall of India.
Egerton, R. F. (2005) Physical principles of electron microscopy : an introduction to
TEM, SEM, and AEM. Springer, 202.
Elachi, C. Introduction to the Physics and Techniques of Remote Sensing, Wiley
Interscience, 1987.

204
Fact Sheet - LDCM Earth Image Collection Satellite. Orbital Sciences Corporation.
Retrieved 12 February 2013.
Farmer, V. C. (1974). The Infrared Spectra of Minerals, Mineralogical Society
Monograph 4. Mineralogical Society, London, UK, Pp. 539.
Fermor, L, L., (1936). An attempt at the correlation of ancient schistose formations of
Peninsular India. Mem. Geol. Surv, India, V.70 (1): 1-52; V.70 (2): Pp 53 - 218.
Fernando, G.W.A.R, Attanayake, A.N.B and Hofmeister, Wolfgang. Corundum-Spinel-
Taafeite-Scheelite bearing Metasomatites in Bakamuna, Sri Lanka Modeling of its
Formation, Proceedings of the International Symposium, Hanoi, September 26-October
2, 2005 .
Ferrier, G. and Wadge, G. (1996). The application of imaging spectrometry data to
mapping alteration zones associated with gold mineralization in southern Spain.
International Journal of Remote Sensing, 17, Pp. 331-350.
Ferrier, G., White, K., Griffiths, G., Bryant, R. and Stefouli, M. (2002). ‗The mapping
Frederic H. Lahee, (1941). Field Geology McGRAW – hill book company INC, printed
in the united states of America, Fourth edition P 3 – 263.
Friedman, J.D., F.E. Mutschler, R.E. Zaartman, P.H. Briggs, G.A. Swayze, and A.F.
Theisen, 1989, Shawangunk ore district, New York: Geochemical and spectral data.
USGS Open-File Report 89-193, p. 92.
Gaffey, S.J., (1986). Spectral reflectance of carbonate minerals in the visible and near
infrared (0.35–2.55 microns): calcite, aragonite, and dolomite. Am. Mineral. 71, Pp. 151–
162.
GARNIER, V., GIULIANI, G., MALUSKI, H., OHNENSTETTER, D., PHAN, T.T.,
HOÀNG, Q.V., PHAM, V.L., VU, V.T. & SCHWARZ, D. (2002b): Ar.–Ar ages in
phlogopites from marble-hosted ruby deposits in northern Vietnam: evidence for
Cenozoic ruby formation. Chem. Geol. 188, 33.– 49.

205
GARNIER, V., GIULIANI, G., OHNENSTETTER, D. & SCHWARZ, D. (2004a):
Saphirs et rubis. Classification des gisements de corindon. Le Règne Minéral 55, 4.–47.
Garnier, V., Giuliani, G., Ohnenstetter, D. and Schwarz, D., (2004a): Saphirs et rubis.
GARNIER, V., OHNENSTETTER, D., GIULIANI, G. & SCHWARZ, D. (2002a): Rubis
trapiches de Mong Hsu, Myanmar. Rev. Ass. Fr. Gemmol. AFG 144,5.–12.
GARNIER, V., OHNENSTETTER, D., GIULIANI, G., MALUSKI, H., DELOULE, E.,
PHAN, T.T., PHAM, V.L. & HOANG, Q.V. (2004b): Age and significance of ruby-
bearing marbles from the Red River shear zone, northern Vietnam. Can. Mineral. 43,
1315.–1329.
Gaston Giuliani, Daniel Ohnenstetter, Anthony E Fallic, Lee Groat, Andrew J, Fagan
(2014). The Geology and Genesis of Gem Corundum Deposits, Mineralogical
Association of Canada, short course 44, Tucson AZ February 2014, p, 29 – 112.
Geo Karnataka: Geology of Karnataka. Geokarnataka.blogspot.com (2007-03-18).
Retrieved on 2011-03-21.
Goetz A.F.H.(1992) Imaging spectrometry for earth remote sensing, Imaging
spectroscopy: Fundamentals and prospective applications:1-19.
Goetz, A. F., G. Vane, J. E. Soloman, and B. N. (1985). Rock, Imaging Spectrometry for
Earth Remote Sensing. Science, 228, 1147.
Goetz, A.F.H. (1992b) Principles of Narrow Band Spectrometry, in The Visible and IR:
Instruments and Data Analysis in Imaging Spectroscopy: Fundamentals and Prospective
Applications, F. Toselli and J. Bodechtel, Eds., pp. 21-32, Brussels and Luxembourg.
Goetz, A.F.H., Rock, B.N. and Rowan, L. C (1983). ―Remote sensing for exploration: An
overview‘. Economic Geology, Vol. 78, No. 4, Pp. 573–590.
Goetz, AFFH, Rowan, LC and Kigston, MJ (1982). ‗Mineral Identification from orbit
initial results from the shuttle multispectral infrared radiometer, Science, Vol 218, Pp.
1020-1024.

206
Golani, P.R. (1989) Sillimanite Corundum deposits of Sonapahar, Meghalaya, India: A
metamorphosed Precambrian Palaeosol. Precambrian Res., Vol.43, Pp: 175–189.
Goldstein, J. (2003) Scanning electron microscopy and x-ray microanalysis. Kluwer
Adacemic/Plenum Pulbishers, 689 p.
Graham R. Hunt (1977). Spectral Signatures of particulate minerals in the visible and
near infrared. Geophysics, Vol. 42. No.3, Pp: 501-513.
Graham, I., Sutherland, L., Khin, Zaw, Nechaev, V., Khanchuk, A., 2006a. Advances in
our understanding of the basalt-derived gem sapphire-ruby deposits of theWest Pacific
margins. 12th Quadrennial IAGOD Symposium 2006, Moscow, Russia, Extended
Abstract CDROM.
Graham, I.T., Sutherland, F.L., Webb, G.B., Fanning, C.M., 2004. Polygenetic
corundums from New South Wales gemfields. In: Khanchuk, A.I., Gonevchuk, G.A.,
Mitrokhin, A.N., Simanenko, I.F., Cook, N.J., Seltmann, R. (Eds.), Metallogeny of the
Pacific Northwest: Tectonics, magmatism and metallogeny of active continental margins.
Dalnauka, Vladivostok, pp. 336–339.
GSI (1981). Geological and Mineral map of Karnataka, Geological Survey of India.
GSI, Memoir (1981). ―Early Precambrian Supracrustals of Southern Karnataka.,
Swaminath J and Ramakrishnan M, A Geological Survey of India, Govt. of India, Vol-
112, Pp: 163-198.
GSI., (2006). Geology and Mineral Resources of the States of India, Geological Survey
of India, Misc Publ.30, Part-VII, Bengaluru, Pp: 1-65.
Guha, A.; Kumar, K.V. (2016). New ASTER derived thermal indices to delineate
mineralogy of different granitoids of an Archaean Craton and analysis of their potentials
with reference to Ninomiya‘s indices for delineating quartz and mafic minerals of
granitoids—An analysis in Dharwar Craton. Ore Geol. Rev, 74, Pp 76–87.

207
Gupta S, Rai S.S, Prakasam K.S, Srinagesh D, Chadha R.K, Priestley K and Gaur V.K
(2003). First evidence for anomalous thick crust beneath mid-Archaean Western Dharwar
Craton, Current Science, Vol.84, Pp: 1219-1226.
Harlow, G.E. and Bender, W., (2013): A study of ruby (corundum) compositions from
the Mogok Belt. American Mineralogy, V.98, p.1120–1132.
Harris D.C and Bertolucci M.D, (1989). Symmetry and Spectroscopy, an introduction to
vibrational and electronic spectroscopy, Dover publications, Inc. New York, Pp: 206.
Harris, J., Wilkimson L. and Heather K. (2001). Application of GIS processing
techniques for producing mineral productivity maps, A case study: mesothermal Au in
Swayze greenstone belt, Ontario, Canada. Natural Resources, 10, Pp 91- 124.
Holland, T.H., (1900). The charnockite series, a group of Archaean hypersthene rocks in
Peninsular India. Mem. Geol. Surv. India, 28 (2): Pp. 117 – 249.
Hoover, D. B., Heran, W. D. and Hill, P. L. (1993). The Geophysical Expression of
Selected Mineral Deposit Models, United States, Department of the Interior Geological
Survey, Pp. 58-60.
Horler D.N.H, Dockray M and Barber J, (1983). The red edge of plant leaf reflectance,
International Journal of Remote Sensing, Vol.4, Pp: 273-288.
Hughes R.W., Corundum: ruby and sapphire, White Lotus, 1991.
Hughes, R. W. 1990. Corundum, Courier International Ltd., England, 314 p.
Hughes, R.W., (1997): Ruby and sapphire. Boulder, U.S.A, V.75, p.420.
Hughes, R.W., (1997): Ruby and sapphire. Boulder, U.S.A, V.75, p.420.
Hunt and Ashley (1979) Spectra of Altered Rocks in the Visible and Near infrared.
Journal of Economic Geology, Volume 74 number 7, Pp1613-1629.
Hunt G.R (1977). Spectral signatures of particular minerals in the visible and near
infrared, Geophysics, Vol.42, Pp: 501-513.

208
Hunt G.R (1980). Electromagnetic radiation: The communication link in remote sensing.
In: B.S. Siegal and A.R. Gillespie, (Editors), Remote Sensing geology, John Wiley and
Sons, New York, Pp: 5-46.
Hunt G.R and Ashley R.P (1979). Spectra of altered rocks in the visible and near
infrared, Economic Geology, Vol.74, Pp: 1613-1629.
Hunt G.R and Salisbury J.W, (1970). Visible and near-infrared spectra of minerals and
rocks, Modern Geology, Vol.1, Pp: 283-300.
Hunt G.R and Vincent R.K (1968). The behavior of spectral features in the infrared
emission from particulate surfaces of various grain sizes, Journal of Geophysical
Research Vol.73, No.18, Pp: 6039-6046.
Hunt G.R, JW. Salisbury, C.J, Lenhoff (1971). Visible and Near Infrared Spectra of
minerals and Rocks III oxides and Hydroxides,mod, Geo, 2 pp 195-205.
Hunt G.R, Salisbury J.W and Lehnoff C.J (1971). Visible and Near Infrared Spectra of
Minerals and Rocks: III. Oxides and Oxy-hydroxides, Modern Geology No.2, Pp: 195-
205.
Hunt, G.R., J.W. Salisbury, and C.J. Lenhoff, 1971, Visible and near-infraredd spectra of
minerals and rocks: III. Oxides and hydroxides. Modern Geology, v. 2, p. 195-205.
Hunt, G.R., J.W. Salisbury, and C.J. Lenhoff, 1973, Visible and near-infrared spectra of
minerals and rocks: VI. Additional silicates. Modern Geology, v. 4, p. 85-106.
Hunt, G.R., J.W. Salisbury, and C.J. Lenhoff, 1973, Visible and near-infrared spectra of
minerals and rocks: VI. Additional silicates. Modern Geology, v. 4, p. 85-106.
Hunt, G.R., Salisbury, J.W. and Lehnoff, C.J. (1971) Visible and near infrared spectra of
minerals and rocks: 111 Oxides and Oxyhydroxides. Modern Geology 2: Pp. 195-205.
Ian Graham, Lin Sutherland, Khin Zaw, Victor Nechaev and Alexander Khanchuk
(2008). Advances in our understanding of the gem corundum deposits of the West Pacific
ISRO prepares for historic 100th mission. Times of India. Retrieved 2014-09-21.

209
Isro's PSLV-C23 lifts off with five foreign satellites. Times of India. Retrieved 2014-09-
21.
Jayananda M, Janardhan A.S, Sivasubramanian P and Peucat J.J (1995).
Geochronological and isotopic constrains on granulite formation in the Kodikanal area,
South India, In: Sontosh M and Yoshida M. (Eds). India and Antartica during the
Precambrian Mem. Geol. Soc. India, Vol.34, Pp: 373-390.
Jayaram B.N., (1965). Systematic geological mapping of South western parts of the
Chitaldurg Schist Belt, Mysore State. Geol.Surv.India, Unpublished Report.
Jayaram, B.(1917) Report on the Corundum Bearing rocks of the Arsikere Taluk with
note on other localities., Rec. Mysore Geol. Dept., Vol.15, No.2, Pp: 63-91.
Jayaram, B., (1920). Report on the limestones and associated rocks of the Voblapura area
with notes on traverse and revision work done during the field season 1916 -17.Rec.
Mysore Geol. Dept., 18: Pp. 33-92.
Jayashree Panjikar, Chandrashekar, H., Muniswamaiah, M. and Nazeer Ahmed (1984).
Study of gem variety of Corundum from Parts of Tumkur and Mysore districts. Jour.
Geol. Soc. India., v.43, pp. 311-313.
Jeevan L and Basavarajappa H.T (2018) Application Of Hyperspectral Remote Sensing
And Gis Techniques For Mapping Of Hydrothermal Alteration Zones Of Precambrian
Rocks In Parts Of Chitradurga Schsit Belt, Dharwar Craton, India (un published thesis).
Joseph Hyde Pratt (1906). Corundum and its occurrence and distribution in the united
states, a revised and enlarged edition of bulletin no 180 and 269, series A, Economic
Geology 61, Washington p 9-168.
Kane R.E. et al, Ruby and Fancy sapphire from Gem & Gemology, 27 / 136,1991.
Karanth R.V., Gems and Gem Industry in India, Geological society of India Banglore,
Kepezhinskas, P., (2011): Indicator minerals in diamond exploration: A case study from
eastern Finnmark, Finland. Vuorimiesyhdistys, V.92, p.72.

210
Khin Zaw, Sutherland, F.L., Dellapasqua, F., Ryan, G.C., Tzen-Fu, Y., Mernagh, P.T.
and Duncan, D., (2006): Constrats in gem corundum characteristics, eastern Australian
basaltic fields: trace elements, fluid/melt inclusions and oxygen isotopes. Mineralogical
Magazine, V.70, p.669-687.
Khin Zaw, Sutherland, L., Fu Yui, T., Meffre, S. and Thu, K., (2014): Vanadium-rich
ruby and sapphire within Mogok Gemfield, Myanmar: implications for gem color and
genesis. Mineral Deposita, V.50, p.200.
Kissin, A., (1994): Ruby and sapphire from the southern Ural Mountains, Russia. Gems
and Gemology, V.30, p. 243–252.
Koltsov, A.B., (2001): Ruby-bearing metasomatites in marbles: conditions and numerical
model of the formation. Exploration Geoscience, V. 10, p. 94–95.
Kragh, Helge (2008). "From geochemistry to cosmochemistry: The origin of a scientific
discipline, 1915–1955". In Reinhardt, Carsten. Chemical Sciences in the 20th Century:
Bridging Boundaries. John Wiley & Sons. pp. 160–192. ISBN 3-527-30271-9.
Kruse F. A., Boardman J. W. and Huntington J. F. (2003) ―Comparison of airborne
hyperspectral data and EO-1 Hyperion for mineral mapping‖. IEEE Transactions on
Geoscience and Remote Sensing, (Special Issue), Vol. 41, No. 6, pp. 1388-1400.
Kruse, F. A., 1988, Use of Airborne Imaging Spectrometer data to map minerals
associated with hydrothermally altered rocks in the northern Grapevine Mountains,
Nevada and California: Remote Sensing of Environment, v. 24, no.1, Pp. 31-51.
Lasnier, B., (1977): Persistance d'une série granulitique au coeur du Massif Central
Français (Haut Allier). Ph.D. thesis, University of Nantes, France, V.26, p. 345.
Lawson, A., (1903): Plumasite, an oligoclase–corundum rock near Spanish Peak,
California. University of California Publications on Geological Sciences collection, V. 3,
p. 219–229.
LDCM Spacecraft. NASA. Retrieved 12 February 2013.

211
Levinson, A.A., Cook, F.A., 1994. Gem corundum in alkali basalts: origin and
occurrence. Gems and Gemology 30, 253–262.
Liew, S. C., Change, C. W., and Lim, K.H. 2002. Hyperspectral Land Cover
Classification of EO-1 Hyperion Data by Principal Component Analysis And Pixel
Unmixing. Centre for Remote Sensing, Imaging and Processing, National University of
Sinagpore, pp. 3111-3113.
Lillesand, T.M. and Kiefer. R. W., Remote Sensing and Image Interpretation, Fourth
Edition, John Wiley and Sons, 2002, ISBN 9971-51-427-3.
M. Deb (2014). Precambrian Geodynamics and Metallogeny of the Indian shield ore
Geology Reviews ELSEVIER, Vol 57, March 2014, p, 1-28.
M. Rajamanickam, S. Balakrishnan and R. Bhutani (2014). Rb-Sr and Sm-Nd istope
systematics and Geochemical studies on metavolcanic rocks from peddavora greenstone
belt evidence for presence of mesoarchean continental crust in easternmost patts of
Dharwar craton, India. Journal of Earth System Science Springer, Vol 123 issue 5, Pp
989 – 1011.
M. Ramakrishnan and R. Vaidyanadhan (2010) Geology of India. Geological society of
India Bangalore Vol-I, p 1-519.
Mackenzic W.S and Guilford .C, Atlas of rock – forming minerals in thin section Pp: 84
Magendran and S. Sanjeevi (2011) "Assessing the Grades of Iron Ores of Noamundi,
India by Ground Based Hyperspectral Remote Sensing", International Journal of Earth
Science and Engineering (IJEE), Vol. 04, No. 08, pp. 7 – 16.
Manjunatha BR, Harry NA (1994). Geology of western coastal Karnataka. Geo
Karnataka, Mysore Geological Department, Centenary volume, 109-116.
Manjunatha BR, Harry NA (1994). Geology of western coastal Karnataka. Geo
Karnataka, Mysore Geological Department, Centenary volume, 109-116.
Manjunatha M.C and Basavarajappa H.T (2017) Applications Of Hyperspectral Remote
Sensing And Gis On Ne-Sw Transects Of Chitradurga District, Karnataka, India (un
published thesis).

212
Maruthi N.E and Basavarajappa H.T (2018). Hyperspectral and Petro - Chemical
Signatures study on Corundum Bearing Amphibolite Schist of Magadi Area, Ramanagara
District, Karnataka, India. RESEARCH REVIEW International Journal of
Multidisciplinary Volume 9, Issue 3, pp. 773-779.
Maruthi N.E and Basavarajappa H.T (2018). Hyperspectral And Petro - Chemical
Signatures Study On Corundum Bearing Litho-Units Of Precambrian Basement Rocks
Around Closepect Granite Madhugiri Area, Karnataka, India. Journal of Emerging
Technologies and Innovative Research (JETIR) Volume 5, Issue 12, pp. 619 - 628.
Maruthi N.E and Basavarajappa H.T (2018). Hyperspectral Signatures and Petro -
Chemical Charectistics Study on Corundum Bearing Litho-Units of Sargur Area, Mysuru
District, Karnataka, India. International Journal of Research and analytical Reviews
(IJRAR) Volume 5, Issue 4, pp. 65-74.
Maruthi N.E, Basavarajappa H.T, Jeevan .L and Siddaraju M.S (2018). Hyperspectral
Signatures On Corundum Bearing Litho-Units Of Precambrian Basement Rocks Around
Closepet Granite Pavagada Area, Karnataka. International Journal of Computer
Engineering and Technology (IJCET) Volume 9, Issue 3, pp. 86-94.
Maruthi N.E, Basavarajappa H.T, Manjunatha M.C, and Harshavardhana A.S. (2019).
Hyperspectral Study And Integration Of Petro-Chemical Signatures On Corundum
Bearing Litho-Units Around Maddur, Mandya District, Karnataka, India. International
Journal of Research and Analytical Reviews (IJRAR), Volume.6, Issue 1, Page No
pp.897-903, January -March 2019.
Maslen, E.N., V.A. Streltsov, N.R. Streltsova, N. Ishizawa, and Y. Satow (1993)
Synchrotron X-ray study of the electron density in α −Al2O3. Acta Cryst., 49, 973–980.
Mather, P. M. (2004). Computer Processing of Remotely-Sensed Images: An
Introduction, 3rd edition, John Wiley and Sons, Ltd, Chichester, Pp 324.
McSween H.Y, I.O. McGlynn and A.D. Rogers (2010). Determining the Modal
mineralogy of martian soils, Journal of Geophysical Research, Vol, 115 E00f 12, p, 1-10.

213
Mehnert K.R., (1969). Petrology of the Precambrian basement complex, In: P.J.Hart
(Editor), "The earth's crust and upper mantle', Geophy.Monograph.13, Am.
Geophy.Union, Washinton., Pp: 513-518.
Mehnert K.R., (1973). Migmatites and the origin of granitic rocks. Elsevier, Amsterdem,
Third Edition.
Moghtaderi, A., Moore, F. and Mohammadzadeh, A. (2007). The application of advanced
space-borne thermal emission and reflection (ASTER) radiometer data in the detection of
alteration in the Chadormalu paleo-crater, Bafq region, entral Iran. Journal of Asian Earth
Sciences,
MOYD, L. (1949): Petrology of the nepheline and corundum rocks of southeastern
Ontario. Amer. Mineral. 34, 736––751.
MURDOCH, J. & WEBB R.W. (1942): Minerals of California, California State. Div.
Mines Bull. 136, San Francisco, California, U.S.A.
Mustard, J. F. and Sunshine, J. M. Spectral Analysis for Earth Science (1999)
Investigations Using Remote Sensing Data. In: Rencz, A. N. (Ed.), Remote Sensing for
the Earth Sciences: Manual of Remote Sensing. 3thed, Vol. 3, John Wiley & Sons, New
York, Pp. 251-306.
Naqvi SM, Rogers JJW (1983). Introduction In: Naqvi S M and Rogers JJW (eds).
Precambrian of South India. Geological Society Memorandum, 4, 6-16.
Naqvi SM, Rogers JJW (1983). Introduction In: Naqvi S M and Rogers JJW (eds).
Precambrian of South India. Geological Society Memorandum, 4, 6-16.
Narayan Sangam and Pavanaguru. Geology of Corundum Occurrances in Parts of
Khammam Schist Belt, International Journal of Scientific and Research Publications,
Volume 3, Issue 2, February 2013.
Neteler M and Mitasova H, (2007). Open source GIS: A GRASS GIS approach, 3rd
Edition. The International Series in Engineering and Computer Science, Springer, New
York Inc, Vol.773, Pp: 406.

214
Newbold, S. T. 1846. Summary of the geology of southern India. Journal. Royal Asiatic.
Soc., New Series, 8. Mysore Journal. Geol. Soc. India, 18: Pp. 102- 110.
Nguyen Viet .Y. et al, On the forming origin of sapphire and ruby in Vietnam, Journal
Nutman A.P, Chadwick B, Ramakrishnan M and Vishwanatha M.N, (1992). SHRIMP-
U/Pb ages of detrital zircon in Sargur supracrustal rocks in western Karnataka, Southern
India, J. Geol. Soc. India, Vol.39, Pp: 364-374.
of Geology, B/23,2004.
of hydrothermal alteration zones on the island of Lesvos, Greece, using an integrated
remote sensing data set‘. International Journal of Remote Sensing, 23, Pp. 341-356.
Okrusch, M., T.E. Bunch, and H. Bank (1976) Paragenesis and petrogenesis of a
corundum-bearing marble at Hunza (Kashmir). Mineralium Deposita, 11, 278–297.
P.F. Carey (2004). Field Geology, Encyclopedia of Life support systems, Geoinformatics,
Vol-I.
P.Parikh, D.M.Bhardwaj, R.P.Gupta†, N.L. Saini, S. Fernandes‡, R.K.Singhal, D.C. Jain
and K.B. Garg. Comparative Study Of The Electronic Structure Of Natural And
Synthetic Rubies Using Xafs And Edax Analyses, december 2002-Indian Academy of
Sciences pp. 653–656.
Palache, C., H. Berman, and C. Frondel (1944) Dana‘s system of mineralogy (7th
edition), v. I, 520–527.
Paul I.A, Michael G.F, David M.J and David R.W (2005). Geographic Information
Systems and Science, 2nd edition, John Willey and Sons, Pp: 536.
Peretti, A. and Hahn, L., (2013): Record-breaking discovery of ruby and sapphire at the
Didy mine in Madagascar: investigating the source. In Color, V.21, p.22–35.
Peretti, A., Mullis J. and Kundig R., (1990): Die Kashmir Saphire and ihr geologisches
Errinnerungsmogen. Neuer Zurchur Zeitung, V.187, p.59.

215
Peter Bajcsy and Peter Groves (2004) Methodology For Hyperspectral Band Selection,
Published in Photogrammetric Engineering and Remote Sensing journal, Vol. 70,
Number 7, July 2004, Pp. 793-802.
Peter G., Read.,Gemological instruments (2nd edition).Butterworth Scientific London,
Peucat, J. J., Ruffaut, P., Fritsch, E., Bouhnik-Le, E., Simonet, C. and Lasnier, B., (2007):
Ga/Mg ratio as new geochemical tool to differentiate magmatic from metamorphic blue
sapphire. Lithos, V.98, p.261-271.
Phillips, W.R. and D.T. Griffen (1981) Optical mineralogy, 24–26.
Pichamuthu, C.S., 1946a. Cycles in Dharwar sedimentation. Curr. Sci., 15: Pp 273 - 274.
Pichamuthu, C.S., 1947. Some aspects of Dharwar geology with special reference to
Mysore State. Presidential address, 34th Indian Sci. Cong., Delhi .pp.1-16 (Also Rec.
Mysore Geol. Dept. 46(2): Pp 1- 34.
Pichamuthu. C.S., 1951. Some observations on the structure and classification of
Dharwar of Mysore State. Curro Sci., 20: Pp 117-119.
Pignatti, S., Cavalli, R.M., Cuomo, V., Fusilli, L., Pascucci, S., Poscolieri, M., and
Santini, F. 2009. Evaluating Hyperion Capability for Land Cover Mapping in a
Fragmented Ecosystem: Pollino National Park, Italy. Remote Sensing of Environment.
Vol. 113, pp. 622-634.
PIN, CH., MONCHOUX, P., PAQUETTE, J.-L., AZAMBRE, B., WANG, R.C. &
MARTIN, B. (2006): Igneous albitite dikes in orogenic lherzolites, western Pyrénées,
France: a possible source for corundum and alkali feldspar xenocrysts in basaltic terranes.
II. Geochemical and petrogenetic considerations. Can. Mineral. 44, 837––850.
PinakiSengupata, Pradip C Saikia and Prakash C Borthakur (2008). SEM-EDX
characterization of an Iron-rich Kaolinite clay. Journal of scientific and Industrial
Research Vol 67. Pp 812-818.

216
Prakash, P. Chandra Singh And T. Hokada. A New Occurrence of Sapphirine-Spinel-
Corundum-bearing Granulite from NE of Jagtiyal, Eastern Dharwar Craton, Andhra
Pradesh. Journal Geological Society Of India Vol.82, July 2013, pp.5-8.
Qaid Ali, M., Basavarajappa, H. T. and Rajendran, S. (2009) ―Integration of VNIR and
SWIR spectral reflectance for mapping mineral resources; A case study, north east of
Hajjah, Yemen‖, Journal of the Indian Society of Remote Sensing Vol. 37, No. 2, pp.
305-315.
Qasim Jan M. (1988) Geochemistry of amphibolites from the southern part of the
Kohistan arc, N. Pakistan, Mineralogical Society, J. Mineralogical Magazine, Vol. 52,
Pp: 147-159.
Radhakrishna B.P (1967). Reconsideration of some problems in the Archaean complex of
Mysore, J.Geol.Soc.India., Vol.18, Pp: 102-110.
Radhakrishna B.P (1974). Peninsular gneissic complex of the Dharwar Craton: a
suggested model for its evolution. J.Geol.Soc.India Vol.15, Pp: 339-454.
Radhakrishna B.P and Naqvi S.M, (1986). Precambrian continental crust of India and its
evolution.
Radhakrishna B.P. (2003) Mineral Resources of Karnataka, Published by the Geological
Society of India, Bengaluru.
Radhakrishna B.P. (2013) Mineral Resources of Karnataka, Published by the Geological
Society of India, Bengaluru,Pp: 1 - 214.
Radhakrishna BP (1983). Archean granite-greenstone terrain of the South Indian Shield.
In: Naqvi S W and Rogers J J W (eds.), Precambrian of South India. Geological Society
of India Memorandum, 4, 1-46.
Radhakrishna BP, Naqvi SM (1986). Precambrian continental crust of India and its
evolution. Journal of Geology, 94, 145-166.
Radhakrishna, B.P., Sreenivasaiah, G., (1974). Bedded baryte from the Precambrian of
Karnataka. J. Geol. Soc.India, Vo.15, Pp: 314–315.

217
Radhakrishnan B.P and Vaidyanadhan R., (1997). Geology of Karnataka, Geological
Society of India (GSI) Publication, Second Edition, Bangalore.
Radhakrishnan, B.P. (1953) Abrasives in Mysore., Rec. Mysore Geol. Dept., Vol.69,
No.2, Pp: 31-43.
Raja.S , Rajendran.S , PoovalingaGanesh.B and Thirunavukkarasu.A. 2010 Study On
Hyperspectral Signatures For Magnetite Iron Ore In Thattayengerpet Region Of
Trichirappalli District In Tamil Nadu State, India. International Journal of Geomatics and
Geosciences volume 1, no 2, 2010.
Rajendran, S., Thirunavukkarasu, A., Balamurugan, G. and Shankar, K. (2011).
Discrimination of Iron Ore Deposits of Granulite Terrain of Southern Peninsular India
using ASTER Data. Journal of Asian Earth Sciences, Vol.41, Pp: 99-106.
Rajesh, H. M. (2004). Application of Remote Sensing and GIS in Mineral Resource
Mapping-An Overview. Journal of Mineralogical and Petrological Sciences, 99, Pp. 83-
103.
Ram Rao, B. (1968). Mineral Resources of Hassan, Mandya and Mysore districts, Dept
Mines and Geology, Bull No.28.
Rama Rao B, (1945). The charnockitic rocks of Mysore, Mysore Geol. Dept Bull, Vol.18,
Pp: 163.
Rama Rao B, (1962). A hand book of the geology of Mysore State, Southern India,
Bangalore printing and publishing Co., Bangalore, Pp: 264.
Rama Rao, B., 1940. Archaean Complex of Mysore. Mysore Geol. Dept. Bull, 17: pp. 95.
Ramakrishnan D and Rishikesh Bharti., (2015). Hyperspectral Remote Sensing and
geological applications., Special Section: Hyperspectral Remote Sensing, Current
Science, Vol.108, No.5, Pp: 879-891.
Ramakrishnan D and Rishikesh Bharti., (2015). Hyperspectral Remote Sensing and
Geological applications, Current Science, Vol.108, No.5, Pp: 879-891.

218
Ramakrishnan M and Vaidyanadhan R., (2008). Geology of India, Vol.1 & 2, Geological
Society of India, Bangalore.
Ramakrishnan M and Vaidyanadhan R., (2010). Geology of India, Vol.1 & 2, Geological
Society of India, Bangalore.
Ramakrishnan M, Mahabaleswar B and Viswanathan S (2012). The abundances of some
Trace-elements in the First-ever Reported Sample of Spinifex-Textured Komatiite from
Ghattihosahalli, Karnataka, Jour. Geol.Soc.Ind., Vol.79, Pp: 361-366.
Ramakrishnan M. and R. Vaidyanadhan. (2008). Geology of India, Volume-1, Pp: 108-
120.
Ramakrishnan M. and R. Vaidyanadhan. (2008). Geology of India, Volume-1, Pp: 108-
120.
Ramakrishnan, m, Vishwanatha, M.N and Swami Nath, J., 1976, Basement Cover
relationships of peninsular Gneiss with grade Schists and Greenstone belts of southern
Karnataka. Journal Geoloical Society of India. Vol 7 Pp 97-111.
Ravi P. Gupta. 2018. Spectra of Minerals and Rocks. Remote Sensing Geology, Pp 23-
35.
Ravindra kumar G.R (1982). Petrological and Structural studies of the Precambrian
terrain around Gundlupet, Mysore dist., Karnataka, Unpub. PhD thesis, Univ. of Mysore,
Mysuru.
Ravindra kumar G.R (1982). Petrological and Structural studies of the Precambrian
terrain around Gundlupet, Mysore dist., Karnataka, Unpub. PhD thesis, Univ. of Mysore,
Mysuru.
Rechards, John.R, and Jia, X., 1999:Remote Sensing Digital Image Analysis, Springer.
Reimer, L. (1998) Scanning electron microscopy : physics of image formation and
microanalysis. Springer, 527 p.

219
Robertson, A.D.C. and Sutherland, F.L., (1992): Possible origins and ages for sapphire
and diamond from the central Queensland gemfields. Records of the Australian Museum
Supplement. V.15, p. 45–54.
Rowan, L. C, Simpson, C. J. and Mars, J. C. (2004). Hyperspectral Analysis of the
ultramafic complex and adjacent lithologies at Mordor, NT, Australia, Remote Sensing of
Environment, 91, Pp. 419- 431.
Rowan, L. C., Mars, J. C. and Simpson, C. J. (2005). Lithologic mapping of the Mordor,
NT, Australia ultramafic complex using the Advanced Spaceborne Thermal Emission and
Reflection Radiometer (ASTER). Remote Sensing of Environment, 99, Pp. 105-126.
Rowan, L. C., Schmidt, R. G. and Mars, J. C. (2006). Distribution of Hydrothermally
Altered rocks in the Reko Diq, Pakistan. Remote Sensing of Environment, 104, Pp. 74-
87.
Sampath Iyengar, P. (1922) Report on the economic mineral deposits in parts of the
Hassan district. Rec. Mysore Geol. Dept., Vol.18, No.2, Pp: 103-105.
Santos, L D and Brandno, P R G, 2005. LM, SEM and EDS study of microstructure of
Brazilian iron ores, Microscopy and Analysis, 19(1):17-19.
Schowengerdt, Robert.A, 1997: Remote Sensing Modals and Methods for Image
Processing, Academic Press.
Seshadri T.S and Mallikarjuna C (1968). Detailed mapping to the south of Kallehadlu,
Chitradurga district, Mysore State. Geol. Surv. India, Unpublished Report.
Severin, Kenneth P., 2004, Energy Dispersive Spectrometry of Common Rock Forming
Minerals. Kluwer Academic Publishers, 225 p.--Highly recommended reference book of
representative EDS spectra of the rock-forming minerals, as well as practical tips for
spectral acquisition and interpretation.
Shanks W.C.P. III (2010), Hydrothermal Alteration, Volcanogenic Massive Sulfide
Occurrenes Model, Scientific Investigation Report.

220
Shih, T.-Y., 2004. On The Atmospheric Correction for a Hyperion Scene Taiwan.
www.aars.org/acrs/proceedings/ACRS2004/Papers/HDP04.2.htm.
Shippert, P., 2008. Introduction to Hyperspectral Image Analysis.
http://satjournal.tcom.ohiou.edu/pdf/shippert.pdf.
Simonet, C., Fritsch, E. and Lasnier, B., (2008): A classification of gem corundum
deposits aimed towards gem exploration. Ore Geology Reviews, V.34, p.127-133.
Singer R.B. (1981) Near – Infrared spectral reflectance of mineral mixtures systematic
combination of pyroxenes olivine and iron oxides, journal of Geophysics V. 86. Pp 7967-
7982.
Smeeth W.F, (1916). Outline of the geological history of Mysore, Mysore Geol. Dept.
Bull. Vol.6, Pp: 22.
Smeeth, W.F. and Sampath Iyengar (1916). Mineral Resources of Mysore.,Mysore Geol.
Dept., Bull No.7, Pp:123-130.
Srikantappa C and Hensen B.J, (1992). Metamorphic conditions and Precambrian of
fluids in the M.M Hills granulites, Karnataka, India, N. Jb. Miner. Mh, Vol.11, Pp: 495-
506.
Srinivasan K (1991). Geology of Peddavuru and Jounnagiri schist belts A. P, Rec,
Geological survey of India 124 (pt5) 261 – 263.
Subrahmanya KR, Murthy TRS, Jayappa KS, Suresh GC (1991). Some aspects of
Quaternary events around Mangalore, Karnataka. Proceedings of seminar on Quaternary
land scape of Indian subcontinent, Baroda University, Baroda 186-194.
SUNAGAWA, I., BERNHARDT, H.-J. & SCHMETZER K. (1999): Texture formation
and element partitioning in trapiche ruby. J. Cryst. Growth 206, 322.–330.
Sutherland, F.L., 1996. Alkaline rocks and gemstones, Australia: a review and synthesis.
Australian Journal of Earth Sciences 43, 323–343.
Sutherland, F.L., Graham, I.T., Pogson, R.E., Schwarz, D., Webb, G.B., Coenraads, R.R.,
Fanning, C.M., Hollis, J.D., Allen, T.C., 2002a. The Tumbarumba Basaltic Gem Field,

221
New South Wales: in relation to sapphire–ruby deposits of Eastern Australia. Records of
the Australian Museum 54, 215–248.
Sutherland, F.L., Graham, I.T., Webb, G.B., 2004. Sapphire–ruby–zircon deposits from
basaltic fields,West Pacific continental margins. In: Khanchuk, A.I., Gonevchuk, G.A.,
Mitrokhin, A.N., Simanenko, L.F., Cook, N.J., Seltmann, R. (Eds.), Metallogeny of the
Pacific Northwest: Tectonics, magmatism and metallogeny of active continental margins.
Dal'nauka, Vladivostok, Russia, pp. 385–387.
Sutherland, L.F., Schwarz, D., Jobbins, E.A. and Coenraads, R.R., (1998a): Distinctive
gem corundum suites from discrete basalt fields: a comparative study of Barrington,
Australia, and West Pailin, Cambodia, gem fields. Journal of Gemmology, V. 26, p.65–
85.
Swaminath J, Ramakrishnan M (1981). Present classification and correlations. In:
Swaminath J and Ramakrishnan M (eds.), Early Precambrian supracrustals of southern
Karnataka. Geological Survey of India Memorandum, 112, 23-38.
Swaminathan J and Ramakrishnan M, (1981). Early Precambrian supracrustals of
Southern Karnataka, Mem. Geol.Surv. India, Vol.112, Pp: 350.
Sween M. C, Jr, Harry Y, Huss, and Gary R. (2010). Cosmochemistry. Cambridge
University Press. ISBN 9781139489461.
Tangestani, M.H. and M.Hosseinjani, ―Discrimination of Alteration zones by using
Spectral Angle Mapping and Linear Spectral Unmixing of the ASTER data at Sarduiyeh
area‖, SE Kerman, Iran, 26th Symposium on Geosciences, 17-19 Feb., Tehran, Iran,
2008.
Terekhov, E.N., Kruglov, V.A. and Levitskiy, V.I., (1999): Rare-earth elements in
corundum bearing metasomatites and related rocks of the Eastern Pamirs. Geokhimiya,
V. 3, p.238–250.
Themelis T., The heat treatment of ruby and sapphire, Gemlab Inc., USA, 1992

222
Tomoaki Morishita and Shoji Arai (2001). Petrogenesis of corundum bearing mafic rock
in the Horoman peridotite complex Japan, Journal of petrology Vol, 42 issue7, pp 1279-
1299.
TOMOAKI MORISHITA, SHOJI ARAI and DAVID H. GREEN. Possible Non-melted
Remnants of Subducted Lithosphere: Experimental and Geochemical Evidence from
Corundum-Bearing Mafic Rocks in the HoromanPeridotite Complex, Japan ,2004,
Journal of Petrology, pp.235-252.
Tong,Q.,Tian,Q.,Pu,O., and zhao,C.,2001,Spectrscopic determination of wheat Water
status using 1650-1850 nm spectral absorption features, Int.J.Rs, Vol 22,No.12, 2329-
2338.
United Launch Alliance Successfully Launches Second NASA Payload in Just 12 Days.
United Launch Alliance. 11 February 2013. Retrieved 12 February 2013.
Upton, B., Hinton, R.W., Aspen, P., Finch, A. and Valley, J.W., (1999): Megacrysts and
associated xenoliths, evidence for migration of geochemically enriched melts in the upper
mantle beneath Scotland. Journal of Petrology, V. 40, p. 935–956.
Vane, G, Green, RO, Chrien, G, Enmark, HT, Hansen, EG & Porter, WM, (1993) ‗The
Airborne Visible/Infrared Imaging Spectrometer‘ Remote Sensing of Environment, vol.
44, Pp. 127-14.
Varshney, P.k. and Arora, M.K., 2004. Advanced Image Processing Techniques for
Remotely Sensed Hyperspectral data. Springer-Verlag Berlin Heidelberg New York.
Viswanatha, M.N. (1972). Corundum pegmatites and Corundum – Sillimanite pegmatites
from Kalyadi area, Hassan district, Indian Minerals, Vol.26, No.3, Pp: 20-23.
White, J.S. (1979) Boehmite exsolution in corundum. Amer. Mineral., 64, 1300–1302.
Wilbur, J.S, F.E. Mutschler, J.D. Friedman, and R.E. Zartman, 1990, New chemical,
isotopic, and fluid inclusion data from zinc-lead-copper veins, Shawangunk Mountains,
New York. Economic Geology, v.85 no.1, pp. 182-196.
Yui, T.-F., Wu, C.-M., Limtrakun, P., Sricharn, W., Boonsoong, A., 2006. Oxygen
isotope studies on placer sapphire and ruby in the Chanthaburi–Trat alkali basaltic
gemfield, Thailand. Lithos 86, 197–211.
Zen. Metamorphic mineral assemblages of slightly calcic Pelitic rocks in and around the
Taconic Allochthon, southwestern Massachusetts and adjacent Connecticut and New
York, E-an, 1981, USGS Publications Warehouse, G.P.O.128 p.

223
RESEARCH PUBLICATIONS
1. Basavarajappa H.T and Maruthi N.E (2018). Hyperspectral And Petro - Chemical
Signatures Study On Shear Zone Controlled Corundum Bearing Pelitic Rocks Of
Budipadaga Area, Chamarajanagara District, Karnataka, India. International
Journal of Research and analytical Reviews (IJRAR) Volume 5, Issue 3, pp. 906-
913.
2. Basavarajappa H.T and Maruthi N.E (2018). Hyperspectral and Petro - Chemical
Signatures study on Corundum Bearing Litho-Units around Sringeri Area,
Chikmagalur District, Karnataka, India. RESEARCH REVIEW International
Journal of Multidisciplinary Volume 3, Issue10, pp. 899-904.
3. Basavarajappa H.T and Maruthi N.E (2018). Petro – Chemical And Spectral
Signatures On Corundum Bearing Precambrian Amphibolites In Sullia Area,
Dakshina Kannada District, Karnataka, India. Journal of Emerging Technologies
and Innovative Research (JETIR) Volume 5, Issue 7, pp. 75-83.
4. Basavarajappa H.T and Maruthi N.E (2018). Petrochemical characteristics and
Hyperspectral signatures on Corundum bearing Precambrian litho-units of Varuna
area, Mysuru district, Karnataka, India. International Journal of Creative Research
Thoughts, Volume6, Issue1, Pp.998-109.
5. Basavarajappa H.T, and Maruthi N.E (2018). Hyperspectral Signature Study
Finds Corundum Alters To Diaspore Influeance Of Climate Change Of Dharwar
Craton Arsikere Band Of Haranahalli, Hassan District, Karnataka, India. Journal
of Environmental Science, Computer Science and Engineering and Technology
(JECET) Volume 7, Issue 2, Pp.238-246.
6. Basavarajappa H.T, Maruthi N.E and Manjunatha M.C (2017). Hyperspectral
Signatures and Field Petrography of Corundum bearing litho-units in Arsikere
band of Haranahalli, Hassan District, Karnataka, India. International Journal of
Creative Research Thoughts, Volume5, Issue4, Pp.3791-3798.
7. Basavarajappa H.T, Maruthi N.E, Jeevan L and Manjunatha M.C (2018). Physico-
chemical charectristics and hyperspectral signature study using geomatics on gem
verity of corundum bearing precambrian litho-units of Mavinahalli area, Mysuru

224
district, Karnataka, India. International Journal of Computer Engineering and
Technology(IJCET) Volume 9, Issue 1, pp. 102-112.
8. Maruthi N.E and Basavarajappa H.T (2018). Hyperspectral and Petro - Chemical
Signatures study on Corundum Bearing Amphibolite Schist of Magadi Area,
Ramanagara District, Karnataka, India. RESEARCH REVIEW International
Journal of Multidisciplinary Volume 9, Issue 3, pp. 773-779.
9. Maruthi N.E and Basavarajappa H.T (2018). Hyperspectral And Petro - Chemical
Signatures Study On Corundum Bearing Litho-Units Of Precambrian Basement
Rocks Around Closepect Granite Madhugiri Area, Karnataka, India. Journal of
Emerging Technologies and Innovative Research (JETIR) Volume 5, Issue 12,
pp. 619 - 628.
10. Maruthi N.E and Basavarajappa H.T (2018). Hyperspectral Signatures and Petro -
Chemical Charectistics Study on Corundum Bearing Litho-Units of Sargur Area,
Mysuru District, Karnataka, India. International Journal of Research and
analytical Reviews (IJRAR) Volume 5, Issue 4, pp. 65-74.
11. Maruthi N.E, Basavarajappa H.T, Jeevan .L and Siddaraju M.S (2018).
Hyperspectral Signatures On Corundum Bearing Litho-Units Of Precambrian
Basement Rocks Around Closepet Granite Pavagada Area, Karnataka.
International Journal of Computer Engineering and Technology (IJCET) Volume
9, Issue 3, pp. 86-94.
12. Maruthi N.E, Basavarajappa H.T, Manjunatha M.C, and Harshavardhana A.S.
(2019). Hyperspectral Study And Integration Of Petro-Chemical Signatures On
Corundum Bearing Litho-Units Around Maddur, Mandya District, Karnataka,
India. International Journal of Research and Analytical Reviews (IJRAR),
Volume.6, Issue 1, Page No pp.897-903, January -March 2019.
Related Documents