Hyperlocal Election Mapping Made Easy Timothy Goddard, Depiction, Inc.

Hyperlocal Election Mapping Made Easy
Jul 08, 2015
Previously, only a select few experts who have been able to take raw election returns and turn them into useful maps that show key trends and patterns on the "hyperlocal" level. However, Depiction mapping software enables anyone to, with relative ease and at trivial cost, create powerful interactive election maps, and much more.
Welcome message from author
This document is posted to help you gain knowledge. Please leave a comment to let me know what you think about it! Share it to your friends and learn new things together.
Transcript

Hyperlocal Election Mapping Made Easy
Timothy Goddard, Depiction, Inc.

Election Results by Precinct
+ Precinct maps _
Election Maps
• Finding the data
• Preparing the data
• Merging the data
• Colorizing the data

• Finding the data
• Preparing the data
• Merging the data
• Colorizing the dataUsing Depiction

What is Depiction?
• Mapping, Simulation & Collaboration Software
• Bringing expert-level capabilities (like election mapping) to everyday people
• Used in emergency management, real estate, small business and more.
• Finding the data
–This is the hard part!
–Two data types:
•Map/GIS Data
•Election Results

Finding the Data
• Map/GIS Data
– “Precincts” or “Voting Districts”
– Accessible at the Statewide or County level
– Shapefile format
– If not available online, try calling

• Statewide:
• County:

Finding the Data
• Election data– Precinct level results
– From different agencies• Statewide
– Secretary of state, board of elections
• County level– Auditor, clerk, registrar, elections division
– Usually not in a spreadsheet format• Which it needs to be!
• Best option—call & ask for a spreadsheet or similar document

• Preparing the data
–Turn it into a spreadsheet
–Save it as CSV
–Different types take different methods
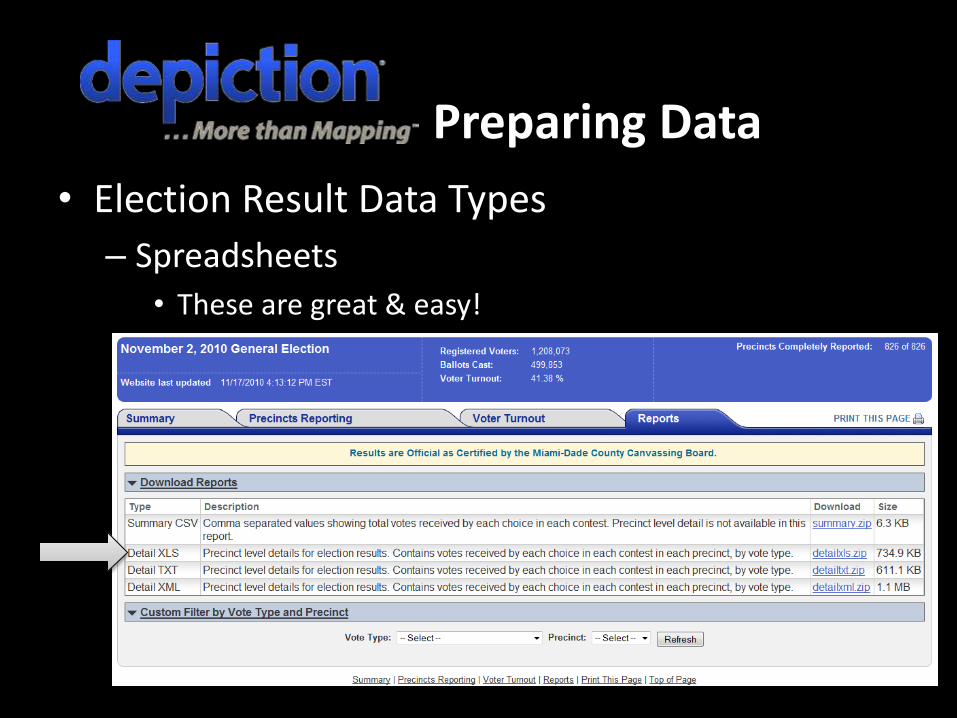
Preparing Data
• Election Result Data Types
– Spreadsheets
• These are great & easy!

Preparing Data
• Election Result Data Types
– Delimited
– Paste into Excel
– ‘Text to Columns’
Semicolon:
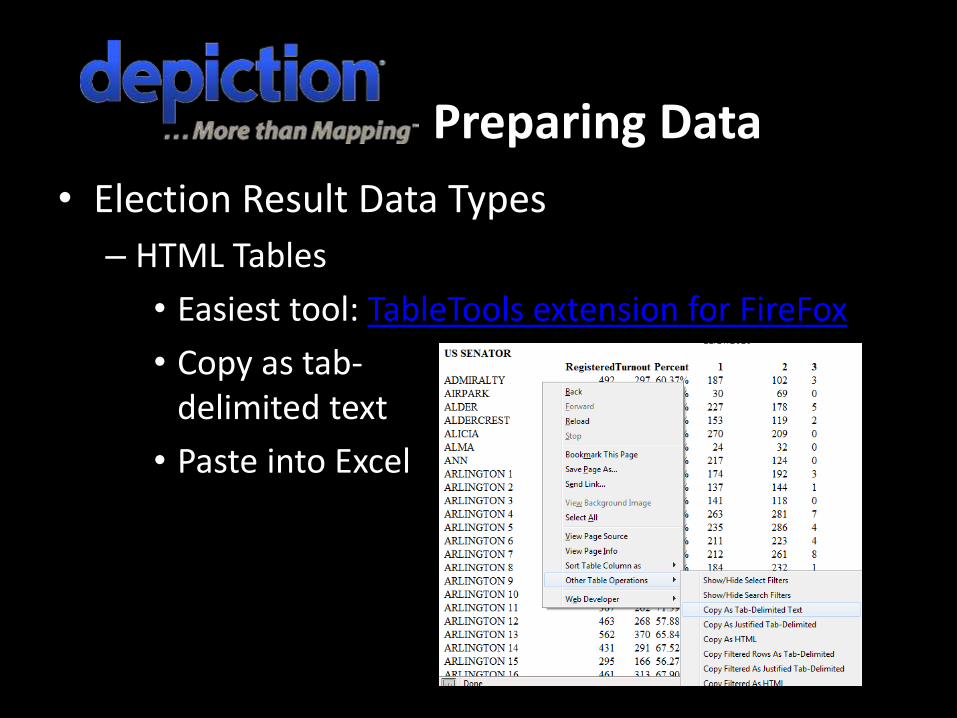
Preparing Data
• Election Result Data Types
– HTML Tables
• Easiest tool: TableTools extension for FireFox
• Copy as tab-delimited text
• Paste into Excel

Preparing Data
• Election Result Data Types
– More difficult types
• Straight Text
• Multiple HTML Tables
– Copy/Paste the whole thinginto Excel
– “Slice & Dice” the data

• Slicing & Dicing
– Filtering
• To separate out columns
• Paste into new sheet
• Slicing & Dicing
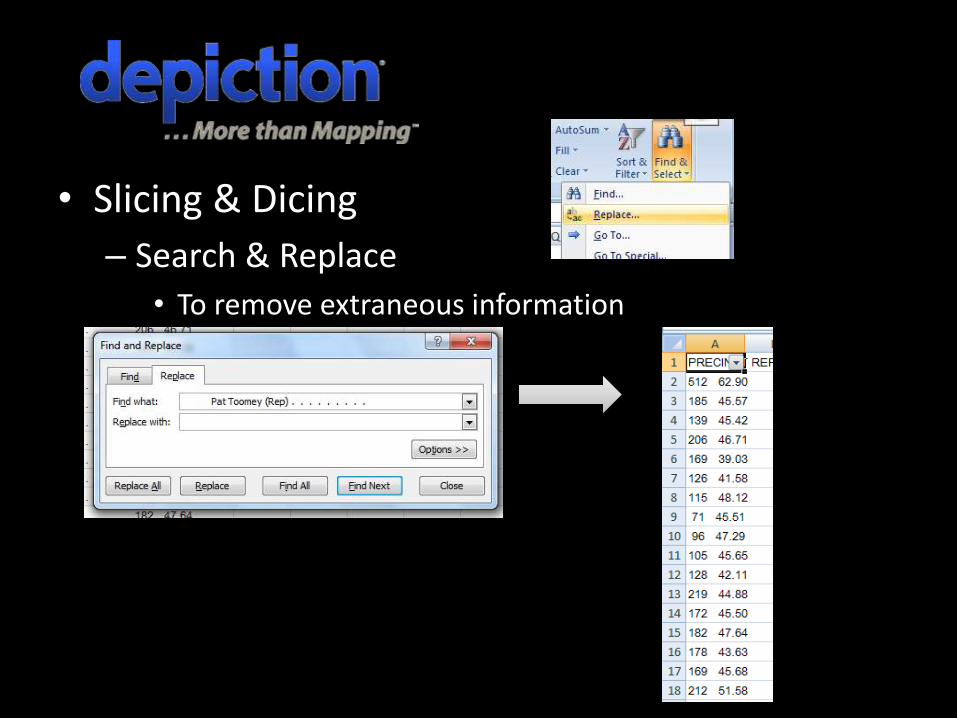
– Search & Replace
• To remove extraneous information
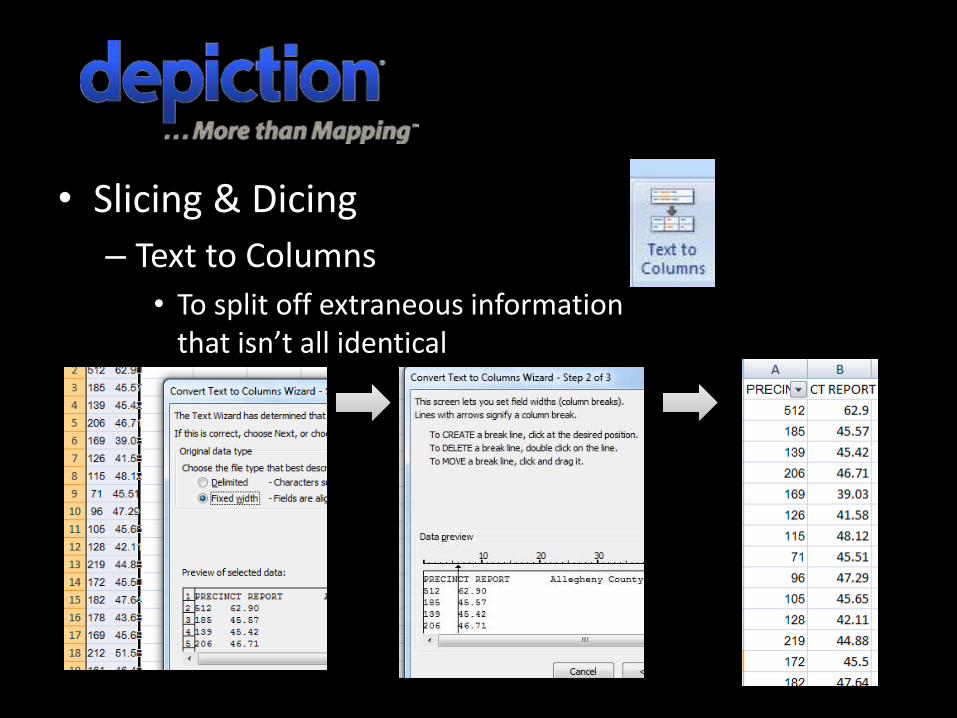
• Slicing & Dicing
– Text to Columns
• To split off extraneous informationthat isn’t all identical
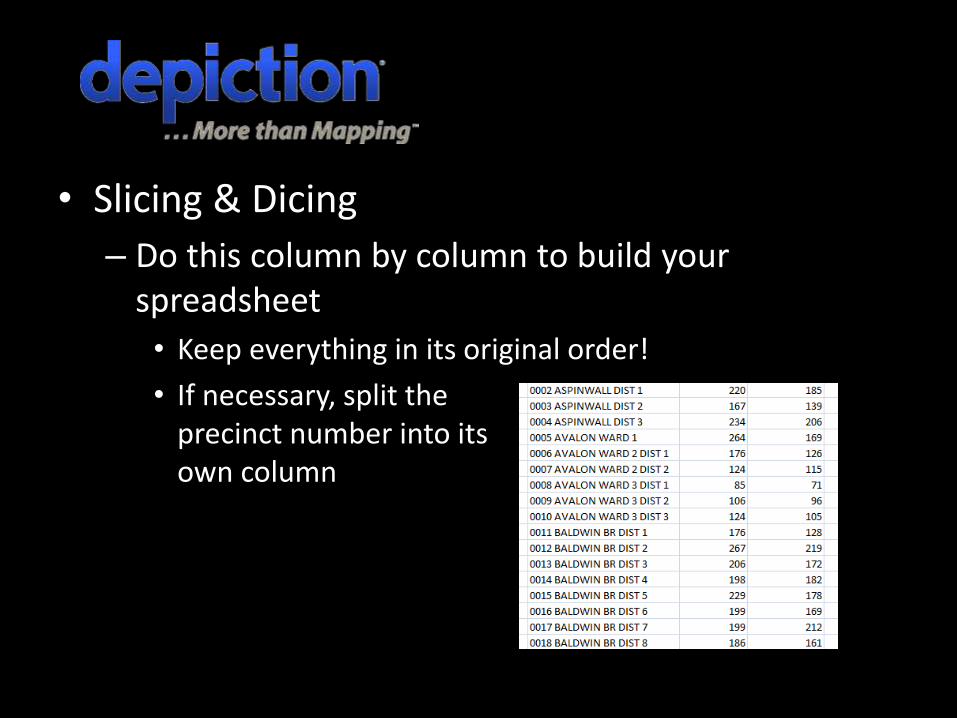
• Slicing & Dicing
– Do this column by column to build your spreadsheet
• Keep everything in its original order!
• If necessary, split the precinct number into itsown column

Preparing Data
• Preparing GIS Data
– Create a new Depiction file
– Set the area you want
– Import the Shapefile into Depiction
• (just drag & drop!)

• Finishing election data preparation
– Be sure to include the precinct number or other unique identifier as a column
– Name the unique identifier column “EID”
– The EID, or ‘Element ID’ is what will match the precinct shapes to the election information.

• Add vote percentage columns– Add a column for the one candidate percentages.
– Add a formula that calculates the percentage—something like: =B2/(B2+C2)
– ‘Fill down’ the entire column
– Do the same for the second candidate. Something like: =C2/(B2+C2)
– Set the decimal places to desired number (2-4, probably)
– Save as CSV and close it.

• Preparing GIS Data
– Find the unique precinct identifier field that matches your voting data
• “PRECINCTNUM”,“NUMBER” “Name,” etc
• Export it all to GML
• Delete the elements

• Preparing GIS Data– Open the GML in a text editor
– Search & replace the precinct field name with EID
– Also removethe “description”field
– Save the GMLdelete the.xsd file
– Import the GML back into Depiction.

Merging the Data
• Import the CSV
– Just drag, drop, and click ‘import’

Merging the data
• Wait for the import to complete– As long as your EIDs match up correctly, the new data
should be appended to the precinct elements.
– An alert will saynothing was imported, because no new elements were added.
– But new fields should be present

Colorizing the Data
• Click “Colorize”
• Select “thematic mapping”
• Choose one of the percent fields as the property value.
• Set the colors, click OK.
• You can also use a “Manual range selection”
– 0 – 1 for absolute coloring
– .499 - .501 for binary “red/blue” coloring
– .25 - .75 for more distinct absolute coloring

Tada!
Allegheny Co,Pennsylvania
2010 Senate Election

Tips & Tricks
• Be sure your precinct data is up to date• Be patient when dealing with hundreds or
thousands of precincts• Do spot checks to be sure your data is correct
– Between original election data & final CSV– Between original election data & final depiction
• Set hovertext for the precincts to name and both candidate percentages & total votes
• To compare multiple elections, delete the EID field, re-import the GML and repeat merge w/ new data

For more information:
www.depiction.com
Related Documents