Hyperglycemia induces apoptosis in rat liver through the increase of hydroxyl radical: new insights into the insulin effect Daniel E France ´s 1 , Marı ´a T Ronco 1 , Juan A Monti 1 , Paola I Ingaramo 1 , Gerardo B Pisani 2 , Juan P Parody 1 , Jose ´ M Pellegrino 1 , Paloma Martı ´n Sanz 3,4 , Marı ´a C Carrillo 1 and Cristina E Carnovale 1 1 Instituto de Fisiologı ´a Experimental (IFISE-CONICET), 2 Area Morfologı ´a, Facultad de Ciencias Bioquı ´micas y Farmace ´uticas (Universidad Nacional de Rosario), Suipacha 570, 2000 Rosario, Argentina 3 Instituto de Investigaciones Biome ´dicas ‘Alberto Sols’, IIBM, Consejo Superior de Investigaciones Cientı ´ficas, CSIC-UAM, Arturo Duperier 4, 28029 Madrid, Spain 4 Centro de Investigacio ´n Biome ´dica en Red de Enfermedades Hepa ´ticas y Digestivas (Ciberehd), Villaroel 170, 08036 Barcelona, Spain (Correspondence should be addressed to C E Carnovale; Email: [email protected]) Abstract In this study, we analyzed the contribution of hydroxyl radical in the liver apoptosis mediated by hyperglycemia through the Bax–caspase pathway and the effects of insulin protection against the apoptosis induced by hyperglycemia. Male adult Wistar rats were randomized in three groups: control (C) (sodium citrate buffer, i.p.), streptozotocin (STZ)-induced diabetic (SID) (STZ 60 mg/kg body weight, i.p.), and insulin- treated SID (SIDCI; 15 days post STZ injection, SID received insulin s.c., twice a day, 15 days). Rats were autopsied on day 30. In liver tissue, diabetes promoted a significant increase in hydroxyl radical production which correlated with lipid peroxidation (LPO) levels. Besides, hyperglycemia signi- ficantly increased mitochondrial BAX protein expression, cytosolic cytochrome c levels, and caspase-3 activity leading to an increase in apoptotic index. Interestingly, the treatment of diabetic rats with desferoxamine or tempol (antioxidants/ hydroxyl radical scavengers) significantly attenuated the increase in both hydroxyl radical production and in LPO produced by hyperglycemia, preventing apoptosis by reduction of mitochondrial BAX and cytosolic cytochrome c levels. Insulin treatment showed similar results. The finding that co-administration of antioxidants/hydroxyl radical scavengers together with insulin did not provide any additional benefit compared with those obtained using either inhibitors or insulin alone shows that it is likely that insulin prevents oxidative stress by reducing the effects of hydroxyl radicals. Importantly, insulin significantly increased apoptosis inhibitor protein expressionby induction of its mRNA. Taken together, our studies support that, at least in part, the hydroxyl radical acts as a reactive intermediate, which leads to liver apoptosis in a model of STZ-mediated hyperglycemia. A new anti-apoptosis signal for insulin is shown, given by an increase of apoptosis inhibitor protein. Journal of Endocrinology (2010) 205, 187–200 Introduction Diabetes is a common metabolic disorder in humans, which is associated with significant morbidity and mortality, and is a contributor to the development of other diseases. Indirectly or directly, the liver is a major target of insulin action. The onset of diabetes is accompanied by development of major biochemical and functional abnormalities in the liver, including alterations in carbohydrate, lipid, and protein metabolism, and changes in antioxidant status (McLennan et al. 1991, Saxena et al. 1993, Chatila & West 1996, Harrison et al. 2006). The prevalence of hepatobiliary diseases is increased in patients with either type 1 or type 2 diabetes (Saxena et al. 1993, Bell & Allbright 2007). Even with insulin treatment, diabetic patients show profound disturbances in tissue growth (Porte & Schwartz 1996). Clinically, altered liver size is seen in both juvenile and adult diabetic patients, which can be the result of alteration in cell number, cell growth, and/or cell death (apoptosis; Chatila & West 1996, Marangiello & Giorgetti 1996). West indicated an increase in oxidative damage in both type 1 and type 2 diabetes as well as deficits in antioxidant defence enzymes and vitamins. It is argued that oxygen, antioxidant defences, and cellular redox status should be regarded as central players in diabetes (West 2000). Laaksonen et al. reported increased lipid peroxidation (LPO) in plasma of young men with type 1 diabetes using the malondialdehyde (MDA) test. MDA is formed when polyunsaturated fatty acyl chains are attacked by hydroxyl radicals, which can also damage DNA-generating characteristic products, i.e. 8-hydroxy-2 deoxyguanosine (Laaksonen et al. 1996). There is accumulating evidence especially in diabetic animal models 187 Journal of Endocrinology (2010) 205, 187–200 DOI: 10.1677/JOE-09-0462 0022–0795/10/0205–187 q 2010 Society for Endocrinology Printed in Great Britain Online version via http://www.endocrinology-journals.org

Welcome message from author
This document is posted to help you gain knowledge. Please leave a comment to let me know what you think about it! Share it to your friends and learn new things together.
Transcript
187
Hyperglycemia induces apoptosis
in rat liver through the increaseof hydroxyl radical: new insights into the insulin effectDaniel E Frances1, Marıa T Ronco1, Juan A Monti1, Paola I Ingaramo1, Gerardo B Pisani2, Juan P Parody1,
Jose M Pellegrino1, Paloma Martın Sanz3,4, Marıa C Carrillo1 and Cristina E Carnovale1
1Instituto de Fisiologıa Experimental (IFISE-CONICET), 2Area Morfologıa, Facultad de Ciencias Bioquımicas y Farmaceuticas (Universidad Nacional de Rosario),Suipacha 570, 2000 Rosario, Argentina
3Instituto de Investigaciones Biomedicas ‘Alberto Sols’, IIBM, Consejo Superior de Investigaciones Cientıficas, CSIC-UAM, Arturo Duperier 4, 28029 Madrid,Spain
4Centro de Investigacion Biomedica en Red de Enfermedades Hepaticas y Digestivas (Ciberehd), Villaroel 170, 08036 Barcelona, Spain
(Correspondence should be addressed to C E Carnovale; Email: [email protected])
Abstract
In this study, we analyzed the contribution of hydroxyl radical
in the liver apoptosis mediated by hyperglycemia through the
Bax–caspase pathway and the effects of insulin protection
against the apoptosis induced by hyperglycemia. Male adult
Wistar rats were randomized in three groups: control (C)
(sodium citrate buffer, i.p.), streptozotocin (STZ)-induced
diabetic (SID) (STZ 60 mg/kg body weight, i.p.), and insulin-
treated SID (SIDCI; 15 days post STZ injection, SID received
insulin s.c., twice a day, 15 days). Rats were autopsied on day
30. In liver tissue, diabetes promoted a significant increase
in hydroxyl radical production which correlated with lipid
peroxidation (LPO) levels. Besides, hyperglycemia signi-
ficantly increased mitochondrial BAX protein expression,
cytosolic cytochrome c levels, and caspase-3 activity leading to
an increase in apoptotic index. Interestingly, the treatment of
diabetic rats with desferoxamine or tempol (antioxidants/
hydroxyl radical scavengers) significantly attenuated the
Journal of Endocrinology (2010) 205, 187–2000022–0795/10/0205–187 q 2010 Society for Endocrinology Printed in Great
increase in both hydroxyl radical production and in LPO
produced by hyperglycemia, preventing apoptosis by
reduction of mitochondrial BAX and cytosolic cytochrome
c levels. Insulin treatment showed similar results. The finding
that co-administration of antioxidants/hydroxyl radical
scavengers together with insulin did not provide any additional
benefit compared with those obtained using either inhibitors
or insulin alone shows that it is likely that insulin prevents
oxidative stress by reducing the effects of hydroxyl radicals.
Importantly, insulin significantly increased apoptosis inhibitor
protein expression by induction of its mRNA. Taken together,
our studies support that, at least in part, the hydroxyl
radical acts as a reactive intermediate, which leads to liver
apoptosis in a model of STZ-mediated hyperglycemia.
A new anti-apoptosis signal for insulin is shown, given by an
increase of apoptosis inhibitor protein.
Journal of Endocrinology (2010) 205, 187–200
Introduction
Diabetes is a common metabolic disorder in humans, which is
associated with significant morbidity and mortality, and is a
contributor to the development of other diseases. Indirectly
or directly, the liver is a major target of insulin action. The
onset of diabetes is accompanied by development of major
biochemical and functional abnormalities in the liver,
including alterations in carbohydrate, lipid, and protein
metabolism, and changes in antioxidant status (McLennan
et al. 1991, Saxena et al. 1993, Chatila & West 1996, Harrison
et al. 2006). The prevalence of hepatobiliary diseases is
increased in patients with either type 1 or type 2 diabetes
(Saxena et al. 1993, Bell & Allbright 2007). Even with insulin
treatment, diabetic patients show profound disturbances in
tissue growth (Porte & Schwartz 1996). Clinically, altered
liver size is seen in both juvenile and adult diabetic patients,
which can be the result of alteration in cell number, cell
growth, and/or cell death (apoptosis; Chatila & West 1996,
Marangiello & Giorgetti 1996).
West indicated an increase in oxidative damage in both
type 1 and type 2 diabetes as well as deficits in antioxidant
defence enzymes and vitamins. It is argued that oxygen,
antioxidant defences, and cellular redox status should be
regarded as central players in diabetes (West 2000). Laaksonen
et al. reported increased lipid peroxidation (LPO) in plasma of
young men with type 1 diabetes using the malondialdehyde
(MDA) test. MDA is formed when polyunsaturated fatty
acyl chains are attacked by hydroxyl radicals, which can also
damage DNA-generating characteristic products, i.e.
8-hydroxy-2 deoxyguanosine (Laaksonen et al. 1996). There
is accumulating evidence especially in diabetic animal models
DOI: 10.1677/JOE-09-0462Britain Online version via http://www.endocrinology-journals.org
D E FRANCES and others . Liver hydroxyl radical and apoptosis in diabetes188
(such as streptozotocin (STZ)-induced diabetic (SID) rats and
mice) that hyperglycemia induces acceleration of hydroxyl
radical generation and this has been correlated with the
level of thiobarbituric acid (TBA) – reactive compounds
as an estimation of LPO (Ohkuwa et al. 1995, Winiarska
et al. 2004).
On the other hand, it was established that hyperglycemia
increases mitochondrial reactive oxygen species (ROS)
production, which could represent a key event in the
development of diabetes complications (Nishikawa et al.
2000, Kiritoshi et al. 2003). The initial cellular response to
high glucose challenge is the generation of ROS, which
rapidly induces apoptotic cell death (Park et al. 2001).
It is known that high D-glucose induces endothelial
apoptosis through activation of the Bax–caspase proteases
pathway. The effectors of apoptosis are now well known to
be represented by a family of intracellular cysteine proteases
known as caspases (Green & Reed 1998). A feature of
apoptosis that impinges on caspases is altered mitochondrial
function characterized by a reduction in the electrochemical
gradient across the mitochondrial membrane and release of
mitochondrial cytochrome c to cytoplasm (Liu et al. 1996),
and it is inhibited by the presence of Bcl-xL in these
organelles (Fraser & Evan 1996, Yang et al. 1997).
Translocation of pro-apoptotic BAX protein into the
mitochondrial membrane is accompanied by a significant
increase in caspase-3 (CASP3) and caspase-9 (CASP9)
activities (Nakagami et al. 2002).
Several studies have been carried out to evaluate the
alterations in cell mitochondrial functions from brain,
heart, liver, and kidney of diabetic rats (Moreira et al.
2006). However, results are sometimes controversial, since
experimental conditions such as age and strain of used
animals are diverse.
In view of the above lines of evidence, the objective of
the present study was to investigate whether hyperglycemia
produces an increase in hydroxyl radical, which exerts
a regulatory action on apoptosis in liver through the
Bax–caspase pathway. In addition, the effect of insulin over
this pathway was also evaluated.
Materials and Methods
Animals and treatments
Experiments were performed in 100-day-old male Wistar
rats. They were housed two per cage and maintained in a
room at constant temperature with a 12 h light:12 h darkness
cycle. Animals were fed with standard pellet diet and
water made available ad libitum. All the experimental
protocols were performed according to the Regulation for
the Care and Use of Laboratory Animals (Expedient
6109/012 E.C. Resolution 267/02) and approved by the
Institutional Animal Use Committee of the National
University of Rosario, Argentina.
Journal of Endocrinology (2010) 205, 187–200
SID was induced by a single dose of STZ (60 mg/kg body
weight (bw), i.p., in 50 mM citrate buffer, pH 4.5; Ha et al.
1994). Rats of the control group (C) (nZ6) received an i.p.
injection of an equal volume of citrate buffer. It is known
that STZ is excreted within 48 h from injection and
therefore cannot be a direct effect of oxidative stress
(Karunanayake et al. 1974). Fifteen days after STZ injection,
a time when the toxic effect of the drug on the liver would
have disappeared (Carnovale & Rodriguez Garay 1984,
Carnovale et al. 1986), blood samples were obtained from the
tail vein, and glucose concentrations were measured by
means of a Surestep glucometer (Glucostix, Bayer Health-
Care). Successful induction of diabetes was defined as a
blood glucose level of O13.2 mmol/l. On day 15 post STZ
treatment, SID rats were randomly assigned to two groups
(nZ6 each group): diabetic animals (SID) and insulin-treated
diabetic animals (SIDCI). Insulin (Betasint insulin, BETA
S.A. Laboratories, Buenos Aires, Argentina) was adminis-
tered s.c. twice a day (at 0800 and 2000 h) until the animals
were killed. Blood glucose levels were measured every day,
each time just before insulin injection. The doses of insulin
were adjusted to reach target blood glucose levels of
6–9 mmol/l. Between 1000 and 1200 h on day 30, rats
were weighed, anesthetized with sodium pentobarbital
solution (50 mg/kg bw, i.p.), and killed. Blood was obtained
by cardiac puncture. Plasma was separated by centrifugation
(2200 g for 5 min at 4 8C). Liver was promptly removed, and
slices of liver tissue were processed for immunohistochemical
studies. Remaining liver tissue was stored at K70 8C until
the analytical assays were performed.
For hydroxyl radical detection, other four rats belonging
to each different group under study (C, SID, SIDCI,
SIDCdesferoxamine (DES), SIDCDESCI, SIDCtempol
(TEM), and SIDCTEMCI) were injected with trapping
agent salicylic acid (SA; 100 mg/kg bw, i.p.) 30 min
before the animals were killed, and the livers were removed.
For studies on inhibition of hydroxyl radical production,
after 15 days of diabetes, STZ-induced diabetes rats were
separated into different groups and received different
hydroxyl radical inhibitors alone or co-administered with
insulin. Each group contained at least six animals. DES is
an iron chelator that prevents the formation of hydroxyl
radicals from hydrogen peroxide via inhibition of the
Fenton and Haber–Weiss reactions (Kaur & Halliwell
1994). DES (100 mg/kg bw, i.p.) was administered to
rats, once a day, in saline solution starting 15 days after
injection of STZ and for 15 days. TEM is a stable
piperidine nitroxide that permeates biological membranes,
and reduces the formation or the effects of hydroxyl
radicals by scavenging superoxide anions or by reducing
intracellular FeC2 concentrations or by directly scavenging
hydroxyl radicals (Chatterjee et al. 2000). TEM (20 mg/kg
bw, i.v.) was administered to rats, once a day, in saline
solution starting 15 days after injection of STZ and for
15 days.
www.endocrinology-journals.org
Liver hydroxyl radical and apoptosis in diabetes . D E FRANCES and others 189
Hydroxyl radical (%OH) detection
The in vivo measurement of %OH, a highly reactive free
radical, is very difficult (Kaur & Halliwell 1994). Thus, sali-
cylate has been used as a trapping agent for detecting %OH
in vivo (Grootveld & Halliwell 1986, Pryor & Godber 1991).
Attack by %OH upon salicylate produces 2,3-dihydroxybenzoic
acid (2,3-DHBA), 2,5-DHBA, and catechol. Among these
hydroxylated products of salicylate, 2,3-DHBA is reported to
be solely formed by direct %OH attack. As a result, the
method of salicylate hydroxylation is useful in predicting
the occurrence of oxidative stress in vivo, and the measure-
ment of 2,3-DHBA has been proposed as a marker for the
assessment of oxidative stress (Pryor & Godber 1991). For this
experiment, 30 min after SA injection (100 mg/kg bw, i.p.),
the rats were anesthetized with sodium pentobarbital
(50 mg/kg bw) and killed.
SA and 2,3-DHBA were measured according to the
methods of Tsai et al. (1998) and Yamamoto et al. (2001)
respectively, both with modifications. For the determination of
SA and 2,3-DHBA, tissue samples (within 0.5 g) were
homogenized in ice-cold saline (0.5 ml), and deproteinized
by the addition of 10% v/v perchloric acid containing 1 mM
EDTA and 100 mM sodium pyrosulfite. Hydrochloride (1 M,
0.4 ml) was added to the supernatant fraction obtained by
centrifugation. The resulting solution was extracted with
10 ml of diethyl ether by mixing thoroughly for 1 min and was
then centrifuged. The organic phase was collected, evaporated
to dryness under nitrogen, and dissolved in 300 ml mobile phase
(30 mM sodium citrate/27.7 mM sodium acetate, pH 2.80).
According to the method, the samples were analyzed using a
Waters HPLC system, equipped with a Model 1515 pump, and
Waters 2465 electrochemical detector (ECD; Waters, Milford,
MA, USA). Reverse-phase HPLC analysis was carried
out using a Luna 5 m C18(2) 100A column (250!4.6 mm,
Phenomenex, Torrance, CA, USA). The glassy carbon-
working electrode was set at a potential of C0.85 V, and the
flow rate was 0.6 ml/min. No interfering peaks were detected
in blank samples. To determine SA levels, an u.v. detector was
coupled to the system monitoring absorbance at 295 nm.
The ratio of 2,3-DHBA to SA was obtained.
Assays for lipid peroxidation
LPO levels were determined as indirect measurements of
ROS production. The amount of aldehydic products
generated by LPO in total homogenate fractions was
quantified by the TBA reaction according to the method of
Ohkawa et al. (1979) and measured by HPLC with
modifications introduced by Young & Trimble (1991). The
amount of TBA reactants (TBARS) was expressed in terms
of MDA using 1,1,3,3-tetramethoxypropane as a standard.
Protein content was measured by the method of Lowry et al.
(1951) using BSA as a standard. Results were expressed as
nmol of MDA per mg of protein.
www.endocrinology-journals.org
Analysis of protein levels by western blotting
Western blotting was performed for the analysis of AKT,
phosphorylated AKT (P-AKT), phosphoinositol-3 kinase
(PI3K), BAD, BAX, Bcl-xL (BCL2L1), X-linked inhibitor of
apoptosis protein (XIAP), and cytochrome c proteins. Briefly,
mitochondria-enriched fractions were prepared from liver
tissues that were homogenized in four volumes of 0.150 M
KCl with protease inhibitors (1 mM phenylmethylsulfonyl
fluoride, 10 mg/ml leupeptin, and 1 mg/ml aprotinin).
Homogenates were centrifuged at 1000 g to remove
unbroken cells, nuclei, and heavy membranes. Mitochondria-
enriched fractions were then obtained by the centrifugation
of supernatant at 6000 g at 4 8C for 15 min. Then, the
supernatant was centrifuged at 45 000 g for 1 h to obtain
the cytosolic fraction (Ronco et al. 2004). Proteins were
quantified according to Lowry et al. (1951). For detection,
25 mg protein was subjected to 12% SDS-PAGE and
transferred to polyvinyl difluoride (PVDF) membranes
(PerkinElmer Life Sciences, Boston, MA, USA). After
blocking, blots were incubated overnight at 4 8C with
monoclonal primary antibodies (AKT and P-AKT (1:600,
Cell Signaling, Danvers, MA, USA); PI3K p85a, BAD,
BAX, BCl-XL, XIAP, and cytochrome c (1:600, Santa
Cruz Biotechnology, Santa Cruz, CA, USA)). After this,
membranes were incubated with secondary antibodies such as
IgG-peroxidase conjugates (1:5000, Amersham Life Science),
and the resulting bands were detected by enhanced
chemiluminescence (ECL; Amersham Pharmacia Biotech)
detection. Autoradiographs were obtained by exposing
PVDF membranes to Kodak XAR film, and the bands
were quantified by densitometry (Shimadzu CS-9000).
Determination of apoptosis
Caspase-3 activity and terminal deoxynucleotidyl transferase-
mediated deoxyuridine triphosphate nick end labeling
(TUNEL) assays were performed as quantitative indexes of
apoptosis.
Caspase-3 activity assay
The activity of caspase-3 was determined according to the
manufacturer’s instructions using an EnzChek caspase-3 assay
kit (Molecular Probes, Eugene, OR, USA). The tissues were
homogenized in lysis buffer (10 mM Tris, 200 mM NaCl,
1 mM EDTA, and 0.001% Triton X-100). Subsequently, after
differential centrifugation, the cytosolic fraction from each
sample was mixed with Z-Asp-Glu-Val-Asp-AMC substrate
solution. A standard curve of AMC ranging from 0 to 100 mM
was run with each set of samples. A control sample without
enzyme was used in each assay to determine the background
fluorescence of the substrate. As an additional control, 1 ml
of the 1 mM Ac-Asp-Glu-Val-Asp-CHO (aldehyde), the
caspase-3 inhibitor stock solution, was added. Fluorescence was
Journal of Endocrinology (2010) 205, 187–200
D E FRANCES and others . Liver hydroxyl radical and apoptosis in diabetes190
measured at an excitation wavelength of 360 nm and an
emission wavelength of 465 nm in a DTX 880 Multimode
Detector (Beckman Coulter, Brea, CA, USA).
Determination of apoptotic index
An apoptosis detection system was utilized which catalyti-
cally incorporates fluorescein-12-dUTP at the 3 0-OH DNA
ends using the principle of the TUNEL assay, with direct
visualization of the labeled DNA (Promega). Light
microscopic analysis of hematoxylin- and eosin-stained
slides was used to quantify apoptotic cells, which were
identified by morphological criteria (increased eosinophilic
cytoplasm, darkened nucleus, and pycnotic separation of
cytoplasmic membrane from neighboring cells). To corro-
borate the incidence of apoptotic bodies, serial sections
were stained with hematoxylin–eosin. An apoptotic index
(AI) was calculated for each sample by counting the
number of positively stained hepatocyte nuclei divided
by the total number of hepatocytes and expressed as
percentage. The number of apoptotic hepatocytes was
assessed by systematically scoring at least 10 000 hepatocytes
per slide at a magnification of 400! (Gold et al. 1994,
Klainguti et al. 2000).
Measurement of Xiap mRNA levels or RNA isolationand reverse transcription-PCR
Total RNA was isolated using the TRIzol method (Life
Technologies). RNA was dissolved in RNAse-free water
and kept at K80 8C until use. Reverse transcription (RT)
of 3 mg total RNA was performed with oligo(dT) primer,
and cDNA samples were stored at K20 8C until
assayed. The primers used were Xiap (Bio-Synthesis,
Lewisville, TX, USA; sense 5 0-TCTGGTGTGAGTTCA-
GATAGG-3 0; antisense 5 0-TGGATACCACTTAGCAT-
GCTG-3 0) and b-actin (Genset Oligos; sense 5 0-GGT-
GACGAGGCCCAGAGCAAG-3 0; antisense 5 0-GATCCA-
CATCTGCTGGAAGGT-3 0). The PCR was performed in a
GenAmp PCR System 2400 thermocycler (Perkin Elmer)
using the following conditions: 94 8C for 1 min, 55 8C for
1 min, 72 8C for 1 min, and a final extension phase of 72 8C
for 10 min. The number of thermal cycles used was 36.
RT-PCR products were then resolved on a 1.5% agarose gel,
and bands were visualized using a High Performance
Ultraviolet Transilluminator (UVP, Upland, CA, USA).
Images of the RT-PCR ethidium bromide-stained agarose
gels were acquired, and quantification of the optical density
Table 1 Assessment of the induced diabetic state. Effect of insulin-treat
Control SID SIDCI
Blood glucose (nmol/l) 6.0G0.5 23.9G2.2* 8.7G1.2*,†
Body weight (g) 447.3G16.2 229.0G31.5* 397.7G21.6*,†
Control, vehicle; SID, streptozotocin-induced diabetes; SIDCI, streptozotocin-*P!0.05 versus control; †P!0.05 versus SID.
Journal of Endocrinology (2010) 205, 187–200
(OD) of bands was performed using the Gel-Pro Analyzer
(Media Cybernetics, Bethesda, MD, USA) software (Ronco
et al. 2009). Results were expressed as the ratio between the
intensities of Xiap and b-actin, OD.
Statistical analysis
Data are presented as meanGS.E.M. for at least six rats per
group. Student’s t-tests were applied wherever necessary, and
statistical analysis of differences between groups was
performed by one-way ANOVA followed by Tukey’s
method. Differences were considered as statistically significant
when P!0.05.
Results
Assessment of the induced diabetic state: effect of insulin treatment
Diabetes was confirmed in STZ-injected rats by monitoring
weight loss and significant increase in blood glucose levels.
Compared with control animals, plasma ALT and AST levels
were increased by factors of 3 and 2 respectively in the
diabetic animals (data not shown). These results are consistent
with the STZ model described by others (Barneo et al. 1990,
Hwang et al. 2005, Fernandes et al. 2009).
Table 1 shows bw and blood glucose levels in control rats,
diabetic rats (SID), diabetic rats treated with insulin (SIDCI),
and these same three groups treated with DES or TEM. Prior
to STZ injection, the bw of diabetic and control rats was
similar, and difference was not statistically significant.
Thirteen days after STZ administration, the bw of diabetic
rats was significantly lower than that of the control group. At
this time, the blood glucose levels were significantly increased
in SID rats, as compared to control animals. Insulin treatment
increased bw and decreased blood glucose levels, reaching the
control group values. Treatment with the antioxidants/
hydroxyl radical scavengers DES or TEM produced no
changes in these parameters.
Assessment of insulin action
In order to assess whether insulin was exerting an anti-
apoptotic effect in our experimental model, we evaluated
the classical pathway of hormone action PI3K/AKT
(Shepherd et al. 1998, Virkamaki et al. 1999).
We determined the levels of the regulatory subunit of
PI3K p85a and also the levels of P-AKT. AKT has been
ment. Values are meansGS.E.M. (nZ6 animals per group)
SIDCDES SIDCDESCI SIDCTEM SIDCTEMCI
21.1G4.1* 7.9G2.2*,† 25.3G3.3* 8.1G2.0*,†
266.2G21.3* 366.5G22.1*,† 250.4G16.3* 347.4G24.7*,†
induced diabetes treated with insulin; DES, desferoxamine; TEM, tempol.
www.endocrinology-journals.org
Liver hydroxyl radical and apoptosis in diabetes . D E FRANCES and others 191
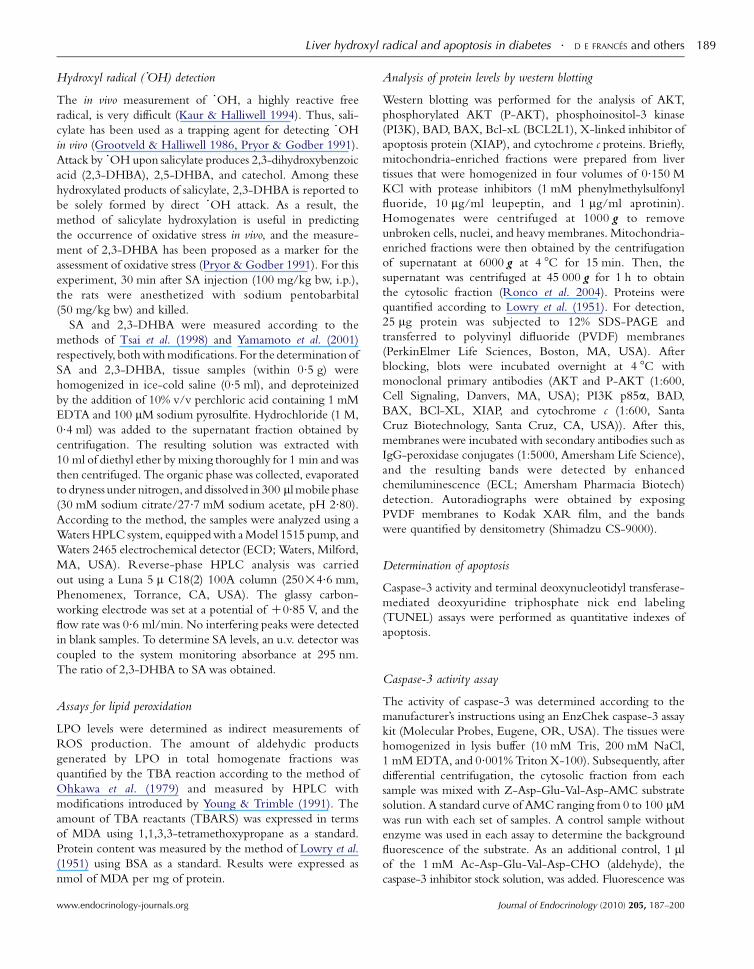
implicated in the suppression of apoptosis through inacti-
vation of several components of the cell death machinery
such as BAD (Datta et al. 1997, Galetic et al. 1999).
As expected (Nawano et al. 1999, Katso et al. 2001),
the diabetic state reduced significantly both PI3K p85a
C SID SID+I SID SID+I SID SID+I
DES TEM
PI3k p85
PI3K p85
% o
f C
- 85 kDa
- 43 kDa
- 60 kDa
- 43 kDa
β-Actin
β-Actin
200
150
100
50
0
% o
f C
150
100
50
200
0
Contro
lSID
SID+I
SID+D
ES
SID+D
ES+I
SID+T
EM
SID+T
EM+I
Contro
lSID
SID+I
SID+D
ES
SID+D
ES+I
SID+T
EM
SID+T
EM+I
* * *
###
*P<0·05 versus C#P<0·05 versus SID
*P<0·05 versus C#P<0·05 versus SID
AKT
AKT t
P
C SID SID+I SID SID+I SID SID+I
DES TEM
A
C D
B
Figure 1 Assessment of the insulin action. Effectphosphoinositol-3 kinase activity (PI3K p85a), (B(P-AKT), and (D) mitochondrial BAD protein exexperimental groups are shown as follows: continjected with sodium citrate vehicle; SID (blackrats received an i.p. injection of STZ (60 mg/kgpost STZ treatment, insulin was administered s.c.for 15 days; SIDCDES (black vertically strippedweight, i.p.) was administered to rats, once a dainjection of STZ and for 15 days; SIDCDESCI (bar); SIDCTEM (black horizontally stripped baradministered to rats, once a day, in saline solutiofor 15 days; SIDCTEMCI (co-administration) (gexamples of western blot of PI3K p85 (A), phospBAD (D), and b-actin or prohibitin for all the proand (D) bottom panels, each bar represents theconsidering control as 100%. Values are the meAKT did not show any change in all the studied gsignificant diminution in SID, SIDCDES, and SIDtreatment restored PI3K p85 levels and increaseddecreased mitochondrial Bad protein expression
www.endocrinology-journals.org
and P-AKT expression, as compared to controls. The
treatment with insulin restored the levels of both proteins
to normal values, thus evidencing the ability of the
hormone to regulate the PI3K/AKT pathway in the liver
(Fig. 1A–C).
- 20 kDa
- 32 kDa
% o
f C
200
150
100
50
0
*P<0·05 versus C#P<0·05 versus SID
*P<0·05 versus C#P<0·05 versus SID
Contro
lSID
SID+I
SID+D
ES
SID+D
ES+I
SID+T
EM
SID+T
EM+I
P-AKT
P-AKT - 60 kDa
- 43 kDaβ-Actin
% o
f C
200
150
100
50
0
Contro
lSID
SID+I
SID+D
ES
SID+D
ES+I
SID+T
EM
SID+T
EM+I
*
** *
**
##
## #
#
Mitochondrial BAD
BAD
rohibitin
C SID SID+I SID SID+I SID SID+I
DES TEM
C SID SID+I SID SID+I SID SID+I
DES TEM
of insulin on (A) regulatory subunit p85a of) total AKT (AKTt), (C) phosphorylated AKT
pression. The results obtained for allrol (C) (white bar), control group of animalsbar), streptozotocin (STZ)-induced diabeticbody weight); SIDCI (gray bar), on day 15to SID rats twice a day (at 0800 and 2000 h)bar), desferoxamine (100 mg/kg bodyy, in saline solution starting 15 days afterco-administration) (gray vertically stripped), tempol (20 mg/kg body weight, i.v.) wasn starting 15 days after injection of STZ andray horizontally stripped bar). Typicalho-AKT (B), total AKT (C), mitochondrial
teins are shown in top panel. In (A), (B), (C),densitometry expressed in percentageanGS.E.M. of six separated animal sets. Totalroups. PI3K p85 and phospho-AKT showedCTEM when compared to control. Insulinphospho-AKT in all groups, thus leading to(*P!0.05 versus C; #P!0.05 versus SID).
Journal of Endocrinology (2010) 205, 187–200
D E FRANCES and others . Liver hydroxyl radical and apoptosis in diabetes192
Next, we examined BAD levels in mitochondrial fraction.
SID rats showed a significant increase of mitochondrial
BAD expression. Insulin reduced the levels of this protein, as
expected due to its known anti-apoptotic effect (Fig. 1D).
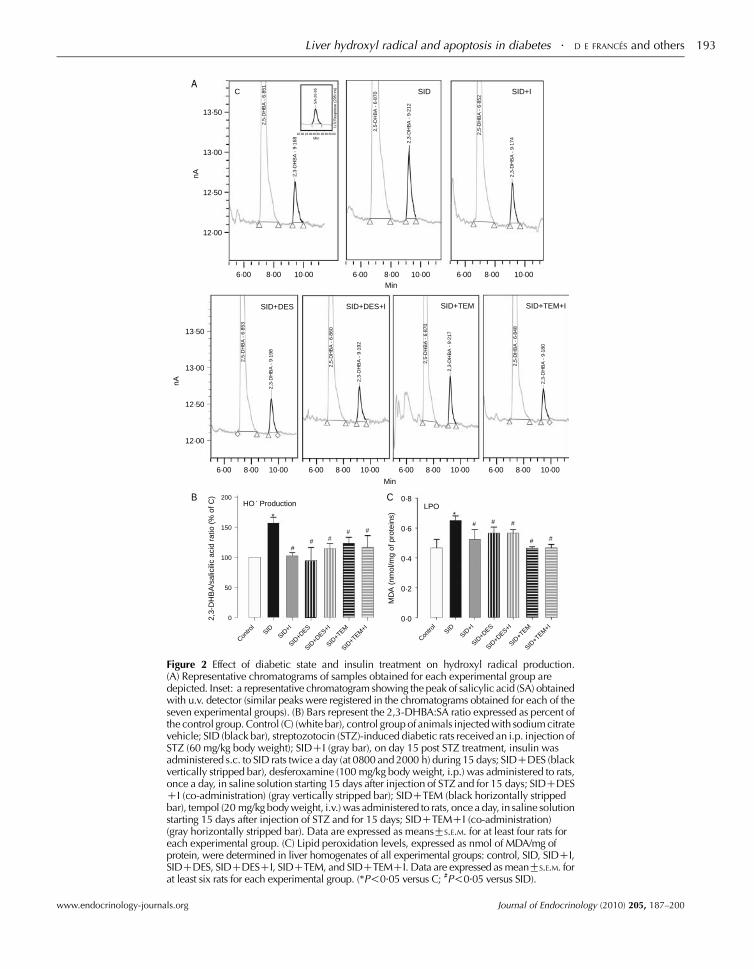
Hydroxyl radical and lipid peroxidation
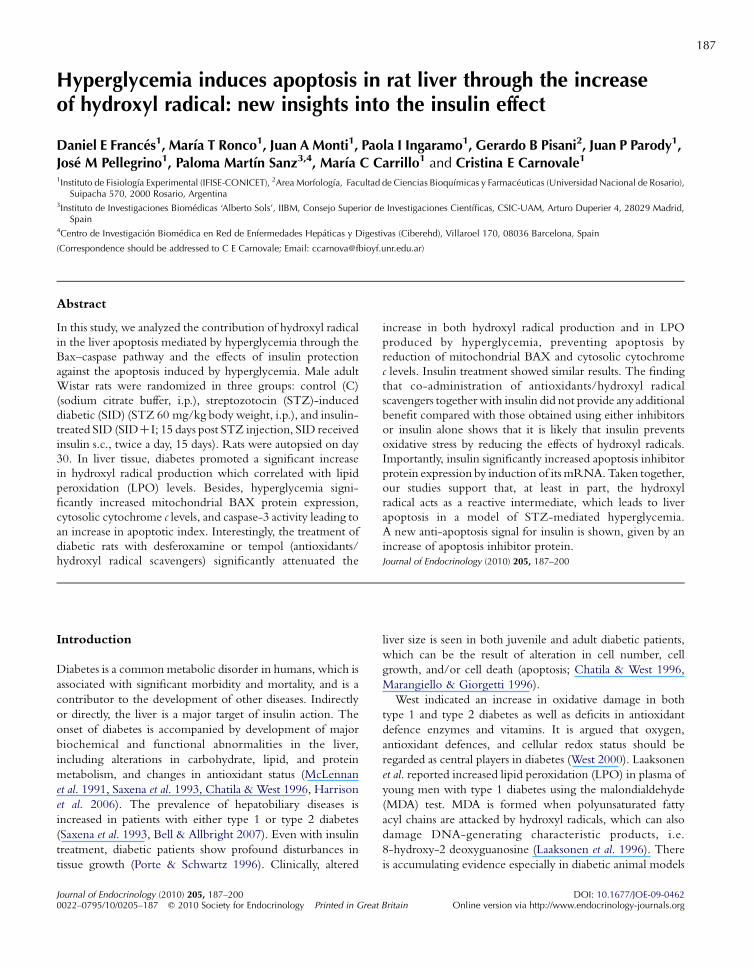
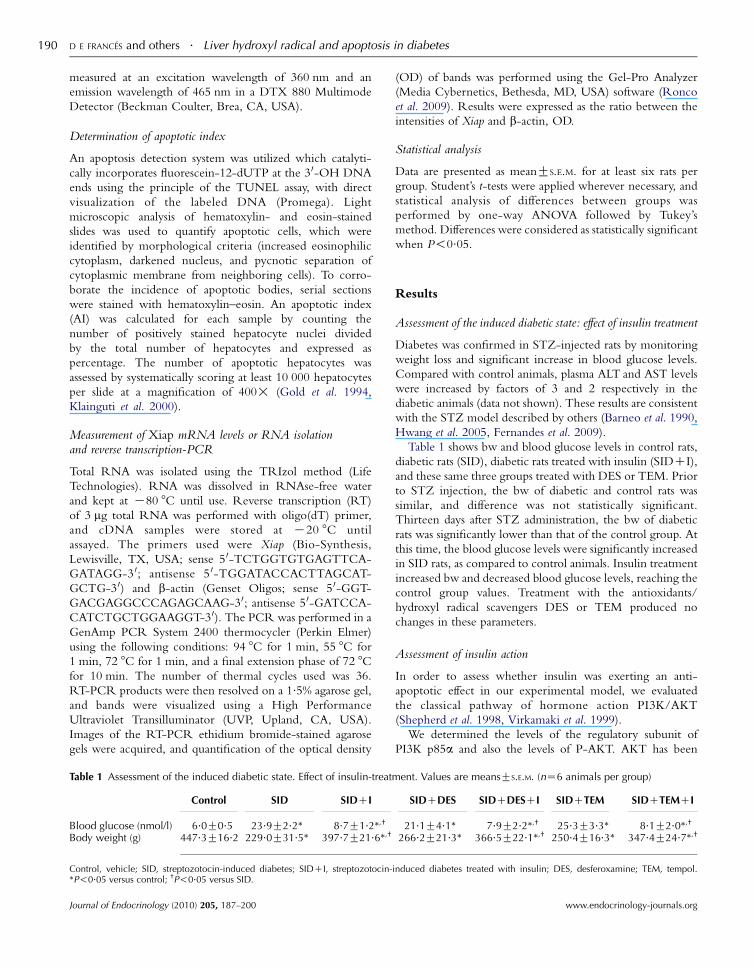
2,3-DHBA:SA ratio was determined to evaluate %OH
production. Results are presented in Fig. 2A and B. The
diabetic state increased %OH production (56%) compared
with the control group (P!0.05), and insulin treatment
significantly attenuated this increase observed in SID rats
(P!0.05), thus evidencing its antioxidant capacity.
A dramatic decrease in the production of %OH was found
in SID rats when DES or TEM was administered.
Co-administration of insulin and DES or TEM to SID rats
did not have any additive effect on the reduction of liver %OH
production compared with that obtained after TEM, DES,
or insulin administration respectively (Fig. 2A and B).
It has also been described that the %OH is one of the
possible candidates for triggering LPO. We have monitored
MDA levels, an LPO product, and a marker of oxidative
damage by TBARS assay. MDA is a reflection of the extent of
oxidant status and is considered a good marker of oxidative
stress (Wen et al. 2006).
MDA levels in liver homogenate of SID animals were
significantly higher than those of the control group (P!0.05;
Fig. 2C). Insulin treatment normalized MDA levels in liver
homogenate of the SID group (P!0.05), suggesting that it is
associated with the diabetic state induced by STZ rather
than a direct hepatotoxic effect of the drug. This reduction
in MDA was not, however, significantly different from the
reduction obtained upon administration of DES or TEM
alone (Fig. 2C). No changes were observed in these
parameters when rats from the control group were treated
with the antioxidants/hydroxyl radical scavengers (data
not shown).
Figure 2C shows that treatment with TEM produced a
larger reduction of LPO in SID than DES. It is known that
TEM reduces the formation of %OH either by scavenging
superoxide anions or by reducing the intracellular concen-
trations of Fe2C, and so we hypothesize that other free radical
intermediates, in addition to the %OH, are contributing to the
production of LPO observed in SID rats.
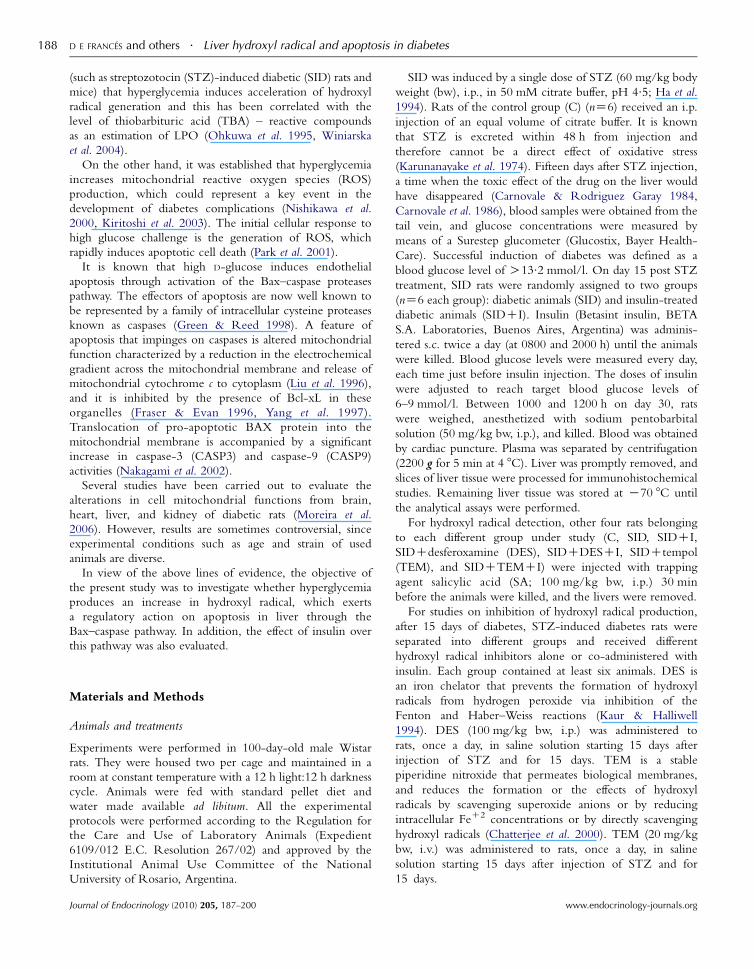
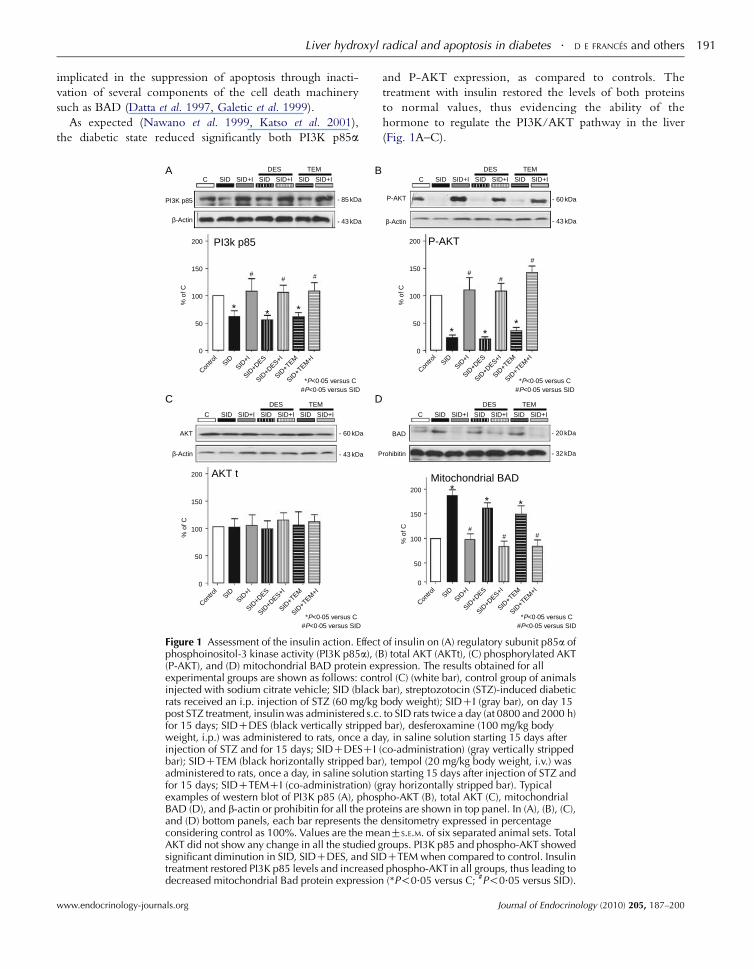
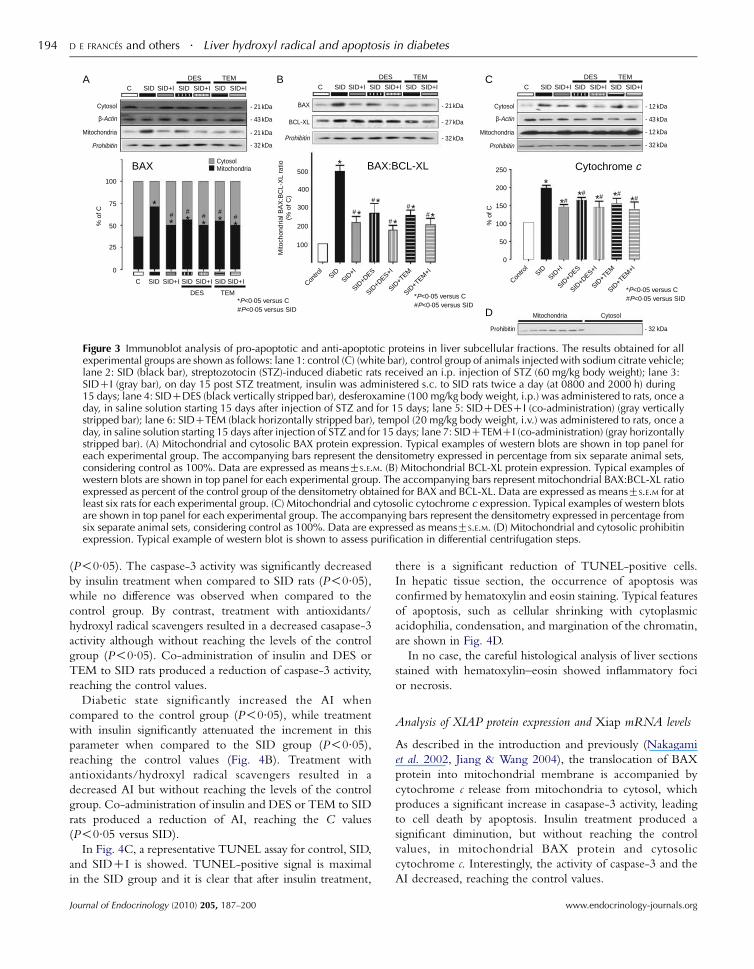
Analysis of the BCL-XL, BAX, and cytochrome c proteins
We examined the expression of BAX protein in liver
mitochondrial and cytosolic fractions, and BCL-XL protein
in liver mitochondrial fraction, by western blot analysis in all
experimental groups. BAX and BCL-XL are members of the
BCL-2 family, which plays a major role as regulators of the
apoptotic process: while BAX promotes apoptosis, and BCL-XL
protects cells from programed cell death (Tzung et al. 1997).
Immunoblot analyses followed by quantitative densitometry
Journal of Endocrinology (2010) 205, 187–200
from six separate animal sets revealed that mitochondrial
BAX protein levels increased by 60% (P!0.05), and a
consequent diminution of cytosolic BAX levels was observed
when compared to the control group (Fig. 3A).
Treatment of SID rats with insulin (SIDCI) markedly
decreased the mitochondrial protein levels of BAX reaching
the control values; however, protein expression of BCL-XL
remained increased when compared to the control group
(P!0.05). BAX:BCL-XL ratio determines cell survival or
death after apoptotic stimuli. Figure 3B shows that
mitochondrial BAX:BCL-XL ratio was significantly
increased in SID rats, indicating that in the diabetic state,
the liver is promoted to an apoptotic state. The ability of
insulin to decrease the BAX:BCL-XL ratio produces a shift in
cell fate towards survival, although the relationship does not
reach the control values.
Co-administration of insulin and DES or TEM to SID rats
did not have any additive effect on reduction of liver
expression of mitochondrial BAX and BCL-XL proteins
when compared to that obtained after TEM, DES, or insulin
administration respectively (Fig. 3A and B).
Immunoblot analysis of cytosolic cytochrome c showed that
there was an increase in its release in SID rats when compared to
the control group (P!0.05), and a consequent diminution of
mitochondrial cytochrome c levels was observed when
compared to the control group. Cytosolic cytochrome
c protein levels analyzed by quantitative densitometry was
increased by 120% (P!0.05) in SID rats compared with the
control group. The levels of cytosolic cytochrome c were
decreased by treatment with insulin compared with the SID
group, thus observing the consequent increase in mitochondrial
cytochrome c. The changes produced by treatment with insulin
did not reach the values of the control group, remaining
significantly increased as compared to the control group
(P!0.05; Fig. 3C). Administration of DES or TEM also
produced a significant attenuation of cytochrome c in cytoplasm
when compared with SID, and a consequent augmentation of
mitochondrial cytochrome c levels was observed when
compared with the SID group. The changes produced by
treatment with antioxidants/hydroxyl radical scavengers did not
reach the values of the control group, remaining significantly
increased as compared to the control group (P!0.05; Fig. 3C).
Co-administration of insulin and DES or TEM to SID rats did
not have any additive effects on the reduction of cytosolic
cytochrome c compared with that obtained after TEM, DES, or
insulin administration respectively.
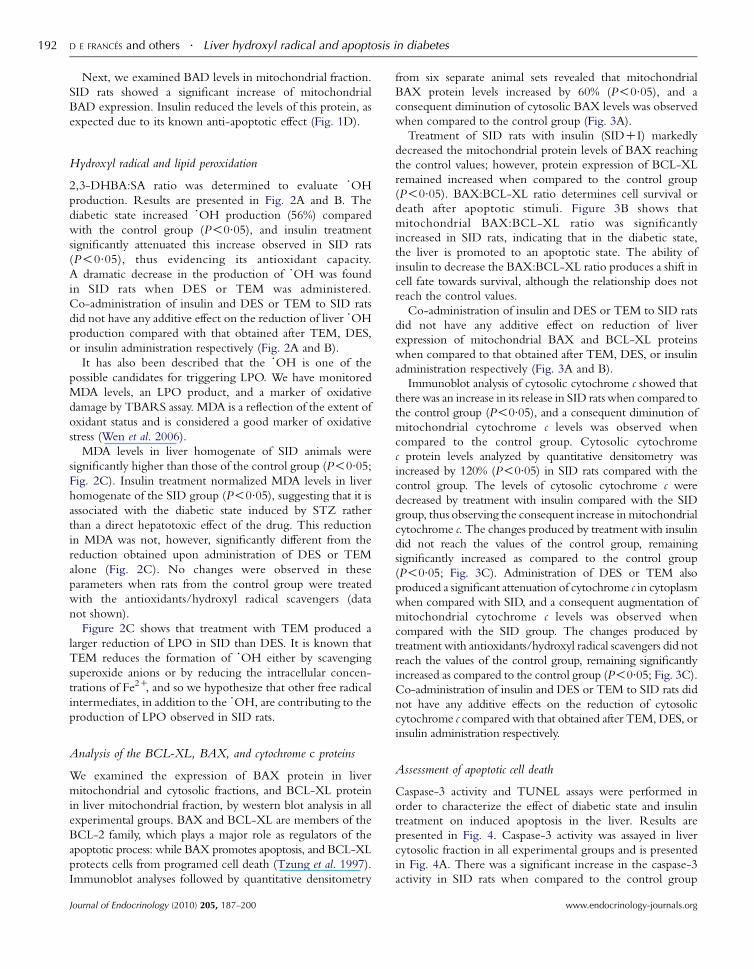
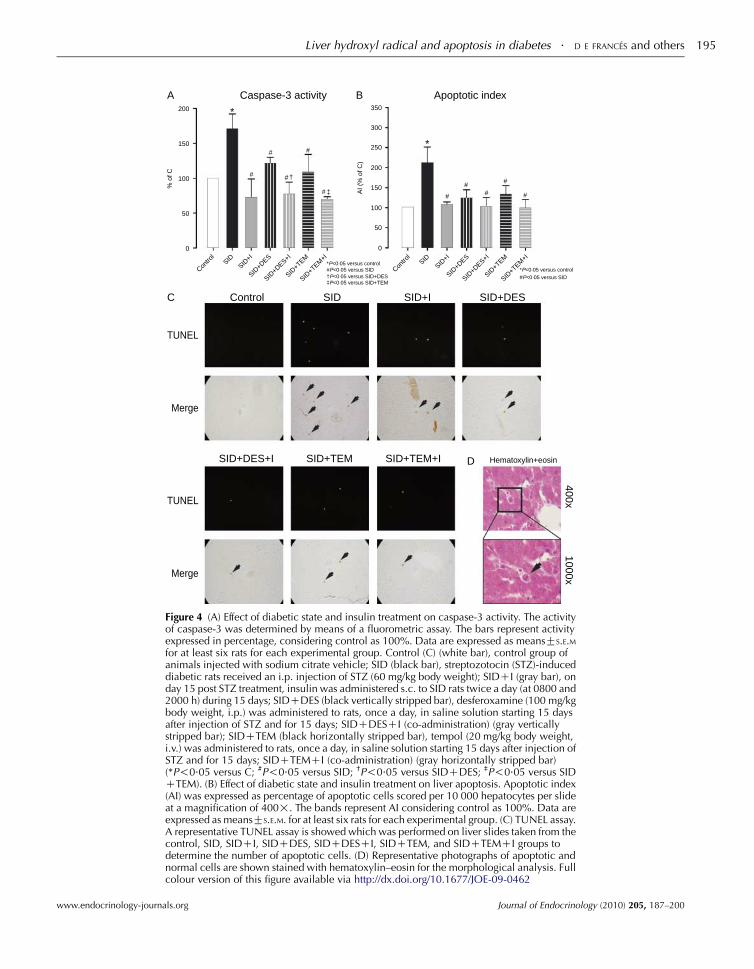
Assessment of apoptotic cell death
Caspase-3 activity and TUNEL assays were performed in
order to characterize the effect of diabetic state and insulin
treatment on induced apoptosis in the liver. Results are
presented in Fig. 4. Caspase-3 activity was assayed in liver
cytosolic fraction in all experimental groups and is presented
in Fig. 4A. There was a significant increase in the caspase-3
activity in SID rats when compared to the control group
www.endocrinology-journals.org
13·50
13·50
13·00
12·50
12·00
6·00 6·00 8·00 10·00 6·00 8·00 10·00 6·00 8·00 10·008·00 10·00
6·00 8·00 10·00 6·00 8·00 10·00 6·00 8·00 10·00
nA
13·00
12·50
12·00
nA
Min
Min
C SID
SID+DES SID+DES+I SID+TEM SID+TEM+I
SID+I
2,3-
DH
BA
- 9
·212
2,5-
DH
BA
- 6
·852
2,3-
DH
BA
- 9
·174
2,5-
DH
BA
- 6
·870
2,3-
DH
BA
- 9
·168
2,5-
DH
BA
- 6
·853
2,3-
DH
BA
- 9
·198
2,5-
DH
BA
- 6
·860
2,3-
DH
BA
- 9
·192
2,5-
DH
BA
- 6
·870
2,3-
DH
BA
- 9
·217
2,5-
DH
BA
- 6
·848
2,3-
DH
BA
- 9
·180
2,5-
DH
BA
- 6
·851
150
100
50
200
0
Contro
lSID
SID+I
SID+D
ES
SID+D
ES+I
SID+T
EM
SID+T
EM+I
Contro
lSID
SID+I
SID+D
ES
SID+D
ES+I
SID+T
EM
SID+T
EM+I
* *
## #
# # #
# ## #
HO · Production LPO0·8
0·6
0·4
0·2
0·0
U.V
.Res
pons
e (2
95nm
)
Min
SA
-26·
65
2,3-
DH
BA
/sal
icili
c ac
id r
atio
(%
of C
)
MD
A (
nmol
/mg
of p
rote
ins)
B C
Figure 2 Effect of diabetic state and insulin treatment on hydroxyl radical production.(A) Representative chromatograms of samples obtained for each experimental group aredepicted. Inset: a representative chromatogram showing the peak of salicylic acid (SA) obtainedwith u.v. detector (similar peaks were registered in the chromatograms obtained for each of theseven experimental groups). (B) Bars represent the 2,3-DHBA:SA ratio expressed as percent ofthe control group. Control (C) (white bar), control group of animals injected with sodium citratevehicle; SID (black bar), streptozotocin (STZ)-induced diabetic rats received an i.p. injection ofSTZ (60 mg/kg body weight); SIDCI (gray bar), on day 15 post STZ treatment, insulin wasadministered s.c. to SID rats twice a day (at 0800 and 2000 h) during 15 days; SIDCDES (blackvertically stripped bar), desferoxamine (100 mg/kg body weight, i.p.) was administered to rats,once a day, in saline solution starting 15 days after injection of STZ and for 15 days; SIDCDESCI (co-administration) (gray vertically stripped bar); SIDCTEM (black horizontally strippedbar), tempol (20 mg/kg body weight, i.v.) was administered to rats, once a day, in saline solutionstarting 15 days after injection of STZ and for 15 days; SIDCTEMCI (co-administration)(gray horizontally stripped bar). Data are expressed as meansGS.E.M. for at least four rats foreach experimental group. (C) Lipid peroxidation levels, expressed as nmol of MDA/mg ofprotein, were determined in liver homogenates of all experimental groups: control, SID, SIDCI,SIDCDES, SIDCDESCI, SIDCTEM, and SIDCTEMCI. Data are expressed as meanGS.E.M. forat least six rats for each experimental group. (*P!0.05 versus C; #P!0.05 versus SID).
Liver hydroxyl radical and apoptosis in diabetes . D E FRANCES and others 193
www.endocrinology-journals.org Journal of Endocrinology (2010) 205, 187–200
C SID SID+I SID SID+I SID SID+I
DES TEMC SID SID+I SID SID+I SID SID+I
DES TEM
C SID SID+I SID SID+I SID SID+I
DES TEM
C SID SID+I SID SID+I SID SID+I
DES TEM
Cytosol
Cytosol
β-Actin
Mitochondria
Mitochondria
Prohibitin
Cytosol
β-Actin
Mitochondria
CytosolMitochondria
Prohibitin
Prohibitin
- 21 kDa - 21 kDa - 12 kDa
- 43 kDa
- 12 kDa
- 32 kDa
- 32 kDa
- 27 kDa
- 32 kDa
- 43 kDa
- 21 kDa
- 32 kDa
BAX
BCL-XL
Prohibitin
*P<0·05 versus C#P<0·05 versus SID
*P<0·05 versus C#P<0·05 versus SID
100
75
50
25
0
% o
f C
% o
f C
Mito
chon
dria
l BA
X:B
CL-
XL
ratio
(% o
f C)
500
400
300
200
100
250
200
150
100
50
0
BAX BAX:BCL-XL
*P<0·05 versus C#P<0·05 versus SID
Contro
lSID
SID+I
SID+D
ES
SID+D
ES+I
SID+T
EM
SID+T
EM+I
Contro
lSID
SID+I
SID+D
ES
SID+D
ES+I
SID+T
EM
SID+T
EM+I
Cytochrome c
*
* *# #
*# *
#
*
*
*##
*#
*#
*#
*
*
#
*#*#
*# *#*#
A B C
D
Figure 3 Immunoblot analysis of pro-apoptotic and anti-apoptotic proteins in liver subcellular fractions. The results obtained for allexperimental groups are shown as follows: lane 1: control (C) (white bar), control group of animals injected with sodium citrate vehicle;lane 2: SID (black bar), streptozotocin (STZ)-induced diabetic rats received an i.p. injection of STZ (60 mg/kg body weight); lane 3:SIDCI (gray bar), on day 15 post STZ treatment, insulin was administered s.c. to SID rats twice a day (at 0800 and 2000 h) during15 days; lane 4: SIDCDES (black vertically stripped bar), desferoxamine (100 mg/kg body weight, i.p.) was administered to rats, once aday, in saline solution starting 15 days after injection of STZ and for 15 days; lane 5: SIDCDESCI (co-administration) (gray verticallystripped bar); lane 6: SIDCTEM (black horizontally stripped bar), tempol (20 mg/kg body weight, i.v.) was administered to rats, once aday, in saline solution starting 15 days after injection of STZ and for 15 days; lane 7: SIDCTEMCI (co-administration) (gray horizontallystripped bar). (A) Mitochondrial and cytosolic BAX protein expression. Typical examples of western blots are shown in top panel foreach experimental group. The accompanying bars represent the densitometry expressed in percentage from six separate animal sets,considering control as 100%. Data are expressed as meansGS.E.M. (B) Mitochondrial BCL-XL protein expression. Typical examples ofwestern blots are shown in top panel for each experimental group. The accompanying bars represent mitochondrial BAX:BCL-XL ratioexpressed as percent of the control group of the densitometry obtained for BAX and BCL-XL. Data are expressed as meansGS.E.M for atleast six rats for each experimental group. (C) Mitochondrial and cytosolic cytochrome c expression. Typical examples of western blotsare shown in top panel for each experimental group. The accompanying bars represent the densitometry expressed in percentage fromsix separate animal sets, considering control as 100%. Data are expressed as meansGS.E.M. (D) Mitochondrial and cytosolic prohibitinexpression. Typical example of western blot is shown to assess purification in differential centrifugation steps.
D E FRANCES and others . Liver hydroxyl radical and apoptosis in diabetes194
(P!0.05). The caspase-3 activity was significantly decreased
by insulin treatment when compared to SID rats (P!0.05),
while no difference was observed when compared to the
control group. By contrast, treatment with antioxidants/
hydroxyl radical scavengers resulted in a decreased casapase-3
activity although without reaching the levels of the control
group (P!0.05). Co-administration of insulin and DES or
TEM to SID rats produced a reduction of caspase-3 activity,
reaching the control values.
Diabetic state significantly increased the AI when
compared to the control group (P!0.05), while treatment
with insulin significantly attenuated the increment in this
parameter when compared to the SID group (P!0.05),
reaching the control values (Fig. 4B). Treatment with
antioxidants/hydroxyl radical scavengers resulted in a
decreased AI but without reaching the levels of the control
group. Co-administration of insulin and DES or TEM to SID
rats produced a reduction of AI, reaching the C values
(P!0.05 versus SID).
In Fig. 4C, a representative TUNEL assay for control, SID,
and SIDCI is showed. TUNEL-positive signal is maximal
in the SID group and it is clear that after insulin treatment,
Journal of Endocrinology (2010) 205, 187–200
there is a significant reduction of TUNEL-positive cells.
In hepatic tissue section, the occurrence of apoptosis was
confirmed by hematoxylin and eosin staining. Typical features
of apoptosis, such as cellular shrinking with cytoplasmic
acidophilia, condensation, and margination of the chromatin,
are shown in Fig. 4D.
In no case, the careful histological analysis of liver sections
stained with hematoxylin–eosin showed inflammatory foci
or necrosis.
Analysis of XIAP protein expression and Xiap mRNA levels
As described in the introduction and previously (Nakagami
et al. 2002, Jiang & Wang 2004), the translocation of BAX
protein into mitochondrial membrane is accompanied by
cytochrome c release from mitochondria to cytosol, which
produces a significant increase in casapase-3 activity, leading
to cell death by apoptosis. Insulin treatment produced a
significant diminution, but without reaching the control
values, in mitochondrial BAX protein and cytosolic
cytochrome c. Interestingly, the activity of caspase-3 and the
AI decreased, reaching the control values.
www.endocrinology-journals.org
% o
f C
AI (
% o
f C)
200
150
100
50
0
Contro
lSID
SID+I
SID+D
ES
Control SID SID+I SID+DES
SID+D
ES+I
SID+T
EM
SID+T
EM+I
SID+DES+I SID+TEM SID+TEM+I
Contro
lSID
SID+I
SID+D
ES
SID+D
ES+I
SID+T
EM
SID+T
EM+I
*P<0·05 versus control
†P<0·05 versus SID+DES‡P<0·05 versus SID+TEM
#P<0·05 versus SID *P<0·05 versus control#P<0·05 versus SID
TUNEL
Merge
TUNEL
Merge
400x1000x
Hematoxylin+eosin
350
300
250
200
150
100
50
0
Caspase-3 activity Apoptotic index
*
*
#
#
##
#
#
# #
#
#†
‡
A B
C
D
Figure 4 (A) Effect of diabetic state and insulin treatment on caspase-3 activity. The activityof caspase-3 was determined by means of a fluorometric assay. The bars represent activityexpressed in percentage, considering control as 100%. Data are expressed as meansGS.E.Mfor at least six rats for each experimental group. Control (C) (white bar), control group ofanimals injected with sodium citrate vehicle; SID (black bar), streptozotocin (STZ)-induceddiabetic rats received an i.p. injection of STZ (60 mg/kg body weight); SIDCI (gray bar), onday 15 post STZ treatment, insulin was administered s.c. to SID rats twice a day (at 0800 and2000 h) during 15 days; SIDCDES (black vertically stripped bar), desferoxamine (100 mg/kgbody weight, i.p.) was administered to rats, once a day, in saline solution starting 15 daysafter injection of STZ and for 15 days; SIDCDESCI (co-administration) (gray verticallystripped bar); SIDCTEM (black horizontally stripped bar), tempol (20 mg/kg body weight,i.v.) was administered to rats, once a day, in saline solution starting 15 days after injection ofSTZ and for 15 days; SIDCTEMCI (co-administration) (gray horizontally stripped bar)(*P!0.05 versus C; #P!0.05 versus SID; †P!0.05 versus SIDCDES; ‡P!0.05 versus SIDCTEM). (B) Effect of diabetic state and insulin treatment on liver apoptosis. Apoptotic index(AI) was expressed as percentage of apoptotic cells scored per 10 000 hepatocytes per slideat a magnification of 400!. The bands represent AI considering control as 100%. Data areexpressed as meansGS.E.M. for at least six rats for each experimental group. (C) TUNEL assay.A representative TUNEL assay is showed which was performed on liver slides taken from thecontrol, SID, SIDCI, SIDCDES, SIDCDESCI, SIDCTEM, and SIDCTEMCI groups todetermine the number of apoptotic cells. (D) Representative photographs of apoptotic andnormal cells are shown stained with hematoxylin–eosin for the morphological analysis. Fullcolour version of this figure available via http://dx.doi.org/10.1677/JOE-09-0462
Liver hydroxyl radical and apoptosis in diabetes . D E FRANCES and others 195
www.endocrinology-journals.org Journal of Endocrinology (2010) 205, 187–200
D E FRANCES and others . Liver hydroxyl radical and apoptosis in diabetes196
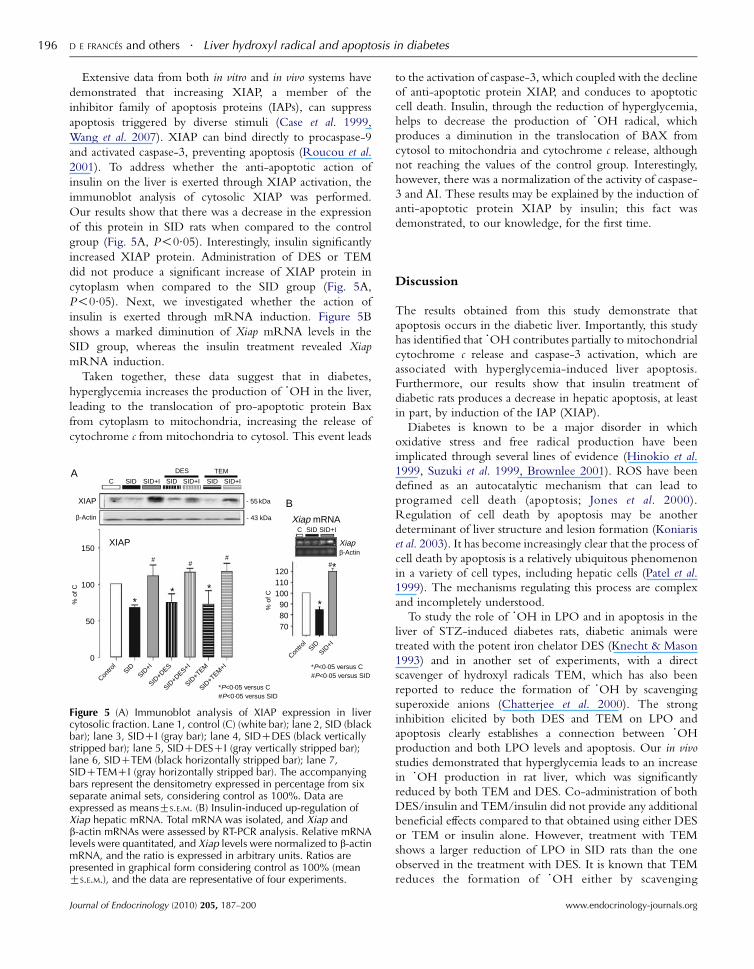
Extensive data from both in vitro and in vivo systems have
demonstrated that increasing XIAP, a member of the
inhibitor family of apoptosis proteins (IAPs), can suppress
apoptosis triggered by diverse stimuli (Case et al. 1999,
Wang et al. 2007). XIAP can bind directly to procaspase-9
and activated caspase-3, preventing apoptosis (Roucou et al.
2001). To address whether the anti-apoptotic action of
insulin on the liver is exerted through XIAP activation, the
immunoblot analysis of cytosolic XIAP was performed.
Our results show that there was a decrease in the expression
of this protein in SID rats when compared to the control
group (Fig. 5A, P!0.05). Interestingly, insulin significantly
increased XIAP protein. Administration of DES or TEM
did not produce a significant increase of XIAP protein in
cytoplasm when compared to the SID group (Fig. 5A,
P!0.05). Next, we investigated whether the action of
insulin is exerted through mRNA induction. Figure 5B
shows a marked diminution of Xiap mRNA levels in the
SID group, whereas the insulin treatment revealed Xiap
mRNA induction.
Taken together, these data suggest that in diabetes,
hyperglycemia increases the production of %OH in the liver,
leading to the translocation of pro-apoptotic protein Bax
from cytoplasm to mitochondria, increasing the release of
cytochrome c from mitochondria to cytosol. This event leads
XIAP
XIAP
C SID SID+I
C SID SID+I
SID SID+I SID SID+I
DES TEM
- 55 kDa
- 43 kDaβ-Actin
Xiap
Xiap mRNA
β-Actin150
100
50
0 Contro
lSID
SID+I
Contro
lSID
SID+I
SID+D
ES
SID+D
ES+I
SID+T
EM
SID+T
EM+I
*P<0·05 versus C#P<0·05 versus SID
*P<0·05 versus C#P<0·05 versus SID
% o
f C
% o
f C
120110100908070
*
*
***
##
##
A
B
Figure 5 (A) Immunoblot analysis of XIAP expression in livercytosolic fraction. Lane 1, control (C) (white bar); lane 2, SID (blackbar); lane 3, SIDCI (gray bar); lane 4, SIDCDES (black verticallystripped bar); lane 5, SIDCDESCI (gray vertically stripped bar);lane 6, SIDCTEM (black horizontally stripped bar); lane 7,SIDCTEMCI (gray horizontally stripped bar). The accompanyingbars represent the densitometry expressed in percentage from sixseparate animal sets, considering control as 100%. Data areexpressed as meansGS.E.M. (B) Insulin-induced up-regulation ofXiap hepatic mRNA. Total mRNA was isolated, and Xiap andb-actin mRNAs were assessed by RT-PCR analysis. Relative mRNAlevels were quantitated, and Xiap levels were normalized to b-actinmRNA, and the ratio is expressed in arbitrary units. Ratios arepresented in graphical form considering control as 100% (meanGS.E.M.), and the data are representative of four experiments.
Journal of Endocrinology (2010) 205, 187–200
to the activation of caspase-3, which coupled with the decline
of anti-apoptotic protein XIAP, and conduces to apoptotic
cell death. Insulin, through the reduction of hyperglycemia,
helps to decrease the production of %OH radical, which
produces a diminution in the translocation of BAX from
cytosol to mitochondria and cytochrome c release, although
not reaching the values of the control group. Interestingly,
however, there was a normalization of the activity of caspase-
3 and AI. These results may be explained by the induction of
anti-apoptotic protein XIAP by insulin; this fact was
demonstrated, to our knowledge, for the first time.
Discussion
The results obtained from this study demonstrate that
apoptosis occurs in the diabetic liver. Importantly, this study
has identified that %OH contributes partially to mitochondrial
cytochrome c release and caspase-3 activation, which are
associated with hyperglycemia-induced liver apoptosis.
Furthermore, our results show that insulin treatment of
diabetic rats produces a decrease in hepatic apoptosis, at least
in part, by induction of the IAP (XIAP).
Diabetes is known to be a major disorder in which
oxidative stress and free radical production have been
implicated through several lines of evidence (Hinokio et al.
1999, Suzuki et al. 1999, Brownlee 2001). ROS have been
defined as an autocatalytic mechanism that can lead to
programed cell death (apoptosis; Jones et al. 2000).
Regulation of cell death by apoptosis may be another
determinant of liver structure and lesion formation (Koniaris
et al. 2003). It has become increasingly clear that the process of
cell death by apoptosis is a relatively ubiquitous phenomenon
in a variety of cell types, including hepatic cells (Patel et al.
1999). The mechanisms regulating this process are complex
and incompletely understood.
To study the role of %OH in LPO and in apoptosis in the
liver of STZ-induced diabetes rats, diabetic animals were
treated with the potent iron chelator DES (Knecht & Mason
1993) and in another set of experiments, with a direct
scavenger of hydroxyl radicals TEM, which has also been
reported to reduce the formation of %OH by scavenging
superoxide anions (Chatterjee et al. 2000). The strong
inhibition elicited by both DES and TEM on LPO and
apoptosis clearly establishes a connection between %OH
production and both LPO levels and apoptosis. Our in vivo
studies demonstrated that hyperglycemia leads to an increase
in %OH production in rat liver, which was significantly
reduced by both TEM and DES. Co-administration of both
DES/insulin and TEM/insulin did not provide any additional
beneficial effects compared to that obtained using either DES
or TEM or insulin alone. However, treatment with TEM
shows a larger reduction of LPO in SID rats than the one
observed in the treatment with DES. It is known that TEM
reduces the formation of %OH either by scavenging
www.endocrinology-journals.org
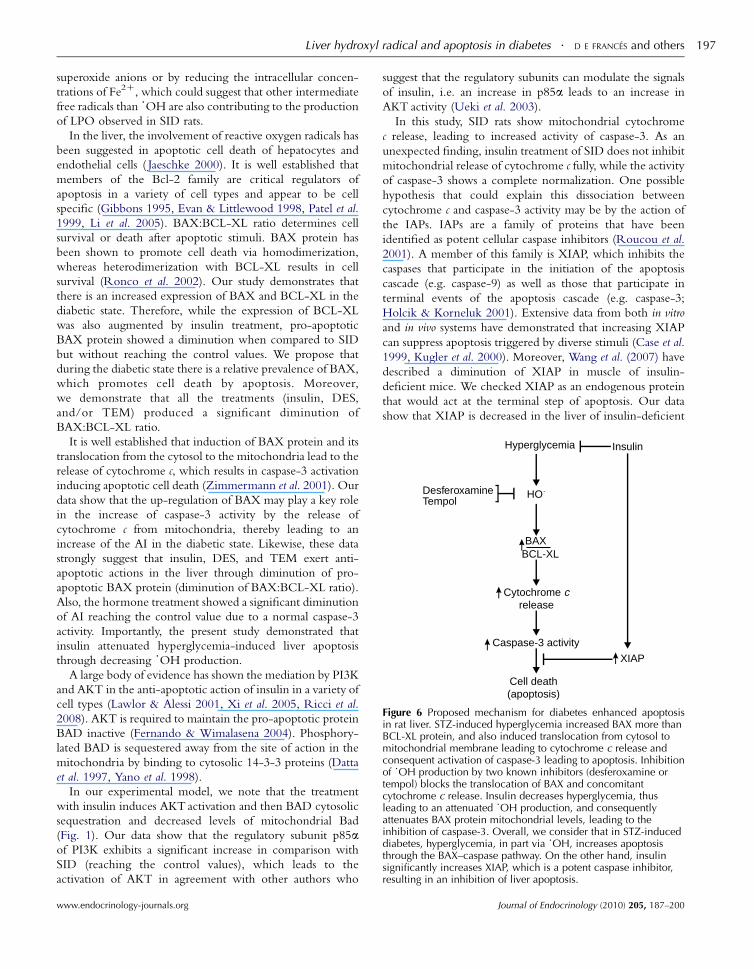
InsulinHyperglycemia
DesferoxamineTempol
BAXBCL-XL
Cytochrome crelease
Cell death(apoptosis)
XIAP
Caspase-3 activity
HO·
Figure 6 Proposed mechanism for diabetes enhanced apoptosisin rat liver. STZ-induced hyperglycemia increased BAX more thanBCL-XL protein, and also induced translocation from cytosol tomitochondrial membrane leading to cytochrome c release andconsequent activation of caspase-3 leading to apoptosis. Inhibitionof %OH production by two known inhibitors (desferoxamine ortempol) blocks the translocation of BAX and concomitantcytochrome c release. Insulin decreases hyperglycemia, thusleading to an attenuated %OH production, and consequentlyattenuates BAX protein mitochondrial levels, leading to theinhibition of caspase-3. Overall, we consider that in STZ-induceddiabetes, hyperglycemia, in part via %OH, increases apoptosisthrough the BAX–caspase pathway. On the other hand, insulinsignificantly increases XIAP, which is a potent caspase inhibitor,resulting in an inhibition of liver apoptosis.
Liver hydroxyl radical and apoptosis in diabetes . D E FRANCES and others 197
superoxide anions or by reducing the intracellular concen-
trations of Fe2C, which could suggest that other intermediate
free radicals than %OH are also contributing to the production
of LPO observed in SID rats.
In the liver, the involvement of reactive oxygen radicals has
been suggested in apoptotic cell death of hepatocytes and
endothelial cells ( Jaeschke 2000). It is well established that
members of the Bcl-2 family are critical regulators of
apoptosis in a variety of cell types and appear to be cell
specific (Gibbons 1995, Evan & Littlewood 1998, Patel et al.
1999, Li et al. 2005). BAX:BCL-XL ratio determines cell
survival or death after apoptotic stimuli. BAX protein has
been shown to promote cell death via homodimerization,
whereas heterodimerization with BCL-XL results in cell
survival (Ronco et al. 2002). Our study demonstrates that
there is an increased expression of BAX and BCL-XL in the
diabetic state. Therefore, while the expression of BCL-XL
was also augmented by insulin treatment, pro-apoptotic
BAX protein showed a diminution when compared to SID
but without reaching the control values. We propose that
during the diabetic state there is a relative prevalence of BAX,
which promotes cell death by apoptosis. Moreover,
we demonstrate that all the treatments (insulin, DES,
and/or TEM) produced a significant diminution of
BAX:BCL-XL ratio.
It is well established that induction of BAX protein and its
translocation from the cytosol to the mitochondria lead to the
release of cytochrome c, which results in caspase-3 activation
inducing apoptotic cell death (Zimmermann et al. 2001). Our
data show that the up-regulation of BAX may play a key role
in the increase of caspase-3 activity by the release of
cytochrome c from mitochondria, thereby leading to an
increase of the AI in the diabetic state. Likewise, these data
strongly suggest that insulin, DES, and TEM exert anti-
apoptotic actions in the liver through diminution of pro-
apoptotic BAX protein (diminution of BAX:BCL-XL ratio).
Also, the hormone treatment showed a significant diminution
of AI reaching the control value due to a normal caspase-3
activity. Importantly, the present study demonstrated that
insulin attenuated hyperglycemia-induced liver apoptosis
through decreasing %OH production.
A large body of evidence has shown the mediation by PI3K
and AKT in the anti-apoptotic action of insulin in a variety of
cell types (Lawlor & Alessi 2001, Xi et al. 2005, Ricci et al.
2008). AKT is required to maintain the pro-apoptotic protein
BAD inactive (Fernando & Wimalasena 2004). Phosphory-
lated BAD is sequestered away from the site of action in the
mitochondria by binding to cytosolic 14-3-3 proteins (Datta
et al. 1997, Yano et al. 1998).
In our experimental model, we note that the treatment
with insulin induces AKT activation and then BAD cytosolic
sequestration and decreased levels of mitochondrial Bad
(Fig. 1). Our data show that the regulatory subunit p85aof PI3K exhibits a significant increase in comparison with
SID (reaching the control values), which leads to the
activation of AKT in agreement with other authors who
www.endocrinology-journals.org
suggest that the regulatory subunits can modulate the signals
of insulin, i.e. an increase in p85a leads to an increase in
AKT activity (Ueki et al. 2003).
In this study, SID rats show mitochondrial cytochrome
c release, leading to increased activity of caspase-3. As an
unexpected finding, insulin treatment of SID does not inhibit
mitochondrial release of cytochrome c fully, while the activity
of caspase-3 shows a complete normalization. One possible
hypothesis that could explain this dissociation between
cytochrome c and caspase-3 activity may be by the action of
the IAPs. IAPs are a family of proteins that have been
identified as potent cellular caspase inhibitors (Roucou et al.
2001). A member of this family is XIAP, which inhibits the
caspases that participate in the initiation of the apoptosis
cascade (e.g. caspase-9) as well as those that participate in
terminal events of the apoptosis cascade (e.g. caspase-3;
Holcik & Korneluk 2001). Extensive data from both in vitro
and in vivo systems have demonstrated that increasing XIAP
can suppress apoptosis triggered by diverse stimuli (Case et al.
1999, Kugler et al. 2000). Moreover, Wang et al. (2007) have
described a diminution of XIAP in muscle of insulin-
deficient mice. We checked XIAP as an endogenous protein
that would act at the terminal step of apoptosis. Our data
show that XIAP is decreased in the liver of insulin-deficient
Journal of Endocrinology (2010) 205, 187–200
D E FRANCES and others . Liver hydroxyl radical and apoptosis in diabetes198
rat (SID group, Fig. 5). Also, we found that the treatment
with insulin increases the XIAP expression levels by inducing
its mRNA (Fig. 5).
This is the first study to show that insulin has anti-apoptotic
action, at least in part, through XIAP induction in rat liver.
Other authors had reported that XIAP is stabilized via the
activation of AKT in Kupffer cells (Ashare et al. 2007).
Moreover, XIAP is known to be phosphorylated at serine
87 by Akt, and this phosphorylation stabilizes the protein
(Dan et al. 2004). In this sense, our results show increased
phosphorylation of AKT in insulin-treated groups, con-
tributing probably to XIAP stabilization.
Taken together, our findings demonstrate that insulin
treatment impairs the increase of %OH production generated
by the diabetic state in the rat liver. High levels of this reactive
species play an important role in the increase of hepatic LPO
observed in the diabetic state, and finally lead to increased
pro-apoptotic events by altering the fine balance between the
expression of pro-apoptotic and anti-apoptotic proteins.
The relative concentration of these proteins is an essential
determinant of their final impact on cell fate, and promotion
of pro-apoptotic events plays a central role in the
development of liver complications in diabetes. Importantly,
this study demonstrates that insulin reduced %OH levels
caused by hyperglycemia and exhibited an attenuation of the
translocation of BAX to the mitochondria, partially affecting
the release of mitochondrial cytochrome c to cytoplasm and
preventing the activation of caspase-3 producing a slight
anti-apoptotic effect.Interestingly, we also show that another
way in which insulin exerts its anti-apoptotic action is due to
its ability to increase the expression of XIAP protein that
appears to be independent of the generation of %OH.
Only the insulin treatment, but not the antioxidants/
hydroxyl radical scavenger ones, results in the reversal of the
alterations observed in the diabetic state as reduced PI3K,
increased mitochondrial BAD, and decreased XIAP. On the
other hand, all treatments lead to a reversal of the alterations
observed in the diabetic state as increased %OH production,
LPO levels, increased BAX:BCL-XL ratio, increased cyto-
chrome c release from the mitochondria, augmentation of
cytochrome c, and increase of AI.
Overall, we demonstrated that hyperglycemia enhances%OH levels, induction of BAX protein, and translocation of
BAX from cytosol to the mitochondria, leading to the release
of cytochrome c and consequent activation of caspase-3 with
resultant apoptosis. Insulin leads to a decrease of %OH levels,
which produces a slight reduction of BAX:BCL-XL ratio,
leading to a mild diminution of cytochrome c release from
mitochondria to cytosol, and a significant decrease in both
caspase-3 activity and AI. Only insulin increases IAP
expression (XIAP; Fig. 6).
Taken together, our study demonstrates a partial
contribution of %OH in hyperglycemia-induced liver
apoptosis, which may contribute to the disease process in
diabetic liver. Also, a new anti-apoptotic signal for insulin is
shown, given by an increase in XIAP expression. The control
Journal of Endocrinology (2010) 205, 187–200
of hepatic %OH production and XIAP levels in the diabetic
state could be of therapeutic relevance for improvement
or delay of the hepatic complications linked to chronic
hyperglycemia.
Declaration of interest
The authors declare that there is no conflict of interest that could be perceived
as prejudicing the impartiality of the research reported.
Funding
This work was supported by research grants from ANPCyT (PICT no. 32413,
CEC) and from CONICET (PIP no. 5531, CEC).
Acknowledgements
We especially wish to thank Marcelo Luquita for his technical assistance
in performing the HPLC assays. We also thank Bioq. Cecilia Basiglio for
English revision.
References
Ashare A, Monick MM, Nymon AB, Morrison JM, Noble M, Powers LS,
Yarovinsky TO, Yahr TL & Hunninghake GW 2007 Pseudomonas
aeruginosa delays Kupffer cell death via stabilization of the X-chromosome-
linked inhibitor of apoptosis protein. Journal of Immunology 179 505–513.
Barneo L, Esteban MM, Garcia-Pravia C, Diaz F & Marin B 1990
Normalization of the altered liver function tests after islet transplantation in
diabetic rats. Diabetes & Metabolism 16 284–289.
Bell DS & Allbright E 2007 The multifaceted associations of hepatobiliary
disease and diabetes. Endocrine Practice 13 300–312.
Brownlee M 2001 Biochemistry and molecular cell biology of diabetic
complications. Nature 414 813–820.
Carnovale CE & Rodriguez Garay EA 1984 Reversible impairment of
hepatobiliary function induced by streptozotocin in the rat. Experientia
40 248–250.
Carnovale CE, Marinelli RA & Rodriguez Garay EA 1986 Bile flow decrease
and altered bile composition in streptozotocin-treated rats. Biochemical
Pharmacology 35 2625–2628.
Case SS, Price MA, Jordan CT, Yu XJ, Wang L, Bauer G, Haas DL, Xu D,
Stripecke R, Naldini L et al. 1999 Stable transduction of quiescent
CD34(C)CD38(K) human hematopoietic cells by HIV-1-based lentiviral
vectors. PNAS 96 2988–2993.
Chatila R & West AB 1996 Hepatomegaly and abnormal liver tests due to
glycogenosis in adults with diabetes. Medicine 75 327–333.
Chatterjee PK, Cuzzocrea S, Brown PA, Zacharowski K, Stewart KN,
Mota-Filipe H & Thiemermann C 2000 Tempol, a membrane-permeable
radical scavenger, reduces oxidant stress-mediated renal dysfunction and
injury in the rat. Kidney International 58 658–673.
Dan HC, Sun M, Kaneko S, Feldman RI, Nicosia SV, Wang HG, Tsang BK &
Cheng JQ 2004 Akt phosphorylation and stabilization of X-linked
inhibitor of apoptosis protein (XIAP). Journal of Biological Chemistry 279
5405–5412.
Datta SR, Dudek H, Tao X, Masters S, Fu H, Gotoh Y & Greenberg ME
1997 Akt phosphorylation of BAD couples survival signals to the
cell-intrinsic death machinery. Cell 91 231–241.
Evan G & Littlewood T 1998 A matter of life and cell death. Science 281
1317–1322.
Fernandes AA, Novelli EL, Okoshi K, Okoshi MP, Muzio BP, Guimaraes JF &
Junior AF 2009 Influence of rutin treatment on biochemical alterations
in experimental diabetes. Biomedicine and Pharmacotherapy 64 214–219.
www.endocrinology-journals.org
Liver hydroxyl radical and apoptosis in diabetes . D E FRANCES and others 199
Fernando RI & Wimalasena J 2004 Estradiol abrogates apoptosis in breast
cancer cells through inactivation of BAD: Ras-dependent nongenomic
pathways requiring signaling through ERK and Akt. Molecular Biology of the
Cell 15 3266–3284.
Fraser A & Evan G 1996 A license to kill. Cell 85 781–784.
Galetic I, Andjelkovic M, Meier R, Brodbeck D, Park J & Hemmings BA
1999 Mechanism of protein kinase B activation by insulin/insulin-like
growth factor-1 revealed by specific inhibitors of phosphoinositide 3-kinase
– significance for diabetes and cancer. Pharmacology & Therapeutics 82
409–425.
Gibbons GH 1995 Mechanisms of vascular remodeling in hypertension: role
of autocrine-paracrine vasoactive factors. Current Opinion in Nephrology and
Hypertension 4 189–196.
Gold R, Schmied M, Giegerich G, Breitschopf H, Hartung HP, Toyka KV &
Lassmann H 1994 Differentiation between cellular apoptosis and necrosis by
the combined use of in situ tailing and nick translation techniques.
Laboratory Investigation 71 219–225.
Green DR & Reed JC 1998 Mitochondria and apoptosis. Science 281
1309–1312.
Grootveld M & Halliwell B 1986 Aromatic hydroxylation as a potential
measure of hydroxyl-radical formation in vivo. Identification of
hydroxylated derivatives of salicylate in human body fluids. Biochemical
Journal 237 499–504.
Ha H, Kim C, Son Y, Chung MH & Kim KH 1994 DNA damage in the
kidneys of diabetic rats exhibiting microalbuminuria. Free Radical Biology
and Medicine 16 271–274.
Harrison SA, Brunt EM, Goodman ZD & Di Bisceglie AM 2006 Diabetic
hepatosclerosis: diabetic microangiopathy of the liver. Archives of Pathology
and Laboratory Medicine 130 27–32.
Hinokio Y, Suzuki S, Hirai M, Chiba M, Hirai A & Toyota T 1999 Oxidative
DNA damage in diabetes mellitus: its association with diabetic
complications. Diabetologia 42 995–998.
Holcik M & Korneluk RG 2001 XIAP, the guardian angel. Nature Reviews.
Molecular Cell Biology 2 550–556.
Hwang HJ, Kim SW, Lim JM, Joo JH, Kim HO, Kim HM & Yun JW 2005
Hypoglycemic effect of crude exopolysaccharides produced by a medicinal
mushroom Phellinus baumii in streptozotocin-induced diabetic rats. Life
Sciences 76 3069–3080.
Jaeschke H 2000 Reactive oxygen and mechanisms of inflammatory liver
injury. Journal of Gastroenterology and Hepatology 15 718–724.
Jiang X & Wang X 2004 Cytochrome C-mediated apoptosis. Annual Review of
Biochemistry 73 87–106.
Jones BE, Lo CR, Liu H, Pradhan Z, Garcia L, Srinivasan A, Valentino KL &
Czaja MJ 2000 Role of caspases and NF-kappaB signaling in hydrogen
peroxide- and superoxide-induced hepatocyte apoptosis. American Journal of
Physiology. Gastrointestinal and Liver Physiology 278 G693–G699.
Karunanayake EH, Hearse DJ & Mellows G 1974 The synthesis of [14C]
streptozotocin and its distribution and excretion in the rat. Biochemical
Journal 142 673–683.
Katso R, Okkenhaug K, Ahmadi K, White S, Timms J & Waterfield MD
2001 Cellular function of phosphoinositide 3-kinases: implications for
development, homeostasis, and cancer. Annual Review of Cell and
Development Biology 17 615–675.
Kaur H & Halliwell B 1994 Detection of hydroxyl radicals by aromatic
hydroxylation. Methods in Enzymology 233 67–82.
Kiritoshi S, Nishikawa T, Sonoda K, Kukidome D, Senokuchi T, Matsuo T,
Matsumura T, Tokunaga H, Brownlee M & Araki E 2003 Reactive oxygen
species from mitochondria induce cyclooxygenase-2 gene expression in
human mesangial cells: potential role in diabetic nephropathy. Diabetes 52
2570–2577.
Klainguti M, Aigner S, Kilo J, Eppenberger HM, Mandinova A, Aebi U,
Schaub MC, Shaw SG, Luscher TF & Atar D 2000 Lack of nuclear
apoptosis in cardiomyocytes and increased endothelin-1 levels in a rat heart
model of myocardial stunning. Basic Research in Cardiology 95 308–315.
Knecht KT & Mason RP 1993 In vivo spin trapping of xenobiotic free radical
metabolites. Archives of Biochemistry and Biophysics 303 185–194.
Koniaris LG, McKillop IH, Schwartz SI & Zimmers TA 2003 Liver
regeneration. Journal of the American College of Surgeons 197 634–659.
www.endocrinology-journals.org
Kugler S, Straten G, Kreppel F, Isenmann S, Liston P & Bahr M 2000 The
X-linked inhibitor of apoptosis (XIAP) prevents cell death in axotomized
CNS neurons in vivo. Cell Death and Differentiation 7 815–824.
Laaksonen DE, Atalay M, Niskanen L, Uusitupa M, Hanninen O & Sen CK
1996 Increased resting and exercise-induced oxidative stress in young
IDDM men. Diabetes Care 19 569–574.
Lawlor MA & Alessi DR 2001 PKB/Akt: a key mediator of cell proliferation,
survival and insulin responses? Journal of Cell Science 114 2903–2910.
Li H, Telemaque S, Miller RE & Marsh JD 2005 High glucose inhibits
apoptosis induced by serum deprivation in vascular smooth muscle cells via
upregulation of Bcl-2 and Bcl-xl. Diabetes 54 540–545.
Liu X, Kim CN, Yang J, Jemmerson R & Wang X 1996 Induction of
apoptotic program in cell-free extracts: requirement for dATP and
cytochrome c. Cell 86 147–157.
Lowry OH, Rosebrough NJ, Farr AL & Randall RJ 1951 Protein measurement
with the Folin phenol reagent. Journal of Biological Chemistry 193 265–275.
Marangiello R & Giorgetti R 1996 A case of glycogenosis in a patient with
insulin dependent diabetes. Minerva Pediatrica 48 279–281.
McLennan SV, Heffernan S, Wright L, Rae C, Fisher E, Yue DK & Turtle JR
1991 Changes in hepatic glutathione metabolism in diabetes. Diabetes 40
344–348.
Moreira PI, Rolo AP, Sena C, Seica R, Oliveira CR & Santos MS 2006
Insulin attenuates diabetes-related mitochondrial alterations: a comparative
study. Medicinal Chemistry 2 299–308.
Nakagami H, Morishita R, Yamamoto K, Taniyama Y, Aoki M, Yamasaki K,
Matsumoto K, Nakamura T, Kaneda Y & Ogihara T 2002 Hepatocyte
growth factor prevents endothelial cell death through inhibition of
bax translocation from cytosol to mitochondrial membrane. Diabetes 51
2604–2611.
Nawano M, Ueta K, Oku A, Arakawa K, Saito A, Funaki M, Anai M, Kikuchi
M, Oka Y & Asano T 1999 Hyperglycemia impairs the insulin signaling
step between PI3-kinase and Akt/PKB activations in ZDF rat liver.
Biochemical and Biophysical Research Communications 266 252–256.
Nishikawa T, Edelstein D, Du XL, Yamagishi S, Matsumura T, Kaneda Y,
Yorek MA, Beebe D, Oates PJ, Hammes HP et al. 2000 Normalizing
mitochondrial superoxide production blocks three pathways of
hyperglycaemic damage. Nature 404 787–790.
Ohkawa H, Ohishi N & Yagi K 1979 Assay for lipid peroxides in animal tissues
by thiobarbituric acid reaction. Analytical Biochemistry 95 351–358.
Ohkuwa T, Sato Y & Naoi M 1995 Hydroxyl radical formation in diabetic rats
induced by streptozotocin. Life Sciences 56 1789–1798.
Park KS, Kim JH, Kim MS, Kim JM, Kim SK, Choi JY, Chung MH, Han B,
Kim SY & Lee HK 2001 Effects of insulin and antioxidant on plasma
8-hydroxyguanine and tissue 8-hydroxydeoxyguanosine in
streptozotocin-induced diabetic rats. Diabetes 50 2837–2841.
Patel T, Steer CJ & Gores GJ 1999 Apoptosis and the liver: a mechanism of
disease, growth regulation, and carcinogenesis. Hepatology 30 811–815.
Porte D Jr & Schwartz MW 1996 Diabetes complications: why is glucose
potentially toxic? Science 272 699–700.
Pryor WA & Godber SS 1991 Noninvasive measures of oxidative stress status
in humans. Free Radical Biology and Medicine 10 177–184.
Ricci C, Jong CJ & Schaffer SW 2008 Proapoptotic and antiapoptotic effects
of hyperglycemia: role of insulin signaling. Canadian Journal of Physiology and
Pharmacology 86 166–172.
Ronco MT, deAlvarez ML, Monti J, Carrillo MC, Pisani G, Lugano MC &
Carnovale CE 2002 Modulation of balance between apoptosis and
proliferation by lipid peroxidation (LPO) during rat liver regeneration.
Molecular Medicine 8 808–817.
Ronco MT, Alvarez ML, Monti JA, Carrillo MC, Pisani GB, Lugano MC &
Carnovale CE 2004 Role of nitric oxide increase on induced
programmed cell death during early stages of rat liver regeneration.
Biochimica et Biophysica Acta 1690 70–76.
Ronco MT, Frances DE, Ingaramo PI, Quiroga AD, Alvarez ML, Pisani GB,
Revelli SS & Carnovale CE 2009 Tumor necrosis factor alpha induced by
Trypanosoma cruzi infection mediates inflammation and cell death in the
liver of infected mice. Cytokine 49 64–72.
Roucou X, Antonsson B & Martinou JC 2001 Involvement of mitochondria
in apoptosis. Cardiology Clinics 19 45–55.
Journal of Endocrinology (2010) 205, 187–200
D E FRANCES and others . Liver hydroxyl radical and apoptosis in diabetes200
Saxena AK, Srivastava P, Kale RK & Baquer NZ 1993 Impaired antioxidant
status in diabetic rat liver. Effect of vanadate. Biochemical Pharmacology 45
539–542.
Shepherd PR, Withers DJ & Siddle K 1998 Phosphoinositide 3-kinase:
the key switch mechanism in insulin signalling. Biochemical Journal 333
471–490.
Suzuki S, Hinokio Y, Komatu K, Ohtomo M, Onoda M, Hirai S, Hirai M,
Hirai A, Chiba M, Kasuga S et al. 1999 Oxidative damage to mitochondrial
DNA and its relationship to diabetic complications. Diabetes Research and
Clinical Practice 45 161–168.
Tsai LY, Lee KT & Liu TZ 1998 Evidence for accelerated generation of
hydroxyl radicals in experimental obstructive jaundice of rats. Free Radical
Biology and Medicine 24 732–737.
Tzung SP, Fausto N & Hockenbery DM 1997 Expression of Bcl-2 family
during liver regeneration and identification of Bcl-x as a delayed early
response gene. American Journal of Pathology 150 1985–1995.
Ueki K, Fruman DA, Yballe CM, Fasshauer M, Klein J, Asano T, Cantley LC
& Kahn CR 2003 Positive and negative roles of p85 alpha and p85 beta
regulatory subunits of phosphoinositide 3-kinase in insulin signaling.
Journal of Biological Chemistry 278 48453–48466.
Virkamaki A, Ueki K & Kahn CR 1999 Protein–protein interaction in insulin
signaling and the molecular mechanisms of insulin resistance. Journal of
Clinical Investigation 103 931–943.
Wang XH, Hu J, Du J & Klein JD 2007 X-chromosome linked inhibitor
of apoptosis protein inhibits muscle proteolysis in insulin-deficient mice.
Gene Therapy 14 711–720.
Wen JJ, Yachelini PC, Sembaj A, Manzur RE & Garg NJ 2006 Increased
oxidative stress is correlated with mitochondrial dysfunction in chagasic
patients. Free Radical Biology and Medicine 41 270–276.
West IC 2000 Radicals and oxidative stress in diabetes. Diabetic Medicine 17
171–180.
Journal of Endocrinology (2010) 205, 187–200
Winiarska K, Drozak J, Wegrzynowicz M, Fraczyk T & Bryla J 2004
Diabetes-induced changes in glucose synthesis, intracellular glutathione
status and hydroxyl free radical generation in rabbit kidney-cortex tubules.
Molecular and Cellular Biochemistry 261 91–98.
Xi X, Gao L, Hatala DA, Smith DG, Codispoti MC, Gong B, Kern TS &
Zhang JZ 2005 Chronically elevated glucose-induced apoptosis is mediated
by inactivation of Akt in cultured Muller cells. Biochemical and Biophysical
Research Communications 326 548–553.
Yamamoto H, Watanabe T, Mizuno H, Endo K, Hosokawa T, Kazusaka A,
Gooneratne R & Fujita S 2001 In vivo evidence for accelerated generation
of hydroxyl radicals in liver of Long-Evans Cinnamon (LEC) rats with acute
hepatitis. Free Radical Biology and Medicine 30 547–554.
Yang J, Liu X, Bhalla K, Kim CN, Ibrado AM, Cai J, Peng TI, Jones DP &
Wang X 1997 Prevention of apoptosis by Bcl-2: release of cytochrome c
from mitochondria blocked. Science 275 1129–1132.
Yano S, Tokumitsu H & Soderling TR 1998 Calcium promotes cell survival
through CaM-K kinase activation of the protein-kinase-B pathway. Nature
396 584–587.
Young IS & Trimble ER 1991 Measurement of malondialdehyde in plasma by
high performance liquid chromatography with fluorimetric detection.
Annals of Clinical Biochemistry 28 504–508.
Zimmermann KC, Bonzon C & Green DR 2001 The machinery of
programmed cell death. Pharmacology and Therapeutics 92 57–70.
Received in final form 11 February 2010Accepted 17 February 2010Made available online as an Accepted Preprint17 February 2010
www.endocrinology-journals.org
Related Documents