Journal of Empirical Generalisations in Marketing Science, Volume One, 1996. Page 1 A Critique and Revision of the Multidimensional Ethics Scale Michael R. Hyman Associate Professor of Marketing New Mexico State University College of Business Administration and Marketing Box 30001, Dept. 5280 Las Cruces, NM 88003-8001 Voice Phone: (505) 522-8463 Fax: (505) 646-1498 E-mail: [email protected] Abstract The Multidimensional Ethics Scale is an eight-item, three-subscale measure developed in Reidenbach and Robin (1990) and subsequently applied in at least ten empirical studies of business ethics. Despite two failed replication studies and two skeptical critiques, business ethics researchers continue to use the scale. Given the lingering uncertainty about the scale and its continued use in empirical research, a definitive critique and revalidation study is warranted. After an examination of the previously published works and new criticisms of Reidenbach and Robin (1990), a revalidation study sensitive to these criticisms is described. Then, a revised, fourteen- item, five-subscale measure is presented. Results of confirmatory factor analyses and tests of predictive validity against three univariate ethics measures show the superior predictive and face validities of this revised measure. Such critique and revalidation studies, by ensuring the continuing soundness of scales created for use in empirical research, certify the tools that marketing scholars use to create marketing knowledge.

Welcome message from author
This document is posted to help you gain knowledge. Please leave a comment to let me know what you think about it! Share it to your friends and learn new things together.
Transcript

Journal of Empirical Generalisations in Marketing Science, Volume One, 1996. Page 1
A Critique and Revision of theMultidimensional Ethics Scale
Michael R. Hyman
Associate Professor of Marketing
New Mexico State University
College of Business Administration and Marketing
Box 30001, Dept. 5280
Las Cruces, NM 88003-8001
Voice Phone: (505) 522-8463
Fax: (505) 646-1498
E-mail: [email protected]
AbstractThe Multidimensional Ethics Scale is an eight-item, three-subscale measure
developed in Reidenbach and Robin (1990) and subsequently applied in at least ten
empirical studies of business ethics. Despite two failed replication studies and two
skeptical critiques, business ethics researchers continue to use the scale. Given the
lingering uncertainty about the scale and its continued use in empirical research, a
definitive critique and revalidation study is warranted. After an examination of the
previously published works and new criticisms of Reidenbach and Robin (1990), a
revalidation study sensitive to these criticisms is described. Then, a revised, fourteen-
item, five-subscale measure is presented. Results of confirmatory factor analyses and
tests of predictive validity against three univariate ethics measures show the superior
predictive and face validities of this revised measure. Such critique and revalidation
studies, by ensuring the continuing soundness of scales created for use in empirical
research, certify the tools that marketing scholars use to create marketing knowledge.
Journal of Empirical Generalisations in Marketing Science, Volume One, 1996. Page 2
IntroductionAre published empirical studies of business ethics problematic? Two reviews of
empirical articles on business ethics published since 1961, Randall & Gibson (1990) and
Weber (1992), agree that most articles “expressed no concern for the reliability or
validity of measures . . . and do not offer a theoretical framework” (Randall & Gibson
1990, p.471). A review of the marketing ethics literature, Tsalikis & Fritzsche (1989),
argues1 that the scientific study of marketing ethics would improve if researchers stopped
using unreliable, univariate measures of ethicality. The Multidimensional Ethics Scale
(henceforth MES), an eight-item, three-subscale measure developed in Reidenbach &
Robin (1990) and subsequently applied in at least ten empirical studies, appeared to help
business ethics researchers address these measurement concerns.
Are published empirical studies based on the MES problematic? Two failed
replication studies of the MES (Cohen, Pant, & Sharp 1993; Hansen 1992) and two
skeptical critiques of the MES (Jones & Ponemon 1993; Skipper & Hyman 1993) throw
the results of such studies into question. Unfortunately, as evidenced by eight empirical
studies published since these replication studies and critiques appeared, business–
especially marketing–ethics researchers continue to use all or part of the MES.
Furthermore, Drs. Reidenbach and Robin continue to champion the original MES
(Reidenbach & Robin 1993, 1995; Flory, Phillips, Reidenbach, & Robin 1993).
Given the lingering uncertainty about the MES and its continued use in empirical
research, a definitive critique and revalidation study is warranted. The exposition
proceeds as follows. First, new and previously published criticisms of the MES are
examined. Second, an effort to revalidate Reidenbach & Robin (1990), with an item pool
and analyses sensitive to criticisms of Reidenbach & Robin (1990) and the MES, is
described. Third, a revised version of the MES is presented and evaluated, one that also
addresses the measurement concerns expressed by Randall & Gibson (1990), Tsalikis &
Fritzsche (1989), and Weber (1992).
Some readers may view the attending to detail, especially in summarizing previously
published criticisms of the MES, as nit-picking. These readers might argue that scale
validators should focus on essential issues such as reliability (e.g., longitudinal stability,
internal consistency) and validity (e.g., predictive, external). Although a good scale must
have these psychometric properties, a scale is only as good as its weakest buttress. As
with all scale development, the devil is in the psychometric details. This psychometric
critique and revision shows the importance of the following details to sound scale
development:

Journal of Empirical Generalisations in Marketing Science, Volume One, 1996. Page 3
(1) constructing scales that exhaustively cover the construct domain;
(2) creating item pools that reflect the perspective of typical respondents rather than
the perspective of subject matter experts;
(3) creating semantically-unambiguous item pools;
(4) normalizing often-skewed response data prior to performing multivariate
analyses;
(5) avoiding degrees of freedom problems in multivariate analyses;
(6) using more than between-respondent variance to signal item importance; and
(7) accessing scale reliability across an adequate range of situations.
Inattention to these details compromised the psychometric integrity of the MES.
Inattention to other details could reduce the psychometric integrity of any new measure.
The overarching goal here is to increase researchers’ sensitivity to the requisite
psychometric details of proper scale development.
Previously Published and New Criticisms of the MESTable 1 summarizes previously published and new criticisms of the MES. These
criticisms are sorted into four groups: (1) ambiguous items, (2) scale development, (3)
factor structure, and (4) omitted ethical rationales. These criticisms are now detailed.Table 1
Problems with the MESProblem Source
Ambiguous MES Items
Contractualism scales are double-barreled SH93
Contradictories rather than contraries anchor three scale items SH93
Researcher-intended perspective is omitted (e.g., target is unspecified inviolates/does not violate an unspoken promise)
SH93
Meaning of acceptable to family item is ambiguous SH93
Univariate ethics scale is incomplete; unknown if all respondents believescenario portrays ethically problematic action
SH93
Scale Development
Item creation process is inconsistent with Churchill (1979) CA; SH93
Item distillation process is inconsistent with Churchill (1979) CA
Strictly factor-analysis-based item distillation process can neglectimportant judgment criteria
SH93

Journal of Empirical Generalisations in Marketing Science, Volume One, 1996. Page 4
Table 1Problems with the MES
Responses to pool items and MES are highly skewed, yet data notnormalized prior to running factor analyses
CA; JP93;SH93
To split the second stage distillation sample (Reidenbach & Robin 1990)into two groups of 54 respondents caused a degrees of freedom problem
CA
Factor Structure of the MES
Replication results are mixed CA
Factor structure may be an artifact of non-randomly selected respondents’characteristics
CPS93; JP93
High reliability may be an artifact of minimal differences in the ethicalityof calibration scenarios
JP93; SH93
Omitted Ethical Rationales
MES does not correspond to normative ethical philosophies CPS93; HA92;SH93
MES lacks utilitarianism and egoism components CPS93; HA92;SH93
MES lacks religion and Golden Rule components SH93
MES lacks a deontology component HA92
Key to Article Abbreviations:CA = current articleCPS93 = Cohen, Pant, & Sharp (1993)
HA92 = Hansen (1992) JP93 = Jones & Ponemon (1993)
SH93 = Skipper & Hyman (1993)
Ambiguous Scale Items
Skipper & Hyman (1993) argues that the semantic-differential items in the MES (and,
by implication, other pool items considered in Reidenbach & Robin 1990) are ambiguous
in five ways. First, the two contractualism items of the MES are double-barreled; for
example, to answer violates/does not violate an unwritten contract assumes a Yes answer
to Does a contract exist? Second, contradictories (i.e., X versus non-X) rather than
contraries (i.e., opposites) anchor three items (i.e., morally/not morally right;
violates/does not violate an unwritten contract; violates/does not violate an unspoken
promise); because the bipolar adjectives that anchor semantic-differential items should be
contraries (e.g., morally- right/morally-wrong), these MES items are misshaped
(Kerlinger 1979). Third, the researcher-intended perspective is omitted; for example, the
target is unspecified in violates/does not violate an unspoken promise and the culture is
unspecified in culturally acceptable/ unacceptable. Fourth, the meaning of a response to

Journal of Empirical Generalisations in Marketing Science, Volume One, 1996. Page 5
acceptable/unacceptable to my family is ambiguous because my family may deem an
action unacceptable, but I may disapprove of my family’s values. Given the likelihood of
rebellion against parental values by often-surveyed college students, this ambiguity is
noteworthy.
Finally, the univariate ethics scale used in Reidenbach & Robin (1990) and
subsequent studies to show the predictive validity of the MES is incomplete; respondents
will reply similarly (i.e., the scale midpoint) whether they hold indifferent beliefs about a
scenario or believe that it lacks ethical undertones.2 An exhaustive univariate ethics
scale would include the reply No Ethical Issue Involved because some respondents will
fail to sense a scenario poses an ethical dilemma. Without this response category, the
behavioral intent scale used to validate the MES (i.e., It is highly probable/improbable
that I would act this way) also becomes problematic.
Problematic Scale Development
Item Creation and Distillation Processes Inconsistent with Churchill (1979).
Reidenbach & Robin (1990) states “the development of the multidimensional [ethics]
scale followed the procedures outlined by . . . Churchill (1979)” (p.641). However, the
item creation and distillation processes described in Reidenbach & Robin (1990) differs
from the scale development method delineated in Churchill (1979).
The Reidenbach & Robin (1990) item pool was suggested by five moral philosophies.
Skipper & Hyman (1993) argues that moral philosophies provide only one source of pool
items; another important source is the general public. Because pool items for the MES
were inspired by moral philosophies rather than by the general public, the MES may
neglect current societal norms (e.g., contrary to caveat emptor; contrary to maintaining
good karma).
Under purification of measures, Churchill (1979) writes:
Coefficient alpha absolutely should be the first measure one calculates
to assess the quality of the instrument. . . . Some analysts like to
perform a factor analysis on the data before doing anything else . . . .
[but] theoretical arguments support the iterative process of the
calculation of coefficient alpha, the elimination of items, and the
subsequent calculation of alpha until a satisfactory coefficient is
achieved. Factor analysis can then be used to confirm whether the
number of dimensions conceptualized can be verified empirically
(pp.68-69).
In Reidenbach & Robin (1990), a 29-item pool was distilled into eight items via a two-
stage, strictly factor-analysis-based procedure; the first stage purged fifteen items and the

Journal of Empirical Generalisations in Marketing Science, Volume One, 1996. Page 6
second stage purged six items. Reidenbach & Robin (1990) states that the a priori
criteria used to develop objective decision rules for reviewing factor patterns and deleting
items were
(1) consistency of the loadings across all scale/scenario data sets; (2)
size of the loadings for each structure set; [and] (3) low inter-item
correlations with other dimension items (p.642).
Reidenbach & Robin (1990) only reports coefficient alphas for the three sets of items that
survived this review process. Thus, Reidenbach & Robin (1990) follows neither the item
creation nor item distillation processes delineated in Churchill (1979). (Note: The
appendix further shows the limitations of strictly factor-analysis-based item distillation
procedures.)
Skewed Data. Both Jones & Ponemon (1993) and Skipper & Hyman (1993) imply that
MES items (and, by implication, many Reidenbach & Robin (1990) pool items) produce
skewed data. Jones & Ponemon (1993) posits that the MES triggers a contrast effect,
which is described as “when an attitudinal statement . . . is within a subject’s bounds of
rejection, the attitude represented is rejected with more vigor than is warranted by the
true position of the subject” (p.414). Skipper & Hyman (1993) argues that factor analysis
accounts for variability, rather than agreement, among responses; as a result, a strictly
factor-analysis-based distillation process will ignore items on which many respondents
agree–items that seemingly belong in the MES. If either Jones & Ponemon (1993) or
Skipper & Hyman (1993) is correct, then many Reidenbach & Robin (1990) pool items
produce highly skewed data. This is shown to be the case.
It is well known that researchers should avoid factor analyses on highly skewed data;
such data should be transformed first (Cureton & D’Agostino 1983; Tabachnick & Fidell
1983; Rummel 1970). Cureton & D’Agostino (1983) notes that the product-moment
correlation for two highly skewed measures reflects the strength and the skewness of the
true relation between these measures; the correlation is lower (higher) than the strength of
the true relation if both measures are skewed in the same (opposite) direction. If many
Reidenbach & Robin (1990) pool items are highly skewed, then the MES may be an
artifact of running factor analyses on distorted correlation matrices.
Degrees of Freedom Problem. In Reidenbach & Robin (1990), the second stage
distillation sample is split into two groups of 54 respondents, which causes a degrees of
freedom problem by creating a less than 2-to-1 respondent-to-item ratio. Although
Reidenbach & Robin (1990) reports that respondents were split for two reasons–to test
Likert-scaled versus semantic-differential versions of pool items and to test for
convergent validity–Hair et al. (1995) suggests that

Journal of Empirical Generalisations in Marketing Science, Volume One, 1996. Page 7
the minimum is to have at least five times as many observations as there
are variables to be analyzed, and the more acceptable range would be a
ten-to-one ratio (p.373).
Factor Structure of the MES
The MES in Prior Empirical Studies. Table 2 profiles twenty-one published studies in
which researchers used all/most of the Reidenbach & Robin (1990) item pool (eight
studies), the MES (ten studies), or an abridged MES (three studies). Regarding the
predominant types of scenarios used, ten studies used retailing/sales scenarios only, and
four studies used advertising scenarios. Regarding the predominant samples used, four
studies relied on a probability sample and eight studies relied on a student sample only.Table 2
Empirical Studies Using Reidenbach & Robin (1988) Items,the MES, or an Abridged MES
Article ItemsUsed
Scenarios/Stimuli Used Data Collection Method,Sample Type, Sample Size,and Response Rate
SeparateMoralEquity &RelativismFactors
Barnett,Bass, &Brown(1994)
3moralequityitems
26; one-to-three sentence,mostly-marketingscenarios, used in eightprevious studies
Convenience sample of 166business students at a mid-sized university in southernU.S.
Notapplicable
Clark &Dawson(1996)
MES 3; retailing scenarios fromReidenbach, Robin, &Dawson (1991)
Convenience sample of 144students at a mid-sizeduniversity in southern U.S.
For 3 of 3scenarios
Cohen, Pant,& Sharp(1993)
33items
7; Reidenbach & Robin(1990) retailing scenariosand four accountingscenarios for main study;three Reidenbach & Robin(1990) retailing scenariosfor item reduction phase
(a) Item reduction: 92 businessstudents at a selective privateuniversity(b) Study: mail survey of 113accounting academics(response rate was 37%)
No
Fernandez,Plank, &Landeros(1995)
MES 1; salesperson who asksbuyer for bid information inreturn for $100 donation tobuyer’s favorite charity(unknown length)
Mail survey of 162 NationalAssociation of PurchasingManagement members(response rate was 34.1%)
Yes (usedcompositescore of all 8items)

Journal of Empirical Generalisations in Marketing Science, Volume One, 1996. Page 8
Table 2Empirical Studies Using Reidenbach & Robin (1988) Items,
the MES, or an Abridged MESFlory,Phillips,Reidenbach,& Robin(1992)
MES 4; 200-word scenariosbased on IMA videotapeportraying 5 ethically-problematic situations
Pretest via statewide CPAorganization; mail survey of314 certified managementaccountants (response rate was62.8%)
For 4 of 4scenarios
Hansen(1992)
33items
3; failing to make fulldisclosures of damaginginformation
Convenience sample of 128marketing students at a largesoutheastern university in U.S.
No
Henthorne &LaTour(1995)
MES Subjects saw black andwhite ad for jeans whichcontained substantial eroticcontent and nudity
Mall intercept of 103 adults(in mid-gulf coast region ofU.S.)
No
Henthorne,Robin, &Reidenbach(1992)
MES 3; Reidenbach & Robin(1990) retailing scenarios
(a) Administered survey of206 association members and105 retail managers(b) Administered survey of160 meeting attendees, 100auto salespeople, and 69 directmarketing sales reps
Assumed(attempt toconfirmunreported)
Humphreys,Robin,Reidenbach,& Moak(1993)
MES 4; food service (retailing)scenarios about managerwho lies to customer,owner who fails to correctunintended deception,owner who knowingviolates state labor law, andowner who trainsemployees to short changecustomers
(a) Administered survey of 96small business owner/managers (attendees ofregional food conference andregional food products/equipment trade show, andNJ/PA food retailers)(b) Convenience sample of103 consumers from twoNJ/PA retail locations
For 4 of 4scenariosand bothsamples
LaFleur,Reidenbach,Robin, &Forrest(1996)
MES 2; two and five sentencescenarios on deception andhost selling in ads forchildren
Mail survey of 251 membersof a national advertisingassociation
For 2 of 2scenarios
LaTour &Henthorne(1994)
MES na Mall intercept of 199 adults inmid-gulf coast region of U.S.
No (singlefactorsolution)

Journal of Empirical Generalisations in Marketing Science, Volume One, 1996. Page 9
Table 2Empirical Studies Using Reidenbach & Robin (1988) Items,
the MES, or an Abridged MESReidenbach& Robin(1988)
33items
3; car warranty, overeagersalesperson, and grocerscenarios from Dornoff &Tankersley (1975)
Convenience sample of 218marketing students at theUniversity of Mississippi
No
Reidenbach& Robin(1990)
33items
3; Reidenbach & Robin(1988) retailing scenarios
Administered survey of 108retail owner/managers and 105small business operators
For 3 of 3scenarios
Reidenbach,Robin, &Dawson(1991)
MES 8; Reidenbach & Robin(1990) retailing scenariosand five additional scenar-ios about high pressuresales tactics, misleading anappraiser, taking kickbacks,misleading the customer,and product substitutionunknown by customer
(a) Mail survey of 152 retailmanagers(b) Administered survey of 70auto sales personnel at weeklysales meeting, 70 directmarketers, and 160 book repsat national sales meeting
In 10 of 15cases (inother fivecases,factors #1and #2merge)
Reidenbach,Robin, &Forrest(1996)
4moralequityitems
2; two and five sentencescenarios on deception andhost selling in ads forchildren
Mail survey of 251 membersof a regional advertisingassociation
NA
Tansey,Brown,Hyman, &Dawson(1994)
MES 2; deceitful sales practicesby a life insurance agent
Convenience sample of 104life insurance agents whoattended a company meeting
No (singlefactorsolution forall 8 items)
Tansey,Hyman, &Brown(1992)
6moralequityandrela-tivismitems
5; use of ads depictingcombat by Red Cross toincrease blood donations,military to recruit, TVnetworks to promote newsshows, and firms topromote themselves
Convenience sample of 124business majors at a largepublic university in southernU.S.
No (singlefactorsolution)
Tsalikis &LaTour(1995)
20itemsubset
3; scenarios from Tsalikis& Nwachukwu (1991)(substituted Greek forNigerian as actor)
Convenience sample of 240U.S. business students fromTsalikis & Nwachukwu(1991); convenience sample of204 Greek economics students
NA(summeditems bycategory(e.g.,justice))

Journal of Empirical Generalisations in Marketing Science, Volume One, 1996. Page 10
Table 2Empirical Studies Using Reidenbach & Robin (1988) Items,
the MES, or an Abridged MESTsalikis &Ortiz-Buonafina(1990)
29itemsubset
4; retail grocer scenariofrom Reidenbach & Robin(1990) and three otherretailing scenarios fromDornoff & Tankersley(1975)
Convenience sample of 175business students at a majoruniversity in south Florida
NA(summeditems bycategory(e.g.,justice))
Tsalikis &Nwachukwu(1988)
32itemsubset
2; overeager salespersonand retail grocer scenariosused in Reidenbach &Robin (1990) (fromReidenbach & Robin 1988)
Convenience samples ofmarketing students: 221 at amostly white university insouthern U.S. and 236 at amostly black university ineastern U.S.
5 factors forwhitesample, 6factors forblack sample
Tsalikis &Nwachukwu(1991)
20itemsubset
3; native/foreignbusinessman offering abribe to native/foreigngovernment official
Convenience sample of 240business students at a majoruniversity in Mississippi;convenience sample of 180students at the University ofLagos in Nigeria
NA(summeditems bycategory(e.g.,justice))
Note: na = not availableNA = not applicable
Of fifteen empirical studies in which responses to all/some of the Reidenbach &
Robin (1990) item pool were subjected to factor analysis, five used the entire item pool,
nine used the MES, and one used an abridged MES. In the first group of five studies,
only Reidenbach & Robin (1990) reports the MES-inspiring three factor solution; the
other four studies (including Reidenbach & Robin 1988, the precursor of Reidenbach &
Robin 1990) report five and six factor solutions.3 In the second group of nine studies, six
report the MES solution, but five of these studies were coauthored by Dr. Reidenbach
and/or Dr. Robin and/or their coauthor on a MES-based study. In one abridged MES
study, the moral equity and relativistic items loaded on one factor.4
Hence, only one of eight MES-based studies not coauthored by Dr. Reidenbach
and/or Dr. Robin and/or their coauthors (i.e., Fernandez, Plank, & Landeros 1995)
yielded the MES-inspiring, three-factor solution.5 Table 2 shows that finding the MES
solution is unrelated to scenario context (e.g., retailing, personal selling) or sample size,
but weakly related to the respondent group surveyed (i.e., four of nine non-student studies
reported this solution). Thus, the MES solution is most strongly related to study
authorship.

Journal of Empirical Generalisations in Marketing Science, Volume One, 1996. Page 11
Factor Structure an Artifact of Respondent Characteristics. Cohen, Pant, & Sharp
(1993) and Jones & Ponemon (1993) suggest that the MES-inspiring, three-factor
solution is an artifact of surveying members of professional associations, businesspeople,
or students from the southern U.S. However, the use of non-probability samples for scale
development is acceptable (Churchill 1979; Flory et al. 1993); thus, this criticism should
be discounted.
High Reliability an Artifact of Similar Calibration Scenarios. Jones & Ponemon
(1993) and Skipper & Hyman (1993) posit that the high reliability of the MES is an
artifact of minimal differences in the ethicality of calibration scenarios; overlooked in
Reidenbach & Robin (1990) are highly unethical, ethically positive, and ethically
ambiguous scenarios. Flory et al. (1993), the rejoinder to Jones & Ponemon (1993),
argues that to assume the professional ethical code of accountants’ (i.e., respondents in
Flory et al. 1992) mandates their ethical judgments is to make an ‘is-ought’ mistake;
because accountants’ ethical judgments are not dictated by their professional ethical code,
the calibration scenarios were adequate. Even if true, the argument in Flory et al. (1993)
is superfluous to the calibration concerns broached by Jones & Ponemon (1993) and
Skipper & Hyman (1993).
Important Ethical Rationales Omitted
Cohen, Pant, & Sharp (1993), Hansen (1992), and Skipper & Hyman (1993) question
the face validity of the MES based on its non-correspondence with normative ethical
philosophies. Rejoinders by Drs. Reidenbach and Robin to this question include (1) the
parsimony and usability of the MES (Reidenbach & Robin 1993), (2) the positive rather
than normative nature of the MES (Reidenbach & Robin 1993), and (3) the high percent
of variance in a univariate ethics measure explained by the MES (Reidenbach & Robin
1995). Upon scrutiny, however, all these rejoinders seem superfluous to this face validity
question.
The MES Lacks a Utilitarian Component. Reidenbach & Robin (1990) states that “All
references to cost/benefit types of ethical calculus were purged on the basis of minimal
contribution to explanatory power. . . . Moreover, respondents had a difficult time in
understanding and applying the concepts inherent in utilitarian thinking” (p.647). Cohen,
Pant, & Sharp (1994), Hansen (1992), and Skipper & Hyman (1993) question this
outcome. Cohen, Pant, & Sharp (1993) argues that “utilitarianism . . . is very amenable
to the cost-benefit principle which permeates accountants’ decisions” (p.14) and notes
that managers who participated in prior studies “predominantly follow a utilitarian
approach to ethical decision making” (p.14); the empirical analyses yielded a utilitarian

Journal of Empirical Generalisations in Marketing Science, Volume One, 1996. Page 12
factor for five of six scenarios. The teleological judgment factor reported in Hansen
(1992) includes three utilitarian items.
Hansen (1992) also reports a deontological judgment factor. In response to Hansen
(1992), Reidenbach & Robin (1993) argues that the fifteen-item, four-factor solution in
Hansen (1992) neither does “a better job predicting ethical judgments or intentions” than
the MES (p.663) nor “significantly improve[s] the reliability of the scales” (p.664). This
rejoinder is superfluous because it addresses predictive validity rather than face validity.
The MES Lacks a Religion Component. Reidenbach & Robin (1990) argues that
“some secular notions can be found in religions; so there must be no important, uniquely
religious norms” (Skipper & Hyman 1993, p.540). Skipper & Hyman (1993) replies that
a face-valid MES would include a religion component because the large memberships of
organized religions “is a strong prima facie reason to think that uniquely religious
concepts–eternal damnation, original sin . . . and so forth–may influence real-world moral
decisions” (p.540). An empirical study, Clark & Dawson (1996), reports that religious
beliefs influence ethical judgments. Even Reidenbach & Robin (1993) and Reidenbach
& Robin (1995) agree; both suggest that researchers should focus on “amplifying the
scales with new items. . . . that acknowledge the influence of religious beliefs”
(Reidenbach & Robin 1993, p.664).
The MES Lacks Other Ethical Components. Cohen, Pant, & Sharp (1993), Hansen
(1992), and Skipper & Hyman (1993) suspect the lack of an egoism component, and
Skipper & Hyman (1993) suspects the lack of a Golden Rule (i.e., “Do unto others . . .”)
component. Common sense also suggests that a comprehensive MES would include
these components.
The Empirical StudyInstrument and Sample
Table 3 lists the revised item pool, disambiguated in accord with the concerns
expressed in Skipper & Hyman (1993); the matching scales from Reidenbach & Robin
(1990) are also listed. Seven-point, Likert-scaled items, anchored by the adjectives
strongly agree and strongly disagree, were evaluated because they are easy for
respondents to understand, easy for researchers to use, and Reidenbach & Robin (1990)
reports no difference between the Likert-scaled and semantic-differential versions of pool
items. (Note: All items included an eighth, non-ordinal scale point labeled Not
applicable/No opinion.) Items numbered 1 to 27, 29, and 30, are disambiguated versions
of items in Reidenbach & Robin (1990). Items 31 to 33 are new items about religion and

Journal of Empirical Generalisations in Marketing Science, Volume One, 1996. Page 13
the Golden Rule. Although other items were considered, such as In the agent’s best
interest, more new items would threaten the primary goal: a revalidation of Reidenbach
& Robin (1990). (Note: There is no analogous item to Reidenbach & Robin (1990) item
28 because pretest respondents could not differentiate the disambiguated version from
revised item 13.)Table 3
Original and Revised Item PoolItem Revised Item Pool Reidenbach & Robin (1990) Item Pool
The actor’s (e.g., sales manager’s) action . . .
Justice Scales
1 Was unjust to the receiver (e.g.,customer)
Just/Unjust
2 Was fair to the receiver (e.g., customer) Fair/Unfair
3 Results in an equal distribution of goodand bad
Does Result/Does Not Result in an equaldistribution of good and bad
Relativist Scales
4 Was culturally acceptable in this country(e.g., the U.S.)
Culturally Acceptable/Unacceptable
5 Was acceptable to me Individually Acceptable/Unacceptable
6 Was acceptable to the people I mostadmire
Acceptable/Unacceptable to people Iadmire most
7 Was traditionally acceptable in thiscountry (e.g., the U.S.)
Traditionally Acceptable/Unacceptable
8 Was acceptable to my family (of whosevalues I approve)
Acceptable/Unacceptable to my family
Egoism Scales
9 Was self promoting for the actor (e.g.,sales manager)
Self Promoting/Not Self Promoting
10 Was selfish for the actor (e.g., salesmanager)
Selfish/Not Selfish
11 Was self sacrificing for the actor (e.g.,sales manager)
Self Sacrificing/Not Self Sacrificing
12 Was prudent for the actor (e.g., salesmanager)
Prudent/Not Prudent
13 Was unacceptable because the actor(e.g., sales manager) was morallyobligated to act otherwise
Under no moral obligation/Morallyobligated to act otherwise

Journal of Empirical Generalisations in Marketing Science, Volume One, 1996. Page 14
Table 3Original and Revised Item Pool
14 Was personally satisfying to the actor(e.g., sales manager)
Personally Satisfying/Not PersonallySatisfying
15 Was in the best interest of the actor’s(e.g., sales manager’s) company
In the best interests of the company/Notin the best interests of the company
Utilitarian Scales
16 Was efficient Efficient/Inefficient
17 Was OK because action can be justifiedby its consequences
OK/Not OK if actions can be justified bytheir consequences
Utilitarian Scales (continued)
18 Compromises an important rule bywhich I live
Compromises/Does Not Compromise animportant rule by which I live
19 On balance, tends to be good On balance, tends to be Good/Bad
20 Produces the greatest total utility Produces the Greatest/Least utility
21 Maximizes benefits while minimizesharm
Maximizes/Minimizes benefits whileMinimizing/Maximizing harm
22 Leads to the greatest good for thegreatest number
Leads to the Greatest/Least good for thegreatest number
23 Results in a positive cost-benefit ratio Results in a Positive/Negative cost-benefit ratio
24 Maximizes total pleasure Maximizes/Minimizes pleasure
Deontology Scales
25 Violates an unwritten contract with thereceiver (e.g., customer)
Violates/Does Not Violate an unwrittencontract
26 Violates my ideas of fairness Violates/Does Not Violate my ideas offairness
27 Was OK because the actor (e.g., salesmanager) is duty bound to act this way
Duty Bound/Not Duty Bound to act thisway
28 None Morally Right/Not Morally Right

Journal of Empirical Generalisations in Marketing Science, Volume One, 1996. Page 15
Table 3Original and Revised Item Pool
29 Was OK because the actor (e.g., salesmanager) is obligated to act this way
Obligated/Not Obligated to act this way
30 Violates an unspoken promise to thereceiver (e.g., customer)
Violates/Does Not Violate an unspokenpromise
Additional Items
31 Violates my religious beliefs None
32 Violates the teachings of most religions None
33 Violates the Golden Rule (“Do untoothers . . .”)
None
Univariate Items
Thinking about the actor’s (e.g., sales manager’s) action . . .
34 It was unethical (includes additionalcategory “Not an Ethical Issue”)
Unethical/Ethical
35 I would probably act this way Highly Probable/Improbable (I would actthis way)
36 Others would probably act this way None
Respondents were selected from a convenience sample of students–predominantly
upper-division undergraduates–attending a land-grant university in the southwestern U.S.
(Again, as noted in Churchill (1979), the use of such samples for scale development is
acceptable.) Two sets of respondents were queried: one set in Summer 1995 (n=161) and
one set in Fall 1995 (n=120). Figure 1 lists the scenarios evaluated by respondents. The
three scenarios used in Summer 1995 (henceforth S1a, S2a, and S3a) are essentially the
retailing scenarios in Reidenbach & Robin (1990). The three scenarios used in Fall 1995
(henceforth S1b, S2b, and S3b) are altered versions of the Summer 1995 scenarios. In
S2a the owners of the grocery chain are African-Americans, but in S1a the ethnicity of
the owners is unspecified. In S2b the salesperson is female, but in S2a the salesperson is
male. In S3b the dealer charged half price for parts and labor, but in S3a the dealer
changed full price for parts and labor. The three new, yet similar, scenarios provide
additional cases for scale development and confirmatory factor analysis. Furthermore,
pretest respondents generally found the altered versions more ethically problematic (i.e.,
less ethically homogeneous than the unaltered versions).

Journal of Empirical Generalisations in Marketing Science, Volume One, 1996. Page 16
Figure 1Scenario-Action Pairs
Scenario: (An African-American owned) A retail grocery chain operates several storesthroughout the local area, including one in the city’s ghetto area. Independentstudies have shown that prices tend to be higher and there is less of a selectionof products in the ghetto-area store than in the other stores.
Action: On the day that welfare checks are received in this ghetto area, the retailer increases prices on all merchandise in the ghetto-area store.
Scenario: A young (woman) man, recently hired as a (saleswoman) salesman for a localretail store, has been working very hard to impress (her) his boss. At times, this young (woman) man, anxious for an order, has been a little over-eager. To get the order, (she) he exaggerates the value of the item or withholds relevant information concerning the product (she) he is trying to sell. No fraud or deceit is intended by (her) his actions; (she) he is simply over-eager.
Action: (Her) His boss, the owner of the store, is aware of (her) the salesman’sactions, but has done nothing to stop such practices.
Scenario: A man bought a new car from a franchised automobile dealership in the local area. Eight months after the car was purchased, he began having problems with the transmission. He took the car back to the dealer, and some minor adjustments were made. During the next few months, he continually had similar problems with the transmission. Each time the dealer made only minoradjustments to the car. During the thirteenth month after he bought the car, theman returned to the dealer because the transmission still functioned improperly. At that time, the transmission was completely overhauled.
Action: Because the warranty was only for one year (12 months from the date of purchase), the dealer charged (one-half) full price for parts and labor.
Note: Versions 1a, 2a, and 3a correspond to the underlined words; versions 1b, 2b, and 3b correspond to the parenthetical bolded words.
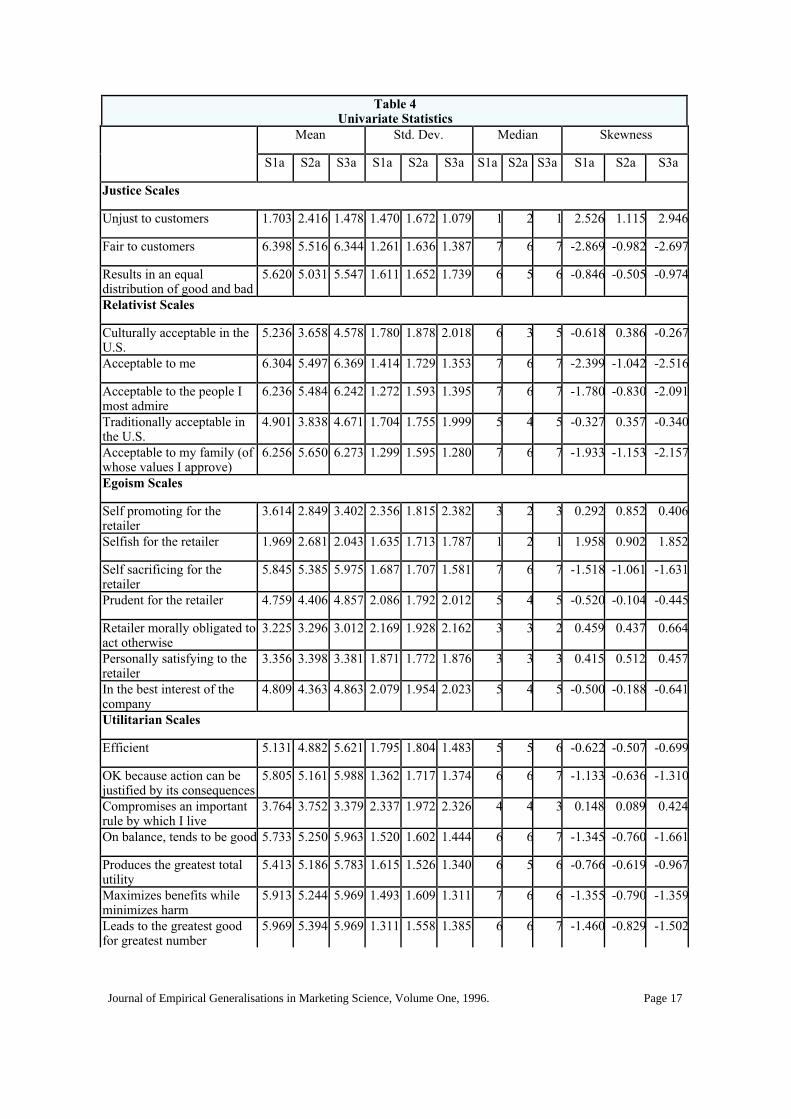
Skewness of Item Pool Data
For the seven-point, Likert-scaled items used to evaluate S1a, S2a, and S3a, (1) the
percent of pool items with means less than 2.0 or greater than 5.5 is 46.9 percent, 9.4
percent, and 59.4 percent, respectively; (2) the percent of pool items with medians of 1, 2,
6, or 7 is 65.6 percent, 53.1 percent, and 71.9 percent, respectively; (3) the mean absolute
skewness for pool items is 1.10, 0.68, and 1.26, respectively; and (4) the percent of pool
items with skewness exceeding + 1 is 46.8 percent, 25.0 percent, and 53.1 percent,
respectively. (See Table 4 for a univariate statistical summary.) Hair et al. (1995) states
that “Skewness values falling outside the range of -1 to +1 indicate a substantially
skewed distribution” (p.35). On this basis, responses to many items are judged highly
skewed; thus, data was normalized before factor analyses were run.
Journal of Empirical Generalisations in Marketing Science, Volume One, 1996. Page 17
Table 4Univariate Statistics
Mean Std. Dev. Median Skewness
S1a S2a S3a S1a S2a S3a S1a S2a S3a S1a S2a S3a
Justice Scales
Unjust to customers 1.703 2.416 1.478 1.470 1.672 1.079 1 2 1 2.526 1.115 2.946
Fair to customers 6.398 5.516 6.344 1.261 1.636 1.387 7 6 7 -2.869 -0.982 -2.697
Results in an equaldistribution of good and bad
5.620 5.031 5.547 1.611 1.652 1.739 6 5 6 -0.846 -0.505 -0.974
Relativist Scales
Culturally acceptable in theU.S.
5.236 3.658 4.578 1.780 1.878 2.018 6 3 5 -0.618 0.386 -0.267
Acceptable to me 6.304 5.497 6.369 1.414 1.729 1.353 7 6 7 -2.399 -1.042 -2.516
Acceptable to the people Imost admire
6.236 5.484 6.242 1.272 1.593 1.395 7 6 7 -1.780 -0.830 -2.091
Traditionally acceptable inthe U.S.
4.901 3.838 4.671 1.704 1.755 1.999 5 4 5 -0.327 0.357 -0.340
Acceptable to my family (ofwhose values I approve)
6.256 5.650 6.273 1.299 1.595 1.280 7 6 7 -1.933 -1.153 -2.157
Egoism Scales
Self promoting for theretailer
3.614 2.849 3.402 2.356 1.815 2.382 3 2 3 0.292 0.852 0.406
Selfish for the retailer 1.969 2.681 2.043 1.635 1.713 1.787 1 2 1 1.958 0.902 1.852
Self sacrificing for theretailer
5.845 5.385 5.975 1.687 1.707 1.581 7 6 7 -1.518 -1.061 -1.631
Prudent for the retailer 4.759 4.406 4.857 2.086 1.792 2.012 5 4 5 -0.520 -0.104 -0.445
Retailer morally obligated toact otherwise
3.225 3.296 3.012 2.169 1.928 2.162 3 3 2 0.459 0.437 0.664
Personally satisfying to theretailer
3.356 3.398 3.381 1.871 1.772 1.876 3 3 3 0.415 0.512 0.457
In the best interest of thecompany
4.809 4.363 4.863 2.079 1.954 2.023 5 4 5 -0.500 -0.188 -0.641
Utilitarian Scales
Efficient 5.131 4.882 5.621 1.795 1.804 1.483 5 5 6 -0.622 -0.507 -0.699
OK because action can bejustified by its consequences
5.805 5.161 5.988 1.362 1.717 1.374 6 6 7 -1.133 -0.636 -1.310
Compromises an importantrule by which I live
3.764 3.752 3.379 2.337 1.972 2.326 4 4 3 0.148 0.089 0.424
On balance, tends to be good 5.733 5.250 5.963 1.520 1.602 1.444 6 6 7 -1.345 -0.760 -1.661
Produces the greatest totalutility
5.413 5.186 5.783 1.615 1.526 1.340 6 5 6 -0.766 -0.619 -0.967
Maximizes benefits whileminimizes harm
5.913 5.244 5.969 1.493 1.609 1.311 7 6 6 -1.355 -0.790 -1.359
Leads to the greatest goodfor greatest number
5.969 5.394 5.969 1.311 1.558 1.385 6 6 7 -1.460 -0.829 -1.502

Journal of Empirical Generalisations in Marketing Science, Volume One, 1996. Page 18
Table 4Univariate Statistics
Results in a positive cost-benefit ratio
5.210 4.918 5.625 1.621 1.615 1.553 5 5 6 -0.602 -0.350 -0.884
Maximizes total pleasure 5.366 4.932 5.700 1.752 1.670 1.640 6 5 6 -0.991 -0.551 -1.240
Deontology Scales
Violates an unwrittencontract with customers
2.547 2.494 2.144 1.823 1.652 1.762 2 2 1 1.046 1.159 1.678
Violates my ideas of fairness 1.831 2.621 1.894 1.446 1.900 1.645 1 2 1 1.955 1.039 2.114
Retailer is duty bound to actthis way
5.681 5.491 5.683 1.556 1.526 1.766 6 6 6 -1.130 -0.903 -1.377
Retailer is obligated to actthis way
5.845 5.644 5.776 1.456 1.531 1.771 6 6 7 -1.154 -1.170 -1.514
Violates an unspokenpromise to customers
2.384 2.550 1.925 1.626 1.790 1.495 2 2 1 0.972 1.073 1.754
Additional Items
Violates my religious beliefs 3.365 3.665 3.177 1.907 1.950 1.849 4 4 4 0.330 0.163 0.373
Violates teachings of mostreligions
3.044 3.556 3.158 1.681 1.929 1.761 3 4 4 0.399 0.228 0.422
Violates the Golden Rule(“Do unto others . . .”)
2.585 2.994 2.633 1.822 1.947 1.845 2 3 2 1.630 0.624 0.959
Univariate Items
Unethical 2.012 2.727 1.862 1.597 1.927 1.617 1 2 1 1.630 0.963 1.920
I would probably act thisway
6.174 5.776 6.236 1.507 1.508 1.353 7 6 7 -2.144 -1.240 -2.108
Others would probably actthis way
4.087 3.602 3.944 1.667 1.570 1.683 4 4 4 -0.115 0.083 0.066
Tabachnick & Fidell (1983) suggests normalizing moderately and positively skewed
data with a square root transformation and normalizing highly and positively skewed data
with a logarithmic transformation; for negatively skewed data, reverse score the data and
apply the transformation for positively skewed data. Rummel (1970) gives several log
and arcsin transformations for normalizing distributions of different degree and direction
of skewness and kurtosis. Both SPSS and SAS offer the Blom transformation for
normalizing skewed data. Cureton & D’Agostino (1983) describes the following mean
method for “normal-standardizing” Likert-type scales:
first divide a unit-normal distribution into segments with areas
proportional to the frequencies of the original score-groups. . . . [This]
puts each z at the mean of the corresponding segment, where z is the
standard-score distance from the mean of the whole distribution . . . to
the mean of the segment (p.128).
Because it is specific to Likert-scaled data, the mean method was applied.
Journal of Empirical Generalisations in Marketing Science, Volume One, 1996. Page 19
As evidence of diverse responses to the MES, Flory et al. (1993) states that all scale
distributions “extended the full limits of the scale (1 to 7), and the standard deviations
ranged from 1.1 to 1.7” (p.420). In only one case did a revised pool item fail to extend
“the full limits of the scale;” also, the standard deviations of these revised pool items
ranged from 1.08 to 2.34. Given that responses to the revised pool items are more
diverse than the responses to the MES described in Flory et al. (1993), and that typical
mean responses to the MES are near scale endpoints, then it follows that responses to the
MES are typically more skewed than responses to the revised pool items. Perhaps the
unexpected results of Reidenbach & Robin (1990), such as an MES without a utilitarian
dimension, are artifacts of factor analyses run on highly skewed data.
The MES-R1: A Revised MESAs noted earlier, Churchill (1979) suggests that researchers run reliability analyses
before they run factor analyses. Of course, reliability analyses assume same-domain
items. Because Skipper & Hyman (1993) argues that several pool items in Reidenbach &
Robin (1990) are misclassified as egoism and utilitarian items, preliminary factor
analyses were run to insure proper groupings of items for reliability analyses. For S1a,
S2a, and S3a, the Kaiser-Meyer-Olkin tests exceeded 0.85, which is in the meritorious
range (Hair et al. 1995), and all Bartlett sphericity tests were significant at the 0.001
level; thus, the revised item pool data is amenable to factor analysis. (Subsequent tests
for S1b, S2b, and S3b produced similar results.)
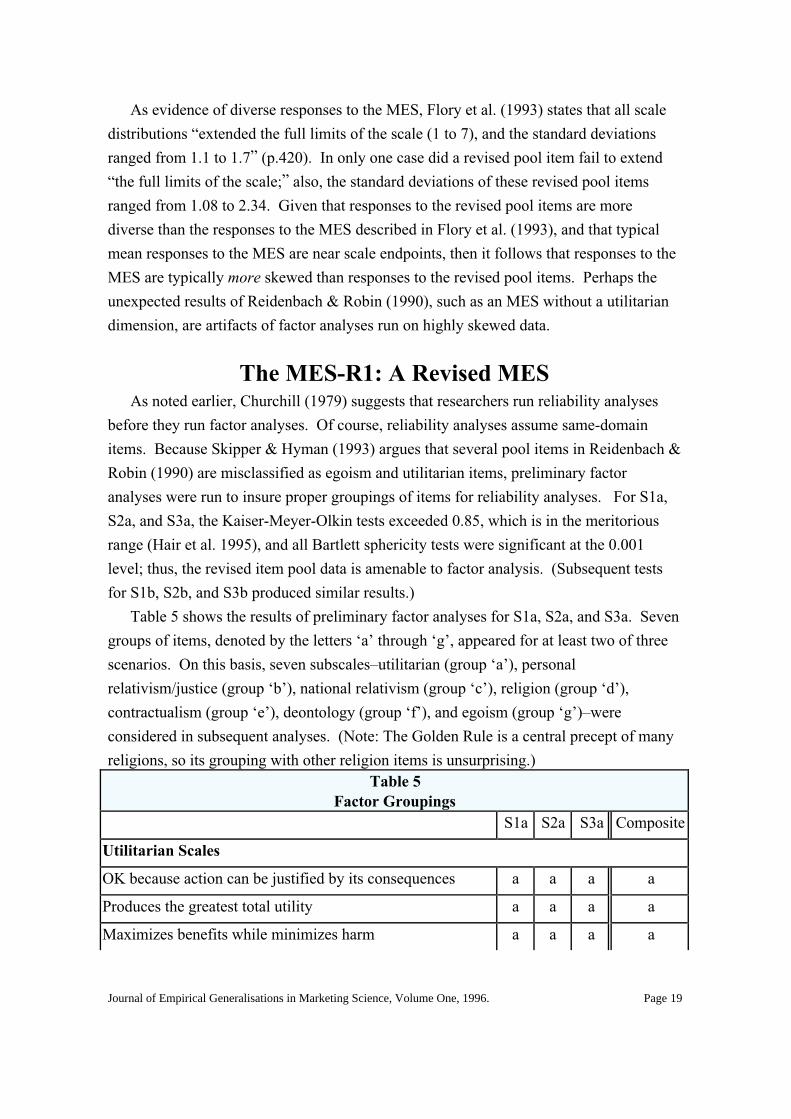
Table 5 shows the results of preliminary factor analyses for S1a, S2a, and S3a. Seven
groups of items, denoted by the letters ‘a’ through ‘g’, appeared for at least two of three
scenarios. On this basis, seven subscales–utilitarian (group ‘a’), personal
relativism/justice (group ‘b’), national relativism (group ‘c’), religion (group ‘d’),
contractualism (group ‘e’), deontology (group ‘f’), and egoism (group ‘g’)–were
considered in subsequent analyses. (Note: The Golden Rule is a central precept of many
religions, so its grouping with other religion items is unsurprising.)Table 5
Factor GroupingsS1a S2a S3a Composite
Utilitarian Scales
OK because action can be justified by its consequences a a a a
Produces the greatest total utility a a a a
Maximizes benefits while minimizes harm a a a a

Journal of Empirical Generalisations in Marketing Science, Volume One, 1996. Page 20
Table 5Factor Groupings
Leads to the greatest good for greatest number a a a a
Results in a positive cost-benefit ratio a a a a
On balance, tends to be good a a a a
Efficient a a a
Maximizes total pleasure a Omit
Compromises an important rule by which I live f Omit
Justice Scales
Unjust to customers b b b b
Fair to customers b b b
Results in an equal distribution of good and bad c Omit
Relativist Scales
Acceptable to me b b b
Acceptable to the people I most admire c b b b
Acceptable to my family (of whose values I approve) b b b
Culturally acceptable in the U.S. c c c c
Traditionally acceptable in the U.S. c c c c
Religion Scales
Violates my religious beliefs d d d d
Violates teachings of most religions d d d d
Violates the Golden Rule (“Do unto others . . .”) d d d d
Deontology Scales
Retailer is duty bound to act this way a a f f
Retailer is obligated to act this way a f f
Violates an unwritten contract with customers a e b e
Violates an unspoken promise to customers a e b e
Violates my ideas of fairness e b e
Egoism Scales
Self promoting for the retailer g g g g
Personally satisfying to the retailer g g g

Journal of Empirical Generalisations in Marketing Science, Volume One, 1996. Page 21
Table 5Factor Groupings
Self sacrificing for the retailer g h Omit
Prudent for the retailer a h Omit
In the best interest of the company a g Omit
Selfish for the retailer f Omit
Retailer morally obligated to act otherwise e Omit
Note: The ratio of scale items to observations exceeds 5.00; n=161 and scale items=32.
Key: a = items that group together (utilitarian factor)b = items that group together (personal relativism/justice factor)c = items that group together (national relativism factor)d = items that group together (religion factor)e = items that group together (contractualism factor)f = items that group together (deontology factor)g = items that group together (egoism factor)
S1a to S3a = three scenarios for which data evaluatedComposite = factor on which item loads at least twice for S1a, S2a, and S3aOmit = eliminated after analysis of data for S1a, S2a, and S3a
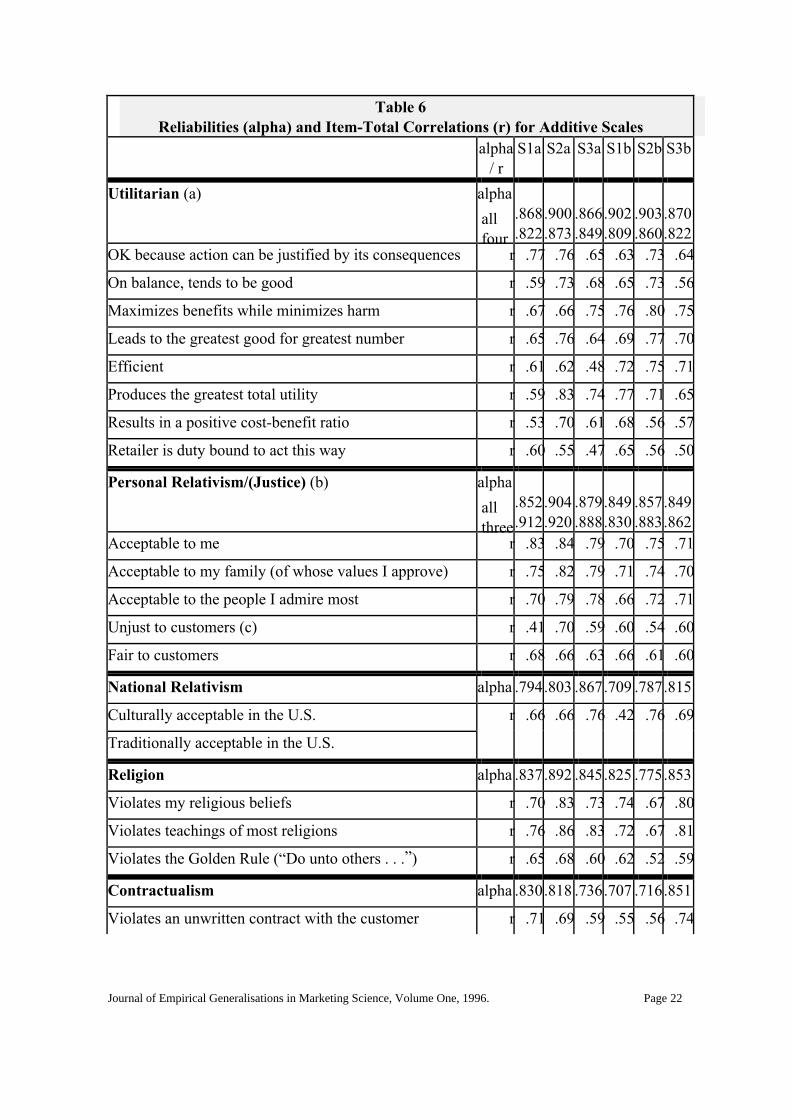
Table 6 shows inter-item reliabilities (α s) and item-total correlations for these seven
possible subscales of the MES-R1–a revised MES. To enhance the parsimony and
usability of the MES-R1, several utilitarian and personal relativism/justice items were
purged via iterative inter-item reliability analyses; the item with the largest alpha if item
deleted was purged until only four utilitarian items or three personal relativism/justice
items remained. Items in the final utilitarian and personal relativism subscales tended to
remain after applying these analyses to data on all scenarios. Across all scenarios, the
average was 0.84 for the utilitarian subscale, 0.88 for the personal relativism subscale,
0.80 for the national relativism subscale, 0.84 for the religion subscale, 0.78 for the
contractualism subscale, 0.79 for the deontological subscale, and 0.53 for the egoism
subscale. Nunnally (1978) suggests that 0.70 is acceptable; thus, inter-item reliabilities
for all but the egoism subscale are acceptable. Also, these average α s are similar to the
average α s in Reidenbach & Robin (1990) (0.8) and Flory et al. (1992) (0.86).
Journal of Empirical Generalisations in Marketing Science, Volume One, 1996. Page 22
Table 6Reliabilities (alpha) and Item-Total Correlations (r) for Additive Scales
alpha/ r
S1a S2a S3a S1b S2b S3b
Utilitarian (a) alpha
all four
.868
.822.900.873
.866
.849.902.809
.903
.860.870.822
OK because action can be justified by its consequences r .77 .76 .65 .63 .73 .64
On balance, tends to be good r .59 .73 .68 .65 .73 .56
Maximizes benefits while minimizes harm r .67 .66 .75 .76 .80 .75
Leads to the greatest good for greatest number r .65 .76 .64 .69 .77 .70
Efficient r .61 .62 .48 .72 .75 .71
Produces the greatest total utility r .59 .83 .74 .77 .71 .65
Results in a positive cost-benefit ratio r .53 .70 .61 .68 .56 .57
Retailer is duty bound to act this way r .60 .55 .47 .65 .56 .50
Personal Relativism/(Justice) (b) alpha
all three
.852
.912.904.920
.879
.888.849.830
.857
.883.849.862
Acceptable to me r .83 .84 .79 .70 .75 .71
Acceptable to my family (of whose values I approve) r .75 .82 .79 .71 .74 .70
Acceptable to the people I admire most r .70 .79 .78 .66 .72 .71
Unjust to customers (c) r .41 .70 .59 .60 .54 .60
Fair to customers r .68 .66 .63 .66 .61 .60
National Relativism alpha .794.803 .867.709 .787.815
Culturally acceptable in the U.S. r .66 .66 .76 .42 .76 .69
Traditionally acceptable in the U.S.
Religion alpha .837.892 .845.825 .775.853
Violates my religious beliefs r .70 .83 .73 .74 .67 .80
Violates teachings of most religions r .76 .86 .83 .72 .67 .81
Violates the Golden Rule (“Do unto others . . .”) r .65 .68 .60 .62 .52 .59
Contractualism alpha .830.818 .736.707 .716.851
Violates an unwritten contract with the customer r .71 .69 .59 .55 .56 .74

Journal of Empirical Generalisations in Marketing Science, Volume One, 1996. Page 23
Table 6Reliabilities (alpha) and Item-Total Correlations (r) for Additive Scales
Violates an unspoken promise to the customer
Deontological alpha .789.705 .811.860 .849.740
Retailer is duty bound to act this way r .65 .54 .68 .75 .74 .59
Retailer is obligated to act this way
Egoism alpha .368.583 .543.438 .678.556
Self promoting for the retailer r .23 .41 .38 .29 .51 .39
Personally satisfying for the retailer
Note:(a) First value (alphaall) is for all eight items; second value (alpha four) is for first four
items only.(b) First value (alphaall) is for all five items; second value (alphathree) is for first
three items only (Personal Relativism only).(c) Item is reverse coded (i.e., 1=7, 2=6, 3=5, 4=4, 5=3, 6=2, 7=1).
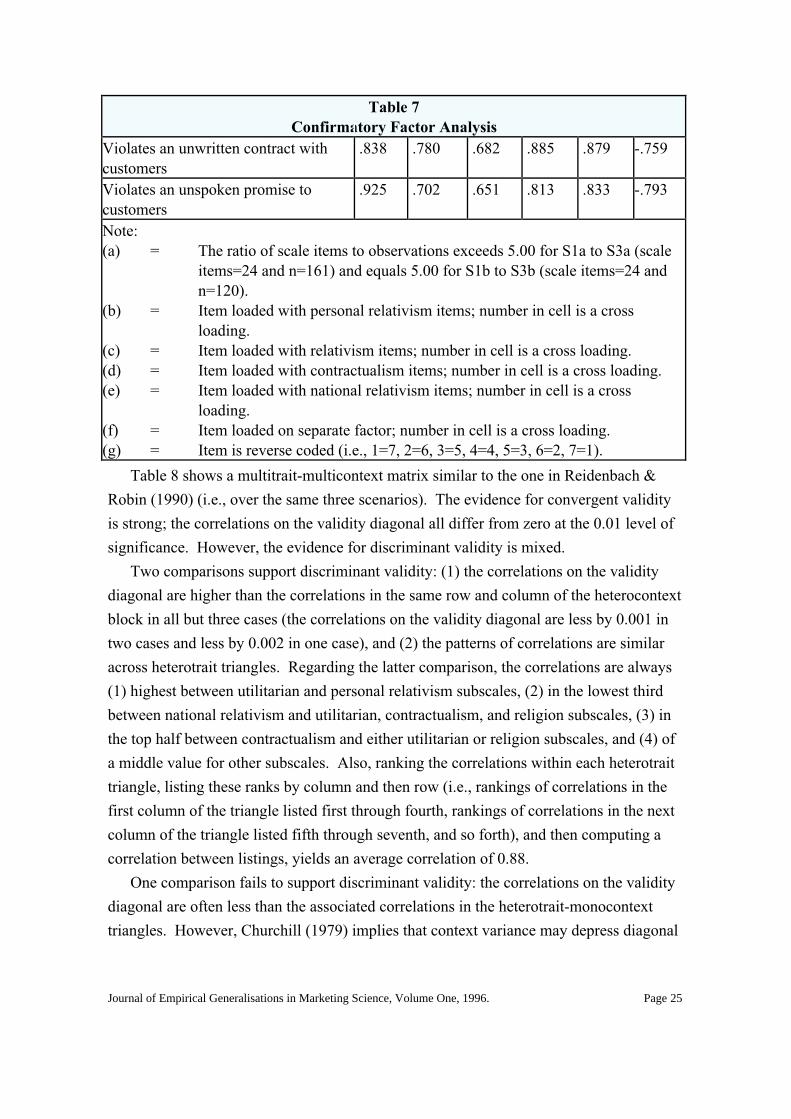
Table 7 shows the results of confirmatory factor analyses for the MES-R1–comprised
of fourteen items and five dimensions–and the MES. A principle components factor
analysis with varimax rotation was run on data for each scenario. Because theory and
scree test results suggested five factor solutions for the MES-R1 and three factor
solutions for the MES, factor loadings for those solutions are reported. Of 84 item-factor
pairs for the MES-R1 (i.e., six scenarios x fourteen items), only one pair is wrong;
however, of 48 item-factor pairs for the MES (i.e., six scenarios x eight items), one item
loads on the wrong factor five of six times and four other pairs are wrong.6 Clearly,
these results favor the MES-R1 over the MES.Table 7
Confirmatory Factor AnalysisFactor Loading (a)
S1a S2a S3a S1b S2b S3b
MES-R1
Utilitarian
OK because action can be justified byits consequences
.710 .665 .735 .625 .693 .821
On balance, tends to be good .790 .711 .728 .463(b) .708 .632
Maximizes benefits while minimizesharm
.791 .845 .796 .859 .820 .758

Journal of Empirical Generalisations in Marketing Science, Volume One, 1996. Page 24
Table 7Confirmatory Factor Analysis
Leads to the greatest good for greatestnumber
.712 .788 .798 .768 .833 .733
Personal Relativism
Acceptable to me .820 .763 .756 .803 .690 .632
Acceptable to the people I most admire .791 .778 .837 .807 .871 .856
Acceptable to my family (of whosevalues I approve)
.797 .782 .882 .828 .835 .838
National Relativism
Culturally acceptable in the U.S. .830 .872 .903 .665 .913 .854
Traditionally acceptable in the U.S. .895 .887 .917 .882 .845 .918
Religion
Violates my religious beliefs .852 .888 .893 .896 .866 .910
Violates teachings of most religions .894 .915 .913 .818 .796 .912
Violates the Golden Rule (“Do untoothers . . .”)
.731 .739 .748 .708 .712 .651
Contractualism
Violates an unwritten contract withcustomers
.835 .800 .797 .841 .746 .821
Violates an unspoken promise tocustomers
.839 .817 .827 .641 .876 .736
MES
Moral Equity
Unjust to customers (g) .756 .819 .758 .903 .867 .803(c)
Fair to customers .677 .870 .794 .892 .845 .764(c)
Retailer morally obligated to actotherwise
-.637 -.023(d) .048(d) -.191(e) -.270(d) -.199(f)
Acceptable to my family (of whosevalues I approve)
.424(c) .757 .776 .584 .564 .494(c)
National Relativism
Culturally acceptable in the U.S. .864 .892 .913 .775 .915 .902
Traditionally acceptable in the U.S. .895 .902 .902 .788 .915 .901
Contractualism
Journal of Empirical Generalisations in Marketing Science, Volume One, 1996. Page 25
Table 7Confirmatory Factor Analysis
Violates an unwritten contract withcustomers
.838 .780 .682 .885 .879 -.759
Violates an unspoken promise tocustomers
.925 .702 .651 .813 .833 -.793
Note:(a) = The ratio of scale items to observations exceeds 5.00 for S1a to S3a (scale
items=24 and n=161) and equals 5.00 for S1b to S3b (scale items=24 and n=120).
(b) = Item loaded with personal relativism items; number in cell is a cross loading.
(c) = Item loaded with relativism items; number in cell is a cross loading.(d) = Item loaded with contractualism items; number in cell is a cross loading.(e) = Item loaded with national relativism items; number in cell is a cross
loading.(f) = Item loaded on separate factor; number in cell is a cross loading.(g) = Item is reverse coded (i.e., 1=7, 2=6, 3=5, 4=4, 5=3, 6=2, 7=1).
Table 8 shows a multitrait-multicontext matrix similar to the one in Reidenbach &
Robin (1990) (i.e., over the same three scenarios). The evidence for convergent validity
is strong; the correlations on the validity diagonal all differ from zero at the 0.01 level of
significance. However, the evidence for discriminant validity is mixed.
Two comparisons support discriminant validity: (1) the correlations on the validity
diagonal are higher than the correlations in the same row and column of the heterocontext
block in all but three cases (the correlations on the validity diagonal are less by 0.001 in
two cases and less by 0.002 in one case), and (2) the patterns of correlations are similar
across heterotrait triangles. Regarding the latter comparison, the correlations are always
(1) highest between utilitarian and personal relativism subscales, (2) in the lowest third
between national relativism and utilitarian, contractualism, and religion subscales, (3) in
the top half between contractualism and either utilitarian or religion subscales, and (4) of
a middle value for other subscales. Also, ranking the correlations within each heterotrait
triangle, listing these ranks by column and then row (i.e., rankings of correlations in the
first column of the triangle listed first through fourth, rankings of correlations in the next
column of the triangle listed fifth through seventh, and so forth), and then computing a
correlation between listings, yields an average correlation of 0.88.
One comparison fails to support discriminant validity: the correlations on the validity
diagonal are often less than the associated correlations in the heterotrait-monocontext
triangles. However, Churchill (1979) implies that context variance may depress diagonal
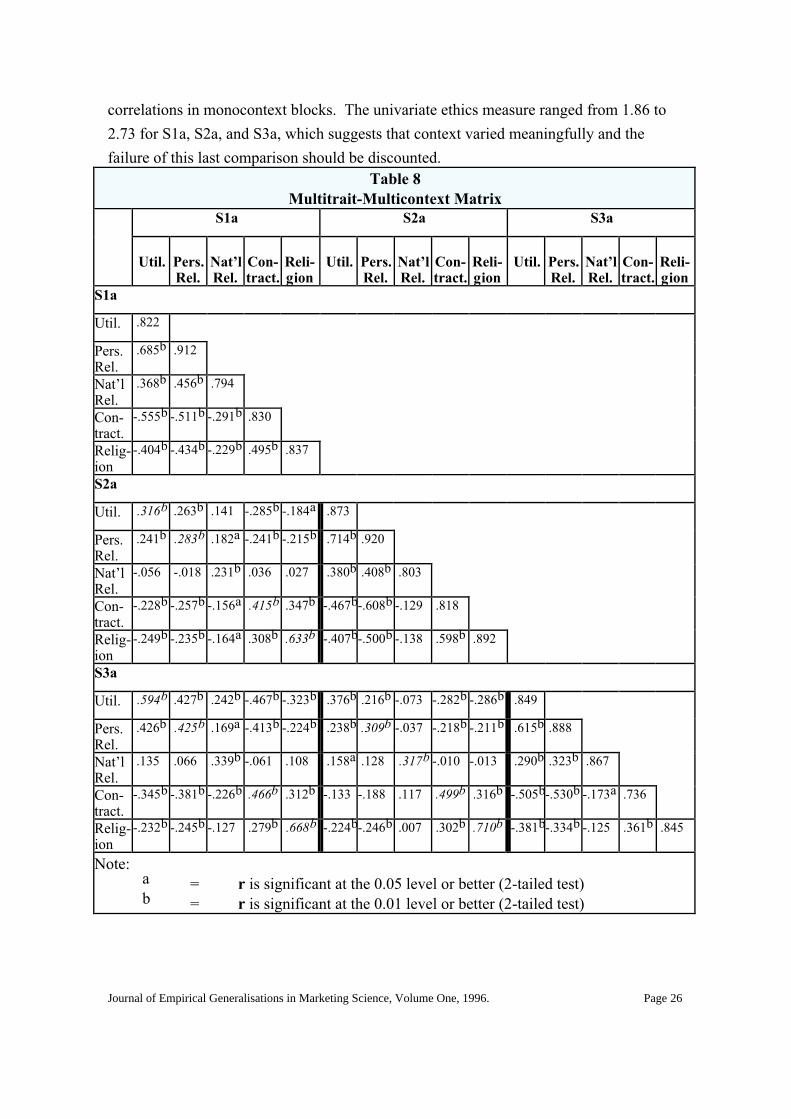
Journal of Empirical Generalisations in Marketing Science, Volume One, 1996. Page 26
correlations in monocontext blocks. The univariate ethics measure ranged from 1.86 to
2.73 for S1a, S2a, and S3a, which suggests that context varied meaningfully and the
failure of this last comparison should be discounted.Table 8
Multitrait-Multicontext MatrixS1a S2a S3a
Util. Pers.Rel.
Nat’lRel.
Con-tract.
Reli-gion
Util. Pers.Rel.
Nat’lRel.
Con-tract.
Reli-gion
Util. Pers.Rel.
Nat’lRel.
Con-tract.
Reli-gion
S1a
Util. .822
Pers.Rel.
.685b .912
Nat’lRel.
.368b .456b .794
Con-tract.
-.555b -.511b -.291b .830
Relig-ion
-.404b -.434b -.229b .495b .837
S2a
Util. .316b .263b .141 -.285b -.184a .873
Pers.Rel.
.241b .283b .182a -.241b -.215b .714b .920
Nat’lRel.
-.056 -.018 .231b .036 .027 .380b .408b .803
Con-tract.
-.228b -.257b -.156a .415b .347b -.467b-.608b -.129 .818
Relig-ion
-.249b -.235b -.164a .308b .633b -.407b-.500b -.138 .598b .892
S3a
Util. .594b .427b .242b -.467b -.323b .376b .216b -.073 -.282b -.286b .849
Pers.Rel.
.426b .425b .169a -.413b -.224b .238b .309b -.037 -.218b -.211b .615b .888
Nat’lRel.
.135 .066 .339b -.061 .108 .158a .128 .317b -.010 -.013 .290b .323b .867
Con-tract.
-.345b -.381b -.226b .466b .312b -.133 -.188 .117 .499b .316b -.505b-.530b -.173a .736
Relig-ion
-.232b -.245b -.127 .279b .668b -.224b-.246b .007 .302b .710b -.381b-.334b -.125 .361b .845
Note:a = r is significant at the 0.05 level or better (2-tailed test)b = r is significant at the 0.01 level or better (2-tailed test)

Journal of Empirical Generalisations in Marketing Science, Volume One, 1996. Page 27
Predictive Validity of the MES-R1 Versus the MESTable 9 shows the correlations between the univariate ethics measures and subscales
of the MES-R1 and MES. The instruments share the (national) relativism and
contractualism subscales. All but the (national) relativism and moral equity subscales
(average r of 0.25 and 0.38 respectively) are equally good predictors of the ethicality
measure (average r ranges from 0.51 for the personal relativism subscale to 0.55 for the
religion subscale). However, the (national) relativism subscale is the best predictor of the
forecasted behavior of others measure (average r=0.43); seemingly, respondents’ sense
of the national ethical standard best reflects their forecasts of others’ behaviors. The
utilitarian and personal relativism subscales are the best predictors of the behavioral
intent measure (average r of 0.63 and 0.60 respectively); seemingly, these subscales best
reflect the family and educational experiences that set a respondent’s internal moral
compass. The moral equity subscale, the one scale unique to the MES, is the second
worst predictor of the ethicality measure and the third worst best predictor of both the
behavioral intent and the forecasted behavior of others measures; thus, the moral equity
subscale has lower predictive validity than most new subscales of the MES-R1.Table 9
Correlations Between Univariate Measures and MES-R1 ScalesMES-R1 Scales Univariate Scales Adjusted R2 (a)
MES Scales MES-R1 MES
Util. Pers.Rel.
Relig-ion
Nat’lRel.
Con-tract.
MoralEquity
Ethical I woulddo
Otherwoulddo
Scales FactorScores
Scales FactorScores
S1a
Ethical -.605b-.553b .560b -.169a .599b -.309b 1.000 0.595 0.527 0.366 0.405
I woulddo
.567b .587b -.448b .315b -.466b .326b -.544b 1.000 0.429 0.415 0.299 0.290
Otherswould do
.255b .225b -.270b .336b -.239b .086 -.153 .201a 1.000 0.136 0.136 0.111 0.113
S2a
Ethical -.520b-.534b .613b -.137 .655b -.446b 1.000 0.531 0.501 0.474 0.421
I woulddo
.551b .607b -.408b .377b -.434b .494b -.428b 1.000 0.413 0.431 0.356 0.383
Otherswould do
.126 .099 -.078 .343b .109 .133 -.028 .374b 1.000 0.137 0.140 0.137 0.125
S3a
Ethical -.449b-.512b .455b -.240b .550b -.331b 1.000 0.416 0.387 0.364 0.400
I woulddo
.566b .577b -.266b .220b -.571b .422b -.367b 1.000 0.457 0.401 0.409 0.384

Journal of Empirical Generalisations in Marketing Science, Volume One, 1996. Page 28
Table 9Correlations Between Univariate Measures and MES-R1 Scales
Otherswould do
.130 .149 -.142 .421b -.137 .153 -.143 .110 1.000 0.163 0.159 0.182 0.161
S1b
Ethical -.603b-.437b .578b -.410b .430b -.387b 1.000 0.478 0.488 0.327 0.333
I woulddo
.713b .622b -.509b .360b -.593b .418b -.676b 1.000 0.621 0.562 0.412 0.459
Otherswould do
.333b .302b -.267b .501b -.143 .194a -.381b .292b 1.000 0.232 0.237 0.211 0.175
S2b
Ethical -.472b-.486b .456b -.299b .442b -.435b 1.000 0.383 0.336 0.312 0.314
I woulddo
.682b .615b -.435b .338b -.389b .447b -.448b 1.000 0.547 0.452 0.287 0.269
Otherswould do
.291b .279b -.175 .529b -.099 .355b -.299b .406b 1.000 0.266 0.218 0.265 0.197
S3b
Ethical -.392b-.505b .606b -.255b .551b -.381b 1.000 0.455 0.399 0.307 0.343
I woulddo
.726b .592b -.301b .234a -.482b .404b -.428b 1.000 0.474 0.501 0.249 0.339
Otherswould do
.167 .234a -.011 .434b .030 .154 -.118 .312b 1.000 0.241 0.179 0.185 0.175
Note:a = r is significant at the 0.05 level or better (2-tailed test).b = r is significant at the 0.01 level or better (2-tailed test).(a) = Adjusted R2 for Scales is for regressions against scores created by
averaging all items that comprise a scale; Adjusted R2 for Factor Scores is for regressions against factor scores for each dimension.
Table 9 also compares the variance in three univariate ethics measures (which
included a No Ethical Dilemma option) explained by additive indices and factor scores
produced by the MES-R1 and MES. It is well known that R2 is an improper criteria for
selecting among non-nested models (Bass 1975; Bass & Clarke 1975; Bass, Tigert, &
Lonsdale 1968). Although the MES is not strictly nested in the MES-R1, both scales
contain identical (national) relativism and contractualism subscales and one moral equity
item of the MES appears in the personal relativism subscale of the MES-R1. Given this
degree of overlap, adjusted R2s provide a tenable criterion for model selection.
The MES-R1 explains more variance in the univariate ethics measures than does the
MES. In all but one case the adjusted R2 for the MES-R1 exceeds or equals the adjusted
R2 for the MES. For the ethicality measure, the average adjusted R2s for the MES-R1
and MES are 0.48 and 0.36 respectively; for the behavioral intent measure, 0.49 and 0.36
respectively; and for the forecasted behavior of others measure, 0.20 and 0.18

Journal of Empirical Generalisations in Marketing Science, Volume One, 1996. Page 29
respectively. (Note: These results are for the additive indices.) Interestingly, the
average adjusted R2s for the MES and the ethicality measure are far lower than those in
Reidenbach & Robin (1990) (0.72), Flory et al. (1993) (0.67), Humphreys et al. (1993)
(0.61), and Reidenbach, Robin, & Dawson (1991) (0.56); also, the average adjusted R2s
for the behavioral intent measure are lower but similar to those in Flory et al. (1993)
(0.61), Humphreys et al. (1993) (0.48), Reidenbach, Robin, & Dawson (1991) (0.37), and
Reidenbach & Robin (1990) (0.34).7
ConclusionClearly, use of the trailblazing MES improved ethics research. However, continuing
progress requires a revamped MES. The preceding critique of Reidenbach & Robin
(1990) and the MES exposed ambiguities in scale items, faulty scale development
procedures, unexpected factor structures, and omitted ethical rationales.
A revised MES–the MES-R1–was developed in accord with the procedures delineated
in Churchill (1979) and the concerns about the MES expressed in Cohen, Pant, & Sharp
(1993), Hansen (1992), Jones & Ponemon (1993), and Skipper & Hyman (1993).
Derived from properly transformed data, the MES-R1 includes five subscales: utilitarian,
personal relativism, and religion subscales were added to the relativism and
contractualism subscales of the original MES. Results of confirmatory factor analyses
and tests of predictive validity against three univariate ethics measures showed the
superior predictive and face validities of the MES-R1.
Again, this article was meant to elevate researchers’ sensitivity to the psychometric
details of proper scale development. Critique and revalidation studies, by ensuring the
continuing soundness of scales created for use in empirical research, can certify the tools
that marketing scholars use to create marketing knowledge. Subsequent related research
could further contribute to the marketing literature by either
(1) providing a comprehensive typology of the psychometric details requisite for
proper scale development, or
(2) revealing scale developers’ tendencies to disregard specific psychometric details.
Caveats
MES-type scales are limited in two ways. First, MES-type scales cannot assess right
versus wrong; rather, such scales can only assess community standards (Skipper &
Hyman 1993). Although Flory et al. (1993) claims that the MES is a good scale “if the
explanation, prediction, and control of unethical behavior is the objective” (p.418, italics
added), results of studies based on MES-type scales cannot dictate an ethical course of

Journal of Empirical Generalisations in Marketing Science, Volume One, 1996. Page 30
action. Second, MES-type scales are susceptible to the same social desirability bias that
distorts much self-report data collected by ethics researchers (Fernandes & Randall 1992;
Izraeli 1988; Randall & Fernandes 1991). Because the promise of anonymity may not
reduce such bias (Fernandes & Randall 1992), and forecasts of others’ behaviors can be
“the best predictor of respondents’ ethical behavior” (Izraeli 1988, p.270), researchers
may gain by asking MES-R1 respondents to “answer from the perspective of a good
friend.”
Finally, the MES-R1, like the MES, lacks several face-valid subscales. One obvious
candidate is an egoism subscale. Although dismissed by Reidenbach & Robin (1995),
the seven deadly sins suggest additional subscales (Skipper & Hyman 1993).
Furthermore, ethics researchers should revalidate the MES-R1 and calibrate future
versions of the scale with scenarios from different business domains and of differing
degrees of ethicality.
Appendix: Limitations of Strictly Factor-Analysis-Based Item Distillation
Reidenbach & Robin (1990) mentions a procedure for deleting pool items via a rule-
based examination of factor patterns. Although Reidenbach & Robin (1990) omits the
rules used, the following two sets of rules fit the general procedure described in
Reidenbach & Robin (1990); in an effort to reproduce the MES, they were applied to a
series of principal components factor analyses with an eigenvalue<1.0 stopping rule and
varimax rotation. (Note: To avoid two confounds, this analysis was limited to the three
scenarios and factor analysis procedures described in Reidenbach & Robin 1990.)
Rule Set #1: Examine the factor patterns of all scenarios jointly and eliminate items
that:
(1) load on single-item factors for two or more scenarios;
(2) load with different sets of items across all scenarios; and
(3) have a communality less than 0.50, the minimum recommended by Hair et
al. (1995), for two or more scenarios.
Rule Set #2: For items not eliminated by Rule Set #1, examine the factor pattern of
each scenario separately and apply these rules iteratively until no pool
item qualifies:
(1) eliminate the item with the lowest loading less than 0.5;
(2) if no item has a loading less than 0.5, eliminate the item with the highest
cross loading greater than 0.4;

Journal of Empirical Generalisations in Marketing Science, Volume One, 1996. Page 31
(3) if no item has a loading less than 0.5 or a cross loading greater than 0.4,
eliminate the item with the lowest loading less than 0.6;
(4) if no item has a loading less than 0.6 or a cross loading greater than 0.4,
eliminate the item with the lowest loading less than 0.7; and.
(5) stop when all items have loadings greater than or equal to 0.7 and no cross
loading greater than 0.4.
Rules (1) and (2) of Rule Set #2 follow from Hair et al. (1995); factor loadings above
0.45 are significant for n 150. Rules (3) to (5) purge enough items to create a MES-sized
measure.
Applying Rule Set #1 to data for S1a, S2a, and S3a eliminated eight of 32 pool items.
The results of Rule Set #2 are summarized in the Appendix Table. For each scenario, the
successive columns represent the successive iterations of Rule Set #2. An ‘x’ in a cell
indicates the iteration in which that item was dropped; a number in the right-most column
indicates the factor on which the item loaded upon satisfying rule (5). After applying
Rule Set#2, two religion items, the Golden Rule item, and one egoism item were retained
across all scenarios; two justice items, one egoism item, one deontology item, and two
utilitarian items, were eliminated across all scenarios. Although Rule Set #2 always
produced a four-factor solution, it retained different items and different numbers of items
for each scenario.Appendix Table
Results of Strictly Factor-Analysis-Based Item DistillationItem
S1a–Iteration # S2a–Iteration # S3a–Iteration #
12
34
56
78
910
1112
1314
12
34
56
78
910
11 12
34
56
78
910
1112
1314
1516
1 x x x
2 x x x
3 2 2 x
4 x x 2
5 x x 2
6 2 2 x
7 x x 2
8 4 4 4
9 x x x

Journal of Empirical Generalisations in Marketing Science, Volume One, 1996. Page 32
Appendix TableResults of Strictly Factor-Analysis-Based Item Distillation
10 x 4 4
11 x 1 x
12 x x x
13 1 1 x
14 4 x x
15 1 1 x
16 x 1 x
17 1 x x
18 1 1 x
19 1 1 x
20 x x x
21 x x x
22 x 1 1
23 x 1 1
24 3 3 3
25 3 3 3
26 3 3 3
Note: ‘x’ denotes step in which item was eliminated; a number in the right-most columnindicates the factor on which the item loaded on last iteration.
Hair et al. (1995) asserts that factor analysts should “ensure that the observed patterns
are conceptually valid and appropriate for study with factor analysis, because the
technique has no means to determine appropriateness other than the correlations among
variables” (p.375). Clearly, Rule Sets #1 and #2 produced inconsistent results; although
Reidenbach & Robin (1990) certainly relied on different elimination criteria, the failure
of these atheoretical rule sets discredits all strictly factor-analysis-based item elimination
methods.
ReferencesBarnett, Tim; Bass, Ken; Brown, Gene (1994) Ethical Ideology and Ethical Judgment
Regarding Ethical Issues in Business, Journal of Business Ethics, Vol.13, p.469-480.

Journal of Empirical Generalisations in Marketing Science, Volume One, 1996. Page 33
Bass, Frank M. (1975) Unexplained Variance in Studies of Consumer Behavior,” in
Control of Error in Market Research Data, John U. Farley and John A. Howard., eds.
Heath and Company: Lexington, MA, p.11-36.
Bass, Frank M.; Clarke, Darral G. (1972) Testing Distributed Lag Models of Advertising
Effect, Journal of Marketing Research,Vol.9, p.298-308.
Bass, Frank M.; Tigert, Douglas J.; Lonsdale, Ronald T. (1968) Market Segmentation:
Group Versus Individual Behavior, Journal of Marketing Research, Vol.5, p.264-270.
Churchill, Gilbert A. Jr. (1979) A Paradigm for Developing Better Measures of
Marketing Constructs, Journal of Marketing Research, Vol.16, p.64-73.
Clark, James W.; Dawson, Lyndon E. (1996) Personal Religiousness and Ethical
Judgements: An Empirical Analysis, Journal of Business Ethics, Vol.15, p.359-372.
Cohen, Jeffrey; Pant, Laurie; Sharp, David (1993) A Validation and Extension of a
Multidimensional Ethics Scale, Journal of Business Ethics, Vol.12, p.13-26.
Cureton, Edward E.; D’Agostino, Ralph B. (1983) Factor Analysis: An Applied
Approach. Lawrence Erlbaum Associates, Publishers: Hillsdale, NJ.
Fernandes, Maria F.; Randall, Donna M. (1992) The Nature of Social Desirability
Response Effects in Ethics Research, Business Ethics Quarterly, Vol.2, p.183-205.
Fernandez, Linda; Plank, Richard E.; Landeros, Robert (1995) Is Maccoby’s Head/Heart
Dichotomy a Measure of Ethical Inclination? American Business Review, Vol.13,
p.85-93.
Flory, Steven M.; Phillips Jr., Thomas J.; Reidenbach, R. Eric; Robin, Donald P. (1992)
A Multidimensional Analysis of Selected Ethical Issues in Accounting, The
Accounting Review, Vol.67, p.284-304.
Flory, Steven M., Phillips Jr., Thomas J.; Reidenbach, R. Eric; Robin, Donald P. (1993) A
Reply to ‘A Comment on “A Multidimensional Analysis of Selected Ethical Issues in
Accounting”’, The Accounting Review, Vol.68, p.417-421.
Hair Jr., Joseph. F.; Anderson, Rolph E.; Tatham, Ronald L.; Black, William C. (1995)
Multivariate Data Analysis with Readings, 4th ed. Prentice Hall: Englewood Cliffs,
NJ.
Hansen, Randall S. (1992) A Multidimensional Scale for Measuring Business Ethics: A
Purification and Refinement, Journal of Business Ethics, Vol.11, p.523-534.
Henthorne, Tony L.; LaTour, Michael S. (1995) A Model to Explore the Ethics of Erotic
Stimuli in Print Advertising, Journal of Business Ethics, Vol.14, p.561-569.
Henthorne, Tony L.; Robin, Donald P.; Reidenbach, R. Eric (1992) Identifying the Gaps
in the Ethical Perceptions Between Managers and Salespersons: A Multidimensional
Approach, Journal of Business Ethics, Vol.11, p.849-856.

Journal of Empirical Generalisations in Marketing Science, Volume One, 1996. Page 34
Humphreys, Neil; Robin, Donald P.; Reidenbach, R. Eric; Moak, Donald L. (1993) The
Ethical Decision Making Process of Small Business Owner/Managers and Their
Customers, Journal of Small Business Management, Vol.31, p.9-22.
Hunt, Shelby D.; Vitell, Scott J. (1986) A General Theory of Marketing Ethics, Journal of
Macromarketing, Vol.6, p.5-16.
Izraeli, Dove (1988) Ethical Beliefs and Behavior Among Managers: A Cross-Cultural
Study, Journal of Business Ethics, Vol.7, p.263-271.
Jones, Scott K.; Ponemon, Lawrence A. (1993) A Comment on ‘A Multidimensional
Analysis of Selected Ethical Issues in Accounting, The Accounting Review, Vol.68,
p.411-416.
Kerlinger, Fred N. (1979) Behavioral Research: A Conceptual Approach. Holt, Rinehart,
and Winston: New York NY.
LaFleur, Elizabeth K.; Reidenbach, R. Eric; Robin, Donald P.; Forrest, P.J. (1996) An
Exploration of Rule Configuration Effects on the Ethical Decision Processes of
Advertising Professionals, Journal of the Academy of Marketing Science, Vol.24,
p.66-76.
LaTour, Michael S.; Henthorne, Tony L. (1994) Ethical Judgments of Sexual Appeals in
Print Advertising, Journal of Advertising, Vol.23, p.81-90.
Nunnally, Jum C. (1978) Psychometric Theory, 2nd ed. McGraw-Hill: New York, NY.
Randall, D.M.; Gibson, A.M. (1990) Methodology in Business Ethics Research: A
Review and Critical Assessment, Journal of Business Ethics, Vol.9, p.457-471.
Randall, Donna M.; Fernandes, Maria F. (1991) The Social Desirability Response Bias in
Ethics Research, Journal of Business Ethics, Vol.10, p.805-817.
Reidenbach, R. Eric; Robin, Donald P. (1988) Some Initial Steps Toward Improving the
Measurement of Ethical Evaluations of Marketing Activities, Journal of Business
Ethics, Vol.7, p.871-879.
Reidenbach, R. Eric; Robin, Donald P. (1990) Toward the Development of a
Multidimensional Scale for Improving Evaluations of Business Ethics, Journal of
Business Ethics, Vol.9, p.639-653.
Reidenbach, R. Eric; Robin, Donald P. (1993) A Comment on ‘A Multidimensional Scale
for Measuring Business Ethics: A Purification and Refinement’, Journal of Business
Ethics, Vol.12, p.663-664.
Reidenbach, R. Eric; Robin, Donald P. (1995) A Response to ‘On Measuring Ethical
Judgments’, Journal of Business Ethics, Vol.14, p.159-162.

Journal of Empirical Generalisations in Marketing Science, Volume One, 1996. Page 35
Reidenbach, R. Eric; Robin, Donald P.; Dawson, Lyndon (1991) An Application and
Extension of a Multidimensional Ethics Scale to Selected Marketing Practices and
Marketing Groups, Journal of the Academy of Marketing Science, Vol.19, p.83-92.
Robin, Donald P.; Reidenbach, R. Eric; Forrest, P.J. (1996) The Perceived Importance of
an Ethical Issue as an Influence on the Ethical Decision-making of Ad Managers,
Journal of Business Research, Vol.35, p.17-28.
Rummel, R. J. (1970) Applied Factor Analysis, Northwestern University Press: Evanston,
IL.
Skipper, Robert; Hyman, Michael R. (1993) On Measuring Ethical Judgments, Journal of
Business Ethics, Vol.12, p.535-545.
Tabachnick, Barbara G.; Fidell, Linda S. (1983) Using Multivariate Statistics, Harper &
Row, Publishers: New York, NY.
Tansey, Richard; Brown, Gene; Hyman, Michael R.; Dawson Jr., Lyndon E. (1994)
Personal Moral Philosophies and the Moral Judgments of Salespeople, Journal of
Personal Selling and Sales Management, Vol.14, p.59-75.
Tansey, Richard; Hyman, Michael R.; Brown, Gene (1992) Ethical Judgments About
Wartime Ads Depicting Combat, Journal of Advertising, Vol.21, p.57-74.
Tsalikis, John; Fritzsche, David J. (1989) Business Ethics: A Literature Review with a
Focus on Marketing Ethics, Journal of Business Ethics, Vol.8, p.695-743.
Tsalikis, John; LaTour, Michael S. (1995) Bribery and Extortion in International
Business: Ethical Perceptions of Greeks Compared to Americans, Journal of Business
Ethics, Vol.14, p.249-264.
Tsalikis, John; Ortiz-Buonafina, M. (1990) Ethical Beliefs’ Differences of Males and
Females, Journal of Business Ethics, Vol.9, p.509-517.
Tsalikis, John; Nwachukwu, Osita (1988) Cross-Cultural Business Ethics: Ethical Beliefs
Difference between Blacks and Whites, Journal of Business Ethics, Vol.7, p.745-754.
Tsalikis, John; Nwachukwu, Osita (1991) A Comparison of Nigerian to American Views
of Bribery and Extortion in International Commerce, Journal of Business Ethics,
Vol.10, p.85-98.
Weber, James (1992) Scenarios in Business Ethics Research: Review, Critical
Assessment, and Recommendations, Business Ethics Quarterly, Vol.2, p.137-160.
Related Documents