1310 Biochemistry 1993, 32, 1310-1317 Hydroubiquinone-Cytochrome c2 Oxidoreductase from Rhodobacter capsulatus: Definition of a Minimal, Functional Isolated Preparation? Dan E. Robertson,'J Huangen Ding,$ Paul R. Chelminski,**o Clive Slaughter,ll Joan Hsu,ll Carolyn Moomaw,ll Mariko Tokito,l Fevzi Dalda1,I and P. Leslie Duttont Department of Biochemistry and Biophysics, The Johnson Research Foundation, and Department of Biology, Plant Science Institute, University of Pennsylvania, Philadelphia, Pennsylvania I91 04, and Howard Hughes Medical Institute, University of Texas Southwest Medical Center at Dallas, Dallas, Texas 75235 Received June 30, 1992; Revised Manuscript Received October 19, I992 ABSTRACT: The hydroubiquinone-cytochrome c2 oxidoreductase (cyt bcl) from Rhodobacter capsulatus has been solubilized according to the dodecyl maltoside method and isolated, and its minimal functional composition has been characterized. We find the complex to be composed of three protein subunits corresponding to polypeptides of cyt b (44 kDa), cyt CI (33 kDa), and 2Fe2S cluster (24 kDa). A fourth band sometimes discernable at 22 kDa appears to be an artifact of the polyacrylamide gel electrophoresis procedure. Its appearance is shown to be derived from the 2Fe2S cluster subunit by the similarity of the binding of subunit-specific monoclonal antibodies and the identical N-terminal sequence of the 24- and 22-kDa bands. The cofactors of cyt bcl, namely, cyt bH, cyt bL, cyt c1, and the 2Fe2S center, the Qm and Qow domains of the Qo site, and the Qi site appear intact as indicated by their optical and EPR spectral signatures, redox properties, and inhibitor binding. The electron paramagnetic resonance spectrum of the cyt bH heme is altered by antimycin, consistent with a change in the dihedral angle between the ligating histidine imidazoles, while the spectrum of the cyt bL heme is broadened by stigmatellin. The ubiquinone-10 content is variable, ranging from 0.8 to 3 molecules/cyt bcl. Activity studies define this three-subunit cyt bcl complex as a minimal structure, equipped as the enzyme in the native state and capable of full catalytic activity. In energy-transducing membranes the free energy available in redox reactions is coupled to the formation of a proton gradient by a number of membrane-spanning, multipeptide complexes. One of these complexes is the hydroubiquinone cytochrome c oxidoreductase (cyt bcl), which converts energy from the oxidation of hydroubiquinone (QHz) from the membrane-bound ubiquinone pool (QWJ and reduction of a soluble cytochrome c to an electrochemical proton gradient. This complex is found across a broad phylogenetic spectrum, from the cytoplasmicmembranes of phototrophic prokaryotes to the mitochondria of advanced eukaryotes and, in a modified This research was supportedfrom Public Health Service Grants GM 27309 to P.L.D. and GM 38237 to F.D. * Correspondenceshould be addresed to this author. t Department of Biochemistry and Biophysics, University of Penn- 8 Present address: University of North Carolina School of Medicine, 11 University of Texas Southwest Medical Center at Dallas. I Department of Biology, University of Pennsylvania. I Abbreviations: cyt, cytochrome; cyt bcl, hydroubiquinone-cyto- chrome c2 oxidoreductase; QH2, hydroubiquinone; Q, ubiquinone; cyt bL, low-potential cytochrome b566of cyt bcl; cyt bH, high-potential cytochrome b560 of cyt bq; Qo, hydroubiquinoneoxidizing site;Qi, ubiquinone reducing site; QPl, membrane-bound pool of ubiquinone; Eh, ambient redox potential; E,, electrochemical midpoint potential; E,,, electrochemical midpoint potential at pH 7; RC, photosynthetic reaction center; SDS, sodium dodecyl sulfate; LDS, lithium dodecyl sulfate; PAGE, polyacryl- amide gel electrophoresis; EPR, electron paramagnetic resonance; 2Fe2.5, the two-iron two-sulfur cluster of cyt bcl; FeS, the iron-sulfur center- containingsubunitof cyt bcl; ENDOR, electronnuclear double resonance; DEAE, diethylaminoethyl; Tris, tris(hydroxymethy1)aminomethane; MOPS, 4-morpholinepropanesulfonic acid; DBH, 2,3-dimethoxy-5-decyI- 6-methyl- 1,4-dihydrobenzoquinone; PMS, dibenzopyrazine methosulfate; PES, dibenzopyrazine ethosulfate; DAD, 2,3,5,6-tetramethyl-p-phe- nylenediamine; OHNQ, 2-hydroxy-1,4-naphthoquinone; UHDBT, 5-n- undecyl-6- hydroxy-4,7-dihydro-4,7-dioxobenzothiazole; DMSO, dimethyl sulfoxide. sylvania. Chapel Hill, NC 27514. 0006-2960/93/0432- 1310$04.00/0 form (cyt bd, in the plant chloroplast membrane [for reviews see Hauska et al. (1983), Dutton (1986), and Prince (1990)l. Electron transfer through cyt bcl is promoted by a high- potential 2Fe2S cluster, cyt CI, and low- and high-potential b-type cytochromes, designated cyt bL and cyt b~. Integral to this activity, and the probable loci of proton binding and release, are the two discrete sites for redox catalysis of ubiquinone, called QO and Qi (Mitchell, 1975, 1976). Recent reviews described the generality of these functionalcomponents in cyt bcl of different sytems, as well as their thermodynamic properties, redox kinetics, and postulated locations in protein subunit sequences (Crofts & Wraight, 1983; Crofts et al., 1983; Rich, 1984; Dutton, 1986; Prince, 1990; Trumpower, 1990a,b). There have been many preparations of the cyt bq complex isolated from a variety of organisms. All complexes have in common three subunits which contain the 2Fe2S, the two heme b groups, and the cyt CI. However, additional subunits are identified with cyt bcl from different sources, ranging from more than 10 associated with the beef heart enzyme (Schagger et al., 1986) to three for the enzyme from Rhodospirillum rubrum (Wynn et al., 1986; Kriauciunas et al., 1989; Majewski & Trebst, 1990), Rhodopseudomonas viridis (Wynn et al., 1986;Cullyet al., 1989) and Paracoccus denitrificans (Yang & Trumpower, 1986). Recent years have seen a great deal of work devoted to the cyt bcl complex of Rhodobacter capsulatus, principally because it was the first photosynthetic organism to be geneticallymanipulated (Marrs, 1978;Scolnik & Marrs, 1987) and because it permits kinetic study by flash activation. The system has stimulated extensive physical-chemical, spectro- scopic, and functional investigations of cyt bcl in the native membranes of wild-type and mutant strains. Most recently, functional analysis and EPR studies of the enzyme in mutant 0 1993 American Chemical Society

Welcome message from author
This document is posted to help you gain knowledge. Please leave a comment to let me know what you think about it! Share it to your friends and learn new things together.
Transcript
1310 Biochemistry 1993, 32, 1310-1317
Hydroubiquinone-Cytochrome c 2 Oxidoreductase from Rhodobacter capsulatus: Definition of a Minimal, Functional Isolated Preparation?
Dan E. Robertson,'J Huangen Ding,$ Paul R. Chelminski,**o Clive Slaughter,ll Joan Hsu,ll Carolyn Moomaw,ll Mariko Tokito,l Fevzi Dalda1,I and P. Leslie Duttont
Department of Biochemistry and Biophysics, The Johnson Research Foundation, and Department of Biology, Plant Science Institute, University of Pennsylvania, Philadelphia, Pennsylvania I91 04, and Howard Hughes Medical Institute,
University of Texas Southwest Medical Center at Dallas, Dallas, Texas 75235 Received June 30, 1992; Revised Manuscript Received October 19, I992
ABSTRACT: The hydroubiquinone-cytochrome c2 oxidoreductase (cyt bcl) from Rhodobacter capsulatus has been solubilized according to the dodecyl maltoside method and isolated, and its minimal functional composition has been characterized. We find the complex to be composed of three protein subunits corresponding to polypeptides of cyt b (44 kDa), cyt C I (33 kDa), and 2Fe2S cluster (24 kDa). A fourth band sometimes discernable at 22 kDa appears to be an artifact of the polyacrylamide gel electrophoresis procedure. Its appearance is shown to be derived from the 2Fe2S cluster subunit by the similarity of the binding of subunit-specific monoclonal antibodies and the identical N-terminal sequence of the 24- and 22-kDa bands. The cofactors of cyt bcl, namely, cyt bH, cyt bL, cyt c1, and the 2Fe2S center, the Qm and Qow domains of the Qo site, and the Qi site appear intact as indicated by their optical and EPR spectral signatures, redox properties, and inhibitor binding. The electron paramagnetic resonance spectrum of the cyt bH heme is altered by antimycin, consistent with a change in the dihedral angle between the ligating histidine imidazoles, while the spectrum of the cyt bL heme is broadened by stigmatellin. The ubiquinone-10 content is variable, ranging from 0.8 to 3 molecules/cyt bcl. Activity studies define this three-subunit cyt bcl complex as a minimal structure, equipped as the enzyme in the native state and capable of full catalytic activity.
In energy-transducing membranes the free energy available in redox reactions is coupled to the formation of a proton gradient by a number of membrane-spanning, multipeptide complexes. One of these complexes is the hydroubiquinone cytochrome c oxidoreductase (cyt bcl), which converts energy from the oxidation of hydroubiquinone (QHz) from the membrane-bound ubiquinone pool (QWJ and reduction of a soluble cytochrome c to an electrochemical proton gradient. This complex is found across a broad phylogenetic spectrum, from the cytoplasmic membranes of phototrophic prokaryotes to the mitochondria of advanced eukaryotes and, in a modified
This research was supported from Public Health Service Grants GM 27309 to P.L.D. and GM 38237 to F.D.
* Correspondence should be addresed to this author. t Department of Biochemistry and Biophysics, University of Penn-
8 Present address: University of North Carolina School of Medicine,
11 University of Texas Southwest Medical Center at Dallas. I Department of Biology, University of Pennsylvania. I Abbreviations: cyt, cytochrome; cyt bcl, hydroubiquinone-cyto-
chrome c2 oxidoreductase; QH2, hydroubiquinone; Q, ubiquinone; cyt bL, low-potential cytochrome b566of cyt bcl; cyt bH, high-potential cytochrome b560 of cyt b q ; Qo, hydroubiquinone oxidizing site; Qi, ubiquinone reducing site; QPl, membrane-bound pool of ubiquinone; Eh, ambient redox potential; E,, electrochemical midpoint potential; E,,, electrochemical midpoint potential at pH 7; RC, photosynthetic reaction center; SDS, sodium dodecyl sulfate; LDS, lithium dodecyl sulfate; PAGE, polyacryl- amide gel electrophoresis; EPR, electron paramagnetic resonance; 2Fe2.5, the two-iron two-sulfur cluster of cyt bcl; FeS, the iron-sulfur center- containing subunit of cyt bcl; ENDOR, electron nuclear double resonance; DEAE, diethylaminoethyl; Tris, tris(hydroxymethy1)aminomethane; MOPS, 4-morpholinepropanesulfonic acid; DBH, 2,3-dimethoxy-5-decyI- 6-methyl- 1,4-dihydrobenzoquinone; PMS, dibenzopyrazine methosulfate; PES, dibenzopyrazine ethosulfate; DAD, 2,3,5,6-tetramethyl-p-phe- nylenediamine; OHNQ, 2-hydroxy- 1,4-naphthoquinone; UHDBT, 5-n- undecyl-6- hydroxy-4,7-dihydro-4,7-dioxobenzothiazole; DMSO, dimethyl sulfoxide.
sylvania.
Chapel Hill, NC 27514.
0006-2960/93/0432- 13 10$04.00/0
form (cyt b d , in the plant chloroplast membrane [for reviews see Hauska et al. (1983), Dutton (1986), and Prince (1990)l.
Electron transfer through cyt bcl is promoted by a high- potential 2Fe2S cluster, cyt CI, and low- and high-potential b-type cytochromes, designated cyt bL and cyt b ~ . Integral to this activity, and the probable loci of proton binding and release, are the two discrete sites for redox catalysis of ubiquinone, called QO and Qi (Mitchell, 1975, 1976). Recent reviews described the generality of these functional components in cyt bcl of different sytems, as well as their thermodynamic properties, redox kinetics, and postulated locations in protein subunit sequences (Crofts & Wraight, 1983; Crofts et al., 1983; Rich, 1984; Dutton, 1986; Prince, 1990; Trumpower, 1990a,b).
There have been many preparations of the cyt b q complex isolated from a variety of organisms. All complexes have in common three subunits which contain the 2Fe2S, the two heme b groups, and the cyt C I . However, additional subunits are identified with cyt bcl from different sources, ranging from more than 10 associated with the beef heart enzyme (Schagger et al., 1986) to three for the enzyme from Rhodospirillum rubrum (Wynn et al., 1986; Kriauciunas et al., 1989; Majewski & Trebst, 1990), Rhodopseudomonas viridis (Wynn et al., 1986; Cullyet al., 1989) and Paracoccus denitrificans (Yang & Trumpower, 1986).
Recent years have seen a great deal of work devoted to the cyt bcl complex of Rhodobacter capsulatus, principally because it was the first photosynthetic organism to be genetically manipulated (Marrs, 1978; Scolnik & Marrs, 1987) and because it permits kinetic study by flash activation. The system has stimulated extensive physical-chemical, spectro- scopic, and functional investigations of cyt bcl in the native membranes of wild-type and mutant strains. Most recently, functional analysis and EPR studies of the enzyme in mutant
0 1993 American Chemical Society
HydroubiquinoneCytochrome c2 Oxidoreductase
forms and in ubiquinone-extracted membranes have led to the formulation of a structural model for the QH2 oxidation site, Qo (Robertson et al., 1990) with suggestions that the site is composed of two binding domains, one with a strong affinity (Qw) and one with a weakaffinity (Qow) for ubiquinone (Ding et al., 1992). ENDOR studies (Gurbiel et al., 1991) on an isolated l5N-1abeledpreparation have indicated that the 2Fe2S cluster incorporates two histidines as ligands to one of the Fe atoms. In view of these developments it is timely that the isolated cyt bcl complex from R. capsulatus be better characterized. When the complex was originally isolated from R. capsulatus, four bands were observed on SDS-PAGE and it was concluded that the complex had four subunits (Ljungdahl et al., 1987). Subsequently, our routine gel electrophoresis examination of isolated complexes yielded inconsistent results with regard to this important question of subunit composition. The additional intent of the present report is to define a structurally minimal cyt bcl complex that retains full functional capabilities, relating it to the current status of knowledge of the enzyme in the native state. The investigation describes a three-subunit preparation with properties remarkably similar to its properties in vivo.
Biochemistry, Vol. 32, No. 5, 1993 1311
Activity Measurements. Activity of the complex was measured by following the rate of reduction of horse heart cyt c at 550 nm after addition of 40 pM 2,3-dimethoxy-5-decyl- 6-methyl- 1,4-dihydrobenzoquinone (DBH) as reported by Berry and Trumpower (1985). The activity was measured in various preparations of the enzyme and related to the molar content of cyt c1.
Ubiquinone Determination and Reconstitu tion. Ubiquinone was determined by the method of Kroger and Klingenberg (1973) as outlined in Ding et al. (1992). Based upon the cyt cI content, this value was found to be variable, in the range 0.5-3 ubiquinone molecules. For ubiquinone reconstitution, a stock mixture of 20 mg/mL soybean phosphatidylcholine and 20 mM ubiquinone-7 was prepared in 50 mM MOPS and 100 mM KC1, pH 7.0. Fifty microliters of this stock was added to 250 pL of isolated cyt bcl complex.
Polyclonal and Monoclonal Antibodies. Polyclonal anti- bodies were a gift of Dr. G. Hauska and were used as described in Davidson et al. (1987). Monoclonal antibodies were prepared according to Schreier et al. (1 980) by the monoclonal antibody facility of Cold Spring Harbor Laboratory under the direction of Dr. E. Harlow. Approximately 50 and 25 pg per mouse of purified cyt bcl in 50% glycerol were used for primary and secondary injections, respectively. Upon screen- ing by dot-blot assay (Schreier et al., 1980), positive clones were retained and further tested after several rounds of single- cell subculture.
SDS-PAGE and Western Blot Analysis. Culture super- natants of the positive hybridoma cell lines were analyzed by western blot (Towbin et al., 1979) using crude R. capsulatus chromatophores as antigen. One-dimensional SDS-PAGE was performed as described by Laemmli (1 970) using either a 12.5% linear or a 9-1876 gradient separating gel. The gel was blotted onto nitrocellulose filters (0.2-pm pore size) at ambient temperatures as in Towbin et al. (1 979), except that the blotting buffer contained 0.02% SDS. As a secondary antibody, goat anti-mouse or goat anti-rabbit antibodies coupled to horseradish peroxidase (Cappel or Bio-Rad) were used for monoclonal or polyclonal antibodies, respectively. Commercial Carnation nonfat dry milk was used as a nonspecific blocking agent for nitrocellulose filters. The antibody-antigen complex was formed and detected at room temperature using 1 ,4-chloronaphthol.
Amino Acid Sequencing. Amino acid sequence analysis was conducted by automated Edman degradation using an Applied Biosystems Inc. (Foster City, CA) Model 470A sequencer employing manufacturer’s programming and chem- icals. The sample was prepared for SDS-PAGE by adding 1 volume of SDS dissolving buffer to 1 volume of protein containing 120 pmol/component and incubating for 10 min prior to loading. After electrophoresis in 12.5% gels, the proteins were electroblotted to Immobilon paper (Millipore Corp., Bedford, MA) using themethodof Matsudaira (1987). The 24- and 22-kDa bands were located by staining with Coomassie Brilliant Blue and excised for sequencing.
Redox Titrations. For redox poising and titrations ac- companied by optical assay (Dutton, 1978), redox-mediating dyes were added to the following final concentrations: 20 pM N-methyldibenzopyrazine (PMS), N-ethyldibenzopyrazine (PES), pyocyanine, and phenazine; 25 pM 1 ,Cbenzoquinone, 1 ,Znaphthoquinone, and 1 ,Cnaphthoquinone; 50 pM duro- quinone; 70 pM 2,3,5,6-tetramethyl-p-phenylenediamine (DAD); and 15 pM 2-hydroxy-1 ,Cnaphthoquinone. For redox titrations prior to EPR analysis of the 2Fe2S, the following dyes were used: 40 pM each DAD, quinhydrone, PMS, and
MATERIALS AND METHODS
Bacterial Cultures. The strain of R. capsulatus used for the isolation of cyt bcl, pMTO-404/MTRKBl, was con- structed by deletion of the chromosomal copy of thepet operon from green strain MT113 1 and genetic complementation with a plasmid pMTO-404 containing the operon and a tetracycline resistance gene (Atta Asafo Adjei & Daldal, 1991). Genetic techniques are outlined in Daldal et al. (1989). The strain used contained multiple copies of the plasmid and overproduced the cyt bcl complex. The strain was cultured under photo- heterotrophic conditions with tetracycline added to the medium to a final concentration of 1.25 pg/mL and chromatophores were prepared as outlined in Dutton et al. (1975).
Isolation ofcyt bc,. Cyt bcl was isolated using the procedure outlined in Ljungdal et al. (1987) with modifications which are essentially those reported by Andrews et al. (1990) for isolation of the cyt bcl complex from Rhodobactersphaeroides. Solubilization of protein from chromatophores was performed in the buffered medium as earlier reported (Ljungdal et al., 1987) with the addition of 20% glycerol. The extract was loaded onto a Bio-Gel A50 DEAE column equilibrated in the same buffer plus 20% glycerol. Fractions with cyt bcl activity were pooled and dialyzed against 50 mM Tris, pH 8.0, 100 mM NaC1,l mM MgC12, and 0.1 mg/mL dodecyl maltoside prior to loading onto DEAE-Sepharose CL-6B. After elution of the protein from DEAE-Sepharose CL-6B, the protein fractions were concentrated and loaded onto a 1.5- X 100-cm Sepharose CL-4B column. As an alternative to the DEAE- Sepharose CL-6B column, the protein was also purified by elution from a Mono-Q HR 10/ 10 column as part of an FPLC system (Pharmacia LKB Biotechnology). In the present modified preparation the column elution profiles for Bio-Gel A50 DEAE and DEAE-Sepharose CL-6B columns were similar to those reported in Ljungdahl et al. (1987). The conclusion follows that the inclusion of 20% glycerol in the extraction, wash, and elution buffers of the first DEAE column has no effect on the elution profile. When Mono-Q was used in place of DEAE-Sepharose CL-6B, the separation of cyt bcl complex from cytochrome oxidase activity was more efficient and the complex was eluted in the absence of significant contamination,
1 3 12 Biochemistry, Vol. 32, No. 5, 1993 Robertson et al.
N,N,",N'-tetramethyl-p-phen ylenediamine. For preparation of EPR samples poised with 20 mM ascorbate, 0.1 pM PMS was added to facilitate equilibration.
Optical and EPR spectra. Optical spectra were obtained on a Johnson Foundation dual-wavelength spectrophotometer fitted with an anaerobic redox cuvette. Data were averaged and stored using an IBM-XT computer. The concentration of total cyt b in a fully-reduced minus fully-oxidized spectrum was determined using the extinction coefficient of Berden and Slater (1970), c560-574 = 28 mM-'. The concentration of cyt cl was determined from ascorbate-reduced minus ferricyanide- oxidized spectra using €551-540 = 19 mM-' (Wood, 1980).
EPR spectra were obtained on a Varian E-109 X-band spectrometer equipped with a variable-temperature flowing helium cryostat (Air Products LTD 3-1 10). 2Fe2S spectral measurements were performed at 25 K at a power setting of 1 mW unless otherwise noted. Spectra of the semiquinone (Qi-) of Qi were obtained at 200 K and 1 pW using a flowing nitrogen cryostat (Varian). Quantitation of spins was per- formed by comparison of integrated spectra with that of a sample of flavodoxin (for Q-) or copper perchlorate (for 2Fe2S), each prepared at known concentrations. Corrected field positions were determined by comparison to a weak pitch standard position at g = 2.0028.
Fitting of the g, transition of the 2Fe2S spectrum was done by deconvolution of the peak into simple gaussians using PEAKFIT software from Jandel Scientific. Proportions of each of the g, transitions characteristic of Qo occupancy by 0, 1, or 2 ubiquinones were determined by fixing the positions and widths at half-height of these features and then allowing a series of iterations to converge on a best fit.
Materials. Dibenzopyrazine methosulfate (PMS), diben- zopyrazine ethosulfate (PES), and antimycin were purchased from Sigma. Myxothiazol was purchased from Boehringer- Mannheim Biochemicals. UHDBT was obtained from Dr. B. L. Trumpower, Dartmouth University, and stigmatellin was obtained from Fluka. DBH 2,3-dimethoxy-5-methyl- 6-decyl- 1,4-dihydrobenzquinone) was custom-synthesized by Dr. David Birney, Texas Tech University. Quinhydrone, 2-hydroxyl ,4-naphthoquinone (OHNQ), and 2,3,5,6-tet- ramethyl-p-phenylenediamine (DAD) were obtained from Aldrich. Pyocyanine was synthesized by photooxidation of PMS and subsequently purified by chloroform extraction. Dodecyl maltoside was purchased from Anatrace, Inc. All other chemicals were reagent grade and were purchased from commercial sources.
RESULTS
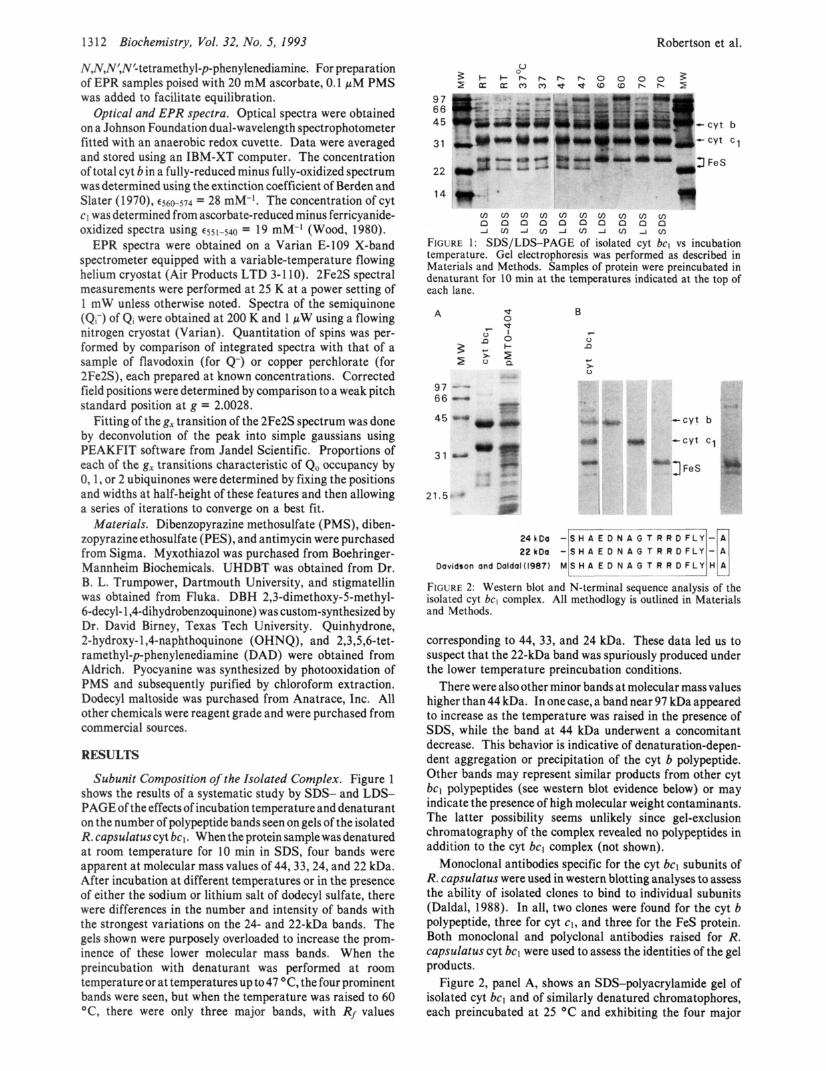
Subunit Composition of the Isolated Complex. Figure 1 shows the results of a systematic study by SDS- and LDS- PAGE of the effects of incubation temperature and denaturant on the number of polypeptide bands seen on gels of the isolated R. capsulatuscyt bcl. When the protein samplewasdenatured at room temperature for 10 min in SDS, four bands were apparent at molecular mass values of 44,33,24, and 22 kDa. After incubation at different temperatures or in the presence of either the sodium or lithium salt of dodecyl sulfate, there were differences in the number and intensity of bands with the strongest variations on the 24- and 22-kDa bands. The gels shown were purposely overloaded to increase the prom- inence of these lower molecular mass bands. When the preincubation with denaturant was performed at room temperature or at temperatures up to47 "C, the four prominent bands were seen, but when the temperature was raised to 60 "C, there were only three major bands, with Rf values
31
22
-cyt c1
3 FeS
14
v ) v ) v ) v ) v ) v ) v ) v ) v ) v ) n n n n n n n n n n - l r n - l r n d r n J C / l J W
FIGURE 1: SDS/LDS-PAGE of isolated cyt bcl vs incubation temperature. Gel electrophoresis was performed as described in Materials and Methods. Samples of protein were preincubated in denaturant for 10 min at the temperatures indicated at the top of each lane.
45 - - Iy - cyt b
31
21.5
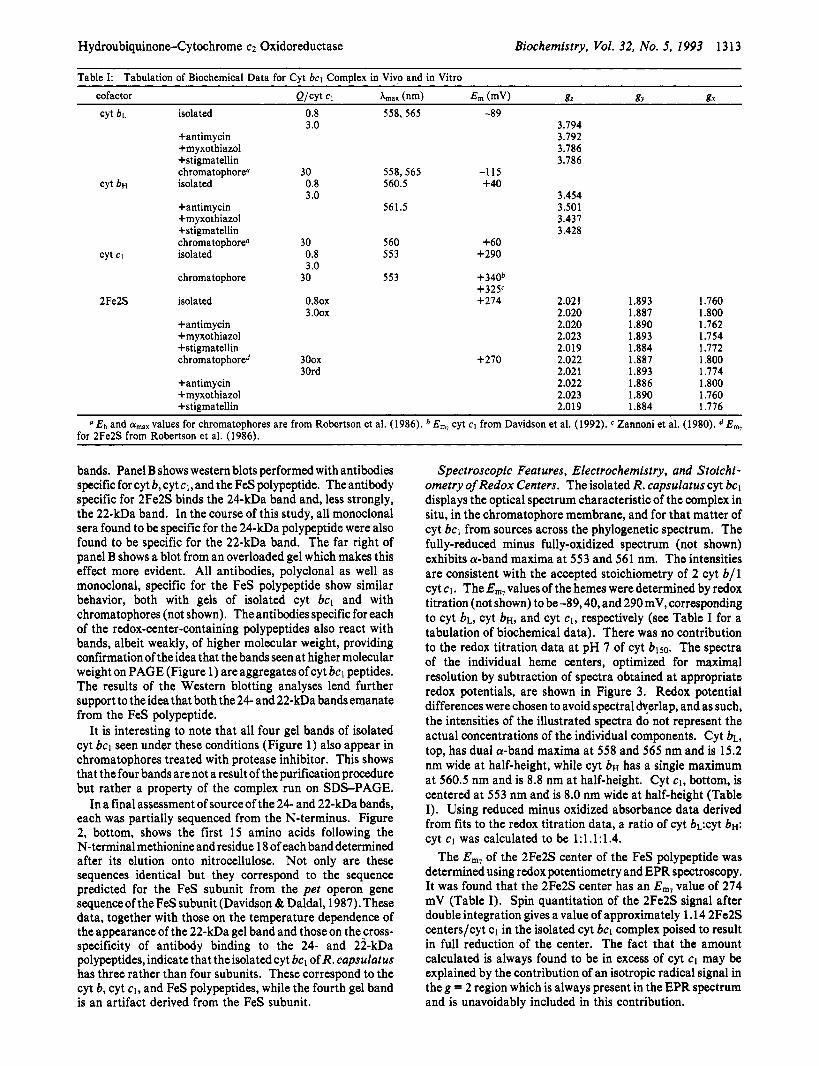
FIGURE 2: Western blot and N-terminal sequence analysis of the isolated cyt bcl complex. All methodlogy is outlined in Materials and Methods.
corresponding to 44, 33, and 24 kDa. These data led us to suspect that the 22-kDa band was spuriously produced under the lower temperature preincubation conditions.
There were also other minor bands at molecular mass values higher than 44 kDa. In onecase, a band near 97 kDa appeared to increase as the temperature was raised in the presence of SDS, while the band at 44 kDa underwent a concomitant decrease. This behavior is indicative of denaturation-depen- dent aggregation or precipitation of the cyt b polypeptide. Other bands may represent similar products from other cyt bc, polypeptides (see western blot evidence below) or may indicate the presence of high molecular weight contaminants. The latter possibility seems unlikely since gel-exclusion chromatography of the complex revealed no polypeptides in addition to the cyt bcl complex (not shown).
Monoclonal antibodies specific for the cyt bcl subunits of R. capsulatus were used in western blotting analyses to assess the ability of isolated clones to bind to individual subunits (Daldal, 1988). In all, two clones were found for the cyt b polypeptide, three for cyt cl, and three for the FeS protein. Both monoclonal and polyclonal antibodies raised for R. capsulatus cyt bcl were used to assess the identities of the gel products.
Figure 2, panel A, shows an SDS-polyacrylamide gel of isolated cyt bcl and of similarly denatured chromatophores, each preincubated at 25 "C and exhibiting the four major
HydroubiquinoneCytochrome c2 Oxidoreductase Biochemistry, Vol. 32, No. 5, 1993 1313
Table I: Tabulation of Biochemical Data for Cyt bcl Complex in Vivo and in Vitro
cofactor Q/W CI h" (nm) E , (mV) gz gv gx
cyt b L isolated 0.8 558,565 -89 3.0 3.794
+antimycin 3.792 +myxothiazol 3.786 +stigmatellin 3.786 chromatophore" 30 558,565 -115
CYt hi isolated 0.8 560.5 +40 3.0 3.454
+antimycin 561.5 3.501 +myxothiazol 3.437 +stigmatellin 3.428 chromatophoreo 30 560 +60
cyt CI isolated 0.8 553 +290 3 .O
chromatophore 30 553 +340b +325c
2Fe2S isolated 0 . 8 0 ~ +274 2.021 1.893 1.760 3 . 0 0 ~ 2.020 1.887 1.800
+antimycin 2.020 1.890 1.762 +myxothiazol 2.023 1.893 1.754 +stigmatellin 2.019 1.884 1.772 chromatophored 3Oox +270 2.022 1.887 1.800
30rd 2.021 1.893 1.774 +antimycin 2.022 1.886 1.800 +myxothiazol 2.023 1.890 1.760 +stigmatellin 2.019 1.884 1.776
" /i?h and a,,, values for chromatophores are from Robertson et al. (1986). E,,,, cyt CI from Davidson et al. (1992). Zannoni et al. (1980). E,,,, for 2Fe2S from Robertson et al. (1986).
bands. Panel B shows western blots performed with antibodies specific for cyt b, cyt c1, and the FeS polypeptide. The antibody specific for 2Fe2S binds the 24-kDa band and, less strongly, the 22-kDa band. In the course of this study, all monoclonal sera found to be specific for the 24-kDa polypeptide were also found to be specific for the 22-kDa band. The far right of panel B shows a blot from an overloaded gel which makes this effect more evident. All antibodies, polyclonal as well as monoclonal, specific for the FeS polypeptide show similar behavior, both with gels of isolated cyt bcl and with chromatophores (not shown). The antibodies specific for each of the redox-center-containing polypeptides also react with bands, albeit weakly, of higher molecular weight, providing confirmation of the idea that the bands seen at higher molecular weight on PAGE (Figure 1) are aggregates of cyt bcl peptides. The results of the Western blotting analyses lend further support to the idea that both the 24- and 22-kDa bands emanate from the FeS polypeptide.
It is interesting to note that all four gel bands of isolated cyt bcl seen under these conditions (Figure 1) also appear in chromatophores treated with protease inhibitor. This shows that the four bands are not a result of the purification procedure but rather a property of the complex run on SDS-PAGE.
In a final assessment of source of the 24- and 22-kDa bands, each was partially sequenced from the N-terminus. Figure 2, bottom, shows the first 15 amino acids following the N-terminal methionine and residue 18 of each band determined after its elution onto nitrocellulose. Not only are these sequences identical but they correspond to the sequence predicted for the FeS subunit from the pet operon gene sequenceof the FeS subunit (Davidson & Daldal, 1987). These data, together with those on the temperature dependence of the appearance of the 22-kDa gel band and those on the cross- specificity of antibody binding to the 24- and 22-kDa polypeptides, indicate that the isolated cyt bcl of R . capsulatus has three rather than four subunits. These correspond to the cyt b, cyt c1, and FeS polypeptides, while the fourth gel band is an artifact derived from the FeS subunit.
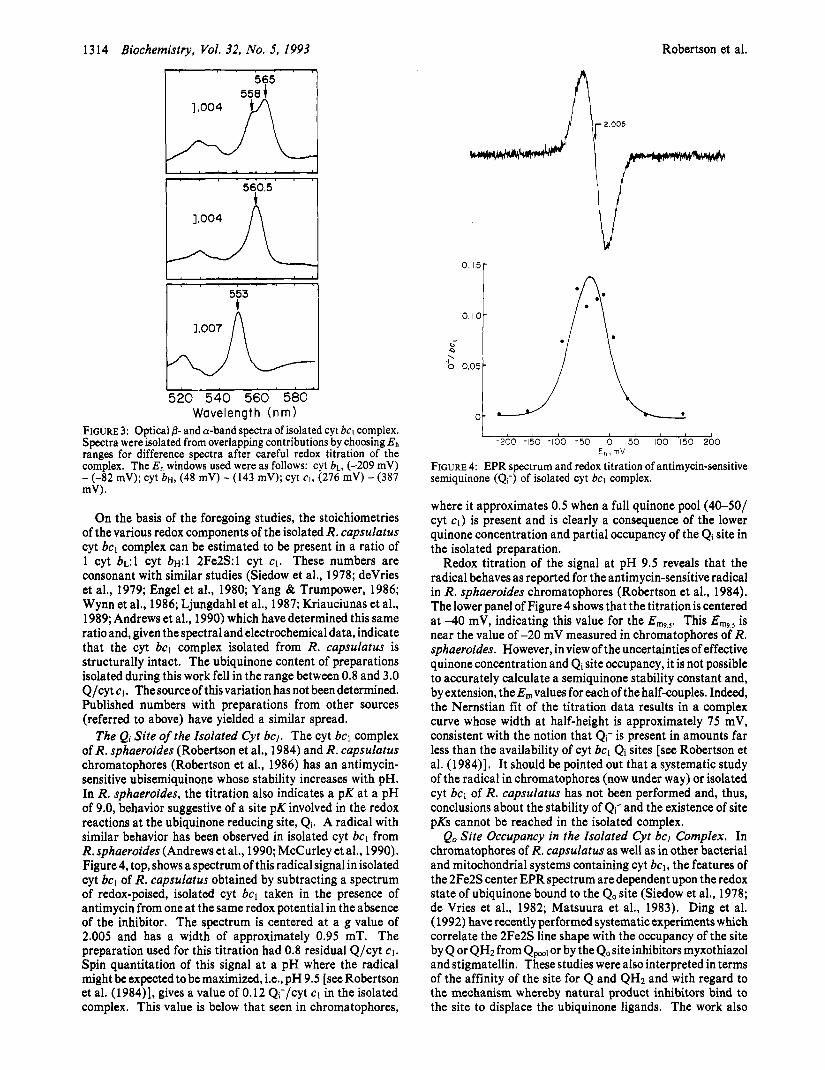
Spectroscopic Features, Electrochemistry, and Stoichi- ometry of Redox Centers. The isolated R. capsulatus cyt bcl displays the optical spectrum characteristic of the complex in situ, in the chromatophore membrane, and for that matter of cyt bcl from sources across the phylogenetic spectrum. The fully-reduced minus fully-oxidized spectrum (not shown) exhibits a-band maxima at 553 and 561 nm. The intensities are consistent with the accepted stoichiometry of 2 cyt b/l cyt c1. The E,, values of the hemes were determined by redox titration (not shown) to be-89,40, and 290 mV, corresponding to cyt b ~ , cyt b ~ , and cyt c1, respectively (see Table I for a tabulation of biochemical data). There was no contribution to the redox titration data at pH 7 of cyt blso. The spectra of the individual heme centers, optimized for maximal resolution by subtraction of spectra obtained at appropriate redox potentials, are shown in Figure 3. Redox potential differences were chosen to avoid spectral dverlap, and as such, the intensities of the illustrated spectra do not represent the actual concentrations of the individual components. Cyt b ~ , top, has dual a-band maxima at 558 and 565 nm and is 15.2 nm wide at half-height, while cyt b~ has a single maximum at 560.5 nm and is 8.8 nm at half-height. Cyt c1, bottom, is centered at 553 nm and is 8.0 nm wide at half-height (Table I). Using reduced minus oxidized absorbance data derived from fits to the redox titration data, a ratio of cyt bL:cyt bH: cyt c1 was calculated to be 1:1.1:1.4.
The E,, of the 2Fe2S center of the FeS polypeptide was determined using redox potentiometry and EPR spectroscopy. It was found that the 2Fe2S center has an E,,,, value of 274 mV (Table I). Spin quantitation of the 2Fe2S signal after double integration gives a value of approximately 1.14 2Fe2S centers/cyt c1 in the isolated cyt bcl complex poised to result in full reduction of the center. The fact that the amount calculated is always found to be in excess of cyt C I may be explained by the contribution of an isotropic radical signal in the g = 2 region which is always present in the EPR spectrum and is unavoidably included in this contribution.
13 14 Biochemistry, Vol. 32, No. 5, I993 pq
I
Robertson et al.
I ' "
0.15r
A r 2.005
I 553 I I
L, . ' ' "
520 540 560 580 Wavelength (nm)
FIGURE 3: Optical 8- and a-band spectra of isolated cyt bcl complex. Spectra were isolated from overlapping contributions by choosing Eh ranges for difference spectra after careful redox titration of the complex. The Eh windows used were as follows: cyt b ~ , (-209 mV) - (-82 mV); cyt b ~ , (48 mV) - (143 mV); cyt cI, (276 mV) - (387 mV).
On the basis of the foregoing studies, the stoichiometries of the various redox components of the isolated R. capsulatus cyt bcl complex can be estimated to be present in a ratio of 1 cyt bL:l cyt bH:l 2Fe2S:l cyt c1. These numbers are consonant with similar studies (Siedow et al., 1978; deVries et al., 1979; Engel et al., 1980; Yang & Trumpower, 1986; Wynn et al., 1986; Ljungdahl et al., 1987; Kriauciunas et al., 1989; Andrews et al., 1990) which have determined this same ratio and, given the spectral and electrochemical data, indicate that the cyt bcl complex isolated from R. capsulatus is structurally intact. The ubiquinone content of preparations isolated during this work fell in the range between 0.8 and 3.0 Q/cyt c l . The source of this variation has not been determined. Published numbers with preparations from other sources (referred to above) have yielded a similar spread.
The Qi Site of the Isolated Cyt bcl. The cyt bcl complex of R. sphaeroides (Robertson et al., 1984) and R. capsulatus chromatophores (Robertson et al., 1986) has an antimycin- sensitive ubisemiquinone whose stability increases with pH. In R. sphaeroides, the titration also indicates a pK at a pH of 9.0, behavior suggestive of a site pK involved in the redox reactions at the ubiquinone reducing site, Qi. A radical with similar behavior has been observed in isolated cyt bcl from R. sphaeroides (Andrews et al., 1990; McCurley et al., 1990). Figure 4, top, shows a spectrum of this radical signal in isolated cyt bcl of R. capsulatus obtained by subtracting a spectrum of redox-poised, isolated cyt bcl taken in the presence of antimycin from one at the same redox potential in the absence of the inhibitor. The spectrum is centered at a g value of 2.005 and has a width of approximately 0.95 mT. The preparation used for this titration had 0.8 residual Q/cyt CI. Spin quantitation of this signal at a pH where the radical might be expected to be maximized, Le., pH 9.5 [see Robertson et al. (1984)], gives a value of 0.12 Q;/cyt c1 in the isolated complex. This value is below that seen in chromatophores,
0.10- I I \
Hydroubiquinone-Cytochrome c2 Oxidoreductase
9.1 1.795 ; L.* 2TOmT PI* 1.887; L,* 1.52mT ~ , * 2 . 0 2 0 ; L,*O.%mT
g,' 1.783 ; La. 5.WmT gy* 1.889; L = 1.9OmT g,*2.021 ; L:* i.mmT
Biochemistry, Vol. 32, No. 5, 1993 1315
g,= 1.767 ; L.. 7.x)mT gY. 1.893 ; L = 2.2OmT ~ , * Z . O Z I ; L:= 1.60mT
I 9.' 1.760; L.*8.OOmT gY= 1.893, L,. 2.20mT 9,*2.021 ; Lz. 1.60mT
4
9.. 1.760; L,.8.00mT gI. 1.893; LY=2.2OmT gz* 2.021 , L,* I 6OmT
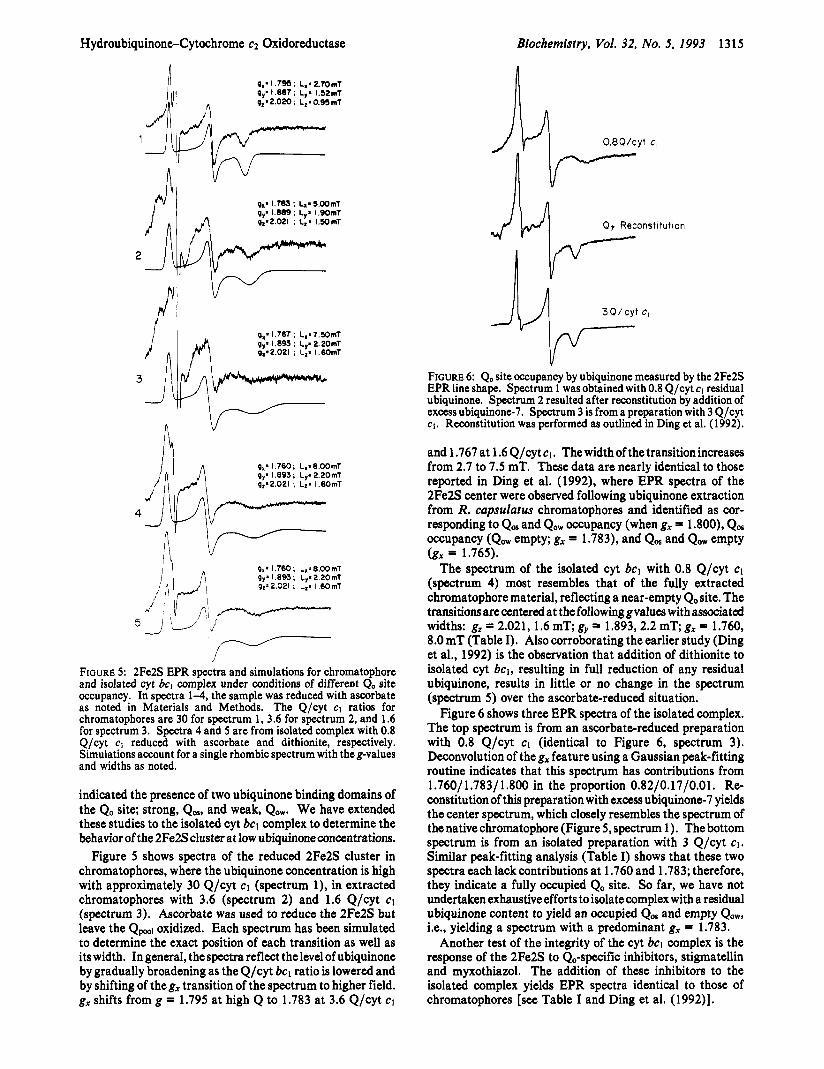
J FIGURE 5: 2Fe2S EPR spectra and simulations for chromatophore and isolated cyt bc1 complex under conditions of different Qo site occupancy. In spectra 1-4, the sample was reduced with ascorbate as noted in Materials and Methods. The Q/cyt cl ratios for chromatophores are 30 for spectrum 1, 3.6 for spectrum 2, and 1.6 for spectrum 3. Spectra 4 and 5 are from isolated complex with 0.8 Q/cyt cI reduced with ascorbate and dithionite, respectively. Simulations account for a single rhombic spectrum with theg-values and widths as noted.
indicated the presence of two ubiquinone binding domains of the Qo site; strong, Q-, and weak, Qow. We have extended these studies to the isolated cyt bcl complex to determine the behavior of the 2Fe2S cluster at low ubiquinoneconcentrations.
Figure 5 shows spectra of the reduced 2Fe2S cluster in chromatophores, where the ubiquinone concentration is high with approximately 30 Q/cyt c1 (spectrum l), in extracted chromatophores with 3.6 (spectrum 2) and 1.6 Q/cyt c1 (spectrum 3). Ascorbate was used to reduce the 2Fe2S but leave the Qpl oxidized. Each spectrum has been simulated to determine the exact position of each transition as well as its width. In general, the spectra reflect the level of ubiquinone by gradually broadening as the Q/cyt bcl ratio is lowered and by shifting of theg, transition of the spectrum to higher field. gx shifts from g = 1.795 at high Q to 1.783 at 3.6 Q/cyt c1
vv FIGURE 6: Qo site occupancy by ubiquinone measured by the 2Fe2S EPR line shape. Spectrum 1 was obtained with 0.8 Q/cyt CI residual ubiquinone. Spectrum 2 resulted after reconstitution by addition of excess ubiquinone-7. Spectrum 3 is from a preparation with 3 Q/cyt cl. Reconstitution was performed as outlined in Ding et al. (1992).
and 1.767 at 1.6 Q/cyt CI. The width of the transition increases from 2.7 to 7.5 mT. These data are nearly identical to those reported in Ding et al. (1992), where EPR spectra of the 2Fe2S center were observed following ubiquinone extraction from R. capsulatus chromatophores and identified as cor- responding to Qos and Qow occupancy (when g, = 1.800), Qos occupancy (Qow empty; g, = 1.783), and Qos and Qow empty (g, = 1.765).
The spectrum of the isolated cyt bcl with 0.8 Q/cyt c1 (spectrum 4) most resembles that of the fully extracted chromatophore material, reflecting a near-empty Qo site. The transitionsarecenteredat thefollowinggvalues with associated widths: g, = 2.021, 1.6 mT; g,, = 1.893,2.2 mT; g, = 1.760, 8.0 mT (Table I). Also corroborating the earlier study (Ding et al., 1992) is the observation that addition of dithionite to isolated cyt bcl, resulting in full reduction of any residual ubiquinone, results in little or no change in the spectrum (spectrum 5 ) over the ascorbate-reduced situation.
Figure 6 shows three EPR spectra of the isolated complex. The top spectrum is from an ascorbate-reduced preparation with 0.8 Q/cyt c1 (identical to Figure 6, spectrum 3). Deconvolution of the g, feature using a Gaussian peak-fitting routine indicates that this spectrum has contributions from 1.760/1.783/1.800 in the proportion 0.82/0.17/0.01. Re- constitution of this preparation with excess ubiquinone-7 yields the center spectrum, which closely resembles the spectrum of the native chromatophore (Figure 5 , spectrum 1). The bottom spectrum is from an isolated preparation with 3 Q/cyt CI. Similar peak-fitting analysis (Table I) shows that these two spectra each lack contributions at 1.760 and 1.783; therefore, they indicate a fully occupied Qo site. So far, we have not undertaken exhaustive efforts to isolate complex with a residual ubiquinone content to yield an occupied Qos and empty Qow, Le., yielding a spectrum with a predominant g, = 1.783.
Another test of the integrity of the cyt bcl complex is the response of the 2Fe2S to Qo-specific inhibitors, stigmatellin and myxothiazol. The addition of these inhibitors to the isolated complex yields EPR spectra identical to those of chromatophores [see Table I and Ding et al. (1992)l.
Robertson et al.
diisoprenyl ubiquinone analogues and horse heart cyt c in aqueous detergent solution. Using 2-methyl-3-decyl-5,6- dimethoxy- 1,4-hydrobenzcquinone, we obtain turnover rates around 350 f 40 s-l. This value is obtained regardless of the residual quinone content of the preparation; the 0.8 Q/cyt CI preparation displayed a rate of 350 s-l, while that containing 3 Q/cyt c1 had a rate of 380 s-1. Material prepared with a final purification step of DEAE-Sepharose yielded lower rates than that purified on Mono-Q. Thus, we find that activity is not altered by the presence in the Qo site of bound ubiquinones; the variation with preparation is attributed to the physical properties of the detergent-aqueous dispersion. The prepa- ration, then, is capable of turnover rates comparable to those of the native membrane. We have not measured the proton pumping activity of the isolated complex, and these mea- surements await the reconstitution of the enzyme into liposomes.
1316 Biochemistry, Vol. 32, No. 5, 1993
3.454
3.792 I A + Antimycin
3.786 + Stigmatel l in
3.786 I /.i + Myxothiazol
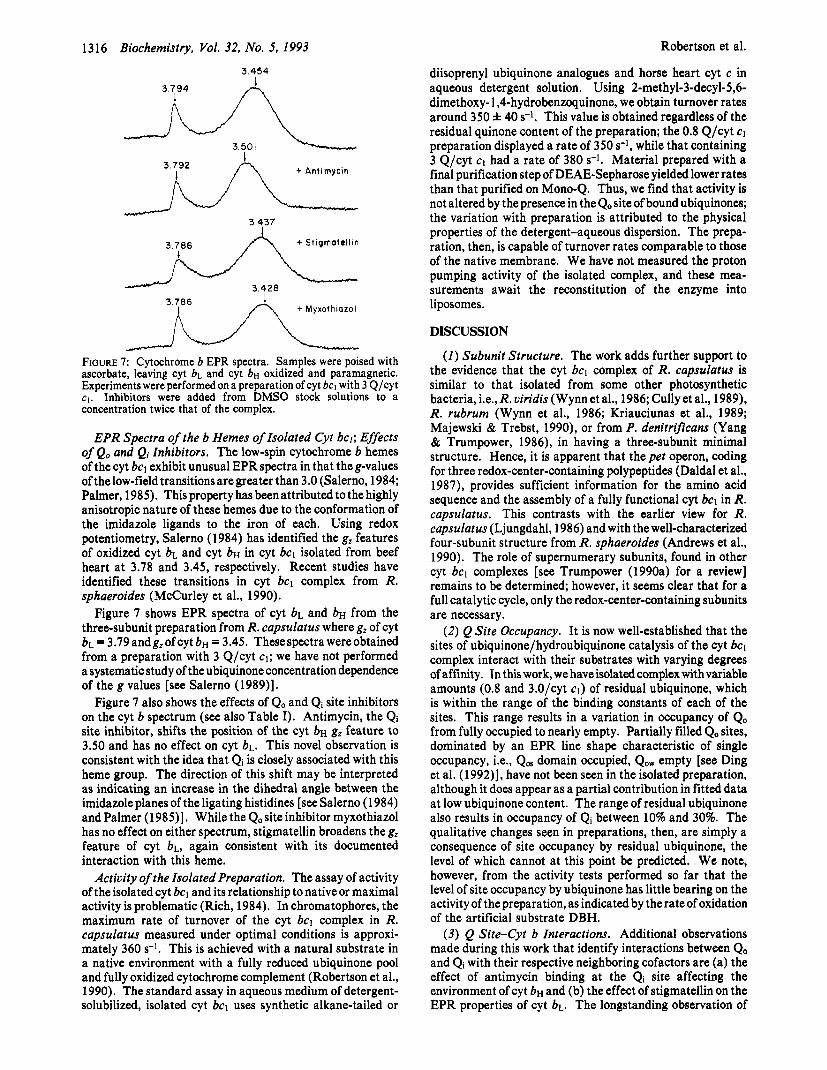
FIGURE 7: Cytochrome 6 EPR spectra. Samples were poised with ascorbate, leaving cyt b~ and cyt bH oxidized and paramagnetic. Experiments were performed on a preparation of cyt bcl with 3 Q/cyt cI . Inhibitors were added from DMSO stock solutions to a concentration twice that of the complex.
EPR Spectra of the b Hemes of Isolated Cyt bcl; Effects of Qo and Qi Inhibitors. The low-spin cytochrome b hemes of the cyt bcl exhibit unusual EPR spectra in that the g-values of the low-field transitions are greater than 3.0 (Salerno, 1984; Palmer, 1985). This property has been attributed to the highly anisotropic nature of these hemes due to the conformation of the imidazole ligands to the iron of each. Using redox potentiometry, Salerno (1984) has identified the g, features of oxidized cyt bL and cyt bH in cyt bcl isolated from beef heart at 3.78 and 3.45, respectively. Recent studies have identified these transitions in cyt bcl complex from R . sphaeroides (McCurley et al., 1990).
Figure 7 shows EPR spectra of cyt bL and bH from the three-subunit preparation from R. capsulatus where g, of cyt bL = 3.79andgZofcyt bH = 3.45. Thesespectrawereobtained from a preparation with 3 Q/cyt cl; we have not performed a systematic study of the ubiquinone concentration dependence of the g values [see Salerno (1989)l.
Figure 7 also shows the effects of Qo and Qi site inhibitors on the cyt b spectrum (see also Table I). Antimycin, the Qi site inhibitor, shifts the position of the cyt bH g, feature to 3.50 and has no effect on cyt bL. This novel observation is consistent with the idea that Qi is closely associated with this heme group. The direction of this shift may be interpreted as indicating an increase in the dihedral angle between the imidazole planes of the ligating histidines [see Salerno (1984) and Palmer (1985)l. While the Qo site inhibitor myxothiazol has no effect on either spectrum, stigmatellin broadens the g, feature of cyt bL, again consistent with its documented interaction with this heme.
Activity of the Isolated Preparation. The assay of activity of the isolated cyt bcl and its relationship to native or maximal activity is problematic (Rich, 1984). In chromatophores, the maximum rate of turnover of the cyt bcl complex in R. capsulatus measured under optimal conditions is approxi- mately 360 s-l. This is achieved with a natural substrate in a native environment with a fully reduced ubiquinone pool and fully oxidized cytochrome complement (Robertson et al., 1990). The standard assay in aqueous medium of detergent- solubilized, isolated cyt bcl uses synthetic alkane-tailed or
DISCUSSION
(I) Subunit Structure. The work adds further support to the evidence that the cyt bcl complex of R . capsulatus is similar to that isolated from some other photosynthetic bacteria, i.e., R . viridis (Wynn et al., 1986; Cullyet al., 1989), R. rubrum (Wynn et al., 1986; Kriauciunas et al., 1989; Majewski & Trebst, 1990), or from P. denitrifcans (Yang & Trumpower, 1986), in having a three-subunit minimal structure. Hence, it is apparent that the pet operon, coding for three redox-center-containing polypeptides (Daldal et al., 1987), provides sufficient information for the amino acid sequence and the assembly of a fully functional cyt bcl in R . capsulatus. This contrasts with the earlier view for R . capsulutus (Ljungdahl, 1986) and with the well-characterized four-subunit structure from R. sphaeroides (Andrews et al., 1990). The role of supernumerary subunits, found in other cyt bcl complexes [see Trumpower (1990a) for a review] remains to be determined; however, it seems clear that for a full catalytic cycle, only the redox-center-containing subunits are necessary.
( 2 ) Q Site Occupancy. It is now well-established that the sites of ubiquinone/hydroubiquinone catalysis of the cyt bcl complex interact with their substrates with varying degrees of affinity. In this work,wehaveisolated complex withvariable amounts (0.8 and 3.0/cyt CI) of residual ubiquinone, which is within the range of the binding constants of each of the sites. This range results in a variation in occupancy of Qo from fully occupied to nearly empty. Partially filled Qo sites, dominated by an EPR line shape characteristic of single occupancy, i.e., Qos domain occupied, Qow empty [see Ding et al. (1992)], have not been seen in the isolated preparation, although it does appear as a partial contribution in fitted data at low ubiquinone content. The range of residual ubiquinone also results in occupancy of Qi between 10% and 30%. The qualitative changes seen in preparations, then, are simply a consequence of site occupancy by residual ubiquinone, the level of which cannot at this point be predicted. We note, however, from the activity tests performed so far that the level of site occupancy by ubiquinone has little bearing on the activity of the preparation, as indicated by the rate of oxidation of the artificial substrate DBH.
( 3 ) Q Site-Cyt b Interactions. Additional observations made during this work that identify interactions between Qo and Qi with their respective neighboring cofactors are (a) the effect of antimycin binding at the Qi site affecting the environment of cyt bH and (b) the effect of stigmatellin on the EPR properties of cyt bL. The longstanding observation of
HydroubiquinoneCytochrome c2 Oxidoreductase
an antimycin-induced red shift in the optical spectrum of cyt b~ indicates a change in the electronic environment sur- rounding the heme, while the EPR shift induced by this Qi inhibitor is an indication of geometrical rearrangement of the heme axial ligands (Salerno, 1984; Palmer, 1984). On the other hand, while myxothiazol and stigmatellin have each been shown to shift the optical spectrum of cyt b ~ , only stigmatellin has an effect on the EPR spectrum of this heme. We note, however, that these results contrast in part with those of McCurley et al. (1 990), working with R. sphaeroides.
Thus, in summary, this investigation has described a fully functional, three-subunit cyt bcl complex. This complex, as isolated, is equipped with heme and FeS cofactors which display native spectroscopic signatures. Similarly, their electrochemistry, at least at neutral pH, is indistinguishable from the complex in vivo. The sites of ubiquinone and hydroubiquinone redox catalysis are also intact. The simplicity of this complete redox complex together with its ease of manipulation by mutagenesis make the R. capsularus cyt bcl an attractive system for future investigations, including the study of redox-linked protonation and deprotonation mech- anisms.
Biochemistry, Vol. 32, No. 5, 1993 1317
Dutton, P. L. (1986) in Encyclopedia of Plant Physiology (Staechlin, A., & Arntzen, C. J., Eds.) Vol. 19, pp 197-237, Springer-Verlag, West Berlin.
Dutton, P. L., Petty, K. M., Bonner, H. S., & Morse, S. D. (1978) Biochim. Biophys. Acta 387, 536-556.
Engle, W. D., Schagger, H., & von Jagow, G. (1980) Biochim. Biophys. Acta 592, 21 1-222.
Evans, E. H., & Crofts, A. R. (1974) Biochim. Biophys. Acta
Gurbiel, R., Ohnishi, T., Robertson, D. E., Daldal, F., & Hoffman,
Hauska, G., Hurt, E., Gabellini, N., & Lockau, W. (1983)
Kriauciunas, A,, Yu, L., Yu, C.-A., Wynn, R. M., & Knaff, D.
357, 89-102.
B. M. (1991) Biochemistry 30, 11579-11584.
Biochim. Biophys. Acta 726, 97-133.
B. (1989) Biochim. Biophys. Acta 976, 70-76.
ACKNOWLEDGMENT
The authors thank Dr. Tomoko Ohnishi for generously providing computer hardware and data accumulation and simulation software. We also thank Dr. David Knaff for helpful discussions.
REFERENCES
Andrews, K. M., Crofts, A. R., & Gennis, R. B. (1990)
Atta-Asafo Adjei, E., & Daldal, F. (1991) Proc. Natl. Acad. Sci.
Berden, J. A., & Slater, E. C. (1970) Biochim. Biophys. Acta
Berry, E. A., & Trumpower, B. L. (1985) J . Biol. Chem. 260,
Crofts, A. R., & Wraight, C. (1983) Biochim. Biophys. Acta
Crofts, A. R., Meinhardt, S. W., Jones, K. R., & Snozzi, M. (1983) Biochim. Biophys. Acta 723, 202-218.
Cully, M., Jay, F. A., Gabellini, N., & Oesterhelt, D. (1989) in Techniques and New Developments in Photosynthesis Research (Barber, J., & Malkin, R., Eds.) pp 287-289, Plenum Press, New York.
Daldal, F. (1988) inLight Energy Transduction in Photosynthesis (Stevens, E. D., & Bryant, D. A., Eds.) pp 259-273, American Society of Plant Physiology, Richville, MD.
Daldal, F., Davidson, E., & Cheng, S. (1987) J . Mol. Biol. 195, 1-12.
Daldal, F., Tokito, M. K., Davidson, E., & Fahman, M. (1989) EMBO J. 8, 3951-3961.
Davidson, E., & Daldal, F. (1987) J . Mol. Biol. 195, 12-24. Davidson, E., Prince, R. C., Daldal, F., Hauska, G., & Marrs,
Davidson, E., Ohnishi, T., Tokito, M., & Daldal, F. (1992)
deVries,S., Albracht, S. P. J., & Leeuwerik, F. J. (1979) Biochim.
Ding, H., Robertson, D. E., Daldal, F., & Dutton, P. L. (1992)
Dutton, P. L. (1978) Methods Enzymol. 54, 41 1-435.
Biochemistry 29, 2645-265 1 .
U.S.A. 88, 492-496.
21 6, 237-249.
2458-2467.
726, 149-185.
B. L. (1987) Biochim. Biophys. Acta 890, 292-301.
Biochemistry 31, 3351-3358.
Biophys. Acta 546, 316-333.
Biochemistry 31, 3144-3158.
Kroger, A,,. & Klingenbeig; M. (1973) Eur. J. Biochem. 34, 358-368.
Laemmli, U.K. (1970) Nature 227, 680-685. Ljungdahl, P. O., Pennoyer, J. D., Robertson, D. E., &
Trumpower, B. L. (1987) Biochim. Biophys. Acta 891,227- 241.
Majewski, C., & Trebst, A. (1990) Mol. Gen. Genet. 224, 373- 382.
Marrs, B. L. (1978) in The Photosynthetic Bacteria (Sistrom, W. R., & Clayton, R. K., Eds.) pp 873-883, Plenum Press, New York.
Matsudaira, P. (1987) J . Biol. Chem. 262, 10035-10038. Matsuura, K., Bowyer, J. R., Ohnishi, T., & Dutton, P. L. (1983)
McCurley, J. P., Miki, T.,Yu, L., & Yu,C.-A. (1990) Biochim.
Mitchell, P. (1975) FEBS Lett. 59, 137-139. Mitchell, P. (1976) J . Theor. Biol. 62, 327-367. Palmer (1985) Biochem. SOC. Trans. 13, 548-560. Prince, R. C. (1990) in The Bacteria, Vol 12, pp 111-149,
Rich, P. R. (1984) Biochim. Biophys. Acta 768, 53-79. Robertson, D. E., Prince, R. C., Bowyer, J., Matsuura, K.-I.,
Dutton, P. L., & Ohnishi, T. (1984) J . Biol. Chem. 259,1758- 1763.
Robertson, D. E., Davidson, E., Prince, R. C., van den Berg, W. H., Marrs, B. L., & Dutton, P. L. (1986) J . Biol. Chem. 261, 584-591.
Robertson, D. E., Daldal, F., & Dutton, P. L. (1990) Biochemistry
Salerno, J. C. (1984) J. Biol. Chem. 259, 2331-2336. Salerno, J. C., Xu, Y., Osgood, M. P., Kim, C. H., & King, T.
E. (1989) J. Biol. Chem. 264, 15398-15403. Schagger, H., Link, T. A,, Engle, W. D., & von Jagow, G. (1 986)
Methods Enzymol. 126, 224-237. Schreier, M., Kohler, G., Hengartner, H., Berek, C., Trucco, M.,
& Forni, L. (1980) Hybridoma Techniques, Cold Spring Harbor Laboratory Press, Cold Spring Harbor, NY.
Scolnik, P. A,, & Marrs, B. L. (1987) Annu. Rev. Microbiol. 41,
Siedow, J. N., Power, S., de la Rosa, F. F., & Palmer, G. (1978)
Towbin, H., Staehelin, T., & Gordon, J. (1979) Proc. Natl. Acad.
Trumpower, B. L. (1990a) Microbiol. Reu. 54, 101-129. Trumpower, B. L. (1990b) J . Biol. Chem. 265, 11409-11412. Wood, P. (1980) Biochem. J . 192, 761-764. Wynn, R. M., Gaul, D. F., Choi, W.-K., Shaw, R. W., & Knaff,
Yang, X., & Trumpower, B. L. (1986) J. Biol. Chem. 261,12282-
Zannoni, D., Prince, R. C., Dutton, P. L., & Marrs, B. L. (1980)
J . Biol. Chem. 258, 1571-1579.
Biophys. Acta 1020, 176-186.
Academic Press, New York.
29, 11249-1 1260.
703-726.
J. Biol. Chem. 253, 2392-2399.
Sci. U.S.A. 76, 4350-4354.
D. B. (1986) Photosynth. Res. 9, 181-195.
12289.
FEBS Lett. 113, 289-293.
Related Documents