HESSD 10, 4099–4132, 2013 Hydrologic restoration of an urbanized area D. H. Trinh and T. F. M. Chui Title Page Abstract Introduction Conclusions References Tables Figures Back Close Full Screen / Esc Printer-friendly Version Interactive Discussion Discussion Paper | Discussion Paper | Discussion Paper | Discussion Paper | Hydrol. Earth Syst. Sci. Discuss., 10, 4099–4132, 2013 www.hydrol-earth-syst-sci-discuss.net/10/4099/2013/ doi:10.5194/hessd-10-4099-2013 © Author(s) 2013. CC Attribution 3.0 License. Hydrology and Earth System Sciences Open Access Discussions This discussion paper is/has been under review for the journal Hydrology and Earth System Sciences (HESS). Please refer to the corresponding final paper in HESS if available. Assessing the hydrologic restoration of an urbanized area via integrated distributed hydrological model D. H. Trinh 1 and T. F. M. Chui 2 1 Department of Civil and Environmental Engineering, National University of Singapore, Singapore, Singapore 2 Department of Civil Engineering, The University of Hong Kong, Hong Kong, China Received: 5 December 2012 – Accepted: 22 March 2013 – Published: 4 April 2013 Correspondence to: T. F. M. Chui ([email protected]) Published by Copernicus Publications on behalf of the European Geosciences Union. 4099

Welcome message from author
This document is posted to help you gain knowledge. Please leave a comment to let me know what you think about it! Share it to your friends and learn new things together.
Transcript
HESSD10, 4099–4132, 2013
Hydrologicrestoration of anurbanized area
D. H. Trinh andT. F. M. Chui
Title Page
Abstract Introduction
Conclusions References
Tables Figures
J I
J I
Back Close
Full Screen / Esc
Printer-friendly Version
Interactive Discussion
Discussion
Paper
|D
iscussionP
aper|
Discussion
Paper
|D
iscussionP
aper|
Hydrol. Earth Syst. Sci. Discuss., 10, 4099–4132, 2013www.hydrol-earth-syst-sci-discuss.net/10/4099/2013/doi:10.5194/hessd-10-4099-2013© Author(s) 2013. CC Attribution 3.0 License.
EGU Journal Logos (RGB)
Advances in Geosciences
Open A
ccess
Natural Hazards and Earth System
Sciences
Open A
ccess
Annales Geophysicae
Open A
ccess
Nonlinear Processes in Geophysics
Open A
ccess
Atmospheric Chemistry
and Physics
Open A
ccess
Atmospheric Chemistry
and Physics
Open A
ccess
Discussions
Atmospheric Measurement
Techniques
Open A
ccess
Atmospheric Measurement
Techniques
Open A
ccess
Discussions
Biogeosciences
Open A
ccess
Open A
ccess
BiogeosciencesDiscussions
Climate of the Past
Open A
ccess
Open A
ccess
Climate of the Past
Discussions
Earth System Dynamics
Open A
ccess
Open A
ccess
Earth System Dynamics
Discussions
GeoscientificInstrumentation
Methods andData Systems
Open A
ccess
GeoscientificInstrumentation
Methods andData Systems
Open A
ccess
Discussions
GeoscientificModel Development
Open A
ccess
Open A
ccess
GeoscientificModel Development
Discussions
Hydrology and Earth System
Sciences
Open A
ccess
Hydrology and Earth System
Sciences
Open A
ccess
Discussions
Ocean Science
Open A
ccess
Open A
ccess
Ocean ScienceDiscussions
Solid Earth
Open A
ccess
Open A
ccess
Solid EarthDiscussions
The Cryosphere
Open A
ccess
Open A
ccessThe Cryosphere
Discussions
Natural Hazards and Earth System
Sciences
Open A
ccess
Discussions
This discussion paper is/has been under review for the journal Hydrology and Earth SystemSciences (HESS). Please refer to the corresponding final paper in HESS if available.
Assessing the hydrologic restoration ofan urbanized area via integrateddistributed hydrological model
D. H. Trinh1 and T. F. M. Chui2
1Department of Civil and Environmental Engineering, National University of Singapore,Singapore, Singapore2Department of Civil Engineering, The University of Hong Kong, Hong Kong, China
Received: 5 December 2012 – Accepted: 22 March 2013 – Published: 4 April 2013
Correspondence to: T. F. M. Chui ([email protected])
Published by Copernicus Publications on behalf of the European Geosciences Union.
4099
HESSD10, 4099–4132, 2013
Hydrologicrestoration of anurbanized area
D. H. Trinh andT. F. M. Chui
Title Page
Abstract Introduction
Conclusions References
Tables Figures
J I
J I
Back Close
Full Screen / Esc
Printer-friendly Version
Interactive Discussion
Discussion
Paper
|D
iscussionP
aper|
Discussion
Paper
|D
iscussionP
aper|
Abstract
Green structures (e.g. green roof and bio-retention systems) are adopted to mitigatethe hydrological impacts of urbanization. However, our current understanding of the ur-banization impacts are often process-specific (e.g. peak flow or storm recession), andour characterizations of green structures are often on a local scale. This study uses5
an integrated distributed hydrological model, Mike SHE, to evaluate the urbanizationimpacts on both overall water balance and water regime, and also the effectiveness ofgreen structures at a catchment level. Three simulations are carried out for a highly ur-banized catchment in the tropics, representing pre-urbanized, urbanized and restoredconditions. Urbanization transforms vegetated areas into impervious surfaces, result-10
ing in 20 and 66 % reductions in infiltration and base flow respectively, and 60 to 100 %increase in peak outlet discharge. Green roofs delay the peak outlet discharge by 2 hand reduce the magnitude by 50 %. Bio-retention systems mitigate the peak dischargeby 50 % and also enhance infiltration by 30 %. The combination of green roofs andbio-retention systems even reduces the peak discharge to the pre-urbanized level. The15
simulation results obtained are independent of field data, enabling a generic model forunderstanding hydrological changes during the different phases of urbanization. Thiswill benefit catchment level planning of green structures in other urban areas.
1 Introduction
Urbanization transforms vegetated areas into impervious surfaces. This causes water20
flow to be intervened by man-made structures and drainage networks, resulting in sig-nificant impacts on hydrological conditions (Antrop, 2004; Haase, 2009). The first andforemost impact is the change in water balance (DeFries and Eshleman, 2004). Thereplacement of vegetation with impervious surface enhances surface runoff and riverdischarge (Bhaduri et al., 2000; Dietz and Clausen, 2008; Wang et al., 2005; Du et25
al., 2012; Ott and Uhlenbrook, 2004; Sanders, 1986) and also reduces water losses
4100
HESSD10, 4099–4132, 2013
Hydrologicrestoration of anurbanized area
D. H. Trinh andT. F. M. Chui
Title Page
Abstract Introduction
Conclusions References
Tables Figures
J I
J I
Back Close
Full Screen / Esc
Printer-friendly Version
Interactive Discussion
Discussion
Paper
|D
iscussionP
aper|
Discussion
Paper
|D
iscussionP
aper|
through canopy interception, vegetation evapotranspiration and soil evaporation (Dowand DeWalle, 2000; Endreny, 2005; Rose and Peters, 2001). Not only surface water,urbanization also affects groundwater in terms of recharge (Barron et al., 2013). Somesuggest that groundwater recharge increases due to the reduction in evapotranspira-tion (Klocking and Haberlandt, 2002; Rose and Peters, 2001) and/or the leakage from5
water systems and sewers if the groundwater table is lower than the pipe level (Gobelet al., 2004; Lerner, 1990). Others believe that the additional impervious surfaces de-crease groundwater recharge due to the reduction of infiltration (Collin and Melloul,2003; Rose and Peters, 2001; Schoonover et al., 2006). Besides changing water bal-ance, urbanization also influences water regime (i.e. pattern of flow) such as increasing10
and decreasing the high and low flows respectively, and also increases the daily vari-ation in stream flow locally (Konrad and Booth, 2005). The storm recession period isalso significantly shorter in urban streams (Rose and Peters, 2001). As listed above,there are numerous studies examining the hydrological impacts of urbanization. Nev-ertheless, they mostly focus on the changes in particular components or processes,15
and examine the impacts on either water balance or water regime. There is thus anincentive to develop an integrated understanding on the overall changes in both waterbalance and water regime.
For environmental benefits and water resources management, there has been ris-ing interests to mitigate the hydrological impacts of urbanization and to restore pre-20
urbanized hydrological conditions. One approach is to implement small-scale hydro-logic control throughout a catchment. Examples of such hydrologic controls, knownas “green structures” or “low impact development practices”, include green roofs andbio-retention systems. Even though there are many variants of green structures, greenroofs and bio-retention systems are representative of most kinds of green structures as25
they comprise the main hydrologic restoration mechanisms of surface runoff delay andinfiltration enhancement. Green roofs collect and retain rainwater falling onto buildingsfor a certain period of time (from hours to days) (Oberndorfer et al., 2007), thereby re-ducing and delaying water discharge to the canals. Studies have found that green roofs
4101
HESSD10, 4099–4132, 2013
Hydrologicrestoration of anurbanized area
D. H. Trinh andT. F. M. Chui
Title Page
Abstract Introduction
Conclusions References
Tables Figures
J I
J I
Back Close
Full Screen / Esc
Printer-friendly Version
Interactive Discussion
Discussion
Paper
|D
iscussionP
aper|
Discussion
Paper
|D
iscussionP
aper|
retain 40–80 % of precipitation (Hutchinson et al., 2003; Palla et al., 2012; VanWoertet al., 2005) and reduce 60–80 % of peak discharge (Bliss et al., 2009; Mentens et al.,2006; Palla et al., 2012; Villarreal et al., 2004). They also tend to retain a higher fractionof precipitation in small storms than in large ones (Carter and Rasmussen, 2006). Onthe other hand, bio-retention systems not only retain stormwater (Xiao and McPherson,5
2011) but also enhance infiltration (Davis, 2008; James and Dymond, 2012). Evaluat-ing the effectiveness of bio-retention systems Holman-Dodds et al. (2003) concludedthat they do not reduce runoff significantly on the site with low infiltration capacity;while Chang et al. (2009) emphasised that it is more effective when sited close to thewatershed outlet. More quantitatively, Davis (2008) showed that with 2 % bio-retention10
system over 0.24 ha area, peak flow reduced by 44 to 63 %. However, most of theabove studies are in plot-scale or small catchments, only evaluating the local impactsof an individual green structure.
The objective of this study is to assess the catchment-scale impact of urbanizationon both water balance and water regime using an integrated distributed hydrological15
model, Mike SHE. The model should include all the main hydrological components(e.g. canopy interception, evapotranspiration, overland flow, river routing and ground-water) and should detail the spatial variations within a catchment. With the use ofthe integrated distributed hydrological model, the feasibility of restoring the hydrologi-cal condition is examined through the implementation of green roofs and bio-retention20
systems on a catchment-scale.
2 Methodology
2.1 The integrated distributed hydrological model
Urbanization and green structures affect the interactions of various hydrological pro-cesses such as canopy interception, plant evapotranspiration, water and soil evapora-25
tion, infiltration, overland flow, and groundwater flow. Thus, an integrated hydrological
4102
HESSD10, 4099–4132, 2013
Hydrologicrestoration of anurbanized area
D. H. Trinh andT. F. M. Chui
Title Page
Abstract Introduction
Conclusions References
Tables Figures
J I
J I
Back Close
Full Screen / Esc
Printer-friendly Version
Interactive Discussion
Discussion
Paper
|D
iscussionP
aper|
Discussion
Paper
|D
iscussionP
aper|
model that accounts for all the above processes is needed to access the hydrologicalimpacts of urbanization and green structures. Compared to distributed models, lumpedmodels have two main limitations. Firstly, the domain response is only evaluated at theoutlet and sub-domain response is not considered. Furthermore, the various charac-teristics of a catchment are lumped into one single parameter which may not be truly5
reflective. This research is interested in sub-domain response and also requires theconsiderations of the heterogeneous land uses including green structures in an urban-ized catchment. Therefore, despite the high demand in input data and long computationtime, a fully distributed model is more suitable for this study.
In particular, Mike SHE (System Hydrologique European), a comprehensive deter-10
ministic, distributed, and physically based modelling system, is selected for this re-search. Mike SHE couples river routing modelling (Mike 11), overland flow and ground-water modelling, giving a complex integrated hydrological analysis of surface and sub-surface water systems. It simulates all major processes in the land phase of the hydro-logical cycle, including precipitation, interception, infiltration, evapotranspiration, sub-15
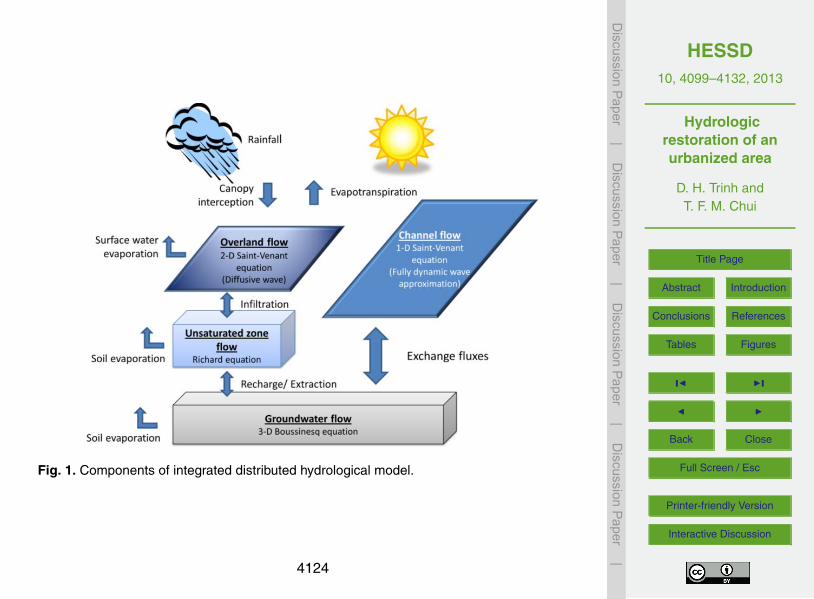
surface flow in unsaturated and saturated zones, overland flow and flow in the channeland river. Figure 1 shows the main components of Mike SHE and their governing equa-tions. The Saint Venant equation is solved numerically in two dimensions for overlandflow and in one dimension for channel flow. The one-dimensional Richards’ equation(or simplified gravity equation) is solved for the pressure head (or moisture) variation in20
the unsaturated zone. The horizontal movement of water in unsaturated zone is consid-ered negligible. Saturated groundwater flow is simulated using the three-dimensionalBoussinesq equation.
4103
HESSD10, 4099–4132, 2013
Hydrologicrestoration of anurbanized area
D. H. Trinh andT. F. M. Chui
Title Page
Abstract Introduction
Conclusions References
Tables Figures
J I
J I
Back Close
Full Screen / Esc
Printer-friendly Version
Interactive Discussion
Discussion
Paper
|D
iscussionP
aper|
Discussion
Paper
|D
iscussionP
aper|
2.2 Green roofs and bio-retention systems – conceptual understanding andmodel implementation
2.2.1 Green roof
Green roof is a conventional roof covered with soil and vegetation, and consists of fourmain components: vegetation layer, soil layer, geotextile filter and drainage material5
(Czemiel Berndtsson, 2010). It functions as a micro-catchment and includes all themain hydrological processes such as: rainfall, plant interception, evapotranspiration,infiltration and storage. Though green roof is often installed to save energy and tomitigate the urban heat island effect, it has also been shown to benefit stormwatermanagement (Bengtsson et al., 2005; Mentens and Raes et al., 2006; VanWoert et al.,10
2005). Rainfall needs to percolate and infiltrate through the vegetation and soil layers,thereby delaying runoff discharge as well as improving water runoff quality.
The key hydrological impact of a green roof during a storm event is the delay inrunoff discharge. In MikeSHE, this delay in runoff discharge is simulated by delayingthe rainfall in each individual green roof by 3 h. The duration of delay is based on15
previously published studies; Moran et al. (2004) reported a delay time of 3 h and Roweet al. (2003) found peak flow was delayed by 2 to 4.5 h. The detailed flow processwithin the different layers of a green roof is not simulated given its high computationaldemand and small impact on predicting the overall discharge delay of a green roof.Other important hydrological processes, such as evapotranspiration and infiltration, are20
simulated as part of the integrated model as explained in Sect. 2.1.
2.2.2 Bio-retention system
Bio-retention system is a shallow planted depression, and consists of ponding area,filter media, transition layer and drainage layer. It is one of the stormwater best man-agement practices that provides both conveyance function and stormwater treatment.25
Stormwater runoff is filtrated through and treated by vegetation and soil within the
4104
HESSD10, 4099–4132, 2013
Hydrologicrestoration of anurbanized area
D. H. Trinh andT. F. M. Chui
Title Page
Abstract Introduction
Conclusions References
Tables Figures
J I
J I
Back Close
Full Screen / Esc
Printer-friendly Version
Interactive Discussion
Discussion
Paper
|D
iscussionP
aper|
Discussion
Paper
|D
iscussionP
aper|
bio-retention area. The filtrated water is either collected by a drainage system or al-lowed to infiltrate into the ground. To enhance infiltration into the system, it oftenemploys filter media with a hydraulic conductivity of one to two orders of magnitude(i.e. 10 to 100 times) higher than that of the surrounding soil profile. In addition, the sys-tem allows ponding which provides further flow retention. In the integrated hydrological5
model, we implement bio-retention systems that allow stormwater to infiltrate directlyinto the surrounding soil profile (i.e. no subsoil drainage). The bio-retention systemsare modelled as homogenous soils with a high hydraulic conductivity of 10−5 m s−1,extending 1 m below the ground. The systems are also equipped with 20 cm of deten-tion ponding. All the hydrological processes, e.g. evapotranspiration and infiltration, are10
also considered in the integrated model.
2.3 Marina-like catchment – a case study in Singapore
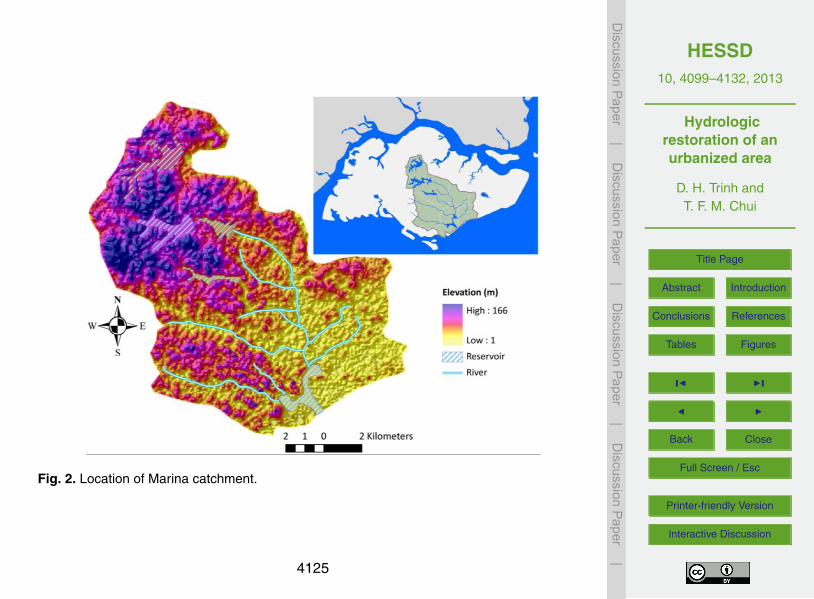
The biophysical and hydrological environment of Singapore has altered dramaticallydue to rapid urbanization and industrialization (Lu et al., 2005). Marina catchment(Fig. 2), the most urbanized part of Singapore, has typical characteristics of a highly15
urbanized catchment in the tropical area. It has a catchment area of 160.8 km2, andcurrently consists of different land uses and soil conditions and includes the differentcomponents of hydrological and vegetation system (e.g. plant, river, reservoirs, mix-ture of permeable and impermeable surfaces). Adopting the main characteristics ofMarina catchment, an integrated distributed hydrological model of Marina-like catch-20
ment is built to evaluate the impact of urbanization on water balances and regimes.In other words, this objective of this study is not to reproduce the exact situations ofMarina catchment, but rather to demonstrate the generic influences of urbanization onhydrological conditions. The model is further developed and applied to evaluate the ef-fectiveness of catchment-scale green structures in mitigating the hydrological impacts25
of urbanization.To address the issues raised in the objective, several simulations are performed.
Firstly, to evaluate the effect of urbanization in Singapore, a pre-urbanized scenario4105
HESSD10, 4099–4132, 2013
Hydrologicrestoration of anurbanized area
D. H. Trinh andT. F. M. Chui
Title Page
Abstract Introduction
Conclusions References
Tables Figures
J I
J I
Back Close
Full Screen / Esc
Printer-friendly Version
Interactive Discussion
Discussion
Paper
|D
iscussionP
aper|
Discussion
Paper
|D
iscussionP
aper|
in which all the hydrological conditions are at natural state is set up. It is then com-pared with an urbanized scenario in which all the hydrological factors are urbanized.Secondly, to evaluate the effectiveness of green structures in minimizing the impactof urbanization, another set of scenarios is set up to reflect the different strategiesin installing the green structures in an urbanized environment. The results are then5
compared with those without the green structures to conclude their effectiveness. Thesimulation of each scenario is one-year, and is further elaborated below:
– The first scenario (pre-urbanized) represents the condition before urbanization inwhich the entire land surface is covered by plants and the rivers are in naturalconditions.10
– The second scenario (urbanized) represents the current situation in which theland surface coverage has changed drastically due to urbanization and is acombination of permeable, impermeable surfaces and buildings; rivers are alsoconcrete-lined.
– The third scenario represents hypothetical situations in which green roofs and/or15
bio-retention systems are installed at strategic locations to mitigate the hydrolog-ical impacts of urbanization. This scenario is further divided into three differentstrategies:
– Strategy 1: Restored by green roofs (Green roof). All the buildings in thecatchment are covered with green roofs which account for 14 % of the catch-20
ment area.
– Strategy 2: Restored by bio-retention systems (Bio-retention). 5 % of thecatchment area is converted from impervious surfaces in the urbanized sce-nario to bio-retention systems in this strategy. The bio-retention systems arelocated near the streams and are in areas where the groundwater table is at25
least 1.5 m below the ground.
4106
HESSD10, 4099–4132, 2013
Hydrologicrestoration of anurbanized area
D. H. Trinh andT. F. M. Chui
Title Page
Abstract Introduction
Conclusions References
Tables Figures
J I
J I
Back Close
Full Screen / Esc
Printer-friendly Version
Interactive Discussion
Discussion
Paper
|D
iscussionP
aper|
Discussion
Paper
|D
iscussionP
aper|
– Strategy 3: Restored by both green roofs and bio-retentions (Hybrid). Thehybrid is a combination of green roofs and bio-retention strategy.
To focus on the impacts resulting from the change from vegetated to impervious sur-face and the implementation of green structures, other factors such as climate, soil andtopography are assumed not to change among the scenarios. Each scenario is run for5
one year under the same climate condition. The digital-elevation model SRTM (i.e. to-pography) in 2005 is obtained from US Geological Survey with 30 m resolution (USGS,2010) and are applied to all three scenarios. The surface mesh includes 89 900 ele-ments; each element is rectangular with a dimension of 60 by 60 m. Below the surfacemesh, 45 subsurface layers are added. The thickness of layers increases with depth,10
starting from 0.2 m at the top to 1 m at the bottom. Each of the main hydrologic com-ponents has its own time step. River routing is the most dynamic process and is highlyresponsive to rainfall and topographical condition, followed by overland flow, and finallyunsaturated and groundwater flow. However, there is a flow exchange between thedifferent flow processes, which lead to some restrictions on the time steps. For river15
routing, a time step of 1 min is used. For overland flow, unsaturated and groundwatercomponents, time steps of 0.25, 0.5 and 12 h are used respectively.
2.3.1 Surface and subsurface parameters
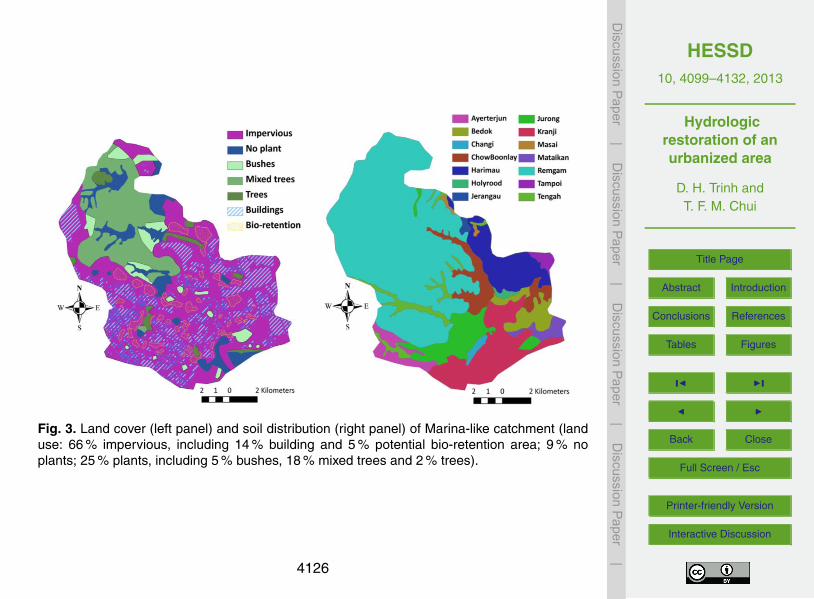
To parameterize the surface and subsurface, the model domain is divided into zonesbased on the land cover, surface properties, soils, and geology. Land cover map (Fig. 3)20
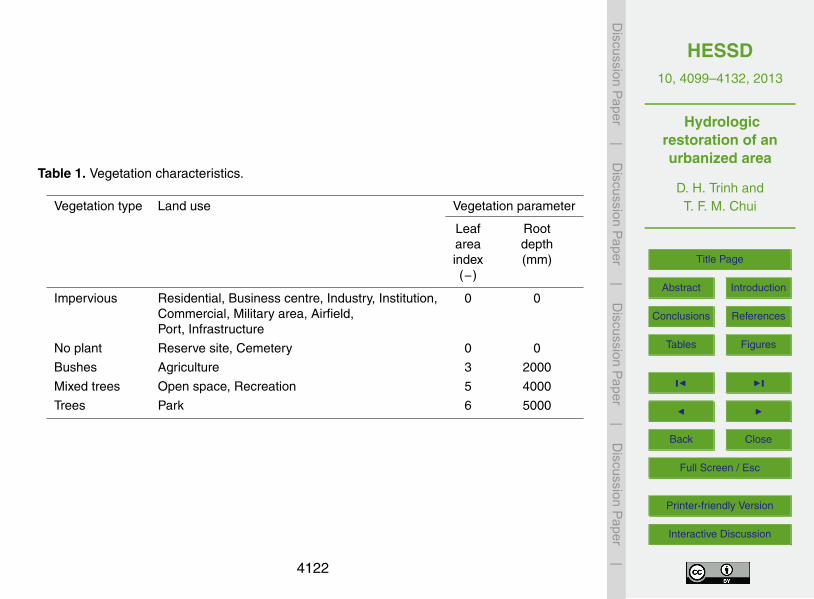
is digitized from Singapore Master Plan in 2003 (URA, 2003), and is classified intofour groups with vegetation of different leaf area indexes (LAI) and roof depths (RD)(Table 1).
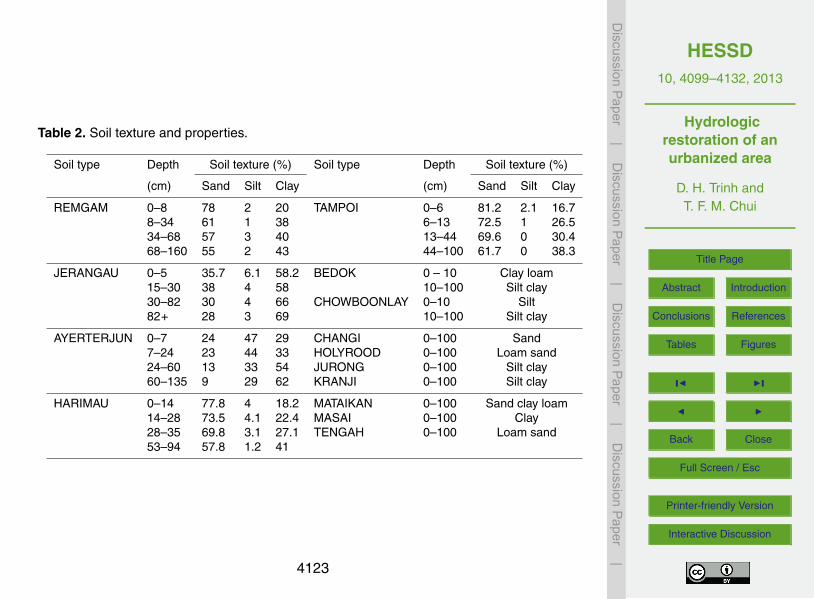
For soil properties, top soil (i.e. soil from surface up to 1 m depth) information isextracted from Singapore soil map (Fig. 3), digitized from the Soil of the Republic of25
Singapore (Wells, 1977; Ives, 1977). Below 1 m depth, the soil is assumed to be loamysand. Using the soil information from Table 2, together with the hydraulic parameters
4107
HESSD10, 4099–4132, 2013
Hydrologicrestoration of anurbanized area
D. H. Trinh andT. F. M. Chui
Title Page
Abstract Introduction
Conclusions References
Tables Figures
J I
J I
Back Close
Full Screen / Esc
Printer-friendly Version
Interactive Discussion
Discussion
Paper
|D
iscussionP
aper|
Discussion
Paper
|D
iscussionP
aper|
of standard soil texture from United State Department of Agriculture, Van Genuchtenparameters are estimated to define moisture retention and unsaturated hydraulic con-ductivity.
Regarding surface properties, detention storage is used to limit the amount of wa-ter that can flow over the ground surface; the depth of ponded water must exceed the5
detention depth before water is routed overland. For Marina-like catchment, detentiondepth is generally set as 0.01 mm as the catchment is mostly covered by impervioussurface. The detention depth for reservoirs is the maximum reservoir level, while thedetention depth is set as 20 cm for areas with bio-retention systems based on Singa-pore’s National Water Agency guideline for bio-retention systems design (PUB, 2011).10
In Mike SHE, the amount of precipitation reaching the ground is considered as pondedwater. Part of the ponded water infiltrates into the ground. The remaining part is calledavailable ponded water and is used to estimate the amount of surface runoff. The frac-tion of available ponded water contributing to surface runoff depends on runoff fractionor runoff coefficient. In our case study, it is assumed that the runoff coefficients for im-15
permeable and permeable coverage are 70 and 30 %, respectively. Surface roughness,defined by Manning number (M) (inverse of the conventional Manning’s coefficient n),are 25 and 80 for surface covered with plant and open space, respectively. The valuesare equivalent to the Manning’s coefficient of 0.04 and 0.0125, which are typical valuesfor vegetated and concreted surface (Chow, 1959).20
For geological properties, hydraulic parameters for the saturated zone are assumedto be loamy sand, a typical soil type in Singapore, for the entire catchment with a hori-zontal hydraulic conductivity of 1.22×10⁻⁵ [m s−1] and a vertical hydraulic conductivityequivalent to 10 % of the horizontal hydraulic conductivity. Specific yield and specificstorage is 0.2 [−] (Freeze and Cherry, 1979) and 9.82×10⁻⁴ m−1 (Younger, 1993),25
respectively.
4108
HESSD10, 4099–4132, 2013
Hydrologicrestoration of anurbanized area
D. H. Trinh andT. F. M. Chui
Title Page
Abstract Introduction
Conclusions References
Tables Figures
J I
J I
Back Close
Full Screen / Esc
Printer-friendly Version
Interactive Discussion
Discussion
Paper
|D
iscussionP
aper|
Discussion
Paper
|D
iscussionP
aper|
2.3.2 Initial condition
The initial condition of the integrated hydrological model is the combination of the initialconditions of different components such as ponding depth, soil moisture content andgroundwater table. Ponding depth of reservoirs is assumed to be at the reservoir waterlevels, and is set at 0 m in the rest of the domain. To obtain an initial groundwater con-5
dition, a 10 yr simulation is carried out. As the groundwater table in Singapore is only afew meters below the ground surface (Rezaur et al., 2003), the initial groundwater tablefor the 10 yr simulation is set at 1.5 m below the ground. The climate condition of year2005 is repeated 10 times for this 10 yr simulation. The groundwater table, reachingdynamic equilibrium after 10 yr, is then used as the initial condition of the remaining10
simulations. The initial condition sensitivity analysis of the results to the initial conditionis also carried out. It is shown that within a reasonable or range of initial conditions, theresults converge to the same solutions. Initial soil moisture is set to achieve equilibriumpressure corresponding to the groundwater table from the 10 yr simulation. In addition,for each of the 1 yr scenario simulation, another 5 yr of stabilization simulation is carried15
out to obtain dynamic equilibrium conditions of all the hydrological components whichare then used as the initial conditions for that particular scenario.
2.3.3 Boundary conditions
For the top boundary, precipitation is the only in-flux and evapotranspiration is theonly out-flux. Rainfall and potential evapotranspiration are assumed to be uniformly20
distributed in the entire catchment. Hourly rainfall data from year 2005 is obtainedfrom the Kent Ridge campus of National University of Singapore (NUS), located at theSouth-Western edge of the catchment. Evapotranspiration is calculated from Penman–Monteith method (Eq. 1) using hourly weather data (e.g. atmospheric pressure, airtemperature, relative humidity, wind speed, and incoming radiation) from NUS for year25
2005.
4109
HESSD10, 4099–4132, 2013
Hydrologicrestoration of anurbanized area
D. H. Trinh andT. F. M. Chui
Title Page
Abstract Introduction
Conclusions References
Tables Figures
J I
J I
Back Close
Full Screen / Esc
Printer-friendly Version
Interactive Discussion
Discussion
Paper
|D
iscussionP
aper|
Discussion
Paper
|D
iscussionP
aper|
λE =∆ (Hnet − G) + ρaircp
(e0z − ez
)/ra
∆ + γ(1 + rc
/ra) (1)
where λ is the latent heat of vaporization (MJ kg−1), E is the hourly potential evapo-transpiration (mm h−1), ∆ is the slope of saturation vapour pressure–temperature curve(kPa ◦C−1), Hnet is the net radiation (MJ m−2 h−1), G is the heat flux density to the ground(MJ m−2 h−1), ρair is the air density (kg m−3), cp is the specific heat at the constant pres-5
sure (MJ kg−1 ◦C−1), e0z is the saturation vapour pressure of air at height z (kPa), ez is
the water vapour pressure of air at height z (kPa), γ (kPa ◦C−1) is the psychometricconstant, rc is the plant resistance (s m−1), ra is the diffusion resistance (s m−1).
For the boundary conditions on the sides, since the model domain is the entireMarina-like catchment, there are no fluxes across the inland boundary. The boundary10
bordering the sea is assumed to have a fixed head of 0 m corresponding to the meansea level. Reservoirs in the catchment are set as internal boundary conditions withhead-controlled flux. The exchange fluxes depend on the head difference between thegroundwater table and the reservoir water depth with a leakage coefficient of 10−3 s−1.The bottom boundary of the domain is bed rock and thus has no flux, and is assumed15
to be at 35 m below the ground.
2.3.4 River routing
The main river network of the Marina-like catchment is delineated from the digital ele-vation model (DEM) and published documents from Singapore’s national water agency(PUB, 2007). Most of the channel cross sections are assumed to rectangular, except20
the main river flow from north to south of the catchment (i.e. Kallang River) has theaddition of the trickle channel. The channel width is estimated based on remote sens-ing data and the channel elevation is estimated from DEM data. Inflow boundary atthe upstream is set at a constant discharge value of 0 m3 s−1. At downstream, water
4110
HESSD10, 4099–4132, 2013
Hydrologicrestoration of anurbanized area
D. H. Trinh andT. F. M. Chui
Title Page
Abstract Introduction
Conclusions References
Tables Figures
J I
J I
Back Close
Full Screen / Esc
Printer-friendly Version
Interactive Discussion
Discussion
Paper
|D
iscussionP
aper|
Discussion
Paper
|D
iscussionP
aper|
level is at a constant elevation of 11 m which is approximately the level of the Marinareservoir (the most southern and downstream reservoir). Manning numbers (M) are 25and 80 for earthen and concrete river banks, respectively. The fluxes exchanged be-tween groundwater and surface water in the channel is estimated using a leakagecoefficient of 10−5. For the stabilization of the model, initial water depth and discharge5
are at 0.1 m and 0 m3 s−1, respectively.
3 Results
3.1 Impacts on overall water balance
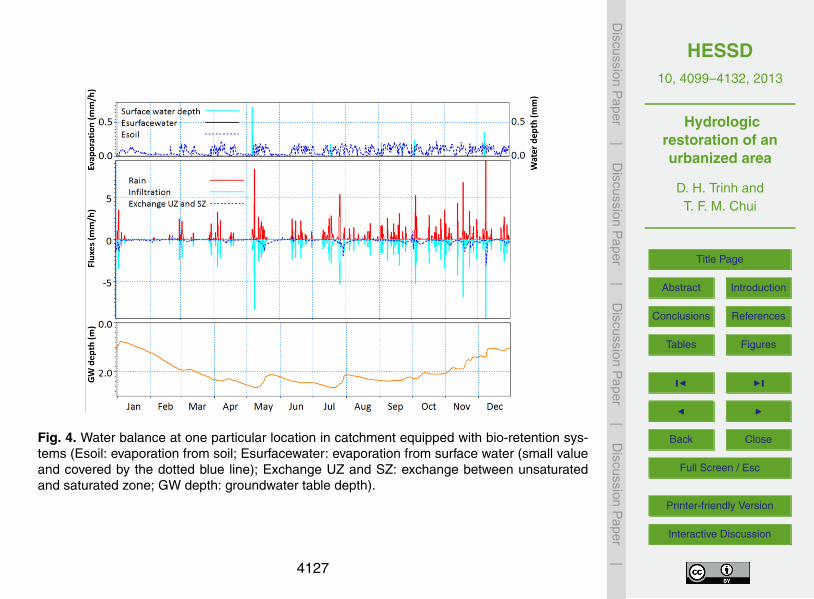
To determine the impacts on water balance, the different hydrological components andtheir temporal variations at one particular location are examined (Fig. 4). The selected10
location is near the main river and in the midstream of the catchment where is highlyurbanized. The results, extracted from the bio-retention scenario, indicate that the hy-drologic processes are temporally dynamic due to the changes in rainfall. For example,in the beginning of January, during the event with a rainfall intensity of 3.5 mm h−1, theinfiltration rate is slightly less than 3.5 mm h−1. The top soil is saturated, producing a15
downward flux from the unsaturated to the saturated zone at the rate of 2 mm h−1. Dueto the series of rainfall events, groundwater table rises by 0.2 m. During the relativelydry period of mid-January to mid-February, there are no downward fluxes from the un-saturated to the saturated zone. As the top soil dries out gradually, the moisture in theunsaturated zone is not enough to support the evaporation process, water is therefore20
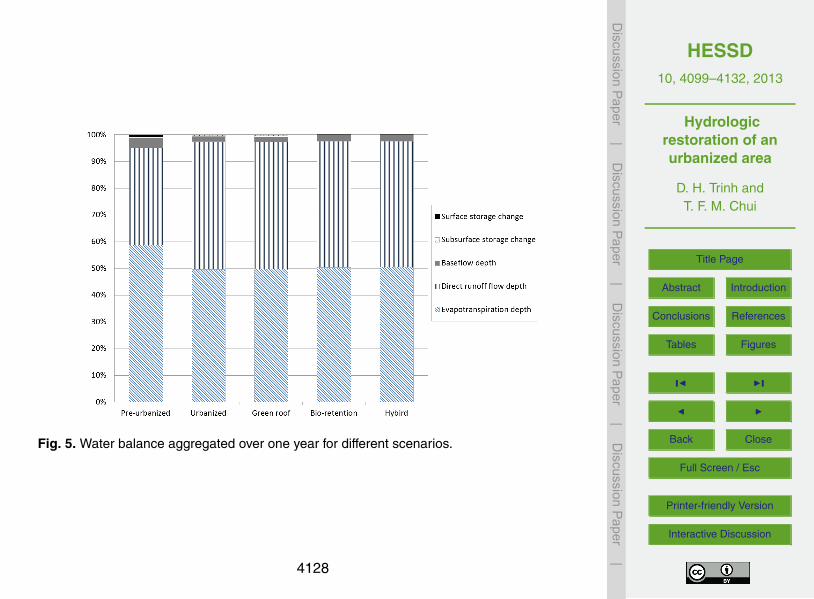
taken from the saturated zone leading to a gradual drawdown in the groundwater table.The only influx to the catchment is rainfall, and it either turns into outfluxes (e.g. base
flow, direct runoff flow and evapotranspiration) or increases the storage within the sys-tem (e.g. canopy storage, surface water storage and subsurface water storage). Fig-ure 5 presents the distribution of rainfall into the different components aggregated over25
one year for the different scenarios. Canopy storage is not shown in the figure as it
4111
HESSD10, 4099–4132, 2013
Hydrologicrestoration of anurbanized area
D. H. Trinh andT. F. M. Chui
Title Page
Abstract Introduction
Conclusions References
Tables Figures
J I
J I
Back Close
Full Screen / Esc
Printer-friendly Version
Interactive Discussion
Discussion
Paper
|D
iscussionP
aper|
Discussion
Paper
|D
iscussionP
aper|
is negligible compared to other components. The amount of surface and subsurfacestorage change in all the scenarios are also small (less than 0.5 % of total water bal-ance) as all the scenarios are simulated under dynamic equilibrium conditions of all thehydrological components.
For all scenarios, the greatest contributing factor is evapotranspiration. Compared5
to the other scenarios, there is a higher fraction (10 % more) of evapotranspiration inthe pre-urbanized scenario since the entire land surface is covered by trees. There isa drastic increase (by 20 %) in the direct runoff in the urbanized scenario due to thechange of 66 % land use from pervious to impervious surfaces. Corresponding to alarge amount of direct runoff in the urbanized scenario, base flow depth is reduced by10
almost 66 % in the urbanized scenario when compared to the pre-urbanized one. Thebase flow depth is also not increased by green roofs, and it only increases marginallywith the implementation of bio-retention systems in either the bio-retention or hybridscenarios due to the enhancing infiltration function of bio-retention systems.
3.2 Impacts on eminent water resources issues15
3.2.1 Flash floods
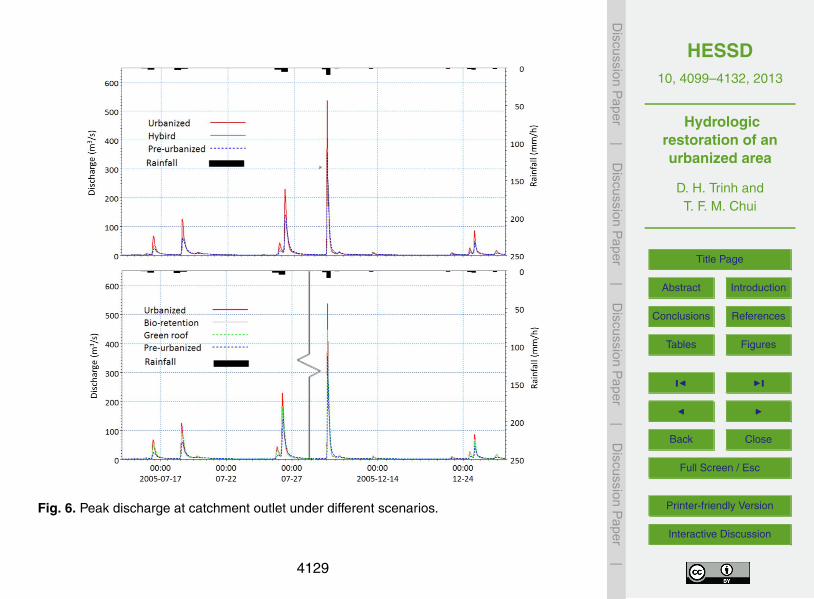
To study the impact of urbanization and the strategies in averting flash floods, river dis-charge is first analyzed. Urbanization increases the peak outlet discharge significantly(Fig. 6). During rainfall events of small intensity (e.g. 5, 13 and 28 December) and av-erage intensity (e.g. 17, 19 July and 26 December), peak outlet discharge increases20
by more than 100 %. For rainfall events with high intensity (26 July and 8 December),the percentage increase is smaller (about 60 %). However, the magnitudes of peak dis-charge for small- and average-intensity rainfall are small. Thus, the high percentageincrease in fact does not have significant impact on the catchment. On the other hand,although the percentage increase of high-intensity rainfall is smaller, it has significant25
impact as the magnitude of peak discharge is relatively high. The highest peak outlet
4112
HESSD10, 4099–4132, 2013
Hydrologicrestoration of anurbanized area
D. H. Trinh andT. F. M. Chui
Title Page
Abstract Introduction
Conclusions References
Tables Figures
J I
J I
Back Close
Full Screen / Esc
Printer-friendly Version
Interactive Discussion
Discussion
Paper
|D
iscussionP
aper|
Discussion
Paper
|D
iscussionP
aper|
discharge in the urbanized scenario is 550 m3 s−1, leading to potential flash floods inthe low lying areas.
Besides assessing the impact of urbanization, the effectiveness of each strategy inreducing the flood risk is also examined. Overall, all the restoration strategies reducethe peak discharge. In average-intensity rainfall events, the green roof scenario or the5
bio-retention scenario reduces the peak discharge by 25 %. The hybrid scenario canfully reduce the peak flow to the pre-urbanized level. For example, the rainfall event on19 July produces a peak outlet discharge of 60 m3 s−1 in the pre-urbanized scenario;this amount increases to 125 m3 s−1 in the urbanized scenario. The installation of ei-ther green roofs or bio-retention systems brings the peak discharge from 125 m3 s−1
10
down to 90 m3 s−1. For the case in which both green roofs and bio-retention systemsare installed, the peak discharge is the same as in the pre-urbanized scenario. In thecase of high-intensity rainfall, focusing on the highest rainfall event in the simulationyear on 8 December, a rainfall depth of 136 mm in 5 h results in an outlet peak dis-charge of 550 m3 s−1 under urbanized conditions. Installation of either green roofs or15
bio-retention systems decreases the peak discharge to 450 m3 s−1, and the installationof both structures decreases the peak discharge to 330 m3 s−1 which is even lowerthan the peak discharge of 350 m3 s−1 in the pre-urbanized scenario. To conclude, thelarge-scale restoration strategy restores the pre-urbanized condition effectively in termsof outlet discharge, reducing the potential flooding problems.20
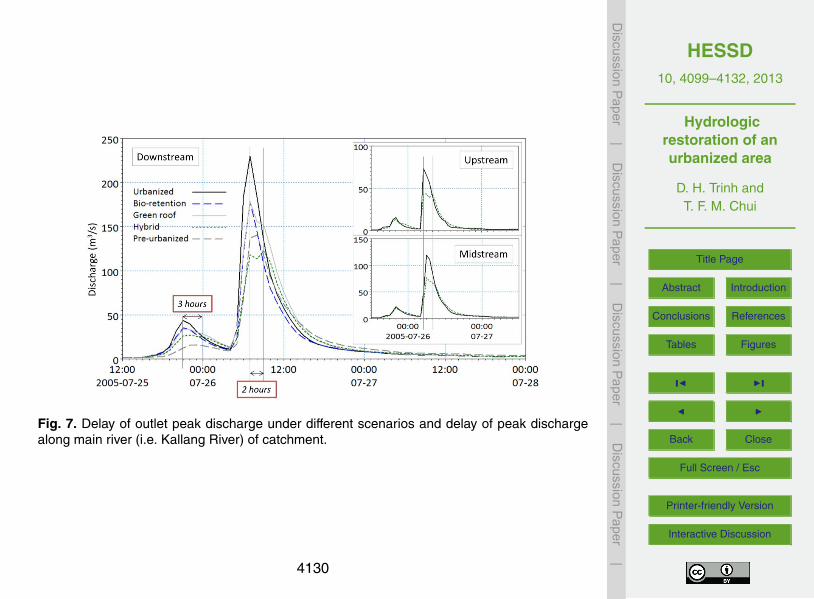
Other than examining the magnitude of peak discharges, Fig. 7 compares the peaktime to evaluate peak delays in each restoration scenario. Taking the rainfall eventon 26 July as an example, the downstream peak outlet discharge in the urbanizedand the bio-retention scenarios occur at the same time. However, there are two peaksin the green roof and hybrid scenarios, with the first peak occurring slightly later in25
the urbanized scenario and the second peak delayed for another 2 h. This is due tothe existence of green roofs which delay discharge for about 3 h in both scenarios.The hydrograph on 25 July also gives similar results except that the time of delayvaries depending on the rainfall characteristics. Although the double peaks only occur
4113
HESSD10, 4099–4132, 2013
Hydrologicrestoration of anurbanized area
D. H. Trinh andT. F. M. Chui
Title Page
Abstract Introduction
Conclusions References
Tables Figures
J I
J I
Back Close
Full Screen / Esc
Printer-friendly Version
Interactive Discussion
Discussion
Paper
|D
iscussionP
aper|
Discussion
Paper
|D
iscussionP
aper|
in simulations and may be indistinct during field observations, the results do illustratethe peak attenuation due to green roofs.
Besides comparing the peak time downstream, one can also examine the change ofdelay along the channel from upstream to midstream and subsequently downstream.Focusing on only the hybrid scenario, the relative heights of the two peaks vary be-5
tween upstream, midstream and downstream due to the merging of secondary riverswhich are at different locations from green structures. Furthermore, there is a slightincrease in the delay of the peak from upstream to downstream due to the propagationof wave along the river. Overall, examining the peak timing and its propagation throughthe river network demonstrates the importance of a catchment-level planning of green10
structures (in terms of locations as well as the percentage of surface coverage) in miti-gating floods.
3.2.2 Ground water replenishment
The main source of groundwater replenishment in this catchment is from surface waterinfiltrating into the ground. Urbanization not only increases the peak river discharge15
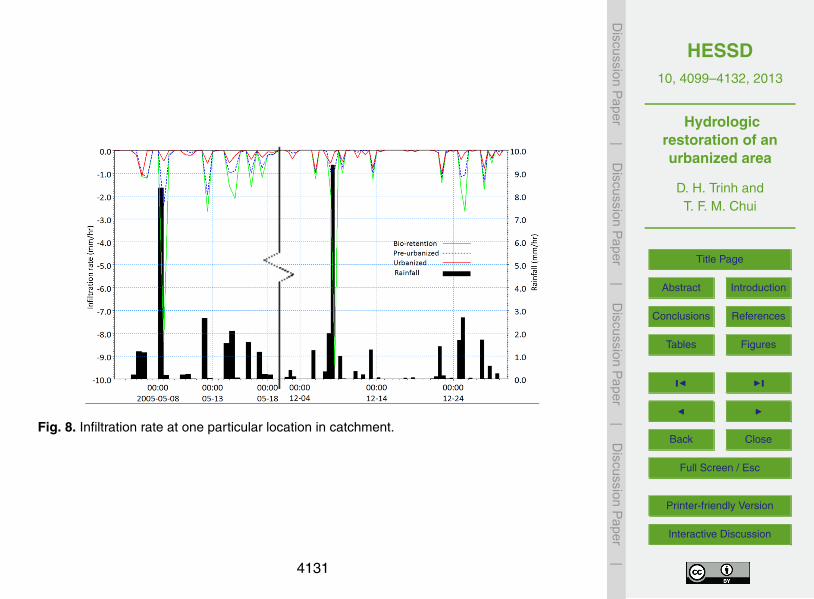
but also decreases the infiltration rate, preventing surface water from going into theground and recharging subsurface storage. As mentioned in the water balance section,green roofs do not significantly change the water budget or enhance infiltration rate.This section therefore focuses on comparing the infiltration rates in the urbanized, pre-urbanized and bio-retention scenarios to evaluate the effectiveness of bio-retention20
systems in enhancing infiltration. For plot scale, the infiltration rates at one particularlocation where land use has changed from pervious, to impervious and then to bio-retention system is compared (Fig. 8). The infiltration rate is highest in the bio-retentionscenario and is equal to the rainfall rate.
The impervious concrete surfaces in an urbanized catchment such as buildings,25
roads and pavements prevent infiltration. The infiltration rate of the entire catchment in2005 is reduced by 20 % in the urbanized scenario as compared to the pre-urbanizedscenario, while the bio-retention scenario restores 10 %. The actual infiltration rate
4114
HESSD10, 4099–4132, 2013
Hydrologicrestoration of anurbanized area
D. H. Trinh andT. F. M. Chui
Title Page
Abstract Introduction
Conclusions References
Tables Figures
J I
J I
Back Close
Full Screen / Esc
Printer-friendly Version
Interactive Discussion
Discussion
Paper
|D
iscussionP
aper|
Discussion
Paper
|D
iscussionP
aper|
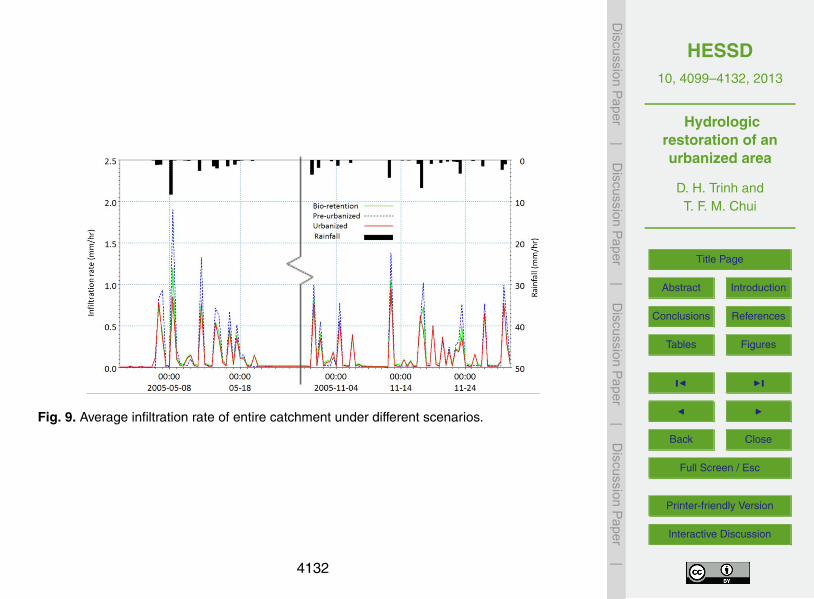
under different scenarios (Fig. 9) varies temporally depending on the rainfall intensityas well as the time interval between two consecutive rainfall events. There is signif-icantly less infiltration in the urbanized scenario during high intensity rainfall eventssuch as those on 9 May, 12 and 17 November. The decrease can be as high as 40 to50 %, compared to only 10 to 15 % in average rainfall events such as those from 14 to5
18 May or from 31 October to 5 November. Bio-retention systems restore 20 to 30 %and 5 to 10 % of the pre-urbanized infiltration during high and average rainfall eventsrespectively. For all the small rainfall events (e.g. 11, 20 May and 15 November), theinfiltration rate of the bio-retention scenario is higher than that in the pre-urbanizedscenario. Most of the small rainfall events occur closely in time. In the pre-urbanized10
condition, the soil is fully saturated after several events. Water can no longer infiltrateand contributes to surface runoff. However, more water can infiltrate in the bio-retentionsystems because the detention ponding provides additional time for water to infiltrateinto the ground.
4 Discussion15
The following key points underpin the analysis of the hydrological characteristics of thedifferent scenarios. Firstly, evapotranspiration accounts for a relatively high percentageof water budgets in all scenarios. It therefore should not be neglected; otherwise thismight lead to over-estimations of the other components. Secondly, groundwater playsan important role and should be taken into consideration, especially when the hydrolog-20
ical changes in shallow groundwater systems are examined. The exchange betweengroundwater and surface water depends on the difference in groundwater level and sur-face water level, as well as the soil moisture content in the unsaturated zone. In shallowgroundwater systems, it is even possible to have groundwater exfiltration during heavyrainfall in low-lying areas. Thirdly, different designs of green structures (e.g. green roofs25
versus bio-retention systems) provide different hydrological functions and their relativelocations within the catchment also yield different outcomes at the catchment outlet.
4115
HESSD10, 4099–4132, 2013
Hydrologicrestoration of anurbanized area
D. H. Trinh andT. F. M. Chui
Title Page
Abstract Introduction
Conclusions References
Tables Figures
J I
J I
Back Close
Full Screen / Esc
Printer-friendly Version
Interactive Discussion
Discussion
Paper
|D
iscussionP
aper|
Discussion
Paper
|D
iscussionP
aper|
Therefore, it is possible to integrate different green structures at optimized locations toachieve specific targets such as reducing flash floods, enhancing groundwater replen-ishment, or restoring the pre-urbanized hydrograph at the catchment outlet.
5 Summary and conclusions
This study assesses the overall hydrological impacts of urbanization and the effec-5
tiveness of catchment-scale green structures in restoring pre-urbanized hydrologicalconditions. A physical-based integrated distributed hydrological model, Mike SHE, isused to simulate a highly urbanized catchment in the tropics under three main scenar-ios (i.e. pre-urbanized, urbanized and restored) that differ in their land uses. The mostimportant findings are summarized as follows:10
1. In terms of the hydrological impacts of transforming 66 % of vegetated area intoimpervious surface and changing the vegetation type in the remaining area duringurbanization, it is observed that:
– Infiltration on average reduces by 20 % which is proportional to the increaseof impervious surface. There is thus less subsurface water recharge and less15
subsurface water storage. The actual reduction in each rainfall event varieswith rainfall intensity and time interval from the previous rainfall event.
– Base flow decreases by 66 % and surface runoff increases by 20 %, leadingto a higher potential of flash floods. The peak outlet discharge increases by100 % during low- and average-intensity rainfall and by 60 % in high-intensity20
rainfall. Although the percentage increase is lower, the increase of dischargeduring high-intensity rainfall is more impactful due to the relatively high pre-urbanized value.
2. To mitigate the hydrological impacts of urbanization, three catchment-scale greenstructure strategies are explored:25
4116
HESSD10, 4099–4132, 2013
Hydrologicrestoration of anurbanized area
D. H. Trinh andT. F. M. Chui
Title Page
Abstract Introduction
Conclusions References
Tables Figures
J I
J I
Back Close
Full Screen / Esc
Printer-friendly Version
Interactive Discussion
Discussion
Paper
|D
iscussionP
aper|
Discussion
Paper
|D
iscussionP
aper|
– The first strategy is to install green roofs in all the buildings, accounting for14 % of the catchment area. The green roofs retain rainfall for 3 h, but exertminimal changes in water balance or infiltration. They however reduce thepeak outlet discharge by 30 to 50 %, and delay the peak by 2 h and thus canmitigate flash floods in urban areas.5
– The second strategy is to set up bio-retention systems in 5 % of the catch-ment area. Bio-retention systems are modelled as 1 m deep soils with rela-tively high hydraulic conductivity of 10−5 m s−1. On average, infiltration for thecatchment increases by 10 %. The actual increase in each event dependson the rainfall condition and can be as high as 30 % during rainfall with high10
intensity. Base flow increases and surface runoff decreases and this secondstrategy can therefore also mitigate flash floods.
– The third strategy is to implement a combination of the previous two strate-gies (i.e. installing 14 % green roofs and 5 % bio-retention). It provides thefunctions of both types of structures (e.g. improving water balance, enhanc-15
ing infiltration rate, delaying peak outlet discharge), and manages to reducethe peak outlet discharge down to, and even lower than the pre-urbanizedvalue in some cases.
3. Assessing the hydrologic restoration of an urbanized area via the case study,further conclusions can be made:20
– Evapotranspiration is one of the important processes and should not be ne-glected as it accounts for a relatively high percentage of the water budget.
– Groundwater plays an important role, especially in shallow groundwater sys-tems, as it has direct dynamic effects on the infiltration rate and the waterexchange between groundwater and surface water.25
– It is feasible to re-shape the outlet hydrograph via large-scale hydrologicalcontrols throughout a catchment but it is important to perform a catchment-scale planning for the desired integrated spatial and temporal effects.
4117
HESSD10, 4099–4132, 2013
Hydrologicrestoration of anurbanized area
D. H. Trinh andT. F. M. Chui
Title Page
Abstract Introduction
Conclusions References
Tables Figures
J I
J I
Back Close
Full Screen / Esc
Printer-friendly Version
Interactive Discussion
Discussion
Paper
|D
iscussionP
aper|
Discussion
Paper
|D
iscussionP
aper|
The simulation results obtained are independent of field data, enabling a generic modelfor understanding hydrological changes during the different phases of urbanization. Theresults and conclusions drawn are thus beneficial and applicable to catchment-levelwater resource planning and management in many urban areas worldwide, especiallythose in the tropical region.5
Acknowledgements. The research was supported by Academic Research Fund (AcRF) Tier 1from Singapore Ministry of Education (MOE) (FRC grant R-302-000-007-112).
References
Antrop, M.: Landscape change and the urbanization process in Europe, Landscape UrbanPlan., 67, 9–26, doi:10.1016/s0169-2046(03)00026-4, 2004.10
Barron, O. V., Barr, A. D., and Donn, M. J.: Effect of urbanisation on the water balance of a catch-ment with shallow groundwater, J. Hydrol., 485, 162–176, doi:10.1016/j.jhydrol.2012.04.027,2013.
Bengtsson, L., Grahn, L., and Olsson, J.: Hydrological function of a thin extensive green roof insouthern Sweden, Nord. Hydrol., 36, 259–268, 2005.15
Bhaduri, B., Harbor, J., Engel, B., and Grove, M.: Assessing watershed-scale, long-term hydro-logic impacts of land-use change using a GIS-NPS model, Environ. Manage., 26, 643–658,2000.
Bliss, D. J., Neufeld, R. D., and Ries, R. J.: Storm Water Runoff Mitigation Using a Green Roof,Environ. Eng. Sci., 26, 407–417, doi:10.1089/ees.2007.0186, 2009.20
Carter, T. L. and Rasmussen, T. C.: Hydrological behavior of vegetated roofs, J. Am. WaterResour. Assoc., 42, 1261–1274, doi:10.1111/j.1752-1688.2006.tb05299.x, 2006.
Chang, C. L., Lo, S. L., and Huang, S. M.: Optimal strategies for best managementpractice placement in a synthetic watershed, Environ. Monit. Assess., 153, 359–364,doi:10.1007/s10661-008-0362-y, 2009.25
Chow, V. T.: Open-Channel Hydraulics, McGraw-Hill, 1959.Collin, M. L. and Melloul, A. J.: Assessing groundwater vulnerability to pollution to promote sus-
tainable urban and rural development, J. Clean. Product., 11, 727–736, doi:10.1016/s0959-6526(02)00131-2, 2003.
4118
HESSD10, 4099–4132, 2013
Hydrologicrestoration of anurbanized area
D. H. Trinh andT. F. M. Chui
Title Page
Abstract Introduction
Conclusions References
Tables Figures
J I
J I
Back Close
Full Screen / Esc
Printer-friendly Version
Interactive Discussion
Discussion
Paper
|D
iscussionP
aper|
Discussion
Paper
|D
iscussionP
aper|
Czemiel Berndtsson, J.: Green roof performance towards management of runoff water quantityand quality: A review, Ecol. Eng., 36, 351–360, doi:10.1016/j.ecoleng.2009.12.014, 2010.
Davis, A.: Field Performance of Bioretention: Hydrology Impacts, J. Hydrol. Eng., 13, 90–95,doi:10.1061/(ASCE)1084-0699(2008)13:2(90), 2008.
DeFries, R. and Eshleman, K. N.: Land-use change and hydrologic processes: a major focus5
for the future, Hydrol. Process., 18, 2183–2186, doi:10.1002/hyp.5584, 2004.Dietz, M. E. and Clausen, J. C.: Stormwater runoff and export changes with develop-
ment in a traditional and low impact subdivision, J. Environ. Manage., 87, 560–566,doi:10.1016/j.jenvman.2007.03.026, 2008.
Dow, C. L. and DeWalle, D. R.: Trends in evaporation and Bowen ratio on urbanizing watersheds10
in eastern United States, Water Resour. Res., 36, 1835–1843, 2000.Du, J., Qian, L., Rui, H., Zuo, T., Zheng, D., Xu, Y., and Xu, C. Y.: Assessing the ef-
fects of urbanization on annual runoff and flood events using an integrated hydrolog-ical modeling system for Qinhuai River basin, China, J. Hydrol., 464–465, 127–139,doi:10.1016/j.jhydrol.2012.06.057, 2012.15
Endreny, T. A.: Evaporation, in: Water Encyclopedia, John Wiley & Sons, Inc., 2005.Freeze, R. A. and Cherry, J. A.: Groundwater, Englewood Cliffs, New Jersey, Prentice Hall,
1979.Gobel, P., Stubbe, H., Weinert, M., Zimmermann, J., Fach, S., Dierkes, C., Kories, H., Messer,
J., Mertsch, V., Geiger, W. F., and Coldewey, W. G.: Near-natural stormwater management20
and its effects on the water budget and groundwater surface in urban areas taking account ofthe hydrogeological conditions, J. Hydrol., 299, 267–283, doi:10.1016/j.jhydrol.2004.08.013,2004.
Haase, D.: Effects of urbanisation on the water balance – A long-term trajectory, Environ. ImpactAssess. Rev., 29, 211–219, doi:10.1016/j.eiar.2009.01.002, 2009.25
Holman-Dodds, J. K., Bradley, A. A., and Potter, K. W.: Evaluation of hydrologic benefits ofinfiltration based urban storm water management1, J. Am. Water Resour. Assoc., 39, 205–215, doi:10.1111/j.1752-1688.2003.tb01572.x, 2003.
Hutchinson, D., Abrams, P., Retzlaff, R., and Liptan, T.: Stormwater monitoring two ecorrofs inPortland, Oregon, USA, in: Greening Rooftops for Sustainable Communites, Chicago, 2003.30
Ives, D. W.: Soil of the Republic of Singapore, in: New Zealand Soil Bureau Scientific Report,Soil Bureau, Lower Hutt, New Zealand, 1977.
4119
HESSD10, 4099–4132, 2013
Hydrologicrestoration of anurbanized area
D. H. Trinh andT. F. M. Chui
Title Page
Abstract Introduction
Conclusions References
Tables Figures
J I
J I
Back Close
Full Screen / Esc
Printer-friendly Version
Interactive Discussion
Discussion
Paper
|D
iscussionP
aper|
Discussion
Paper
|D
iscussionP
aper|
James, M. and Dymond, R.: Bioretention Hydrologic Performance in an Urban StormwaterNetwork, J. Hydrol. Eng., 17, 431–436, doi:10.1061/(ASCE)HE.1943-5584.0000448, 2012.
Klocking, B. and Haberlandt, U.: Impact of land use changes on water dynamics – a case studyin temperate meso and macroscale river basins, Phys. Chem. Earth A/B/C, 27, 619–629,doi:10.1016/s1474-7065(02)00046-3, 2002.5
Konrad, C. P. and Booth, D. B.: Hydrologic Changes in Urban Streams and Their EcologicalSignificance, in: American Fisheries Society Symposium, Alaska, 157–177, 2005.
Lerner, D. N.: Groundwater recharge in urban areas, Atmos. Environ. B, 24, 29–33,doi:10.1016/0957-1272(90)90006-G, 1990.
Lu, X. X., Wong, P. P., and Chou, L. M.: Singapore’s Biophysical Environment, The McGraw10
Hill, Singapore, 2005.Mentens, J., Raes, D., and Hermy, M.: Green roofs as a tool for solving the rainwater
runoff problem in the urbanized 21st century?, Landscape Urban Plan., 77, 217–226,doi:10.1016/j.landurbplan.2005.02.010, 2006.
Moran, A., Hunt, B., and Jennings, G.: A North Carolina Field Study to Evaluate Greenroof15
Runoff Quantity, Runoff Quality, and Plant Growth, in: 2nd Greening Rooftops for SustainableCommunities Conference, Portland, 446–460, 2004.
Oberndorfer, E., Lundholm, J., Bass, B., Coffman, R. R., Doshi, H., Dunnett, N., Gaffin, S.,KOHler, M., Liu, K. K. Y., and Rowe, B.: Green Roofs as Urban Ecosystems: EcologicalStructures, Functions, and Services, BioScience, 57, 823–833, 2007.20
Ott, B. and Uhlenbrook, S.: Quantifying the impact of land-use changes at the event and sea-sonal time scale using a process-oriented catchment model, Hydrol. Earth Syst. Sci., 8,62–78, doi:10.5194/hess-8-62-2004, 2004.
Palla, A., Gnecco, I., and Lanza, L. G.: Compared performance of a conceptual and a mecha-nistic hydrologic models of a green roof, Hydrol. Process., 26, 73–84, doi:10.1002/hyp.8112,25
2012.PUB: ABC Waters Master Plan for the Central Catchment, in: ABC Waters Master Plan, Public
Utility Board (Water), Singapore, 2007.PUB: Design guidelines Public Utilities Board, Singapore, 2011.Rezaur, R. B., Rahardjo, H., Leong, E. C., and Lee, T. T.: Hydrologic Behavior of Residual Soil30
Slopes in Singapore, J. Hydrol. Eng., 8, 133–144, 2003.
4120
HESSD10, 4099–4132, 2013
Hydrologicrestoration of anurbanized area
D. H. Trinh andT. F. M. Chui
Title Page
Abstract Introduction
Conclusions References
Tables Figures
J I
J I
Back Close
Full Screen / Esc
Printer-friendly Version
Interactive Discussion
Discussion
Paper
|D
iscussionP
aper|
Discussion
Paper
|D
iscussionP
aper|
Rose, S. and Peters, N. E.: Effects of urbanization on streamflow in the Atlanta area(Georgia, USA): a comparative hydrological approach, Hydrol. Process., 15, 1441–1457,doi:10.1002/hyp.218, 2001.
Rowe, D., Rugh, C., VanWoert, N., Monterusso, M., and Russell, D.: Green roof slope, sub-strate depth, and vegetation influence runoff, in: 1st North American Green Roof Conference:5
Greening Rooftops for Sustainalbe Communities, Chicago, 354–362, 2003.Sanders, R. A.: Urban vegetation impacts on the hydrology of Dayton, Ohio, Urban Ecol., 9,
361–376, doi:10.1016/0304-4009(86)90009-4, 1986.Schoonover, J. E., Lockaby, B. G., and Helms, B. S.: Impacts of land cover on stream hydrology
in the West Georgia Piedmont, USA, J. Environ. Qual., 35, 2123–2131, 2006.10
URA: Singapore Master Plan in 2003 Urban Redevelopment Authority, Singapore, 2003.USGS: USGS Global Visualization Viewer USGS Global Visualization Viewer, Virginia, 2010.VanWoert, N. D., Rowe, D. B., Andresen, J. A., Rugh, C. L., Fernandez, R. T., and Xiao, L.:
Green Roof Stormwater Retention: Effects of Roof Surface, Slope and Media Depth, J. Env-iron. Qual., 34, 1036–1044, doi:10.2134/jeq2004.0364, 2005.15
Villarreal, E. L., Semadeni-Davies, A., and Bengtsson, L.: Inner city stormwater con-trol using a combination of best management practices, Ecol. Eng., 22, 279–298,doi:10.1016/j.ecoleng.2004.06.007, 2004.
Wang, Y., Choi, W., and Deal, B. M.: Long-term impacts of land-use change on non-point sourcepollutant loads for the St. Louis Metropolitan Area, USA, Environ. Manage., 35, 194–205,20
2005.Wells, N.: The role of soils in the utilisation of sewage sludge in Singapore, in: New Zealand
Soil Bureau Scientific Report, Soil Bureau, Lower Hutt, New Zealand, 1977.Xiao, Q. and McPherson, E. G.: Performance of engineered soil and trees in a parking lot
bioswale, Urban Water J., 8, 241–253, doi:10.1080/1573062x.2011.596213, 2011.25
Younger, P. L.: Simple generalized methods for estimating aquifer storage parameters, Q. J.Eng. Geol. Hydrogeol., 26, 127–135, 1993.
4121
HESSD10, 4099–4132, 2013
Hydrologicrestoration of anurbanized area
D. H. Trinh andT. F. M. Chui
Title Page
Abstract Introduction
Conclusions References
Tables Figures
J I
J I
Back Close
Full Screen / Esc
Printer-friendly Version
Interactive Discussion
Discussion
Paper
|D
iscussionP
aper|
Discussion
Paper
|D
iscussionP
aper|
Table 1. Vegetation characteristics.
Vegetation type Land use Vegetation parameter
Leaf Rootarea depthindex (mm)(−)
Impervious Residential, Business centre, Industry, Institution, 0 0Commercial, Military area, Airfield,Port, Infrastructure
No plant Reserve site, Cemetery 0 0
Bushes Agriculture 3 2000
Mixed trees Open space, Recreation 5 4000
Trees Park 6 5000
4122
HESSD10, 4099–4132, 2013
Hydrologicrestoration of anurbanized area
D. H. Trinh andT. F. M. Chui
Title Page
Abstract Introduction
Conclusions References
Tables Figures
J I
J I
Back Close
Full Screen / Esc
Printer-friendly Version
Interactive Discussion
Discussion
Paper
|D
iscussionP
aper|
Discussion
Paper
|D
iscussionP
aper|
Table 2. Soil texture and properties.
Soil type Depth Soil texture (%) Soil type Depth Soil texture (%)
(cm) Sand Silt Clay (cm) Sand Silt Clay
REMGAM 0–8 78 2 20 TAMPOI 0–6 81.2 2.1 16.78–34 61 1 38 6–13 72.5 1 26.534–68 57 3 40 13–44 69.6 0 30.468–160 55 2 43 44–100 61.7 0 38.3
JERANGAU 0–5 35.7 6.1 58.2 BEDOK 0 – 10 Clay loam15–30 38 4 58 10–100 Silt clay30–82 30 4 66 CHOWBOONLAY 0–10 Silt82+ 28 3 69 10–100 Silt clay
AYERTERJUN 0–7 24 47 29 CHANGI 0–100 Sand7–24 23 44 33 HOLYROOD 0–100 Loam sand24–60 13 33 54 JURONG 0–100 Silt clay60–135 9 29 62 KRANJI 0–100 Silt clay
HARIMAU 0–14 77.8 4 18.2 MATAIKAN 0–100 Sand clay loam14–28 73.5 4.1 22.4 MASAI 0–100 Clay28–35 69.8 3.1 27.1 TENGAH 0–100 Loam sand53–94 57.8 1.2 41
4123
HESSD10, 4099–4132, 2013
Hydrologicrestoration of anurbanized area
D. H. Trinh andT. F. M. Chui
Title Page
Abstract Introduction
Conclusions References
Tables Figures
J I
J I
Back Close
Full Screen / Esc
Printer-friendly Version
Interactive Discussion
Discussion
Paper
|D
iscussionP
aper|
Discussion
Paper
|D
iscussionP
aper|
21
593
594
Figure 1. Components of integrated distributed hydrological model 595
596
Fig. 1. Components of integrated distributed hydrological model.
4124
HESSD10, 4099–4132, 2013
Hydrologicrestoration of anurbanized area
D. H. Trinh andT. F. M. Chui
Title Page
Abstract Introduction
Conclusions References
Tables Figures
J I
J I
Back Close
Full Screen / Esc
Printer-friendly Version
Interactive Discussion
Discussion
Paper
|D
iscussionP
aper|
Discussion
Paper
|D
iscussionP
aper|
22
597
598
Figure 2. Location of Marina Catchment 599
600
Fig. 2. Location of Marina catchment.
4125
HESSD10, 4099–4132, 2013
Hydrologicrestoration of anurbanized area
D. H. Trinh andT. F. M. Chui
Title Page
Abstract Introduction
Conclusions References
Tables Figures
J I
J I
Back Close
Full Screen / Esc
Printer-friendly Version
Interactive Discussion
Discussion
Paper
|D
iscussionP
aper|
Discussion
Paper
|D
iscussionP
aper|
23
601
602
Figure 3. Land cover (left) and soil distribution (right) of Marina-like catchment 603
(Land use: 66% impervious, including 14% building and 5% potential bio-retention area; 9% 604
no plants; 25% plants, including 5% bushes, 18% mixed trees and 2% trees) 605
606
23
601
602
Figure 3. Land cover (left) and soil distribution (right) of Marina-like catchment 603
(Land use: 66% impervious, including 14% building and 5% potential bio-retention area; 9% 604
no plants; 25% plants, including 5% bushes, 18% mixed trees and 2% trees) 605
606
Fig. 3. Land cover (left panel) and soil distribution (right panel) of Marina-like catchment (landuse: 66 % impervious, including 14 % building and 5 % potential bio-retention area; 9 % noplants; 25 % plants, including 5 % bushes, 18 % mixed trees and 2 % trees).
4126
HESSD10, 4099–4132, 2013
Hydrologicrestoration of anurbanized area
D. H. Trinh andT. F. M. Chui
Title Page
Abstract Introduction
Conclusions References
Tables Figures
J I
J I
Back Close
Full Screen / Esc
Printer-friendly Version
Interactive Discussion
Discussion
Paper
|D
iscussionP
aper|
Discussion
Paper
|D
iscussionP
aper|
24
607
608
Figure 4. Water balance at one particular location in catchment equipped with bio-retention 609
systems 610
(Esoil: Evaporation from soil; Esurfacewater: Evaporation from surface water (small value 611
and covered by the dotted blue line); Exchange UZ and SZ: Exchange between unsaturated 612
and saturated zone; GW depth: groundwater table depth) 613
614
Fig. 4. Water balance at one particular location in catchment equipped with bio-retention sys-tems (Esoil: evaporation from soil; Esurfacewater: evaporation from surface water (small valueand covered by the dotted blue line); Exchange UZ and SZ: exchange between unsaturatedand saturated zone; GW depth: groundwater table depth).
4127
HESSD10, 4099–4132, 2013
Hydrologicrestoration of anurbanized area
D. H. Trinh andT. F. M. Chui
Title Page
Abstract Introduction
Conclusions References
Tables Figures
J I
J I
Back Close
Full Screen / Esc
Printer-friendly Version
Interactive Discussion
Discussion
Paper
|D
iscussionP
aper|
Discussion
Paper
|D
iscussionP
aper|
25
615
616
Figure 5. Water balance aggregated over one year for different scenarios 617
Fig. 5. Water balance aggregated over one year for different scenarios.
4128
HESSD10, 4099–4132, 2013
Hydrologicrestoration of anurbanized area
D. H. Trinh andT. F. M. Chui
Title Page
Abstract Introduction
Conclusions References
Tables Figures
J I
J I
Back Close
Full Screen / Esc
Printer-friendly Version
Interactive Discussion
Discussion
Paper
|D
iscussionP
aper|
Discussion
Paper
|D
iscussionP
aper|
26
618
619
Figure 6. Peak discharge at catchment outlet under different scenarios 620
Fig. 6. Peak discharge at catchment outlet under different scenarios.
4129
HESSD10, 4099–4132, 2013
Hydrologicrestoration of anurbanized area
D. H. Trinh andT. F. M. Chui
Title Page
Abstract Introduction
Conclusions References
Tables Figures
J I
J I
Back Close
Full Screen / Esc
Printer-friendly Version
Interactive Discussion
Discussion
Paper
|D
iscussionP
aper|
Discussion
Paper
|D
iscussionP
aper|
27
621
622
Figure 7. Delay of outlet peak discharge under different scenarios and delay of peak 623
discharge along main river (i.e., Kallang River) of catchment 624
625
Fig. 7. Delay of outlet peak discharge under different scenarios and delay of peak dischargealong main river (i.e. Kallang River) of catchment.
4130
HESSD10, 4099–4132, 2013
Hydrologicrestoration of anurbanized area
D. H. Trinh andT. F. M. Chui
Title Page
Abstract Introduction
Conclusions References
Tables Figures
J I
J I
Back Close
Full Screen / Esc
Printer-friendly Version
Interactive Discussion
Discussion
Paper
|D
iscussionP
aper|
Discussion
Paper
|D
iscussionP
aper|
28
626
627
Figure 8. Infiltration rate at one particular location in catchment 628
629
Fig. 8. Infiltration rate at one particular location in catchment.
4131
HESSD10, 4099–4132, 2013
Hydrologicrestoration of anurbanized area
D. H. Trinh andT. F. M. Chui
Title Page
Abstract Introduction
Conclusions References
Tables Figures
J I
J I
Back Close
Full Screen / Esc
Printer-friendly Version
Interactive Discussion
Discussion
Paper
|D
iscussionP
aper|
Discussion
Paper
|D
iscussionP
aper|
29
630
631
632
Figure 9. Average infiltration rate of entire catchment under different scenarios 633
634
Fig. 9. Average infiltration rate of entire catchment under different scenarios.
4132
Related Documents