Hydrologic Data Analysis Report for Test Well SPR7005X in Spring Valley Hydrographic Area 184 Southern Nevada Water Authority Doc No. DAR-ED-0007 June 2011

Welcome message from author
This document is posted to help you gain knowledge. Please leave a comment to let me know what you think about it! Share it to your friends and learn new things together.
Transcript
Hydrologic Data Analysis Report for
Test Well SPR7005X in Spring Valley
Hydrographic Area 184
Southern Nevada Water AuthorityDoc No. DAR-ED-0007
June 2011

This document’s use of trade, product, or firm names is for descriptive purposes only and does not imply endorsement by the Southern Nevada Water Authority. Although trademarked names are used, a trademark symbol does not appear after every occurrence of a trademarked name. Every attempt has been made to use proprietary trademarks in the capitalization style used by the manufacturer.
Suggested citation:Prieur, J.P., Acheampong, S.Y., Ashinhurst, C.S., and Fryer, W., 2011, Hydrologic data analysis report for Test Well SPR7005X in Spring Valley Hydrographic Area 184: Southern Nevada Water Authority, Las Vegas, Nevada, Doc. No. DAR-ED-0007, 78 p.
SOUTHERN NEVADA WATER AUTHORITYGroundwater Resources DepartmentWater Resources Division snwa.com
Hydrologic Data Analysis Report for Test Well SPR7005X in Spring Valley Hydrographic Area 184
June 2011
Doc No. DAR-ED-0007
By: James P. Prieur1, Stephen Y. Acheampong1, Chris S. Ashinhurst1, and William Fryer2
1. Southern Nevada Water Authority, Las Vegas, NV2. S.M. Stoller Corporation, Las Vegas, NV

Hydrologic Data Analysis Report for Test Well SPR7005X in Spring Valley
i
CONTENTS
List of Figures . . . . . . . . . . . . . . . . . . . . . . . . . . . . . . . . . . . . . . . . . . . . . . . . . . . . . . . . . . . . . . . . . iiiList of Tables . . . . . . . . . . . . . . . . . . . . . . . . . . . . . . . . . . . . . . . . . . . . . . . . . . . . . . . . . . . . . . . . . . .vList of Acronyms and Abbreviations . . . . . . . . . . . . . . . . . . . . . . . . . . . . . . . . . . . . . . . . . . . . . . . .vii
ES.1.0 Executive Summary . . . . . . . . . . . . . . . . . . . . . . . . . . . . . . . . . . . . . . . . . . . . . . . . . . . . .ES-1
1.0 Introduction. . . . . . . . . . . . . . . . . . . . . . . . . . . . . . . . . . . . . . . . . . . . . . . . . . . . . . . . . . . . . 1-1
1.1 Program Objectives. . . . . . . . . . . . . . . . . . . . . . . . . . . . . . . . . . . . . . . . . . . . . . . . . 1-11.2 Testing and Monitoring Program . . . . . . . . . . . . . . . . . . . . . . . . . . . . . . . . . . . . . . 1-11.3 Report Organization . . . . . . . . . . . . . . . . . . . . . . . . . . . . . . . . . . . . . . . . . . . . . . . . 1-2
2.0 Well Site Description . . . . . . . . . . . . . . . . . . . . . . . . . . . . . . . . . . . . . . . . . . . . . . . . . . . . . 2-1
2.1 Hydrogeologic Setting . . . . . . . . . . . . . . . . . . . . . . . . . . . . . . . . . . . . . . . . . . . . . . 2-12.1.1 Regional Hydrogeologic Setting . . . . . . . . . . . . . . . . . . . . . . . . . . . . . . . 2-12.1.2 Local Hydrogeologic Setting . . . . . . . . . . . . . . . . . . . . . . . . . . . . . . . . . . 2-3
2.2 Testing Program Monitoring Locations . . . . . . . . . . . . . . . . . . . . . . . . . . . . . . . . . 2-42.2.1 Test Well SPR7005X . . . . . . . . . . . . . . . . . . . . . . . . . . . . . . . . . . . . . . . . 2-42.2.2 Observation Wells and Background Monitoring . . . . . . . . . . . . . . . . . . . 2-42.2.3 Well Survey and Water-Level Data . . . . . . . . . . . . . . . . . . . . . . . . . . . . 2-12
3.0 Test Description and Background Data . . . . . . . . . . . . . . . . . . . . . . . . . . . . . . . . . . . . . . . 3-1
3.1 Site Activities . . . . . . . . . . . . . . . . . . . . . . . . . . . . . . . . . . . . . . . . . . . . . . . . . . . . . 3-13.2 Test Equipment and Site Layout. . . . . . . . . . . . . . . . . . . . . . . . . . . . . . . . . . . . . . . 3-13.3 Discharge Information . . . . . . . . . . . . . . . . . . . . . . . . . . . . . . . . . . . . . . . . . . . . . . 3-13.4 Instrumentation and Background Data . . . . . . . . . . . . . . . . . . . . . . . . . . . . . . . . . . 3-2
4.0 Well Hydraulics and Performance Testing . . . . . . . . . . . . . . . . . . . . . . . . . . . . . . . . . . . . . 4-1
4.1 Development . . . . . . . . . . . . . . . . . . . . . . . . . . . . . . . . . . . . . . . . . . . . . . . . . . . . . . 4-14.1.1 Development Results . . . . . . . . . . . . . . . . . . . . . . . . . . . . . . . . . . . . . . . . 4-1
4.2 Step-Drawdown Test . . . . . . . . . . . . . . . . . . . . . . . . . . . . . . . . . . . . . . . . . . . . . . . 4-14.2.1 Well Performance and Specific Capacity. . . . . . . . . . . . . . . . . . . . . . . . . 4-24.2.2 Well Loss Analysis. . . . . . . . . . . . . . . . . . . . . . . . . . . . . . . . . . . . . . . . . . 4-2
5.0 Constant-Rate Test Evaluation . . . . . . . . . . . . . . . . . . . . . . . . . . . . . . . . . . . . . . . . . . . . . . 5-1
5.1 Data Review and Adjustments . . . . . . . . . . . . . . . . . . . . . . . . . . . . . . . . . . . . . . . . 5-15.2 Constant-Rate Test Data . . . . . . . . . . . . . . . . . . . . . . . . . . . . . . . . . . . . . . . . . . . . . 5-25.3 Analytical Model Selection . . . . . . . . . . . . . . . . . . . . . . . . . . . . . . . . . . . . . . . . . . 5-25.4 Constant-Rate and Recovery-Test Analysis . . . . . . . . . . . . . . . . . . . . . . . . . . . . . . 5-5
5.4.1 Test Analysis Methodology . . . . . . . . . . . . . . . . . . . . . . . . . . . . . . . . . . . 5-65.4.2 Test Analysis Results . . . . . . . . . . . . . . . . . . . . . . . . . . . . . . . . . . . . . . . . 5-6
5.5 Discussion. . . . . . . . . . . . . . . . . . . . . . . . . . . . . . . . . . . . . . . . . . . . . . . . . . . . . . . 5-12
6.0 Water Chemistry . . . . . . . . . . . . . . . . . . . . . . . . . . . . . . . . . . . . . . . . . . . . . . . . . . . . . . . . . 6-1
6.1 Groundwater Sample Collection and Analysis . . . . . . . . . . . . . . . . . . . . . . . . . . . . 6-1

ii
Southern Nevada Water Authority - Water Resources Division
6.2 EPA Drinking Water Standards . . . . . . . . . . . . . . . . . . . . . . . . . . . . . . . . . . . . . . . 6-26.3 Groundwater-Chemistry Results. . . . . . . . . . . . . . . . . . . . . . . . . . . . . . . . . . . . . . . 6-2
6.3.1 Field Results . . . . . . . . . . . . . . . . . . . . . . . . . . . . . . . . . . . . . . . . . . . . . . . 6-26.3.2 Major Constituents . . . . . . . . . . . . . . . . . . . . . . . . . . . . . . . . . . . . . . . . . . 6-36.3.3 Trace and Minor Constituents . . . . . . . . . . . . . . . . . . . . . . . . . . . . . . . . . 6-46.3.4 Stable Isotopes and Environmental Tracers . . . . . . . . . . . . . . . . . . . . . . . 6-4
6.3.4.1 Hydrogen and Oxygen Isotopes . . . . . . . . . . . . . . . . . . . . . . . 6-46.3.4.2 Tritium . . . . . . . . . . . . . . . . . . . . . . . . . . . . . . . . . . . . . . . . . . . 6-66.3.4.3 Carbon Isotopes . . . . . . . . . . . . . . . . . . . . . . . . . . . . . . . . . . . . 6-66.3.4.4 Chlorine-36/Chloride Ratios . . . . . . . . . . . . . . . . . . . . . . . . . . 6-76.3.4.5 Strontium and Uranium Isotopes . . . . . . . . . . . . . . . . . . . . . . . 6-7
6.3.5 Radiological Parameters. . . . . . . . . . . . . . . . . . . . . . . . . . . . . . . . . . . . . . 6-76.3.6 Organic Compounds. . . . . . . . . . . . . . . . . . . . . . . . . . . . . . . . . . . . . . . . . 6-7
6.4 Summary. . . . . . . . . . . . . . . . . . . . . . . . . . . . . . . . . . . . . . . . . . . . . . . . . . . . . . . . . 6-8
7.0 References. . . . . . . . . . . . . . . . . . . . . . . . . . . . . . . . . . . . . . . . . . . . . . . . . . . . . . . . . . . . . . 7-1
Appendix A - CD-ROM Contents
A.1.0 Introduction. . . . . . . . . . . . . . . . . . . . . . . . . . . . . . . . . . . . . . . . . . . . . . . . . . . . . . . . . . . . .A-1
A.1.1 Photos . . . . . . . . . . . . . . . . . . . . . . . . . . . . . . . . . . . . . . . . . . . . . . . . . . . . . . . . . . .A-1A.1.2 Read-Me File . . . . . . . . . . . . . . . . . . . . . . . . . . . . . . . . . . . . . . . . . . . . . . . . . . . . .A-1A.1.3 Background Water-Level Data . . . . . . . . . . . . . . . . . . . . . . . . . . . . . . . . . . . . . . . .A-1A.1.4 Barometric-Pressure Data . . . . . . . . . . . . . . . . . . . . . . . . . . . . . . . . . . . . . . . . . . . .A-1A.1.5 Step-Drawdown Test Data . . . . . . . . . . . . . . . . . . . . . . . . . . . . . . . . . . . . . . . . . . .A-1A.1.6 Constant-Rate Test . . . . . . . . . . . . . . . . . . . . . . . . . . . . . . . . . . . . . . . . . . . . . . . . .A-1A.1.7 AQTESOLV . . . . . . . . . . . . . . . . . . . . . . . . . . . . . . . . . . . . . . . . . . . . . . . . . . . . . .A-2A.1.8 Water Chemistry . . . . . . . . . . . . . . . . . . . . . . . . . . . . . . . . . . . . . . . . . . . . . . . . . . .A-2
Appendix B - Water-Chemistry Data

Hydrologic Data Analysis Report for Test Well SPR7005X in Spring Valley
iii
FIGURESNUMBER TITLE PAGE
2-1 SNWA Exploratory and Test Wells in Spring Valley (as of June 2011) . . . . . . . . . . . . . 2-2
2-2 Surficial Geology and Structural Features at Monitor Well SPR7005M and Test Well SPR7005X. . . . . . . . . . . . . . . . . . . . . . . . . . . . . . . . . . . . . . . . . . . . . . . . . 2-5
2-3 Test Well SPR7005X Construction Schematic . . . . . . . . . . . . . . . . . . . . . . . . . . . . . . . . 2-7
2-4 Borehole Stratigraphic Column of Test Well SPR7005X . . . . . . . . . . . . . . . . . . . . . . . . 2-8
2-5 Monitor Well SPR7005M Construction Schematic . . . . . . . . . . . . . . . . . . . . . . . . . . . . . 2-9
2-6 Borehole Stratigraphic Column of Test Well SPR7005M . . . . . . . . . . . . . . . . . . . . . . . 2-11
2-7 Test Well SPR7005X Historic Hydrograph . . . . . . . . . . . . . . . . . . . . . . . . . . . . . . . . . . 2-13
2-8 Historical Hydrograph for Monitor Well SPR7005M . . . . . . . . . . . . . . . . . . . . . . . . . . 2-14
2-9 Historical Hydrograph for Background Well 184W506M. . . . . . . . . . . . . . . . . . . . . . . 2-14
3-1 Hydrograph for Background Well 184W506M During Testing Activities at Test Well SPR7005X . . . . . . . . . . . . . . . . . . . . . . . . . . . . . . . . . . . . . . . . . . . . . . . . . . 3-2
3-2 Local Barometric-Pressure Variation and Groundwater-Level Measurements at Monitor Well SPR7005M. . . . . . . . . . . . . . . . . . . . . . . . . . . . . . . . . . . . . . . . . . . . . . . 3-3
4-1 Linear Plot of Drawdown for Each Pumping Interval During Step-Drawdown Testing of Test Well SPR7005X . . . . . . . . . . . . . . . . . . . . . . . . . . . . . . . . . . . . . . . . . . . 4-2
4-2 Linear Plot of Step-Test Drawdown and Pumping Depth-to-Water Level for Various Discharge Rates for Test Well SPR7005X . . . . . . . . . . . . . . . . . . . . . . . . . . 4-3
4-3 Step-Drawdown Test Specific Capacity Versus Discharge Rate for Test Well SPR7005X . . . . . . . . . . . . . . . . . . . . . . . . . . . . . . . . . . . . . . . . . . . . . . . . . . . . 4-3
4-4 Evaluation of Head Loss Coefficients Using Hantush-Bierschenk Method from Step-Drawdown Test Results . . . . . . . . . . . . . . . . . . . . . . . . . . . . . . . . . . . . . . . . . 4-5
5-1 Discharge Record at Test Well SPR7005X . . . . . . . . . . . . . . . . . . . . . . . . . . . . . . . . . . . 5-2
5-2 Log-Log Data Plot of Drawdown versus Time from Monitor Well SPR7005M. . . . . . . 5-3
5-3 Semi-Log Data Plot of Drawdown versus Time from Monitor Well SPR7005M. . . . . . 5-3
iv
FIGURES (CONTINUED)NUMBER TITLE PAGE
Southern Nevada Water Authority - Water Resources Division
5-4 Log-Log Data Plot of Drawdown versus Time from Test Well SPR7005X . . . . . . . . . . 5-4
5-5 Semi-Log Data Plot of Drawdown versus Time from Test Well SPR7005. . . . . . . . . . . 5-4
5-6 Optimal Barker GRFM Solution Semi-Log Plot . . . . . . . . . . . . . . . . . . . . . . . . . . . . . . . 5-9
5-7 Optimal Barker GRFM Solution Derivative Drawdown Plot . . . . . . . . . . . . . . . . . . . . . 5-9
5-8 Optimal Barker GRFM Solution Recovery . . . . . . . . . . . . . . . . . . . . . . . . . . . . . . . . . . 5-10
5-9 Late-Time Cooper-Jacob Analysis of Monitor Well . . . . . . . . . . . . . . . . . . . . . . . . . . . 5-11
5-10 Late-Time Cooper-Jacob Analysis of Test Well . . . . . . . . . . . . . . . . . . . . . . . . . . . . . . 5-11
5-11 Monitor Well SPR7005M Recovery Data Presenting Residual Drawdown Versus the Log of the Ratio of t/t’ . . . . . . . . . . . . . . . . . . . . . . . . . . . . . . . . . . . . . . . . . 5-12
6-1 Piper Diagram Illustrating Relative Major-Ion Compositions . . . . . . . . . . . . . . . . . . . . . 6-3
6-2 Plot of δD versus δ18O . . . . . . . . . . . . . . . . . . . . . . . . . . . . . . . . . . . . . . . . . . . . . . . . . . . 6-5
A-1 SPR7005X Test Well Site, Facing East-Northeast. . . . . . . . . . . . . . . . . . . . . . . . . . . . . .A-2
A-2 SPR7005X Test Wellhead Equipment . . . . . . . . . . . . . . . . . . . . . . . . . . . . . . . . . . . . . . .A-3
A-3 SPR7005X Test Wellhead Equipment with Trailer and Generator . . . . . . . . . . . . . . . . .A-3
A-4 Discharge Piping, Facing East from Well Site SPR7005X . . . . . . . . . . . . . . . . . . . . . . .A-4
A-5 Discharge with Erosion Control for Hydrologic Testing Performed at Test Well SPR7005X . . . . . . . . . . . . . . . . . . . . . . . . . . . . . . . . . . . . . . . . . . . . . . . . . .A-4
Hydrologic Data Analysis Report for Test Well SPR7005X in Spring Valley
v
TABLESNUMBER TITLE PAGE
2-1 Test Well SPR7005X Borehole and Well Statistics . . . . . . . . . . . . . . . . . . . . . . . . . . . . . . 2-6
2-2 Monitor Well SPR7005M Borehole and Well Statistics . . . . . . . . . . . . . . . . . . . . . . . . . 2-10
2-3 Well Survey Data and Measuring Point Information . . . . . . . . . . . . . . . . . . . . . . . . . . . 2-12
4-1 Step-Drawdown Test Analysis . . . . . . . . . . . . . . . . . . . . . . . . . . . . . . . . . . . . . . . . . . . . . . 4-5
5-1 Measurement and Parameter Values Used for Analysis. . . . . . . . . . . . . . . . . . . . . . . . . . . 5-7
5-2 Summary of Optimal Analysis Results. . . . . . . . . . . . . . . . . . . . . . . . . . . . . . . . . . . . . . . . 5-7
6-1 Total Depths of Wells Drilled by SNWA in Spring Valley, Nevada . . . . . . . . . . . . . . . . . 6-2
B-1 Field and Analytical Results, Analytical Methods, Reporting Limits, and Maximum Contaminant Levels for Inorganic, Stable Isotopic, and Radiological Constituents in Groundwater Samples from Test Well SPR7005X and Monitor Well SPR7005M . . . . . .B-1
B-2 Organic Compounds Analyzed in Groundwater Samples from Test Well SPR7005X, Including the EPA Method, Reporting Limit, and Maximum Contaminant Level . . . . . .B-4

vi
Southern Nevada Water Authority - Water Resources Division
This Page Left Intentionally Blank

Hydrologic Data Analysis Report for Test Well SPR7005X in Spring Valley
vii
ACRONYMS
Barker GRFM Barker generalized radial flow model
EPA U.S. Environmental Protection Agency
ET Evapotranspiration
HSLA high strength low alloy
MCL maximum contaminant level
MS mild steel
NAD83 North American Datum of 1983
SNWA Southern Nevada Water Authority
UTM Universal Transverse Mercator
ABBREVIATIONS
°C degrees Celsius
amsl above mean sea level
bgs below ground surface
cm centimeter
d day
ft foot
gal gallon
gpm gallons per minute
I.D. inside diameter (of casing)
in. inch
in. Hg inches of mercury
L liter
lb pound
m meter
mEq milliequivalent
mg milligram
mi mile
min minute
ml milliliter
mrem millirem
μg microgram
μS microsiemen
NTU nephelometric turbidity unit
viii
ABBREVIATIONS (CONTINUED)
Southern Nevada Water Authority - Water Resources Division
O.D. outside diameter (of casing)
‰ per mil
pmc percent modern carbon
pCi picocurie
psi pounds per square inch
yr year

Hydrologic Data Analysis Report for Test Well SPR7005X in Spring Valley
Executive Summary ES-1
ES.1.0 EXECUTIVE SUMMARY
The development and hydrologic testing program at Test Well SPR7005X, located on the west side of Spring Valley (hydrographic area 184), White Pine County, Nevada was performed from April 10 through July 13, 2008. The test well and associated Monitor Well SPR7005M are completed within the carbonate-rock aquifer in limestone and dolomite, with the bottom of the borehole completed within quartzite. Test Well SPR7005X and Monitor Well SPR7005M are completed to depths of 1,350 and 1,404 ft bgs, respectively. Static depths to water in the two wells are approximately 496 and 495 ft bgs, respectively. Three wells (test, monitor, and background well) were monitored throughout the testing program.
The development and test pumping extracted 28,517,200 gal of water. Development pumping improved specific capacity, a ratio of discharge (Q) to drawdown (s) in the test well, from 99.1 to 105.5 gpm/ft at 2,300 gpm after the first day of development, and from 106.8 to 111.1 gpm/ft at 2,500 gpm after the second day of development. A five-interval well performance step-drawdown test was conducted at discharge rates ranging from 2,000 to 3,800 gpm to evaluate the well performance over a range of pumping rates, evaluate well loss coefficients, and determine the optimal discharge rate for the constant-rate test.
A 120-hour constant-rate test was performed at a target discharge rate of 3,000 gpm. Diagnostic drawdown data plots and site hydrogeologic conditions were indicative of a dual-porosity aquifer system with a linear high hydraulic conductivity fracture zone associated with faulting that provides the primary conduit of flow and results in high well yield. Specific capacity during the last 12 hours of the 120-hour constant-rate test ranged from 74.9 to 75.4 gpm/ft at 3,000 gpm. The aquifer test provided information on the local characteristics of the high-hydraulic conductivity linear feature. Limited information on the long-term response of pumping as a function of recharge to the feature from the bordering formation was obtained due to the duration of test. Additional analysis should be performed as longer-term pumping or regional hydrogeologic data become available for the well site to further refine aquifer property values and evaluate the presence of boundary conditions.
Site hydrogeologic data and diagnostic log-log and derivative drawdown data plots indicate that a dual porosity model is the most appropriate solution method. The Barker Generalized Radial Flow Model (GRFM) Solution, which considers fracture-fluid flow in multiple dimensions, delayed gravity drainage, dual porosity, wellbore storage, and well bore skin effect was selected and applied to the test and monitor well pumping and recovery data. The Cooper-Jacob approximation and Theis recovery methods were performed for comparison purposes. Analyses were performed using AQTESOLV software.
The Barker GRFM analysis estimates a fracture hydraulic conductivity (K) of 2,658 ft/day. The test provided information on the local characteristics of the high-hydraulic conductivity linear feature which is in direct connection between the test and monitor wells.
Executive Summary
Southern Nevada Water Authority - Water Resources Division
ES-2
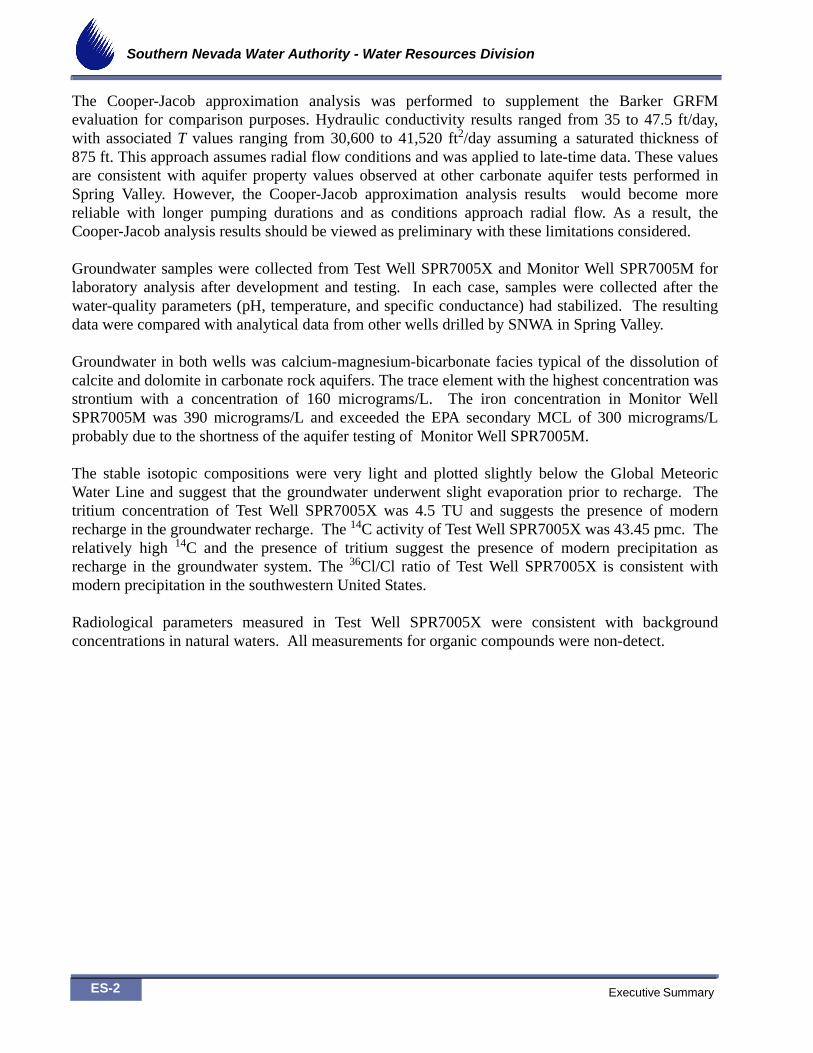
The Cooper-Jacob approximation analysis was performed to supplement the Barker GRFM evaluation for comparison purposes. Hydraulic conductivity results ranged from 35 to 47.5 ft/day, with associated T values ranging from 30,600 to 41,520 ft2/day assuming a saturated thickness of 875 ft. This approach assumes radial flow conditions and was applied to late-time data. These values are consistent with aquifer property values observed at other carbonate aquifer tests performed in Spring Valley. However, the Cooper-Jacob approximation analysis results would become more reliable with longer pumping durations and as conditions approach radial flow. As a result, the Cooper-Jacob analysis results should be viewed as preliminary with these limitations considered.
Groundwater samples were collected from Test Well SPR7005X and Monitor Well SPR7005M for laboratory analysis after development and testing. In each case, samples were collected after the water-quality parameters (pH, temperature, and specific conductance) had stabilized. The resulting data were compared with analytical data from other wells drilled by SNWA in Spring Valley.
Groundwater in both wells was calcium-magnesium-bicarbonate facies typical of the dissolution of calcite and dolomite in carbonate rock aquifers. The trace element with the highest concentration was strontium with a concentration of 160 micrograms/L. The iron concentration in Monitor Well SPR7005M was 390 micrograms/L and exceeded the EPA secondary MCL of 300 micrograms/L probably due to the shortness of the aquifer testing of Monitor Well SPR7005M.
The stable isotopic compositions were very light and plotted slightly below the Global Meteoric Water Line and suggest that the groundwater underwent slight evaporation prior to recharge. The tritium concentration of Test Well SPR7005X was 4.5 TU and suggests the presence of modern recharge in the groundwater recharge. The 14C activity of Test Well SPR7005X was 43.45 pmc. The relatively high 14C and the presence of tritium suggest the presence of modern precipitation as recharge in the groundwater system. The 36Cl/Cl ratio of Test Well SPR7005X is consistent with modern precipitation in the southwestern United States.
Radiological parameters measured in Test Well SPR7005X were consistent with background concentrations in natural waters. All measurements for organic compounds were non-detect.
Hydrologic Data Analysis Report for Test Well SPR7005X in Spring Valley
Section 1.0 1-1
1.0 INTRODUCTION
In support of its Clark, Lincoln, and White Pine Counties Groundwater Development Project, Southern Nevada Water Authority (SNWA) installed test and monitor wells in Spring Valley (Hydrographic Area 184) to evaluate hydrogeologic conditions. This report documents the collection, analysis, and evaluation of data obtained during the well development and hydraulic testing of Test Well SPR7005X and Monitor Well SPR7005M located in western Spring Valley, White Pine County, Nevada.
This report also presents groundwater-level data collected at the site post-test through December 2010. A separate document entitled Geologic Data Analysis Report for Monitor Well SPR7005M and Test Well SPR7005X in Spring Valley (Mace and Muller, 2010) includes the documentation and detailed results for the drilling program, including evaluation of lithology, structural features, drilling parameters, and geophysical logs.
1.1 Program Objectives
Hydraulic testing was performed to evaluate well performance and to provide representative data on the hydraulic properties of the alluvial aquifer in the vicinity of the test well. Groundwater samples were also collected for laboratory analysis to evaluate the groundwater chemistry of the aquifer in the vicinity of the well.
Prior to hydraulic testing, Test Well SPR7005X was developed to remove any remaining drilling fluids and improve the hydraulic connection with the formation. The development performed consisted of pump and surge activities. This was in addition to airlifting and swabbing development that were performed earlier immediately after well installation.
1.2 Testing and Monitoring Program
The well development and hydraulic testing program was performed from April 10 through July 13, 2008, and consisted of the following activities:
• Developed the well using airlift and dual swab techniques
• Final well development, using surging methods
• Well hydraulic testing and performance evaluation, using a five-interval step-drawdown test
• Aquifer-property evaluation testing, using a 120-hour constant-rate test and subsequent water-level recovery measurements
Section 1.0
Southern Nevada Water Authority - Water Resources Division
1-2
• Collection of groundwater samples for laboratory chemical analysis
A complete schedule of test program activities is presented in Section 3.1.
Monitor Well SPR7005M is part of the SNWA Spring Valley regional water-level monitoring network. Water-level data have been collected regularly from this location since the hydraulic testing program and is currently equipped with continuous water level recording instrumentation.
1.3 Report Organization
This report is divided into seven sections and two appendixes.
Section 1.0 presents introductory information about the testing program and this report.
Section 2.0 describes the well site hydrogeology and summarizes the well construction, borehole lithology, and water-level data for the test and monitor wells.
Section 3.0 describes the test program and presents information on test instrumentation and background data.
Section 4.0 presents the analysis and evaluation of the results from the test well development and performance step-drawdown testing.
Section 5.0 presents the analysis and evaluation of the constant-rate aquifer test.
Section 6.0 presents the groundwater-chemistry results and evaluation.
Section 7.0 provides a list of references cited in this report.
Appendix A presents site photos and documentation of site physical and transducer test data. The data package on the CD-ROM includes regional background monitor well water levels, barometric pressure, and hydrologic data collected from the test and monitor wells.
Appendix B presents the water-chemistry laboratory data reports.
Hydrologic Data Analysis Report for Test Well SPR7005X in Spring Valley
Section 2.0 2-1
2.0 WELL SITE DESCRIPTION
SNWA Test Well SPR7005X, is located on the west side of Spring Valley, on public land managed by Bureau of Land Management near Cooper Canyon, approximately three mi north of the intersection of SR 893 and U.S. Highway 50. The test well is located in Section 9, T14N, R66E at a surface elevation of approximately 6,398 ft amsl. Access to the site is from SR 893 approximately two mi northwest along a dirt road. A map showing the site location and other SNWA test and monitor wells in Spring Valley installed as of June 2010 is presented on Figure 2-1. This section presents an overview of the hydrogeologic setting and description of the test and monitor wells including construction details and historic water level hydrographs.
2.1 Hydrogeologic Setting
This subsection presents the regional and local hydrogeologic setting of the Test Well SPR7005X site. Previous studies and reports that detail the regional hydrogeology are referenced. A description of the local hydrogeologic setting is provided and is based on field mapping, drilling data, and review of existing hydrogeologic and geophysical information.
2.1.1 Regional Hydrogeologic Setting
Spring Valley, located in east-central Nevada, is approximately 120 mi in length and averages approximately 16 mi in width. The valley is located within the Basin and Range province and is an upgradient basin within the Great Salt Lake Desert Flow System. It is bounded by the Schell Creek Range to the west, the Antelope Range to the north, the Snake Range and Limestone Hills to the east, the Wilson Creek Range to the south, and the Fortification Range to the southwest.
The primary aquifer systems within Spring Valley are carbonate and basin fill, with a volcanic aquifer occurring in the southwest portion of the valley. Extensive north-south-trending range-front faults and related structures are the primary control of groundwater flow in the carbonates and are present on both the east and west sides of the valley. The local discharge of groundwater in central Spring Valley in the vicinity of the well site is from the carbonates through the basin fill generally toward the central axis of the valley with discharge occurring through evapotranspiration (ET). Some groundwater flow in the southern portion of Spring Valley is postulated to occur south of the Snake Range through the fractures in the carbonates of the Limestone Hills into Hamlin Valley.
Numerous studies related to Spring Valley and adjacent basins have been performed since the late 1940s. These studies have included water-resource investigations, geologic and hydrogeologic investigations, recharge and discharge estimations, and other hydrologic studies. The regional hydrogeologic framework and a summary of results of previous studies have been presented in several reports.

Section 2.0
Southern Nevada Water Authority - Water Resources Division
2-2
Figure 2-1SNWA Exploratory and Test Wells in Spring Valley (as of June 2011)
_̂
_̂
_̂
!R
!R
!R
!R
!R!R
!R
!R
!R
!R!R
!R!R
!R
SPR7007X
SPR7008X
SPR7005X
184W105
184W103
184W101
SPR7007M
SPR7008M
SPR7006MSPR7005M
184W506M
184W504M
184W502M184W508M
180W902M
JuabTooele
LincolnWhite Pine
MillardBeaver
Nye
£¤6
£¤50
£¤93
£¤93
?@488
?@490
?@487
?@894
?@893
?@318
UV159
UV21
£¤6
£¤6 £¤50
£¤50
£¤93
UTA
HN
EVA
DA
Baker
Ely
Lund
179STEPTOEVALLEY
178BBUTTEVALLEY
(SOUTHERNPART)
253DEEPCREEKVALLEY
175LONGVALLEY
185TIPPETTVALLEY
195SNAKEVALLEY
194PLEASANTVALLEY
257TULEVALLEY
174JAKESVALLEY
207WHITERIVERVALLEY
196HAMLINVALLEY
180CAVEVALLEY 183
LAKEVALLEY
255PINE
VALLEY
184SPRINGVALLEY
650,000
650,000
700,000
700,000
750,000
750,000
800,000
800,000
4,30
0,00
0
4,30
0,00
0
4,35
0,00
0
4,35
0,00
0
4,40
0,00
0
4,40
0,00
0
LegendSNWA Well
!R Basin Fill Well
!R Carbonate Well
!R Volcanic Well
Spring Valley*
Hydrographic Area*
County Boundary
State Boundary
_̂ Town
Major Roads
US Route
State Route
.4 0 4 8 12 162
MilesMAP ID 15133-3213 02/23/2010 BP
*Hydrographic Area name and number shown
Grid based on Universal Transverse Mercator projection, North American Datum 1983, Zone 11N meters. Hillshadedeveloped from 30-m DEM, Sun Angle 45°, Azimuth 315°.
Hydrologic Data Analysis Report for Test Well SPR7005X in Spring Valley
Section 2.0 2-3
These historic as well as most recent reports are presented below:
• Water Resources Appraisal of Spring Valley, White Pine and Lincoln Counties, Nevada (Rush and Kazmi, 1965)
• Major Ground-Water Flow Systems in the Great Basin Region of Nevada, Utah, and Adjacent States (Harrill et al., 1988)
• Water Resources of the Basin and Range Carbonate-Rock Aquifer System, White Pine County, Nevada, and Adjacent Areas in Nevada and Utah (Welch et al., 2007)
• 2008 Spring Valley Hydrologic Monitoring and Mitigation Plan Status and Data Report (SNWA, 2009)
• 2009 Spring Valley Hydrologic Monitoring and Mitigation Plan Status and Data Report (SNWA, 2010)
• 2010 Spring Valley Hydrologic Monitoring and Mitigation Plan Status and Data Report (SNWA, 2011)
• Geology and Geophysics of Spring, Cave, Dry Lake, and Delamar Valleys, White Pine and Lincoln Counties and Adjacent Areas, Nevada and Utah: The Geologic Framework of Regional Groundwater Flow Systems (Rowley, et al., 2011)
• Hydrology and Water Resources of Spring, Cave, Dry Lake, and Delamar Valleys, Nevada and Vicinity (Burns and Drici, 2011)
• Committed Groundwater Resources in four Nevada Hydrographic Areas: Cave, Dry Lake, Delamar, and Spring Valleys (Stanka, 2011)
• SNWA Hydrologic Management Program for Groundwater Development in Spring, Cave, Dry Lake, and Delamar Valleys, Nevada (Prieur, 2011)
2.1.2 Local Hydrogeologic Setting
The site location was selected after conducting a geologic reconnaissance of the area, including field mapping, review of regional geophysical and well data, evaluation of surface structural features using aerial photography, and evaluation of local geophysical data. A regional gravity survey was performed by U.S. Geological Survey (USGS) to estimate the structure and depth of the basins in eastern Nevada. Gravity data for Spring and Snake Valley are presented in USGS Open File Report 2006-1160 (Mankinen et al., 2006). Surface Geophysical profiles were also performed in the vicinity of the well site by the USGS and SNWA. The results are discussed in Audiomagnetotelluric Data and Two-Dimensional Models from Spring, Snake, and Three Lakes Valleys, Nevada (McPhee et al., 2007) and geologically interpreted in Audiomagnetotelluric Investigations in Selected Basins in White Pine and Lincoln Counties, East-Central Nevada (Pari and Baird, 2011).
Section 2.0
Southern Nevada Water Authority - Water Resources Division
2-4
A site map presenting the surficial geology, test and monitor well locations are presented in Figure 2-2. The geologic units encountered at the well site are Quaternary alluvium, Tertiary welded volcanic tuff, and Cambrian carbonates. The Cambrian carbonates are part of the Cambrian, Middle Part, RGU (Dixon et al., 2007), and consist of limestones, dolomites, siltstones and quartzites (Mace and Muller, 2010). A further discussion of geophysical profiles, local geologic structure, and detailed lithologic descriptions of the stratigraphic units encountered are presented in (Mace and Muller, 2010).
2.2 Testing Program Monitoring Locations
Three wells consisting of the test, monitor, and background well were monitored throughout the testing program. Site attribute, lithologic, and hydrologic information for the locations are presented in this section.
2.2.1 Test Well SPR7005X
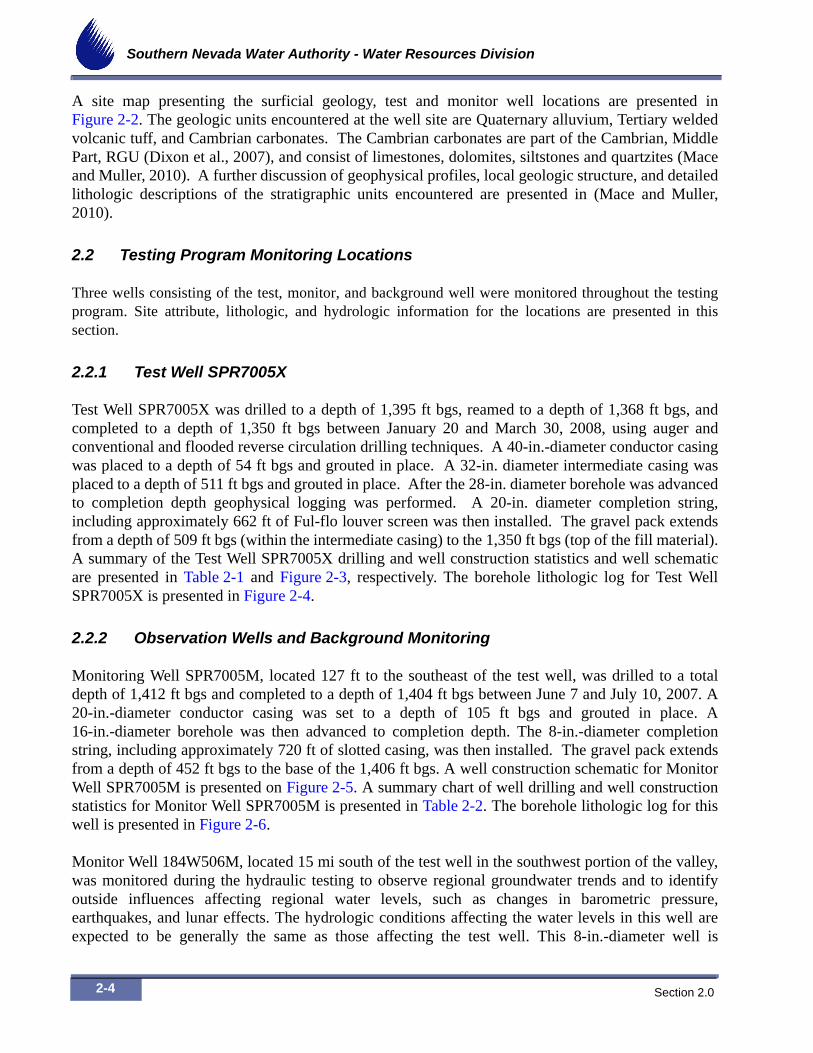
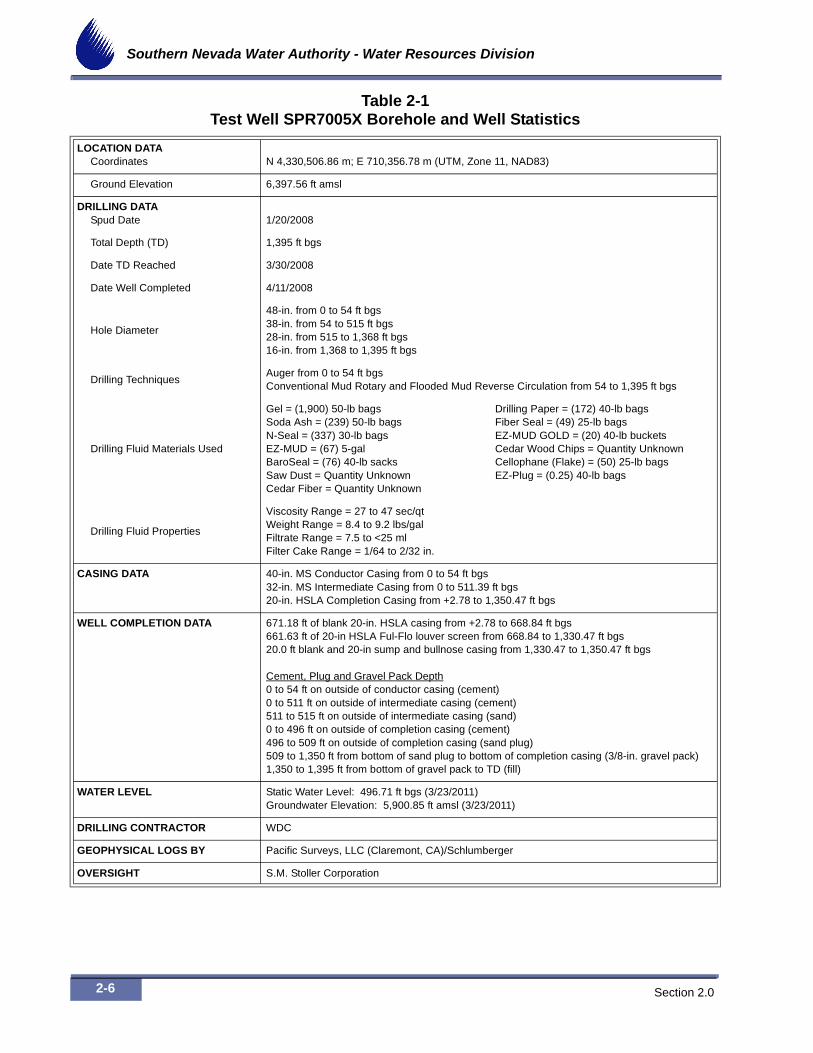
Test Well SPR7005X was drilled to a depth of 1,395 ft bgs, reamed to a depth of 1,368 ft bgs, and completed to a depth of 1,350 ft bgs between January 20 and March 30, 2008, using auger and conventional and flooded reverse circulation drilling techniques. A 40-in.-diameter conductor casing was placed to a depth of 54 ft bgs and grouted in place. A 32-in. diameter intermediate casing was placed to a depth of 511 ft bgs and grouted in place. After the 28-in. diameter borehole was advanced to completion depth geophysical logging was performed. A 20-in. diameter completion string, including approximately 662 ft of Ful-flo louver screen was then installed. The gravel pack extends from a depth of 509 ft bgs (within the intermediate casing) to the 1,350 ft bgs (top of the fill material). A summary of the Test Well SPR7005X drilling and well construction statistics and well schematic are presented in Table 2-1 and Figure 2-3, respectively. The borehole lithologic log for Test Well SPR7005X is presented in Figure 2-4.
2.2.2 Observation Wells and Background Monitoring
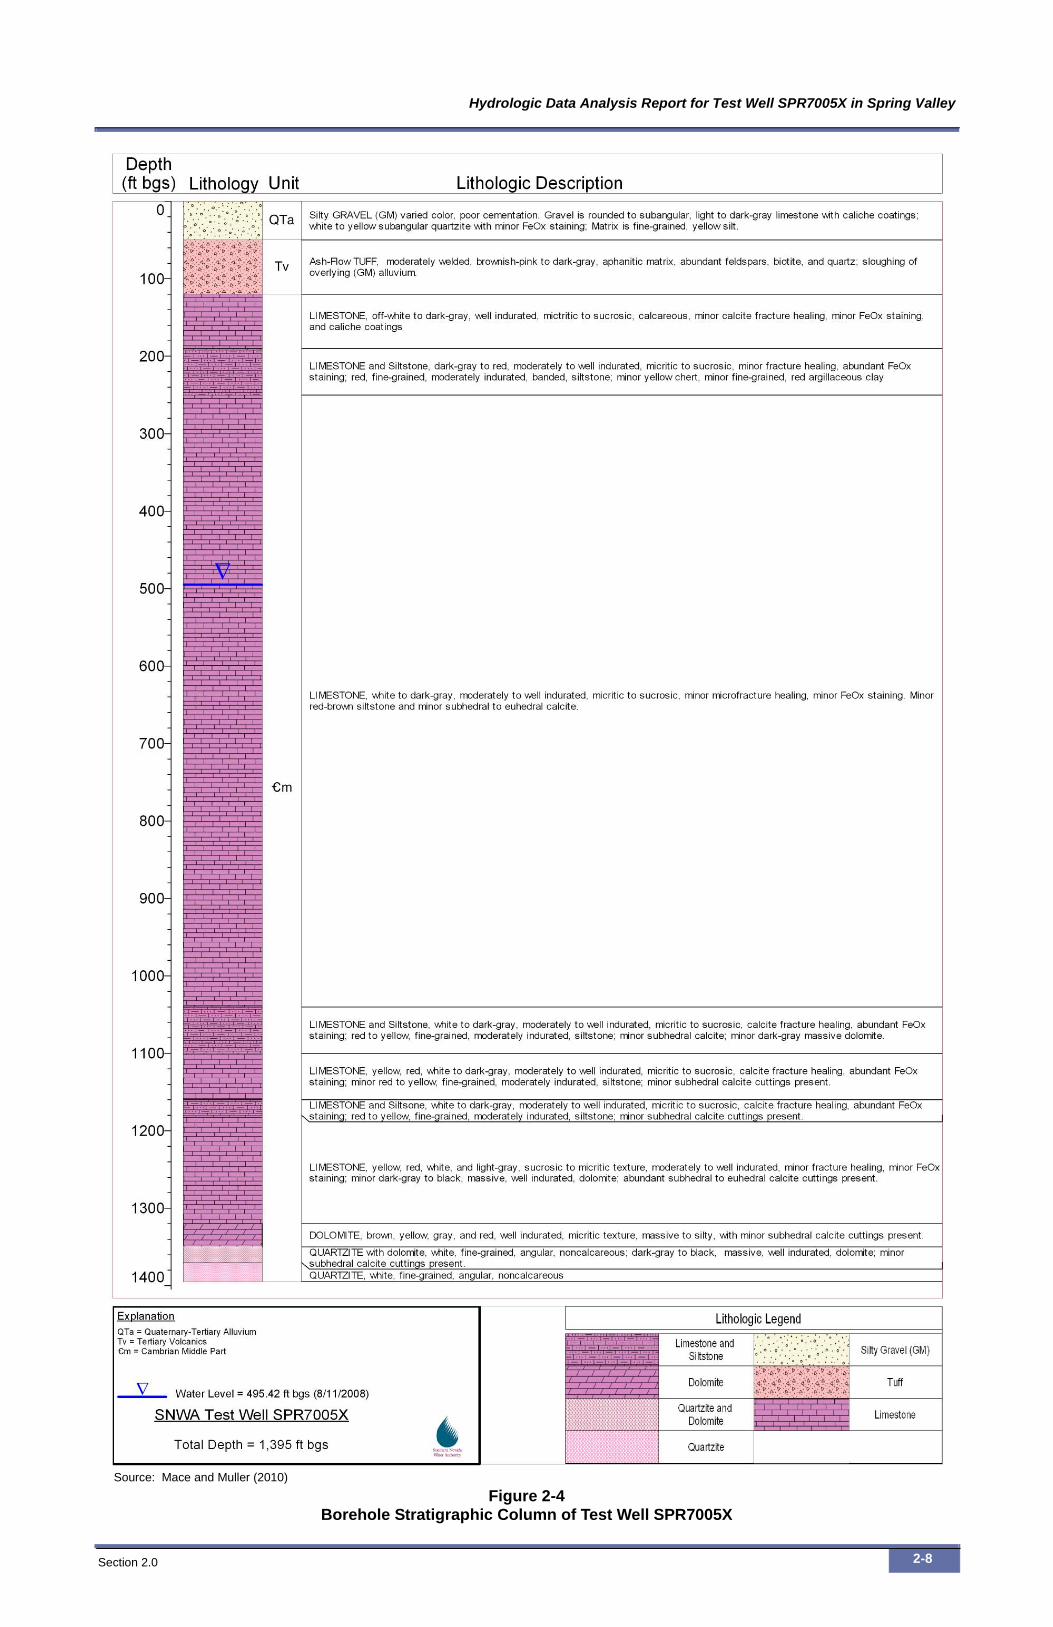
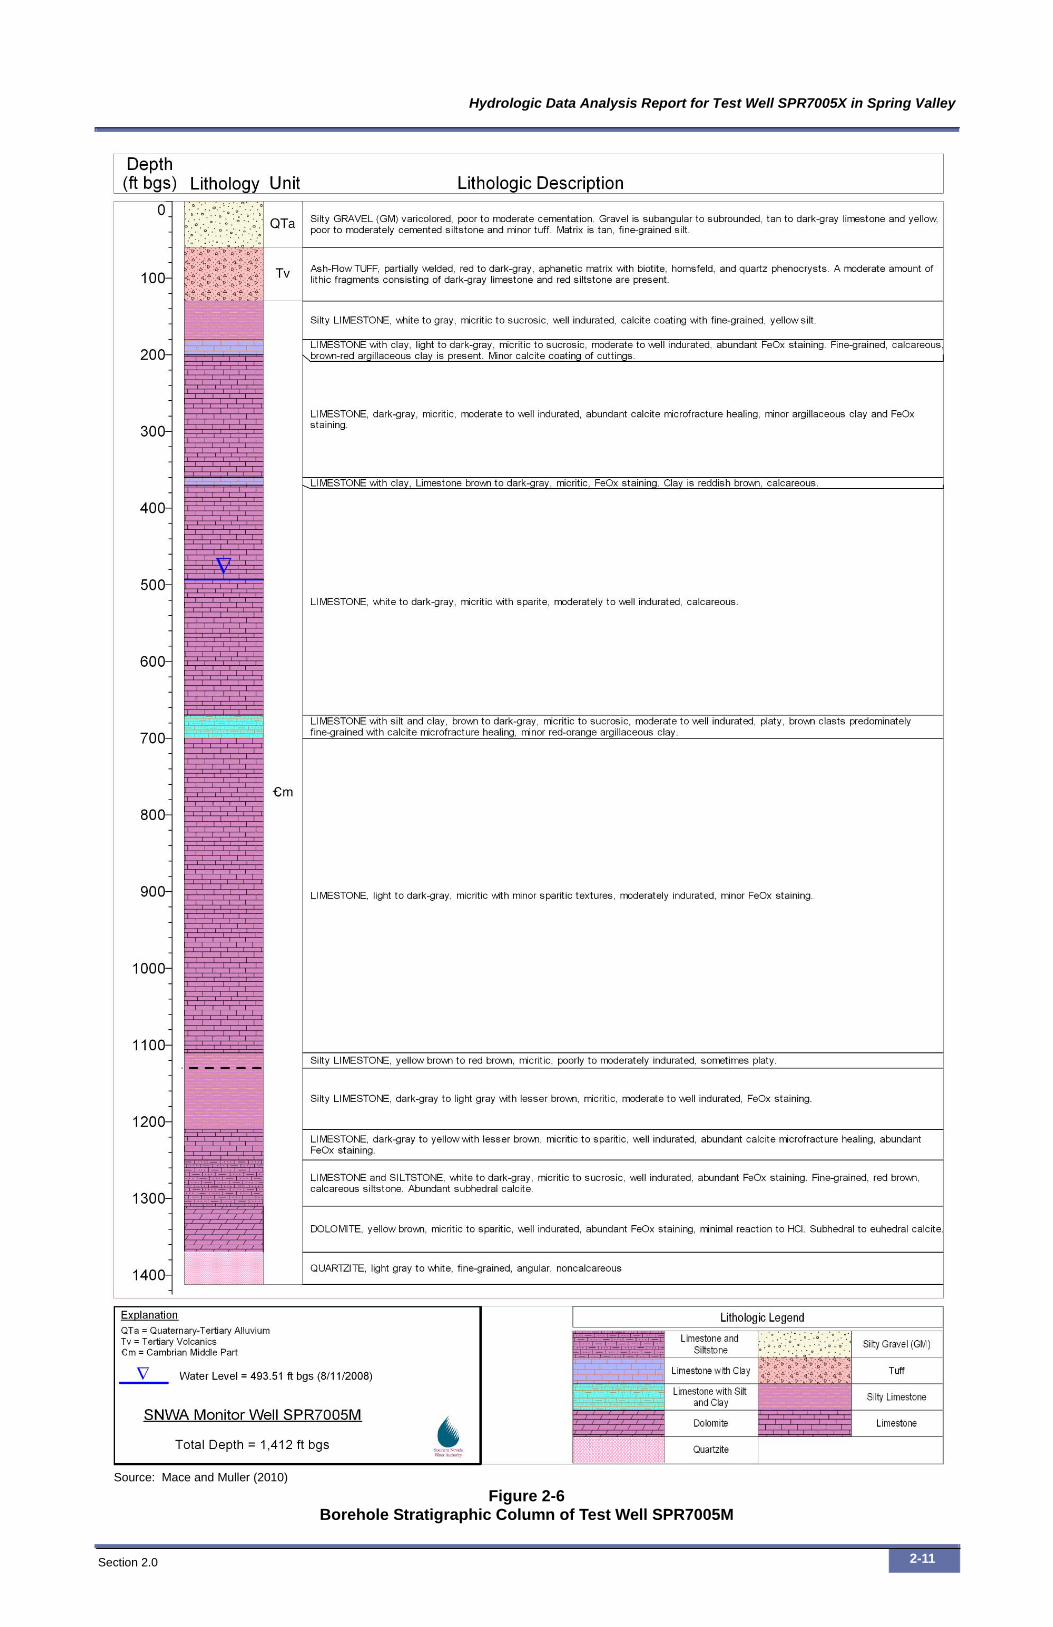
Monitoring Well SPR7005M, located 127 ft to the southeast of the test well, was drilled to a total depth of 1,412 ft bgs and completed to a depth of 1,404 ft bgs between June 7 and July 10, 2007. A 20-in.-diameter conductor casing was set to a depth of 105 ft bgs and grouted in place. A 16-in.-diameter borehole was then advanced to completion depth. The 8-in.-diameter completion string, including approximately 720 ft of slotted casing, was then installed. The gravel pack extends from a depth of 452 ft bgs to the base of the 1,406 ft bgs. A well construction schematic for Monitor Well SPR7005M is presented on Figure 2-5. A summary chart of well drilling and well construction statistics for Monitor Well SPR7005M is presented in Table 2-2. The borehole lithologic log for this well is presented in Figure 2-6.
Monitor Well 184W506M, located 15 mi south of the test well in the southwest portion of the valley, was monitored during the hydraulic testing to observe regional groundwater trends and to identify outside influences affecting regional water levels, such as changes in barometric pressure, earthquakes, and lunar effects. The hydrologic conditions affecting the water levels in this well are expected to be generally the same as those affecting the test well. This 8-in.-diameter well is

Hydrologic Data Analysis Report for Test Well SPR7005X in Spring Valley
Section 2.0 2-5
Source: Mace and Muller (2010); Unit designations are the RGUs defined in Dixon et al. (2007).
Figure 2-2Surficial Geology and Structural Features
at Monitor Well SPR7005M and Test Well SPR7005X
ââââââââââââââââââââââââââââââââââââââââââââââââââââââââ
!.SPR7005M
SPR7005X
C o o p e r C a n y o n
_m
_m
_p_s
Ol
QTa
710,000
710,000
712,000
712,000
4,33
0,00
0
4,33
0,00
0
4,33
2,00
0
4,33
2,00
0
.0.1 0 0.1 0.2 0.3 0.4
Miles
MAP ID 15717-3212 10/13/2009 JBB/JM*Well offset exaggerated on map for display purposes
Grid based on Universal Transverse Mercator projection, North American Datum 1983, Z one 11N meters. Local roads,PLSS data, and 40-foot contour lines shown in background.
179
178B
253
175
185
184 195257
174
207256
196180
183 255
Middle Cambrian tolate Proterozoicsedimentary rocks
_p_s
Upper and MiddleCambrian limestone
_mSubsidiary Faults
Inferred Detachment Fault
Inferred Fault
Normal Fault
Geology
Middle and Lower Ordovician,mostly eureka Quartzite and Pogonip Goup
Ol
Quaternary-TertiaryAlluvium
QTa
Regional Faultâ â Concealed Normal
Fault
LegendSNWA Test well*
!. SNWA Monitor well
Section 2.0
Southern Nevada Water Authority - Water Resources Division
2-6
Table 2-1Test Well SPR7005X Borehole and Well Statistics
LOCATION DATACoordinates N 4,330,506.86 m; E 710,356.78 m (UTM, Zone 11, NAD83)
Ground Elevation 6,397.56 ft amsl
DRILLING DATASpud Date 1/20/2008
Total Depth (TD) 1,395 ft bgs
Date TD Reached 3/30/2008
Date Well Completed 4/11/2008
Hole Diameter
48-in. from 0 to 54 ft bgs38-in. from 54 to 515 ft bgs28-in. from 515 to 1,368 ft bgs16-in. from 1,368 to 1,395 ft bgs
Drilling TechniquesAuger from 0 to 54 ft bgsConventional Mud Rotary and Flooded Mud Reverse Circulation from 54 to 1,395 ft bgs
Drilling Fluid Materials Used
Gel = (1,900) 50-lb bagsSoda Ash = (239) 50-lb bagsN-Seal = (337) 30-lb bagsEZ-MUD = (67) 5-galBaroSeal = (76) 40-lb sacksSaw Dust = Quantity Unknown Cedar Fiber = Quantity Unknown
Drilling Paper = (172) 40-lb bagsFiber Seal = (49) 25-lb bagsEZ-MUD GOLD = (20) 40-lb bucketsCedar Wood Chips = Quantity Unknown Cellophane (Flake) = (50) 25-lb bagsEZ-Plug = (0.25) 40-lb bags
Drilling Fluid Properties
Viscosity Range = 27 to 47 sec/qtWeight Range = 8.4 to 9.2 lbs/galFiltrate Range = 7.5 to <25 mlFilter Cake Range = 1/64 to 2/32 in.
CASING DATA 40-in. MS Conductor Casing from 0 to 54 ft bgs32-in. MS Intermediate Casing from 0 to 511.39 ft bgs20-in. HSLA Completion Casing from +2.78 to 1,350.47 ft bgs
WELL COMPLETION DATA 671.18 ft of blank 20-in. HSLA casing from +2.78 to 668.84 ft bgs661.63 ft of 20-in HSLA Ful-Flo louver screen from 668.84 to 1,330.47 ft bgs20.0 ft blank and 20-in sump and bullnose casing from 1,330.47 to 1,350.47 ft bgs
Cement, Plug and Gravel Pack Depth0 to 54 ft on outside of conductor casing (cement)0 to 511 ft on outside of intermediate casing (cement)511 to 515 ft on outside of intermediate casing (sand)0 to 496 ft on outside of completion casing (cement)496 to 509 ft on outside of completion casing (sand plug)509 to 1,350 ft from bottom of sand plug to bottom of completion casing (3/8-in. gravel pack)1,350 to 1,395 ft from bottom of gravel pack to TD (fill)
WATER LEVEL Static Water Level: 496.71 ft bgs (3/23/2011) Groundwater Elevation: 5,900.85 ft amsl (3/23/2011)
DRILLING CONTRACTOR WDC
GEOPHYSICAL LOGS BY Pacific Surveys, LLC (Claremont, CA)/Schlumberger
OVERSIGHT S.M. Stoller Corporation

Hydrologic Data Analysis Report for Test Well SPR7005X in Spring Valley
Section 2.0 2-7
Note: Not to scale
Figure 2-3Test Well SPR7005X Construction Schematic
Hydrologic Data Analysis Report for Test Well SPR7005X in Spring Valley
Section 2.0 2-8
Source: Mace and Muller (2010)
Figure 2-4Borehole Stratigraphic Column of Test Well SPR7005X

Hydrologic Data Analysis Report for Test Well SPR7005X in Spring Valley
Section 2.0 2-9
Note: Not to scale
Figure 2-5Monitor Well SPR7005M Construction Schematic

Section 2.0
Southern Nevada Water Authority - Water Resources Division
2-10
Table 2-2Monitor Well SPR7005M Borehole and Well Statistics
LOCATION DATACoordinates N 4,330,471.51 m; E 710,372.44 m (UTM, Zone 11, NAD83)
Ground Elevation 6,395.68 ft amsl
DRILLING DATASpud Date 6/7/2007
Total Depth (TD) 1,412 ft bgs
Date TD Reached 6/26/2007
Date Well Completed 7/10/2007
Hole Diameter
28-in. from 0 to 105 ft bgs17-in. from 105 to 118 ft bgs16-in. from 118 to 1,412 ft bgs
Drilling TechniquesConventional Circulation from 0 to 118 ft bgsFlooded Reverse Circulation from 118 to 1,412 ft bgs
Drilling Fluid Materials Used
Gel = (188) 50-lb bagsSoda Ash = (27) 50-lb bagsN-Seal = (32) 30-lb bagsEZ-Mud = (15) 5-galBaroSeal = (15) 40-lb sacksWood Chips = Quantity Unknown Wood Shavings = Quantity Unknown
Drilling Paper = (23) 40-lb bagsDrisPac = (4) 50-lb sacksEZ-Mud GOLD = (69) 40-lb bucketsQuick Trol = (5) 40-lb bucketsCellophane (Flake) = (56) 25-lb bagsEZ-Plug = (11) 40-lb bagsMud (1909) = 50-lb sacks
Drilling Fluid Properties
Viscosity Range = 27 to 625 sec/qtWeight Range = 8.5 to 9.3 lbs/galFiltrate Range = 3 to 50 mlFilter Cake Range = 1/32 to 3/32 in.
CASING DATA 20-in. MS Conductor Casing from 0 to 105 ft bgs8.625-in. MS Completion Casing from +2.8 to 1,403.8 ft bgs
WELL COMPLETION DATA 666.1 ft of blank MS 8-in. casing from +2.8 to 663.3 ft bgs720 ft of 8.625-in. slotted screen from 663.3 to 1,383.3 ft bgs20.0 ft blank 8.625-in. sump MS casing from 1,383.3 to 1,403.3 ft bgs0.5 ft MS Bullnose from 1,403.3 to 1,403.8 ft bgs
Cement, Plug and Gravel Pack Depth0 to 105 ft on outside of conductor casing (cement)0 to 439 ft on outside of completion casing (cement)439 to 452 ft on outside of completion casing (sand plug)452 to 1,406 ft from bottom of sand plug to top of fill (3/8-in. gravel pack)1,406 to 1,412 ft from bottom of gravel pack to TD (fill)
WATER LEVEL Static Water Level: 494.86 ft bgs (3/23/2011)Groundwater Elevation: 5,900.82 ft amsl (3/23/2011)
DRILLING CONTRACTOR WDC
GEOPHYSICAL LOGS BY Pacific Surveys (Claremont, CA)
OVERSIGHT SNWA
Hydrologic Data Analysis Report for Test Well SPR7005X in Spring Valley
Section 2.0 2-11
Source: Mace and Muller (2010)
Figure 2-6Borehole Stratigraphic Column of Test Well SPR7005M

Hydrologic Data Analysis Report for Test Well SPR7005X in Spring Valley
Section 2.0 2-12
completed in the unconfined, fractured carbonate-aquifer system at a depth of 1,140 ft bgs with an open borehole interval of 79 to1,160 ft bgs. Other basin fill wells were monitored in conjunction with this test. Since they are not completed in the carbonate-rock aquifer, well 184W506M was selected as the representative background monitor well.
2.2.3 Well Survey and Water-Level Data
A professional survey of the wells utilized in the testing program was performed to determine the location and elevation of the measuring points and ground-surface elevations. Results of the survey of the wells are presented in Table 2-3.
Depth-to-groundwater measurements were obtained, relative to the marked reference point, at the testing program well locations. Static levels prior to the 120-hour constant-rate test were measured at 494.59 and 492.52 ft bgs for Test Well SPR7005X, and Monitor Well SPR7005M, respectively. The distance of the temporary measuring points above land surface used for these two wells during testing is 3.11 and 2.80 ft, respectively. The temporary reference measuring point for the Test Well SPR7005X was the top of the transducer access tube associated with the turbine-pump vertical-shaft well-head assembly. The distance above ground surface of the permanent measuring points are 2.78 and 2.80 ft, respectively.
Static groundwater-elevation data were collected on a continuous basis at background well 184W506M, which was used as a background well during the testing program, with an In-Situ LevelTROLL pressure transducer from preceding the test to the July 15, 2009, when a new Design Analysis pressure transducer was installed. Continuous data is available at this site to the present. Periodic, manual measurements are collected regularly at Monitor Well 184W506M at least quarterly as part of the long-term monitoring program. Background well 184W506M static groundwater elevation is approximately 5,796 to 5,699 ft amsl, which corresponds to a depth of water of approximately 218 to 215 ft bgs, respectively.
Static groundwater-elevation data have been collected on a six-week basis at Monitor Well SPR7005M from December 18, 2007, to the present. Continuous groundwater-elevation data has been collected at this well beginning before development and testing at well SPR7005X using an In-Situ LevelTROLL. On July 13, 2009, the In-Situ equipment was removed in preparation of
Table 2-3Well Survey Data and Measuring Point Information
Well IDWell Use During
Testing
Locationa
Temporary MPb
(ft amsl)
Permanent MPb
(ft amsl)
Ground Surface
Elevationb (ft amsl)
UTM Northing (m)
UTM Easting (m)
SPR7005X Test Well 4,330,506.86 710,356.78 6,400.67 6,400.34 6,397.56
SPR7005M Observation Well 4,330,471.51 710,372.44 -- 6,398.48 6,395.68
184W506M Background Well 4,306,214.21 713,939.81 -- 6,016.44 6,014.04
aCoordinates are Universal Transverse Mercator, North American Datum of 1983, Zone 11bElevations are North American Vertical Datum of 1988 MP = Measuring Point
Section 2.0
Southern Nevada Water Authority - Water Resources Division
2-13
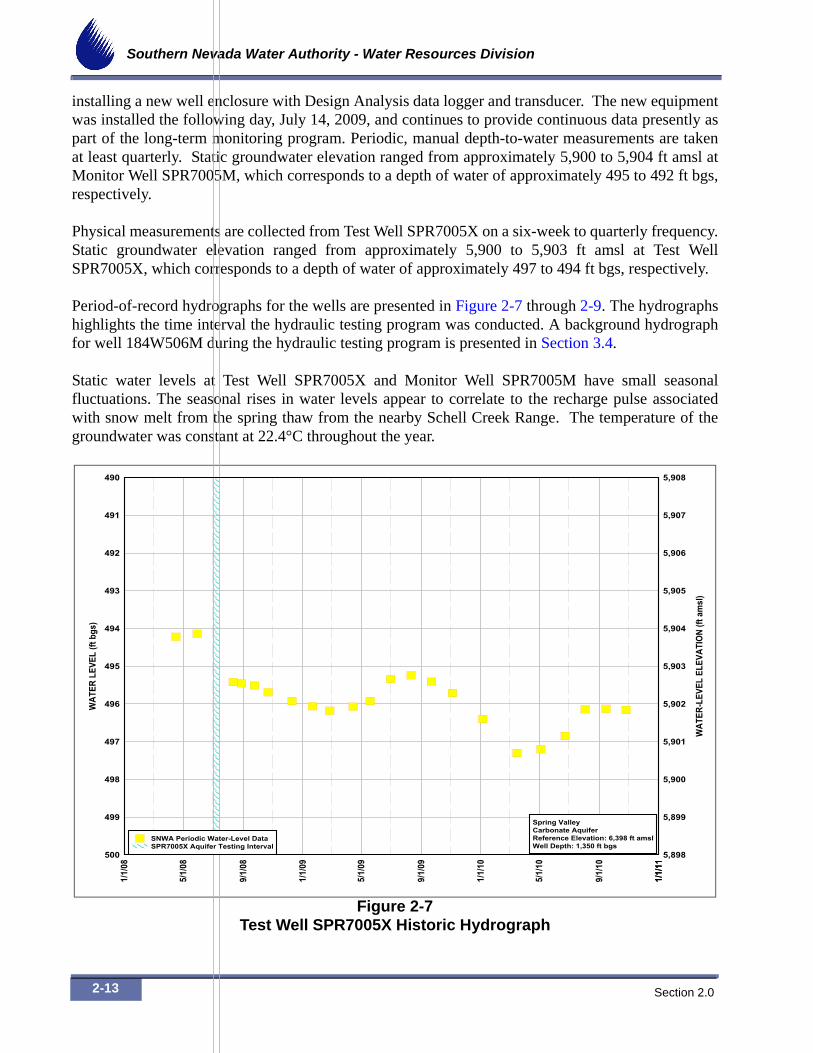
installing a new well enclosure with Design Analysis data logger and transducer. The new equipment was installed the following day, July 14, 2009, and continues to provide continuous data presently as part of the long-term monitoring program. Periodic, manual depth-to-water measurements are taken at least quarterly. Static groundwater elevation ranged from approximately 5,900 to 5,904 ft amsl at Monitor Well SPR7005M, which corresponds to a depth of water of approximately 495 to 492 ft bgs, respectively.
Physical measurements are collected from Test Well SPR7005X on a six-week to quarterly frequency. Static groundwater elevation ranged from approximately 5,900 to 5,903 ft amsl at Test Well SPR7005X, which corresponds to a depth of water of approximately 497 to 494 ft bgs, respectively.
Period-of-record hydrographs for the wells are presented in Figure 2-7 through 2-9. The hydrographs highlights the time interval the hydraulic testing program was conducted. A background hydrograph for well 184W506M during the hydraulic testing program is presented in Section 3.4.
Static water levels at Test Well SPR7005X and Monitor Well SPR7005M have small seasonal fluctuations. The seasonal rises in water levels appear to correlate to the recharge pulse associated with snow melt from the spring thaw from the nearby Schell Creek Range. The temperature of the groundwater was constant at 22.4°C throughout the year.
Figure 2-7Test Well SPR7005X Historic Hydrograph
WAT
ER L
EVEL
(ft b
gs)
WAT
ER-L
EVEL
ELE
VATI
ON (f
t am
sl)
1/1/
08
5/1/
08
9/1/
08
1/1/
09
5/1/
09
9/1/
09
1/1/
10
5/1/
10
9/1/
10
1/1/
111/
1/11
500 5,898
499 5,899
498 5,900
497 5,901
496 5,902
495 5,903
494 5,904
493 5,905
492 5,906
491 5,907
490 5,908
Spring ValleyCarbonate AquiferReference Elevation: 6,398 ft amslWell Depth: 1,350 ft bgs
SNWA Periodic Water-Level DataSPR7005X Aquifer Testing Interval

Hydrologic Data Analysis Report for Test Well SPR7005X in Spring Valley
Section 2.0 2-14
*Data processed using a temperature specific conversion factor
Figure 2-8 Historical Hydrograph for Monitor Well SPR7005M
*Data processed using a temperature specific conversion factor
Figure 2-9Historical Hydrograph for Background Well 184W506M
WAT
ER L
EVEL
(ft b
gs)
WAT
ER-L
EVEL
ELE
VATI
ON (f
t am
sl)
1/1/08
5/1/08
9/1/08
1/1/09
5/1/09
9/1/09
1/1/10
5/1/10
9/1/10
1/1/11
1/1/11
500 5,896
499 5,897
498 5,898
497 5,899
496 5,900
495 5,901
494 5,902
493 5,903
492 5,904
491 5,905
490 5,906
Transducer Failed
Spring ValleyCarbonate AquiferReference Elevation: 6,396 ft amslWell Depth: 1,404 ft bgs
SNWA Continuous Water-Level Data*SNWA Periodic Water-Level DataSPR7005X Aquifer Testing Interval
WAT
ER L
EVEL
(ft b
gs)
WAT
ER-L
EVEL
ELE
VATI
ON (f
t am
sl)
1/1/08
5/1/08
9/1/08
1/1/09
5/1/09
9/1/09
1/1/10
5/1/10
9/1/10
1/1/11
1/1/11
220 5,794
219 5,795
218 5,796
217 5,797
216 5,798
215 5,799
214 5,800
213 5,801
212 5,802
211 5,803
210 5,804
Spring ValleyCarbonate AquiferReference Elevation: 6,014 ft amslWell Depth: 1,140 ft bgs
SNWA Continuous Water-Level Data*SNWA Periodic Water-Level DataSPR7005X Aquifer Testing Interval

Section 2.0
Southern Nevada Water Authority - Water Resources Division
2-15
This Page Left Intentionally Blank
Hydrologic Data Analysis Report for Test Well SPR7005X in Spring Valley
Section 3.0 3-1
3.0 TEST DESCRIPTION AND BACKGROUND DATA
This section describes the activities, pump equipment, and monitoring instrumentation associated with development and hydraulic testing of Test Well SPR7005X. Background hydrologic data and regional trends associated with the testing program are also presented and evaluated in this section.
3.1 Site Activities
The following summarizes the development and testing activities performed in 2008 at the well site:
April 5 to 10: Developed the test well using airlift and dual swab techniques.
June 27 to 30: Final well development, using surge and pump methods. The well was developed at rates ranging from 800 to 3,800 gpm.
July 1: Performed a five-interval step-drawdown tests at rates ranging from 2,000 to 3,800 gpm.
July 7 to 13: Performed a 120-hour constant-rate test at 3,000 gpm and subsequent water-level recovery measurements.
July 10: Collected groundwater samples for laboratory chemical analysis. Groundwater chemistry samples were collected from well Test Well SPR7005X at 8:30 a.m. during performance of the constant-rate test. A total of 18,101,195 gal of water had been extracted from the well (including pumping during well development, step test, and the constant-rate test) at the time of sampling.
3.2 Test Equipment and Site Layout
A Goulds Company vertical line shaft turbine pump was used in Test Well SPR7005X. The intake was set at approximately 700 ft bgs. The transducer was set at approximately 660 ft below the measuring point during development and step test. A pump discharge-line check valve was not used during the test to allow more effective development activities.
3.3 Discharge Information
Pumped water was discharged through approximately 1,000 ft of 12 in. diameter discharge line downgradient and to the east-southeast into a wash. A total of 28,517,200 gal of water were pumped during the program. This consists of pumpage totals of 21,763,300 during the 120-hour constant-rate test, 1,410,900 gal during the step test, and 5,343,000 gal during pumping development.
Section 3.0
Southern Nevada Water Authority - Water Resources Division
3-2
3.4 Instrumentation and Background Data
Regional and site background water levels were continuously monitored prior to, during, and after the test period at Test Well SPR7005X and Monitor Well SPR7005M. Water levels were measured and recorded continuously at Test Well SPR7005X and Monitor Well SPR7005M with In-Situ equipment. Hermit 3000 data loggers recorded the data from the PXD-261 100 and 50 psi pressure transducers set in the test and monitor wells, respectively.
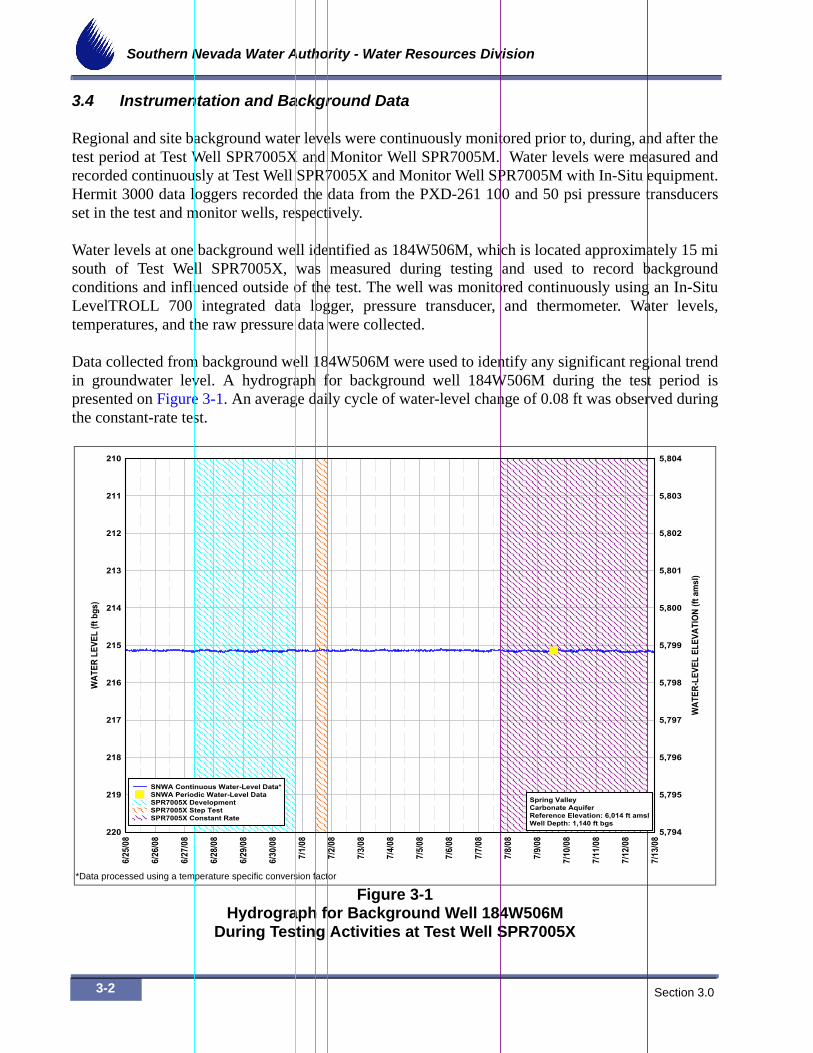
Water levels at one background well identified as 184W506M, which is located approximately 15 mi south of Test Well SPR7005X, was measured during testing and used to record background conditions and influenced outside of the test. The well was monitored continuously using an In-Situ LevelTROLL 700 integrated data logger, pressure transducer, and thermometer. Water levels, temperatures, and the raw pressure data were collected.
Data collected from background well 184W506M were used to identify any significant regional trend in groundwater level. A hydrograph for background well 184W506M during the test period is presented on Figure 3-1. An average daily cycle of water-level change of 0.08 ft was observed during the constant-rate test.
*Data processed using a temperature specific conversion factor
Figure 3-1Hydrograph for Background Well 184W506M
During Testing Activities at Test Well SPR7005X
WAT
ER L
EVEL
(ft b
gs)
WAT
ER-L
EVEL
ELE
VATI
ON (f
t am
sl)
6/25
/08
6/26
/08
6/27
/08
6/28
/08
6/29
/08
6/30
/08
7/1/
08
7/2/
08
7/3/
08
7/4/
08
7/5/
08
7/6/
08
7/7/
08
7/8/
08
7/9/
08
7/10
/08
7/11
/08
7/12
/08
7/13
/08
220 5,794
219 5,795
218 5,796
217 5,797
216 5,798
215 5,799
214 5,800
213 5,801
212 5,802
211 5,803
210 5,804
Spring ValleyCarbonate AquiferReference Elevation: 6,014 ft amslWell Depth: 1,140 ft bgs
SNWA Continuous Water-Level Data*SNWA Periodic Water-Level DataSPR7005X DevelopmentSPR7005X Step TestSPR7005X Constant Rate

Hydrologic Data Analysis Report for Test Well SPR7005X in Spring Valley
Section 3.0 3-3
Barometric pressure was recorded at the test well and at ET Station SV2b located approximately 19.3 mi north of the test well. Figure 3-2 presents a plot of barometric pressure variation data and groundwater level measurements in Monitor Well SPR7005M collected during the constant-rate aquifer test of Test Well SPR7005X. No other influences, such as existence of other pumping wells in the vicinity of Test Well SPR7005X, were identified. The barometric-pressure record, recorded at Test Well SPR7005X and ET station SV2b, covers the time period during the constant-rate test. During the record period, the largest barometric pressure fluctuation of was approximately 0.27 in. Hg. This equates to 0.30 ft water based on 100 percent barometric efficiency of the well. Analysis of the barometric efficiency of this well indicates a barometric efficiency of approximately 40 percent. This equates to 0.12 ft of water. Both of these numbers are insignificant in relation to drawdown in both the test and monitor wells.
Manual water level and flow measurements were collected at wells using a Heron electronic water-level indicator probes at prescribed intervals and in accordance at accordance with SNWA Water Resources Division Field Operating Procedure for Well Development and Aquifer Testing(SNWA, 2007). Field groundwater-quality samples were collected and analyzed on site regularly for pH, conductivity, temperature, and turbidity throughout the testing period. Program test data are presented in data files on the CD-ROM that accompanies this report.
Figure 3-2Local Barometric-Pressure Variation and
Groundwater-Level Measurements at Monitor Well SPR7005M
TIME (min)
BARO
MET
RIC
PRES
SURE
(In.
Hg)
DRAW
DOW
N (ft
)0 500 1,000 1,500 2,000 2,500 3,000 3,500 4,000 4,500 5,000 5,500 6,000 6,500 7,000 7,500
29.0 0.00
29.1 0.25
29.2 0.50
29.3 0.75
29.4 1.00
29.5 1.25
29.6 1.50
29.7 1.75
29.8 2.00
29.9 2.25
30.0 2.50
30.1 2.75
30.2 3.00
30.3 3.25
30.4 3.50
30.5 3.75
30.6 4.00
30.7 4.25
30.8 4.50
30.9 4.75
31.0 5.00
Data Logger Malfunction. Replaced Data Logger and XDR
Barometric-Pressure Data (SV2b)Well SPR7005M Drawdown

Section 3.0
Southern Nevada Water Authority - Water Resources Division
3-4
Transducer data at the test and monitor wells were compared to manual data collected throughout the test period. Evaluation of the data sets indicated no significant variations, with the exception of some turbulence and vibration in the test well during pumping. Data from the test well constant-rate record was extracted logarithmically, due to the large number of data points, in order to facilitate the data processing and analysis. Manually collected data at the test well was used to check the transducer test well record.
The respective borehole deviations for Test Well SPR7005X and Monitor Well SPR7005M are presented in the geophysical logs in the Closure Distance plots provided in the Geologic Data Analysis Report (Mace and Muller, 2010). Evaluation of borehole deviation and depth to groundwater indicated negligible influence on depth-to-water measurement results.

Hydrologic Data Analysis Report for Test Well SPR7005X in Spring Valley
Section 4.0 4-1
4.0 WELL HYDRAULICS AND PERFORMANCE TESTING
This section presents development results and analysis of the step-drawdown well performance testing.
4.1 Development
Prior to this phase of development, Test Well SPR7005X was initially developed after drilling using a dual-swab technique. A dual swab was used prior to and after placement of the gravel pack. A polymer dispersant, AQUA-CLEAR PFD, was added to the well to break up residual drilling mud, and a final swab was performed the length of the screen.
Test Well SPR7005X was then developed using a surging and pumping technique. The well was pumped at a constant rate for a short period of time (usually under an hour) until turbidity data reached a certain low threshold and then surged repeatedly. Water-level and field groundwater- quality data were collected during the pumping period. Specific capacity (discharge [Q] in gpm/drawdown[s] in ft) was determined during and at the end of each pumping period to evaluate development effectiveness and the need for additional development.
4.1.1 Development Results
A total of 5,343,000 gal of water was pumped during this phase of development. Due to issues with fuel supply to the pump motor, development had to be stopped, then restarted the next day. Prior to shutdown, the well was developed at a previously used lower pumping rate to quantify developmental effectiveness for this initial well development. Development was then continued the following day for an additional 12 hours. Initial development resulted in improvement of approximately 6.4 percent in specific capacity (at a rate of 2,300 gpm). Secondary development resulted in improvement of approximately 4.1 percent in specific capacity (at a rate of 2,500 gpm).
4.2 Step-Drawdown Test
A step-drawdown test was performed using five different pumping rates ranging from 2,000 to 3,800 gpm. The pumping periods ranged from 90 to 120 min in duration during which the pumping rate was held constant. Pumping rates were increased in each subsequent pumping period. Figure 4-1 presents a graph showing plots of the drawdown versus time for each pumping interval during the step test.

Section 4.0
Southern Nevada Water Authority - Water Resources Division
4-2
4.2.1 Well Performance and Specific Capacity
Well specific capacity is a measure of the well’s productivity and efficiency. Specific capacity generally decreases with pumping duration and increased discharge rate. Graphs of drawdown versus discharge rate and specific capacity versus discharge rate are presented on Figure 4-2 and Figure 4-3, respectively.
Results from the step-drawdown test indicate specific capacity values ranging from 68.3 to 123.6 gpm/ft for associated short term pumping rates of 3,800 to 2,000 gpm, respectively. Specific capacity during the last 12 hours of the 120-hour constant-rate test ranged from 74.9 to 75.4 gpm/ft of drawdown at 3,000 gpm.
4.2.2 Well Loss Analysis
The drawdown observed in a pumping well is the effect of aquifer and well losses. The aquifer loss is the theoretical drawdown expected at the pumping well in a perfectly efficient well where flow is laminar. The well loss is the additional drawdown observed in the pumping well caused by turbulent flow and frictional head loss effects in or adjacent to the well. Loss components are also classified as linear and nonlinear. Linear well losses are usually caused by damage to the formation during drilling,
Figure 4-1Linear Plot of Drawdown for Each Pumping Interval
During Step-Drawdown Testing of Test Well SPR7005X
TIME (min)
DR
AW
DO
WN
(ft)
0 50 100 150 200 250 300 350 400 450 50060
55
50
45
40
35
30
25
20
15
10
5
0
Equipment Malfunction. Pump Shutdown for 2.25 hrs.2,000 gpm
2,500 gpm
3,000 gpm
3,500 gpm
3,800 gpm
Static Water Level: 494.70 ft bgs

Hydrologic Data Analysis Report for Test Well SPR7005X in Spring Valley
Section 4.0 4-3
Figure 4-2Linear Plot of Step-Test Drawdown and Pumping Depth-to-Water Level
for Various Discharge Rates for Test Well SPR7005X
Figure 4-3Step-Drawdown Test Specific Capacity Versus
Discharge Rate for Test Well SPR7005X
DISCHARGE (gpm)
DR
AW
DO
WN
(ft)
APP
RO
XIM
ATE
PU
MPI
NG
WA
TER
LEV
EL (f
t bgs
)
1,500 2,000 2,500 3,000 3,500 4,000 4,50070 564.70
65 559.70
60 554.70
55 549.70
50 544.70
45 539.70
40 534.70
35 529.70
30 524.70
25 519.70
20 514.70
15 509.70
10 504.70
5 499.70
0 494.70
Static Water Level: 494.70 ft bgs
DISCHARGE (gpm)
SPEC
IFIC
CAP
ACIT
Y (g
pm/ft
)
1,500 2,000 2,500 3,000 3,500 4,000 4,50060
65
70
75
80
85
90
95
100
105
110
115
120
125
130
Static Water Level: 494.70 ft bgs
Section 4.0
Southern Nevada Water Authority - Water Resources Division
4-4
residual drilling fluids not removed during well development, or head losses as groundwater flows through the gravel pack and screen. Nonlinear head losses are caused by turbulent flow occurring inside the well screen, pump column, and the zone adjacent to the well. Higher well losses caused by the formation are expected to be more pronounced in a fractured bedrock aquifer due to turbulence occurring within the fractures, as is present at Test Well SPR7005X.
Determination of well loss allows the calculation of drawdown and specific capacity expected in the pumping well at various discharge rates. Evaluation of well loss also includes the evaluation of turbulent flow with increased pumping rate. Generally, specific capacity decreases to some degree at higher pumping rates because of an increase of turbulent flow at the well and a decrease in saturated thickness at the borehole wall under unconfined conditions. The evaluation of well losses allows for better projection of the optimal pumping rate and estimation of actual drawdown in the aquifer near the well, removed from the effects of losses caused by pumping and well inefficiencies, friction loss, and turbulent flow.
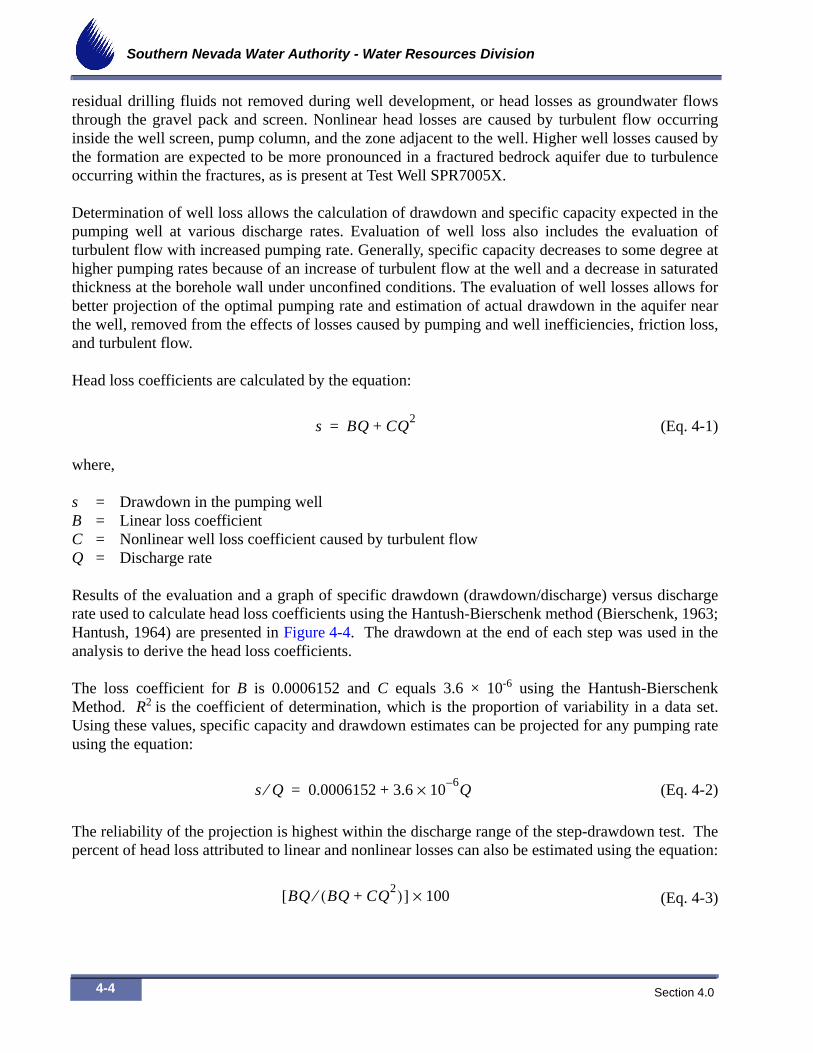
Head loss coefficients are calculated by the equation:
(Eq. 4-1)
where,
s = Drawdown in the pumping wellB = Linear loss coefficientC = Nonlinear well loss coefficient caused by turbulent flowQ = Discharge rate
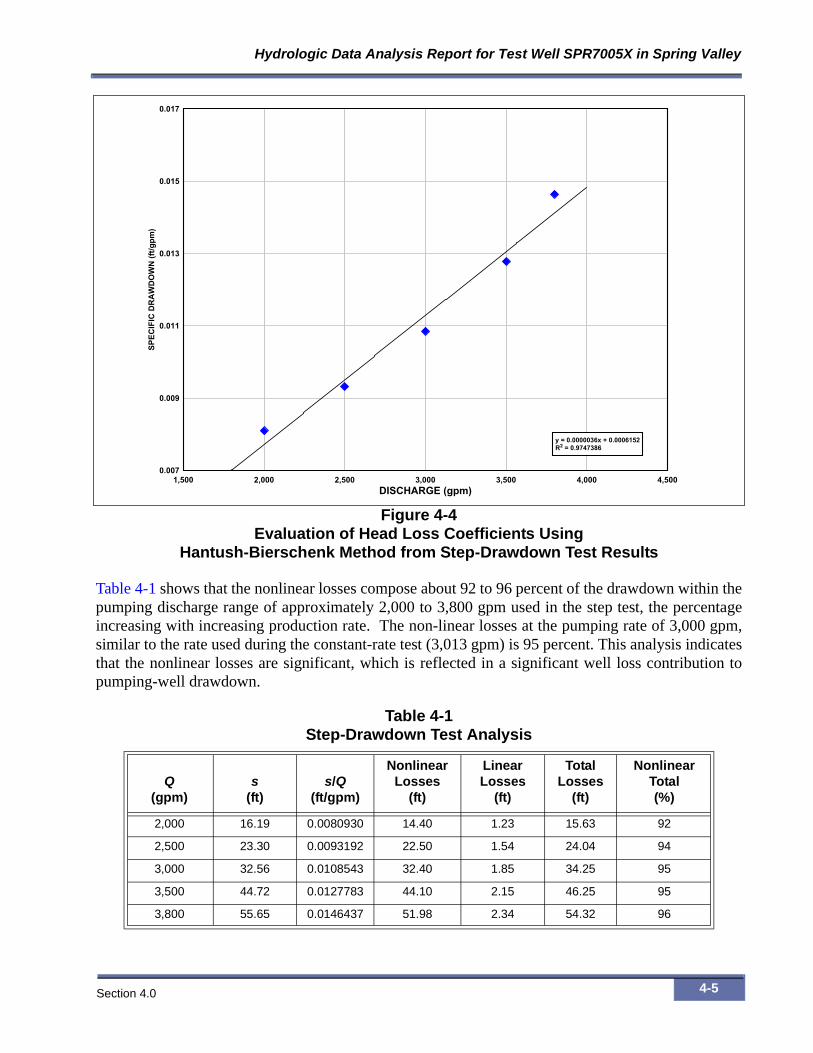
Results of the evaluation and a graph of specific drawdown (drawdown/discharge) versus discharge rate used to calculate head loss coefficients using the Hantush-Bierschenk method (Bierschenk, 1963; Hantush, 1964) are presented in Figure 4-4. The drawdown at the end of each step was used in the analysis to derive the head loss coefficients.
The loss coefficient for B is 0.0006152 and C equals 3.6 × 10⁻⁶ using the Hantush-Bierschenk Method. R2 is the coefficient of determination, which is the proportion of variability in a data set. Using these values, specific capacity and drawdown estimates can be projected for any pumping rate using the equation:
(Eq. 4-2)
The reliability of the projection is highest within the discharge range of the step-drawdown test. The percent of head loss attributed to linear and nonlinear losses can also be estimated using the equation:
(Eq. 4-3)
s BQ CQ2
+=
s Q⁄ 0.0006152 3.6 106–Q×+=
BQ BQ CQ2
+( )⁄[ ] 100×
Hydrologic Data Analysis Report for Test Well SPR7005X in Spring Valley
Section 4.0 4-5
Table 4-1 shows that the nonlinear losses compose about 92 to 96 percent of the drawdown within the pumping discharge range of approximately 2,000 to 3,800 gpm used in the step test, the percentage increasing with increasing production rate. The non-linear losses at the pumping rate of 3,000 gpm, similar to the rate used during the constant-rate test (3,013 gpm) is 95 percent. This analysis indicates that the nonlinear losses are significant, which is reflected in a significant well loss contribution to pumping-well drawdown.
Figure 4-4Evaluation of Head Loss Coefficients Using
Hantush-Bierschenk Method from Step-Drawdown Test Results
Table 4-1Step-Drawdown Test Analysis
Q(gpm)
s (ft)
s/Q (ft/gpm)
Nonlinear Losses
(ft)
Linear Losses
(ft)
Total Losses
(ft)
Nonlinear Total(%)
2,000 16.19 0.0080930 14.40 1.23 15.63 92
2,500 23.30 0.0093192 22.50 1.54 24.04 94
3,000 32.56 0.0108543 32.40 1.85 34.25 95
3,500 44.72 0.0127783 44.10 2.15 46.25 95
3,800 55.65 0.0146437 51.98 2.34 54.32 96
DISCHARGE (gpm)
SPEC
IFIC
DR
AW
DO
WN
(ft/g
pm)
1,500 2,000 2,500 3,000 3,500 4,000 4,5000.007
0.009
0.011
0.013
0.015
0.017
y = 0.0000036x + 0.0006152R2 = 0.9747386

Section 4.0
Southern Nevada Water Authority - Water Resources Division
4-6
This Page Left Intentionally Blank
Hydrologic Data Analysis Report for Test Well SPR7005X in Spring Valley
Section 5.0 5-1
5.0 CONSTANT-RATE TEST EVALUATION
This section summarizes the hydraulic testing data, analytical solution selection, and analysis results of the 120-hour constant-rate and recovery test at Test Well SPR7005X.
5.1 Data Review and Adjustments
Water-level data were collected with transducer and physical methods using the instrumentation described in Section 3.4. Data collection time intervals were logarithmic and in accordance with SNWA procedures and consistent with industry standards. The manual water-level measurements were used to confirm the transducer data. No significant variation between the two data sets was observed. Data from the test well constant-rate record was extracted logarithmically, due to the large number of data points, in order to facilitate the data processing and analysis.
Outside effects, such as changes in barometric pressure, regional water-level trends, and precipitation events, were monitored during the test period. No influences that would significantly affect the test results were identified. No other pumping wells were present in the area. A detailed discussion of background data and outside influences is presented in Section 3.4.
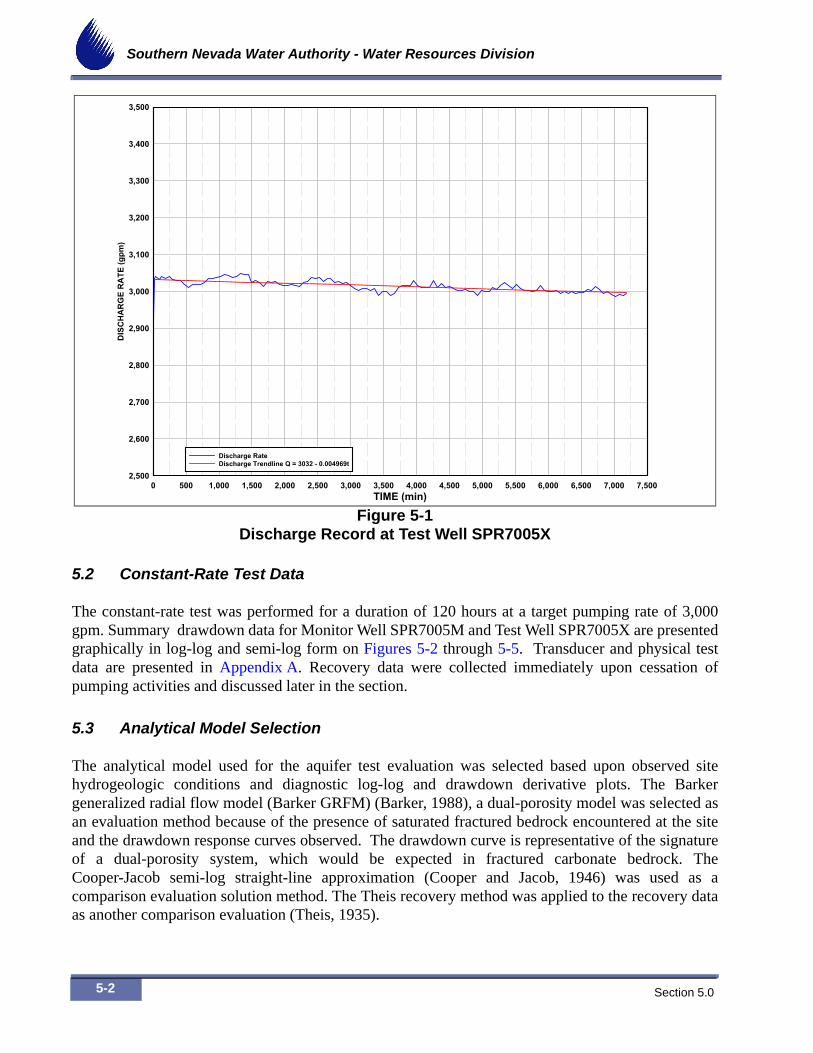
The target discharge rate for the constant-rate test was 3,000 gpm. The discharge rate was monitored using a magnetic flowmeter with continuous readout, and recorded every 30 seconds as presented in Figure 5-1. Totalizer readings indicated a total volume of 21,763,300 gal pumped during the 120-hour test, which averages 3,023 gpm for the duration of the test. The flow variations had no significant effect on the test analysis. For analytical purposes the production rate was represented by the average rate per day for each day, based on the magnetic flow meter record. The five rates, all approximately within 1 percent of the target pumping rate, were used for the constant-rate test analysis. These values are 3,032, 3,023, 3,013, 3,004, and 2,995 gpm for each of the 1,440 minute, five day periods.
Vertical flow losses within the well were considered during analysis. Upward flow within the well screen and casing to the pump intake is subject to friction losses that are a function of the screen and casing diameters, friction coefficient, and flow rate. Since the flow rate varies along the depth of the well screen because of distributed water intake along the screen, the losses vary with depth. Due to the large screen diameter, the friction losses within the well would have been relatively small compared to the drawdown imposed by testing.
Early-time recovery data after cessation of pumping was temporarily obscured due to the water in the pump column flowing back into the well. This creates a short-term injection pulse into the well that is superimposed on the test and monitor well recovery record. The pulse quickly reaches equilibrium and does not influence the analysis of the recovery data.
Section 5.0
Southern Nevada Water Authority - Water Resources Division
5-2
5.2 Constant-Rate Test Data
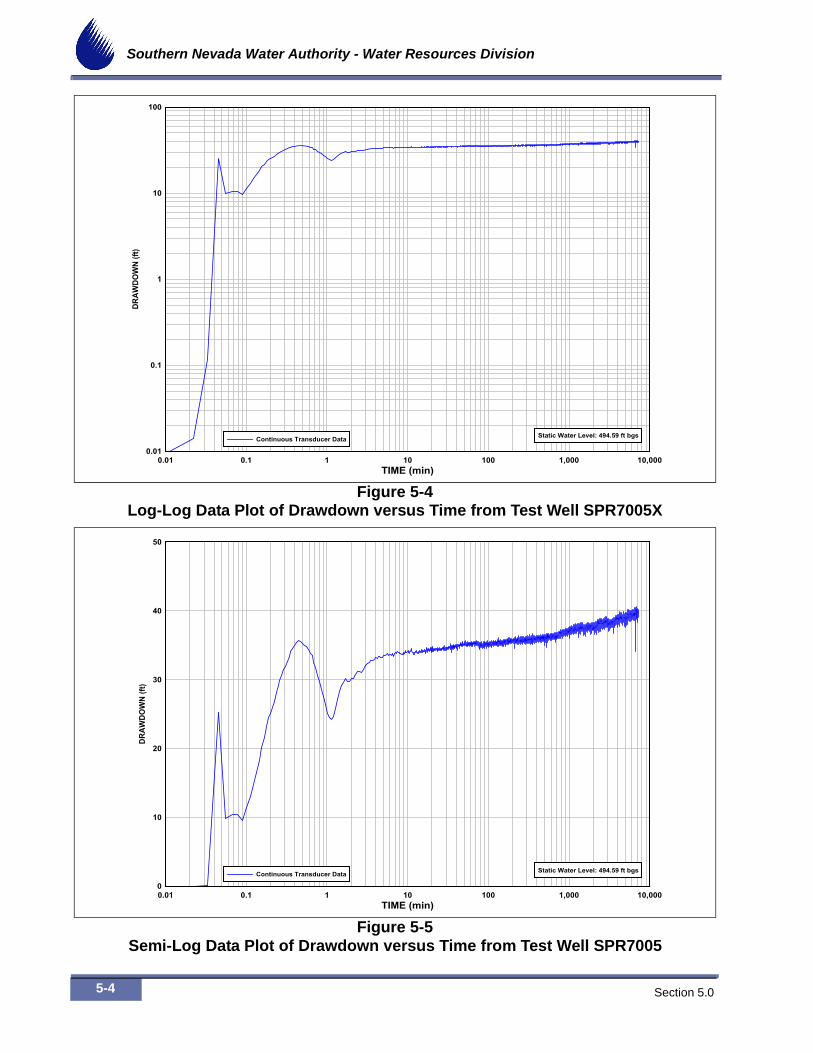
The constant-rate test was performed for a duration of 120 hours at a target pumping rate of 3,000 gpm. Summary drawdown data for Monitor Well SPR7005M and Test Well SPR7005X are presented graphically in log-log and semi-log form on Figures 5-2 through 5-5. Transducer and physical test data are presented in Appendix A. Recovery data were collected immediately upon cessation of pumping activities and discussed later in the section.
5.3 Analytical Model Selection
The analytical model used for the aquifer test evaluation was selected based upon observed site hydrogeologic conditions and diagnostic log-log and drawdown derivative plots. The Barker generalized radial flow model (Barker GRFM) (Barker, 1988), a dual-porosity model was selected as an evaluation method because of the presence of saturated fractured bedrock encountered at the site and the drawdown response curves observed. The drawdown curve is representative of the signature of a dual-porosity system, which would be expected in fractured carbonate bedrock. The Cooper-Jacob semi-log straight-line approximation (Cooper and Jacob, 1946) was used as a comparison evaluation solution method. The Theis recovery method was applied to the recovery data as another comparison evaluation (Theis, 1935).
Figure 5-1Discharge Record at Test Well SPR7005X
TIME (min)
DIS
CH
AR
GE
RA
TE (g
pm)
0 500 1,000 1,500 2,000 2,500 3,000 3,500 4,000 4,500 5,000 5,500 6,000 6,500 7,000 7,5002,500
2,600
2,700
2,800
2,900
3,000
3,100
3,200
3,300
3,400
3,500
Discharge RateDischarge Trendline Q = 3032 - 0.004969t

Hydrologic Data Analysis Report for Test Well SPR7005X in Spring Valley
Section 5.0 5-3
Figure 5-2Log-Log Data Plot of Drawdown versus Time from Monitor Well SPR7005M
Figure 5-3Semi-Log Data Plot of Drawdown versus Time from Monitor Well SPR7005M
TIME (min)
DRAW
DOW
N (ft
)
0.01 0.1 1 10 100 1,000 10,0000.01
0.1
1
10
Static Water Level: 492.52 ft bgsContinuous Transducer Data
TIME (min)
DRAW
DOW
N (ft
)
0.01 0.1 1 10 100 1,000 10,0000
1
2
3
4
5
Static Water Level: 492.52 ft bgs
Continuous Transducer Data
Section 5.0
Southern Nevada Water Authority - Water Resources Division
5-4
Figure 5-4Log-Log Data Plot of Drawdown versus Time from Test Well SPR7005X
Figure 5-5Semi-Log Data Plot of Drawdown versus Time from Test Well SPR7005
TIME (min)
DRAW
DOW
N (ft
)
0.01 0.1 1 10 100 1,000 10,0000.01
0.1
1
10
100
Static Water Level: 494.59 ft bgsContinuous Transducer Data
TIME (min)
DRAW
DOW
N (ft
)
0.01 0.1 1 10 100 1,000 10,0000
10
20
30
40
50
Static Water Level: 494.59 ft bgsContinuous Transducer Data
Hydrologic Data Analysis Report for Test Well SPR7005X in Spring Valley
Section 5.0 5-5
The Barker GRFM is a generalized radial flow model for an unsteady, confined, fractured media, dual-porosity conceptual system model. The solution utilizes a flow dimension term which characterizes flow conditions at the test site. Flow dimension (n) provides adjustment of the response for variation in the flow geometry, ranging from n = 1 for linear flow, to n = 2 for radial flow, to n = 3 for spherical flow. This analytical model is equivalent to the Moench (1984) fractured media, dual-porosity, radial flow model with flow dimension equal to 2. The flow dimension parameter has particular application to assist in the evaluation of situations in which a linear feature, such as a fault, may affect the drawdown response as occurs at this site. The flow dimension can also be used as an adjustment for partial penetration (shift to slightly spherical flow dimension) effects that cannot be estimated in advance.
An analytical model with these features that also incorporates specific aspects of unconfined aquifer response, such as delayed gravity drainage, is not available. A dual-porosity solution is more appropriate for the hydrogeologic conditions present at the site over an unconfined solution, such as the Neuman solution (Neuman, 1975), which considers only delayed response or gravity drainage of the formation. Given that the water table was located within fractured carbonate with low storage, the delayed gravity drainage effect would not be expected to be as substantial as dual-porosity effects.
General assumptions associated with the Barker GRFM solution are that:
• An aquifer has infinite extent and uniform extent of flow• Pumping and observation wells are fully penetrating• An aquifer is confined with single or dual porosity• Matrix blocks are slab shaped or spherical• Flow is unsteady
The complexities of the aquifer system do not fully conform to the assumptions of the analytical model. However, the Barker GRFM solution is the most appropriate of the analytical solutions available for the observed localized hydrogeologic conditions at this test location. While the assumptions related to aquifer and flow conditions are not perfectly satisfied, they are sufficiently satisfied to provide a reasonable estimate of localized aquifer parameters.
Cooper-Jacob semi-log straight-line approximation was used as a comparison evaluation solution method. This approach assumes radial flow conditions and was applied to late-time data. Cooper-Jacob analysis results would become more reliable with longer pumping durations and as conditions approach radial flow. As a result, the Cooper Jacob analysis results should be view with these limitations considered.
5.4 Constant-Rate and Recovery-Test Analysis
This section presents the aquifer test evaluation methodology, results, and analysis plots of the test drawdown and recovery data.
Section 5.0
Southern Nevada Water Authority - Water Resources Division
5-6
5.4.1 Test Analysis Methodology
The aquifer test analysis software AQTESOLV V4.50 (Duffield, 1996-2007) was used for curve fitting. The data logger records of pressure transducer output were used to create AQTESOLV input files of the drawdown and recovery data. The time representing the measurement at the start of identifiable drawdown at the test well was used as the start time to determine the elapsed time and drawdown magnitude. The Barker GRFM solution was fitted to the drawdown and recovery responses of both the test well and monitor well sequentially and iteratively to determine the model parameter set that would best fit all of the data. Well borehole skin as related to nonlinear flow losses at the test well distorting actual drawdown near the test well was also evaluated. Analysis was performed with a range of wellbore skin factors.
5.4.2 Test Analysis Results
The Barker GRFM solution was fitted to the data iteratively, applying constraints successively to refine the fit and produce an overall model that was consistent with all site and literature data and to determine the parameter range in which the solution is optimized. The model fit to all of the data and constraints is optimal within a relatively restricted range for the major parameters. The observation well response is best simulated with a flow dimension n=1, indicating linear flow and a very high local hydraulic conductivity. This suggests that the test well primarily produces via connection to highly anisotropic linear features associated with a fault to which the observation well is well connected.
Results from the downhole geophysics indicates extensive fractures and high fracture density between 1,050 and 1,370 ft bgs. Quartize was encountered at approximately 1,370 ft bgs with a low fracture density and is used as a base for the saturated thickness estimate. High non-linear well losses observed in the step drawdown test support limited highly fractured, very high hydraulic conductivity zones in the vicinity of the test well. The Barker GRFM solution quantifies the linear highly transmissive structural feature, that may or may not be laterally continuous, and does not accurately represent the aquifer properties of the carbonate rock aquifer as a whole.
The Cooper-Jacob (1946) method was also used a comparison solution. The Theis recovery method was used to evaluate the recovery data. Results using the Cooper-Jacob and Theis recovery methods must be used in context of the hydrogeologic conditions at the site. Test results indicate that a primary linear structural feature was controlling the response of the test and observation well. Radial flow conditions may not have been reached at the time of the test conclusion. The results will be verified in the future tests as aquifer response is observed after a longer pumping duration.
The basic input measurement and parameter values used for analysis are shown in Table 5-1.
Parameter symbols used in this section are presented below:
K = Aquifer/ fracture hydraulic conductivity (ft/day)K′ = Matrix hydraulic conductivity (ft/day)n = Flow dimension; 1 = linear, 2 = radial, and 3 = spherical (dimensionless)Q = Pumping discharge rate (gpm)
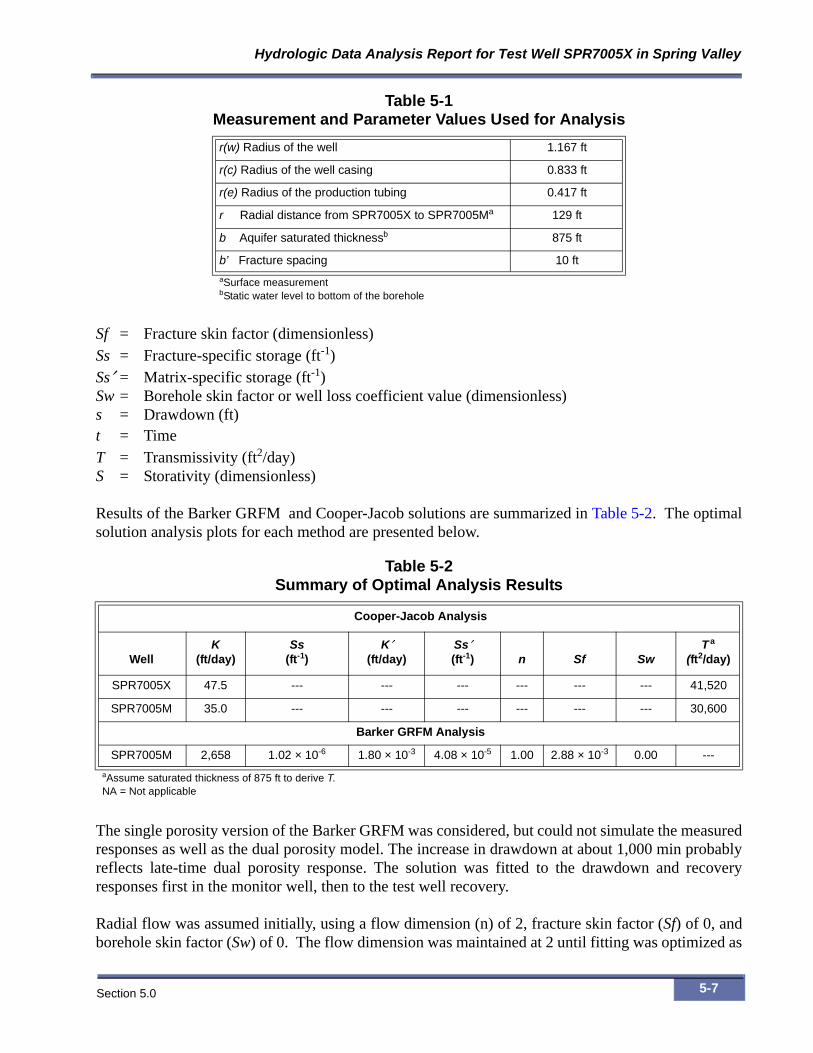
Hydrologic Data Analysis Report for Test Well SPR7005X in Spring Valley
Section 5.0 5-7
Sf = Fracture skin factor (dimensionless)Ss = Fracture-specific storage (ft-1)Ss′ = Matrix-specific storage (ft-1)Sw = Borehole skin factor or well loss coefficient value (dimensionless)s = Drawdown (ft)t = TimeT = Transmissivity (ft2/day)S = Storativity (dimensionless)
Results of the Barker GRFM and Cooper-Jacob solutions are summarized in Table 5-2. The optimal solution analysis plots for each method are presented below.
The single porosity version of the Barker GRFM was considered, but could not simulate the measured responses as well as the dual porosity model. The increase in drawdown at about 1,000 min probably reflects late-time dual porosity response. The solution was fitted to the drawdown and recovery responses first in the monitor well, then to the test well recovery.
Radial flow was assumed initially, using a flow dimension (n) of 2, fracture skin factor (Sf) of 0, and borehole skin factor (Sw) of 0. The flow dimension was maintained at 2 until fitting was optimized as
Table 5-1Measurement and Parameter Values Used for Analysis
r(w) Radius of the well 1.167 ft
r(c) Radius of the well casing 0.833 ft
r(e) Radius of the production tubing 0.417 ft
r Radial distance from SPR7005X to SPR7005Ma 129 ft
b Aquifer saturated thicknessb 875 ft
b’ Fracture spacing 10 ft
aSurface measurementbStatic water level to bottom of the borehole
Table 5-2Summary of Optimal Analysis Results
Cooper-Jacob Analysis
WellK
(ft/day)Ss
(ft-1)K′
(ft/day)Ss′(ft-1) n Sf Sw
T a
(ft2/day)
SPR7005X 47.5 --- --- --- --- --- --- 41,520
SPR7005M 35.0 --- --- --- --- --- --- 30,600
Barker GRFM Analysis
SPR7005M 2,658 1.02 × 10⁻⁶ 1.80 × 10⁻³ 4.08 × 10⁻⁵ 1.00 2.88 × 10⁻³ 0.00 ---
aAssume saturated thickness of 875 ft to derive T.NA = Not applicable
Section 5.0
Southern Nevada Water Authority - Water Resources Division
5-8
much as possible with the other parameters. The well bore skin factor was maintained at 0, due to the uncertainty of the multiple factors affecting the magnitude of the test well drawdown. The observation well response was best simulated with the flow dimension parameter set to 1. This indicates linear flow and a very high localized fracture hydraulic conductivity associated with the fault damage zone in which the test and monitor wells are completed.
Three primary parameters were evaluated in the analysis of fracture hydraulic conductivity (K). These parameters were (1) dewatering correction for drawdown, (2) fracture spacing, and (3) matrix-specific storage (Ss′ ). The correction for dewatering was considered, but not applied because the aquifer is unconfined, however drawdown in the vicinity of the well was not a significant fraction of the aquifer saturated thickness. Average fracture spacing of 10 ft is used in the analysis. Although 10 ft may not be the measurable value at this well, the type-curve match is sensitive to this parameter and a value of 10-15 ft provides an optimal match. The sensitivity of fracture spacing to hydraulic conductivity is low. Fracture spacing primarily interacts with K’ and Ss’ (matrix hydraulic properties). There is also no independent data for anisotropy of vertical/horizontal hydraulic conductivity.
Constraints on fracture-specific storage (Ss) for carbonates for Nevada are based on information from Kilroy (1992) (1.06 × 10⁻⁷ - 4.57 × 10⁻⁸ ft-1), Galloway and Rojstaczer (1989) (1.1 × 10⁻¹¹ ft-1), and Bredehoeft (1997) (9 × 10⁻¹⁰ ft-1). Matrix-specific storage in carbonates is several orders of magnitude larger that fracture-specific storage, so the overall storage (sum of fracture and matrix storage) is similar to the matrix storage. Specific storage can be equated to storativity (S) as the product of specific storage and aquifer thickness. SNWA has documented ranges of storativity for the lower and upper carbonate aquifers from 8.14 × 10⁻³ to 1.70 × 10⁻⁹. For the test well, with a nominal aquifer thickness of 875 ft, the Ss would be 9.3 × 10⁻⁶ to 1.9 × 10⁻¹² ft-1. This indicates that there is considerable latitude in Ss values. General information from Freeze and Cherry (1979) for carbonate compressibility for jointed rock can be used to calculate the theoretical Ss, which extends the upper range to about 3 × 10⁻⁵ ft -1. The Barker GRFM solution provides an approximate Ss value of 1.02 × 10⁻⁶ ft-1.
The Barker GRFM solution optimal aquifer hydraulic conductivity (K) in the vicinity of the test well is dominated by high K localized fractures. The hydraulic conductivity value was 2,658 ft/day using a fracture spacing of 10 ft. Matrix hydraulic conductivity (K′ ) was 1.80 × 10⁻³ ft/d. Fracture-specific storage was 1.02 × 10⁻⁶ ft-1. Matrix-specific storage of 4.08 × 10⁻⁵ ft-1 relates to an aquifer storativity (S) value of 0.036, assuming a saturated thickness of 875 ft. Increased estimated saturated thickness would equate to a theoretical proportional increase in aquifer storativity. The effective saturated thickness is influenced by variation in fracture density with depth.
The optimal Barker GRFM solution plot for Monitor Well SPR7005M and Test Well SPR7005X is presented in Figure 5-6. Derivative drawdown versus time plots are presented in Figure 5-7. The derivative drawdown response in the monitor well is consistent with a dual-porosity fractured bedrock system. The recovery analysis using Barker GRFM solution is presented in Figure Figure 5-8. This figure also presents a plot of residual drawdown versus log t/t’ (ratio of total pumping elapsed time to time since pumping stopped). In this plot, initial recovery is to the right and later recovery is to the left.

Hydrologic Data Analysis Report for Test Well SPR7005X in Spring Valley
Section 5.0 5-9
Figure 5-6Optimal Barker GRFM Solution Semi-Log Plot
Figure 5-7Optimal Barker GRFM Solution Derivative Drawdown Plot
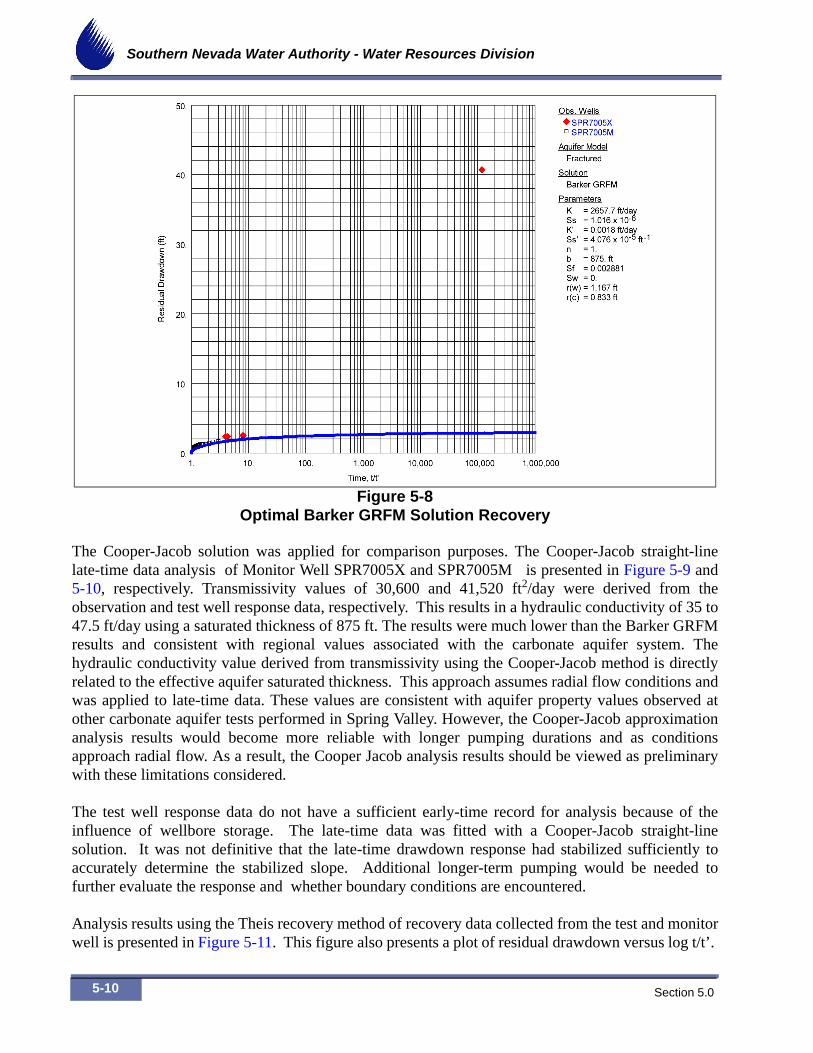
Section 5.0
Southern Nevada Water Authority - Water Resources Division
5-10
The Cooper-Jacob solution was applied for comparison purposes. The Cooper-Jacob straight-line late-time data analysis of Monitor Well SPR7005X and SPR7005M is presented in Figure 5-9 and 5-10, respectively. Transmissivity values of 30,600 and 41,520 ft2/day were derived from the observation and test well response data, respectively. This results in a hydraulic conductivity of 35 to 47.5 ft/day using a saturated thickness of 875 ft. The results were much lower than the Barker GRFM results and consistent with regional values associated with the carbonate aquifer system. The hydraulic conductivity value derived from transmissivity using the Cooper-Jacob method is directly related to the effective aquifer saturated thickness. This approach assumes radial flow conditions and was applied to late-time data. These values are consistent with aquifer property values observed at other carbonate aquifer tests performed in Spring Valley. However, the Cooper-Jacob approximation analysis results would become more reliable with longer pumping durations and as conditions approach radial flow. As a result, the Cooper Jacob analysis results should be viewed as preliminary with these limitations considered.
The test well response data do not have a sufficient early-time record for analysis because of the influence of wellbore storage. The late-time data was fitted with a Cooper-Jacob straight-line solution. It was not definitive that the late-time drawdown response had stabilized sufficiently to accurately determine the stabilized slope. Additional longer-term pumping would be needed to further evaluate the response and whether boundary conditions are encountered.
Analysis results using the Theis recovery method of recovery data collected from the test and monitor well is presented in Figure 5-11. This figure also presents a plot of residual drawdown versus log t/t’.
Figure 5-8Optimal Barker GRFM Solution Recovery
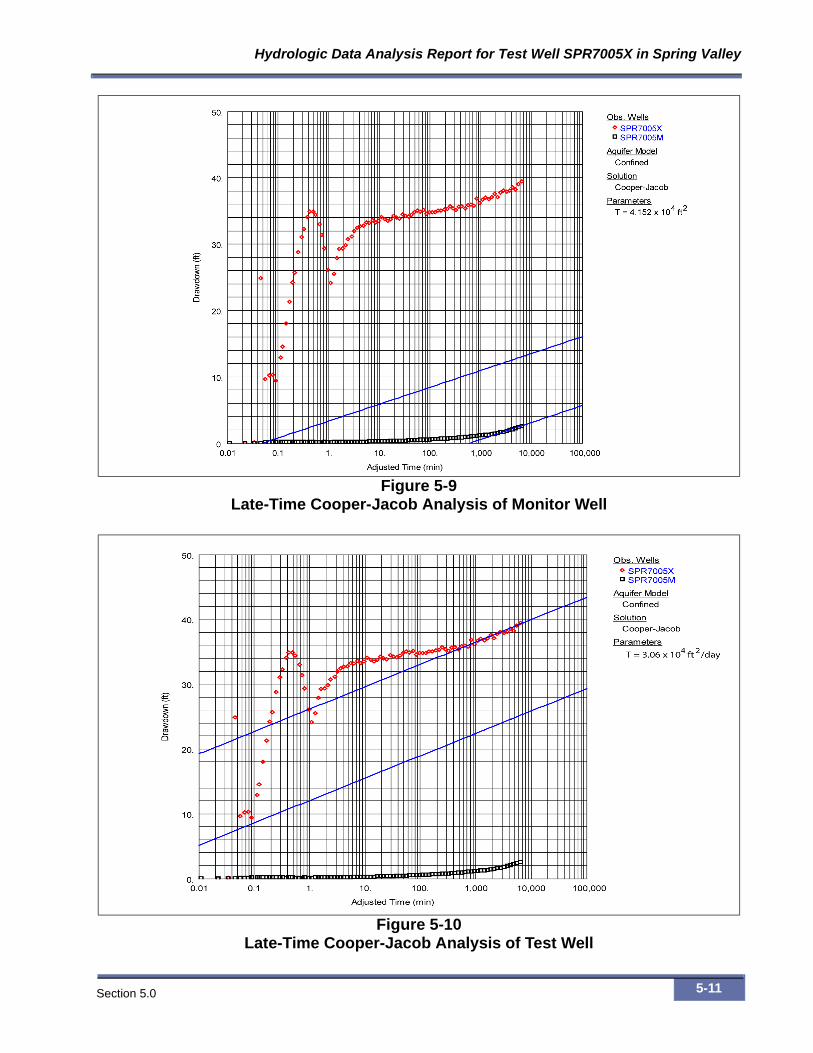
Hydrologic Data Analysis Report for Test Well SPR7005X in Spring Valley
Section 5.0 5-11
Figure 5-9Late-Time Cooper-Jacob Analysis of Monitor Well
Figure 5-10Late-Time Cooper-Jacob Analysis of Test Well
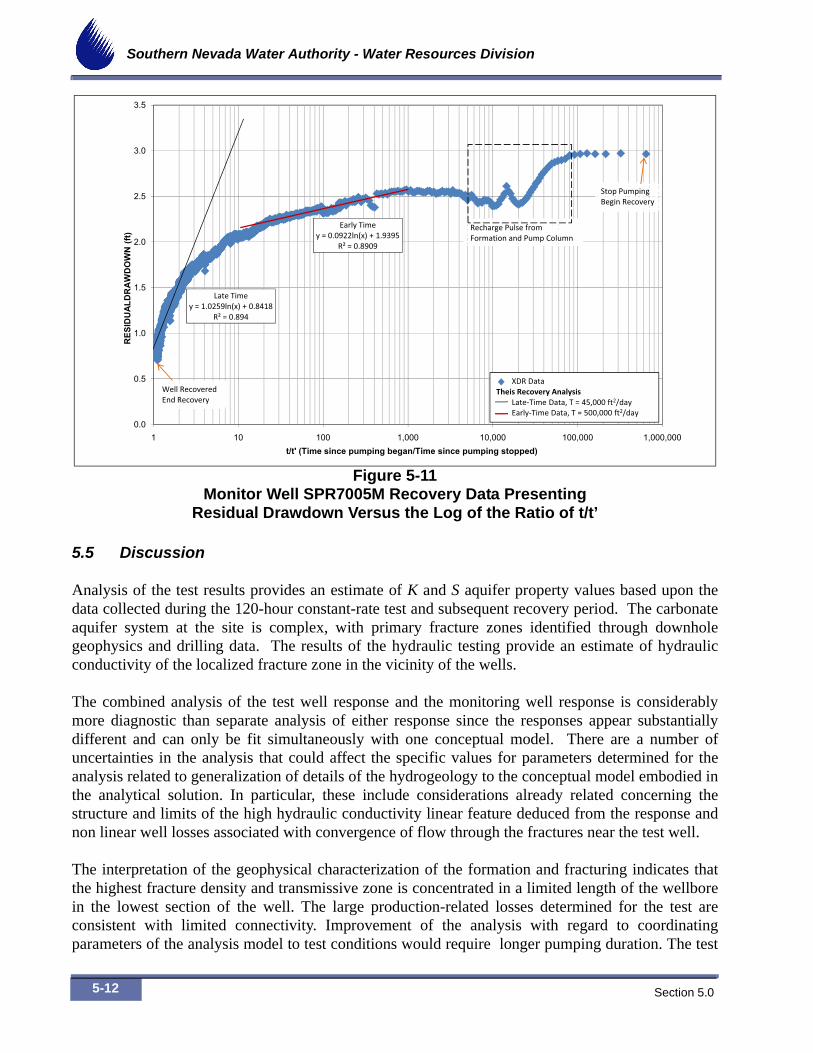
Section 5.0
Southern Nevada Water Authority - Water Resources Division
5-12
5.5 Discussion
Analysis of the test results provides an estimate of K and S aquifer property values based upon the data collected during the 120-hour constant-rate test and subsequent recovery period. The carbonate aquifer system at the site is complex, with primary fracture zones identified through downhole geophysics and drilling data. The results of the hydraulic testing provide an estimate of hydraulic conductivity of the localized fracture zone in the vicinity of the wells.
The combined analysis of the test well response and the monitoring well response is considerably more diagnostic than separate analysis of either response since the responses appear substantially different and can only be fit simultaneously with one conceptual model. There are a number of uncertainties in the analysis that could affect the specific values for parameters determined for the analysis related to generalization of details of the hydrogeology to the conceptual model embodied in the analytical solution. In particular, these include considerations already related concerning the structure and limits of the high hydraulic conductivity linear feature deduced from the response and non linear well losses associated with convergence of flow through the fractures near the test well.
The interpretation of the geophysical characterization of the formation and fracturing indicates that the highest fracture density and transmissive zone is concentrated in a limited length of the wellbore in the lowest section of the well. The large production-related losses determined for the test are consistent with limited connectivity. Improvement of the analysis with regard to coordinating parameters of the analysis model to test conditions would require longer pumping duration. The test
Figure 5-11Monitor Well SPR7005M Recovery Data Presenting
Residual Drawdown Versus the Log of the Ratio of t/t’
Late�Timey�=�1.0259ln(x)�+�0.8418
Early�Timey�=�0.0922ln(x)�+�1.9395
R²�=�0.8909
1.5
2.0
2.5
3.0
3.5
UAL
DR
AW
DO
WN
(ft)
Stop�Pumping�Begin�Recovery
Recharge�Pulse�from�Formation�and�Pump�Column�
R²�=�0.894
0.0
0.5
1.0
1 10 100 1,000 10,000 100,000 1,000,000
RES
IDU
t/t' (Time since pumping began/Time since pumping stopped)
Well Recovered�End�Recovery
XDR�DataTheis�Recovery�Analysis
Late�Time�Data,�T�=�45,000�ft2/dayEarly�Time�Data,�T�=�500,000�ft2/day
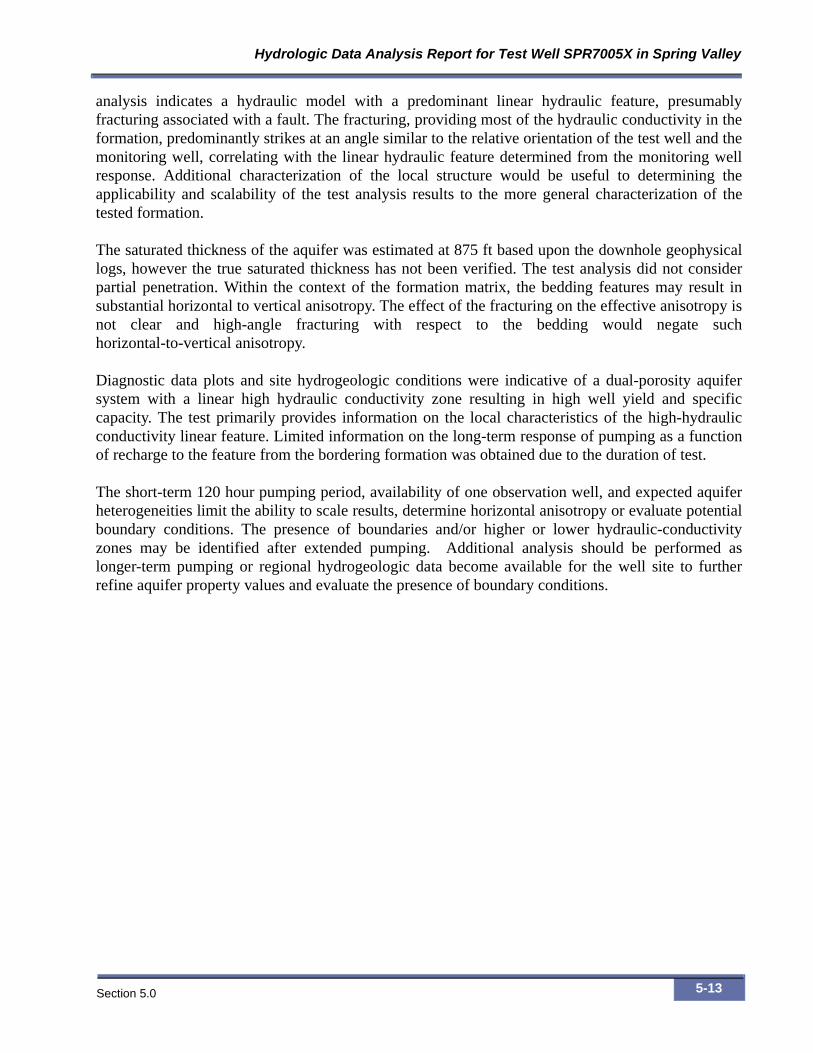
Hydrologic Data Analysis Report for Test Well SPR7005X in Spring Valley
Section 5.0 5-13
analysis indicates a hydraulic model with a predominant linear hydraulic feature, presumably fracturing associated with a fault. The fracturing, providing most of the hydraulic conductivity in the formation, predominantly strikes at an angle similar to the relative orientation of the test well and the monitoring well, correlating with the linear hydraulic feature determined from the monitoring well response. Additional characterization of the local structure would be useful to determining the applicability and scalability of the test analysis results to the more general characterization of the tested formation.
The saturated thickness of the aquifer was estimated at 875 ft based upon the downhole geophysical logs, however the true saturated thickness has not been verified. The test analysis did not consider partial penetration. Within the context of the formation matrix, the bedding features may result in substantial horizontal to vertical anisotropy. The effect of the fracturing on the effective anisotropy is not clear and high-angle fracturing with respect to the bedding would negate such horizontal-to-vertical anisotropy.
Diagnostic data plots and site hydrogeologic conditions were indicative of a dual-porosity aquifer system with a linear high hydraulic conductivity zone resulting in high well yield and specific capacity. The test primarily provides information on the local characteristics of the high-hydraulic conductivity linear feature. Limited information on the long-term response of pumping as a function of recharge to the feature from the bordering formation was obtained due to the duration of test.
The short-term 120 hour pumping period, availability of one observation well, and expected aquifer heterogeneities limit the ability to scale results, determine horizontal anisotropy or evaluate potential boundary conditions. The presence of boundaries and/or higher or lower hydraulic-conductivity zones may be identified after extended pumping. Additional analysis should be performed as longer-term pumping or regional hydrogeologic data become available for the well site to further refine aquifer property values and evaluate the presence of boundary conditions.
Section 5.0
Southern Nevada Water Authority - Water Resources Division
5-14
This Page Left Intentionally Blank
Hydrologic Data Analysis Report for Test Well SPR7005X in Spring Valley
Section 6.0 6-1
6.0 WATER CHEMISTRY
Groundwater chemistry data for Test Well SPR7005X and Monitor Well SPR7005M are presented in this section. Data for other SNWA wells located in Spring Valley (see Figure 2-1) in the vicinity of these wells are also presented in a Piper diagram for comparison.
6.1 Groundwater Sample Collection and Analysis
Water samples were collected from Test Well SPR7005X on July 10, 2008, at 08:30 a.m. after pumping over 18 million gal (following well development, step-drawdown testing, and a portion of the constant-rate test). Turbidity, pH, specific conductance, dissolved oxygen, and temperature of the water were measured in the field. With the exception of dissolved oxygen, these parameters were also measured periodically during well development and testing. Sampling and field measurement of the water-quality parameters were performed using the National Field Manual for the Collection of Water-Quality Data (USGS, 2007) as the basis. All measurement equipment was calibrated according to the manufacturers’ calibration procedures. Samples were sent to Weck Laboratories, Inc., (Weck) for analysis of a large suite of parameters including major solutes, minor and trace constituents, radiological parameters, and organic compounds. Weck is certified by the State of Nevada and performs all analyses according to U.S. Environmental Protection Agency (EPA) methods or methods published in Standard Methods for the Examination of Water and Wastewater (Eaton et al., 2005). Both total and dissolved trace element concentrations of the samples were analyzed. The parameters analyzed and the corresponding EPA analytical method are presented in Tables B-1 and B-2. Weck provided all sample containers and preservatives. Radiation Safety Engineering, Inc., and Frontier Analytical Laboratory were contracted by Weck for the analysis of radiological parameters and dioxin, respectively. In addition, samples were collected for the analysis of oxygen and hydrogen isotopes by University of Waterloo’s Environmental Isotope Laboratory, carbon isotopes by University of Arizona’s NSF-Arizona Accelerator Mass Spectrometry Laboratory, and chlorine-36 by Purdue University’s Purdue Rare Isotope Measurement (PRIME) Laboratory.
Water samples were collected from Monitor Well SPR7005M on August 22, 2007, at 4:18 p.m. after pumping approximately 133,500 gal. Samples were sent to Weck for analysis of major solutes and trace and minor constituents. Samples were also collected for the analysis of oxygen and hydrogen isotopes, and tritium activity by University of Waterloo’s Environmental Isotope Laboratory (Table B-1). The pH, specific conductance, and temperature associated with these samples were measured in the field. Monitor Well SPR7005M (184W512M) was used as the water source for drilling Test Well SPR7005X.
The groundwater chemistry of additional wells in the area are presented on a Piper diagram in this section for comparison. The wells, all drilled by the SNWA (see Figure 2-1), were completed in either alluvial or carbonate-rock aquifer, are given in Table 6-1.

Section 6.0
Southern Nevada Water Authority - Water Resources Division
6-2
6.2 EPA Drinking Water Standards
The national maximum contaminant levels (MCLs) for drinking water, established by the EPA and authorized by the Safe Drinking Water Act, are presented in Tables B-1 and B-2. These national health-based standards are to protect against both naturally occurring and man-made contaminants that may be found in drinking water. Also presented in Table B-1 are the secondary drinking water standards established by the EPA. These are non-enforceable guidelines that regulate contaminants that may cause cosmetic or aesthetic effects in drinking water. Generally, the measured parameters in the Test Well SPR7005X and the Monitor Well SPR7005M were less than the MCL. Exceedance is discussed further in Sections 6.3.3 and 6.3.6.
6.3 Groundwater-Chemistry Results
In this section, the field measurements and analytical results for the groundwater of Monitor Well SPR7005M and Test Well SPR7005X are presented and compared to those of groundwater samples from wells within the vicinity on a Piper diagram (Figure 6-1).
6.3.1 Field Results
Field measurements of turbidity, pH, specific conductance, and temperature were performed periodically throughout the development and testing of Test Well SPR7005X and for the samples collected for laboratory analysis (see Table B-1). For Test Well SPR7005X, the turbidity varied widely without any discernible trend and varied from 1.91 to greater than 1,000 NTU during development. The pH, temperature, and EC measurements were relatively stable throughout the development of the well. The pH ranged from 7.15 to 8.09, the temperature varied from 21.4 to 23.8ºC, and the EC ranged from 323 to 495 μS/cm. Field measurements made at the time of sample collection are reported as 323
Table 6-1Total Depths of Wells Drilled by SNWA in Spring Valley, Nevada
Well Aquifer MaterialTotal Drilled Depth
(ft bgs)
184W101 Carbonate 1,760
184W502M Carbonate 1,828
184W103 Carbonate 1,046
184W504M Carbonate 1,040
184W105 Carbonate 1,160
184W506M Carbonate 1,160
SPR7005X Carbonate 1,395
SPR7005M Carbonate 1,412
SPR7007X Alluvial 1,040
SPR7008X Alluvial 970
SPR7023I Alluvial 1,220

Hydrologic Data Analysis Report for Test Well SPR7005X in Spring Valley
Section 6.0 6-3
μS/cm, 7.2, 24.1°C, and 3.3 mg/L for specific conductance, pH, water temperature, and dissolved oxygen concentration, respectively.
An 8-hour constant-rate test was performed for Monitor Well SPR7005M during which time samples were collected for analysis. Field measurements made at the time of sample collection are reported as 0.88 NTU, 325 μS/cm, 7.72, and 24.1°C for turbidity, specific conductance, pH, and water temperature, respectively. The temperature is similar to that of the Test Well 184W101, a deep carbonate-rock aquifer well located south of Test Well SPR7005X.
When compared to other carbonate-rock aquifer wells, (e.g. Test Well 184W105 and Monitor Well 184W506M), the water temperatures in the Test Well SPR7005X and Monitor Well SPR7005M are relatively higher (21.4 and 24.1°C) probably due to the greater depths. The total depth of Test Well SPR7005X is approximately 1,370 ft and the depths of the other test wells were approximately 1,100 ft. It appears that the relatively deeper wells have a component of geothermal water. There are no clear discernible trends in the specific conductance and the pH values of the carbonate-rock wells.
6.3.2 Major Constituents
The concentrations of the major constituents in groundwater samples from Test Well SPR7005X and Monitor Well SPR7005M are presented in Table B-1. Major constituents are defined as those
Figure 6-1Piper Diagram Illustrating Relative Major-Ion Compositions
80 60 40 20 20 40 60 80
20
40
60
80
20
40
60
80
20
40
60
80
20
40
60
80
Ca Na+K HCO3 Cl
Mg SO4
<=HC
O3Na+K=>
<=Ca +MgCl
+SO
4=>
A
A
A
B
B
B
C
C
C
D
D
D
E
E
E
L
L
L
K
K
K
H
H
H
I
I
I
J
J
J
C
C
C
Q
Q
Q
S
S
S
LegendLegend
A 184W101
B 184W103
C 184W105
D 184W502M
E 184W504M
L 184W506M
K SPR7005M
H SPR7005X
I SPR7007M
J SPR7007X
C SPR7008M
Q SPR7008X
S SPR7023I
Section 6.0
Southern Nevada Water Authority - Water Resources Division
6-4
commonly present in groundwater at concentrations greater than 1 mg/L and typically include calcium (Ca), magnesium (Mg), potassium (K), sodium (Na), silica (SiO2), bicarbonate (HCO3), sulfate (SO4), and chloride (Cl). The sum of the charge of major cations should equal the sum of the charge of the major anions in solution (in milliequivalents per liter [mEq/L]); thus, calculation of the anion-cation (charge) balance is used to assess the accuracy of the analyses and to ensure that the full suite of anions and cations present as major constituents in the groundwater have been included in the analyses. The charge balance for the analysis of Test Well SPR7005X and Monitor Well SPR7005M were 0.3 and 1.1 percent respectively, and indicate that the analyses were performed adequately (Table B-1).
The relative major-ion compositions of the SNWA wells in Spring Valley are illustrated on a Piper diagram in Figure 6-1. A Piper diagram consists of two triangular plots presenting the major cations (left triangle) and major anions (right triangle) in percent milliequivalents. The two triangular plots are then projected to a central diamond where the relative abundance of all the major ions is presented. A Piper diagram is used to evaluate similarities or differences in groundwater major-ion compositions, to identify the hydrochemical water type representing the aquifer(s) from which the groundwater was collected, and to assess possible evolutionary trends that have occurred along a flowpath. As shown in Figure 6-1, the relative concentrations of major ions are similar for all the groundwater samples. The groundwater samples all represent a calcium-magnesium-bicarbonate facies that is typical of dissolution of calcite and dolomite in waters of a carbonate-rock aquifer. The relative concentrations of sodium plus potassium (Na + K) tend to be slightly greater in the groundwater samples from the monitor wells than in that of their associated test wells.
6.3.3 Trace and Minor Constituents
The concentrations of trace elements in the groundwater from Test Well SPR7005X and Monitor Well SPR7005M are presented in Table B-1. The trace element concentrations of the Test Well SPR7005X were generally less than the primary and secondary MCLs established by the EPA. The iron concentration of the Monitor Well SPR7005M was 390 μg/L and exceeded the EPA secondary MCL of 300 μg/L. The trace element with the highest concentration in the groundwater in both wells was strontium. The strontium concentration of each of the wells was160 μg/L.
6.3.4 Stable Isotopes and Environmental Tracers
The stable hydrogen, (δD) oxygen (δ18O), and carbon isotopic (δ13C) compositions of the groundwater samples from Test Well SPR7005X and the stable hydrogen (δD) and oxygen (δ18O) compositions of the groundwater samples of Monitor Well SPR7005M are presented in Table B-1. Table B-1 also presents carbon-14 (14C) chlorine-36 (36Cl/Cl), strontium (87Sr/86Sr) and uranium (234U/238U) isotope ratios for the groundwater samples collected from Test Well SPR7005X.
6.3.4.1 Hydrogen and Oxygen Isotopes
Stable isotopes of hydrogen and oxygen behave conservatively in most groundwater systems and therefore can be used to indicate groundwater source, trace groundwater flowpaths, evaluate possible mixing of groundwater along a flowpath, and evaluate water budgets. Isotopic concentrations are
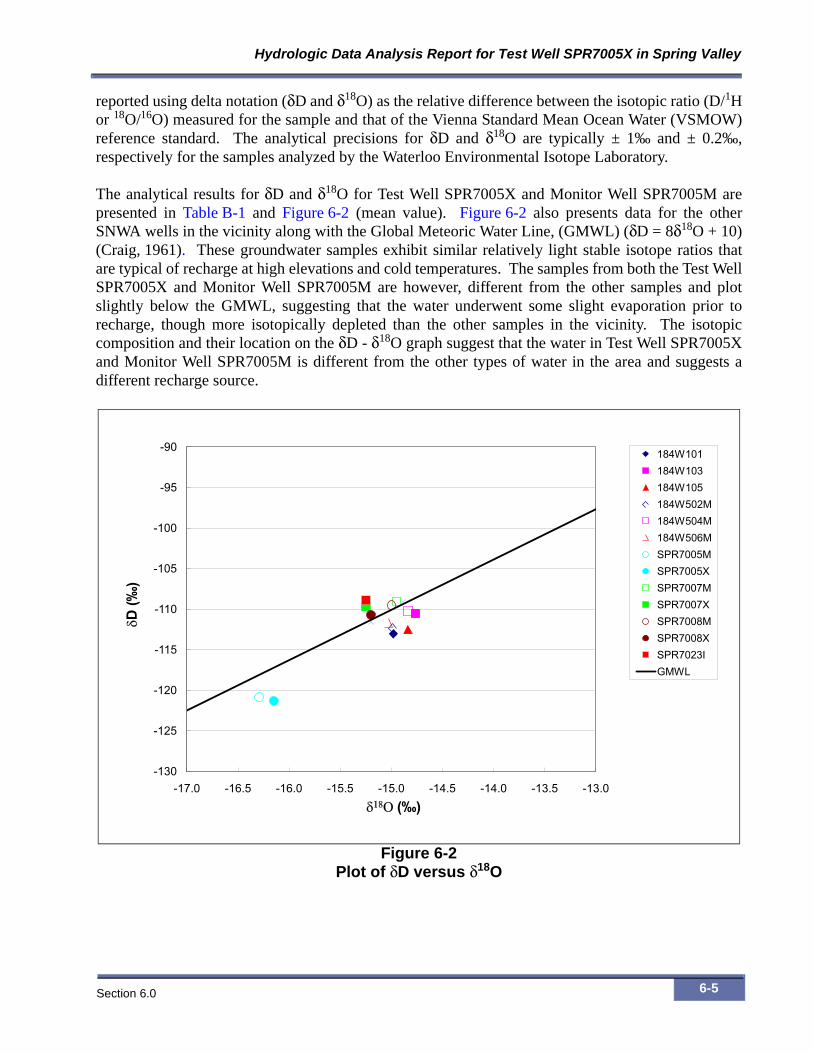
Hydrologic Data Analysis Report for Test Well SPR7005X in Spring Valley
Section 6.0 6-5
reported using delta notation (δD and δ18O) as the relative difference between the isotopic ratio (D/1H or 18O/16O) measured for the sample and that of the Vienna Standard Mean Ocean Water (VSMOW) reference standard. The analytical precisions for δD and δ18O are typically ± 1‰ and ± 0.2‰, respectively for the samples analyzed by the Waterloo Environmental Isotope Laboratory.
The analytical results for δD and δ18O for Test Well SPR7005X and Monitor Well SPR7005M are presented in Table B-1 and Figure 6-2 (mean value). Figure 6-2 also presents data for the other SNWA wells in the vicinity along with the Global Meteoric Water Line, (GMWL) (δD = 8δ18O + 10) (Craig, 1961). These groundwater samples exhibit similar relatively light stable isotope ratios that are typical of recharge at high elevations and cold temperatures. The samples from both the Test Well SPR7005X and Monitor Well SPR7005M are however, different from the other samples and plot slightly below the GMWL, suggesting that the water underwent some slight evaporation prior to recharge, though more isotopically depleted than the other samples in the vicinity. The isotopic composition and their location on the δD - δ18O graph suggest that the water in Test Well SPR7005X and Monitor Well SPR7005M is different from the other types of water in the area and suggests a different recharge source.
Figure 6-2Plot of δD versus δ18O
-130
-125
-120
-115
-110
-105
-100
-95
-90
-17.0 -16.5 -16.0 -15.5 -15.0 -14.5 -14.0 -13.5 -13.0
�D (‰
)
����� (‰)
184W101184W103184W105184W502M184W504M184W506MSPR7005MSPR7005XSPR7007MSPR7007XSPR7008MSPR7008XSPR7023IGMWL

Section 6.0
Southern Nevada Water Authority - Water Resources Division
6-6
6.3.4.2 Tritium
Tritium, a short-lived isotope of hydrogen with a half-life of 12.43 years, is commonly used to identify modern recharge. Natural 3H is formed in the upper atmosphere by nitrogen bombarded by the flux of neutrons in cosmic radiation (Clark and Fritz, 1997). The era of thermonuclear bomb testing in the atmosphere from 1951 to 1976 provided the 3H input signal that defines modern water. Modern ground waters are those recharged within the past few decades and are part of an active hydrologic cycle (Clark and Fritz, 1997). Tritium concentrations exceeded 1000 TU during the early 1960s (Drever, 1988; Yang and others, 1996, p. 25 and 53). Prior to nuclear testing in the 1960s, the amount of 3H in the atmosphere was very small, and concentrations in precipitation were not well known. Thatcher (1962) estimated a probable range in concentration of 2 to 8 TU. Tritium values measured by SNWA for precipitation samples collected by Desert Research Institute from the Egan, Schell Creek, and Snake Ranges in east-central Nevada in 2008 were 8.4, 12.3 and 9.4 TU, respectively.
The tritium activity measured for Test Well SPR7005X was 4.5 TU and is greater than those measured in the other carbonate-rock aquifer wells which are all less than the reporting limit of 0.8 TU. Though this value is less than the values measured for precipitation in the surrounding mountains by SNWA mentioned earlier, the presence of tritium suggests that the groundwater contains a great proportion of modern recharge.
6.3.4.3 Carbon Isotopes
The δ13C in groundwater is used to assess the extent of isotope mass transfer that occurred along a groundwater flowpath. Corrections based on this assessment can then be applied to Carbon-14 (14C) data to determine the age of the groundwater. The δ13C composition is reported as the relative difference between the isotopic ratio, 13C/12C, for the sample and that of the Pee Dee Belemnite (PDB) reference standard. The analytical precision for δ13C is typically ± 0.3‰. Carbon-14 is reported as percent modern carbon (pmc), where modern carbon is defined as the approximate 14C activity of wood grown in 1890 (13.56 disintegrations per minute per gram of carbon), before the dilution of 14C in the atmosphere by burning fossil fuels. The analytical precision for 14C in these groundwater samples is ± 0.1 pmc.
The values of δ13C and 14C measured in the groundwater of the Test Well SPR7005X are −7.5‰ and 43.45 pmc respectively. These were significantly different from the values measured in the surrounding carbonate wells in the vicinity which ranged from -6.7 to -5.8‰ in δ13C and from 4.93 to 10.37 pmc in 14C respectively. The relatively high 14C activity and relatively light value of δ13C suggest that the groundwater has not interacted very much with isotopically heavy carbonate minerals. Water-rock interaction has occurred to a lesser extent along the groundwater flowpath to Test Well SPR70005X in comparison with the other test wells. Further evaluation of groundwater flowpaths is required to assess the extent of these reactions and to accurately estimate the groundwater age.
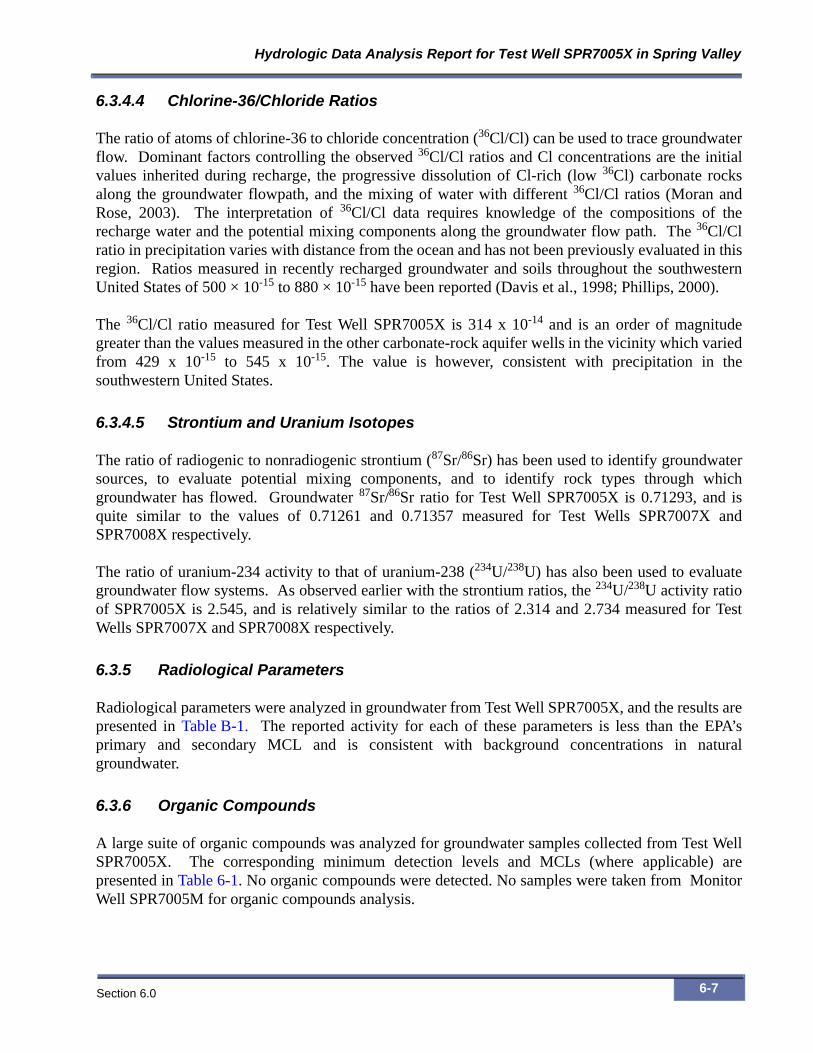
Hydrologic Data Analysis Report for Test Well SPR7005X in Spring Valley
Section 6.0 6-7
6.3.4.4 Chlorine-36/Chloride Ratios
The ratio of atoms of chlorine-36 to chloride concentration (36Cl/Cl) can be used to trace groundwater flow. Dominant factors controlling the observed 36Cl/Cl ratios and Cl concentrations are the initial values inherited during recharge, the progressive dissolution of Cl-rich (low 36Cl) carbonate rocks along the groundwater flowpath, and the mixing of water with different 36Cl/Cl ratios (Moran and Rose, 2003). The interpretation of 36Cl/Cl data requires knowledge of the compositions of the recharge water and the potential mixing components along the groundwater flow path. The 36Cl/Cl ratio in precipitation varies with distance from the ocean and has not been previously evaluated in this region. Ratios measured in recently recharged groundwater and soils throughout the southwestern United States of 500 × 10-15 to 880 × 10-15 have been reported (Davis et al., 1998; Phillips, 2000).
The 36Cl/Cl ratio measured for Test Well SPR7005X is 314 x 10-14 and is an order of magnitude greater than the values measured in the other carbonate-rock aquifer wells in the vicinity which varied from 429 x 10-15 to 545 x 10-15. The value is however, consistent with precipitation in the southwestern United States.
6.3.4.5 Strontium and Uranium Isotopes
The ratio of radiogenic to nonradiogenic strontium (87Sr/86Sr) has been used to identify groundwater sources, to evaluate potential mixing components, and to identify rock types through which groundwater has flowed. Groundwater 87Sr/86Sr ratio for Test Well SPR7005X is 0.71293, and is quite similar to the values of 0.71261 and 0.71357 measured for Test Wells SPR7007X and SPR7008X respectively.
The ratio of uranium-234 activity to that of uranium-238 (234U/238U) has also been used to evaluate groundwater flow systems. As observed earlier with the strontium ratios, the 234U/238U activity ratio of SPR7005X is 2.545, and is relatively similar to the ratios of 2.314 and 2.734 measured for Test Wells SPR7007X and SPR7008X respectively.
6.3.5 Radiological Parameters
Radiological parameters were analyzed in groundwater from Test Well SPR7005X, and the results are presented in Table B-1. The reported activity for each of these parameters is less than the EPA’s primary and secondary MCL and is consistent with background concentrations in natural groundwater.
6.3.6 Organic Compounds
A large suite of organic compounds was analyzed for groundwater samples collected from Test Well SPR7005X. The corresponding minimum detection levels and MCLs (where applicable) are presented in Table 6-1. No organic compounds were detected. No samples were taken from Monitor Well SPR7005M for organic compounds analysis.
Section 6.0
Southern Nevada Water Authority - Water Resources Division
6-8
6.4 Summary
Groundwater samples were collected from Test Well SPR7005X and Monitor Well SPR7005M and analyzed for a suite of chemical parameters. Field measurement of water-quality parameters was also performed during aquifer testing and used to demonstrate stabilization of the water chemistry prior to collection of the samples. The resulting data were compared to data from samples collected from other SNWA wells in the vicinity on a Piper diagram. As expected from a carbonate-rock aquifer, the groundwater is of a calcium-magnesium-bicarbonate facies.
The stable isotopic composition of the samples collected from Test Well SPR7005X and Monitor Well SPR7005M were very depleted and plotted separately from those of the groundwater samples from the wells in the vicinity and suggested a different recharge source for the water. The 36Cl/Cl ratio measured for the sample collected from Test Well SPR7005X was consistent with precipitation in the southwestern United States, and the relatively high14C and relatively light value of δ13C suggest that the groundwater has not interacted very much with isotopically heavy carbonate minerals. The strontium isotope ratio is similar to those of the surrounding wells. The samples from the monitor wells were not analyzed for 36Cl/Cl, 87Sr/86Sr, 234U/238U, and 14C, activity and δ13C.
The data were also evaluated with respect to the EPA Safe Drinking Water Act standards. For Test Well SPR7005X, no constituent exceeded the primary or secondary MCL and no organic compound was detected.

Hydrologic Data Analysis Report for Test Well SPR7005X in Spring Valley
Section 7.0 7-1
7.0 REFERENCES
Barker, J.A., 1988, A generalized radial-flow model for hydraulic tests in fractured rock: Water Resources Research, Vol. 24, No. 10, p. 1796-1804.
Bierschenk, W.H., 1963, Determining well efficiency by multiple step-drawdown tests: International Association of Scientific Hydrology, Vol. 64, p. 493-507.
Bredehoeft, J.D., 1997, Fault permeability near Yucca Mountain: Water Resources Research, Vol. 33, No. 11, p. 2459–2463.
Burns, A.G., and Drici, W., 2011, Hydrology and water resources of Spring, Cave, Dry Lake, and Delamar valleys, Nevada and vicinity: Presentation to the Office of the Nevada State Engineer: Southern Nevada Water Authority, Las Vegas, Nevada.
Clark, I.D., and Fritz, P., 1997 Environmental Isotopes in Hydrogeology: New York, Lewis Publishers.
Cooper, H.H., and Jacob, C.E., 1946, A generalized graphical method for evaluating formation constants and summarizing well-field history: American Geophysical Union Transactions, Vol. 27, No. 4, p. 526-534.
Craig, H., 1961, Isotopic variations in meteoric waters: Science, Vol. 133, p. 1702-1703.
Davis S.N., Cecil, L.D., Zreda, M., and Sharma, P., 1998, Chlorine-36 and the initial valve problem: Hydrogeology Journal, Vol. 6, No 1, p. 104-114.
Dixon, G.L., Rowley, P.D., Burns, A.G., Watrus, J.M., Donovan, D.J., and Ekren, E.B., 2007, Geology of White Pine and Lincoln counties and adjacent areas, Nevada and Utah: The geologic framework of regional groundwater flow systems: Southern Nevada Water Authority, Las Vegas, Nevada, Doc. No. HAM-ED-0001, 157 p.
Drever, J.I., 1988, The geochemistry of natural waters. Third edition: Upper Saddle River, New Jersey, Prentice Hall.
Duffield, G.M., 1996-2007, HydroSOLVE, Inc, AQTESOLV Version 4.50 Professional software.
Eaton, A.D., Clesceri, L.S., Rice, E.W., Greenberg, A.E., and Franson, M.H., eds., 2005, Standard methods for the examination of water and wastewater. Twenty-first edition: Washington, D.C., American Public Health Association.
Section 7.0
Southern Nevada Water Authority - Water Resources Division
7-2
Freeze, R.A., and Cherry, J.A., 1979, Groundwater: Englewood Cliffs, New Jersey, Prentice-Hall.
Galloway, D., and Rojstaczer S., 1989, Analysis of the frequency response of water levels in wells to Earth tides and atmospheric loading, in Proceedings 1988 Canadian/American Conference on Hydrogeology: Baniff, Alberta, Canada, National Water Well Association, Dublin, Ohio, p. 100-113.
Hantush, M.S., 1964, Hydraulics of wells, in Advances in Hydroscience: Chow, V.T., eds., Vol. I, Academic Press, New York and London, p. 281-432.
Harrill, J.R., Gates, J.S., and Thomas, J.M., 1988, Major ground-water flow systems in the Great Basin region of Nevada, Utah, and adjacent states: U.S. Geological Survey Hydrologic Investigations Atlas HA-694-C, scale 1:1,000,000, 2 sheets.
Kilroy, K.C., 1992, Aquifer storage characteristics of Paleozoic carbonate rocks in southeastern Nevada estimated from harmonic analysis of water-level fluctuations [Ph.D. dissertation]: University of Nevada, Reno, 77 p.
Mace, J.T., and Muller D.C., 2010, Geologic Data Analysis Report for Monitor Well SPR7005M and Test Well SPR7005X in Spring Valley: Southern Nevada Water Authority, Las Vegas, Nevada, Doc. No. RDS-ED-0017, 30 p.
Mankinen, E.A., Roberts, C.W., McKee, E.H., Chuchel, B.A., and Moring, B.C., 2006, Geophysical Data from the Spring and Snake valleys area, Nevada and Utah. U.S. Geological Survey Open-File Report 2006–1160, 36 p.
McPhee, Darcy K., Chuchel, Bruce A., and Pellerin, Louise, 2007, Audiomagnetotelluric data and two-dimensional models from Spring, Snake, and Three Lakes Valleys, Nevada: U.S. Geological Survey Open-File Report 2007–1181, 47 p. [http://pubs.usgs.gov/of/2007/1181/].
Moench, A.F., 1984, Double-porosity models for a fissured groundwater reservoir with fracture skin: Water Resources Research, Vol. 20, No. 7, p. 831–846.
Moran J.E., and Rose, T.P., 2003, A chlorine-36 study of regional groundwater flow and vertical transport in southern Nevada: Environmental Geology, Vol. 43, p. 592-605.
Neuman, S.P., 1975, Analysis of pumping test data from anisotropic unconfined aquifers considering delayed gravity response: Water Resources Research, Vol. 11, No. 2, p. 329–342.
Pari, K.T., and Baird, F.A., 2011, Audiomagnetotelluric investigations in selected basins in White Pine and Lincoln Counties, East-Central Nevada: Southern Nevada Water Authority, Las Vegas, Nevada, Doc. No. RDS-ED-0022, 81 p.
Peterman, Z.E., Hedge, C.E., and Tourtelot, H.A., 1970, Isotopic composition of strontium in sea water throughout Phanerozoic time: Geochimica et Cosmochimica Acta, Vol. 34, Issue 1, p. 105-120.

Hydrologic Data Analysis Report for Test Well SPR7005X in Spring Valley
Section 7.0 7-3
Phillips, F.M., 2000, Chlorine-36—environmental tracers in subsurface hydrology: P.G. Cook and A.L. Herczeg, ed., Kluwer, Boston.
Prieur, J.P., 2011, SNWA hydrologic management program for groundwater development in Spring, Cave, Dry Lake, and Delamar valleys, Nevada: Presentation to the Office of the Nevada State Engineer: Southern Nevada Water Authority, Las Vegas, Nevada.
Rorabaugh, M.J., 1953, Graphical and theoretical analysis of step-drawdown test of artesian well, in Proceedings of the American Society of Civil Engineers, Vol. 79, separate no. 362, 23 p.
Rowley, P.D., Dixon, G.L., Burns, A.G., Pari, K.T., Watrus, J.M., and Ekren, E.B., 2011, Geology and geophysics of Spring, Cave, Dry Lake, and Delamar valleys, White Pine and Lincoln Counties and adjacent areas, Nevada and Utah: The geologic framework of regional groundwater flow systems: Presentation to the Office of the Nevada State Engineer: Southern Nevada Water Authority, Las Vegas, Nevada.
Rush, F.E., and Kazmi, S.A.T., 1965, Water resources appraisal of Spring Valley, White Pine and Lincoln Counties, Nevada: Nevada Department of Conservation and Natural Resources Ground-Water Resources–Reconnaissance Series Report 33, 36 p.
SNWA, see Southern Nevada Water Authority.
Southern Nevada Water Authority, 2007, Water Resources Division field operating procedure for well development and aquifer testing: Southern Nevada Water Authority, Las Vegas, Nevada, Procedure No. WRD-FOP-006, 29 p.
Southern Nevada Wather Authority, 2009, 2008 Spring Valley hydrologic monitoring and mitigation plan status and data report: Southern Nevada Water Authority, Las Vegas, Nevada, Doc. No. WRD-ED-0004, 109 p.
Southern Nevada Wather Authority, 2010, 2009 Spring Valley hydrologic monitoring and mitigation plan status and data report: Southern Nevada Water Authority, Las Vegas, Nevada, Doc. No. WRD-ED-0007, 120 p.
Southern Nevada Wather Authority, 2011, 2010 Spring Valley hydrologic monitoring and mitigation plan status and data report: Southern Nevada Water Authority, Las Vegas, Nevada, Doc. No. WRD-ED-0010, 126 p.
Stanka, M.A., 2011, Committed groundwater resources in four Nevada hydrographic areas: Cave, Dry Lake, Delamar, and Spring valleys: Presentation to the Office of the Nevada State Engineer: Stanka Consulting, LTD., Carson City, Nevada.
Thatcher, L.L., 1962, The distribution of tritium fallout in precipitation over North America: Hydrological Sciences Journal, Vol. 7, Issue 2, p. 48-58.

Section 7.0
Southern Nevada Water Authority - Water Resources Division
7-4
Theis, C.V., 1935, The relation between the lowering of the piezometric surface and the rate and duration of discharge of a well using ground-water storage: American Geophysical Union Transaction, Vol. 16, p. 519-524.
USGS, see U.S. Geological Survey.
U.S. Geological Survey, 2007, National field manual for the collection of water-quality data [Internet]: U.S. Geological Survey Techniques of Water-Resources Investigations, Book 9, chaps. A1-A9, available from http://pubs.water.usgs.gov/twri9A.
Welch, A.H., Bright, D.J., and Knochenmus, L.A., eds., 2007, Water resources of the Basin and Range carbonate-rock aquifer system, White Pine County, Nevada, and adjacent areas in Nevada and Utah: U.S. Geological Survey Scientific Investigations Report 2007-5261, 96 p.
Yang, I.C., Rattray, G.W., and Yu, P., 1996, Interpretation of chemical and isotopic data from boreholes in the unsaturated zone at Yucca Mountain, Nevada: U.S. Geological Survey Water-Resources Investigations Report 96-4058, 67 p.
Hydrologic Data Analysis Report for Test Well SPR7005X in Spring Valley
Appendix A
CD-ROM Contents
Hydrologic Data Analysis Report for Test Well SPR7005X in Spring Valley
Appendix A A-1
A.1.0 INTRODUCTION
This appendix describes the digital contents of the CD-ROM that accompanies this report. The CD-ROM contains background water-level, barometric-pressure, step-drawdown test, and constant- rate test data. This CD-ROM also includes an electronic copy of the groundwater-chemistry data, as well as the AQTESOLV input files for the step-drawdown and constant-rate tests.
A.1.1 Photos
The following photos show an overview of the site (Figure A-1), the pump and motor setup (Figure A-2), the site setup (Figure A-3), discharge line (Figure A-4), and energy dissipation at the termination of the discharge line for erosion prevention (Figure A-5).
A.1.2 Read-Me File
Included on the CD-ROM is a text file version of this appendix that describes the contents of the CD-ROM. There is also an index of the files and folders in the form of a PDF document.
A.1.3 Background Water-Level Data
A spreadsheet containing the continuous water-level data and corresponding chart from SNWA Monitor Well 184W506M. This well was used to monitor background conditions during development and testing at Test Well SPR7005X.
A.1.4 Barometric-Pressure Data
Onsite Barometric-pressure data are located in the continuous record data files associated with Test Well SPR7005X. Regional barometric-pressure data from ET site SV2b is located in a separate file titled “SV2b Baro.xlsx”. All barometric-pressure data are reported in inches Hg.
A.1.5 Step-Drawdown Test Data
A summary spreadsheet for the step test, which includes both the manual and continuous data, is labeled “SPR7005X Step Test.xls”.
A.1.6 Constant-Rate Test
The constant-rate test data from both the Test Well SPR7005X and Monitor Well SPR7005M are provided in the spreadsheets labeled “SPR7005X and SPR7005M Const Rate 3000 gpm Manual

Appendix A
Southern Nevada Water Authority - Water Resources Division
A-2
Data.xlsx” for the manual data, and “SPR7005X and SPR7005M Const Rate 3000 gpm XDR Data.xlsx” for the continuously recorded transducer data.
A.1.7 AQTESOLV
The input files for using AQTESOLV software for aquifer analysis are provided. The input files are in the form of an Excel spreadsheet with water-level and discharge data for the constant-rate test. AQTESOLV files have also been included with basic information, such as casing, borehole, and downhole equipment radius, as well as approximate saturated thickness.
A.1.8 Water Chemistry
The laboratory results from Weck Labs, Inc., are included in PDF format and labeled “SPR7005X_8071126.pdf” for well SPR7005X and “184W512M_SPR7005M_7082432 FINAL.pdf” for well SPR7005M.
Figure A-1SPR7005X Test Well Site, Facing East-Northeast

Hydrologic Data Analysis Report for Test Well SPR7005X in Spring Valley
Appendix A A-3
Figure A-2SPR7005X Test Wellhead Equipment
Figure A-3SPR7005X Test Wellhead Equipment with Trailer and Generator

Appendix A
Southern Nevada Water Authority - Water Resources Division
A-4
Figure A-4Discharge Piping, Facing East from Well Site SPR7005X
Figure A-5Discharge with Erosion Control for
Hydrologic Testing Performed at Test Well SPR7005X
Hydrologic Data Analysis Report for Test Well SPR7005X in Spring Valley
Appendix B
Water-Chemistry Data

Hydrologic Data Analysis Report for Test Well SPR7005X in Spring Valley
Appendix B B-1
Table B-1Field and Analytical Results, Analytical Methods, Reporting Limits, and Maximum
Contaminant Levels for Inorganic, Stable Isotopic, and Radiological Constituents in Groundwater Samples from Test Well SPR7005X and Monitor Well SPR7005M
(Page 1 of 3)
Constituent Name UnitAnalysisMethod RL
SPR7005X(184W111)7/10/2008
08:30
SPR7005M(184W512M)
8/22/200716:18
PrimaryMCL
SecondaryMCL
Field Measured
pH units Field --- 7.4 7.7 --- 6.5 to 8.5
Conductivity μS/cm Field --- 327 325 --- ---
Dissolved Oxygen mg/L Field --- 3.5 --- --- ---
Temperature °C Field --- 24.3 24.1 --- ---
Turbidity NTU Field --- --- 0.88 --- ---
Stable Isotopes and Environmental Tracers
Carbon-14 (14C) pmc NA --- 43.45 --- --- ---
Carbon-13/12 (δ13C) per mil (‰) NA --- -7.5 --- --- ---
Chlorine-36/Chloride (36Cl/Cl) ratio NA --- 3.14E-12 --- --- ---
Hydrogen-2/1 (δD) per mil (‰) NA --- -121.3/-121.3 -120.5/-121.2 --- ---
Oxygen-18/16 (δ18O) per mil (‰) NA --- -16.15 -16.36/-16.23 --- ---
Strontium-87/86 Ratio NA --- 0.71293 --- --- ---
Tritium TU NA 0.5 4.5 --- --- ---
Uranium-234/238 Activity Ratio NA --- 2.545 --- --- ---
Major Solutes
Alkalinity Bicarbonate mg/L as HCO3 SM 2320B 2.0 200 200 --- ---
Alkalinity Carbonate mg/L as CaCO3 SM 2320B 2.0 ND ND --- ---
Alkalinity Hydroxide mg/L as CaCO3 SM 2320B 2.0 ND ND --- ---
Alkalinity Total mg/L as CaCO3 SM 2320B 2.0 160 160 --- ---
Calcium mg/L EPA 200.7 0.10 40 | 40b 38 --- ---
Chloride mg/L EPA 300.0 0.50 1.8 2.0 --- 250
Fluoride mg/L EPA 300.0 0.10 ND ND 4 2.0
Magnesium mg/L EPA 200.7 0.10 16 | 16b 14 --- ---
Nitrate mg/L as N EPA 353.2 0.10 0.30 --- 10 ---
Potassium mg/L EPA 200.7 1.0 1.1 | 1.2b 1.0 --- ---
Silica mg/L EPA 200.7 0.10 10 10 --- ---
Sodium mg/L EPA 200.7 1.0 | 0.50 4.9 | 5.0b 9.9 --- ---
Sulfate mg/L as SO4 EPA 300.0 0.50 11 15 --- 250
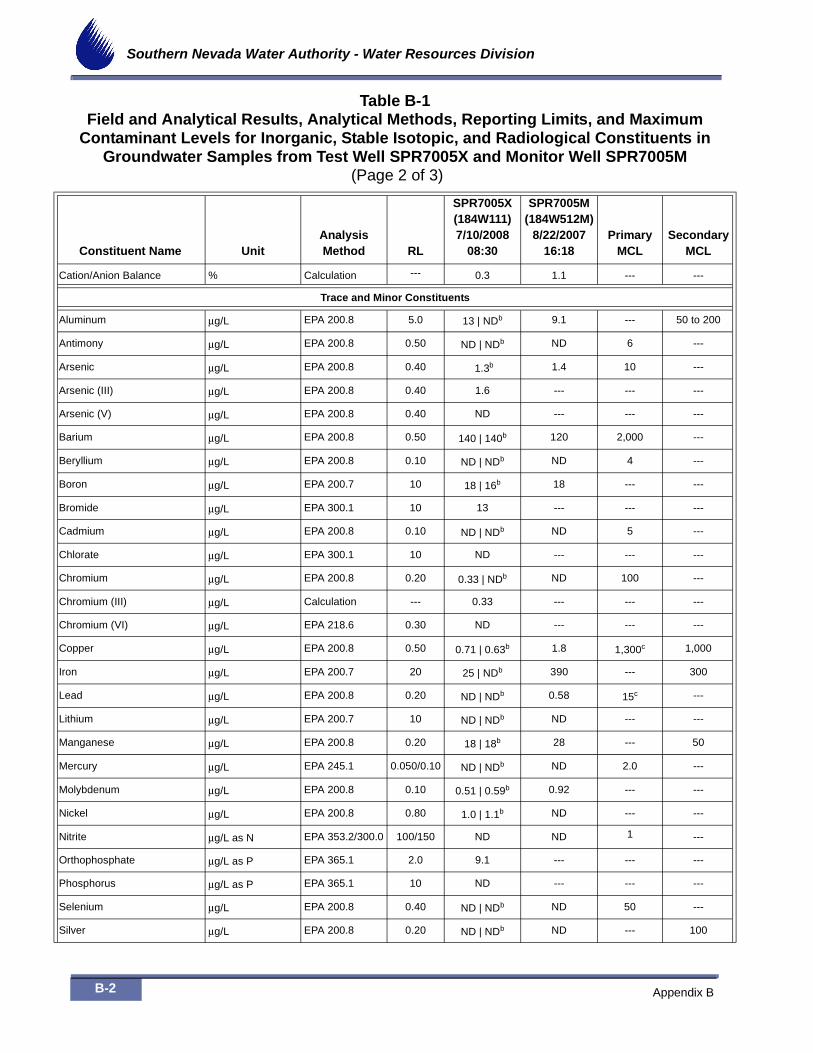
Appendix B
Southern Nevada Water Authority - Water Resources Division
B-2
Cation/Anion Balance % Calculation --- 0.3 1.1 --- ---
Trace and Minor Constituents
Aluminum μg/L EPA 200.8 5.0 13 | NDb 9.1 --- 50 to 200
Antimony μg/L EPA 200.8 0.50 ND | NDb ND 6 ---
Arsenic μg/L EPA 200.8 0.40 1.3b 1.4 10 ---
Arsenic (III) μg/L EPA 200.8 0.40 1.6 --- --- ---
Arsenic (V) μg/L EPA 200.8 0.40 ND --- --- ---
Barium μg/L EPA 200.8 0.50 140 | 140b 120 2,000 ---
Beryllium μg/L EPA 200.8 0.10 ND | NDb ND 4 ---
Boron μg/L EPA 200.7 10 18 | 16b 18 --- ---
Bromide μg/L EPA 300.1 10 13 --- --- ---
Cadmium μg/L EPA 200.8 0.10 ND | NDb ND 5 ---
Chlorate μg/L EPA 300.1 10 ND --- --- ---
Chromium μg/L EPA 200.8 0.20 0.33 | NDb ND 100 ---
Chromium (III) μg/L Calculation --- 0.33 --- --- ---
Chromium (VI) μg/L EPA 218.6 0.30 ND --- --- ---
Copper μg/L EPA 200.8 0.50 0.71 | 0.63b 1.8 1,300c 1,000
Iron μg/L EPA 200.7 20 25 | NDb 390 --- 300
Lead μg/L EPA 200.8 0.20 ND | NDb 0.58 15c ---
Lithium μg/L EPA 200.7 10 ND | NDb ND --- ---
Manganese μg/L EPA 200.8 0.20 18 | 18b 28 --- 50
Mercury μg/L EPA 245.1 0.050/0.10 ND | NDb ND 2.0 ---
Molybdenum μg/L EPA 200.8 0.10 0.51 | 0.59b 0.92 --- ---
Nickel μg/L EPA 200.8 0.80 1.0 | 1.1b ND --- ---
Nitrite μg/L as N EPA 353.2/300.0 100/150 ND ND 1 ---
Orthophosphate μg/L as P EPA 365.1 2.0 9.1 --- --- ---
Phosphorus μg/L as P EPA 365.1 10 ND --- --- ---
Selenium μg/L EPA 200.8 0.40 ND | NDb ND 50 ---
Silver μg/L EPA 200.8 0.20 ND | NDb ND --- 100
Table B-1Field and Analytical Results, Analytical Methods, Reporting Limits, and Maximum
Contaminant Levels for Inorganic, Stable Isotopic, and Radiological Constituents in Groundwater Samples from Test Well SPR7005X and Monitor Well SPR7005M
(Page 2 of 3)
Constituent Name UnitAnalysisMethod RL
SPR7005X(184W111)7/10/2008
08:30
SPR7005M(184W512M)
8/22/200716:18
PrimaryMCL
SecondaryMCL
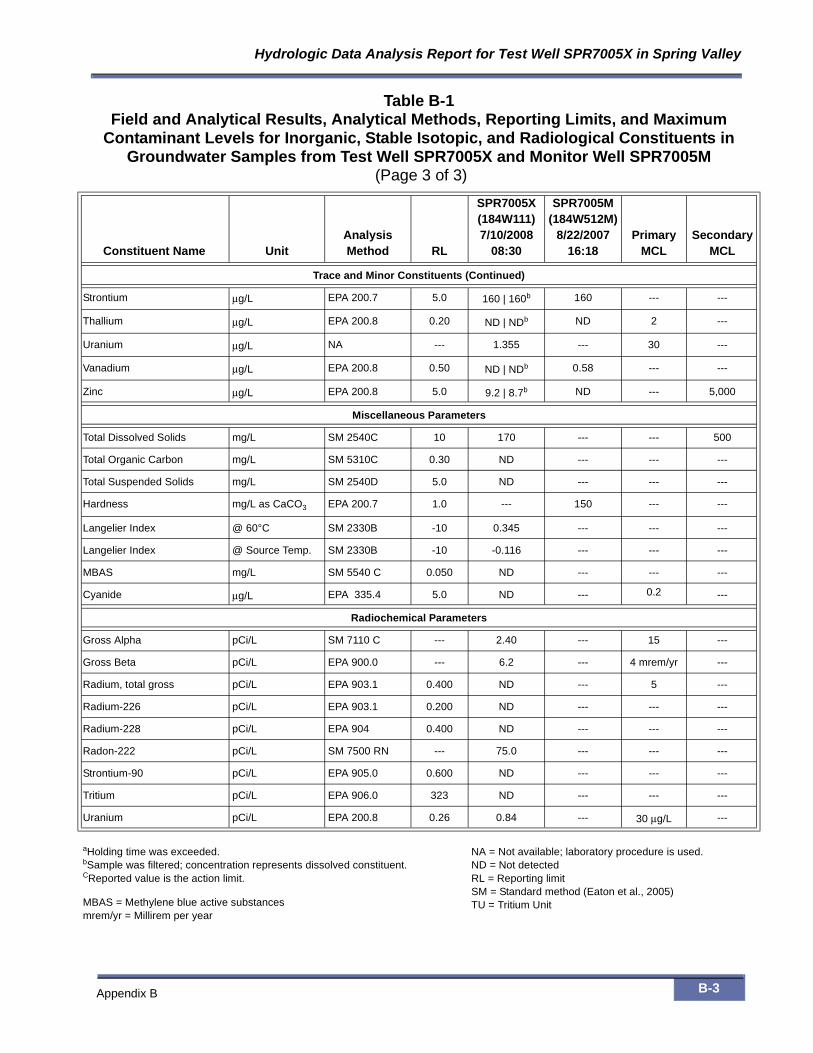
Hydrologic Data Analysis Report for Test Well SPR7005X in Spring Valley
Appendix B B-3
Trace and Minor Constituents (Continued)
Strontium μg/L EPA 200.7 5.0 160 | 160b 160 --- ---
Thallium μg/L EPA 200.8 0.20 ND | NDb ND 2 ---
Uranium μg/L NA --- 1.355 --- 30 ---
Vanadium μg/L EPA 200.8 0.50 ND | NDb 0.58 --- ---
Zinc μg/L EPA 200.8 5.0 9.2 | 8.7b ND --- 5,000
Miscellaneous Parameters
Total Dissolved Solids mg/L SM 2540C 10 170 --- --- 500
Total Organic Carbon mg/L SM 5310C 0.30 ND --- --- ---
Total Suspended Solids mg/L SM 2540D 5.0 ND --- --- ---
Hardness mg/L as CaCO3 EPA 200.7 1.0 --- 150 --- ---
Langelier Index @ 60°C SM 2330B -10 0.345 --- --- ---
Langelier Index @ Source Temp. SM 2330B -10 -0.116 --- --- ---
MBAS mg/L SM 5540 C 0.050 ND --- --- ---
Cyanide μg/L EPA 335.4 5.0 ND --- 0.2 ---
Radiochemical Parameters
Gross Alpha pCi/L SM 7110 C --- 2.40 --- 15 ---
Gross Beta pCi/L EPA 900.0 --- 6.2 --- 4 mrem/yr ---
Radium, total gross pCi/L EPA 903.1 0.400 ND --- 5 ---
Radium-226 pCi/L EPA 903.1 0.200 ND --- --- ---
Radium-228 pCi/L EPA 904 0.400 ND --- --- ---
Radon-222 pCi/L SM 7500 RN --- 75.0 --- --- ---
Strontium-90 pCi/L EPA 905.0 0.600 ND --- --- ---
Tritium pCi/L EPA 906.0 323 ND --- --- ---
Uranium pCi/L EPA 200.8 0.26 0.84 --- 30 μg/L ---
aHolding time was exceeded.bSample was filtered; concentration represents dissolved constituent.CReported value is the action limit.
MBAS = Methylene blue active substancesmrem/yr = Millirem per year
NA = Not available; laboratory procedure is used.ND = Not detectedRL = Reporting limitSM = Standard method (Eaton et al., 2005)TU = Tritium Unit
Table B-1Field and Analytical Results, Analytical Methods, Reporting Limits, and Maximum
Contaminant Levels for Inorganic, Stable Isotopic, and Radiological Constituents in Groundwater Samples from Test Well SPR7005X and Monitor Well SPR7005M
(Page 3 of 3)
Constituent Name UnitAnalysisMethod RL
SPR7005X(184W111)7/10/2008
08:30
SPR7005M(184W512M)
8/22/200716:18
PrimaryMCL
SecondaryMCL

Appendix B
Southern Nevada Water Authority - Water Resources Division
B-4
Table B-2 Organic Compounds Analyzed in Groundwater Samples from Test Well SPR7005X,
Including the EPA Method, Reporting Limit, and Maximum Contaminant Level (Page 1 of 2)
*Chlorinated Pesticides by EPA 508 (μg/L)
Analyte RL MCL Analyte RL MCL Analyte RL MCL
Aldrin 0.050 --- Endosulfan II 0.010 --- PCB 1016 Aroclor 0.10 ---
BHC (Alpha) 0.010 --- Endosulfan sulfate 0.050 --- PCB 1221 Aroclor 0.10 ---
BHC (Beta) 0.050 --- Endrin 0.050 2 PCB 1232 Aroclor 0.10 ---
BHC (Delta) 0.050 --- Endrin aldehyde 0.050 --- PCB 1242 Aroclor 0.10 ---
Chlordane (tech) 0.10 2 Heptachlor 0.010 0.4 PCB 1248 Aroclor 0.10 ---
Chlorothalonil 0.050 --- Heptachlor Epoxide 0.010 0.2 PCB 1254 Aroclor 0.10 ---
4,4'-DDD 0.020 --- Hexachlorobenzene 0.50 1.0 PCB 1260 Aroclor 0.10 ---
4,4'-DDE 0.010 --- Hexachlorocyclopentadiene 0.050 50 Propachlor 0.50 ---
4,4'-DDT 0.020 --- Lindane 0.050 0.2 Toxaphene 1.0 3
Dieldrin 0.020 --- Methoxychlor 0.050 40 Trifluralin 0.010 ---
Endosulfan I 0.020 --- Polychlorinated biphenyls (PCBs) 0.50 0.5
*Purgeable Organic Compounds by EPA 524.2 (μg/L)
tert-Amyl methyl ether 3.0 --- Di-isopropyl ether 3.0 --- Methyl tertiary butyl ether (MTBE) 3.0 ---
Benzene 0.50 5 1,1-Dichloroethane 0.50 --- Naphthalene 0.50 ---
Bromobenzene 0.50 --- 1,2-Dichloroethane 0.50 --- n-Propylbenzene 0.50 ---
Bromochloromethane 0.50 --- 1,1-Dichloroethylene 0.50 5 Styrene 0.50 100
Bromodichloromethane 0.50 --- cis-1,2-Dichloroethylene 0.50 7 Tetrachloroethylene 0.50 5
Bromoform 0.50 --- trans-1,2-Dichloroethylene 0.50 70 1,1,1,2-Tetrachloroethane 0.50 ---
2-Butanone 5.0 --- Dichlorodifluoromethane 0.50 100 1,1,2,2-Tetrachloroethane 0.50 ---
n-Butylbenzene 0.50 --- 1,2-Dichloropropane 0.50 --- Toluene 0.50 1,000
sec-Butylbenzene 0.50 --- 1,3-Dichloropropane 0.50 5 1,2,3-Trichlorobenzene 0.50 ---
tert-Butylbenzene 0.50 --- 2,2-Dichloropropane 0.50 --- 1,2,4-Trichlorobenzene 0.50 70
tert-Butyl ethyl ether 3.0 --- 1,1-Dichloropropene 0.50 --- 1,1,1-Trichloroethane 0.50 200
Carbon tetrachloride 0.50 5 cis-1,3-Dichloropropene 0.50 --- 1,1,2-Trichloroethane 0.50 5
Chlorobenzene 0.50 100 trans-1,3-Dichloropropene 0.50 --- Trichloroethylene 0.50 5
Chloroethane 0.50 --- total-1,3-Dichloropropene 0.50 --- Trichlorofluoromethane 5.0 ---
2-Chloroethylvinyl ether 1.0 --- Ethylbenzene 0.50 700 1,2,3-Trichloropropane 0.50 ---
Chloroform 0.50 --- Hexachlorobutadiene 0.50 --- 1,1,2-Trichloro-1,2,2-trifluoroethane 5.0 ---
2-Chlorotoluene 0.50 --- 2-Hexanone 5.0 --- 1,2,4-Trimethylbenzene 0.50 ---
4-Chlorotoluene 0.50 --- Isopropylbenzene 0.50 --- 1,3,5-Trimethylbenzene 0.50 ---
Dibromochloromethane 0.50 --- p-Isopropyltoluene 0.50 --- Vinyl chloride 0.50 2
Dibromomethane 0.50 --- Methyl bromide 0.50 --- Xylene (m,p) isometric pair 1.0 ---
m-Dichlorobenzene 0.50 --- Methyl chloride 0.50 --- Xylenes, total 0.50 10,000
o-Dichlorobenzene 0.50 600 Methylene chloride 0.50 5 o-Xylene 0.50 ---
p-Dichlorobenzene 0.50 75 4-Methyl-2-pentanone 5.0 ---
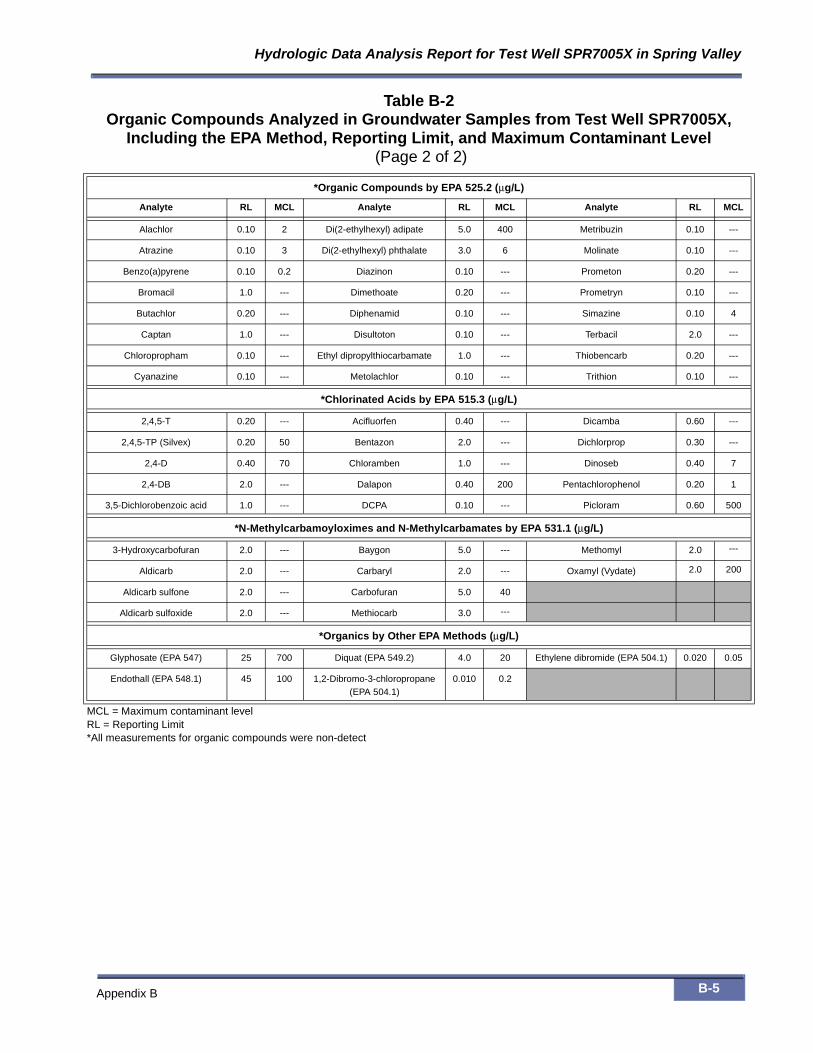
Hydrologic Data Analysis Report for Test Well SPR7005X in Spring Valley
Appendix B B-5
*Organic Compounds by EPA 525.2 (μg/L)
Analyte RL MCL Analyte RL MCL Analyte RL MCL
Alachlor 0.10 2 Di(2-ethylhexyl) adipate 5.0 400 Metribuzin 0.10 ---
Atrazine 0.10 3 Di(2-ethylhexyl) phthalate 3.0 6 Molinate 0.10 ---
Benzo(a)pyrene 0.10 0.2 Diazinon 0.10 --- Prometon 0.20 ---
Bromacil 1.0 --- Dimethoate 0.20 --- Prometryn 0.10 ---
Butachlor 0.20 --- Diphenamid 0.10 --- Simazine 0.10 4
Captan 1.0 --- Disultoton 0.10 --- Terbacil 2.0 ---
Chloropropham 0.10 --- Ethyl dipropylthiocarbamate 1.0 --- Thiobencarb 0.20 ---
Cyanazine 0.10 --- Metolachlor 0.10 --- Trithion 0.10 ---
*Chlorinated Acids by EPA 515.3 (μg/L)
2,4,5-T 0.20 --- Acifluorfen 0.40 --- Dicamba 0.60 ---
2,4,5-TP (Silvex) 0.20 50 Bentazon 2.0 --- Dichlorprop 0.30 ---
2,4-D 0.40 70 Chloramben 1.0 --- Dinoseb 0.40 7
2,4-DB 2.0 --- Dalapon 0.40 200 Pentachlorophenol 0.20 1
3,5-Dichlorobenzoic acid 1.0 --- DCPA 0.10 --- Picloram 0.60 500
*N-Methylcarbamoyloximes and N-Methylcarbamates by EPA 531.1 (μg/L)
3-Hydroxycarbofuran 2.0 --- Baygon 5.0 --- Methomyl 2.0 ---
Aldicarb 2.0 --- Carbaryl 2.0 --- Oxamyl (Vydate) 2.0 200
Aldicarb sulfone 2.0 --- Carbofuran 5.0 40
Aldicarb sulfoxide 2.0 --- Methiocarb 3.0 ---
*Organics by Other EPA Methods (μg/L)
Glyphosate (EPA 547) 25 700 Diquat (EPA 549.2) 4.0 20 Ethylene dibromide (EPA 504.1) 0.020 0.05
Endothall (EPA 548.1) 45 100 1,2-Dibromo-3-chloropropane(EPA 504.1)
0.010 0.2
MCL = Maximum contaminant levelRL = Reporting Limit*All measurements for organic compounds were non-detect
Table B-2 Organic Compounds Analyzed in Groundwater Samples from Test Well SPR7005X,
Including the EPA Method, Reporting Limit, and Maximum Contaminant Level (Page 2 of 2)

Appendix B
Southern Nevada Water Authority - Water Resources Division
B-6
References
Eaton, A.D., Clesceri, L.S., Rice, E.W., Greenberg, A.E., and Franson, M.H., eds., 2005, Standard methods for the examination of water and wastewater. Twenty-first edition: Washington, D.C., American Public Health Association.
Related Documents