Hydrologic Analysis Francisco Olivera, Ph.D., P.E. Srikanth Koka Department of Civil Engineering Texas A&M University

Hydrologic Analysis Francisco Olivera, Ph.D., P.E. Srikanth Koka Department of Civil Engineering Texas A&M University.
Dec 20, 2015
Welcome message from author
This document is posted to help you gain knowledge. Please leave a comment to let me know what you think about it! Share it to your friends and learn new things together.
Transcript
Hydrologic Analysis
Francisco Olivera, Ph.D., P.E.Srikanth Koka
Department of Civil EngineeringTexas A&M University

Watershed Delineation
Watershed delineation is the process of identifying the drainage area of a point.
For many years, Civil Engineers have been using USGS paper maps for watershed delineation.
The maps are in Universal Transverse Mercator (UTM) coordinates and in 1:24,000 scale.

Watershed Delineation
Water flows in the direction of the terrain steepest downhill slope. Streamlines (blue arrows) are orthogonal to the contour lines.
Drainage divides (red line) are found along the highest points of the terrain.
Streamlines do not flow towards drainage divides, and do not intersect them.
DEMs
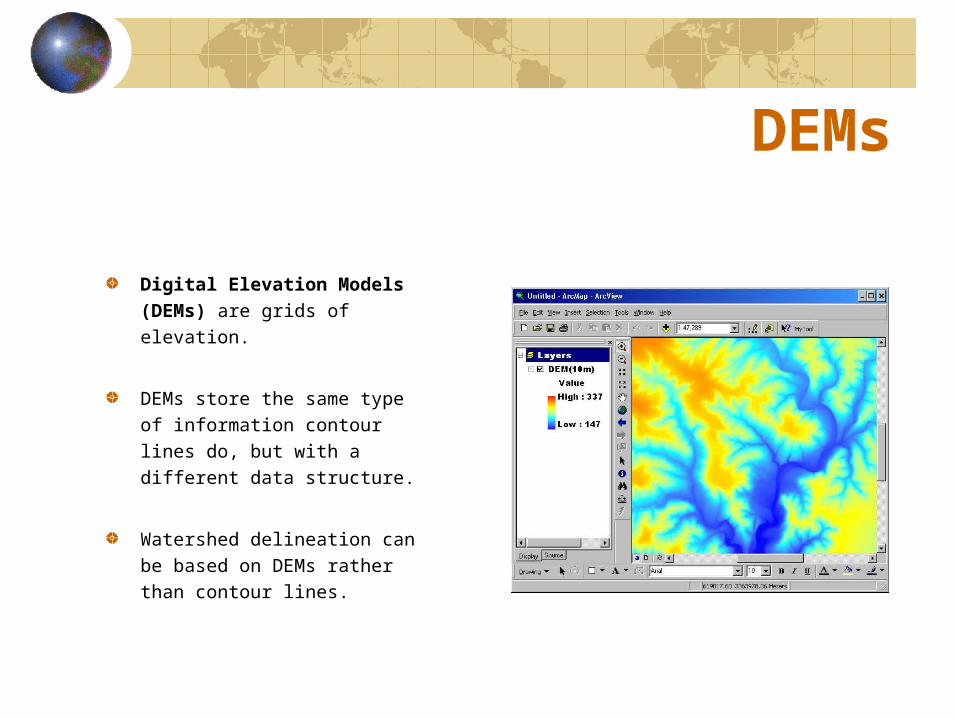
Digital Elevation Models (DEMs) are grids of elevation.
DEMs store the same type of information contour lines do, but with a different data structure.
Watershed delineation can be based on DEMs rather than contour lines.
30-Meter DEMs
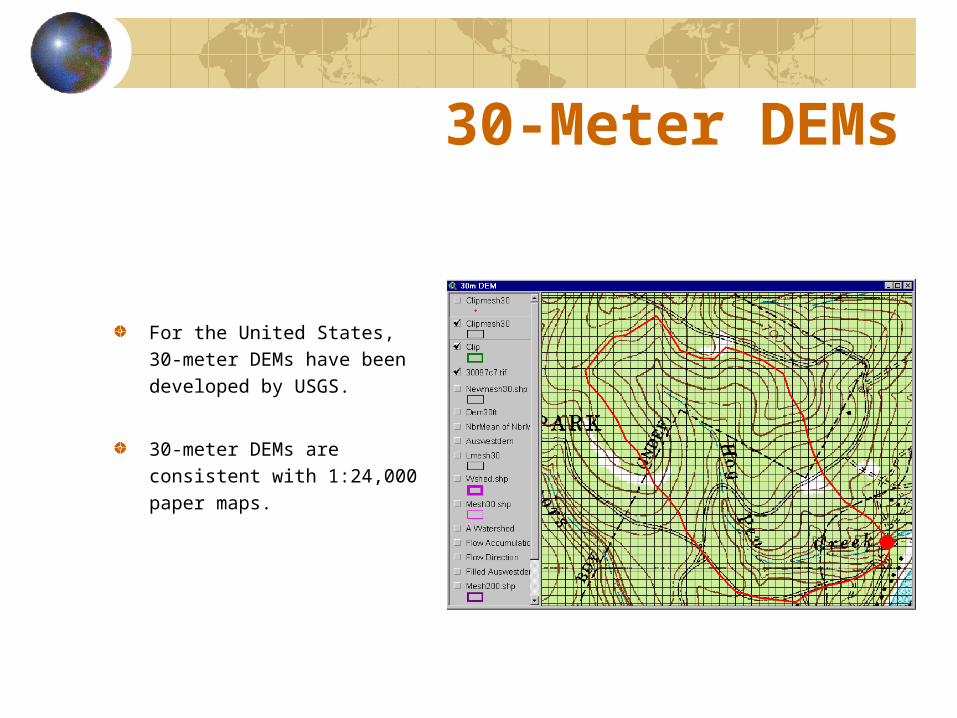
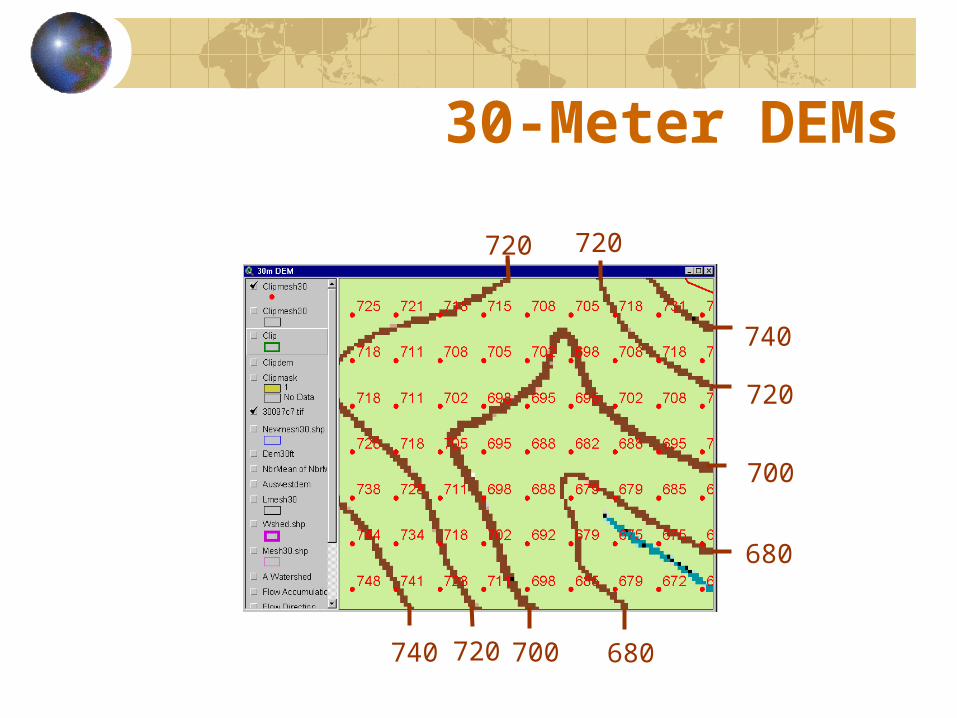
For the United States, 30-meter DEMs have been developed by USGS.
30-meter DEMs are consistent with 1:24,000 paper maps.
30-Meter DEMs
720
700
680
740
680700720740
720 720

30-Meter DEMs
700
680

30m ~ 90m
30-Meter and 3" DEMs

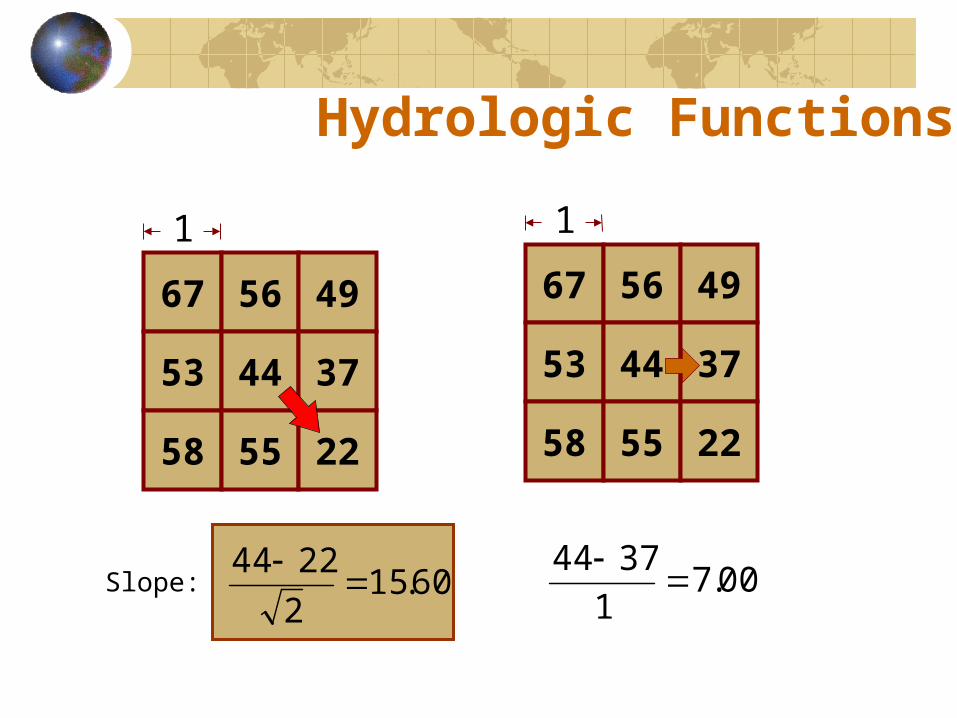
Hydrologic Functions
Flow direction codes
The eight-direction pour point algorithm (D-8) assigns a flow direction code to each cell, based on the steepest downhill slope as defined by the DEM.
The flow direction code indicates the cell – out of the eight neighbor cells – towards which the water flows.
Flow direction cannot be defined for cells within a terrain depression. DEMs have to be filled before determining flow directions.
67 56 49
53 44 37
58 55 22
1
67 56 49
53 44 37
58 55 22
1
60.152
2244
00.7
1
3744
Slope:
Hydrologic Functions

4 4
4 4
4 8
22
2 2 2
2
1 1 2
128
128 1 2 4
128 1 41
128
71 58
49 46
37 38
Hydrologic Functions
56
445369
74
78 72 69
4768
58 55
21
31
67
64 22
61 16
DEM Flow direction grid Flow network(not a grid)
Function: Flow directionArgument: DEM

DEM

Flow Direction

0 0
2 1
5 2
71 58
49 46
37 38
Hydrologic Functions
Function: Flow accumulationArgument: Flow direction
56
445369
74
78 72 69
4768
58 55
21
31
67
64 22
61 16
DEM Flow network(not a grid)
0 0 0
0 1 1
0
0
0 0 0
3 8
1 1 20 0
1 24
Flow accumulation grid
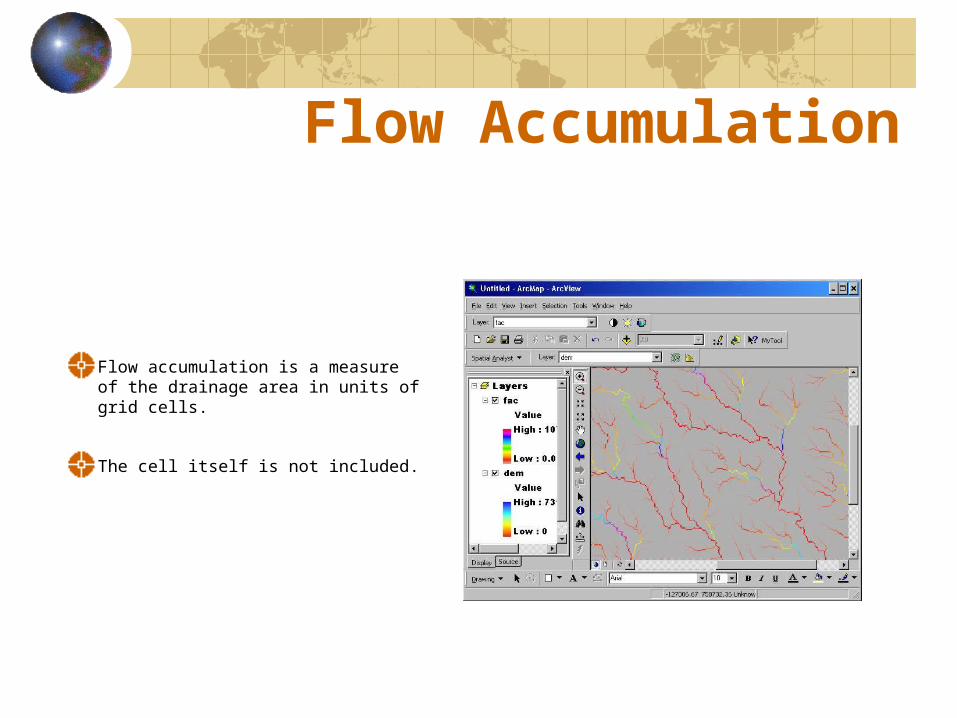
Flow Accumulation
Flow accumulation is a measure of the drainage area in units of grid cells.
The cell itself is not included.

71 58
49 46
37 38
56
445369
74
78 72 69
4768
58 55
21
31
67
64 22
61 16
0 0 0 0 0
0 1 1 2 1
0
0
0 0 0
3 8 5 2
1 1 20 0
1 24
Hydrologic Functions
DEM Flow accumulation(> 2 cells)
Process: Stream delineationArgument: Flow accumulation

Stream Network
All grid cells draining more than a user-defined threshold value are part of the stream network.
Red streams correspond to a lower threshold than the blue streams.

71 58
49 46
37 38
56
445369
74
78 72 69
4768
58 55
21
31
67
64 22
61 16
DEM Delineated streams Streams links
Hydrologic Functions
Function: Stream linksArgument: Delineated streams
Stream links are assigned an identification number randomly.

Stream links
Stream links are the segments of a stream channel connecting two successive junctions, a junction and an outlet, or a headwater and a junction.

71 58
49 46
37 38
56
445369
74
78 72 69
4768
58 55
21
31
67
64 22
61 16
DEM Streams links Outlets
Hydrologic Functions
Process: OutletsArgument: Stream links
Outlets are assigned the identification number of their link.

Watershed Outlets
The most downstream cells of the stream segments (yellow/brown cells) are watershed outlets.
User-defined points (red dots) are also watershed outlets.

Modified Stream Links
User-defined outlets modify the stream links by subdividing the segment in which they are located into two segments.
71 58
49 46
37 38
56
445369
74
78 72 69
4768
58 55
21
31
67
64 22
61 16
DEM Outlets Watersheds
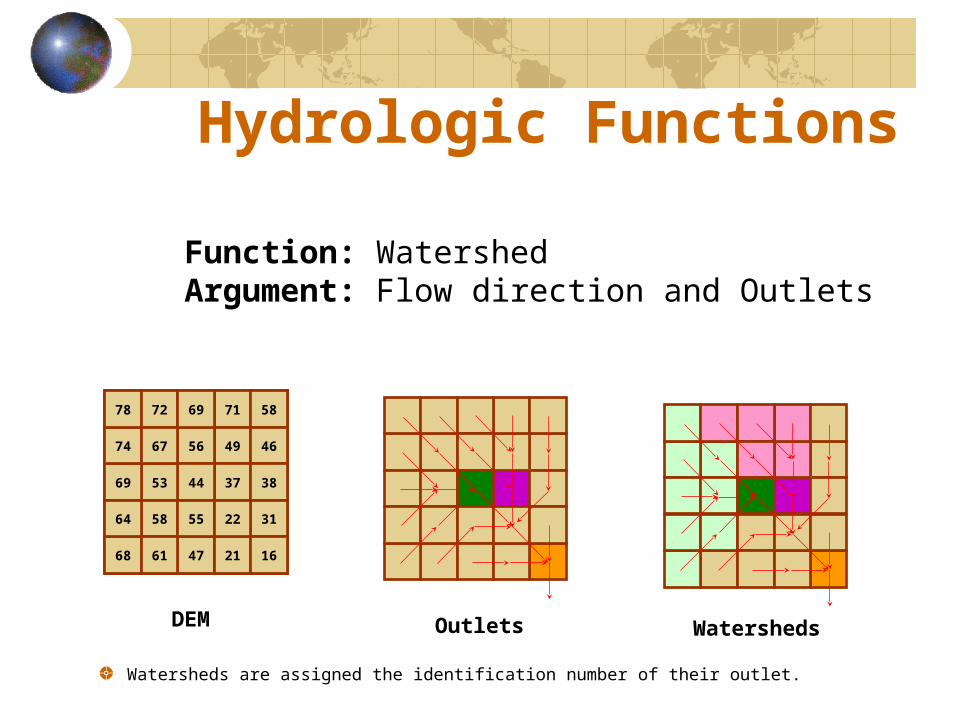
Hydrologic Functions
Function: WatershedArgument: Flow direction and Outlets
Watersheds are assigned the identification number of their outlet.

Watershed Delineation
The drainage area of each watershed outlet is delineated.

Raster to Vector Conversion
The grids of stream links and watersheds are vectorized to obtain stream line and watershed polygon feature classes.
Both feature classes include a field Grid-Code in their attribute tables, which stores the stream link and watershed identification number.
Since the identification number of the streams and their corresponding watershed is the same, the attribute tables can be related.

Merging Watersheds
Adjacent watershed polygons can be merged into a single polygon, if they share their outlet or one flows into the other.
Related Documents