HYDROGRAPH SEPARATION: GRAPHICAL AND TRACER METHODS (AND WHAT THEY REVEAL ABOUT URBAN WATERSHEDS) 19 February 2013 – Urban Hydrology

Welcome message from author
This document is posted to help you gain knowledge. Please leave a comment to let me know what you think about it! Share it to your friends and learn new things together.
Transcript

HYDROGRAPH SEPARATION:
GRAPHICAL AND TRACER METHODS
(AND WHAT THEY REVEAL ABOUT
URBAN WATERSHEDS)
19 February 2013 – Urban Hydrology

Why do hydrologists want to
separate hydrographs?
Where
does
surface
runoff and
streamflow
come
from?
Hydrographs are the principal
hydrologic data source available in
most watersheds
Hydrograph contains much information
about runoff sources in a watershed if we
can just figure out how to separate these
sources
Teaser: Studies using isotopes to
separate hydrographs revolutionized
ideas about runoff in the late 1970s
Text modified from Doug Burns and Tomas Vitvar: http://www.esf.edu/hss/IsotopeWS/Burns-Vitvar%20presentation/sld001.htm

Graphical Hydrograph Separation:
Graphical methods
prevailed from the 1930s
to 1960s
Graphical methods still
used by engineers and can
be used as a basis for
comparing runoff in
different watersheds, but
doesn’t reveal much about
processes
Text modified from Doug Burns and Tomas Vitvar: http://www.esf.edu/hss/IsotopeWS/Burns-Vitvar%20presentation/sld001.htm

West Creek at Pleasant Valley Road
Go to:
http://waterd
ata.usgs.gov/
oh/nwis/uv/?s
ite_no=4121
4108141210
0&PARAmeter
_cd=00065,0
0 060,00010)
Download
data from
November
11-18, 2012
Go to:
http://waterdata.usgs.gov/oh/nwis/uv
/?site_no=412141081412100&PARA
meter_cd=00065,00 060,00010)
Download data from November 11-18,
2012
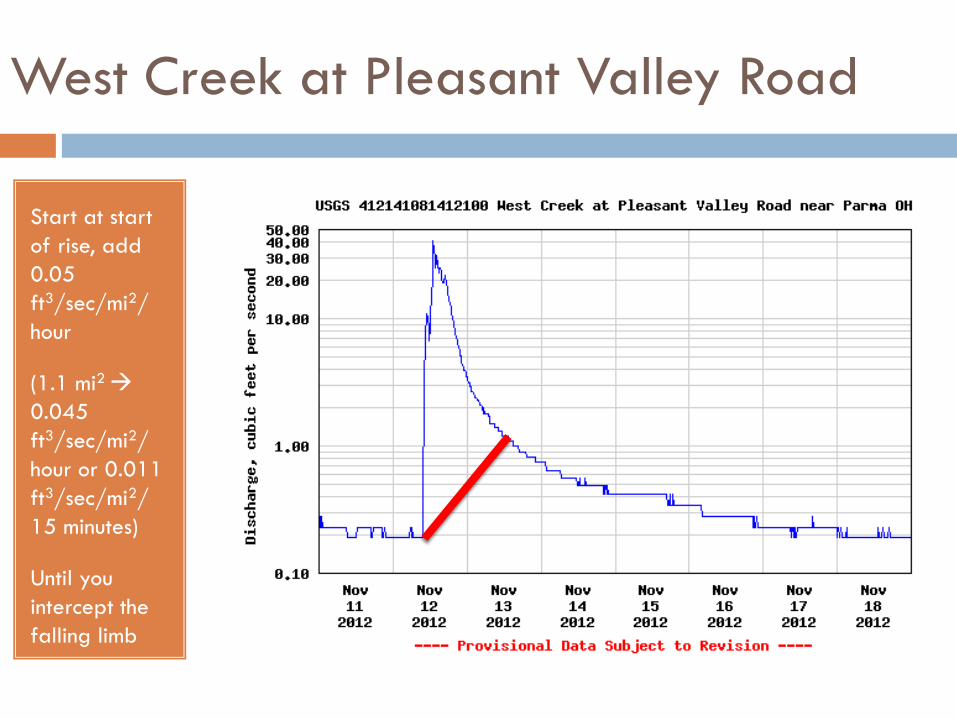
West Creek at Pleasant Valley Road
Start at start
of rise, add
0.05
ft3/sec/mi2/
hour
(1.1 mi2
0.045
ft3/sec/mi2/
hour or 0.011
ft3/sec/mi2/
15 minutes)
Until you
intercept the
falling limb
Go to:
http://waterdata.usgs.gov/oh/nwis/uv
/?site_no=412141081412100&PARA
meter_cd=00065,00 060,00010)
Download data from November 11-18,
2012
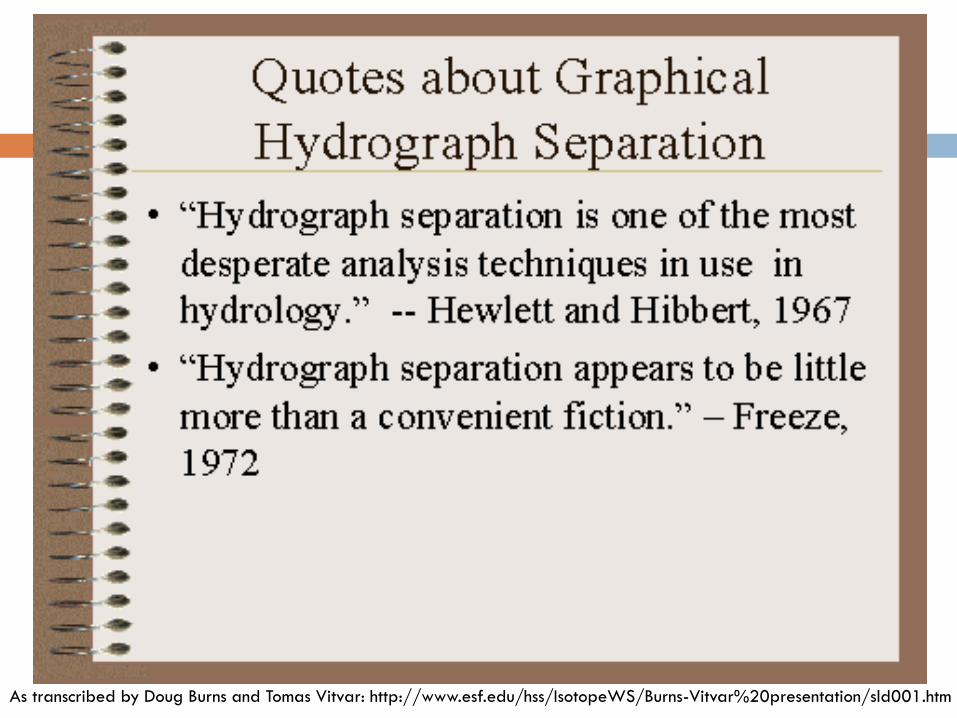
Quotes about graphical
hydrograph separation
http://www.esf.edu/hss/IsotopeWS/Bu
rns-Vitvar%20presentation/img019.gif
As transcribed by Doug Burns and Tomas Vitvar: http://www.esf.edu/hss/IsotopeWS/Burns-Vitvar%20presentation/sld001.htm

(data from McGlynn and McDonnell (2003)).
http://serc.carleton.edu/microbelife/research_methods/environ_sampling/stableisotopes.html
Hydrograph separation using
isotope tracers
Method takes advantage of conservative mixing of 18O and 2H
Two types
Time source – new and old water
Geographic source – contributions from different
landscape positions
Punchline: Isotope methods clearly show much of
stormflow or peakflow is old water stored in
catchment prior to storm (in forested watersheds)
Text modified from Doug Burns and Tomas Vitvar: http://www.esf.edu/hss/IsotopeWS/Burns-Vitvar%20presentation/sld001.htm

Stable Isotopes Tracing the Hydrologic
Cycle
Animations courtesy of E. Schauble (UCLA)
Cha
ract
eri
stic
vib
rations
of
H2O
Stable Isotopes of H2O
1H, 2H (2D), 16O, 17O, 18O
Vibrational frequency (energy) differences
Provide characteristic fingerprint of origin
Applications in hydrogeology
Provenance of water
Identify processes that formed waters
Separating hydrographs into “old” and “new”
water
Slide from E. Griffith, UT Arlington

Isotopologues of Water
Isotopologues are molecules that differ only in
their isotopic content. What are the isotopologues of
water?
2H = D
0.015%
1H
99.985%

Isotope Ratio notation
d = value ‰ ‘per mil’
O and H are normalized to SMOW –
standard mean ocean water
d18O = 0‰, d2H = 0‰
Positive vs. negative delta values
Isotopically heavy vs. light

Isotopic fractionation: Detectable
change in the ratio of an isotopic pair
Due to mass differences of isotopes—affect
vibrational frequency of atom which affects
ability to make (& break) bonds w/
surrounding environment
18O and 2H content of water changes only
through fractionation associated with phase
changes
Conservative behavior – once isotopes
become part of water molecule, they change
only through mixing

Fractionation effects associated
with phase changes of H2O
Evaporation – vapor that forms is lighter than
surrounding water
Condensation – liquid that forms is heavier than
surrounding water
So, precipitation selectively removes 18O and 2H from the
vapor phase
Snowmelt – residual snowpack becomes isotopically
heavier as light isotopes melt out first

Fractionation effects associated
with phase changes of H2O
Evaporation – vapor that forms is lighter than
surrounding water
Condensation – liquid that forms is heavier than
surrounding water
So, precipitation selectively removes 18O and 2H from the
vapor phase
http://serc.carleton.edu/microbelife/research_methods/environ_sampling/stableisotopes.html
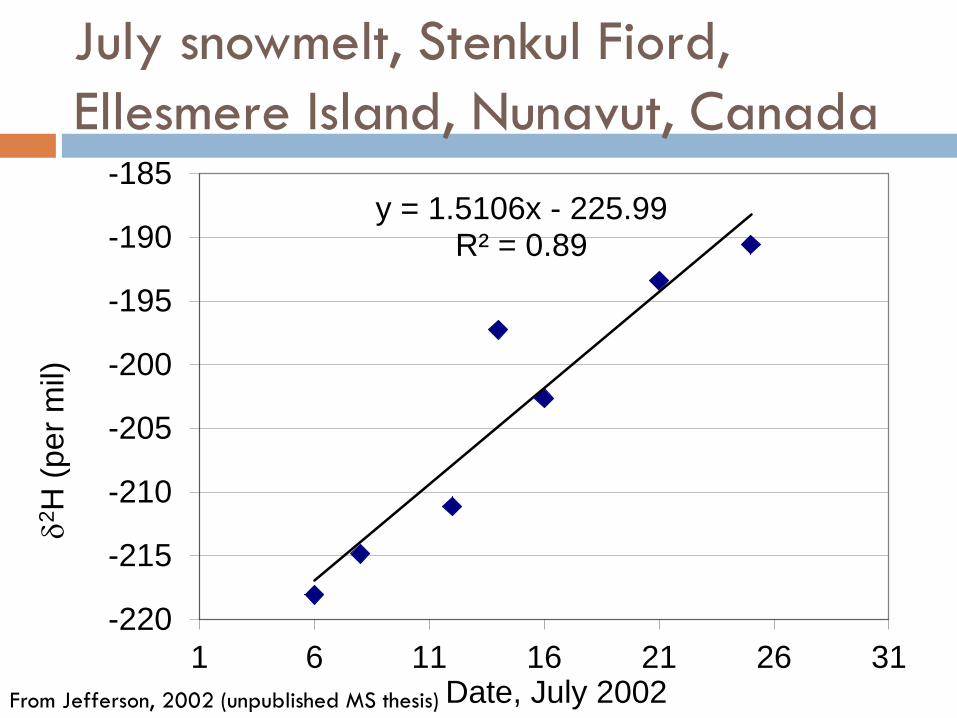
July snowmelt, Stenkul Fiord,
Ellesmere Island, Nunavut, Canada
y = 1.5106x - 225.99 R² = 0.89
-220
-215
-210
-205
-200
-195
-190
-185
1 6 11 16 21 26 31
d2H
(p
er
mil)
Date, July 2002 From Jefferson, 2002 (unpublished MS thesis)

Geography and seasonality of 18O
and 2H content of precipitation
Precipitation becomes lighter as air mass
moves inland
Precipitation becomes lighter with
increasing elevation – orographic effect
Precipitation becomes lighter towards the
poles and is lighter in winter than summer
Text modified from Doug Burns and Tomas Vitvar: http://www.esf.edu/hss/IsotopeWS/Burns-Vitvar%20presentation/sld001.htm

Fractionation effects associated
with phase changes of H2O
Evaporation – vapor that forms is lighter than
surrounding water
Condensation – liquid that forms is heavier than
surrounding water
So, precipitation selectively removes 18O and 2H from the
vapor phase
http://serc.carleton.edu/microbelife/research_methods/environ_sampling/stableisotopes.html

Seasonality of precipitation
isotopes, Eureka, Nunavut, Canada
-350
-300
-250
-200
-150
-100
0
2
4
6
8
10
12
14
J F M A M J J A S O N D
dD
(p
er
mil
)
Pre
cip
ita
tio
n (
mm
)
Month
Precipitation delta DData from GNIP, figure by Jefferson (2002)
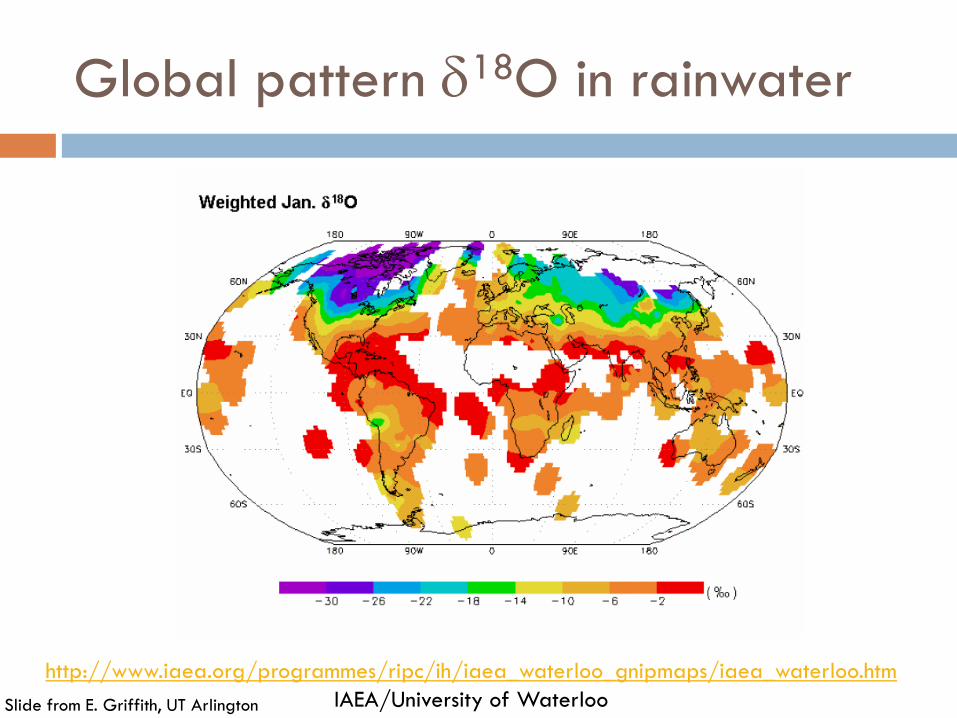
Global pattern d18O in rainwater
http://www.iaea.org/programmes/ripc/ih/iaea_waterloo_gnipmaps/iaea_waterloo.htm
IAEA/University of Waterloo Slide from E. Griffith, UT Arlington

Precipitation: Equilibrium & the
“Global Meteoric Water Line”
Sam Epstein
and Toshiko
Maveda,1953
Harmon Craig
(1961)
defined the
relationship
between 18O
and 2H in
worldwide
fresh surface
waters.
Craig (1961); Rozanski et al. (1992)
Slide from E. Griffith, UT Arlington

Evaporation:
Humidity & Local Meteoric Water Lines
Slide from E. Griffith, UT Arlington

Isotopes in storm-discharge analysis
Iqbal, M.Z.
1998.
Application of
environmental
isotopes in
storm-
discharge
analysis of
two
contrasting
stream
channels in a
watershed,
Wat.
Res.32(10):
2959-2968
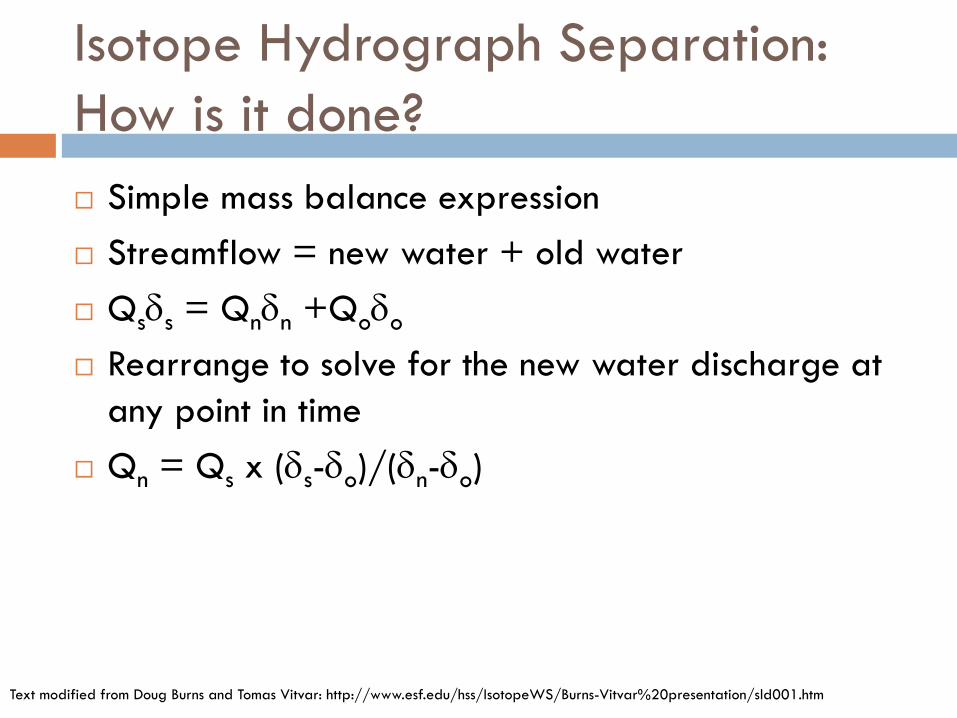
Isotope Hydrograph Separation:
How is it done?
Simple mass balance expression
Streamflow = new water + old water
Qsds = Qndn +Qodo
Rearrange to solve for the new water discharge at
any point in time
Qn = Qs x (ds-do)/(dn-do)
Text modified from Doug Burns and Tomas Vitvar: http://www.esf.edu/hss/IsotopeWS/Burns-Vitvar%20presentation/sld001.htm

Isotopes in storm-discharge analysis
Iqbal, M.Z.
1998.
Application of
environmental
isotopes in
storm-
discharge
analysis of
two
contrasting
stream
channels in a
watershed,
Wat.
Res.32(10):
2959-2968

Isotopes in storm-discharge analysis
Iqbal, M.Z.
1998.
Application of
environmental
isotopes in
storm-
discharge
analysis of
two
contrasting
stream
channels in a
watershed,
Wat.
Res.32(10):
2959-2968

Assumptions of Isotope Hydrograph
Separations
Significant differences in isotopic
content of new and old water
New and old water content has a
constant isotopic content in space and
time, or variation can be accounted for
Contributions of water with with isotopic
content different from old water
negligible – soil water, stored surface
water, multiple sources of gw
Text modified from Doug Burns and Tomas Vitvar: http://www.esf.edu/hss/IsotopeWS/Burns-Vitvar%20presentation/sld001.htm

General results of hydrograph
separation studies
Old water is typically >50% of
peakflow, 60-80% of total storm runoff
at most sites (but humid, forested site
bias)
Agricultural and urban watersheds are
dominated by new water at peak flow
Wetlands and impoundments promote
high proportion of old water in
stormflow
Text modified from Doug Burns and Tomas Vitvar: http://www.esf.edu/hss/IsotopeWS/Burns-Vitvar%20presentation/sld001.htm
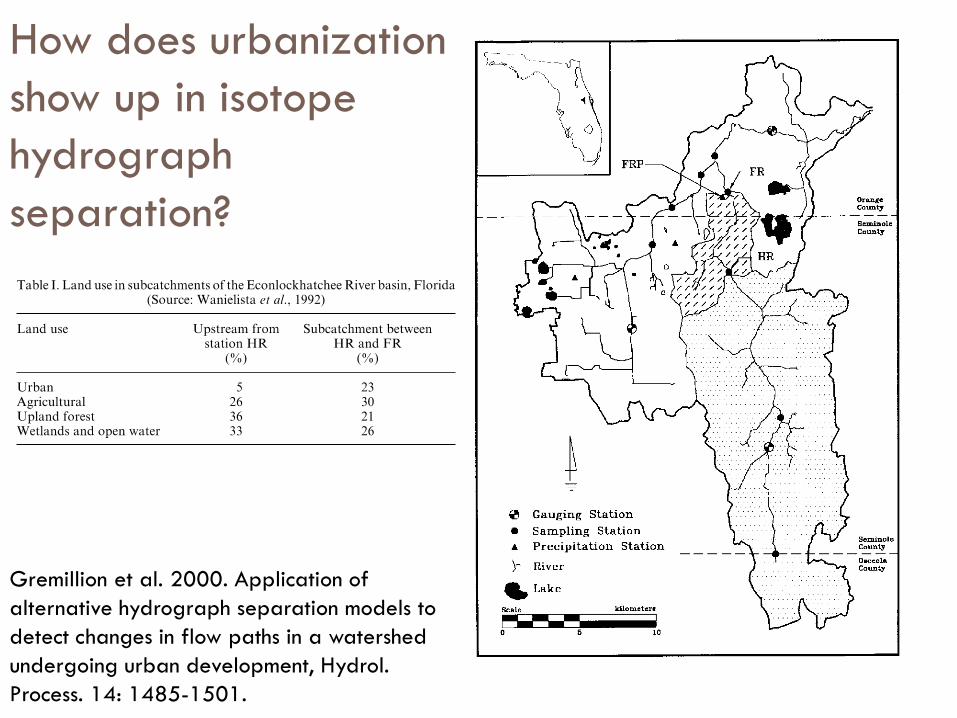
How does urbanization
show up in isotope
hydrograph
separation?
Gremillion et al. 2000. Application of
alternative hydrograph separation models to
detect changes in flow paths in a watershed
undergoing urban development, Hydrol.
Process. 14: 1485-1501.

How does
urbanization
show up in
isotope
hydrograph
separation?
Gremillion et al. 2000. Application of
alternative hydrograph separation models
to detect changes in flow paths in a
watershed undergoing urban
development, Hydrol. Process. 14: 1485-
1501.

Urbanizing Florida watershed
Downstream of urbanizing subcatchment
76% of river flow was “old” water
Only 47% of water entering river in the urbanizing
subcatchment was “old” water
Why are these the “expected” results?
Why is hard to find isotope hydrograph separations in
urban watersheds?
Gremillion et al. 2000. Application of alternative hydrograph separation models to detect changes in flow paths in a watershed undergoing urban
development, Hydrol. Process. 14: 1485-1501.
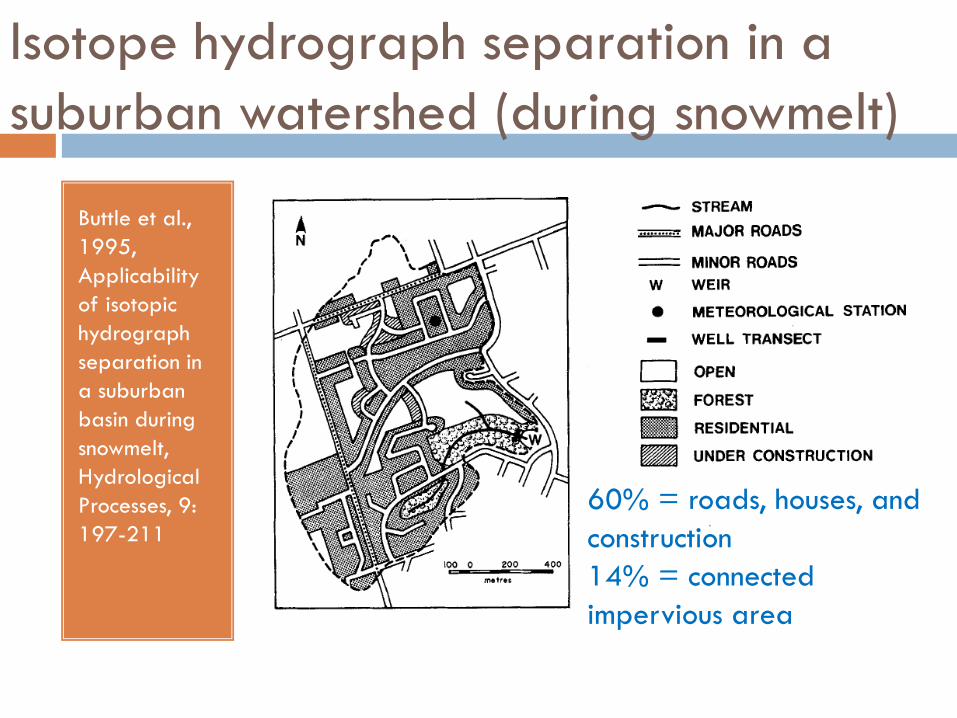
Isotope hydrograph separation in a
suburban watershed (during snowmelt)
Buttle et al.,
1995,
Applicability
of isotopic
hydrograph
separation in
a suburban
basin during
snowmelt,
Hydrological
Processes, 9:
197-211
60% = roads, houses, and
construction
14% = connected
impervious area

Isotope hydrograph separation in a
suburban watershed (during snowmelt)
Buttle et al., 1995, Applicability of isotopic
hydrograph separation in a suburban basin during
snowmelt, Hydrological Processes, 9: 197-211
Problem 1: What to use as pre-event isotope content?
Baseflow – maybe
none in an urban
watershed?
Near stream
groundwater
– not well
mixed?
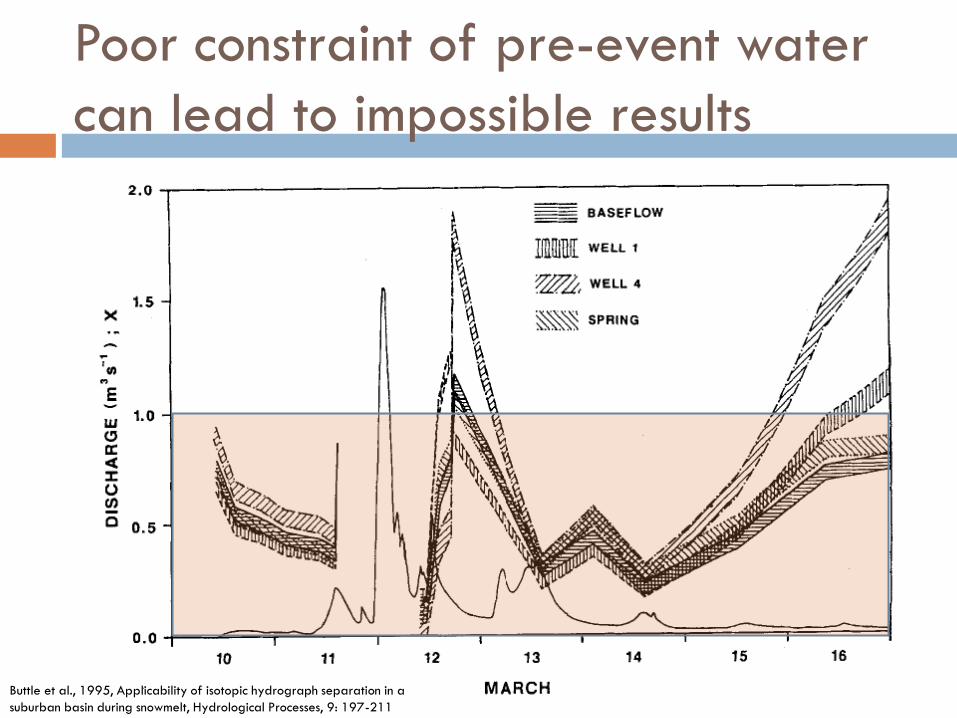
Poor constraint of pre-event water
can lead to impossible results
Buttle et al., 1995, Applicability of isotopic hydrograph separation in a
suburban basin during snowmelt, Hydrological Processes, 9: 197-211

Isotope hydrograph separation in a
suburban watershed (during snowmelt)
Buttle et al., 1995, Applicability of isotopic
hydrograph separation in a suburban basin during
snowmelt, Hydrological Processes, 9: 197-211
Problem 2: What to use as event isotope content?
Rainfall?
But also snowmelt
Pre-event snowpack? Or a snowmelt time series?
But not even distribution, % melted, % directly connected to stream
Runoff to storm sewer?
Still need to worry about spatial variability

Poor constraint of event water can
lead to impossible results.
Buttle et al., 1995, Applicability of isotopic hydrograph separation in a
suburban basin during snowmelt, Hydrological Processes, 9: 197-211
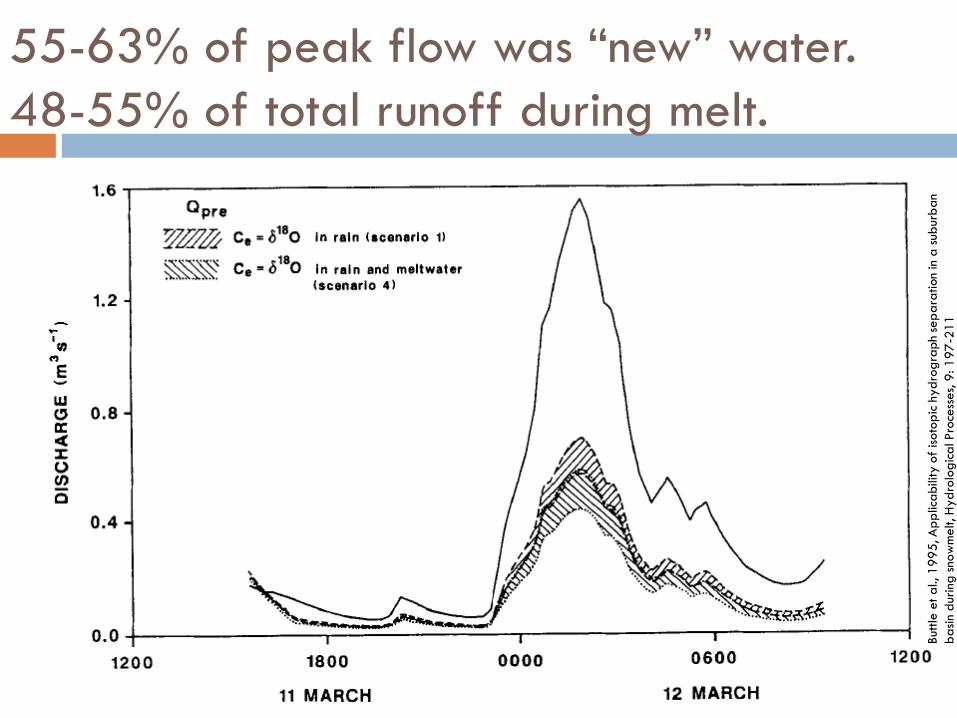
55-63% of peak flow was “new” water.
48-55% of total runoff during melt.
Buttle
et a
l., 1
99
5, A
pp
licabili
ty o
f isoto
pic
hyd
rog
raph
sep
ara
tion in a
sub
urb
an
ba
sin d
uring
snow
melt, H
yd
rolo
gic
al Pro
cess
es, 9
: 1
97
-211

Challenges for using isotopes as
urban hydrology tracers
Hibbs et al. 2012 Origin of Stream Flows at the Wildlands-Urban
Interface, Santa Monica Mountains, California, USA, Environmental
and Engineering Geosciences, 18(1): 51-64.
Role of connected
and disconnected
impervious surfaces
Potential for imported
water from leaky
pipes, irrigation, &
wastewater effluent
But these challenges
can also make them
useful “forensic” tools

Heterogeneity in small
(~0.5 km2) watersheds
TJ
DT-ds CF-ds
CF-us DT-us
Sampling date
Jeff
ers
on,
unp
ublish
ed
da
ta

New methods and approaches
More applications in disturbed settings
Can use solute tracers – but conservative mixing
assumption may not be met
End-member Mixing Analysis (EMMA) – more complex
methods of separating hydrographs using multiple
tracers simultaneously
The readings by Sidle and Pellerin are great examples of
applying isotopes & tracers to problems in urban hydrology
Text modified from Doug Burns and Tomas Vitvar: http://www.esf.edu/hss/IsotopeWS/Burns-Vitvar%20presentation/sld001.htm
Related Documents