Hydrogeochemical Processes Governing Uranium Mobility: Inferences from the Anthropogenically Disturbed, Semi-arid Region of India anita punia ( [email protected] ) Indian Institute of Technology Guwahati https://orcid.org/0000-0002-2572-7463 Rishikesh Bharti Indian Institute of Technology Guwahati Pankaj Kumar Inter-University Accelerator Centre Research Article Keywords: Heavy metals, Geochemical process, Uranium mobilisation, Khetri Copper Belt Posted Date: April 30th, 2021 DOI: https://doi.org/10.21203/rs.3.rs-466586/v1 License: This work is licensed under a Creative Commons Attribution 4.0 International License. Read Full License Version of Record: A version of this preprint was published at Archives of Environmental Contamination and Toxicology on August 4th, 2021. See the published version at https://doi.org/10.1007/s00244-021- 00879-3.

Welcome message from author
This document is posted to help you gain knowledge. Please leave a comment to let me know what you think about it! Share it to your friends and learn new things together.
Transcript

Hydrogeochemical Processes Governing UraniumMobility: Inferences from the AnthropogenicallyDisturbed, Semi-arid Region of Indiaanita punia ( [email protected] )
Indian Institute of Technology Guwahati https://orcid.org/0000-0002-2572-7463Rishikesh Bharti
Indian Institute of Technology GuwahatiPankaj Kumar
Inter-University Accelerator Centre
Research Article
Keywords: Heavy metals, Geochemical process, Uranium mobilisation, Khetri Copper Belt
Posted Date: April 30th, 2021
DOI: https://doi.org/10.21203/rs.3.rs-466586/v1
License: This work is licensed under a Creative Commons Attribution 4.0 International License. Read Full License
Version of Record: A version of this preprint was published at Archives of Environmental Contaminationand Toxicology on August 4th, 2021. See the published version at https://doi.org/10.1007/s00244-021-00879-3.

1
Hydrogeochemical processes governing Uranium mobility: Inferences from 1
the anthropogenically disturbed, semi-arid region of India 2
Anita Puniaa*, Rishikesh Bhartia* and Pankaj Kumarb 3
a Department of Civil Engineering, Indian Institute of Technology, Guwahati, India 4
bInter-University Accelerator Centre (IUAC), New Delhi 5
Corresponding author email: [email protected]; [email protected] 6
7
Abstract 8
Khetri Copper Belt, Rajasthan is anthropogenically active and geologically belongs to the Delhi supergroup. To 9
study the active geochemical processes controlling the elemental mobility, representative groundwater samples 10
were analysed for heavy metals and radionuclide (U). A maximum U concentration (average 87 µgL-1) is observed 11
in the quartzite mine zone whereas minimum (average 13 µgL-1) is found to be in the copper mine zone samples. 12
Despite the presence of Jaspura and Gothra granitoid in the copper mine zone, the abundance of U is low 13
suggesting the scavenging of U by sulphides or iron oxides. Additionally, at the confluence of two geological 14
groups, Fe concentration is found high with a low concentration of U which further confirms scavenging of U. In 15
the region, aquifers are shallow which supports the weathering of minerals. Thus, a high concentration of U in 16
groundwater is attributed to mineral dissolution, faults or fractures. It is evident from the results that in the absence 17
of iron-bearing sulphides, U concentration in groundwater would be very high compared to the current 18
concentration. It also indicates low concentration of U in the copper mine zone, area is covered with abundant 19
quantity of Fe sulphide rich waste. The present study recommends further research to understand the feasibility 20
of mining waste for the removal of U contamination from groundwater. 21
22
Keywords Heavy metals; Geochemical process; Uranium mobilisation; Khetri Copper Belt 23
24
Introduction 25
Uranium (U) is a carcinogenic radionuclide and excessive consumption poses a potential health risk to humans 26
(Blantz et al. 1985). U accumulates in organs and tissues of the human body and causes various health hazards 27
(Russell and Kathren 2004; Wei et al. 2019). It leads to chronic disorders of the liver, kidney and bones (Craft et 28
al. 2004; Brugge and Buchner 2011; Katz 2014). The most important route of U entry is through drinking water. 29
World Health Organisation (WHO) recommends 30 µg L-1 as a permissible limit for drinking water (WHO 2011) 30
exceeding this permissible limit could cause chronic health impacts on human beings. 31
Sources of ions in groundwater are being controlled by both anthropogenic and geogenic processes. 32
Anthropogenically, contamination of groundwater due to U mines is reported in different countries such as Poland 33
(Kozak et al. 2013), France (Cuvier et al. 2015), Portugal (Neiva et al. 2014), Spain (Villa et al. 2011) and Serbia 34
(Momčilović et al. 2013). A high concentration of U in groundwater is attributed to the abundance of U-rich 35

2
mining waste. Simultaneously, some studies suggested geogenic origin of U in groundwater worldwide namely 36
Korea (Shin et al. 2016), USA (Burow et al. 2017), Switzerland (Stalder et al. 2012), Germany (Liesch et al. 2015) 37
and China (Wu et al. 2014). 38
In India high concentration of U is found in the states of Punjab (Sharma et al., 2019), Himachal Pradesh (Rani et 39
al. 2013), Jharkhand (Patra et al. 2013), Tamil Naidu (Selvi et al. 2016) and Jammu and Kashmir (Sharma et al. 40
2017). A high concentration of U is observed in different parts of Rajasthan specially in Sikar (Duggal et al. 2016), 41
Jaipur, Ajmer, Tonk, Kota, Jodhpur, and Barmer (Coyte et al. 2019). Hence it is important to understand the 42
geochemical processes governing U mobility in natural conditions. 43
The high content of uranium is found in the forms of carbonates (Andersonite, Bayleyite and Grimselite), 44
phosphates (Autunite and Torbernite), oxides (Metaschoepite, Metastudtite and Uraninite) and silicates (Uraninite 45
and Swamboite) (Deditius et al. 2008; Gorman-Lewis et al. 2007; Gorman-Lewis et al. 2008a & b; O'Brien and 46
Williams 1983; Ray et al. 2011; Locock and Burns 2003; Gorman-Lewis et al. 2009). Groundwater depletion 47
leads to the dissolution of minerals and enhances elemental mobility. Uraninite is insoluble and is readily oxidized 48
through rock-water interactions to soluble uranyl ions (U(VI)O22+) through dissolution, complex formation and 49
desorption-sorption (Tricca et al. 2000). Under anoxic conditions reduced sulfur and iron species may reduce 50
U(VI) to U3O8/U4O9/UO2 (Hua and Deng, 2008) (Eq. 1-4). 51 𝑈𝑂22++≡ 𝐹𝑒𝑆 ↔≡ 𝑆2− − 𝑈𝑂22+ + 𝐹𝑒2+ --(1) 52 ≡ 𝑆2− − 𝑈𝑂22+ ↔ 𝑆0(𝑠) − 𝑈𝑂2(𝑠) --(2) 53 𝐹𝑒𝑆(𝑠) + 𝐻2𝑂 ↔ 𝐹𝑒2+ + 𝐻𝑆− + 𝑂𝐻− --(3) 54 𝑈𝑂22+ +𝐻𝑆− ↔ 𝑈𝑂2(𝑠) − 𝑆0(𝑠) + 𝐻+ --(4) 55
Natural factors such as geology and geochemical processes such as ion exchange, precipitation, complexation or 56
redox reaction play an important role in releasing the U from minerals to groundwater. Migration of U through 57
sulphide, silicate and carbonate-rich geological setup influence the chemical composition of groundwater. In the 58
mining region dissolution of sulphides contaminates groundwater with a high concentration of heavy metals 59
(Tomiyama et al. 2019; Cánovas et al. 2016). Sulphides specifically Fe, affects the mobility of U by adsorbing on 60
its surface through substitution (Cumberland et al. 2016) or ion exchange process (Jang et al. 2008). In contrast, 61
Paradis et al. (2016) suggested reduced sulfur-bearing species are not fully effective to limit the mobility of U. In 62
the carbonate-rich region, adsorption of U on soil decreases significantly because of the formation of negatively-63
charged uranyl carbonate (Giblin et al. 1981). 64
Geological features such as fractures and faults also create oxidising conditions. Under oxic conditions dissolution 65
of Fe-rich minerals increases and thus in groundwater (Smith and Roychoudhury 2013). Groundwater present in 66
the fracture zone is prone to more contamination. Fracture zones yield most of the water and are also helpful in 67
locating the available water resources (Banks et al., 1992). The iron-bearing minerals adsorb and immobilize the 68
U(VI)-bearing species at circumneutral pH under oxidizing conditions (Li and Kaplan 2012). U gets mobilise in 69
the presence of oxygen and nitrate in groundwater (Watson et al. 2013). 70
Due to the complex behaviour of U, geochemical processes governing the U mobility in groundwater are difficult 71
to understand. Considering this the region active for mining for different types of minerals such as granite, 72

3
quartzite, and copper is selected. The selected study area would be helpful in better understanding the perspectives 73
of U mobility under the influence of different types of anthropogenic and geogenic factors. The main aim is to 74
understand (1) the impact of mining on the concentration of Fe, Mn and U and (2) understanding the perspectives 75
of U mobility under the influence of different types of anthropogenic and geogenic factors. 76
77
Study Area 78
The study area is well known for copper mines and it is located in the Jhunjhunu district of the Indian state 79
Rajasthan (Fig. 1a). It is located at an altitude of approximately 370 m above mean sea level with N 28˚04.070 80
latitudes and E 75˚49.294 longitudes. The region is famous as a Khetri Copper Belt (KBC) since historical times 81
and it extends from Singhana (north) to Raghunathgarh (South) which is~80 km in length. Rocks of Khetri 82
complex are comprises of metasedimentary and igneous intruded by granitoids (Sarkar and Dasgupta 1980; Gupta 83
et al. 1998). 84
Geologically, the study area falls in the Delhi supergroup and is divided into northern (North Delhi fold belt) and 85
southern (South Delhi fold belt) parts by Kantli fault (NW-SE transverse) (Gupta et al. 1998). Rocks of the 86
supergroup undergoes many folding and polyphase metamorphism (Kaur et al. 2012). The Delhi Supergroup rocks 87
are divided into two groups based on age i.e. an older Alwar (dominate in psammite) and a younger Ajabgarh 88
group (dominate in pelites) (Heron 1923; Das Gupta 1968). Most of the region is covered by the Ajabgarh group 89
which is formed of metamorphosed argillites and calcareous followed by the Alwar group which dominantly 90
consists of arenaceous. The Ajabgarh group is composed of schists and phyllites and intruded by basic rocks such 91
as granites and amphibolites. The Alwar group is made up of various types of rocks and the composition varies 92
from pure ortho-quartzites to arkose with bands of magnetite, hematite and amphibole. At the confluence of 93
different lithological units (Ajabgarh and Alwar) major faults and fractures are observed (Roy Chowdhury and 94
Das Gupta 1965). The juncture of Alwar and Ajabgarh is also enriched in iron oxide-copper-gold deposits (Knight 95
et al. 2002). The metasomatic alternation of granites in the region are enriched in U and rare earth elements 96
mineralization (Kaur et al. 2014). 97
Methodology 98
Sampling 99
The groundwater samples were collected in May 2019 following the sampling protocols. The region is famous 100
for copper (Khetri Nagar) mines but quartzite (Ishakpura) and granites (Papurana) mines are also active in the 101
area. The sampling locations were categorized into 3 zones i.e. copper mine zone (CMZ), quartzite mine zone 102
(QMZ) and granite mine zone (GMZ) depending on the type of mine. A total of 32 groundwater samples i.e. 7, 103
13 and 12 were collected from QMZ, CMZ and GMZ respectively. Considering each mine as a centre point, the 104
sampling locations were distributed systematically in North, East, South and West directions. From each direction, 105
a total of approximately 3 samples were collected after the interval of 2-3 km. The main constraint of sampling 106
was the non-availability of functional hand-pumps. To avoid contamination due to the pipeline the groundwater 107
pumped during the initial first 5 minutes was discarded. 108

4
For the perseveration of water samples pH is maintained below 2 by adding few drops of concentrated Supra-pure 109
HNO3 (Radojevic and Bashkin 1999). After the addition of HNO3, the samples were filtered using standard pore 110
size 0.45 μm syringe filters at the sampling site. Before the sampling, the sample bottles were washed with Milli-111
Q ultrapure and the sample itself to avoid contamination. Parameters such as pH, EC and temperature of the 112
samples were measured in-situ using a portable pH meter (Hanna instrument, H196107). 113
Elemental and statistical Analysis 114
The groundwater analysis for Fe, Mn and radionuclide (238U) was done using Inductively coupled plasma mass 115
spectrometry (ICP-MS) at Inter-University Accelerator Centre (IUAC), New Delhi. The ICP-MS was calibrated 116
using standard solutions of 1, 20, 50 and 100 µg/L prepared from 1000 µgL-1 multi-element stock solution (1000 117
µgL-1) via dilution process. For QA/QC, standards namely DGH, MBH, JB-1a and AMH were used (Rathi et Al. 118
1994; Imai et Al. 1995; Saini et Al. 2013). To assess the precision and accuracy during the analysis elemental 119
concentration in the blank (Milli Q prepared from 18.2 MΩ·cm Ultrapure, Sigma Aldrich) and standards were 120
measured after every 10 samples. The elemental detection limit varies from 0.1-1000 µg/L for Fe, Mn and 121
radionuclide. 122
The statistical parameters such as average, standard deviation, and median were calculated for the interpretation 123
of data. ArcGIS 10.6.1 was used for locating the sampling locations on the geological map using GPS locations. 124
The inverse distance weighting (IDW) method was used for the multivariate interpolation of U concentration. 125
Graphs were plotted using the Grapher software (version 10). 126
Risk assessment 127
Drinking water containing excessive U for a longer duration adversely affects kidneys and bones (Zamora et al. 128
1998; Kurttio et al. 2005). The risk caused by excessive intake of U is calculated in terms of Average Daily Dose 129
(ADD) via equation 5 (WHO 2011): 130
U×DWI×EF×EDADD=
LE×BW --5 131
The full form of used abbreviation are as follows U= uranium concentration (mg/L), DWI= Daily Intake of Water 132
(4.05 L per day) (Saini et al. 2016), EF = Exposure Frequency (350 days per year) (USEPA 1999), ED = Exposure 133
Duration (65 years) (WHO, 2011), LE = Life Expectancy (65 years with 365 days per year i.e. 23,725 days) and 134
BW = Body Weight (53 kg of an adult Indian standard person) (Sharma et al. 2017). 135
Hazard Quotient (HQ) indicates the probable health risk caused by the ingestion of uranium on the consumption 136
of contaminated water. HQ values less than 1 suggest no adverse health effects due to the consumption of uranium 137
contaminated water (AERB 2004) and it was calculated using equation 6. 138
ADDHQ=
RD --6 139
where RD indicates the Reference Dose. 140
Results and discussions 141

5
Variation in concentration of heavy metals and U 142
U concentration varies from 0.03 to 430 µgL-1 with an average of 37 µgL-1 indicating high contamination in the 143
region. U concentration exceeds or near the WHO permissible limit (30 µgL-1) at most of locations. It is observed 144
high at all the sites falling in quartzites mine zone with an average concentration of 87 µgL-1. Fe concentration is 145
also observed very high with an average concentration of 2.48±3.31 ppm. Fe exceeds BIS permissible limit (0.3 146
ppm) at all the sites except two locations. 147
High concentration of Mn (133 µgL-1) and Fe (6.56 mgL-1) in the copper mine zone compared to quartzite and 148
granite mine zone is attributed to dissolution of sulphides. The average U concentration is observed lowest (13 149
µgL-1) in the copper mine zone. Baidya and Pal (2020) reported mineralization of uraninite near the Kolihan and 150
Chaandmari Cu deposits confirming the abundance of U in the copper mine zone. Uraninite is the probable source 151
for U in the groundwater. The low concentration of U in groundwater of copper mine zone is attributed to the 152
scavenging capacity of sulphides such as Mackinawite (FeS0.9) or Fe-oxyhydroxides (Leermakers et al. 2016; 153
Abdelouas et al. 1999). It also suggests immobilisation of U in groundwater by sulphide dissolution. Thus, the 154
present study confirms that sulphide mines have a buffering capacity to control the U mobilization in groundwater. 155
Source of U 156
The presence of U-rich granites and albetised quartzite rocks (GSI 2011) are a major source of U in groundwater 157
of the North-Eastern part of Rajasthan. Statistical variation of U concentration is classified into three classes (Fig. 158
2). The highest value of the first class is 30 µgL-1 which is a WHO permissible limit and rest are further classified 159
into two classes i.e. high (31-120 µgL-1) and severe (above 120 µgL-1). In the copper mine zone, U (90 µgL-1) 160
concentration is observed high at CE2 located near to the confluence of two geological groups (Ajabgarh and 161
Alwar) compared to other locations. Fractures at the confluence of geological groups create oxic conditions which 162
lead to the dissolution of minerals and permits U mobilization into groundwater (Abdelouas et al. 1999). Adithya 163
et al. (2019) observed that groundwater in the oxidising conditions contain a higher concentration of dissolved U. 164
Faults occur at the juncture of Ajabgarh and Alwar groups are attributed to the high mobility of U in groundwater. 165
The current study is preliminary in nature and further detailed study is needed with more number of samples from 166
the confluence of geological groups. High contamination at ME3 (80 µgL-1 U) is due to its closeness to albitite 167
line. The albitite line is enriched in uraninite (Ray, 1990), a potential source of U in the groundwater. ME3 is 168
located in close proximity of Dabla granitoid and illegal mining is also observed in its surroundings. The high 169
concentration of U in the groundwater is also attributed to anthropogenic activities (small scale mines). 170
MC and MS1 with a U concentration of 216 and 31 µgL-1 are located close to active granite mines. Sedimentary 171
rocks derived from granites are enriched in uranium concentration (Hobday and Galloway 1999). Almost all the 172
locations in the quartzite mine zone are contaminated with U indicating its high mobility. Quartzite and granite 173
mine zone are located in the vicinity of albitite line, where occurrence of U mineralization is reported. Highest 174
concentration of U i.e. 430 µgL-1 is observed at QW3 close to Gothra granitoid. The high concentration of U is 175
attributed to the presence of uranium enriched granite in the region (GSI 2011; Duggal et al. 2020). The variation 176
in U concentration with respect to their geological settings indicates its geogenic origin in the groundwater. 177
Classifying the samples according to geological groups, the concentration of Fe and Mn is observed high at the 178
confluence of the Ajabgarh and Alwar groups (Fig. 3). Natural recharge leads to the dissolution of minerals in the 179
6
fracture zones. The high concentration of elemental concentration is observed high in the fracture zone due to the 180
presence of the oxic condition. Thus, fractures and faults at the confluence of two geological groups create oxic 181
conditions which enhance the dissolution of Fe-rich minerals. The dissolved Fe and Mn minerals act as a 182
scavenger for U and thus, reducing the U concentration which is supposed to be high at the confluence. At the 183
Alwar group, Fe and Mn concentration are lowest among all the geological setups and U concentration is the 184
highest. It indicates that in natural conditions sulphide mines acts as a buffer and control the dissolution of U in 185
groundwater. In the Khetri region, despite uranium-rich minerals, U concentration is observed low compared to 186
its neighbouring locations, which is due to the buffering capacity of sulphide mines. 187
In the KBC region, the abundance of uraninite is observed in close vicinity to quartzite and copper mines (Ray 188
1990; Baidya and Pal 2020). However, a high concentration of U is observed in the groundwater of the quartzite 189
mine zone comparative to the copper mine zone. In the copper mine zone, a high concentration of Fe and Mn is 190
observed and it is well known that the Fe is a scavenger for U in natural conditions. A strong correlation between 191
Fe and U suggests that Fe scavenges U from the groundwater in the copper mine zone. 192
Processes affecting U concentration in groundwater 193
High U content in groundwater is due to weathering or anthropogenic dissolution of U bearing minerals. The 194
origin of U in groundwater is geogenic but it is also significantly influenced by anthropogenic activities. Both 195
geogenic and anthropogenic factors will be discussed in detail in the following sections. 196
Weathering 197
A shallow groundwater table with fractures and faults could be the reason for the leaching of U in groundwater. 198
The primary source in the region is U bearing silicate minerals such as granite and uraninite. The region is known 199
for Cu mineralization along with the occurrences of Au ± Fe ± Co ± Ag ± REE ± U ± P (Baidya et al. 2017). The 200
geology of the region is very diverse and made up of different types of parent rocks. Fractures and faults are 201
common features found at the boundary of two-parent rocks. Thus, a high concentration of U in groundwater is 202
attributed to mineral dissolution, faults or fractures in the region. 203
Groundwater depth is shallow and prone to leaching of elements because of precipitation. U concentration is 204
observed high in shallow groundwater of semi-arid (Coyte et al. 2018) and arid region (Burow et al. 2017) due to 205
leaching. The Khetri belt lies in the semi-arid region with shallow groundwater. The groundwater table is shallow 206
hence weathering of U bearing minerals is a significant contributor of U in groundwater of the Khetri belt. In the 207
Indian scenario, a high concentration of U in groundwater is attributed to an oxidising condition which leads to 208
the solubility of U by forming the soluble uranyl carbonates (Coyte et al. 2017; Brindha and Elango 2013). 209
Anthropogenic activities 210
Anthropogenic activities (industries or mining) leads to overexploitation or pollution of resources. Granite, 211
quartzite and copper mines are major anthropogenic activities in the region. The concentration of U is found high 212
near quartzite and granite mines due to the abundance of granite minerals. U does not show a significant 213
correlation with Fe (except at the confluence of Ajabgarh and Alwar group) suggesting it is not associate with 214
sulphide rich minerals and its origin is geogenic in the groundwater. At the confluence of Ajabgarh and Alwar 215
group, fractures and faults promote the dissolution of sulphides and U enriched silicates. U and Fe have a 216

7
significant correlation coefficient (R2=0.97) at the confluence of Ajabgarh and Alwar group which indicates a 217
strong association between U and Fe. Additionally, fractures and faults create oxic conditions which are 218
responsible for the desorption of U from clay minerals, metal oxides and oxyhydroxides (Zhou and Gu 2005; 219
Yang et al. 2014). 220
Neighbouring quartzite mines groundwater resources are overexploited and groundwater resources are completely 221
depleted at some locations. Overexploitation is a situation where the rate of groundwater extraction exceeds the 222
average rate of aquifer recharge (Foster and Loucks 2006). A high concentration of U is attributed to 223
overexploitation of groundwater resources. The overexploitation of groundwater leads to an increase in the 224
concentration of major ions (Bagheri et al. 2019) and Fe (Gad et al. 2016). Quartzite mines lie in the Alwar group 225
comprised of quartzite marble, schist and gneiss is a probable source in addition to Gothra granitoid. 226
Future research scope 227
In the present study, U concentration is observed less in copper mining zone compared to other locations despite 228
the abundance of uraninite or granite, a source of U. It indicates that Fe-hydroxides or FeS are potential scavenger 229
of U from the groundwater. Mine waste enriched in iron sulphides is generated in huge amount across the globe 230
(Thom et al. 2013; Eurostat, 2017). Thus, the present study purposes application of mining waste (tailings and 231
overburden rocks) for the treatment of U concentration from groundwater. The natural attenuation of U from 232
groundwater using mining waste needs further research, as mining waste is also a source of heavy metal 233
contamination. 234
Mining waste is enriched in heavy metals (Punia et al. 2017), a source of groundwater contamination (Olías et al. 235
2021). Mining waste highly enriched in FeS generates acid mine drainage (AMD) and contaminates downstream 236
groundwater. Identification of optimum concentration of mining waste for the removal of U from groundwater is 237
important. Achieving a balance between contamination and natural attenuation by mining waste is a topic of 238
debate and needs further research. The dose of mining waste in groundwater after a regular interval of time would 239
be beneficial as excessive FeS would generate AMD. A research is needed to identify the appropriate dose of 240
mining waste and exposure duration to achieve the better removal of U from the groundwater. 241
The Fe-(hydr)oxides and goethite have a capacity to remove U from groundwater via complexation process 242
(Logue et al. 2004; Gustafsson et al. 2009). Beneficiation of sulphide ore generates Fe enriched mining tailings 243
in abundant quantity and oxidation transforms sulphide minerals into stable goethite (Kim and Kim 2021). Iron 244
oxyhydroxides and goethite controls U mobility in the environment (Lahrouch et al. 2021). Now a day’s 245
permeable reactor barrier (PRB) is widely used technology for the treatment of groundwater. Use of mine tailings 246
in PRB could be a probable solution for the treatment of U contamination. Further research is needed to facilitate 247
the use mine waste as a reactive material for the manufacturing of PRB. The PRB coated with reactive material 248
of Zero-valent iron nanoparticle are found feasible for removal and sequestration of U from groundwater (Li et 249
al. 2015). The injection of iron nanoparticles effectively removes U contamination but the influence of other ions 250
such as calcium, sulphate and carbonate on the water resources needs more studies (Jing et al. 2019). 251
The huge quantity of mining waste is burden for environment and its use for the treatment of groundwater would 252
solve the problem of its disposal. The preparation of nano particles of Fe also increases the implementation cost 253
at larger scale and the application of mining waste for the same would reduce the cost. Iron sulphide immobilizes 254

8
U by reduction or ion exchange processes (Gong et al. 2016; Hua and Deng 2008). Further research is needed to 255
identify the weight% concentration of mining waste which could be used for the removal of U contamination from 256
groundwater. As per our knowledge, no study has been carried for the removal of U contamination from 257
groundwater using mining waste. 258
Risk assessment 259
Results show that at most of the locations HQ value lies near 1 and at four locations (QW3, CE2, MC, and ME3) 260
it is above 1 indicating the probable adverse health impacts (Fig. 4). The reference dose value is taken as 4.53 mg 261
kg-1 day-1 (AERB 2004). HQ varies from 0 to 7 with an average of 0.61. Consumption of U contaminated water 262
leads to nephrotoxicity, genotoxicity and developmental defects in humans (Brugge and Buchner 2011; Lariviere 263
et al. 2007). Maximum HQ values ~7 demands further studies to assess the health impact of U in the region. 264
Conclusions 265
The region is active in mining so the impact of anthropogenic activities can’t be neglected. It is observed that 266
sulphide mine acts as a buffer and prevents the dissolution of U-rich minerals in groundwater. U concentration is 267
found high in quartzite mine zone due to lack of buffers i.e. sulphides or Fe-hydroxides. The study recommends 268
immobilization of U in groundwater using mining waste enriched in Fe sulphides and hydroxides. U concentration 269
is observed high near to the confluence of two geological groups compared to other locations. Faults or fractures 270
between two rocks cause oxic conditions and oxygen leads to the dissolution of Fe-rich minerals. Source of U in 271
groundwater is uranium mineralization in granites, gneisses and quartzite rocks. The presence of fractures and 272
faults significantly affects the uranium concentration in groundwater. Shallow aquifers with fractures and faults 273
could be the reason for the mobility of U in groundwater. The origin of U in the groundwater is geogenic in nature 274
but the influence of overexploitation of water can’t be neglected. Overexploitation of groundwater increases the 275
ionic concentration in groundwater. The health risk assessment for cancer indicates the HQ values ~7 demands 276
further studies to assess the health impact of U in the region. 277
Acknowledgments 278
The postdoctoral fellowship of the Indian Institute of Technology Guwahati is acknowledged. The authors also 279
acknowledge the support of IUAC for extending the ICPMS facility under the Geochronology project funded by 280
the Ministry of Earth Sciences, Govt of India. The authors also acknowledge the help of Dr. Sumaya Prasad Dhal 281
(Research Associate), IUAC in the handling of the instrument. 282
References 283
:1319-1329 284
Abdelouas A, Lutze W, Nuttall HE (1999) Oxidative dissolution of uraninite precipitated on Navajo sandstone. J 285
Cont Hyd 36:353-375 286
Adithya VS, Chidambaram S, Keesari T, Mohokar HV, Prasanna MV (2019) Occurrence of Uranium in 287
Groundwater Along the Lithological Contacts in Central Tamilnadu, India: An Isotope Hydrogeochemical 288
Perspective. Exposure and Health 11:277-290 289
9
AERB (2004) Drinking Water Specifications in India. Department of Atomic Energy, Govt. of India. Atomic 290
Energy Regulatory Board. 291
Ayotte JD, Flanagan SM, Morrow WS (2007) Occurrence of Uranium and 222Radon in Glacial and Bedrock 292
Aquifers in the Northern United States, 1993- 2003. Citeseer. 293
Bagheri R, Nosrati A, Jafari H, Eggenkamp HGM, Mozafari M (2019) Overexploitation hazards and salinization 294
risks in crucial declining aquifers, chemo-isotopic approaches. J Hazard Mater 369:150-163. 295
Baidya AS, Pal DC (2020) Geochemical evolution and timing of uranium mineralization in the Khetri Copper 296
Belt, western India. Ore Geol Rev 127:103794 297
Baidya AS, Paul J, Pal DC, Upadhyay D (2017) Mode of occurrences and geochemistry of 952 amphibole in the 298
Kolihan-Chandmari copper deposits, Rajasthan, India: insight into the ore- 953 forming process. Ore Geol Rev 299
80:1092-1110 300
Banks D, Rohr-Torp E, Skarphagen H (1992) An integrated study of a Precambrian granite aquifer. riveter. 301
Southeastern Norway. Nor geol unders Bull 422:47-66 302
Blantz RC, Pelayo JC, Gushwa LC, Myers RR, Evan AP (1985) Functional basis for the glomerular alterations in 303
uranyl nitrate acute renal failure. Kidney Int 28:733-743 304
Brindha K, Elango L (2013) Occurrence of uranium in groundwater of a shallow granitic aquifer and its suitability 305
for domestic use in southern India. J Radioanal Nucl Chem 295:357-367 306
Brugge D, Buchner V (2011) Health effects of uranium: new research findings. Rev Environ Health 26:231-249 307
Burowa KR, Belitz K, Dubrovsky NM, Jurgens BC (2017) Large decadal-scale changes in uranium and 308
bicarbonate in groundwater of the irrigated western U.S. Sc Total Environ 586:87-95 309
Cánovas CR, Macías F, Pérez-López R (2016) Metal and acidity fluxes controlled by precipitation/dissolution 310
cycles of sulfate salts in an anthropogenic mine aquifer. J Contam Hydrol 188:29-43 311
Coyte RM, Jain RC, Srivastava SK, Sharma KC, Khalil A, Ma L, Vengosh, A (2018) Large-scale uranium 312
contamination of groundwater resources in India. Environ Sci Technol Lett 5:341-347 313
Coyte RM, Singh A, Furst KE, Mitch WA, Vengosh A (2019) Co-occurrence of geogenic and anthropogenic 314
contaminants in groundwater from Rajasthan, India. Sci Total Environ 688:1216-1227 315
Craft ES, Abu-Qare AW, Flaherty MM, Garofolo MC, Rincavage HL, Abou-Donia MB (2004) Depleted and 316
natural uranium: chemistry and toxicological effects. J Toxicol Environ Health Part B 7:297-317 317
Cumberland SA, Douglas G, Grice K, Moreau JW (2016) Uranium mobility in organic matter-rich sediments: a 318
review of geological and geochemical processes. Earth Sci Rev 159:160-185 319
Cuvier A, Panza F, Pourcelot L, Foissard B, Cagnat X, Prunier J, Beek P (2015) Uranium decay daughters from 320
isolated mines: accumulation and sources. J Environ Radioact 149:110-120 321
Das Gupta SP (1968) The structural history of the Khetri Copper Belt, Jhunjhunu and Sikar districts, Rajasthan. 322
Geol Sur India 98:170 323

10
Deditius AP, Utsunomiya S, Ewing RC (2008) The chemical stability of coffinite, USiO4 center dot nH(2)O; 0 < 324
n < 2, associated with organic matter: a case study from Grants uranium region, New Mexico, USA. Chem Geol 325
251(1-4):33-49 326
Duggal V, Rani A, Balaram V (2016) Assessment of age-dependent radiation dose due to intake of uranium and 327
thorium in drinking water from Sikar district, Rajasthan, India. Radiat Prot Dosim 171:257-261 328
Duggal V, Sharma S, Mehra R (2020) Risk assessment of radon in drinking water in Khetri Copper Belt of 329
Rajasthan, India. Chemosphere 239:124782. 330
Eurostat (2017) Generation of waste by waste category, 331
http://appsso.eurostat.ec.europa.eu/nui/show.do?Dataset=env_wasgen&lang=en. 332
Foster S, Loucks D (2006) Non-renewable groundwater resources. UNESCO, IHP-VI, Series on Groundwater, 333
No. 10, Paris, 81 pp. 334
Gad M, Dahab K, Ibrahim H (2016) Impact of iron concentration as a result of groundwater exploitation on the 335
Nubian sandstone aquifer in El Kharga Oasis, western desert, Egypt. NRIAG J Astron geophys 5(1):216-237 336
Giblin AM, Batts BD, Swaine DJ (1981) Laboratory simulation studies of uranium mobility in natural waters. 337
Geochim Cosmochim Acta 45:699-709 338
Gong Y, Tang J, Zhao D (2016) Application of iron sulfide particles for groundwater and soil remediation: A 339
review. Water Research 89, 309-320 340
Gorman-Lewis D, Burns PC, Fein JB (2008a) Review of uranyl mineral solubility measurements. J Chem 341
Thermodyn 40(3):335-352 342
Gorman-Lewis D, Fein JB, Burns PC, Szymanowski JE, Converse J (2008b) Solubility measurements of the 343
uranyl oxide hydrate phases metaschoepite, compreignacite, Na–compreignacite, becquerelite, and clarkeite. J 344
Chem Thermodyn 40(6):980-990 345
Gorman-Lewis D, Mazeina L, Fein JB, Szymanowski JES, Burns PC, Navrotsky, A (2007) Thermodynamic 346
properties of soddyite from solubility and calorimetry measurements. J Chem Thermodyn 39(4):568-575 347
Gorman-Lewis D, Shvareva T, Kubatko KA, Burns PC, Wellman DM, McNamara B, Szymanowski JES, 348
Navrotsky A, Fein JB (2009) Thermodynamic properties of autunite, uranyl hydrogen phosphate, and uranyl 349
orthophosphate from solubility and calorimetric measurements. Environ Sci Technol 43(19):7416-7422 350
GSI (2011) Geology and mineral resources of Rajasthan, Geological Survey of India, Miscellaneous Publication 351
No. 30 Part 12, 3rd Revised Edition. ISSN 0579-4706, PGSI, 327, 700-2010 (DSK-II). 352
Gupta P, Guha DB, Chattopadhyay B (1998) Basement–cover relationship in the Khetri Copper Belt and the 353
emplacement mechanism of the granite massifs, Rajasthan. J Geol Soc India 52:417-432 354
Gustafsson JP, Dässman E, Bäckström M (2009) Towards a consistent geochemical model for prediction of 355
uranium(VI) removal from groundwater by ferrihydrite. Applied Geochemistry 24, 454–462 356
Heron AM (1923) Geology of western Jaipur. Rec Geol Surv India 54(4):345-397 357

11
Hobday DK, Galloway WE (1999) Groundwater processes and sedimentary uranium deposits. Hydrogeol J 358
7(1):127-138 359
Hua B, Deng B (2008) Reductive Immobilization of Uranium(VI) by Amorphous Iron Sulfide. Environ. Sci. 360
Technol. 42, 8703-8708 361
Hua B, Deng B (2008) Reductive immobilization of uranium(VI) by amorphous iron sulfide. Environ Sci Technol 362
42 (23):8703-8708. 363
Jang JH, Dempsey BA, Burgos WD (2008) Reduction of U(VI) by Fe(II) in the presence of hydrous ferric oxide 364
and hematite: effects of solid transformation, surface cover-age, and humic acid. Water Res 42 (8-9):2269-2277 365
Jing C., Li Y.L., Landsberger S. (2019) Review of soluble uranium removal by nanoscale zero valent iron. Journal 366
of Environmental Radioactivity 164, 65-72 367
Jordens A, Cheng YP, Waters KE (2013) A review of the beneficiation of rare earth element bearing minerals. 368
Miner Eng 41:97-114 369
Kanzari A, Gérard M, Boekhout F, Galoisy L, Calas G, Descostes M (2017) Impact of incipient weathering on 370
uranium migration in granitic waste rock piles from former U mines (Limousin, France). J Geochem Explor 371
183:114-126 372
Katz SA (2014) The chemistry and toxicology of depleted uranium. Toxics 2:50-78 373
Kaur G, Mehta PK (2005) The Gothara plagiogranite: evidence for oceanic magmatism in a non-ophiolitic 374
association, North Khetri copper belt, Rajasthan, India?. J Asian Earth Sci 25:805-819 375
Kaur P, Chaudhri N, Hofmann AW, Raczek I, Okrusch M, Skora S, Koepke J (2014) Metasomatism of ferroan 376
granites in the northern Aravalli orogen, NW India: geochemical and isotopic constraints, and its metallogenic 377
significance. Int J Earth Sci 103:1083-1112 378
Kaur P, Zeh A, Chaudhri N (2017) Palaeoproterozoic continental arc magmatism, and Neoproterozoic 379
metamorphism in the Aravalli-Delhi orogenic belt, NW India: New constraints from in situ zircon U-Pb-Hf 380
isotope systematics, monazite dating and whole-rock geochemistry. J Asian Earth Sc 136:68-88 381
Kim H-J, Kim Y (2021) Schwertmannite transformation to goethite and the related mobility of trace metals in 382
acid mine drainage. Chemosphere, 269, 128720 383
Knight J, Lowe J, Joy S, Cameron J, Merrillees J, Nag S, Shah N, Dua G, Jhala K (2002) The Khetri Copper Belt, 384
Rajasthan: iron oxide copper-gold terrane in the Proterozoic of NW India. In: Porter, T.M. (Ed.), Hydrothermal 385
Iron Oxide Copper-Gold and Related Deposits: A Global Perspective, vol. 2. PGC Publishing, Adelaide, pp. 321-386
341 387
Kozak K, Mazur J, Vautopic J, Grzadziel D, Kobal I, Omran KMH (2013) The potential health hazard due to 388
elevated radioactivity in old uranium mines in Dolina Białego, Tatra mountains, Poland. Isot Environ Health Stud 389
49:274-282 390
Kurttio P, Komulainen H, Leino A, Salonen L, Auvinen A, Saha H (2005) Bone as a possible target of chemical 391
toxicity of natural uranium in drinking water. Environ Health Perspect 113:68-72 392

12
Lahrouch F, Guo N, Hunault MOJY, Solari PL, Descostes M, Gerard M (2021) Uranium retention on iron 393
oxyhydroxides in post-mining environmental conditions. Chemosphere, 264(1), 128473 394
Lariviere D, Packer AP, Marro L, Li C, Chen J, Cornett RJ (2007) Age dependence of natural uranium and thorium 395
concentrations in bone. Health Phys 92:119-126 396
Leermakers M, Phrommavanh V, Drozdzak J, Gao Y, Nos J, Descostes Ml (2016) DGT as a useful monitoring 397
tool for radionuclides and trace metals in environments impacted by uranium mining: case study of the Sagnes 398
wetland in France. Chemosphere 155:142-151 399
Li Z-J, Wang L, Yuan L-Y, Xiao C-L, Mei L, Zheng L-R, Zhang J, Yang J-H, Zhao Y-L, Zhu Z-T, Chai Z-F, Shi 400
W-Q (2015) Efficient removal of uranium from aqueous solution by zero-valent iron nanoparticle and its graphene 401
composite. Journal of Hazardous Materials 290, 26–33 402
Liesch T, Hinrichsen S, Goldscheider N (2015) Uranium in groundwater - Fertilizers versus geogenic sources. Sc 403
Total Environ 536:981-995 404
Locock AJ, Burns PC (2003) Crystal structures and synthesis of the copper-dominant members of the autunite 405
and meta-autunite groups: torbernite, zeunerite, metatorbernite and metazeunerite. Can Mineral 41:489-502 406
Logue, B.A., Smith, R.W., Westall, J.C., 2004. U(VI) adsorption on iron-coated sands: Comparison of approaches 407
for modeling adsorption on heterogeneous environmental materials. Appl. Geochem. 19, 1937–1951. 408
Merkel BJ, Sperling B (1998) Hydrogeochemische Stoffsysteme Teil II. Bonn: Kommissionsvertrieb Wirtschafts- 409
und Verlagsgesellschaft Gas und Wasser mbH. 410
Momčilović M, Kovačević J, Tanić M, Đorđević M, Bačić G, Dragović S (2013) Distribution of natural 411
radionuclides in surface soils in the vicinity of abandoned uranium mines in Serbia. Environ Monit Assess 185(2) 412
Neiva AMR, Carvalho PCS, Antunes IMHR, Silva MMVG, Santos ACT, Cabral Pinto MMS, Cunha PP (2014) 413
Contaminated water, stream sediments and soils close to the abandoned Pinhal do Souto uranium mine, central 414
Portugal. J Geochem Explor 136:102-117 415
O'Brien TJ, Williams PA (1983) The aqueous chemistry of uranium minerals. 4. Schröckingerite, grimselite, and 416
related alkali uranyl carbonates. Mineral Mag 47 (342):69-73 417
Olías M, Cánovas CR, Basallote MD (2021) Surface and Groundwater Quality Evolution in the Agrio and 418
Guadiamar Rivers After the Aznalcóllar Mine Spill (SW Spain): Lessons Learned. Mine Water and the 419
Environment 40, 235-249 420
Paradis CJ, Jagadamma S, Watson DB, McKay LD, Hazen TC, Park M, Istok JD (2016) In situ mobility of 421
uranium in the presence of nitrate following sulfate-reducing conditions. J Contam Hydro 187:55-64 422
Patra A, Mohapatra S, Sahoo S, Lenka P, Dubey J, Tripathi R, Puranik V (2013) Age-dependent dose and health 423
risk due to intake of uranium in drinking water from Jaduguda, India. Radiat Protect Dosim 155:210-216 424
Punia A, Siddaiah NS, Singh SK (2017) Source and assessment of heavy metal pollution at Khetri copper mine 425
tailings and surrounding soil, Rajasthan, India. Bulletin of Environmental Contamination and Toxicology, 99, 426
633-641 427

13
Radojevic M, Bashkin VN (1999) Practical environmental analysis. Royal Society of Chemistry, pp. 154-155. 428
Rani A, Mehra R, Duggal V (2013) Analysis of uranium concentration in drinking water samples using ICPMS. 429
Health Phys 104:251- 255 430
Ray AE, Bargar JR, Sivaswamy V, Dohnalkova AC, Fujita Y, Peyton BM, Magnuson TS (2011) Evidence for 431
multiple modes of uranium immobilization by an anaerobic bacterium. Geochim Cosmochim Acta 75 (10):2684-432
2695 433
Roy Chowdhury M K and Das Gupta S P (1965) Ore-localization in the Khetri copper belt, Rajasthan, India. Econ 434
Geol 60:69-88 435
Russell JJ, Kathren RL (2004) Uranium deposition and retention in a USTUR whole body case. Health Phys 436
86:273-284 437
Saini K, Singh P, Bajwa BS (2016) Comparative statistical analysis of carcinogenic and non-carcinogenic effects 438
of uranium in groundwater samples from different regions of Punjab, India. Appl Radiat Isot 118:196-202 439
Sarkar SC, Dasgupta S (1980) Geologic setting, genesis and transformation of the sulfide deposits in the northern 440
part of the Khetri copper belt, Rajasthan, India- an outline. Miner Deposita 15:117-137 441
Scherrer NC, Engi M, Gnos E, Jakob V, Lietchi A (2000) Monazite Analysis; From Sample Preparation to 442
Microprobe Age Dating and REE Quantification. 80. pp. 93-105 443
Selvi B, Vijayakumar B, Rana B, Ravi P (2016) Distribution of natural uranium in groundwater around 444
Kudankulam. Radiat Protect Environ 39:25-25 445
Sharma S, Kumar A, Mehra R, Mishra R (2017) Ingestion doses and hazard quotients due to intake of Uranium 446
in drinking water from Udhampur District of Jammu and Kashmir State, India. Radioprotection 52:109-118 447
Sharma T, Sharma A, Kaur I, Mahajan RK, Litoria PK, Sahoo SK, Bajwa BS (2019) Uranium distribution in 448
groundwater and assessment of age dependent radiation dose in Amritsar, Gurdaspur and Pathankot districts of 449
Punjab, India. Chemosphere 219:607-616 450
Shin W, Oh J, Choung S, Cho B, Lee K, Yun U, Woo N, Kim HK (2016) Distribution and potential health risk of 451
groundwater uranium in Korea. Chemosphere 163:108-115 452
Smith M, Roychoudhury AN (2013) Mobilisation of Iron from rocks in a fractured aquifer: Lithological and 453
geochemical controls. Appl Geochem 31:171-186 454
Stalder E, Blanc A, Haldimann M, Dudler V (2012) Occurrence of uranium in Swiss drinking water. Chemosphere 455
86:672-679 456
Stier O (1983) Untersuchungen zur Verteilung von Uran in Gesteinen, Böden, und Bachsedimenten der 457
Granitmassive des südöstlichen Bayerischen Waldes mit besonderer Berücksichtigung der geochemischen 458
Uranexploration. RWTH Aachen. 459
Thom JGM, Dipple GM, Power IM, Harrison AL (2013) Chrysotile dissolution rates: Implications for carbon 460
sequestration. Appl Geochem 35:244-254 461
14
Tomiyama S, Igarashi T, Tabelin CB, Tangviroon P, Ii H (2019) Acid mine drainage sources and 462
hydrogeochemistry at the Yatani mine, Yamagata, Japan: A geochemical and isotopic study. J Contam Hydrol 463
225:103502 464
Tricca A, Porcelli D, Wasserburg GJ (2000) Factors controlling the groundwater transport of U, Th, Ra, and Rn. 465
J Earth Syst Sci 109:95-108 466
USEPA (1999) United States Environmental Protection Agency, Cancer risk coefficients for environmental 467
exposure to radionuclides. Federal Guidance Report No. 13, EPA 402-R-99-001. 468
Villa M, Manjon G, Hurtado S, Garcia-Tenorio R (2011) Uranium pollution in an estuary affected by pyrite acid 469
mine drainage and releases of naturally occur-ring radioactive materials. Mar Pollut Bull 62:1521-1529 470
Watson DB, Wu WM, Mehlhorn T, Tang GP, Earles J, Lowe K, Gihring TM, Zhang GX, Phillips J, Boyanov MI, 471
Spalding BP, Schadt C, Kemner KM, Criddle CS, Jardine PM, Brooks SC (2013) In situ bioremediation of 472
uranium with emulsified vegetable oil as the electron donor. Environ Sci Technol 47 (12):6440-6448 473
Wei Y, Jin L, Li Z, Liu J, Wang L, Pi X, Yin S, Wang C, Ren A (2019) Levels of uranium and thorium in maternal 474
scalp hair and risk of orofacial clefts in offspring. J Environ Radioact 204:125-131 475
WHO (2011) Guidelines for Drinking-water Quality. Fourth ed., vol. 1, World Health Organization, Geneva, 476
Switzerland. 477
Wu Y, Wang Y, Xie X (2014) Occurrence, behavior and distribution of high levels of uranium in shallow 478
groundwater at Datong basin, northern China. Sci Total Environ 472:809-817 479
Yang Q, Smitherman P, Hess CT, Culbertson CW, Marvinney RG, Smith AE, Zheng Y (2014) Uranium and 480
radon in private bedrock well water in Maine: geospatial analysis at two scales. Environ Sci Technol 48:4298-481
4306 482
Zamora ML, Tracy BL, Zielinski JM, Meyerhof DP, Moss MA (1998) Chronic ingestion of uranium in drinking 483
water: a study of kidney bio effects in humans. Toxicol Sci 43:68-77 484
Zhou P, Gu BH (2005) Extraction of oxidized and reduced forms of uranium from contaminated soils: effects of 485
carbonate concentration and pH. Environ Sci Technol 39:4435-4440 486
15
Figure captions: 487
Figure 1 Study area C) Sampling locations superimposed on the geology (after Knight et al. 2002; Kaur et al. 488
2005). 489
Figure 2 Measured Uranium concentration in the Khetri Copper Belt. 490
Figure 3 Estimated concentration of heavy metals and U in different geological setups of Khetri region. 491
Figure 4 Locations with high Average Daily Dose (ADD) and Hazard Quotient (HQ) values. 492

Figures
Figure 1
Study area C) Sampling locations superimposed on the geology (after Knight et al. 2002; Kaur et al.2005). Note: The designations employed and the presentation of the material on this map do not implythe expression of any opinion whatsoever on the part of Research Square concerning the legal status ofany country, territory, city or area or of its authorities, or concerning the delimitation of its frontiers orboundaries. This map has been provided by the authors.
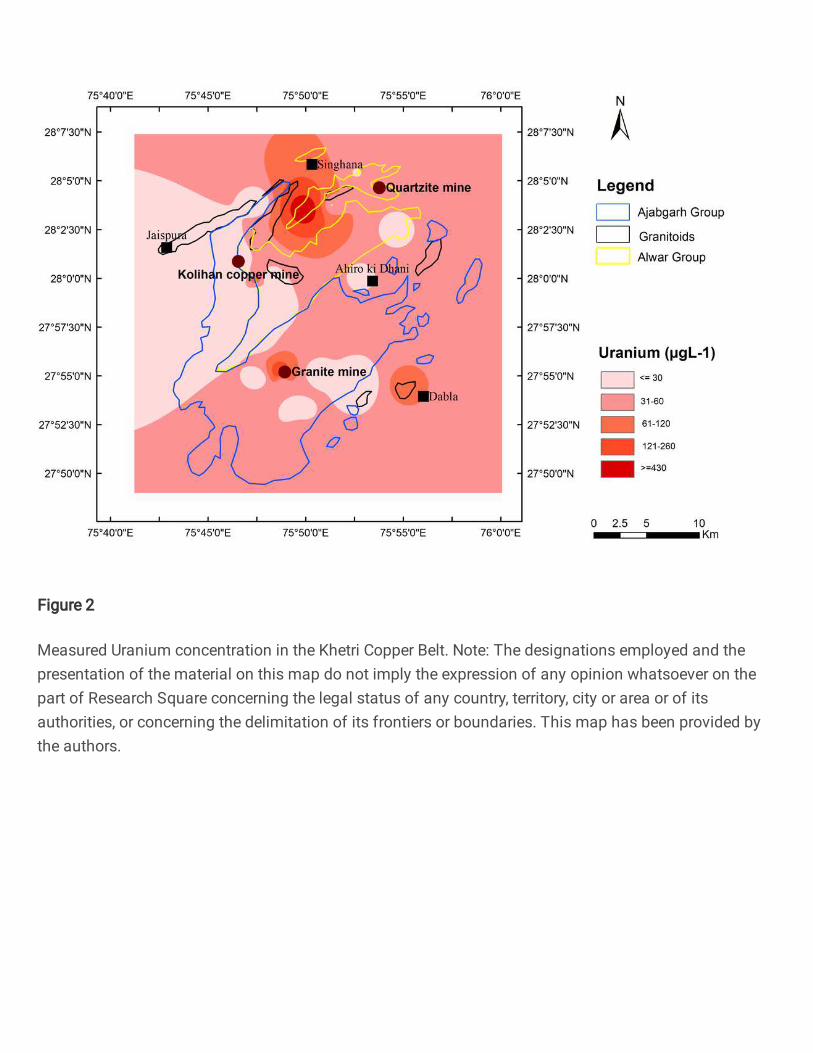
Figure 2
Measured Uranium concentration in the Khetri Copper Belt. Note: The designations employed and thepresentation of the material on this map do not imply the expression of any opinion whatsoever on thepart of Research Square concerning the legal status of any country, territory, city or area or of itsauthorities, or concerning the delimitation of its frontiers or boundaries. This map has been provided bythe authors.

Figure 3
Estimated concentration of heavy metals and U in different geological setups of Khetri region.

Figure 4
Locations with high Average Daily Dose (ADD) and Hazard Quotient (HQ) values. Note: The designationsemployed and the presentation of the material on this map do not imply the expression of any opinionwhatsoever on the part of Research Square concerning the legal status of any country, territory, city orarea or of its authorities, or concerning the delimitation of its frontiers or boundaries. This map has beenprovided by the authors.
Related Documents