Chapter 3 HYDROGEOCHEMICAL CHARACTERISATION OF GROUNDWATER IN THE CAPE FLATS AREA, SOUTH AFRICA: CONSTRAINTS FOR W ATER SUPPLY AUGMENTATION Segun Michael Adelana 1,2, • • • , Yongxin Xu 1 and Petr Vrbka 3 1 Earth Sciences Department, University of the Western Cape, Bellville, SA 2 Agriculture Research, Department of Environment and Primary Industries, DEPI Bendigo Centre, Victoria, Australia 3 Dieburger Str. 108, D-64846 Groß-Zimmern, Germany ABSTRACT A study carried out to evaluate hydrogeochemical characteristics of groundwater in the Cape Flats identified the geochemical processes and their relation to groundwater quality. The distribution of salinity, trends in major ions and ionic ratios imply that groundwater chemistry is largely controlled by a combination of surface and near-surface processes. The groundwater is characterised by Ca–Mg–HCO 3 , Ca–SO 4 and Na–Cl. There is little difference in chemistry between the older underlying Malmesbury Formation and the Cape Flats nonetheless in comparison with the Cape Granite, the composition (e.g. total dissolved solids) is ten- times higher. Sources and mechanisms of salinization were investigated • E-mail: [email protected].

Welcome message from author
This document is posted to help you gain knowledge. Please leave a comment to let me know what you think about it! Share it to your friends and learn new things together.
Transcript
Chapter 3
HYDROGEOCHEMICAL CHARACTERISATION
OF GROUNDWATER IN THE CAPE FLATS
AREA, SOUTH AFRICA: CONSTRAINTS FOR
WATER SUPPLY AUGMENTATION
Segun Michael Adelana1,2,••••, Yongxin Xu
1
and Petr Vrbka3
1Earth Sciences Department, University of the Western Cape, Bellville, SA 2Agriculture Research, Department of Environment and Primary Industries,
DEPI Bendigo Centre, Victoria, Australia 3Dieburger Str. 108, D-64846 Groß-Zimmern, Germany
ABSTRACT
A study carried out to evaluate hydrogeochemical characteristics of groundwater in the Cape Flats identified the geochemical processes and their relation to groundwater quality. The distribution of salinity, trends in major ions and ionic ratios imply that groundwater chemistry is largely controlled by a combination of surface and near-surface processes. The groundwater is characterised by Ca–Mg–HCO3, Ca–SO4 and Na–Cl. There is little difference in chemistry between the older underlying Malmesbury Formation and the Cape Flats nonetheless in comparison with the Cape Granite, the composition (e.g. total dissolved solids) is ten-times higher. Sources and mechanisms of salinization were investigated
•
E-mail: [email protected].

Segun Michael Adelana, Yongxin Xu and Petr Vrbka 2
using geochemical techniques. The analysis and interpretation of long-term groundwater monitoring data revealed that salinity and nitrate contamination are potential threats to groundwater usability. High levels of chloride concentration in wells within 8 kilometres of the coast of False Bay is contributing to the deterioration of groundwater quality and could limit the quantity of available sustainable groundwater in this area.
Keywords: Groundwater–Cape Town–Water quality–Hydrogeochemical
process–Geochemical evolution – Salinization
INTRODUCTION
The development of groundwater resources in the coastal areas is a
sensitive issue that require carefully-planned management programs.
Groundwater in sandy aquifers, particularly in the coastal plains, could be
highly vulnerable to pollution resulting from anthropogenic activities and
seawater encroachments. Therefore, the understanding of processes and
chemical reactions related to coastal sedimentary settings as well as seawater
intrusion and other pollution pathways become important before the
development of coastal groundwater.
Seawater intrusion is a common problem in developed coastal aquifer
systems (USGS, 2005; 2006; 2007); the need to plan and manage coastal
groundwater reserves has led to several seawater intrusion studies (e.g. Pulido-
Bosch et al., 1999; Djabri et al., 2003; Green, 2006) and a wide range of
management approaches including the use of hydrogeochemical analyses and
numerical modelling (e.g. Sadeg and Karahanoglu, 2008; Gaaloul et al., 2012).
Coastal aquifers have been studied in different countries using
hydrogeochemical analyses (Giménez and Morell, 1997; Petalas and
Diamantis, 1999; Stuyfzand, 1999; Custodio, 2002, Cabrera and Custodio,
2004, Walraevens and Van Camp, 2005). Natural geochemical processes play
an important role in groundwater quality in most of these areas. Water quality
is also a limiting factor in quantifying usable fresh groundwater storage
(Edmunds, 2012).
The effects of seawater encroachment into fresh water have been
investigated using ionic ratios (Petalas and Diamantis, 1999; Sanchez et al.,
1999, 2002; Vengosh et al., 2002; El Moujabber et al., 2006; Lee and Song,
2006; Petrides and Cartwright, 2006). However, in the Cape Town area the
Hydrogeochemical Characterisation of Groundwater … 3
previous studies on the coastal plain sands have shown limited information on
the hydrogeochemical characteristics and evolution of groundwater.
In the past groundwater investigations and extraction mostly takes place
from deep fractured aquifers in the Table Mountain Group to avoid pollution
by surface activities such as agriculture and indiscriminate waste disposals.
This study originated from a long-term monitoring to investigate the status of
groundwater in the Cape Flats aquifer and its use in the city’s water supply
augmentation. This study is aimed at defining hydrogeochemical behaviour of
the Cape Flats aquifer in relation to other underlying and neighbouring
aquifers and to characterize geochemical processes. The study uses long-term
monitoring data to trace the historical and current groundwater quality.
THE STUDY AREA
Location and Description
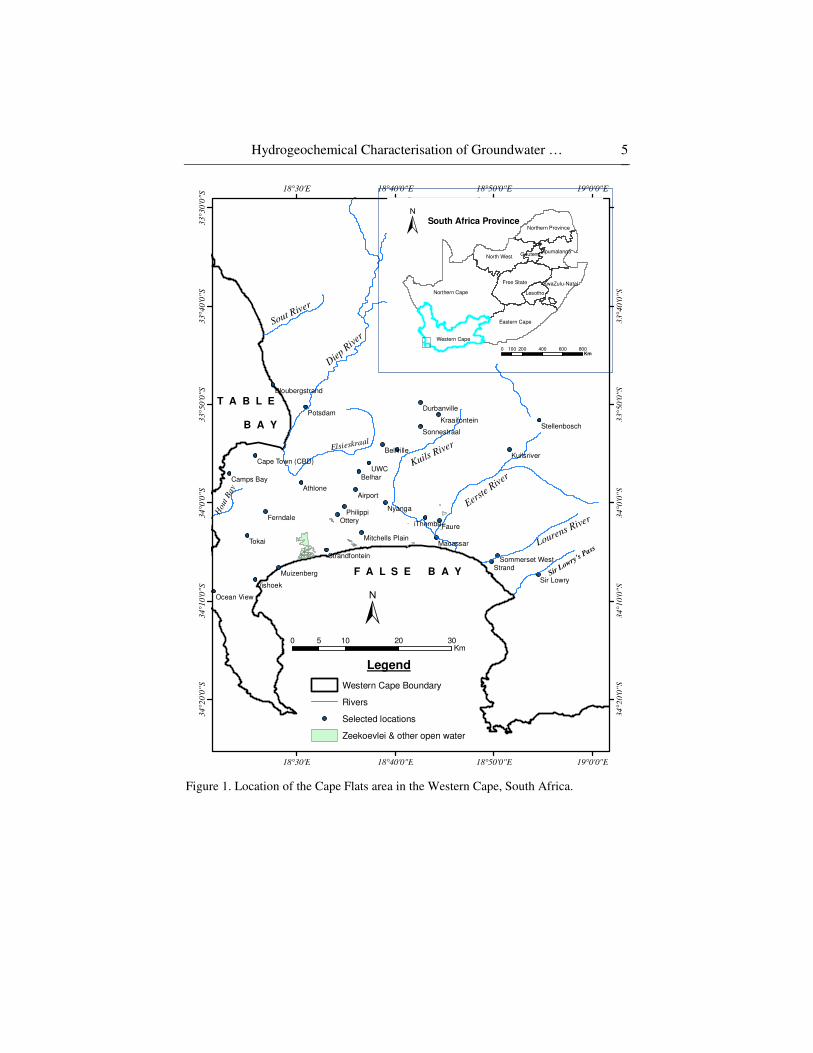
The Cape Flats is located within the boundaries of the City of Cape Town
in the Western Cape Province of South Africa and is positioned in the south-
western Cape between 33˚30΄ and 34˚10΄ south-latitude and between 18˚20΄
and 19˚00΄ east-longitude. Generally, the Cape Flats is taken to be an area
bounded by the Cape Town-Muizenberg, Cape Town-Bellville-Kraaifontein,
Bellville-Kuilsriver-Strand railway lines and the False Bay coast; with a
narrow strip of sand along the western coast, extending northwards from Cape
Town and Bellville through Blouberstrand up till Atlantis (Figure 1).
Presently, most of the area, underlain by the Cape Flats aquifer, is built-up,
with a greater proportion of industrial development from the eastern-side of
the City to the northern and southern suburbs.
Topography, Climate and Land-Use
The area around the City of Cape Town has a diverse terrain ranging from
low-lying sandy plains to the east and southern end and the Table Mountain to
the west and north. The large undulating sandy area connecting the hardrock
of the Cape Peninsula with the mainland has been described as the Cape Flats
(Schalke, 1973; Theron et al., 1992). This area has an average elevation of
30 m above sea level (a.s.l.), although sand dunes are common on the Cape
Flats, with the highest elevation of dunes only 65 m a.s.l. (Theron et al., 1992).
Segun Michael Adelana, Yongxin Xu and Petr Vrbka 4
The city of Cape Town has a typical Mediterranean climate but the
generally mountainous nature of the area results in contrasting rainfall
distribution pattern in the region. Annual precipitation varies between 400 mm
and 800 mm, with long-term mean of 600 mm/a. The city of Cape Town
receives most of its rain in the winter months (May-August) with a relatively
drier period (<20 mm/month) from November to March (Figure 2).
Hydrogeochemical Characterisation of Groundwater … 5
UWC
Faure
Tokai
Belhar
Nyanga
Ottery
Strand
Potsdam
AthloneAirport
iThemba
Vishoek
PhilippiFerndale
Macassar
Bellville
Camps Bay
Sir Lowry
Kuilsriver
Muizenberg
Ocean View
Durbanville
Sonnestraal
KraaifonteinStellenbosch
Strandfontein
Bloubergstrand
Sommerset West
Cape Town (CBD)
Mitchells Plain
18°30'E
18°30'E
18°40'0"E
18°40'0"E
18°50'0"E
18°50'0"E
19°0'0"E
19°0'0"E
34
°20
'0"S
34
°20
'0"S
34
°10
'0"S
34
°10
'0"S
34
°0'0
"S
34
°0'0
"S
33°5
0'0
"S
33°5
0'0
"S
33°4
0'0
"S
33°4
0'0
"S
33°3
0'0
"S
Northern Cape
Eastern Cape
Free State
North West
Western Cape
Northern Province
KwaZulu-Natal
Mpumalanga
Lesotho
Gauteng
F A L S E B A Y
Legend
Western Cape Boundary
Rivers
Selected locations
Zeekoevlei & other open water
Kuils River
Die
p Riv
er
Sout River
Eerste R
iver
Lourens River
Sir Lowry's
Pass
Hou
t B
ay
Elsieskraal
±0 10 20 305
Km
T A B L E
B A Y
± South Africa Province
0 200 400 600 800100Km
Figure 1. Location of the Cape Flats area in the Western Cape, South Africa.

Segun Michael Adelana, Yongxin Xu and Petr Vrbka 6
Figure 2. Mean temperature variation with monthly rainfall in Cape Town (1933-2010) Data source: South African Weather Bureau.
The average daily maximum temperature in Cape Town is about 28°C in
mid-summer and 17°C in mid-winter. Annual PET, summed from the daily
calculations generated by CROPWAT, is higher than AET in order of nearly
2.5 (Adelana, 2011). Land use in the region is dominated by
residential/industrial, parks and horticulture (Adelana and Xu, 2008). The
Greater Philippi horticultural area, which produces 70-80% of Cape Town’s
vegetable and fresh produce (such as lettuce, onions, fresh fruit, bananas,
potatoes), utilises groundwater from the Cape Flats aquifer for irrigation.
Geology and Hydrogeology of the Cape Flats
The Cenozoic sediments of the Western Cape region are referred to as the
Sandveld Group (Hendey and Dingle 1983; Malan 1987; Theron et al. 1992).
The Cape Flats, which is a component of these Cenozoic sediments, are in
places up to 50 m thick (Theron et al. 1992). Figure 3 shows the geological
map of the area around the Cape Flats. Geological cross-section A-B-C, shown
in Figure 4, illustrates the lithological relationship of the Tertiary sediments in
the study area. Part of the area is covered by calcareous sands and limestone
deposits while silcrete, marine clays and bottom sediments occur in places
(Gerber 1976). The sandy aquifer is underlain by an extensive shaly bedrock
aquifer (Malmesbury Shale) (Gerber 1981).
There are reports on the hydrogeology of the area (Henzen, 1973; Gerber,
1976; Vandoolaeghe, 1989).

Hydrogeochemical Characterisation of Groundwater … 7
B
A
C
18°30'
18°30'
18°40'
18°40'
18°50'
18°50'34°1
0'
34°1
0'
34°0
'
34°0
'
33
°50'
33
°50'
F A L S E B A Y
±7.5 0 7.5 153.75
Km
Legend
Quaternary
Nardouw
Peninsula
Cape Granite Suite
Malmesbury
Karoo
Cross section lineA_B_C
T A B L E
B A Y
Figure 3. Geological map of the area around the Cape Flats.
Figure 4. Geological cross-sections A-B-C across the Cape Flats. Locations of some boreholes are shown e.g. BA15.
Updated hydrogeological information on the study area are described in
Meyer (2001) and reviewed in Adelana and Xu (2006). Groundwater level
Segun Michael Adelana, Yongxin Xu and Petr Vrbka 8
range from 0.2 to 20.6 m with a yearly variation between 0.001and 0.2 m
(Adelana, 2011).
Yield analysis of about 497 boreholes in the Sandveld Group indicates
that 41% of boreholes yield ≤0.5 L/s while 30% yields >2 L/s (Meyer, 2001).
Transmissivity values range from 32.5-619 m2/d (Adelana, 2011), but typical
values are between 200 and 350 m2/d (Gerber, 1981). Recharge rates using
Chloride Mass Balance range from 29.0 mm/a (5.5% of rainfall) to 46.6 mm/a
(8.1% of rainfall) for the years 2002-2005; while that from Water Table
Fluctuations vary between wet and dry years and between locations, with a
range of 17% to 47% of annual precipitation (Adelana et al., 2006).
GROUNDWATER MONITORING AND ANALYTICAL
SAMPLING
About 1,928 samples from 170 boreholes, monitored by the Western Cape
Department of Water Affairs (DWA), have been used in this study and are
available in the National Groundwater Database (NGDB). Most of the
boreholes are still active monitoring wells, even though some (which were
consistently monitored for groundwater quality in the past) have been
abandoned or decommissioned while some are only monitored for
groundwater level. A review of the existing groundwater quality monitoring
network indicates that the most of sampling programs have been carried out in
the active wells, mostly screened in the Cape Flats aquifer (10-30 m below the
water table). However, some of the active wells are screened at relatively
deeper depths (up to 138 m) in the Malmesbury Shale (weathered shale).
All groundwater quality monitoring data available in the Cape Town area
have been compiled (Table 1) and the distribution of wells and sampling
points in Figure 5. The sampling intervals differ, some wells are sampled
yearly, bi-annually or quarterly, some monthly. This historical data was
updated with the (2005-2007) sampling campaigns, which had bi-annual
sampling frequency. The dataset is separated into 2 sets with different length
of record: a) 1967-2001, and b) 2003-2007.
The pH, electrical conductivity (EC) and total dissolved solids (TDS)
were determined at the site using portable field meters and probes during the
2005-2007 sampling campaigns. The carbonate and bicarbonate were
determined by acid titration; chloride by AgNO3 titration; sulphate by a
titrimetric method using barium perchlorate after passing the samples through
Hydrogeochemical Characterisation of Groundwater … 9
cation exchange resin; phosphate by ascorbic acid method using
spectrophotometer; calcium and magnesium by EDTA titration; and sodium
and potassium by flame photometry in the laboratory of BEMLABS Pty,
Somerset West (Cape Town).
The analysed data were processed and interpreted with the programs
Hydrogeochemical Analysis Model (Kan et al. 2004) and AquaChem
(Waterloo 1999).
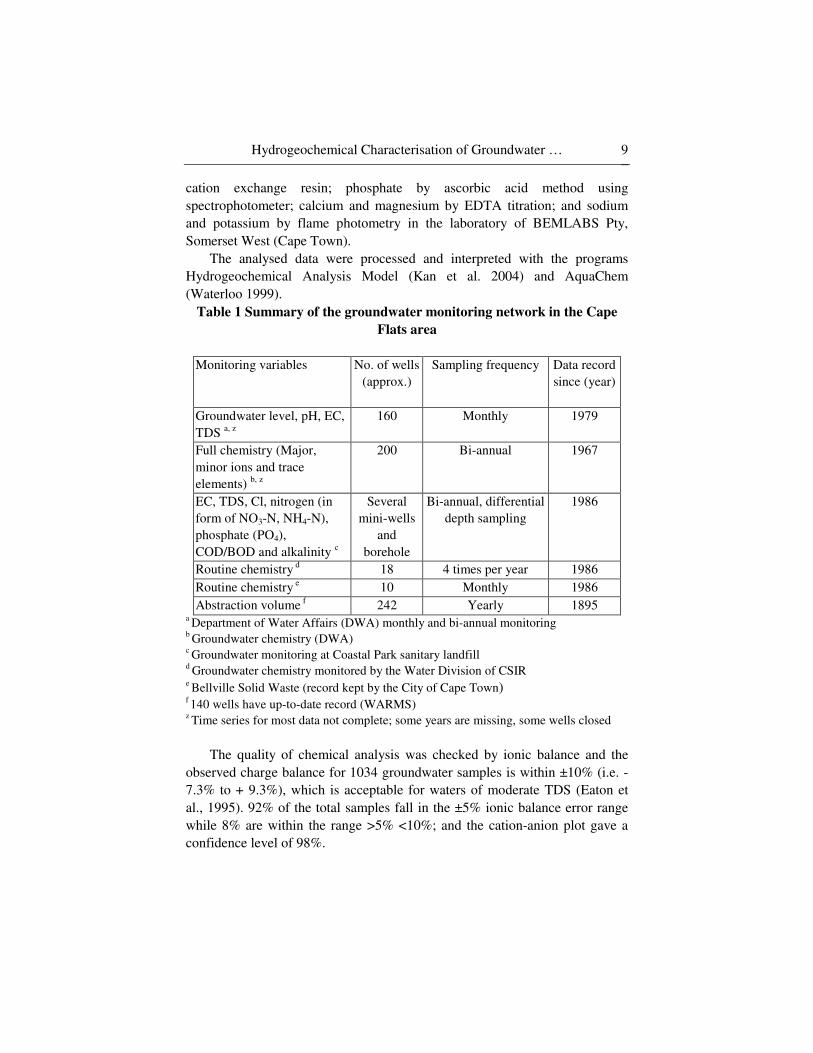
Table 1 Summary of the groundwater monitoring network in the Cape
Flats area
Monitoring variables No. of wells
(approx.)
Sampling frequency Data record
since (year)
Groundwater level, pH, EC,
TDS a, z
160 Monthly 1979
Full chemistry (Major,
minor ions and trace
elements) b, z
200 Bi-annual 1967
EC, TDS, Cl, nitrogen (in
form of NO3-N, NH4-N),
phosphate (PO4),
COD/BOD and alkalinity c
Several
mini-wells
and
borehole
Bi-annual, differential
depth sampling
1986
Routine chemistry d 18 4 times per year 1986
Routine chemistry e 10 Monthly 1986
Abstraction volume f 242 Yearly 1895 a Department of Water Affairs (DWA) monthly and bi-annual monitoring
b Groundwater chemistry (DWA)
c Groundwater monitoring at Coastal Park sanitary landfill
d Groundwater chemistry monitored by the Water Division of CSIR
e Bellville Solid Waste (record kept by the City of Cape Town)
f 140 wells have up-to-date record (WARMS)
z Time series for most data not complete; some years are missing, some wells closed
The quality of chemical analysis was checked by ionic balance and the
observed charge balance for 1034 groundwater samples is within ±10% (i.e. -
7.3% to + 9.3%), which is acceptable for waters of moderate TDS (Eaton et
al., 1995). 92% of the total samples fall in the ±5% ionic balance error range
while 8% are within the range >5% <10%; and the cation-anion plot gave a
confidence level of 98%.
Segun Michael Adelana, Yongxin Xu and Petr Vrbka 10
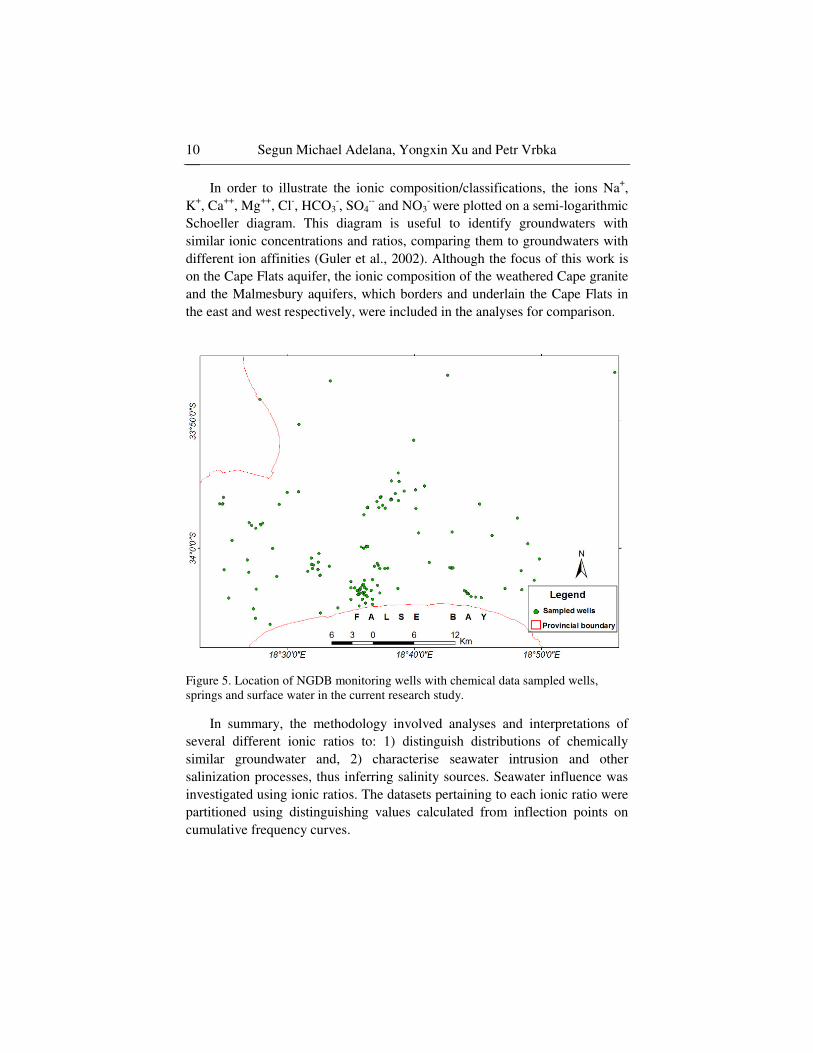
In order to illustrate the ionic composition/classifications, the ions Na+,
K+, Ca
++, Mg
++, Cl
-, HCO3
-, SO4
-- and NO3
- were plotted on a semi-logarithmic
Schoeller diagram. This diagram is useful to identify groundwaters with
similar ionic concentrations and ratios, comparing them to groundwaters with
different ion affinities (Guler et al., 2002). Although the focus of this work is
on the Cape Flats aquifer, the ionic composition of the weathered Cape granite
and the Malmesbury aquifers, which borders and underlain the Cape Flats in
the east and west respectively, were included in the analyses for comparison.
Figure 5. Location of NGDB monitoring wells with chemical data sampled wells, springs and surface water in the current research study.
In summary, the methodology involved analyses and interpretations of
several different ionic ratios to: 1) distinguish distributions of chemically
similar groundwater and, 2) characterise seawater intrusion and other
salinization processes, thus inferring salinity sources. Seawater influence was
investigated using ionic ratios. The datasets pertaining to each ionic ratio were
partitioned using distinguishing values calculated from inflection points on
cumulative frequency curves.
Hydrogeochemical Characterisation of Groundwater … 11
RESULTS AND DISCUSSIONS
Groundwater Hydrogeochemical Composition
The physical and chemical characterisation of the study area is based on
the following dataset: 30 samples from wells screened in weathered
Malmesbury Shale aquifer, 60 samples from the weathered/fractured Cape
Granite and 1,034 samples from the sandy Cape Flats aquifer. The summary
statistics of the physical and chemical parameters of groundwater sampled
from the Cape Flats aquifer is shown in Table 2. The pH values show a range
from 4.8 to 9.1, with a mean of 7.6. The groundwater temperature (from the
2005-2007 sampling) ranges between 17.2°C and 25.4°C.
There is a wide range of values and large standard deviations occur for
most of the measured parameters. For example, concentrations of Na+, and Cl
-
have ranges of 3.3-2,285.8 mg/l and 7.0-5,121.1 mg/l, respectively (Table 2).
Ca++
, Mg++
, and SO4-- also show large variations with ranges of 1.7-366 mg/l,
1.0-321 mg/l and 0.0-846 mg/l, respectively. HCO3- has a range of 0.1-753
mg/l while NO3- ranges from 0-248 mg/l. These wide distributions indicate
that chemical composition may have been affected by multiple processes. The
high concentrations of Na+ and Cl
- may indicate some level of saline water
impact or other salinization process. The concentrations of HCO3- and Ca
++
could reflect contribution by water-rock interaction (Park et al., 2005). Despite
the wide ranges of values as shown in Table 2, most parameters show log-
normal density distributions (Figure 6).
A distorted density distribution can be observed for K+ and NO3
-, with
concentrations towards low values. Na+ and Cl
- instead show higher log-
values. The distribution helps in explaining the relationships between various
measured parameters.
The relationships between various measured parameters are obvious from
the correlation coefficients presented in Table 3. Major correlations are:
1) Na+, Cl
- and Mg
++ have a strong correlation (>0.98); and Ca
++ and
SO4-- are correlated with this group (>0.69)
2) Fe++
, Na+, Ca
++, and Mg
++ concentrations are correlated (>0.80); Fe
++,
Mn+ are also correlated (0.72) and show good correlation to Na
+,
Mg++
, and Cl- (>0.67)
3) HCO3- and Ca
++ have a correlation of 0.67; HCO3
- show weak
correlation to other parameters.

Segun Michael Adelana, Yongxin Xu and Petr Vrbka 12
The pH and nitrate do not show meaningful correlation with most of the
other measured parameters. HCO3- shows the next lowest correlations with
other parameters but correlates to Ca++
(0.67). The EC and Cl- were highly
positively correlated with most of the other ions (except for K+, HCO3
- and
NO3-), which indicates that these ions are derived from the same source with a
limited composition range. These correlations form the basis of discussion for
the sources of solutes in groundwater.
Table 2. Statistics of physical and chemical parameters (mg/l) of
groundwater in the Cape Flats
Parameter Minimum Maximum Average Standard
Deviation
Number of
Samples
pH 4.8 9.1 7.6 0.5 1034
T ( °C) 17.2 25.4 19.9 1.5 120
EC
(µS/cm) 9.2 4320.0 222.7 408.3 1034
TDS 48.4 10370.0 1181.4 1831.8 1034
Na 3.3 2285.8 231.2 474.7 1034
Ca 1.7 366.0 100.4 75.0 1034
Mg 1 321.3 36.4 72.6 1034
K 0.3 74.9 4.6 7.3 1034
Cl 7.3 5121.1 471.3 1072.3 1034
SO4 0.3 846.6 70.7 82.5 1034
HCO3 4 753.0 191.5 102.2 1032
NO3 0 248.4 2.7 11.0 1034
PO4 0 11.4 0.1 0.6 1026
NH4 0 173.0 1.3 9.3 1011
Fe 0 30.3 3.0 6.0 599
Mn 0 2.3 0.1 0.2 591
Ba 0.002 2.0 0.1 0.2 475
Sr 0.001 5.8 1.4 0.8 502
Cu 0 2.7 0.0 0.1 566
Zn 0 1.3 0.0 0.1 540
F 0 3.1 0.2 0.2 1012
Ni 0 0.1 0.0 0.0 510
Rb 0.001 0.0 0.0 0.0 10
B 0.002 3.8 0.1 0.2 556
Al 0.006 1.3 0.8 0.4 476

Hydrogeochemical Characterisation of Groundwater … 13
As 0 1.0 0.1 0.1 493
Be 0.001 0.0 0.00 0.00 377
Cd 0 0.0 0.01 0.00 507
Co 0.001 0.1 0.02 0.01 379
Cr 0 0.1 0.01 0.01 496
Hg 0.002 14.0 0.05 0.77 333
Table 2. Statistics of physical and chemical parameters (mg/l) of
groundwater in the Cape Flats
(continued)
Parameter Minimum Maximum Average Standard
Deviation
Number of
Samples
Mo 0 0.1 0.01 0.01 453
Pb 0 0.9 0.08 0.10 534 2H (‰) -22.5 4.0 -13.2 6.2 22
18O (‰) -4.4 0.1 -2.9 1.0 22
Temperature, T. in C, pH in pH-units, EC in µS cm−1
,Ca to Al in mg l−1
, AS to Zn in
µg l−1
.
Table 3. Classification according TDS and distribution of groundwater
samples in the study area
TDS
(mg/l)
Classification Number and distribution of groundwater samples
Cape
Flats
sand
% Cape
Granite
% Malmesbury
Shale
%
<1,000 Fresh water 758 81.5 60 100 30 50
5,000 -
18,000
Brackish
water
100 10.8 - - 30 50
18,000
-40,000
Saltwater 68 7.3 - - - -
>40,000 Hypersaline 4 0.4 - - - -
Hydrogeochemical Characterisation and Classification
The classification based on TDS (mg/l) and the distribution of the
groundwater samples according to the aquifers is shown in Table 3. Seawater
Segun Michael Adelana, Yongxin Xu and Petr Vrbka 14
influence (18,000-40,000 mg/l TDS) or hypersaline water (TDS >40,000mg/l),
was traced in 72 samples from the Cape Flats aquifer only - no such high TDS
found in the other two aquifers (Table 3).
The average equivalent concentration of the major ions of groundwaters in
the study area is plotted in the Schoeller diagram (Figure 7).

Hydrogeochemical Characterisation of Groundwater … 15
Figure 6. Distribution of major ions in groundwater samples from the Cape Flats
aquifer.
Segun Michael Adelana, Yongxin Xu and Petr Vrbka 16
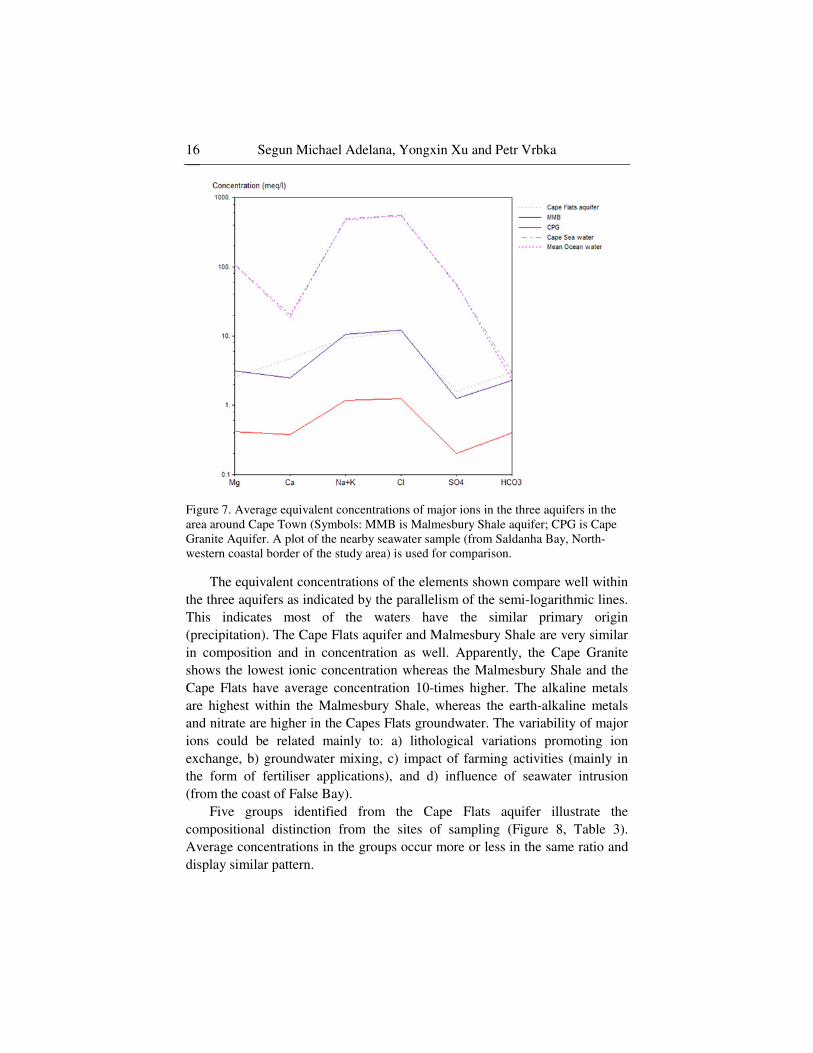
Figure 7. Average equivalent concentrations of major ions in the three aquifers in the
area around Cape Town (Symbols: MMB is Malmesbury Shale aquifer; CPG is Cape Granite Aquifer. A plot of the nearby seawater sample (from Saldanha Bay, North-western coastal border of the study area) is used for comparison.
The equivalent concentrations of the elements shown compare well within
the three aquifers as indicated by the parallelism of the semi-logarithmic lines.
This indicates most of the waters have the similar primary origin
(precipitation). The Cape Flats aquifer and Malmesbury Shale are very similar
in composition and in concentration as well. Apparently, the Cape Granite
shows the lowest ionic concentration whereas the Malmesbury Shale and the
Cape Flats have average concentration 10-times higher. The alkaline metals
are highest within the Malmesbury Shale, whereas the earth-alkaline metals
and nitrate are higher in the Capes Flats groundwater. The variability of major
ions could be related mainly to: a) lithological variations promoting ion
exchange, b) groundwater mixing, c) impact of farming activities (mainly in
the form of fertiliser applications), and d) influence of seawater intrusion
(from the coast of False Bay).
Five groups identified from the Cape Flats aquifer illustrate the
compositional distinction from the sites of sampling (Figure 8, Table 3).
Average concentrations in the groups occur more or less in the same ratio and
display similar pattern.
Hydrogeochemical Characterisation of Groundwater … 17
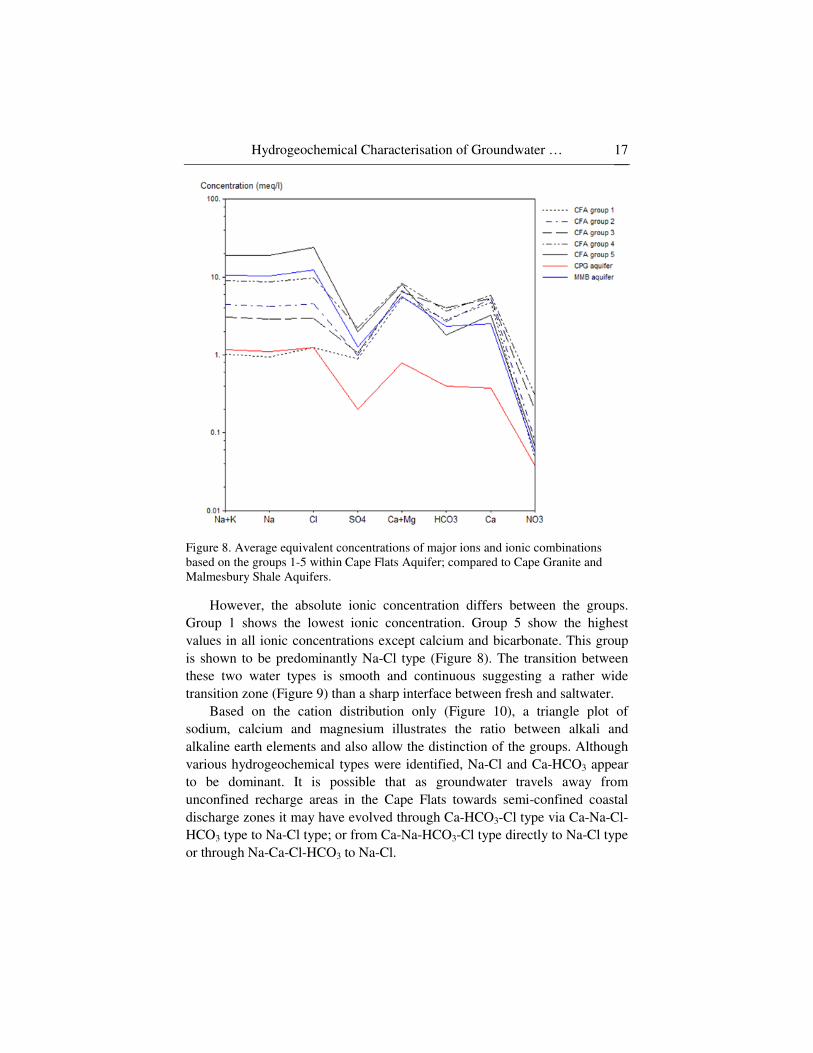
Figure 8. Average equivalent concentrations of major ions and ionic combinations based on the groups 1-5 within Cape Flats Aquifer; compared to Cape Granite and Malmesbury Shale Aquifers.
However, the absolute ionic concentration differs between the groups.
Group 1 shows the lowest ionic concentration. Group 5 show the highest
values in all ionic concentrations except calcium and bicarbonate. This group
is shown to be predominantly Na-Cl type (Figure 8). The transition between
these two water types is smooth and continuous suggesting a rather wide
transition zone (Figure 9) than a sharp interface between fresh and saltwater.
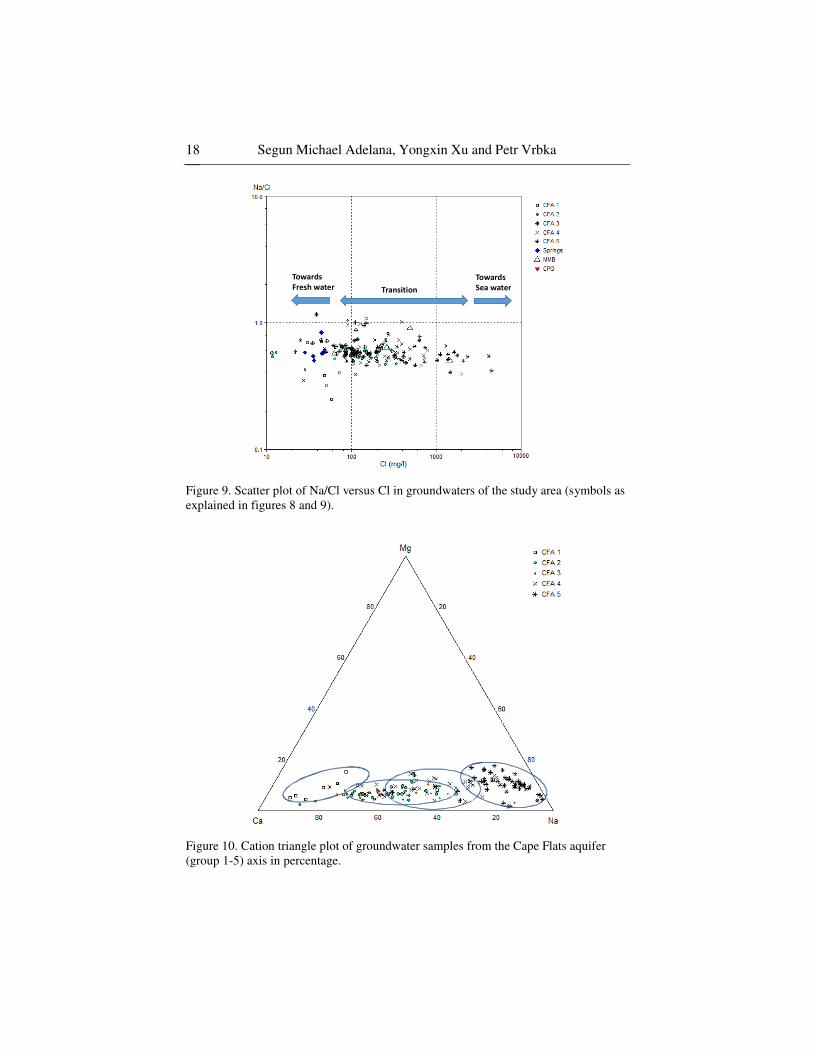
Based on the cation distribution only (Figure 10), a triangle plot of
sodium, calcium and magnesium illustrates the ratio between alkali and
alkaline earth elements and also allow the distinction of the groups. Although
various hydrogeochemical types were identified, Na-Cl and Ca-HCO3 appear
to be dominant. It is possible that as groundwater travels away from
unconfined recharge areas in the Cape Flats towards semi-confined coastal
discharge zones it may have evolved through Ca-HCO3-Cl type via Ca-Na-Cl-
HCO3 type to Na-Cl type; or from Ca-Na-HCO3-Cl type directly to Na-Cl type
or through Na-Ca-Cl-HCO3 to Na-Cl.
Segun Michael Adelana, Yongxin Xu and Petr Vrbka 18
Towards
Sea water
Towards
Fresh water Transition
Figure 9. Scatter plot of Na/Cl versus Cl in groundwaters of the study area (symbols as
explained in figures 8 and 9).
Figure 10. Cation triangle plot of groundwater samples from the Cape Flats aquifer
(group 1-5) axis in percentage.
Hydrogeochemical Characterisation of Groundwater … 19
Sea
Fresh
Conservative
mixing
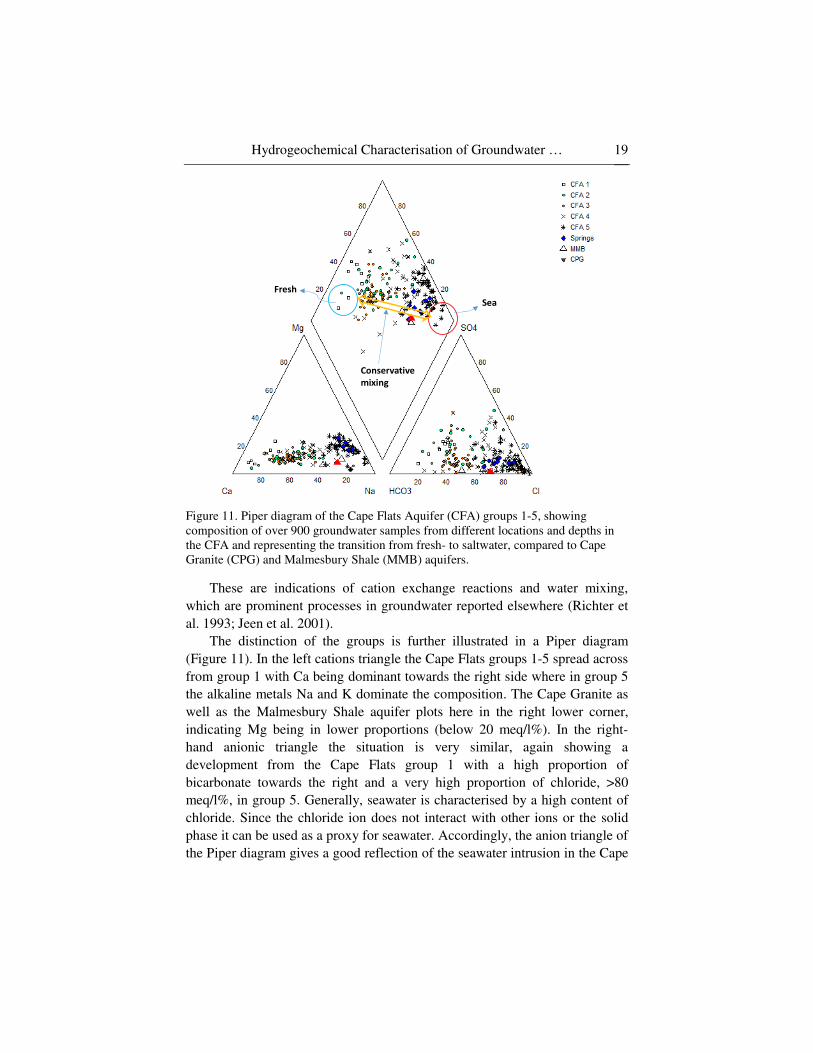
Figure 11. Piper diagram of the Cape Flats Aquifer (CFA) groups 1-5, showing
composition of over 900 groundwater samples from different locations and depths in the CFA and representing the transition from fresh- to saltwater, compared to Cape Granite (CPG) and Malmesbury Shale (MMB) aquifers.
These are indications of cation exchange reactions and water mixing,
which are prominent processes in groundwater reported elsewhere (Richter et
al. 1993; Jeen et al. 2001).
The distinction of the groups is further illustrated in a Piper diagram
(Figure 11). In the left cations triangle the Cape Flats groups 1-5 spread across
from group 1 with Ca being dominant towards the right side where in group 5
the alkaline metals Na and K dominate the composition. The Cape Granite as
well as the Malmesbury Shale aquifer plots here in the right lower corner,
indicating Mg being in lower proportions (below 20 meq/l%). In the right-
hand anionic triangle the situation is very similar, again showing a
development from the Cape Flats group 1 with a high proportion of
bicarbonate towards the right and a very high proportion of chloride, >80
meq/l%, in group 5. Generally, seawater is characterised by a high content of
chloride. Since the chloride ion does not interact with other ions or the solid
phase it can be used as a proxy for seawater. Accordingly, the anion triangle of
the Piper diagram gives a good reflection of the seawater intrusion in the Cape
Segun Michael Adelana, Yongxin Xu and Petr Vrbka 20
Flats. The water of the Malmesbury Shale aquifer plots close to group 5 while
Cape Granite water touches group 4 in the Na+K/Na-Cl end of the plot. Again,
the sulphate content is in general low, as indicated by value mainly <20
meq/l%. While all samples are characterised by very low SO4-2
concentrations,
HCO3- is the dominating anion at lower depths and away from the coast, areas
which are flushed by freshwater.
Salinization
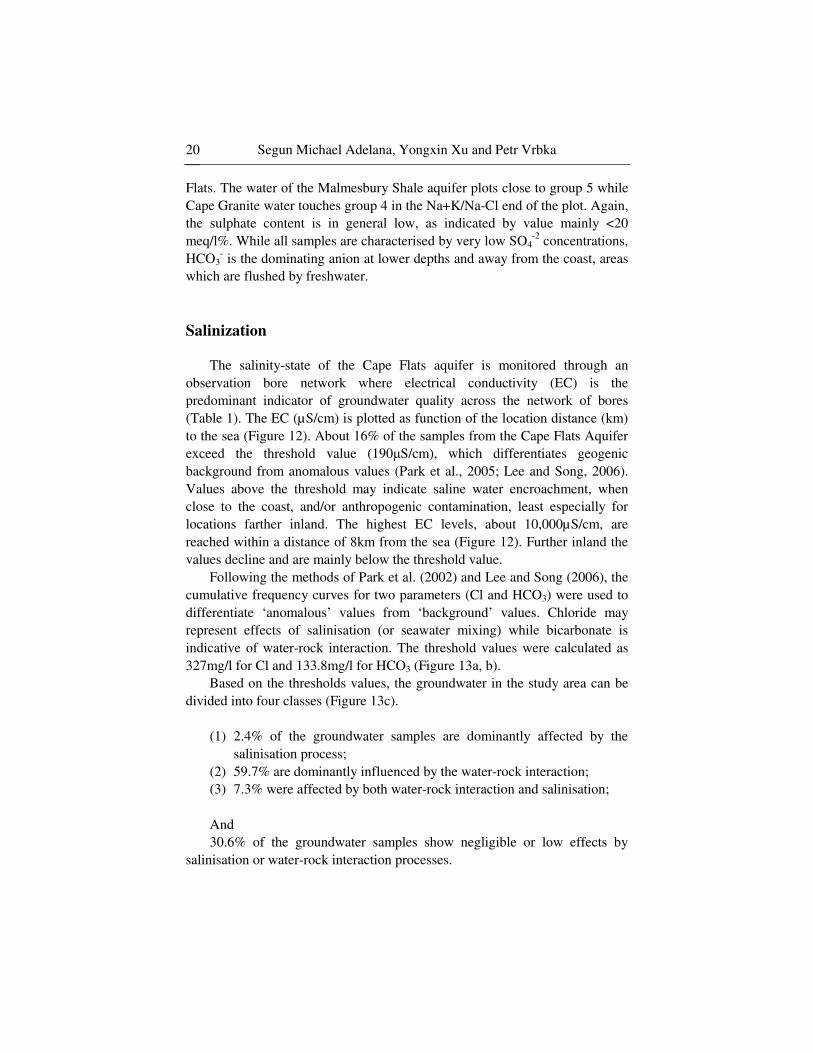
The salinity-state of the Cape Flats aquifer is monitored through an
observation bore network where electrical conductivity (EC) is the
predominant indicator of groundwater quality across the network of bores
(Table 1). The EC (µS/cm) is plotted as function of the location distance (km)
to the sea (Figure 12). About 16% of the samples from the Cape Flats Aquifer
exceed the threshold value (190µS/cm), which differentiates geogenic
background from anomalous values (Park et al., 2005; Lee and Song, 2006).
Values above the threshold may indicate saline water encroachment, when
close to the coast, and/or anthropogenic contamination, least especially for
locations farther inland. The highest EC levels, about 10,000µS/cm, are
reached within a distance of 8km from the sea (Figure 12). Further inland the
values decline and are mainly below the threshold value.
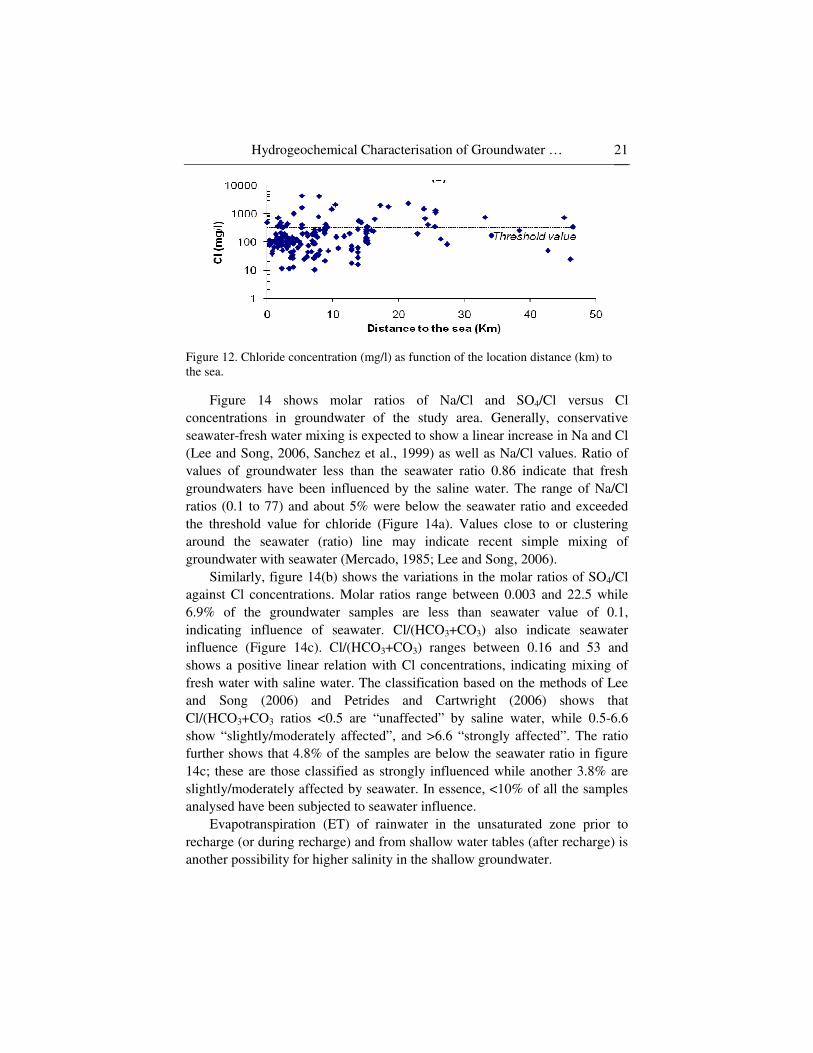
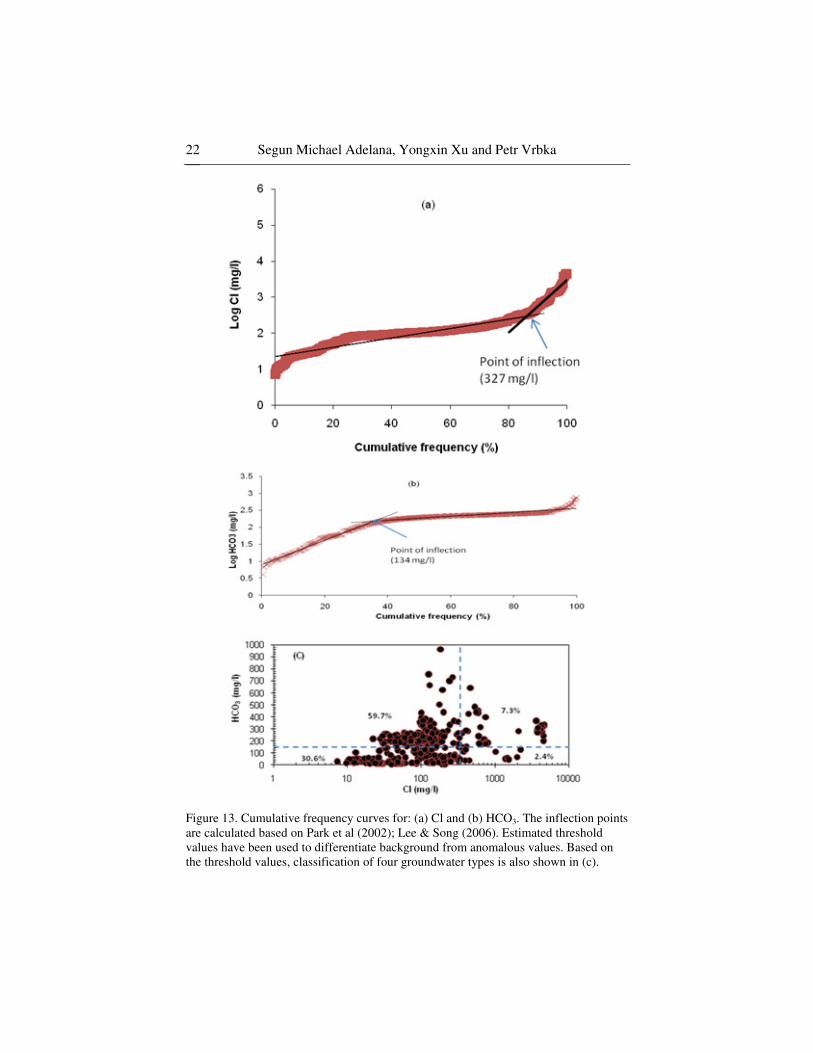
Following the methods of Park et al. (2002) and Lee and Song (2006), the
cumulative frequency curves for two parameters (Cl and HCO3) were used to
differentiate ‘anomalous’ values from ‘background’ values. Chloride may
represent effects of salinisation (or seawater mixing) while bicarbonate is
indicative of water-rock interaction. The threshold values were calculated as
327mg/l for Cl and 133.8mg/l for HCO3 (Figure 13a, b).
Based on the thresholds values, the groundwater in the study area can be
divided into four classes (Figure 13c).
(1) 2.4% of the groundwater samples are dominantly affected by the
salinisation process;
(2) 59.7% are dominantly influenced by the water-rock interaction;
(3) 7.3% were affected by both water-rock interaction and salinisation;
And
30.6% of the groundwater samples show negligible or low effects by
salinisation or water-rock interaction processes.
Hydrogeochemical Characterisation of Groundwater … 21
Figure 12. Chloride concentration (mg/l) as function of the location distance (km) to the sea.
Figure 14 shows molar ratios of Na/Cl and SO4/Cl versus Cl
concentrations in groundwater of the study area. Generally, conservative
seawater-fresh water mixing is expected to show a linear increase in Na and Cl
(Lee and Song, 2006, Sanchez et al., 1999) as well as Na/Cl values. Ratio of
values of groundwater less than the seawater ratio 0.86 indicate that fresh
groundwaters have been influenced by the saline water. The range of Na/Cl
ratios (0.1 to 77) and about 5% were below the seawater ratio and exceeded
the threshold value for chloride (Figure 14a). Values close to or clustering
around the seawater (ratio) line may indicate recent simple mixing of
groundwater with seawater (Mercado, 1985; Lee and Song, 2006).
Similarly, figure 14(b) shows the variations in the molar ratios of SO4/Cl
against Cl concentrations. Molar ratios range between 0.003 and 22.5 while
6.9% of the groundwater samples are less than seawater value of 0.1,
indicating influence of seawater. Cl/(HCO3+CO3) also indicate seawater
influence (Figure 14c). Cl/(HCO3+CO3) ranges between 0.16 and 53 and
shows a positive linear relation with Cl concentrations, indicating mixing of
fresh water with saline water. The classification based on the methods of Lee
and Song (2006) and Petrides and Cartwright (2006) shows that
Cl/(HCO3+CO3 ratios <0.5 are “unaffected” by saline water, while 0.5-6.6
show “slightly/moderately affected”, and >6.6 “strongly affected”. The ratio
further shows that 4.8% of the samples are below the seawater ratio in figure
14c; these are those classified as strongly influenced while another 3.8% are
slightly/moderately affected by seawater. In essence, <10% of all the samples
analysed have been subjected to seawater influence.
Evapotranspiration (ET) of rainwater in the unsaturated zone prior to
recharge (or during recharge) and from shallow water tables (after recharge) is
another possibility for higher salinity in the shallow groundwater.
Segun Michael Adelana, Yongxin Xu and Petr Vrbka 22
Figure 13. Cumulative frequency curves for: (a) Cl and (b) HCO3. The inflection points
are calculated based on Park et al (2002); Lee & Song (2006). Estimated threshold values have been used to differentiate background from anomalous values. Based on the threshold values, classification of four groundwater types is also shown in (c).

Hydrogeochemical Characterisation of Groundwater … 23
Figure 14. Molar ratios: (a) Na/Cl (b) SO4/Cl; and (c) Cl/(HCO3+CO3) versus Cl concentrations in Cape Flats aquifer groundwater.
Shallow groundwater, much of which is affected by agriculture, may have
undergone some degree of ET. This is due to the large input of irrigation water
Segun Michael Adelana, Yongxin Xu and Petr Vrbka 24
that undergoes transpiration by crops, and the resulting high water tables
(locally < 1 m from the surface), which allow secondary ET (directly from the
water table) to occur after recharge. This process is common in many semi-
arid environments (Cartwright et al., 2006; Han et al., 2010; Currell et al.,
2011).
Cation Exchange and Hydrogeochemical Evolution
Based on the preceding analyses, groundwater from the Cape Flats could
be a mixture of recently recharged precipitation, which have undergone cation
exchange reactions or mixed in relative proportions with seawater encroaching
laterally from the coast. Major ion chemistry (e.g. molar ion ratios), are
particularly useful in assessing sources of solutes and characterising
hydrogeochemical evolution in aquifers (e.g. Edmunds et al. 1982; Herczeg
and Edmunds 2000; Cartwright et al. 2004).
Cation exchange may also relate to large-scale disturbance and/or transient
conditions in an aquifer (Currell et al., 2011); for example, high levels of
pumping and/or mixing with irrigation water in recent decades may have
mobilized Na that was otherwise relatively immobile in clay lenses. This
would also add minor amounts of Na+; however, the dominant source of
sodium in groundwater is cation exchange with Ca2+
in the clay lenses of the
deeper (Malmesbury) aquifer.
Exchange of ions is known to occur in different aquifer lithologies (e.g.
Edmunds and Walton, 1983; Walraevens and Van Camp, 2005). As previously
described, the quaternary deposits consist largely of aeolian sand, but minor
fluvial to marine deposits also occur. The inter-relationships of the various
formations are known from many boreholes and exposures within and outside
the greater Cape Town area (Theron et al. 1992). Generally, cation exchange is
favourable in relatively low ionic-strength waters (e.g. at [Na] < 0.1 M) where
there is an abundance of negatively charged mineral surfaces, as these surfaces
generally have greater affinity for divalent than monovalent cations (Stumm
and Morgan, 1996). In the Cape Flats aquifer, the exchange likely occurs in
lacustrine clay lenses interlayered with peat and argillaceous sand in places,
which would contain abundant exchange sites. The shallow clayey and
calcareous sands (widespread in the Cape Flats) also have a large potential
primary Na-source, as the hyper-saline water (laterally from the coast) from
which they were deposited had Na-rich chemistry (Adelana et al., 2010).
Hydrogeochemical Characterisation of Groundwater … 25
Cation exchange may additionally/alternatively occur within the loess that
makes up the bulk of the aquifer matrix.
The occurrence of Na-Ca exchange in the aquifer has implications for the
evolution of groundwater chemistry in the Cape Flats. Several other studies
have shown mobilization of As and F in groundwater occurring due to changes
in Na/Ca ratios in aquifer settings (Gomez et al., 2009; Currell et al., 2011).
Despite the strong correlation between the concentrations of these major ions
there is some variation in their ratios as well as in relation to other cations and
molar ratios (Figure 15a-d). Molar Na/Cl ratios range from as high as 1.95
(Figure 15a), with many between 0.6 and 1.2 (essentially Cape Flats
groundwater). The high Na/Cl ratios of the freshest groundwaters are probably
controlled by water-rock interaction, for example, albite weathering by
2NaAlSi3O8 + 9H2O + 2H2CO3 → Al2Si2O5(OH)4 + 2Na+ + 2HCO3
- +
4H4SiO4 (1)
(albite) (kaolinite)
Samples with Na/Cl ratios of 0.8–0.99 are probably due to evaporation of
rainfall which has a Na/Cl ratio of 0.88±0.1 (Adelana et al., 2011). Samples
with low Na/Cl ratios are probably the result of Na loss or exchange onto soils
and clays. The high HCO3/Cl ratios (up to 2.55, in the fresh groundwater,
Figure 15b) may be due to the weathering of feldspars (as illustrated in
equation 1), which may occur during the initial stages of water rock
interaction.
Ca and Mg (Figure 15c-d) may have been derived from dissolution of
silicate minerals (e.g. feldspar or biotite), and/or cation exchange of Na for Ca
and Mg on clay minerals while dissolution of K-feldspar may be the major
source of K+. This is probably the case around Mitchells’ Plain, very close to
the coastline, where Ca is the dominant cation. There is the possibility that the
groundwater rich in sodium ions (Na+), as a result of seawater interaction,
invades organic peat layers rich in calcium (Ca2+
). In this case, the sodium ions
with a valency of (+1) replace the calcium with a valency of (+2). The reaction
showing the cation exchange for the peaty layer is as follows:
2Na+ + Ca – Peat2 → 2Na – Peat + Ca
2+ (2)
The effects of anthropogenic contamination in shallow groundwater (e.g.
fertiliser application) may be reflected in the increasing concentrations of NO3
in groundwater from 1983-1993 (Figure 16), which are mostly in excess of the

Segun Michael Adelana, Yongxin Xu and Petr Vrbka 26
drinking water standard of 10 mg/l (as NO3-N). These are from wells around
Ottery/Philippi/Mitchell’s Plain area, where active farming activities are
practised all-the-year round.
In contrast to salinity, groundwater flowing from the east has relatively
low NO3 levels. Agricultural activities are extensive in the northeast catchment
of Macassar. This may be comparable to the intensive vegetable farming in the
capture zone of the Cape Flats aquifer around Philippi/Ottery area, where
>70% of vegetable production in the Western Cape are derived, and as such a
good source of livelihood and income for this community dwellers. The
current application rate of fertilizers has not been quantified but estimated as
twofold higher than what it was in the 1980s (Adelana, 2011). There are no
prescribed fertilizer application rate by law or restrictions on the quantity of
fertilisers that can be applied to a given area of land, as it is in other parts of
the world (CSUCE, 1994; USEPA, 2010; EA, 2013).
CONSTRAINTS AND MANAGEMENT IMPLICATIONS
From the samples analysed in this study, more than 85 per cent have Na
and Cl concentrations below the WHO drinking water standard and essentially
all the major, minor ions and trace elements are within the limits acceptable.
Figure 15(a-d). Molar ratios for groundwater in the study area.

Hydrogeochemical Characterisation of Groundwater … 27
19
85
1986
1987
1988
1990
1991
19
92
1993
BH88847
BH88849
BH88850
BH88851
BH88852
BH88874
0
2
4
6
8
10
12
14
16
18
20N
O3 (
mg
/L)
Figure 16. Variation in NO3 concentrations in selected wells (in the Cape Flats).
This is an indication of overall good water quality and suitability for the
purpose intended for the City of Cape Town. However, there are concerns
about the level of nitrate concentrations in some areas, and high levels of
chloride ions (close to seawater) in some boreholes within 10 km of the coast
of False Bay.
Moreover, private (household) use of groundwater from the Cape Flats
aquifer is widespread and increased from 2000-2007 (Colvin et al., 2007),
especially since the increase in potable water tariffs in early 2000 (CCT,
2001). In response, the City of Cape Town has adopted an integrated approach
to water management, which seeks a balance between water conservation and
water demand management initiatives and conventional supply augmentation
(Colvin et al., 2009).
Although the Department of Water Affairs (through the Cape Town
regional office) in regulating groundwater development introduced strategies
and management measures, the capacity-constraint within the department itself
may limit the ability to continue groundwater monitoring. The cumulative
effect of these could mean further deterioration of groundwater quality in the
short and longer-term. Deterioration of groundwater quality if unchecked and

Segun Michael Adelana, Yongxin Xu and Petr Vrbka 28
ill-managed could limit the quantity of available (usable) groundwater in this
area and may cause potential crisis for the local economy. Therefore,
continuous monitoring is inevitable and detail investigation to determine the
position of seawater wedge (e.g. through numerical modelling) with
appropriate measures becomes necessary.
The Cape Flats aquifer is vulnerable to many outside influences: the
informal settlement of the Khayelitsha (poor sanitation) and the Philippi
agricultural area (where fertilizer application takes place regularly) and
numerous nodal sources of pollution (e.g. Waste Water Treatment Works,
WWTW and the waste disposal sites). It may, therefore, be necessary to issue
strong land use restrictions in order to prevent further contamination of
groundwater. Public support/participation and education should be
encouraged.
Finally, the dependence on groundwater is growing across the country.
About 20% of water supplies in South Africa come from groundwater and
over 60% of the population is dependent on it at some time of the year
(DWAF, 2009). In recognition of this, the national strategy “Water for Growth
and Development” through the Department of Water and Environmental
Affairs” intends to grow groundwater supplies from nine to 10% by 2040
(DWAF, 2009). Therefore, adequate monitoring is required to keep the
balance between water conservation and water demand.
SUMMARY AND CONCLUSION
The study examined physical and chemical characteristics of groundwater
in the Cape Flats based on available historical data (1967-2001) and more
recent updated sampling (2005-2007). Groundwater in the Cape Flats aquifer
is predominantly of Na-Cl and Ca-Na-HCO3-Cl type water. Whereas Na-Cl
and Ca-HCO3 types are dominant, various hydrogeochemical types were
observed between the three aquifers of the area. Concentrations of major ions
and ionic ratios were used to understand the evolution of groundwater
chemistry within the Cape Flats aquifer system and its distinctions from other
two aquifers (weathered Cape Granite suites and Malmesbury Shale).
Groundwater in the Cape Flats was categorised into four:
(1) 59.7% are dominantly influenced by the water-rock interaction;
(2) 2.4% of the groundwater samples are dominantly affected by the
salinization process;

Hydrogeochemical Characterisation of Groundwater … 29
(3) 7.3% were affected by both water-rock interaction and salinization;
and
30.6% of the groundwater samples show negligible or low effects of
salinization or water-rock interaction processes.
Most of the samples from Cape Flats aquifer have NaCl values below the
WHO limits for drinking water (85.5% of samples below 250 mg/l Na and
79% are below 250 mg/l Cl-), an indication of good water quality for the
purpose of water supply augmentation intended for the City of Cape Town.
However, there are concerns about some level of nitrate concentrations,
resulting from agricultural practices and high levels of chloride ions in some
boreholes indicating seawater encroachment from the coast and estuaries.
Deterioration of groundwater quality from seawater influence could limit the
amount of available sustainable groundwater in this area and may cause
potential crisis for the local economy.
Reviewed by Prof. Tamiru Abiye, Professor of Hydrogeology, University
of Witswaterstrand, Johannesburg, South Africa and Dr Jude Cobbing, former
hydrogeologist at the British Geological Survey, a researcher and consultant in
South Africa.
REFERENCES
Adelana, S. M. A. (2011). Groundwater resource evaluation and protection.
Saarbrücken, LAMBERT Academic Publishing GmbH and Co., 296p.
Adelana, S. M. A.; Xu, Y. (2008). Impacts of land-use changes on a shallow
coastal aquifer, South-Western Cape, South Africa. Proc. XXXVI
Congress of the International Association of Hydrogeologists (IAH),
Toyama, Japan, 28 October -2 November.
Adelana, S. M. A; Xu, Y; Adams, S. (2006). Identifying sources and
mechanism of groundwater recharge in the Cape Flats, South Africa:
Implications for sustainable resource management. Proc. XXXIV
Congress of the International Association of Hydrogeologists (IAH),
Beijing, China, 9-13 October 2006.
Adelana, S. M. A; Xu, Y; Vrbka, P. (2010). An integrated conceptual model
for the development and management of the Cape Flats aquifer, South
Africa. Water SA, 36 (4): 461-474.
Segun Michael Adelana, Yongxin Xu and Petr Vrbka 30
Barber, C; Otto, C. J.; Bates, L. E.; Taylor, K. J. (1996). Evaluation of the
relationship between land-use changes and groundwater quality in a water
supply catchment, using GIS technology: The Gwelup wellfield, Western
Australia. Hydrogeology J., 4:6-19.
Cabrera, M. C; Custodio, E. (2004). Groundwater flow in a volcanic–
sedimentary coastal aquifer: Telde area, Gran Canaria, Canary Islands,
Spain. Hydrogeology J., 10.1007/s10040-003-0316-y, Springer-Verlag.
Colvin, C. A.; Le Maitre, D.; Lotter, D. (2009). Climate Change and Water
Resources. ScienceScope, CSIR.
Colvin, C.; Le Maitre, D.; Saayman, I.; Hughes, S. (2007). An introduction to
Aquifer Dependent Ecosystems in South Africa. WRC TT.
Cartwright, I.; Weaver, T.; Fulton, S.; Nichol, C.; Reid, M.; Cheng, X. (2004).
Hydrogeochemical and isotopic constraints on the origins of dryland
salinity, Murray Basin, Victoria, Australia. Appl. Geochem., 19:1233-
1254.
City of Cape Town, CCT (2001) Water resources and water resource planning.
Water Services Development Plan, December 2001, City of Cape Town.
Colorado State University Cooperative Extension, CSUCE. (1994). Best
Management Practices for Nitrogen Fertilization (XCM-172). (1994,
August). Retrieved February 19, 2014: http://www.ext.colostate.edu/
PUBS/CROPS/pubcrop.html#soil
Currell, M. J.; Cartwright, I. (2011). Major-ion chemistry, δ13
C and 87
Sr/86
Sr
as indicators of hydrochemical evolution and sources of salinity in
groundwater in the Yuncheng Basin, China. Hydrogeology J., 19:835-850.
Custodio, E. (2002). Coastal aquifers as important natural hydrogeological
structures. In: Bocanegra E., Martinez D and Massone H. (eds.)
Groundwater and Human Development, Mar de Plata, Argentina,
pp.1905- 1918.
Djabri, L.; Laouar, R.; Hani, A.; Mania, J.; Mudry, J. (2003). The origin of
water salinity on the Annaba coast (NE Algeria). Proceedings of
symposium HSO2a held during IUGG2003 at Sapporo; IAHS Publ. No
280, pp. 229-35.
DWAF (2009). Water for Growth and Development Framework (version 7).
Department of Water Affairs and Forestry, June 2009.
Edmunds, W. M.; Walton, N. R. G. (1983). The Lincolnshire Limestone -
Hydrogeochemical evolution over a ten-year period. J. Hydrol., 61:201–
211.

Hydrogeochemical Characterisation of Groundwater … 31
Edmunds, W. M.; Bath, A. H.; Miles, D. L. (1982) Hydrochemical evolution
of the East Midlands Triassic sandstone aquifer, England. Geochim.
Cosmochim. Acta., 46:2069-81.
Edmunds, W. M. (2012). Limits to the availability of groundwater in Africa.
Environ. Res. Lett., 7: 021003 (3pp) doi:10.1088/1748-9326/7/2/021003.
El Moujabber, M; Bou Samra, B.; Darwish, T.; Atallah, T. (2006).
Comparison of different indicators for groundwater contamination by
seawater intrusion on the Lebanese Coast. Water Resources Management,
20(2):161-180.
Environment Agency, EA (2013). Fertiliser Recommendations for
Agricultural and Horticultural Crops, The Fertiliser Manual (RB209) on
the Defra website http://www.defra.gov.uk/rb209
Gaaloul, N.; Pliakas, F.; Kallioras, A., Schuth, C., Marinos, P. (2012).
Simulation of Seawater Intrusion in Coastal Aquifers: Forty Five-Years
Exploitation in an Eastern Coast Aquifer in NE Tunisia. The Open
Hydrology Journal, 6, (Suppl 1-M6) 31-44.
Gerber, A. (1976). An investigation into the hydraulic characteristics of the
groundwater source in the Cape Flats. Unpublished M.Sc. thesis,
University of the Orange Free State, Bloemfontein.
Gerber, A. (1981). A digital model of groundwater flow in the Cape Flats.
CSIR Contract Report C WAT 46, Pretoria.
Giménez, E.; Morell, I. (1997). Hydrogeochemical analysis of salinization
processes in the coastal aquifer of Oropesa (Castellón, Spain). Environ.
Geol., 29:118–131.
Green, E. D. (2006). Regional evaluation of saltwater intrusion of coastal
aquifers in Caribbean Islands. Evaluation of the OAS-Funded Regional
Project Report: Retrieved on May 20, 2014 from http://portal.oas.org/
LinkClick.aspx?fileticket=9MUvoCFnOuM%3Dandtabid=1473
Güler, C., Thyne, G. D., McCray, J. E, Turner, A. K., 2002. Evaluation of
graphical and multivariate statistical methods for classification of water
chemistry data. Hydrogeol. J., 18: 455-474.
Han, D. M.; Liang, X.; Currell, M. J.; Jin, M. G.; Zhong, W. J.; Liu, C. M.;
Song, X. F. (2010). Environmental isotopic and hydrochemical
characteristics of groundwater systems in Daying and Qicun geothermal
fields, Xinzhou Basin, Shanxi, China. Hydrol. Process, 22:3157–3176.
Hendey, Q. B.; Dingle, R. V. (1983). Onshore sedimentary phosphate deposits
in South Western Africa. Technical Report Joint Geological
Survey/University of Cape Town Marine Geoscience Unit, 14, p27-40.
Segun Michael Adelana, Yongxin Xu and Petr Vrbka 32
Henzen M (1973). The reclamation, storage and abstraction of purified sewage
effluents in the Cape Peninsula (in Afrikaans). D.Sc. Thesis, University of
the Orange Free State, Bloemfontein.
Herczeg, A. L.; Edmunds, W. M. (2000). Inorganic ions as tracers. In: Cook P,
Herczeg A (eds) Environmental tracers in subsurface hydrology. Kluwer,
Boston, pp 31–77.
Jeen, S. K.; Kim, J. M.; Ko, K. S.; Yum, B.; Chang, H. W. (2001).
Hydrogeochemical characteristics of groundwater in a mid-western coastal
aquifer system, Korea. Geosci. J., 5:339-348.
Kan, A.; Xu, Y.; Usher, B. (2004). Hydrogeochemical Analysis Model (HAM)
in excel: An overview of input, equations and use. Institute for
Groundwater Studies, University of the Free State, Bloemfontein.
Lee, J. Y.; Song, S. H. (2006). Evaluation of groundwater quality in coastal
areas: implications for sustainable agriculture. Environ. Geol., 10.1007/
s00254-006-0560-2.
Malan, J. A. (1987). The Bredasdorp Group in the area between Gansbaai and
Mossel Bay. South African Journal of Science, 83: 506-507.
Mercado, A. (1985). The use of hydrogeochemical patterns in carbonate sand
and sandstone aquifers to identify intrusion and flushing of saline waters.
Ground Water, 23:635-645.
Meyer, P. S. (2001). An explanation of the 1:500 000 hydrogeological map of
Cape Town 3317. Department of Water Affairs and Forestry, 59pp.
Park, S. C.; Yun, S. T.; Chae, G. T.; Yoo, I. S.; Shin, K. S.; Heo, C. H.; Lee, S.
K. (2005). Regional hydrochemical study on salinization of coastal
aquifers, western coastal area of South Korea. J. Hydrol., 313:182-194.
Park, S. C.; Yun, S. T.; Chae, G. T.; Lee, S. K. (2002). Hydrochemistry of
shallow groundwaters in western coastal area of Korea: a study on
seawater mixing in coastal aquifers. J. KoSSGE., 7:63-77.
Petalas, C. P.; Diamantis, I. B. (1999). Origin and distribution of saline
groundwaters in the upper Miocene aquifer system, coastal Rhodope area,
northeastern Greece. Hydrogeol. J., 7(3):305–316.
Pulido-Bosch, A.; Tahiri, A.; Vallejos, A. (1999). Hydrogeochemical
characteristics of processes in the Temara Aquifer in Northwestern
Morocco. Water Air Soil Pollut., 114: 323-337.
Richter, B. C.; Kreitler, C. W.; Bledsoe, B. E. (1993). Geochemical techniques
for identifying sources of ground-water salinization. CRC, New York.
Sadeg, S. A.; Karahanoglu, N. (2008). Numerical assessment of seawater
intrusion in the Tripoli region, Libya. Environ. Geol., 40: 1151-68.

Hydrogeochemical Characterisation of Groundwater … 33
Sanchez, M. F.; Pulido-Bosch, A.; Sanchez, L.; Vallejos-Izquierdo, A. (2002).
Identification of the origin of salinization in groundwater using minor ions
(Lower Andarax, Southeast Spain). Sci. Total Environ., 297:43-58.
Sinclair, A. J. (1974). Selection of thresholds in geochemical data using
probability graphs. J. Geochem. Explor., 3:129-149.
Stuyfzand, P. J. (1999). Patterns in groundwater chemistry resulting from
groundwater flow. Hydrogeol. J., 7(1):15-27.
Theron, J. N. (1974). Geological sheet 3418BA, Strandfontein (1:50 000):
Geological Survey, South Africa (Open file).
Theron, J. N., Gresse, P. G.; Siegfried, H. P.; Rogers, J. (1992). The geology
of the Cape Town area. Explanation on Sheet 3318, Geological Survey,
South Africa, 140p.
USEPA (2010). Managing Agricultural Fertilizer Application to Prevent
Contamination of Drinking Water. Source Water Protection Practices
Bulletin, USEPA East (EPA East), August 2010, Washington, DC 20004.
Unites States Geological Survey, USGS. (2007). Freshwater-Saltwater
Interactions along the Atlantic Coast. Retrieved on February 6, 2008 from
http://water.usgs.gov/ogw/gwrp/saltwater/.
United States Geological Survey, USGS. (2005). Saltwater Intrusion in Los
Angeles Area Coastal Aquifers- The Marine Connection. Retrieved on
February 6, 2008 from http://pubs.usgs.gov/fs/2002/fs030-02/
United States Geological Survey, USGS. (2005). Southern California Salt-
Water Intrusion. Retrieved on February 6, 2008 from
http://walrus.wr.usgs.gov/cabrillo/casa/
Vandoolaeghe, M. A. C. (1989). The Cape Flats groundwater development
pilot abstraction scheme. Technical Report No. GH3655, Directorate
Geohydrology, DWAF, Cape Town.
Walraevens, K.; Van Camp, M. (2005). Advances in understanding natural
groundwater quality controls in coastal aquifers. Groundwater and saline
intrusion, selected papers from the 18th Salt Water Intrusion Meeting,
Cartagena 2004, Spain, pp 449–463.
L.T.
Related Documents