HYDROGEN SPECTRUM ANALYSIS BY SIMULATION Rohit Kumar Vishwakarma

Welcome message from author
This document is posted to help you gain knowledge. Please leave a comment to let me know what you think about it! Share it to your friends and learn new things together.
Transcript
HYDROGEN SPECTRUMANALYSIS
BY SIMULATION
Rohit Kumar Vishwakarma

Hydrogen Atom the Swedish carl Wilhelm scheele and Eng. Joseph Priestley reported the existence of new component of air now called “hydrogen”.
Hydrogen in earlier known as “fire Air”.
Electrically neutral atom consist one positively charge proton and one negatively charge electron.
These two particle made it simple two body problem in quantum mechanics .
Proton
Electron
A simple hydrogen atom

Solution Of The HydrogenAtom
Plum pudding model
Rutherford model
Bohr’s theory of H-Atom
Schrodinger wave equation solution

Thomson’s model known as plum pudding model which consist corpuscles surround by plums ( positively charge particle ).
Cartoon of the plum pudding
Rutherford model
Rutherford (or planetary) model of an atom, in which the positively charged nucleus, which contains the majority of the atomic masses is surrounded by orbiting electrons.
Thomson's & Rutherford's Model
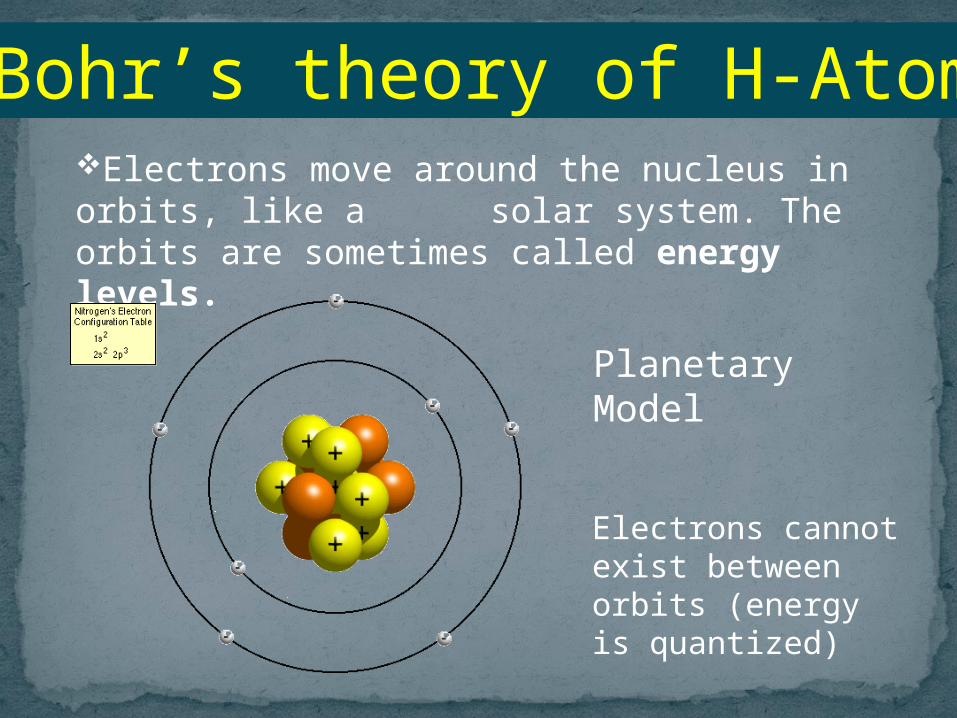
Bohr’s theory of H-AtomElectrons move around the nucleus in orbits, like a solar system. The orbits are sometimes called energy levels.
Planetary Model
Electrons cannot exist between orbits (energy is quantized)
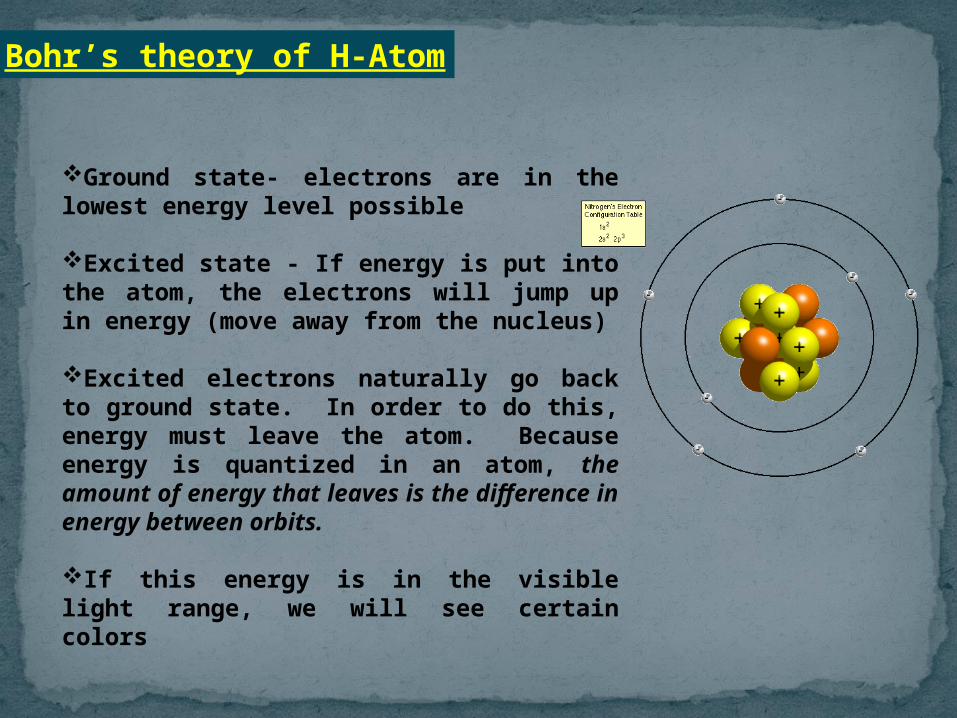
Bohr’s theory of H-Atom
Ground state- electrons are in the lowest energy level possible
Excited state - If energy is put into the atom, the electrons will jump up in energy (move away from the nucleus)
Excited electrons naturally go back to ground state. In order to do this, energy must leave the atom. Because energy is quantized in an atom, the amount of energy that leaves is the difference in energy between orbits.
If this energy is in the visible light range, we will see certain colors
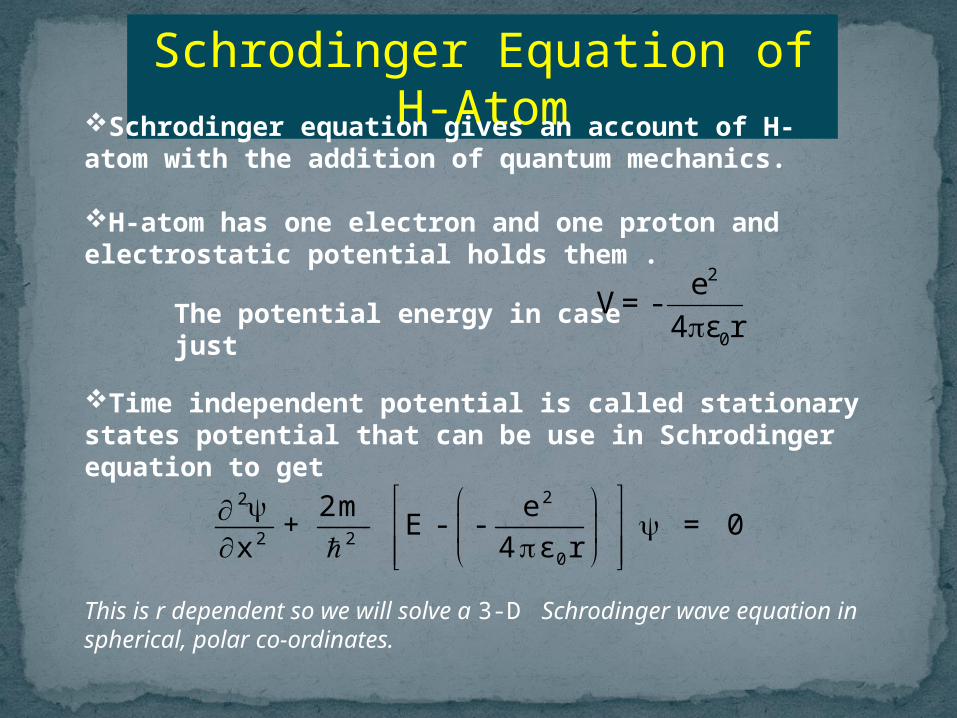
Schrodinger Equation of H-AtomSchrodinger equation gives an account of H-
atom with the addition of quantum mechanics.
H-atom has one electron and one proton and electrostatic potential holds them .
The potential energy in case just
2
0
eV = - 4 ε r
Time independent potential is called stationary states potential that can be use in Schrodinger equation to get
22
2 20
2m e + E - - = 0x 4 ε r
This is r dependent so we will solve a 3-D Schrodinger wave equation in spherical, polar co-ordinates.
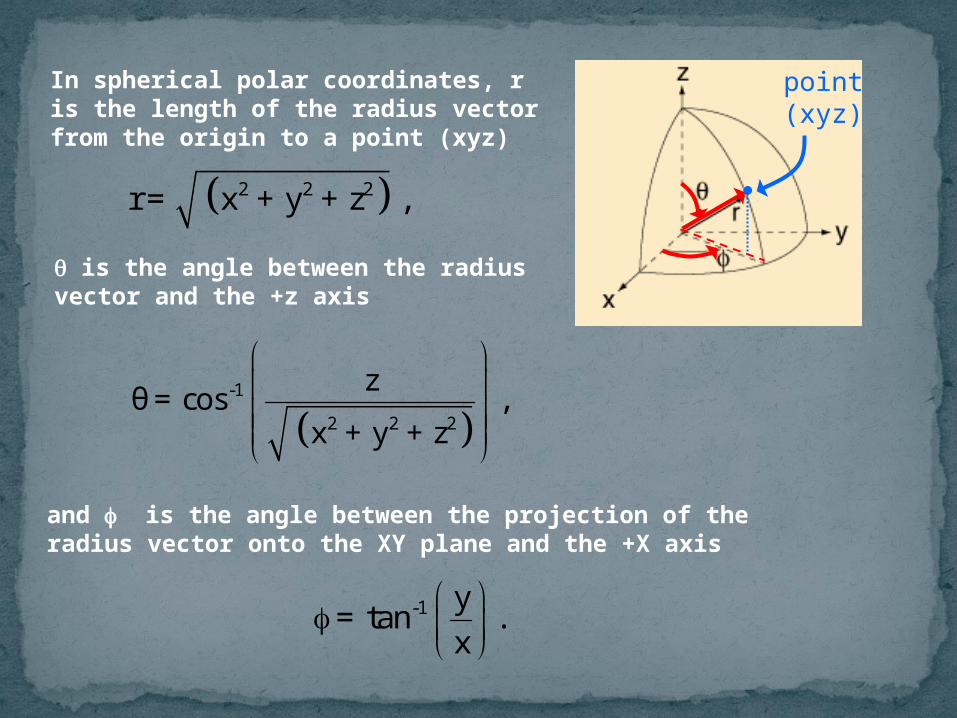
In spherical polar coordinates, r is the length of the radius vector from the origin to a point (xyz)
2 2 2r = x +y +z , is the angle between the radius vector and the +z axis
-1
2 2 2
zθ = cos , x +y +z
and is the angle between the projection of the radius vector onto the XY plane and the +X axis
-1 y = tan .x
point (xyz)
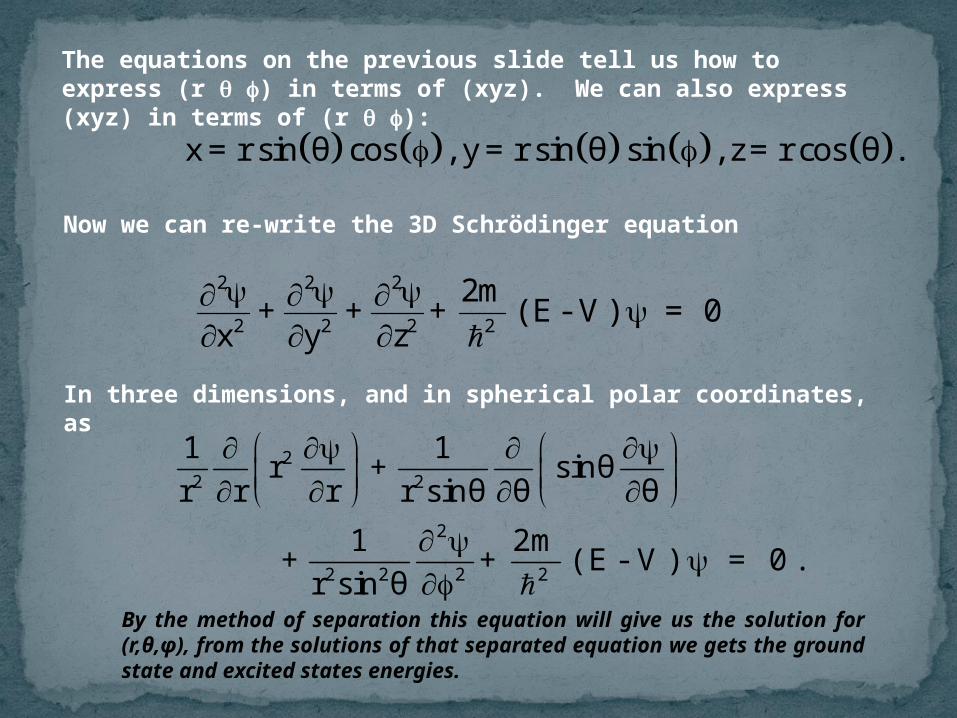
The equations on the previous slide tell us how to express (r ) in terms of (xyz). We can also express (xyz) in terms of (r ):
x = r sin θ cos , y = r sin θ sin , z = r cos θ .
Now we can re-write the 3D Schrödinger equation
2 2 2
2 2 2 22m + + + ( E - V ) = 0x y z
In three dimensions, and in spherical polar coordinates, as
22 2
2
2 2 2 2
1 1r + sinθ r r r r sinθ θ θ1 2m + + ( E - V ) = 0 .r sin θ
By the method of separation this equation will give us the solution for (r,θ,φ), from the solutions of that separated equation we gets the ground state and excited states energies.
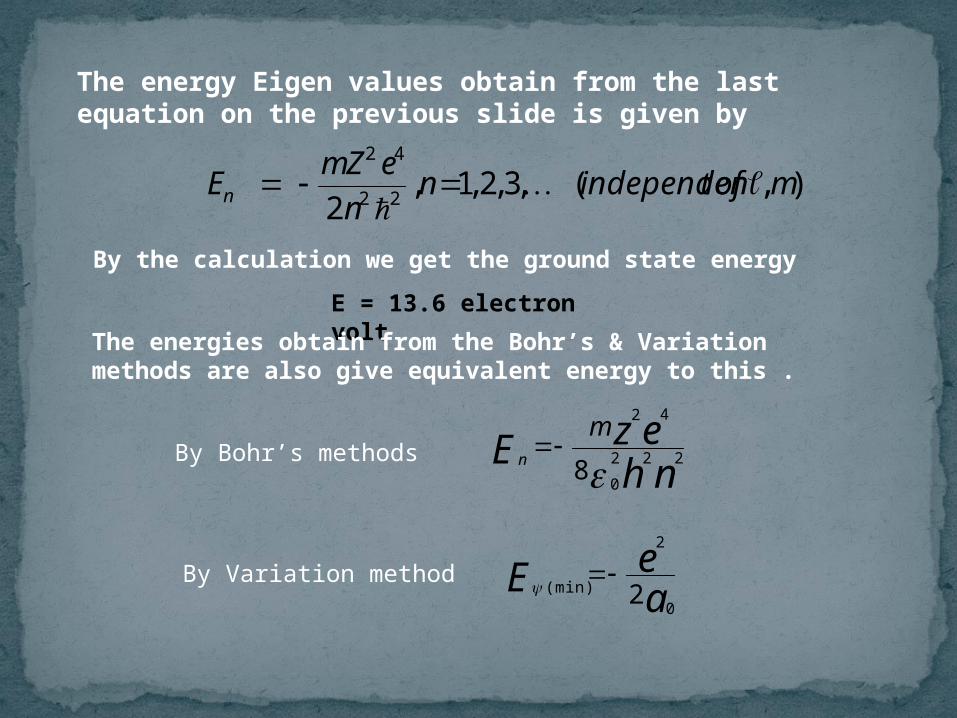
The energy Eigen values obtain from the last equation on the previous slide is given by
By the calculation we get the ground state energy E = 13.6 electron volt
The energies obtain from the Bohr’s & Variation methods are also give equivalent energy to this .
By Bohr’s methods
nhezE
mn 222
0
42
8
).,(,3,2,1,2 22
42
moftindependennneZmEn
By Variation method aeE
0
2
(min) 2

Hydrogen SpectrumBohr’s experiment gives a clear explanations of hydrogen spectrum which can be seen below .
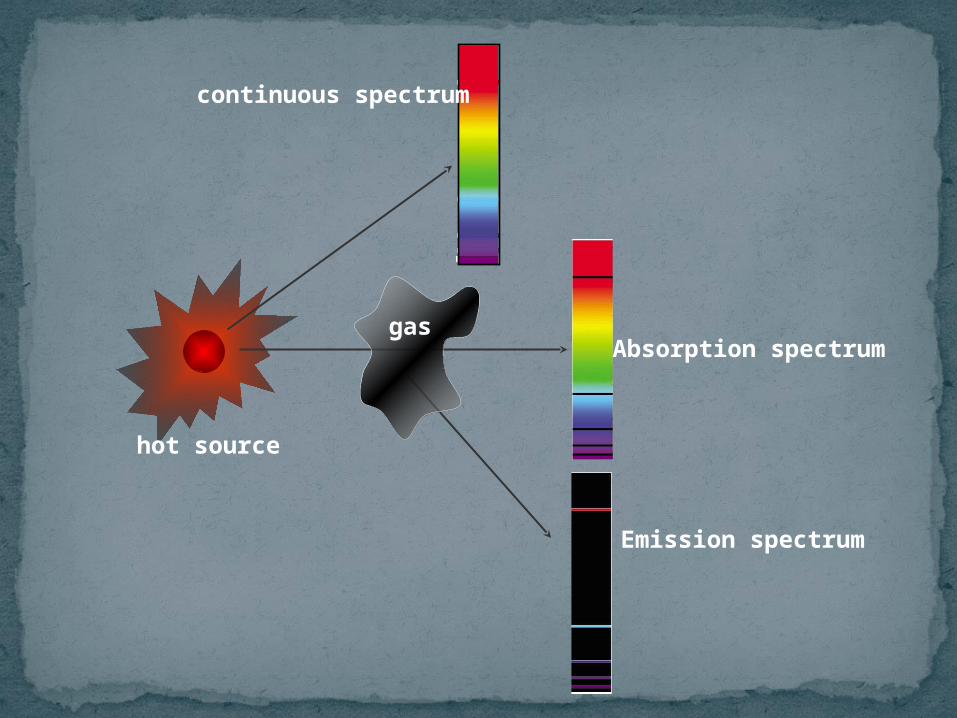
continuous spectrum
Absorption spectrum
Emission spectrum
hot source
gas
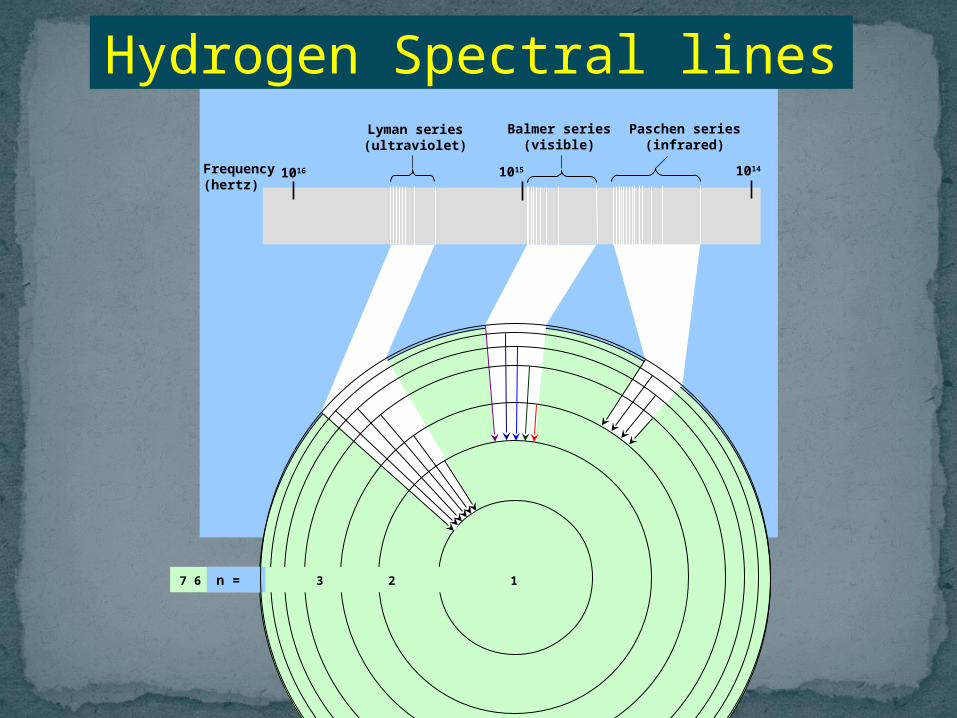
Lyman series(ultraviolet)
Balmer series(visible)
Paschen series(infrared)
Frequency(hertz)
1016 1015 1014
7 6 5 4 3 2 1 n =
Hydrogen Spectral lines

(ultraviolet)
(visible)
(infrared)
Hydrogen Spectral lines

A B C D E F Lyman series (UV)
A B C D E Balmer (VisiAble)
A B C D Paschen (IR)
E1
E2
E3
E4
E5
E6
Ener
gy
Bohr’s model of the atom accounted mathematically for the energy of each of the transitions shown.
IRregion
UVregion
656 nm
486 nm
434 nm
410 nm
ionization
Hydrogen Spectral lines
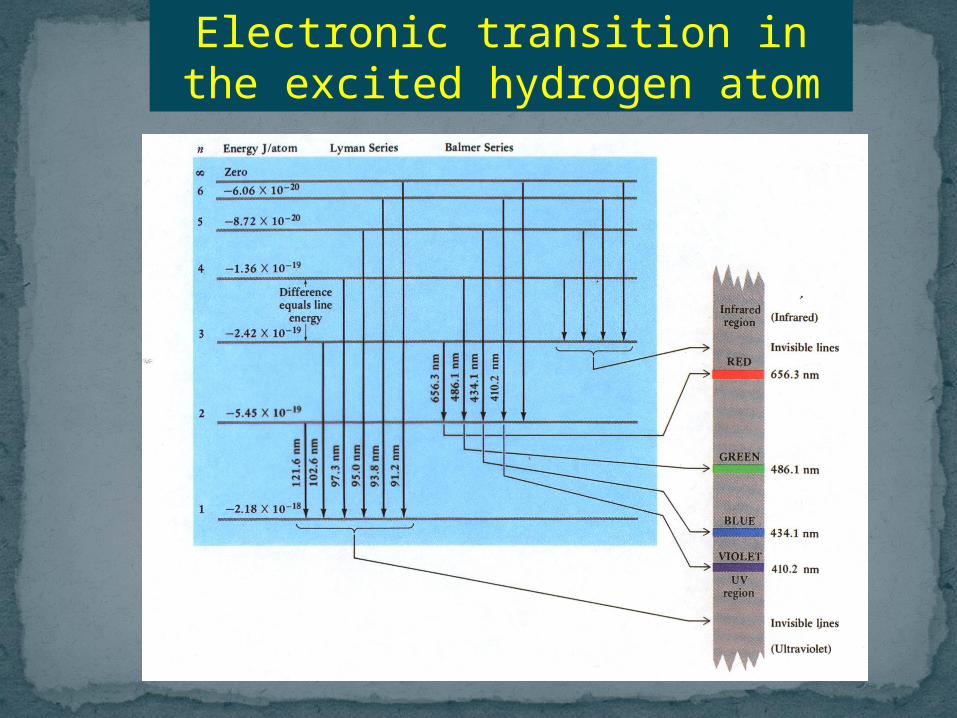
Electronic transition in the excited hydrogen atom

THANK YOU
Rohit Kumar Vishwakarma
Related Documents