Original Contribution Hydrogen peroxide metabolism and sensing in human erythrocytes: A validated kinetic model and reappraisal of the role of peroxiredoxin II Rui Benfeitas a,b , Gianluca Selvaggio a , Fernando Antunes c , Pedro M.B.M. Coelho a , Armindo Salvador a,d,n a Center for Neuroscience and Cell Biology, University of Coimbra, 3004-517 Coimbra, Portugal b Institute for Interdisciplinary Research, University of Coimbra, 3030-789 Coimbra, Portugal c Departamento de Química e Bioquímica and Centro de Química e Bioquímica, Faculdade de Ciências, Universidade de Lisboa, Lisboa, Portugal d Coimbra Chemistry Center, University of Coimbra, 3004-535 Coimbra, Portugal article info Article history: Received 18 April 2014 Received in revised form 26 May 2014 Accepted 10 June 2014 Available online 18 June 2014 Keywords: Systems biology Quantitative redox biology Redox signaling Thioredoxin Peroxiredoxin sulfinylation Free radicals abstract Hydrogen peroxide (H 2 O 2 ) metabolism in human erythrocytes has been thoroughly investigated, but unclear points persist. By integrating the available data into a mathematical model that accurately represents the current understanding and comparing computational predictions to observations we sought to (a) identify inconsistencies in present knowledge, (b) propose resolutions, and (c) examine their functional implications. The systematic confrontation of computational predictions with experi- mental observations of the responses of intact erythrocytes highlighted the following important discrepancy. The high rate constant (10 7 –10 8 M 1 s 1 ) for H 2 O 2 reduction determined for purified peroxiredoxin II (Prx2) and the high abundance of this protein indicate that under physiological conditions it consumes practically all the H 2 O 2 . However, this is inconsistent with extensive evidence that Prx2’s contribution to H 2 O 2 elimination is comparable to that of catalase. Models modified such that Prx2’s effective peroxidase activity is just 10 5 M 1 s 1 agree near quantitatively with extensive experimental observations. This low effective activity is probably due to a strong but readily reversible inhibition of Prx2’s peroxidatic activity in intact cells, implying that the main role of Prx2 in human erythrocytes is not to eliminate peroxide substrates. Simulations of the responses to physiological H 2 O 2 stimuli highlight that a design combining abundant Prx2 with a low effective peroxidase activity spares NADPH while improving potential signaling properties of the Prx2/thioredoxin/thioredoxin reductase system. & 2014 Elsevier Inc. All rights reserved. The metabolism of H 2 O 2 in human erythrocytes has been the subject of scrutiny over many decades, which reintensified recently [1–6]. Consequently, erythrocytes have become the most thoroughly understood model for H 2 O 2 metabolism in human cells. Nevertheless, important aspects of this system and how its design relates to function remain unclear. Mathematical modeling has consistently proved useful in clarify- ing the mechanisms of antioxidant defense and redox signaling [7–20]. Kinetic models help identify gaps and inconsistencies in the state of the art, assessing alternative mechanistic hypotheses, under- standing the interplay among multiple factors, and understanding the relationship between molecular-level design and phenotype. The availability of convenient kinetic modeling software [21] facili- tated this approach. Attempts at quantitative modeling of H 2 O 2 metabolism were crucial in highlighting the importance of Prx2 (EC 1.11.1.15) and addressing the relative importance of glutathione peroxidase (GPx1, EC 1.11.1.9), catalase (Cat, EC 1.11.1.6), and Prx2 in mouse erythrocytes [1,3]. However, recent experimental data [4–6,22] question previous notions. The main open issues pertain to the role of the third most abundant protein in human erythrocytes, Prx2. Prx2 reduces H 2 O 2 through a three-step cycle (Fig. 1A) involving two conserved cysteine residues in each monomer. H 2 O 2 oxidizes the peroxidatic cysteine C51–SH to a sulfenic acid, C51–SOH. C51–SOH then condenses with the resolving cysteine C172–SH from an adjacent monomer to form a disulfide C51–S–S–C172, which in turn is reduced by thioredoxin (Trx1), thereby closing the cycle. C51–SOH can also be further oxidized by H 2 O 2 to sulfinic acid, C51–SO 2 H, Contents lists available at ScienceDirect journal homepage: www.elsevier.com/locate/freeradbiomed Free Radical Biology and Medicine http://dx.doi.org/10.1016/j.freeradbiomed.2014.06.007 0891-5849/& 2014 Elsevier Inc. All rights reserved. Abbreviations: Cat, catalase; CPTTRS, Cat/Prx2/Trx1/TrxR system; Ferri, ferricata- lase; GPx1, glutathione peroxidase 1; GSH, glutathione; GSR, glutathione reductase; GSSG, glutathione disulfide; Prx2, peroxiredoxin II; PSH, Prx2 monomer with peroxidatic Cys in thiol form; RT, plasma recirculation time; Srx, sulfiredoxin; Trx1, thioredoxin 1; TrxR, thioredoxin reductase n Corresponding author at: University of Coimbra, CNC –Center for Neuroscience and Cell Biology, UC-Biotech, Biocant Park, Núcleo 04 lote 8, 3060-197 Cantanhede, Portugal. Fax: þ351 239 827703. E-mail address: [email protected] (A. Salvador). Free Radical Biology and Medicine 74 (2014) 35–49

Welcome message from author
This document is posted to help you gain knowledge. Please leave a comment to let me know what you think about it! Share it to your friends and learn new things together.
Transcript
Original Contribution
Hydrogen peroxide metabolism and sensing in human erythrocytes:A validated kinetic model and reappraisal of the role of peroxiredoxin II
Rui Benfeitas a,b, Gianluca Selvaggio a, Fernando Antunes c, Pedro M.B.M. Coelho a,Armindo Salvador a,d,n
a Center for Neuroscience and Cell Biology, University of Coimbra, 3004-517 Coimbra, Portugalb Institute for Interdisciplinary Research, University of Coimbra, 3030-789 Coimbra, Portugalc Departamento de Química e Bioquímica and Centro de Química e Bioquímica, Faculdade de Ciências, Universidade de Lisboa, Lisboa, Portugald Coimbra Chemistry Center, University of Coimbra, 3004-535 Coimbra, Portugal
a r t i c l e i n f o
Article history:Received 18 April 2014Received in revised form26 May 2014Accepted 10 June 2014Available online 18 June 2014
Keywords:Systems biologyQuantitative redox biologyRedox signalingThioredoxinPeroxiredoxin sulfinylationFree radicals
a b s t r a c t
Hydrogen peroxide (H2O2) metabolism in human erythrocytes has been thoroughly investigated, butunclear points persist. By integrating the available data into a mathematical model that accuratelyrepresents the current understanding and comparing computational predictions to observations wesought to (a) identify inconsistencies in present knowledge, (b) propose resolutions, and (c) examinetheir functional implications. The systematic confrontation of computational predictions with experi-mental observations of the responses of intact erythrocytes highlighted the following importantdiscrepancy. The high rate constant (107–108 M�1 s�1) for H2O2 reduction determined for purifiedperoxiredoxin II (Prx2) and the high abundance of this protein indicate that under physiologicalconditions it consumes practically all the H2O2. However, this is inconsistent with extensive evidencethat Prx2’s contribution to H2O2 elimination is comparable to that of catalase. Models modified such thatPrx2’s effective peroxidase activity is just 105 M�1 s�1 agree near quantitatively with extensiveexperimental observations. This low effective activity is probably due to a strong but readily reversibleinhibition of Prx2’s peroxidatic activity in intact cells, implying that the main role of Prx2 in humanerythrocytes is not to eliminate peroxide substrates. Simulations of the responses to physiological H2O2
stimuli highlight that a design combining abundant Prx2 with a low effective peroxidase activity sparesNADPH while improving potential signaling properties of the Prx2/thioredoxin/thioredoxin reductasesystem.
& 2014 Elsevier Inc. All rights reserved.
The metabolism of H2O2 in human erythrocytes has been thesubject of scrutiny over many decades, which reintensifiedrecently [1–6]. Consequently, erythrocytes have become the mostthoroughly understood model for H2O2 metabolism in humancells. Nevertheless, important aspects of this system and how itsdesign relates to function remain unclear.
Mathematical modeling has consistently proved useful in clarify-ing the mechanisms of antioxidant defense and redox signaling[7–20]. Kinetic models help identify gaps and inconsistencies in the
state of the art, assessing alternative mechanistic hypotheses, under-standing the interplay among multiple factors, and understandingthe relationship between molecular-level design and phenotype.The availability of convenient kinetic modeling software [21] facili-tated this approach. Attempts at quantitative modeling of H2O2
metabolism were crucial in highlighting the importance of Prx2 (EC1.11.1.15) and addressing the relative importance of glutathioneperoxidase (GPx1, EC 1.11.1.9), catalase (Cat, EC 1.11.1.6), and Prx2 inmouse erythrocytes [1,3].
However, recent experimental data [4–6,22] question previousnotions. The main open issues pertain to the role of the third mostabundant protein in human erythrocytes, Prx2. Prx2 reduces H2O2
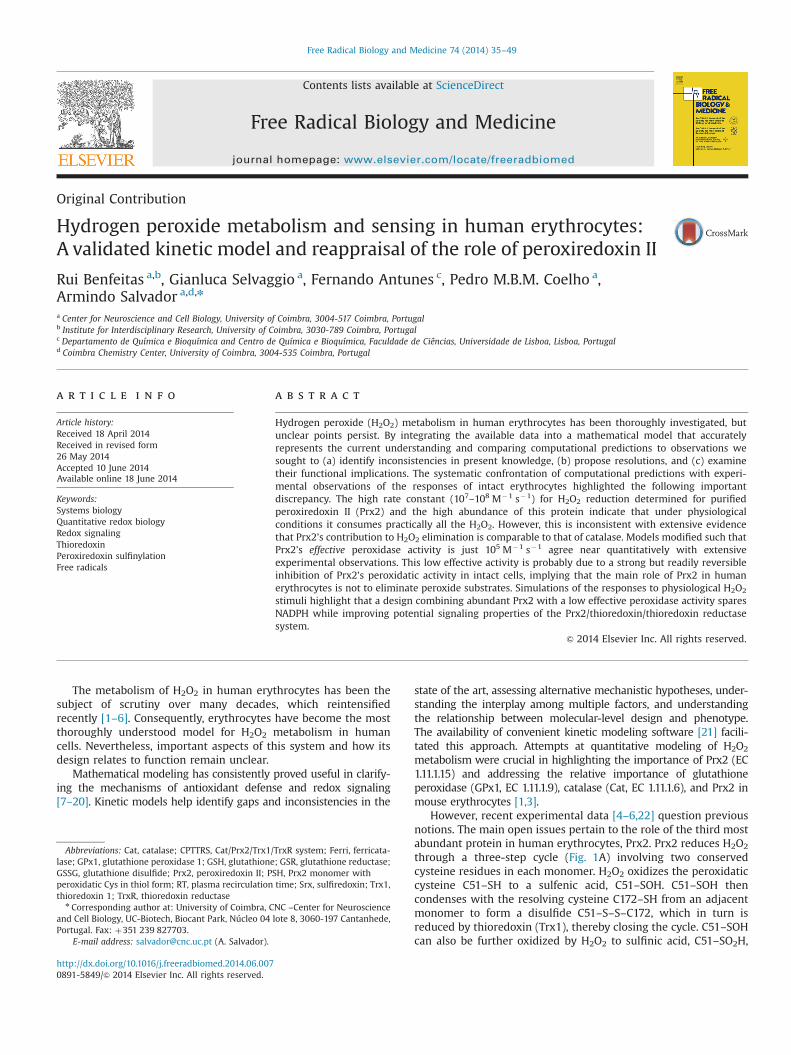
through a three-step cycle (Fig. 1A) involving two conservedcysteine residues in each monomer. H2O2 oxidizes the peroxidaticcysteine C51–SH to a sulfenic acid, C51–SOH. C51–SOH thencondenses with the resolving cysteine C172–SH from an adjacentmonomer to form a disulfide C51–S–S–C172, which in turn isreduced by thioredoxin (Trx1), thereby closing the cycle. C51–SOHcan also be further oxidized by H2O2 to sulfinic acid, C51–SO2H,
Contents lists available at ScienceDirect
journal homepage: www.elsevier.com/locate/freeradbiomed
Free Radical Biology and Medicine
http://dx.doi.org/10.1016/j.freeradbiomed.2014.06.0070891-5849/& 2014 Elsevier Inc. All rights reserved.
Abbreviations: Cat, catalase; CPTTRS, Cat/Prx2/Trx1/TrxR system; Ferri, ferricata-lase; GPx1, glutathione peroxidase 1; GSH, glutathione; GSR, glutathione reductase;GSSG, glutathione disulfide; Prx2, peroxiredoxin II; PSH, Prx2 monomer withperoxidatic Cys in thiol form; RT, plasma recirculation time; Srx, sulfiredoxin; Trx1,thioredoxin 1; TrxR, thioredoxin reductase
n Corresponding author at: University of Coimbra, CNC –Center for Neuroscienceand Cell Biology, UC-Biotech, Biocant Park, Núcleo 04 lote 8, 3060-197 Cantanhede,Portugal. Fax: þ351 239 827703.
E-mail address: [email protected] (A. Salvador).
Free Radical Biology and Medicine 74 (2014) 35–49
which inactivates Prx2’s peroxidase activity. Johnson et al. [1]found that a quantitative modeling of H2O2 metabolism in GPx-deficient mouse erythrocytes required a substantial but not over-whelming contribution of Prx2. Experiments by Low et al. [2]confirmed the relevance of Prx2 to H2O2 consumption in humanerythrocytes. Subsequent determinations [23,24] of the rate con-stant for H2O2 reduction by Prx2 from human erythrocytes yieldedvalues in the range 107–108 M�1 s�1. As we show below, thesevalues imply an overwhelming contribution to H2O2 eliminationshould all the Prx2 be peroxidatically active. Prx2 also protectshemoglobin against aggregation [5] and binds many proteins,some of which in a redox-dependent manner [25–28]. Theseobservations raise the question of whether Prx2’s main function
in erythrocytes is to act as a peroxidase, a H2O2 sensor, or achaperone.
We began by critically reviewing the quantitative literaturedata about the physiological setting and mechanisms of H2O2
metabolism in human erythrocytes. Namely, we examined thepathophysiological concentration ranges and time frames of expo-sure of these circulating cells to H2O2, as well as consumptionmechanisms including the Cat, GPx1, and Prx2 pathways. We thenintroduced a kinetic model that seeks to accurately represent thecurrent understanding of these processes, based on curated datafrom kinetic parameters determined in vitro. Comparing thepredictions based on this model to experimental observations ofintact erythrocytes we highlighted a fundamental discrepancy
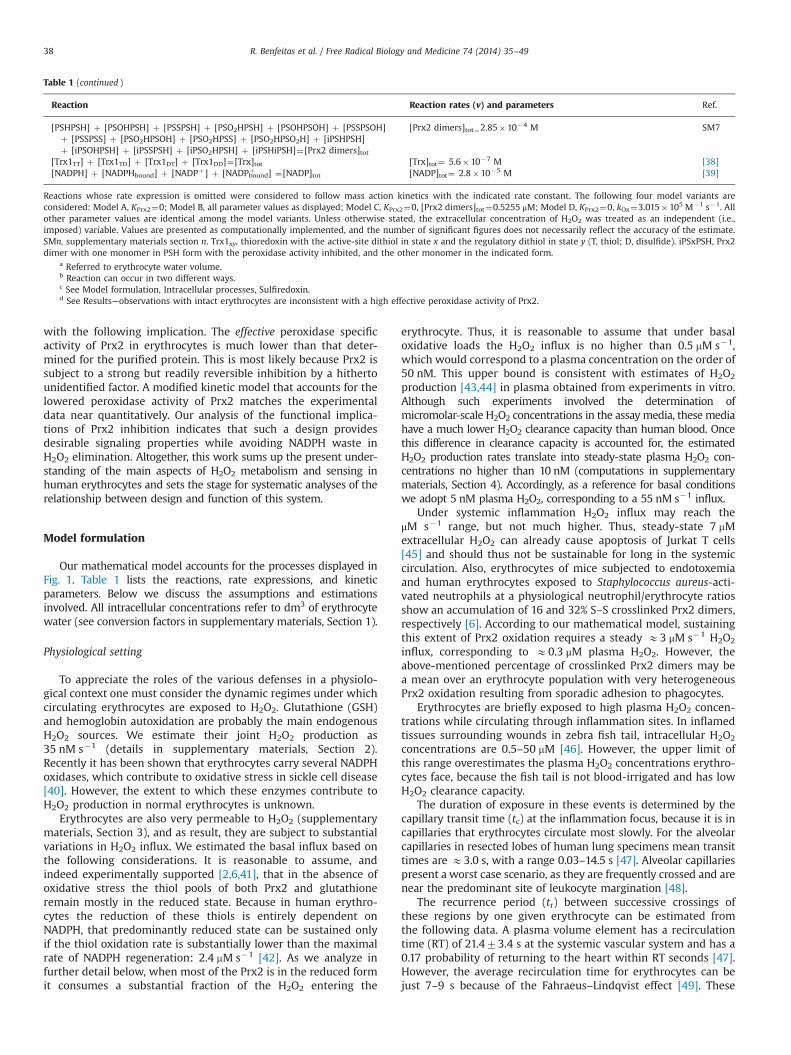
Fig. 1. Model of H2O2 metabolism in human erythrocytes. (A) Overall diagram of the model. The model accounts for the following processes: (i) generation of intracellularH2O2 from both endogenous and exogenous sources; (ii) H2O2 consumption via Cat, Prx2, and GPx1; (iii) Prx2 sulfinylation and reduction of the sulfinic to the sulfenic form;(iv) Trx1 oxidation by Prx2, reduction via thioredoxin reductase, and reactions between the active-site dithiol and the regulatory dithiol (gray); (v) glutathione disulfide(GSSG) reduction via glutathione reductase; and (vi) NADPþ reduction to NADPH by the hexose monophosphate shunt. (B) Modeling of the Prx2 redox cycle, taking theoxidation state of each monomer in each dimer into account. C-I, C-II, and Ferri, catalase in compound I, compound II, and Ferri form, respectively; PSH, PSOH, PSO2H, andPSS, Prx2 monomer with the peroxidatic Cys in thiol, sulfenic, sulfinic, and disulfide form, respectively; Srx, sulfiredoxin; Trxxy, thioredoxin with the active-site dithiol instate x and the regulatory dithiol in state y (T, thiol; D, disulfide); TrxSH, thioredoxin with the active-site dithiol in reduced form.
R. Benfeitas et al. / Free Radical Biology and Medicine 74 (2014) 35–4936
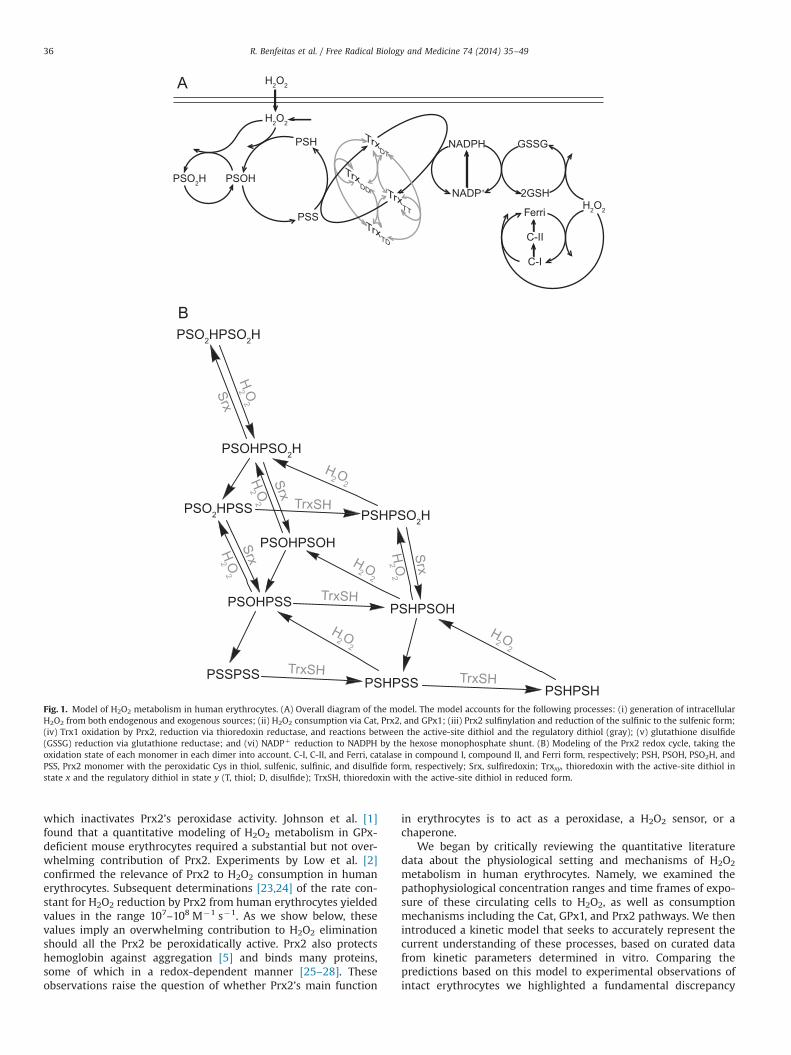
Table 1Reactions, conservation relationships, rate expressions, and parameter values considered in the kinetic model.
Reaction Reaction rates (v) and parameters Ref.
- H2O2 vprod¼3.5�10�8 M s�1 SM2eH2O2 - H2O2 kP¼10.9 s�1 a SM3H2O2 - eH2O2 kP¼10.9 s�1 a SM3H2O2 þ 2 GSH - GSSG þ 2 H2O ν¼ 1=ððϕ1=½H2O2�Þþðϕ2=½GSH�ÞÞ [29]
ϕ1¼3.99�10�2 s SM5ϕ2¼9.72 s SM5
GSSG þ NADPH þ Hþ - 2 GSH þ NADPþ ν¼ VMax ; GSR=ð1þðKM;GSR;NADPH=½NADPH�ÞþðKM;GSR;GSSG=½GSSG�ÞÞ [30]VMax,GSR¼4.9�10�5 M s�1 [31]KM,GSR,NADPH¼8.5�10�6 M [32]KM,GSR,GSSG¼6.5�10�5 M [32]
Ferricatalase þ H2O2 - compound I þ H2O kFerri¼6�106 M�1 s�1 [33]Compound I þ H2O2 - ferricatalase þ O2 þ H2O kCI¼1.8�107 M�1 s�1 [33]Compound I - compound II kCIinac¼1.1�10�2 s�1 [34]Compound II - ferricatalase kCII¼7.39�104 s�1 [35]PSHPSH þ H2O2 - PSOHPSH þ H2O 2kOx¼2�108 M�1 s�1 b [24]PSOHPSH - PSSPSH þ H2O kCond¼1.7 s�1 [22]PSOHPSH þ H2O2 - PSOHPSOH þ H2O kOx¼108 M�1 s�1 [24]PSOHPSH þ H2O2 - PSO2HPSH þ H2O kSulf¼1.2�104 M�1 s�1 [22]PSSPSH þH2O2 - PSSPSOH þ H2O kOx¼108 M�1 s�1 [24]PSSPSH þ Trx1TT - PSHPSH þ Trx1DT kRed¼2.1�105 M�1 s�1 [24]PSSPSH þ Trx1TD - PSHPSH þ Trx1DD kRed¼2.1�105 M�1 s�1 [24]PSOHPSOH - PSSPSOH þ H2O 2kCond¼3.4 s�1 b [22]PSOHPSOH þ H2O2 - PSO2HPSOH þ H2O 2kSulf¼2.4�104 M�1 s�1 [22]PSSPSOH - PSSPSS þ H2O kCond¼1.7 s�1 [22]PSSPSOH þ H2O2 - PSO2HPSS þ H2O kSulf¼1.2�104 M�1 s�1 [22]PSSPSOH þ Trx1TT - PSOHPSH þ Trx1DT kRed¼2.1�105 M�1 s�1 [24]PSSPSOH þ Trx1TD - PSOHPSH þ Trx1DD kRed¼2.1�105 M�1 s�1 [24]PSSPSS þ Trx1TT - PSSPSH þ Trx1DT 2kRed¼4.2�105 M�1 s�1 b [24]PSSPSS þ Trx1TD - PSSPSH þ Trx1DD 2kRed¼4.2�105 M�1 s�1 b [24]PSO2HPSH þ H2O2 - PSO2HPSOH þ H2O kOx¼108 M�1 s�1 [24]PSO2HPSH - PSOHPSH kSrx¼10�4 s�1 c
PSO2HPSOH - PSO2HPSS þ H2O kCond¼1.7 s�1 [22]PSO2HPSOH þ H2O2 - PSO2HPSO2H þ H2O kSulf¼1.2�104 M�1 s�1 [22]PSO2HPSOH - PSOHPSOH kSrx¼10�4 s�1 c
PSO2HPSS þ Trx1TT - PSO2HPSH þ Trx1DT kRed¼2.1�105 M�1 s�1 [24]PSO2HPSS þ Trx1TD - PSO2HPSH þ Trx1DD kRed¼2.1�105 M�1 s�1 [24]PSO2HPSS - PSSPSOH kSrx¼10�4 s�1 c
PSO2HPSO2H - PSO2HPSOH 2kSrx¼2�10�4 s�1 b c
iPSHPSH þ H2O2 - iPSOHPSH kOx¼108 M�1 s�1 [24]iPSOHPSH - iPSSPSH kCond¼1.7 s�1 [22]iPSOHPSH þ H2O2 - iPSO2HPSH kSulf¼1.2�104 M�1 s�1 [22]iPSO2HPSH - iPSOHPSH kSrx¼10�4 s�1 c
iPSSPSH þ Trx1TT - iPSHPSH þ Trx1DT kRed¼2.1�105 M�1 s�1 [24]iPSSPSH þ Trx1TD - iPSHPSH þ Trx1DD kRed¼2.1�105 M�1 s�1 [24]PSHPSH ⇆ iPSHPSH KPrx2¼166.9 d
PSOHPSH ⇆ iPSOHPSH KPrx2¼166.9PSSPSH ⇆ iPSSPSH KPrx2¼166.9PSO2HPSH ⇆ iPSO2HPSH KPrx2¼166.9iPSHPSH ⇆ iPSHiPSH KPrx2¼166.9Trx1DT þ NADPH þ Hþ- Trx1TT þ NADPþ ν¼ VMax;TrxR=ð1þðKM;TrxR;NADPH=½NADPH�ÞþðKM;TrxR;Trx1DT=½Trx1DT�ÞÞ SM9
VMax,TrxR¼1.0�10�5 M s�1 SM9KM,TrxR,NADPH¼6�10�6 M [36]KM,TrxR,Trx1DT¼1.83�10�6 M [37]
Trx1DD þ Trx1TT - 2 Trx1TD kTrxb¼4.2�103 M�1 s�1 SM82 Trx1TD - Trx1DD þ Trx1TT 2kTrxa¼4.2�105 M�1 s�1 b SM8Trx1DT þ Trx1TD - Trx1DD þ Trx1TT kTrxa¼2.1�105 M�1 s�1 SM8Trx1DD þ Trx1TT - 2 Trx1DT kTrxa¼2.1�105 M�1 s�1 SM82 Trx1DT - Trx1DD þ Trx1TT 2kTrxb¼8.4�103 M�1 s�1 b SM8Trx1DD þ Trx1DT - Trx1DD þ Trx1TD kTrxb¼4.2�103 M�1 s�1 SM8Trx1DD þ Trx1TD - Trx1DD þ Trx1DT kTrxa¼2.1�105 M�1 s�1 SM8Trx1TT þ Trx1TD - Trx1TT þ Trx1DT kTrxa¼2.1�105 M�1 s�1 SM8Trx1TT þ Trx1DT - Trx1TT þ Trx1TD kTrxb¼4.2�103 M�1 s�1 SM8Trx1DD þ NADPH þ Hþ- Trx1TD þ NADPþ ν¼ VMax;TrxR=ð1þðKM;TrxR;NADPH=½NADPH�ÞþðKM;TrxR;Trx1DD=½Trx1DD�ÞÞ SM8,9
VMax,TrxR¼1.0�10�5 M s�1 SM9KM,TrxR,NADPH¼6�10�6 M [36]KM,TrxR,Trx1DD¼1.83�10�3 M SM9
NADPþ - NADPH þ Hþν¼ VMax; TMS½NADPþ �=ðKM; HMS; NADPþ þ½NADPþ �ÞVMax,HMS¼2.4�10�6 M s�1 SM11KM; HMS; NADPþ ¼4.5�10�7 M SM11
NADPH ⇆ NADPHbound KNADPH¼9.6 SM10NADPþ ⇆ NADPþ
bound KNADPþ¼1.8 SM10
Conservation relationships[GSH] þ (2� [GSSG])¼[GS]tot [GS]tot¼3.2�10�3 M [31][Ferricatalase] þ [compound I] þ [compound II]¼[Cat]tot [Cat]tot¼2.44�10�5 M SM6
R. Benfeitas et al. / Free Radical Biology and Medicine 74 (2014) 35–49 37
Salvador
Highlight
Typo: 1.83e-6 M
with the following implication. The effective peroxidase specificactivity of Prx2 in erythrocytes is much lower than that deter-mined for the purified protein. This is most likely because Prx2 issubject to a strong but readily reversible inhibition by a hithertounidentified factor. A modified kinetic model that accounts for thelowered peroxidase activity of Prx2 matches the experimentaldata near quantitatively. Our analysis of the functional implica-tions of Prx2 inhibition indicates that such a design providesdesirable signaling properties while avoiding NADPH waste inH2O2 elimination. Altogether, this work sums up the present under-standing of the main aspects of H2O2 metabolism and sensing inhuman erythrocytes and sets the stage for systematic analyses of therelationship between design and function of this system.
Model formulation
Our mathematical model accounts for the processes displayed inFig. 1. Table 1 lists the reactions, rate expressions, and kineticparameters. Below we discuss the assumptions and estimationsinvolved. All intracellular concentrations refer to dm3 of erythrocytewater (see conversion factors in supplementary materials, Section 1).
Physiological setting
To appreciate the roles of the various defenses in a physiolo-gical context one must consider the dynamic regimes under whichcirculating erythrocytes are exposed to H2O2. Glutathione (GSH)and hemoglobin autoxidation are probably the main endogenousH2O2 sources. We estimate their joint H2O2 production as35 nM s�1 (details in supplementary materials, Section 2).Recently it has been shown that erythrocytes carry several NADPHoxidases, which contribute to oxidative stress in sickle cell disease[40]. However, the extent to which these enzymes contribute toH2O2 production in normal erythrocytes is unknown.
Erythrocytes are also very permeable to H2O2 (supplementarymaterials, Section 3), and as result, they are subject to substantialvariations in H2O2 influx. We estimated the basal influx based onthe following considerations. It is reasonable to assume, andindeed experimentally supported [2,6,41], that in the absence ofoxidative stress the thiol pools of both Prx2 and glutathioneremain mostly in the reduced state. Because in human erythro-cytes the reduction of these thiols is entirely dependent onNADPH, that predominantly reduced state can be sustained onlyif the thiol oxidation rate is substantially lower than the maximalrate of NADPH regeneration: 2.4 mM s�1 [42]. As we analyze infurther detail below, when most of the Prx2 is in the reduced formit consumes a substantial fraction of the H2O2 entering the
erythrocyte. Thus, it is reasonable to assume that under basaloxidative loads the H2O2 influx is no higher than 0.5 mM s�1,which would correspond to a plasma concentration on the order of50 nM. This upper bound is consistent with estimates of H2O2
production [43,44] in plasma obtained from experiments in vitro.Although such experiments involved the determination ofmicromolar-scale H2O2 concentrations in the assaymedia, these mediahave a much lower H2O2 clearance capacity than human blood. Oncethis difference in clearance capacity is accounted for, the estimatedH2O2 production rates translate into steady-state plasma H2O2 con-centrations no higher than 10 nM (computations in supplementarymaterials, Section 4). Accordingly, as a reference for basal conditionswe adopt 5 nM plasma H2O2, corresponding to a 55 nM s�1 influx.
Under systemic inflammation H2O2 influx may reach theμM s�1 range, but not much higher. Thus, steady-state 7 mMextracellular H2O2 can already cause apoptosis of Jurkat T cells[45] and should thus not be sustainable for long in the systemiccirculation. Also, erythrocytes of mice subjected to endotoxemiaand human erythrocytes exposed to Staphylococcus aureus-acti-vated neutrophils at a physiological neutrophil/erythrocyte ratiosshow an accumulation of 16 and 32% S–S crosslinked Prx2 dimers,respectively [6]. According to our mathematical model, sustainingthis extent of Prx2 oxidation requires a steady E3 μM s�1 H2O2
influx, corresponding to E0.3 μM plasma H2O2. However, theabove-mentioned percentage of crosslinked Prx2 dimers may bea mean over an erythrocyte population with very heterogeneousPrx2 oxidation resulting from sporadic adhesion to phagocytes.
Erythrocytes are briefly exposed to high plasma H2O2 concen-trations while circulating through inflammation sites. In inflamedtissues surrounding wounds in zebra fish tail, intracellular H2O2
concentrations are 0.5–50 mM [46]. However, the upper limit ofthis range overestimates the plasma H2O2 concentrations erythro-cytes face, because the fish tail is not blood-irrigated and has lowH2O2 clearance capacity.
The duration of exposure in these events is determined by thecapillary transit time (tc) at the inflammation focus, because it is incapillaries that erythrocytes circulate most slowly. For the alveolarcapillaries in resected lobes of human lung specimens mean transittimes are E3.0 s, with a range 0.03–14.5 s [47]. Alveolar capillariespresent a worst case scenario, as they are frequently crossed and arenear the predominant site of leukocyte margination [48].
The recurrence period (tr) between successive crossings ofthese regions by one given erythrocyte can be estimated fromthe following data. A plasma volume element has a recirculationtime (RT) of 21.473.4 s at the systemic vascular system and has a0.17 probability of returning to the heart within RT seconds [47].However, the average recirculation time for erythrocytes can bejust 7–9 s because of the Fahraeus–Lindqvist effect [49]. These
Table 1 (continued )
Reaction Reaction rates (v) and parameters Ref.
[PSHPSH] þ [PSOHPSH] þ [PSSPSH] þ [PSO2HPSH] þ [PSOHPSOH] þ [PSSPSOH]þ [PSSPSS] þ [PSO2HPSOH] þ [PSO2HPSS] þ [PSO2HPSO2H] þ [iPSHPSH]þ [iPSOHPSH] þ [iPSSPSH] þ [iPSO2HPSH] þ [iPSHiPSH]¼[Prx2 dimers]tot
[Prx2 dimers]tot¼2.85�10�4 M SM7
[Trx1TT] þ [Trx1TD] þ [Trx1DT] þ [Trx1DD]¼[Trx]tot [Trx]tot¼ 5.6�10�7 M [38][NADPH] þ [NADPHbound] þ [NADPþ] þ [NADPþ
bound] ¼[NADP]tot [NADP]tot¼ 2.8�10�5 M [39]
Reactions whose rate expression is omitted were considered to follow mass action kinetics with the indicated rate constant. The following four model variants areconsidered: Model A, KPrx2¼0; Model B, all parameter values as displayed; Model C, KPrx2¼0, [Prx2 dimers]tot¼0.5255 μM; Model D, KPrx2¼0, kOx¼3.015�105 M�1 s�1. Allother parameter values are identical among the model variants. Unless otherwise stated, the extracellular concentration of H2O2 was treated as an independent (i.e.,imposed) variable. Values are presented as computationally implemented, and the number of significant figures does not necessarily reflect the accuracy of the estimate.SMn, supplementary materials section n. Trx1xy, thioredoxin with the active-site dithiol in state x and the regulatory dithiol in state y (T, thiol; D, disulfide). iPSxPSH, Prx2dimer with one monomer in PSH form with the peroxidase activity inhibited, and the other monomer in the indicated form.
a Referred to erythrocyte water volume.b Reaction can occur in two different ways.c See Model formulation, Intracellular processes, Sulfiredoxin.d See Results—observations with intact erythrocytes are inconsistent with a high effective peroxidase activity of Prx2.
R. Benfeitas et al. / Free Radical Biology and Medicine 74 (2014) 35–4938
values set a lower limit for tr, corresponding to the case of anextensive pulmonary inflammation. The recurrence periods forcrossing localized inflammations in the peripheral circulation areof many minutes to hours.
Intracellular processes
Glutathione peroxidaseGPx1 catalyzes the reduction of H2O2 and organic peroxides by
GSH. The rate law characterized by Flohé et al. [29] for bovineGPx1 fits the time series obtained by Mueller et al. [50] for H2O2
consumption by GPx1 in human hemolysates (estimations insupplementary materials, Section 5). Further, the values for ϕ1
and ϕ2 (Table 1) that were estimated from this time series areconsistent with other determinations [51] of GPx1 activity inhuman erythrocytes, and the ϕ1/ϕ2 ratio is in good agreementwith the kinetic parameters determined in Ref. [52] for these cells.Because the data from Ref. [50] provide the most direct determi-nation available of GPx1 kinetics in human erythrocytes, in ourmodel we adopted the values for ϕ1 and ϕ2 estimated from thisreference. As a consequence of these values, at low to moderateoxidative stress the GPx1-catalized H2O2 reduction has zero-orderkinetics with respect to GSH and first-order kinetics with respectto H2O2. The estimated pseudo-first-order rate constant is 25 s�1.The good agreement between independent determinations of theactivity and kinetic parameters of GPx1 in human erythrocytes(further discussion in supplementary materials, Section 5) givesconfidence about the accurate modeling of this enzyme’s action.
CatalaseCat behaves as a dismutase at H2O2 concentrations above
nanomolar and as a peroxidase at lower concentrations [53]. Weapproximated its kinetics as described in the supplementarymaterials, Section 6, and adjusted the effective concentration ofCat so that at high H2O2 concentrations the pseudo-first-order rateconstant matched the value (218 s�1) determined in Ref. [50]. Thedata from Mueller et al. [50] for hemolysates shows that Cateliminates H2O2 with much higher activity than GPx1 at H2O2
concentrations above 100 nM. However, it has been argued thatthis might not be the case at the sub-nanomolar H2O2 concentra-tions prevailing in erythrocytes under physiological conditionsbecause the activity of Cat as a peroxidase is lower than its activityas a dismutase. Our estimates based on the available data (sup-plementary materials, Section 6) strongly suggest that the activityof Cat remains much higher than that of GPx1 even under theseconditions. Cat consumes NADPH for protection against inactiva-tion [53,54], but the rate of this process is negligible underphysiological conditions (supplementary materials, Section 6).
Peroxiredoxin IIWe explicitly considered the oxidation state of each peroxidatic
Cys in each dimer (Fig. 1B). This allowed us to compute thefractions of singly and doubly disulfide-crosslinked dimers. Forthe oxidation of C51–SH by H2O2 (kOx) and for the reduction of thedisulfide (kRed) we adopted the rate constants determined byManta et al. [24] for Prx2 purified from human erythrocytes:kOx¼1.0�108 M�1 s�1, kRed¼2.1�105 M�1 s�1 at 251C, pH 7.4.This value for kOx is on the order of magnitude of the value1.3�107 M�1 s�1 at 201C, pH 7.4, determined by Peskin et al. [23].For the condensation (kCond) and sulfinylation (kSulf) reactions weadopted the rate constants determined by Peskin et al. [22] forrecombinant human Prx2: kCond¼1.7 s�1, kSulf¼1.2�104 M�1 s�1
at 201C (computations and further discussion in supplementarymaterials, Section 7).
SulfiredoxinSulfiredoxin (EC 1.8.98.2) catalyzes the reduction of Prx2’s C51–
SO2H to C51–SOH using ATP and reducing equivalents from Trx orGSH [55,56]. This process is slow, as mammalian sulfiredoxinshave kcat E3.0�10�3 s�1 [55]. It remains poorly characterized inhuman erythrocytes, where it is also slow [2,4]. Thus, we assumeda pseudo-first-order rate constant kSrx¼10�4 s�1.
ThioredoxinThe reduction of Prx2 by Trx1 is coupled to the oxidation of the
active-site dithiol (C32,C35, Eo¼�230 mV [57]) of the latter,which is in turn reduced via thioredoxin reductase (TrxR; EC1.8.1.9). However, human Trx1 carries another conserved oxidiz-able dithiol (C62,C69), which has a higher midpoint potential(Eo4�210 mV) [57]. The corresponding disulfide is not directlyreduced by TrxR and its oxidation prevents the direct reduction ofthe C32–C35 disulfide by TrxR. However, that disulfide can bereduced by the Trx C32–C35 dithiol [57]. We modeled theseinteractions (Fig. 1A, gray; supplementary materials, Section 8)according to the following assumptions: the secondary dithiol ofone Trx1 molecule can be modified only by the active site ofanother Trx1 molecule and the redox state of one dithiol does notaffect the properties of the other in the same molecule.
Thioredoxin reductaseTrxR catalyzes the reduction of the Trx1 active site by NADPH
in a ping–pong mechanism [58]. The maximal rate for this process(E1.0 mM s�1, supplementary materials, Section 9) is lower thanthe TrxR activity for two reasons. First, the total concentration ofTrx in human erythrocytes is lower than KM,TrxR,Trx1DT. Second, athigh oxidative loads part of the Trx is converted to the double-disulfide form [57].
NADPMost NADP in human erythrocytes is bound to proteins. Of the
total 40 mM NADP pool, 12 mM is tightly bound to proteins [39,54],and the remaining is loosely bound. We assumed that thisremaining pool of NADPH and NADPþ instantaneously equilibratesbetween bound and unbound forms (supplementary materials,Section 10).
NADPH regenerationNADPþ reduction proceeds via the hexose monophosphate
shunt. We modeled its kinetics through a phenomenologicalMichaelis–Menten equation that approximates the behavior atboth low and high oxidative loads accurately and interpolates thebehavior at intermediate oxidative loads (supplementary materi-als, Section 11).
Computational methods
We formalized the models as systems of algebraic-differentialequations. The concentrations of H2O2 in plasma, the cytoplasmicconcentration of GPx1, and the total cytoplasmic concentrations ofPrx2, NADP, glutathionyl moiety, and Trx1 are independent vari-ables whose values are prescribed at the outset. All other con-centrations were treated as dependent variables.
We computed steady-state solutions numerically, applyingNewton–Raphson's method as implemented in the Mathematica9.0.1 [59] FindRoot function with default settings. All steady-statesolutions examined are stable. We also evaluated the logarithmicsensitivities of all the concentrations and reaction rates to all theparameters as described in Refs. [60,61]. This analysis indicatedthat the model is robust with respect to uncertainties of
R. Benfeitas et al. / Free Radical Biology and Medicine 74 (2014) 35–49 39
parameters and independent variables (supplementary materials,Section 12).
To analyze the time-dependent behavior we integrated thesystem of equations numerically in Mathematica using the func-tion NDSolve with default values except for the setting Maximum-StepSize - 0.1. Critical results were double checked throughsimulations in COPASI [62]. The Systems Biology Markup Language[63] file for the COPASI implementation is available from theauthors upon request.
Results
Observations with intact erythrocytes are inconsistent with a higheffective peroxidase activity of Prx2
The kinetic parameters were determined from experimentsusing purified proteins or hemolysates. Is a kinetic model strictlybased on these data able to accurately simulate the H2O2 meta-bolism in intact human erythrocytes? We addressed this questionby comparing the predictions of such a kinetic model (Model A) toexperimental observations with intact cells.
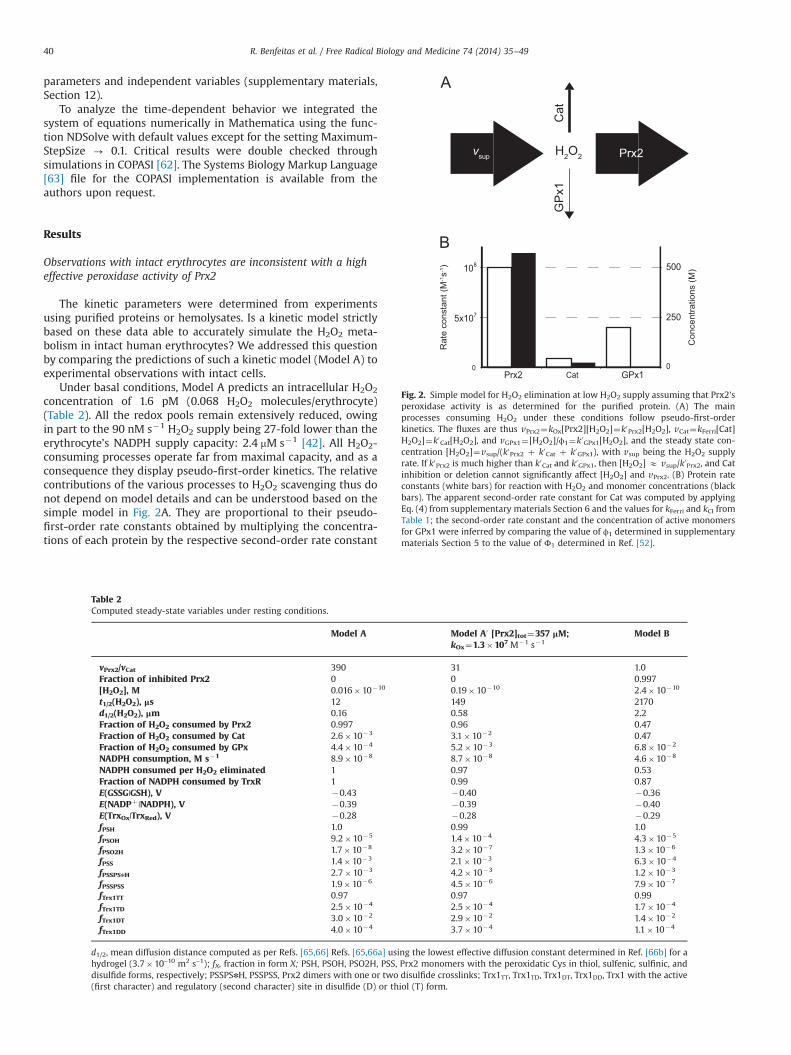
Under basal conditions, Model A predicts an intracellular H2O2
concentration of 1.6 pM (0.068 H2O2 molecules/erythrocyte)(Table 2). All the redox pools remain extensively reduced, owingin part to the 90 nM s�1 H2O2 supply being 27-fold lower than theerythrocyte’s NADPH supply capacity: 2.4 mM s�1 [42]. All H2O2-consuming processes operate far from maximal capacity, and as aconsequence they display pseudo-first-order kinetics. The relativecontributions of the various processes to H2O2 scavenging thus donot depend on model details and can be understood based on thesimple model in Fig. 2A. They are proportional to their pseudo-first-order rate constants obtained by multiplying the concentra-tions of each protein by the respective second-order rate constant
Table 2Computed steady-state variables under resting conditions.
Model A Model A0 [Prx2]tot¼357 μM;kOx¼1.3�107 M�1 s�1
Model B
vPrx2/vCat 390 31 1.0Fraction of inhibited Prx2 0 0 0.997[H2O2], M 0.016�10�10 0.19�10�10 2.4�10�10
t1/2(H2O2), μs 12 149 2170d1/2(H2O2), μm 0.16 0.58 2.2Fraction of H2O2 consumed by Prx2 0.997 0.96 0.47Fraction of H2O2 consumed by Cat 2.6�10�3 3.1�10�2 0.47Fraction of H2O2 consumed by GPx 4.4�10�4 5.2�10�3 6.8�10�2
NADPH consumption, M s�1 8.9�10�8 8.7�10�8 4.6�10�8
NADPH consumed per H2O2 eliminated 1 0.97 0.53Fraction of NADPH consumed by TrxR 1 0.99 0.87E(GSSG|GSH), V �0.43 �0.40 �0.36E(NADPþ |NADPH), V �0.39 �0.39 �0.40E(TrxOx|TrxRed), V �0.28 �0.28 �0.29fPSH 1.0 0.99 1.0fPSOH 9.2�10�5 1.4�10�4 4.3�10�5
fPSO2H 1.7�10�8 3.2�10�7 1.3�10�6
fPSS 1.4�10�3 2.1�10�3 6.3�10�4
fPSSPSnH 2.7�10�3 4.2�10�3 1.2�10�3
fPSSPSS 1.9�10�6 4.5�10�6 7.9�10�7
fTrx1TT 0.97 0.97 0.99fTrx1TD 2.5�10�4 2.5�10�4 1.7�10�4
fTrx1DT 3.0�10�2 2.9�10�2 1.4�10�2
fTrx1DD 4.0�10�4 3.7�10�4 1.1�10�4
d1/2, mean diffusion distance computed as per Refs. [65,66] Refs. [65,66a] using the lowest effective diffusion constant determined in Ref. [66b] for ahydrogel (3.7�10–10 m2 s–1); fX, fraction in form X; PSH, PSOH, PSO2H, PSS, Prx2 monomers with the peroxidatic Cys in thiol, sulfenic, sulfinic, anddisulfide forms, respectively; PSSPSnH, PSSPSS, Prx2 dimers with one or two disulfide crosslinks; Trx1TT, Trx1TD, Trx1DT, Trx1DD, Trx1 with the active(first character) and regulatory (second character) site in disulfide (D) or thiol (T) form.
0
5x10⁷
108
0
250
500
Prx2 Cat GPx1
Rat
e co
nsta
nt (M
s)
Con
cent
ratio
ns (M
)
H2O2
Cat
GP
x1
Prx2vsup
Fig. 2. Simple model for H2O2 elimination at low H2O2 supply assuming that Prx2’speroxidase activity is as determined for the purified protein. (A) The mainprocesses consuming H2O2 under these conditions follow pseudo-first-orderkinetics. The fluxes are thus vPrx2¼kOx[Prx2][H2O2]¼k0Prx2[H2O2], vCat¼kFerri[Cat]H2O2]¼k0Cat[H2O2], and vGPx1¼[H2O2]/ϕ1¼k0GPx1[H2O2], and the steady state con-centration [H2O2]¼vsup/(k0Prx2 þ k0Cat þ k0GPx1), with vsup being the H2O2 supplyrate. If k0Prx2 is much higher than k0Cat and k0GPx1, then [H2O2] E vsup/k0Prx2, and Catinhibition or deletion cannot significantly affect [H2O2] and vPrx2. (B) Protein rateconstants (white bars) for reaction with H2O2 and monomer concentrations (blackbars). The apparent second-order rate constant for Cat was computed by applyingEq. (4) from supplementary materials Section 6 and the values for kFerri and kCI fromTable 1; the second-order rate constant and the concentration of active monomersfor GPx1 were inferred by comparing the value of ϕ1 determined in supplementarymaterials Section 5 to the value of Φ1 determined in Ref. [52].
R. Benfeitas et al. / Free Radical Biology and Medicine 74 (2014) 35–4940
for the reaction with H2O2. Namely, Prx2 (57,000 s�1, 99.7%) bCat (146 s�1, 0.26%) 4 GPx1 (25 s�1, 0.044%). The overwhelmingcontribution from Prx2 ensues from both the higher second-orderrate constant and the much higher concentration of this proteinrelative to those of Cat and Gpx1 (Fig. 2B). But estimates based ona lower experimentally determined rate constant [23] for H2O2
reduction by Prx2 (kOx) and Prx2 concentration [64] are qualita-tively similar (Table 2, second column).
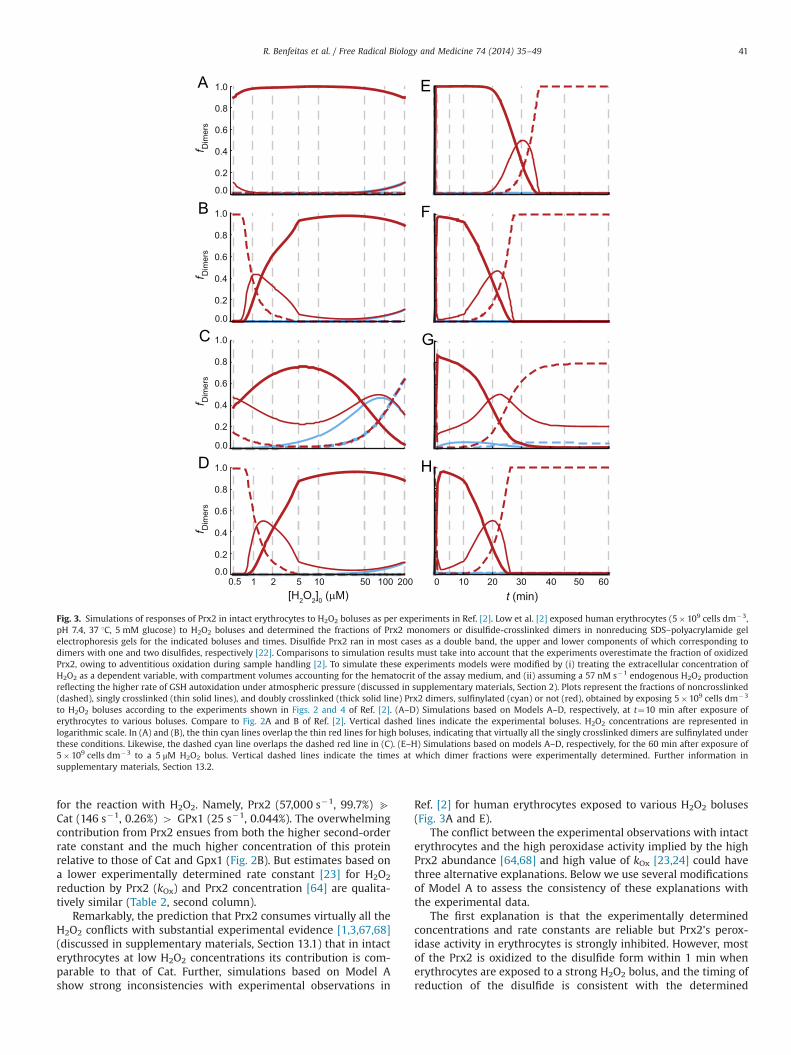
Remarkably, the prediction that Prx2 consumes virtually all theH2O2 conflicts with substantial experimental evidence [1,3,67,68](discussed in supplementary materials, Section 13.1) that in intacterythrocytes at low H2O2 concentrations its contribution is com-parable to that of Cat. Further, simulations based on Model Ashow strong inconsistencies with experimental observations in
Ref. [2] for human erythrocytes exposed to various H2O2 boluses(Fig. 3A and E).
The conflict between the experimental observations with intacterythrocytes and the high peroxidase activity implied by the highPrx2 abundance [64,68] and high value of kOx [23,24] could havethree alternative explanations. Below we use several modificationsof Model A to assess the consistency of these explanations withthe experimental data.
The first explanation is that the experimentally determinedconcentrations and rate constants are reliable but Prx2’s perox-idase activity in erythrocytes is strongly inhibited. However, mostof the Prx2 is oxidized to the disulfide form within 1 min whenerythrocytes are exposed to a strong H2O2 bolus, and the timing ofreduction of the disulfide is consistent with the determined
1 2
0.2
0.4
0.6
0.8
1.0
0.2
0.4
0.6
0.8
1.0
5 10 50 100 200
0.2
0.4
0.6
0.8
1.0
0.2
0.4
0.6
0.8
1.0
0.5
0.0
0.0
0.0
0.0
f Dim
ers
f Dim
ers
f Dim
ers
f Dim
ers
t (min)0 10 20 30 40 50 60
[H2O2]0 (µM)
Fig. 3. Simulations of responses of Prx2 in intact erythrocytes to H2O2 boluses as per experiments in Ref. [2]. Low et al. [2] exposed human erythrocytes (5�109 cells dm�3,pH 7.4, 37 1C, 5 mM glucose) to H2O2 boluses and determined the fractions of Prx2 monomers or disulfide-crosslinked dimers in nonreducing SDS–polyacrylamide gelelectrophoresis gels for the indicated boluses and times. Disulfide Prx2 ran in most cases as a double band, the upper and lower components of which corresponding todimers with one and two disulfides, respectively [22]. Comparisons to simulation results must take into account that the experiments overestimate the fraction of oxidizedPrx2, owing to adventitious oxidation during sample handling [2]. To simulate these experiments models were modified by (i) treating the extracellular concentration ofH2O2 as a dependent variable, with compartment volumes accounting for the hematocrit of the assay medium, and (ii) assuming a 57 nM s�1 endogenous H2O2 productionreflecting the higher rate of GSH autoxidation under atmospheric pressure (discussed in supplementary materials, Section 2). Plots represent the fractions of noncrosslinked(dashed), singly crosslinked (thin solid lines), and doubly crosslinked (thick solid line) Prx2 dimers, sulfinylated (cyan) or not (red), obtained by exposing 5�109 cells dm�3
to H2O2 boluses according to the experiments shown in Figs. 2 and 4 of Ref. [2]. (A–D) Simulations based on Models A–D, respectively, at t¼10 min after exposure oferythrocytes to various boluses. Compare to Fig. 2A and B of Ref. [2]. Vertical dashed lines indicate the experimental boluses. H2O2 concentrations are represented inlogarithmic scale. In (A) and (B), the thin cyan lines overlap the thin red lines for high boluses, indicating that virtually all the singly crosslinked dimers are sulfinylated underthese conditions. Likewise, the dashed cyan line overlaps the dashed red line in (C). (E–H) Simulations based on models A–D, respectively, for the 60 min after exposure of5�109 cells dm�3 to a 5 μM H2O2 bolus. Vertical dashed lines indicate the times at which dimer fractions were experimentally determined. Further information insupplementary materials, Section 13.2.
R. Benfeitas et al. / Free Radical Biology and Medicine 74 (2014) 35–49 41
activity of TrxR [2]. Therefore, the hypothetical inhibitor mustessentially titrate active Prx2 out, readily release it from inhibitionas the active pool is depleted, and not severely limit Prx2reduction. To model this inhibition parsimoniously, we modifiedModel A by considering that reduced Prx2 monomers quicklyequilibrate with a form that cannot reduce H2O2. The equilibriumconstant (KPrx2¼1.7�102) was chosen so that Prx2’s contributionto H2O2 consumption matched that of Cat at the basal steady state.This implies a 499% inhibition. The modified model (Model B)simulates near quantitatively the detailed experimental observa-tions in Ref. [2] and explains some puzzling phenomenologytherein (Fig. 3B and F and additional results in supplementarymaterials Section 13.2). Additionally, the predicted redox poten-tials of Trx1 and NADPH agree with literature values (Table 2 andsupplementary materials Section 13.2). There is a strong disagree-ment with the high rates of Prx2 sulfinylation observed inexperiments in Ref. [4]. However, this is probably because in theseexperiments H2O2 production via glucose oxidase in the absenceof erythrocytes strongly underestimated production in the pre-sence of erythrocytes (supplementary materials, Section 13.3).It should be noted that owing to a lack of available data ourmodels do not account for Prx1, which occurs in erythrocytes at1.2% of Prx2’s abundance [68]. Should Prx1 be as reactive withH2O2 as purified Prx2, it could account for virtually all the NADPH-dependent H2O2 consumption observed in erythrocytes that lackCat activity (supplementary materials, Section 7). One would thenhave to hypothesize a complete inhibition of Prx2’s peroxidaseactivity to explain these observations. However, an effective rateconstant for H2O2 reduction by Prx2 in cells much lower than105 M�1 s�1 would be inconsistent with the observation [2] thatPrx2 is rapidly oxidized upon exposure of 5�109 erythrocytesdm�3 to a 5 μM H2O2 bolus (further details in supplementarymaterials, Section 7). This suggests that Prx2 does not contributemuch less than Cat to H2O2 consumption under low H2O2 suppliesand that the effective rate constant for H2O2 reduction by Prx1 isalso lower than 108 M�1 s�1.
As a second explanation, Prx2’s concentration [64,68] mighthave been severely overestimated. We modeled this possibility bydecreasing the total concentration of Prx2 in Model A to E1 μM,so that Prx2’s contribution to H2O2 consumption matched that ofCat at the basal steady state. However, this model (Model C)yielded results that are inconsistent with the experimental obser-vations (Fig. 3C and G). Further, the E1 μM Prx2 concentration ismuch lower than is implied by the fraction of lysate proteinobtained through the methods [69,70] used to purify Prx2 forthe determinations of kOx [23,24]. And because the obtained valuesof kOx are referred to the mass of these Prx2 preparations, theestimated total Prx2 peroxidase activity in cells is practicallyindependent of its purity. Therefore, this explanation is unviable.
As a third explanation the value of kOx might have beenseverely overestimated. We modeled this possibility by decreasingthat value in Model A to 3.015�105 M�1 s�1, which makes Prx2’scontribution to H2O2 consumption identical to that of Cat at thebasal steady state. The modified model (Model D) simulates theexperimental observations in Ref. [2] as accurately as Model B(Fig. 3D and H) and predicts similar redox potentials. Further, theobservation that Prx2 forms complexes with many proteins [25–28], including Cat [26,28], suggests that interactions with Cat orhorseradish peroxidase (EC 1.11.1.7) in the competition assaysmight have interfered with the determinations [23,24] of kOx.Such interactions might inhibit the competing enzyme or activatePrx2. However, the four different experiments in Refs. [23,24] allyield kOx values in the range 6�106 to 1.0�108 M�1 s�1, with themost accurate experiments yielding the highest values. Anddespite having been carried out at a range of Prx2/Cat and Prx2/peroxidase ratios, none shows evidence of the anomalous behavior
that interactions with Prx2 should cause (supplementary materi-als, Section 7). Further, an extensive inhibition of Cat by Prx2 isinconsistent with the observations [1–3,67,68] showing substan-tial effects of Cat modulation in intact erythrocytes. In turn,activation of isolated Prx2 by Cat is inconsistent with observations[23] of Prx2 oxidation decreasing with increasing Cat activity.
Altogether, the whole body of experimental evidence favors thefirst explanation.
A low effective peroxidase activity of Prx2 spares NADPH andimproves potential signaling properties
Prx2 is the third most abundant protein in human erythrocytes.Further, its very high reactivity requires a precise arrangement ofaminoacyl residues in the active site [71] and would thus be lost tomutational drift in the absence of a selective pressure requiring itsmaintenance. How can these considerations be reconciled with astrong inhibition of the peroxidase activity in human erythrocytes?
Below we examine the hypothesis that a large amount ofreversibly inhibited Prx2—the design represented by Model B—conveys advantages that cannot be achieved by a lower amount ofPrx2 (Model/Design C) or a less H2O2-reactive Prx2 (Model/DesignD). These advantages might be related to the management of theNADPH pool and/or to the action of Prx2 as a H2O2 sensor for theCat/Prx2/Trx1/TrxR system (CPTTRS) functioning as a transducer ofH2O2 supply (vsup) into protein thiol redox states. We consider aspotential signaling outputs the concentrations or redox potentialsof any forms of Prx2 or Trx1 that can in principle specifically reactwith or bind to other proteins not part of the CPTTRS, regulatingtheir activities. Additionally, the intracellular concentration ofH2O2 is also an output because it is largely determined by theCPTTRS and it can be read by other cellular sensors. For the CPTTRSto be a good analog transducer it must satisfy at least the followingtwo criteria. First, the output must be sensitive to the input. Thissensitivity is normally measured by the gain (g) of the output (y)with respect to the input (x), g¼∂ log y/∂ log x E (x/y) (Δy/Δx), forsmall Δx. A good gain normally means g Z 1. Second, there shouldbe a wide region of constant gain, that is, a region where a c-foldchange in the input consistently translates into a cg-fold change inthe output so that the signal is transmitted undistorted. Constantgain regions are characterized by straight lines in plots of log y vslog x. The ratio between the highest value of x in the constant gainregion and the lowest value of x in the region (or the basal value ofx if the region extends to lower values) is denoted by “dynamicrange.” For the CPTTRS to be a good digital transducer it has tosatisfy at least the following criteria. First, the ratio between theoutput value at the “high” state and that at the “low” state must behigh enough to clearly separate the two states despite sporadicfluctuations. Second, transition between the low and the high statemust occur within a narrow range of the input, a property denotedas “decisiveness.”
Armed with these concepts and terminology, we now examinethe extent to which Designs B–D of the CPTTRS fulfill the criteriaabove. Models B–D permit a meaningful comparison among thesethree otherwise equivalent designs, as the only differing para-meters were adjusted so that the same steady-state H2O2 con-centrations, consumption rate, and fractional contributions of Catvs Prx2 obtain under the reference (basal) conditions. We alsocompare to Model/Design A to examine the consequences of itshigh peroxidase activity.
At steady state, Designs A, B, and D respond to increasing H2O2
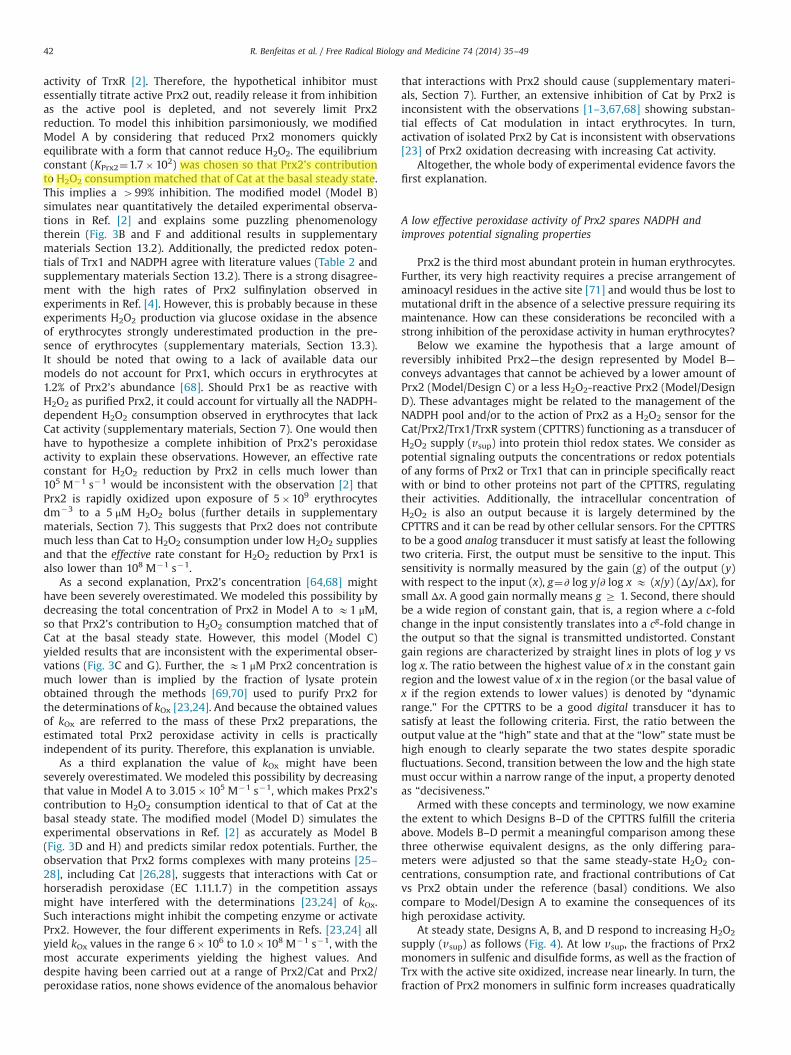
supply (vsup) as follows (Fig. 4). At low vsup, the fractions of Prx2monomers in sulfenic and disulfide forms, as well as the fraction ofTrx with the active site oxidized, increase near linearly. In turn, thefraction of Prx2 monomers in sulfinic form increases quadratically
R. Benfeitas et al. / Free Radical Biology and Medicine 74 (2014) 35–4942
Salvador
Highlight
This was a "Salomonic" decision. Some experiments with intact erythrocytes suggest a higher contribution of Cat, other suggest a lower one. The experiments in ref. 2 are not precise enough to resolve this matter. Overall, my impression is that Prx2 may contribute as little as 25%.
with vsup. This follows from this species forming upon twosuccessive oxidations by H2O2. At higher vsup the Prx2 oxidationrate approaches TrxR’s capacity to reduce Trx. As a consequence
Trx accumulates in singly and then doubly oxidized forms. Becausethe latter is not a TrxR substrate, Prx2 reduction and the Trx redoxpotential (in absolute value) sharply decrease and cause a sharp
10-7
10-9
10-11
100
10-2
10-4
[H2O
2] (M
)
f PS
H
1.0
0.5
0.0
10-1
10-3
10-5
v NA
DP
H/v
H2O
2
f PS
OH
100
10-2
10-1 10-3
100
10-6
f TSS
f PS
O2H
f PS
S
-0.15
-0.20
-0.25
-0.30
10-2
10-4
100
E(T
rx) (
V)
vsup (µM s-1)
2 3 40.0
0.5
1.0
0.1 1 10 0.1 1 10
vsup (µM s-1)
Fig. 4. Steady-state responses of alternative designs of the Prx2 redox cycle in H2O2 metabolism to changes in H2O2 supply. Cyan, Design A; black, Design B; green, Design C;dashed red, Design D. Each design corresponds to the respective model variant described in Table 1. Note the logarithmic scales, except for E(Trx) in (G). (A) H2O2
concentration. Note (i) the extremely low H2O2 concentrations at low vsup and very abrupt increase for Design A and (ii) the higher H2O2 concentrations at intermediate vsupfor Design C. (B) Fraction of Prx2 monomers in reduced form. Note (i) the abrupt decrease for Design A occurring at vsup values about half of those causing a milder decreasefor Designs B and D and (ii) the gradual decrease for Design C, starting at very low vsup and resulting in most Prx2 being oxidized at intermediate vsup. (C) Ratio between ratesof NADPH and H2O2 consumption. Note (i) the much higher NADPH consumed per H2O2 at low vsup for Design A and (ii) the lower NADPH consumption per H2O2 for DesignC, reflecting respectively the high and low contributions of Prx2 for H2O2 elimination under these designs. (D) Fraction of Prx2 monomers in sulfenic form. (E) Fraction of Trxwith the active site oxidized. Note the much lower accumulation of this form under Design C. (F) Fraction of Prx2 monomers in sulfinic form. Note (i) the much higher valuesunder Design C and (ii) the high gain (2) over most of the vsup range under all designs. (G) Redox potential of the Trx active site. (H) Fraction of Prx2 monomers in disulfideform. In (D–H), note (i) the higher dynamic ranges provided by Designs B and D compared to Designs A and C; (ii) except in (F), the low gains and very low dynamic rangeprovided by Design C. In (B (inset), G, and H) note the better decisiveness provided by Design B vs Design D. Accumulation of Prx2 in sulfenic (D) and sulfinic (F) forms isnegligible under Designs A, B, and D, but not under Design C.
R. Benfeitas et al. / Free Radical Biology and Medicine 74 (2014) 35–49 43
Salvador
Sticky Note
Note the abrupt oxidation of the Trx and Prx pools. This happens where the rate of Prx2 oxidation approaches the maximal rate of Trx reduction. Before the transition [H2O2] ~ vsupply/(k1Cat + k1Prx), with k1Cat and k1Prx the pseudo-first-order rate constants for reaction of H2O2 with Cat and Prx2, respectively. After the transition, [H2O2] ~ vsupply/k1Cat Thus: 1. An increase in the fraction of H2O2 consumed by Cat (under basal conditions) will shift the transition to higher vsup and decrease its abruptness. 2. The transition could be taken as separating stress from non-stress in a natural way. 3. Under the current setting (Cat consuming 50% of the H2O2) the transition occurs at [H2O2]plasma ~ 300 nM, which is about the [H2O2] that would obtain in major blood vessels if the phagocytes were fully activated. 4. The observation in ref. 6 that in erythrocytes from endotoxemic rats or in human erythrocytes adhering in vitro to activated phagocytes Prx2 is <50% oxidized can be reconciled with this abrupt transition if (a) there was heterogeneous Prx2 oxidation (some erythrocytes w/ all Prx oxidized, others with very little, either because of cellular heterogeneity or because of heterogeneous exposure), OR (b) the contribution of Prx2 for H2O2 elimination under low vsup is even lower than assumed. We will publish a systematic analysis of the variables influencing the various aspects of the response and an exploration of the implications for other cell types in an upcoming paper.
0 30 60t (hour)
0 5 10t (min)
0 6 12t (min)
10-50.5 µM H2O2 pulse 5 µM H2O2 pulse 50 µM H2O2 pulse
10-9
10-13
[H2O
2] (M
)
t (min)
1.0
0.5
0.0
f PS
H
10-1
10-5
10-9
f PS
O2H
0 1 20 1 20 1 2
100
10-4
10-3
10-1
10-2
10-5
f PS
OH
1.0
0.5
0.0
f PS
S
t (min) t (min)
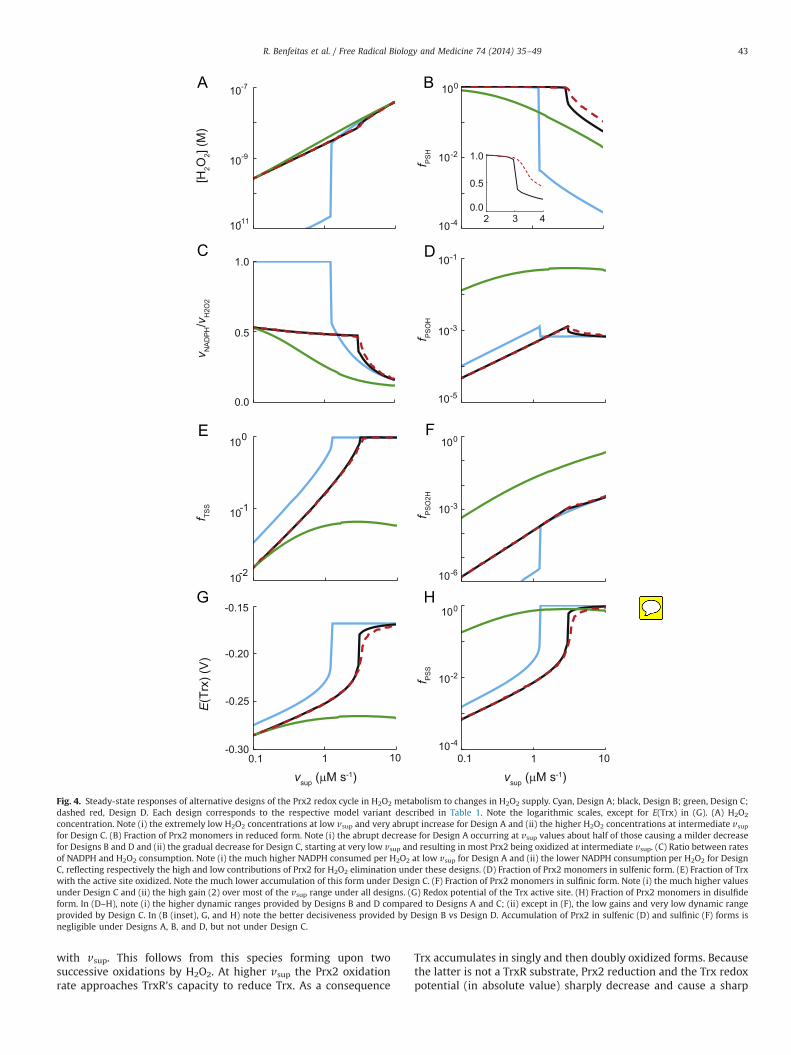
Fig. 5. Responses of intracellular H2O2 concentration and Prx2 oxidation states to extracellular H2O2 pulses. Time courses (A) of the intracellular H2O2 concentration and(B–E) of the fractions of Prx2 monomers with the peroxidatic Cys in thiol (B), sulfenic (C), sulfinic (D), and disulfide (E) form upon 3 s pulse of 0.5, 5, and 50 μM local plasmaH2O2 concentrations. Vertical gray bars indicate the timing and duration of the H2O2 pulse. The correspondence of line to design is as for Fig. 4. Recovery of the PSH pool afterthe strongest H2O2 pulses is delayed by strong competition of GSR for NADPH after GSSG accumulation during the pulse (see Figs. 6B and 6C). Note the strong oxidation ofPrx2 caused by even relatively weak H2O2 pulses in Design D, owing to the total concentration of Prx2 in this design being less than half the dose of H2O2 entering theerythrocyte during the pulse. Note also the very slow reduction of the sulfinic Prx2 accumulated during the pulse.
R. Benfeitas et al. / Free Radical Biology and Medicine 74 (2014) 35–4944
accumulation of Prx2 disulfide and a steep decline in H2O2
reduction.These three designs provide sensitive constant-gain responses of
various potential signaling outputs (Fig. 4A, D–F, 4H) to changes invsup, over large dynamic ranges. The dynamic ranges extend toapproximately twofold higher values in Designs B and D relative toDesign A, owing to less than half of the supplied H2O2 beingconsumed via Prx2. Further, the first two designs spend much lessNADPH per H2O2 consumed than the last (Fig. 4C). Overall, theresponses of Designs B and D are very similar, but Design B providesbetter digital transduction (Fig. 4B, G, H) than Design D, separatingthe proportional response from the saturated regime through astronger and more decisive threshold. This feature may be advanta-geous in activating a stress response at a sharp stress threshold.
In contrast, Design C fails to yield a constant-gain response orto achieve substantial oxidation of the Trx pool, owing to the lowPrx2 concentration. Furthermore, it leads to extensive Prx2 sulfi-nylation at high values of vsup, owing to Trx1 remaining mainly inreduced form even at high vsup and therefore readily regeneratingthe Prx2 dithiol and ensuring a steady supply of sulfenic Prx2.
Erythrocytes are often exposed to brief H2O2 concentrationpulses as they cross inflammation sites (see Physiological setting),
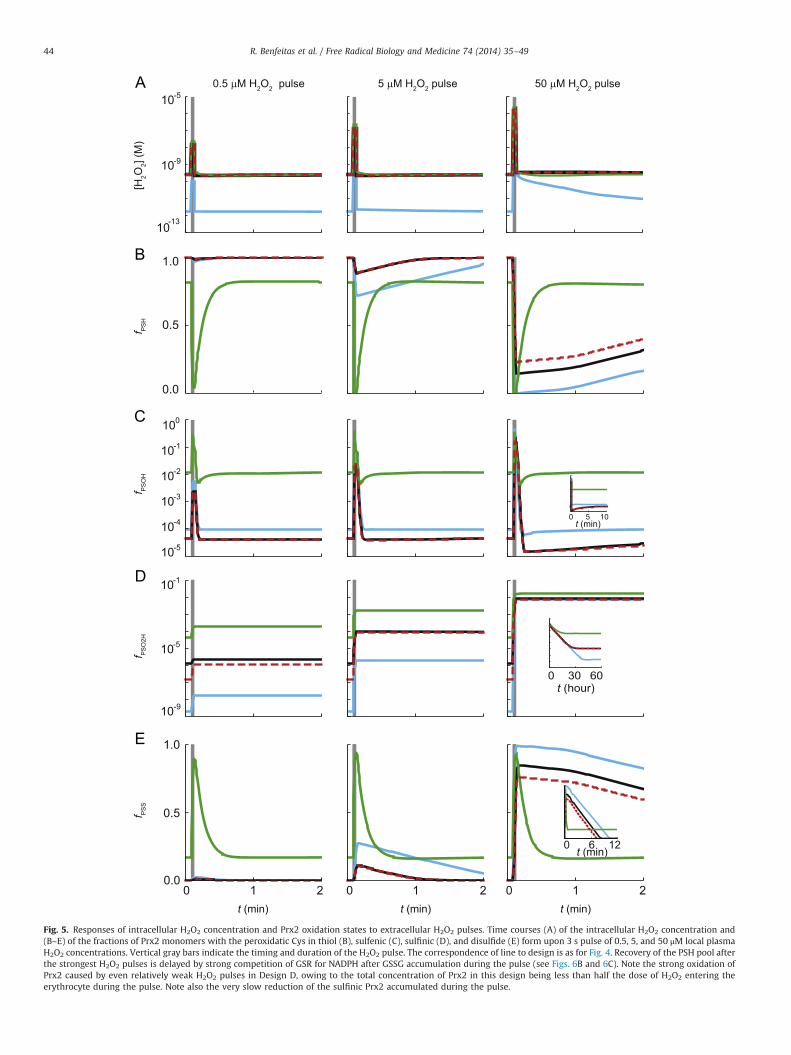
which makes the dynamic response relevant (Figs. 5–7). Relativeto Design A, Designs B and D are characterized by lower totalNADPH expenditure (Fig. 7A) and extended dynamic ranges(Figs. 7B, E). Further, these two designs show faster recovery ofthe redox pools after H2O2 pulses (Figs. 5 and 6). This feature isadvantageous to avoid a gradual buildup of oxidized forms of Prx2,Trx1, and GSH as erythrocytes recurrently cross inflammationsites, as may happen in pulmonary infections (see Physiologicalsetting). Overall, Designs B and D show similar dynamic behaviors.In contrast, in Design C, even modest H2O2 pulses fully oxidizePrx2 (Fig. 5E). As a consequence, almost all the potential signalingoutputs saturate at low pulse amplitudes; with the exception ofthe fraction of sulfinylated Prx2, the response to a 3-s, 0.5 μMplasma H2O2 pulse is similar to the response to a 50 μM pulse(Fig. 5C–E).
Discussion
This work presents an up-to-date quantitative assessment ofthe H2O2 metabolism in human erythrocytes, which allowed us toevaluate the consistency of the present knowledge about this
-0.15
-0.20
-0.25
-0.30
E(G
SH
) (V
)
-0.20
-0.28
-0.36
-0.44
E(N
AD
PH
) (V
)
-0.25
-0.30
-0.35
-0.40
t (min) t (min) t (min)0 1 20 1 20 1 2
0 6 12t (min)
0.5 µM H2O2 pulse µM H2O25 pulse 50 µM H2O2 pulse
0 6 12t (min)
0 6 12t (min)
E(T
rx) (
V)
Fig. 6. Responses of the potentials of redox pools to extracellular H2O2 pulses. The correspondence of line to model is as for Fig. 4. Time course of the redox potentials of(A) Trx1, (B) GSH, and (C) NADPH upon 3 s pulse of 0.5, 5, and 50 μM local plasma H2O2 concentrations. Vertical gray bars indicate the timing and duration of the H2O2 pulse.Note the delay in the recovery of all the redox potentials after the strongest pulses. This ensues mainly from NADPH depletion by the GSR-catalyzed reduction of GSSGaccumulated during the pulse and from the limited rate at which erythrocytes can reduce NADPþ to NADPH.
R. Benfeitas et al. / Free Radical Biology and Medicine 74 (2014) 35–49 45
process. Computational predictions based on available kinetic datawere compared to experimental observations of intact humanerythrocytes and flagged a fundamental discrepancy. On one hand,
the rate constants [23,24] for H2O2 reduction by Prx2 and itsconcentration [64,68] in reduced, nonsulfinylated form [2,4,72]would make it almost solely responsible for clearing H2O2 in
106
103
100
106
103
100
∆vsup (µM s-1)
104
102
100
0.00
0.07
0.14
103
103
100
104
102
1000.0
0.1
0.2
10-1
101
10-1 101 103
∆vsup (µM s-1)10-1 101 103
NA
DP
H c
onsu
med
by p
ulse
(µM
)[H
2O2] M
ax/[H
2O2] B
asal
E(T
rx1)
Max
-E(T
rx1)
Bas
alE
(GS
H) M
ax-E
(GS
H) B
asal
[PS
OH
] Max
/[PS
OH
] Bas
al[P
SO
2H] M
ax/[P
SO
2H] B
asal
[PS
S] M
ax/[P
SS
] Bas
al
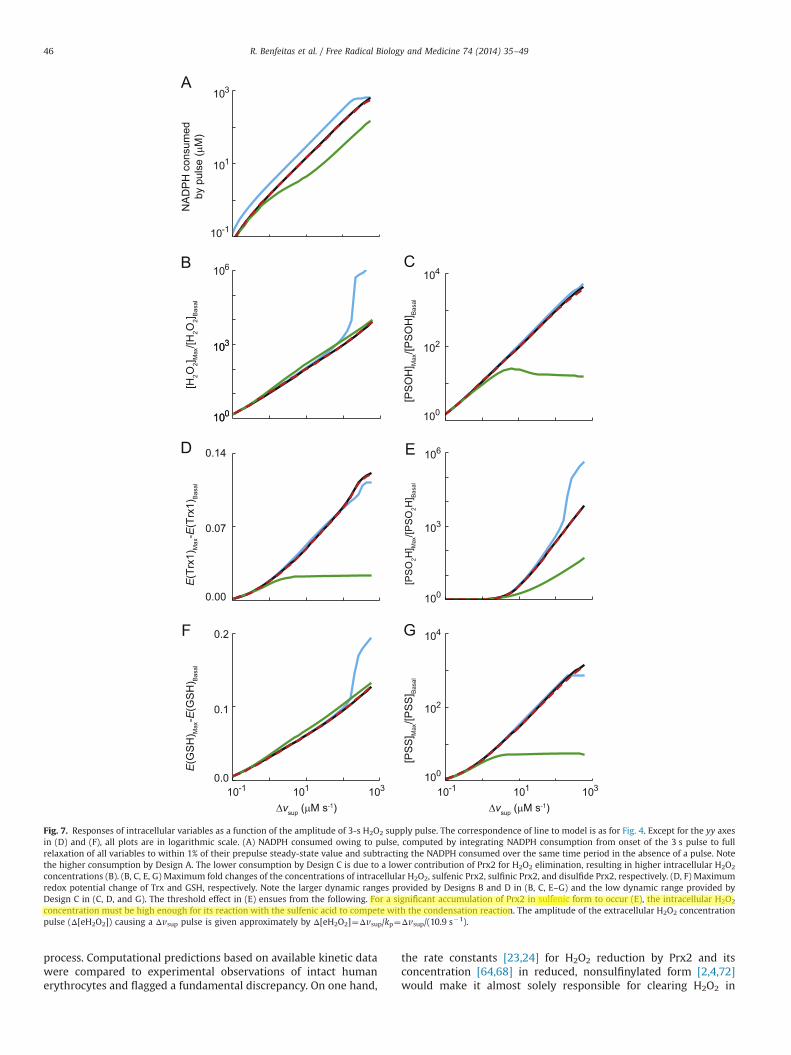
Fig. 7. Responses of intracellular variables as a function of the amplitude of 3-s H2O2 supply pulse. The correspondence of line to model is as for Fig. 4. Except for the yy axesin (D) and (F), all plots are in logarithmic scale. (A) NADPH consumed owing to pulse, computed by integrating NADPH consumption from onset of the 3 s pulse to fullrelaxation of all variables to within 1% of their prepulse steady-state value and subtracting the NADPH consumed over the same time period in the absence of a pulse. Notethe higher consumption by Design A. The lower consumption by Design C is due to a lower contribution of Prx2 for H2O2 elimination, resulting in higher intracellular H2O2
concentrations (B). (B, C, E, G) Maximum fold changes of the concentrations of intracellular H2O2, sulfenic Prx2, sulfinic Prx2, and disulfide Prx2, respectively. (D, F) Maximumredox potential change of Trx and GSH, respectively. Note the larger dynamic ranges provided by Designs B and D in (B, C, E–G) and the low dynamic range provided byDesign C in (C, D, and G). The threshold effect in (E) ensues from the following. For a significant accumulation of Prx2 in sulfenic form to occur (E), the intracellular H2O2
concentration must be high enough for its reaction with the sulfenic acid to compete with the condensation reaction. The amplitude of the extracellular H2O2 concentrationpulse (Δ[eH2O2]) causing a Δvsup pulse is given approximately by Δ[eH2O2]¼Δvsup/kp¼Δvsup/(10.9 s�1).
R. Benfeitas et al. / Free Radical Biology and Medicine 74 (2014) 35–4946
Salvador
Highlight
"sulfinic" (this was a typo)
Salvador
Highlight
A remarkable aspect about these curves is that we observe a biphasic response of sulfinylation to H2O2 pulses as recently reported by Elisabeth Veal and co-workers without needing to invoke a large thiol-redox pool reacting with the H2O2.
human erythrocytes at physiological supply rates. On the otherhand, extensive evidence (supplementary materials, Section 13.1)indicates that Prx2's contribution to H2O2 elimination is compar-able to that of Cat. Also, most Prx2 is oxidized to the disulfide formwithin 1 min when 5�109 erythrocytes dm�3 are exposed to a5 μM H2O2 bolus [2].
Altogether, these observations indicate that the effective rateconstant for H2O2 reduction by Prx2 in erythrocytes is much lowerthan that determined for the purified protein. This may be becausethe experimental determinations overestimated the rate constantby 2 orders of magnitude or because Prx2’s peroxidase activity isstrongly (499%) but reversibly inhibited in cells. Accounting foreither of these hypotheses permitted simulating the detailedexperimental results in Ref. [2] accurately. However, the rawexperimental data [67,73] do not support the possibility of anoverestimation of the rate constant caused by the association ofPrx2 to Cat or horseradish peroxidase, which adds weight to thealternative hypothesis.
The hypothetic inhibition is unlikely to be mediated by covalentpost-translational modifications for the following two reasons. First,the Prx2 in the kinetic studies in Refs. [23,24] should carry the samecovalent modifications as in the human erythrocytes from which itwas purified; yet it has very high peroxidase activity. Second, the fastturnover implied by the fast Prx2 oxidation observed in Ref. [2]makes regulation by covalent modification energetically forbidding(see supplementary materials, Section 14.1).
A binding-dissociation (near) equilibrium is a more likely inhibitorymechanism. However, one must acknowledge the lack of obviousinhibitors. These must be in sufficient excess over Prx2 to titrate itand form an inhibitory complex that is weak enough to permitready dissociation. Few known erythrocyte metabolites and onlytwo proteins—carbonic anhydrase and hemoglobin—are suffi-ciently abundant. No low-molecular-weight (MW) physiological
effectors of Prx2 with the necessary characteristics are known atpresent. In turn, Prx2 binds hemoglobin and this binding isnecessary for protecting the latter against H2O2-induced aggrega-tion [5]. It is unknown if this interaction inhibits Prx2’s peroxidaseactivity.
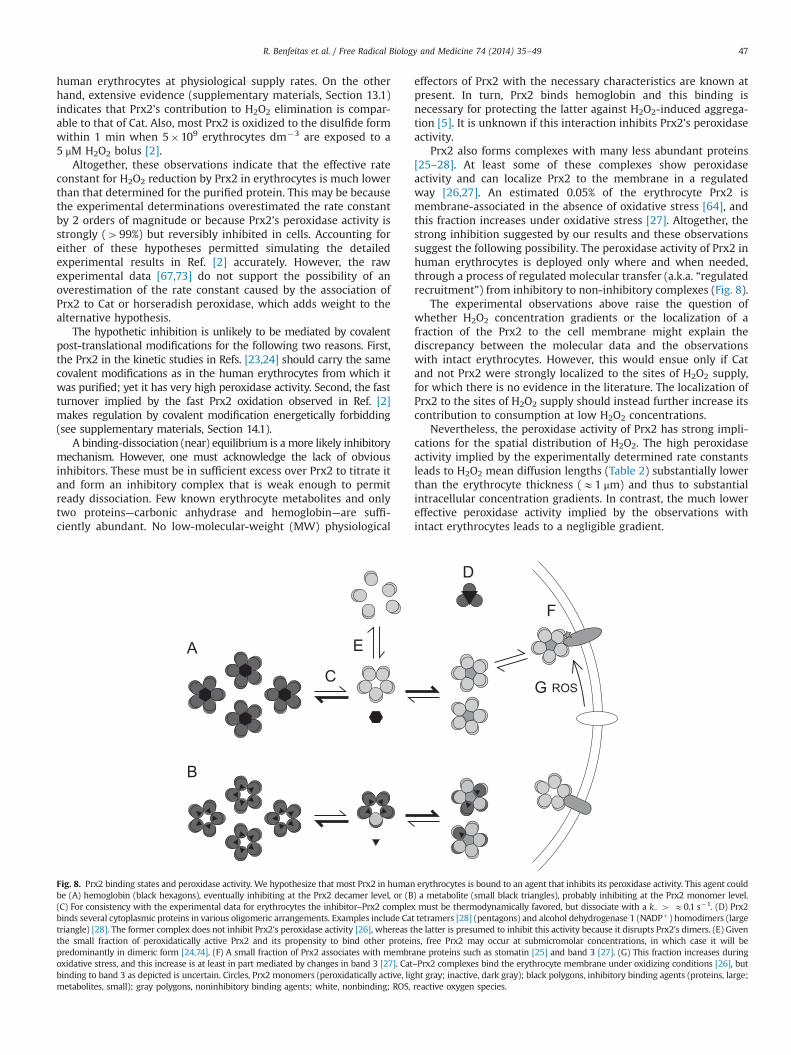
Prx2 also forms complexes with many less abundant proteins[25–28]. At least some of these complexes show peroxidaseactivity and can localize Prx2 to the membrane in a regulatedway [26,27]. An estimated 0.05% of the erythrocyte Prx2 ismembrane-associated in the absence of oxidative stress [64], andthis fraction increases under oxidative stress [27]. Altogether, thestrong inhibition suggested by our results and these observationssuggest the following possibility. The peroxidase activity of Prx2 inhuman erythrocytes is deployed only where and when needed,through a process of regulated molecular transfer (a.k.a. “regulatedrecruitment”) from inhibitory to non-inhibitory complexes (Fig. 8).
The experimental observations above raise the question ofwhether H2O2 concentration gradients or the localization of afraction of the Prx2 to the cell membrane might explain thediscrepancy between the molecular data and the observationswith intact erythrocytes. However, this would ensue only if Catand not Prx2 were strongly localized to the sites of H2O2 supply,for which there is no evidence in the literature. The localization ofPrx2 to the sites of H2O2 supply should instead further increase itscontribution to consumption at low H2O2 concentrations.
Nevertheless, the peroxidase activity of Prx2 has strong impli-cations for the spatial distribution of H2O2. The high peroxidaseactivity implied by the experimentally determined rate constantsleads to H2O2 mean diffusion lengths (Table 2) substantially lowerthan the erythrocyte thickness (E1 μm) and thus to substantialintracellular concentration gradients. In contrast, the much lowereffective peroxidase activity implied by the observations withintact erythrocytes leads to a negligible gradient.
Fig. 8. Prx2 binding states and peroxidase activity. We hypothesize that most Prx2 in human erythrocytes is bound to an agent that inhibits its peroxidase activity. This agent couldbe (A) hemoglobin (black hexagons), eventually inhibiting at the Prx2 decamer level, or (B) a metabolite (small black triangles), probably inhibiting at the Prx2 monomer level.(C) For consistency with the experimental data for erythrocytes the inhibitor–Prx2 complex must be thermodynamically favored, but dissociate with a k– 4 E0.1 s�1. (D) Prx2binds several cytoplasmic proteins in various oligomeric arrangements. Examples include Cat tetramers [28] (pentagons) and alcohol dehydrogenase 1 (NADPþ) homodimers (largetriangle) [28]. The former complex does not inhibit Prx2’s peroxidase activity [26], whereas the latter is presumed to inhibit this activity because it disrupts Prx2’s dimers. (E) Giventhe small fraction of peroxidatically active Prx2 and its propensity to bind other proteins, free Prx2 may occur at submicromolar concentrations, in which case it will bepredominantly in dimeric form [24,74]. (F) A small fraction of Prx2 associates with membrane proteins such as stomatin [25] and band 3 [27]. (G) This fraction increases duringoxidative stress, and this increase is at least in part mediated by changes in band 3 [27]. Cat–Prx2 complexes bind the erythrocyte membrane under oxidizing conditions [26], butbinding to band 3 as depicted is uncertain. Circles, Prx2 monomers (peroxidatically active, light gray; inactive, dark gray); black polygons, inhibitory binding agents (proteins, large;metabolites, small); gray polygons, noninhibitory binding agents; white, nonbinding; ROS, reactive oxygen species.
R. Benfeitas et al. / Free Radical Biology and Medicine 74 (2014) 35–49 47
The hypothesis that Prx2’s peroxidase activity is strongly inhibitedhas the following functional implication: the main role of Prx2 inhuman erythrocytes cannot be to minimize the intracellular concen-tration of H2O2 or of any other peroxide substrates. Indeed, H2O2 notbeing very reactive, the benefits of keeping its concentration at o0.1molecule/cell (Table 2) can hardly balance their high costs, namely, theinvestment of 2.7% of this cell’s cytoplasmic protein mass in Prx2 [68]and the waste of 1 NADPH/H2O2. More efficient protection againstH2O2 could be achieved at much lower protein mass and E0 NADPH/H2O2 by doubling the amount of Cat. Further, the low H2O2 concen-trations stated above would be too low to significantly oxidize lessabundant [68] sensors such as Prx1 and Prx6 before Prx2 becomesfully oxidized. Instead, the large amount of Prx2 in erythrocytes maybe required for it to protect proteins against unfolding and aggregationas a holdase [75] and/or for effective signaling. A strong but quicklyreversible inhibition would then alleviate the NADPH cost of the“excessive” peroxidase activity while leaving the reducing equivalentsin Prx2 available to help eliminate H2O2 under stress.
Although high-MW Prx2 (4240 kDa) multimers triggered bysulfinylation show the strongest holdase activity [75], lower-MWforms that predominate at low oxidative loads [24,74] also showsubstantial activity [5,72,75]. In turn, Prx2 has also been involvedin various signaling processes [76,77].
Remarkably, our computational results indicate that a designwith abundant Prx2 subject to strong reversible inhibition (DesignB) has better signal transduction properties than a design with lowPrx2 abundance (Design C). Namely (Figs. 4 and 5), it provides (a) alarge dynamic range in which changes in H2O2 supply translateinto proportional changes in potential signaling outputs and (b) asharp transition between a proportional response regime and asaturated regime in which potential signaling outputs are at theirmaximum values. Property (a) is desirable for analog signaltransduction, whereas property (b) is desirable for digital signaltransduction (e.g., for triggering an emergency response). Design Bachieves these advantages at a lower NADPH cost, faster recoveryof the Prx2 and Trx1 redox states after perturbation, and extendedrange of proportional response relative to a design with normalPrx2 abundance and no inhibition (Design A). It is also the designthat provides the best digital signal transduction.
Peroxiredoxins are very abundant in most cell types [78] andthis poses similar problems of NADPH waste in H2O2 eliminationand inhibition of competing H2O2 signaling pathways. An effectiveperoxidase activity that is well balanced with Cat’s H2O2 dismu-tase activity and with the reactivities of other H2O2 sensors shouldhave the same advantages in these cells as highlighted in this workfor human erythrocytes. These possibilities highlight the complex-ity of thiol redox systems and call for integrated theoretical–experimental approaches toward improving our understanding.
Acknowledgments
We acknowledge Fellowship SFRH/BD/51199/2010 to R.B. andGrants PEst-C/SAU/LA0001/2013-2014, PEst-OE/QUI/UI0612/2013,PEst-OE/QUI/UI0313/2014, and FCOMP-01-0124-FEDER-020978financed by FEDER through the “Programa Operacional Factoresde Competitividade, COMPETE” and by national funds through“FCT, Fundação para a Ciência e a Tecnologia” (Project PTDC/QUI-BIQ/119657/2010).
Appendix A. Supplementary material
Supplementary data associated with this article can be found inthe online version at http://dx.doi.org/10.1016/j.freeradbiomed.2014.06.007.
References
[1] Johnson, R. M.; Goyette, G.; Ravindranath, Y.; Ho, Y. -S. Hemoglobin autoxida-tion and regulation of endogenous H2O2 levels in erythrocytes. Free Radic. Biol.Med. 39:1407–1417; 2005.
[2] Low, F. M.; Hampton, M. B.; Peskin, A. V.; Winterbourn, C. C. Peroxiredoxin2 functions as a noncatalytic scavenger of low-level hydrogen peroxide in theerythrocyte. Blood 109:2611–2617; 2007.
[3] Johnson, R. M.; Ho, Y. -S.; Yu, D. -Y.; Kuypers, F. A.; Ravindranath, Y.; Goyette, G. W.The effects of disruption of genes for peroxiredoxin-2, glutathione peroxidase-1,and catalase on erythrocyte oxidative metabolism. Free Radic. Biol. Med. 48:519–-525; 2010.
[4] Cho, C. S.; Lee, S.; Lee, G. T.; Woo, H. A.; Choi, E. J.; Rhee, S. G. Irreversibleinactivation of glutathione peroxidase 1 and reversible inactivation of peroxir-edoxin II by H2O2 in red blood cells. Antioxid. Redox Signaling 12:1235–1246; 2010.
[5] Han, Y. -H.; Kim, S. -U.; Kwon, T. -H.; Lee, D. -S.; Ha, H. -L.; Park, D. -S.; Woo, E. -J.;Lee, S. -H.; Kim, J. -M.; Chae, H. -B.; Lee, S. Y.; Kim, B. Y.; Yoon, D. Y.; Rhee, S. G.;Fibach, E.; Yu, D. -Y. Peroxiredoxin II is essential for preventing hemolytic anemiafrom oxidative stress through maintaining hemoglobin stability. Biochem.Biophys. Res. Commun. 426:427–432; 2012.
[6] Bayer, S. B.; Maghzal, G.; Stocker, R.; Hampton, M. B.; Winterbourn, C. C.Neutrophil-mediated oxidation of erythrocyte peroxiredoxin 2 as a potentialmarker of oxidative stress in inflammation. FASEB J. 27:3315–3322; 2013.
[7] Antunes, F.; Salvador, A.; Pinto, R. E. PHGPx and phospholipase A2/GPx:comparative importance on the reduction of hydroperoxides in rat livermitochondria. Free Radic. Biol. Med. 19:669–677; 1995.
[8] Salvador, A.; Antunes, F.; Pinto, R. E. Kinetic modelling of in vitro lipidperoxidation experiments—'low level' validation of a model of in vivo lipidperoxidation. Free Radic. Res. 23:151–172; 1995.
[9] Antunes, F.; Salvador, A.; Marinho, H. S.; Alves, R.; Pinto, R. E. Lipid peroxida-tion in mitochondrial inner membranes. I. An integrative kinetic model. FreeRadic. Biol. Med. 21:917–943; 1996.
[10] Salvador, A.; Sousa, J.; Pinto, R. E. Hydroperoxyl, superoxide and pH gradientsin the mitochondrial matrix: a theoretical assessment. Free Radic. Biol. Med.31:1208–1215; 2001.
[11] Gardner, R.; Salvador, A.; Moradas-Ferreira, P. Why does SOD overexpressionsometimes enhance, sometimes decrease, hydrogen peroxide production? Aminimalist explanation Free Radic. Biol. Med. 32:1351–1357; 2002.
[12] Salvador, A.; Savageau, M. A. Quantitative evolutionary design of glucose6-phosphate dehydrogenase expression in human erythrocytes. Proc. Natl.Acad. Sci. USA 100:14463–14468; 2003.
[13] Makino, N.; Sasaki, K.; Hashida, K.; Sakakura, Y. A metabolic model describingthe H2O2 elimination by mammalian cells including H2O2 permeation throughcytoplasmic and peroxisomal membranes: comparison with experimentaldata. Biochim. Biophys. Acta 1673:149–159; 2004.
[14] Gardner, R.; Moradas-Ferreira, P.; Salvador, A. Why does superoxide dismutaseoverexpression often increase hydrogen peroxide concentrations? An alter-native explanation J. Theor. Biol. 242:798–800; 2006.
[15] Salvador, A.; Savageau, M. A. Evolution of enzymes in a series is driven bydissimilar functional demands. Proc. Natl. Acad. Sci. USA 103:2226–2231; 2006.
[16] Coelho, P. M. B. M.; Salvador, A.; Savageau, M. A. Quantifying global toleranceof biochemical systems: design implications for moiety-transfer cycles. PLoSComput. Biol. 5:e1000319; 2009.
[17] Adimora, N. J.; Jones, D. P.; Kemp, M. L. A model of redox kinetics implicatesthe thiol proteome in cellular hydrogen peroxide responses. Antioxid. RedoxSignaling 13:731–743; 2010.
[18] Coelho, P. M. B. M.; Salvador, A.; Savageau, M. A. Relating mutant genotype tophenotype via quantitative behavior of the NADPH redox cycle in humanerythrocytes. PLoS One 5:e13031; 2010.
[19] Pillay, C. S.; Hofmeyr, J. -H. S.; Rohwer, J. M. The logic of kinetic regulation inthe thioredoxin system. BMC Syst. Biol. 5:15; 2011.
[20] Aon, M. A.; Stanley, B. A.; Sivakumaran, V.; Kembro, J. M.; O'Rourke, B.;Paolocci, N.; Cortassa, S. Glutathione/thioredoxin systems modulate mito-chondrial H2O2 emission: an experimental–computational study. J. Gen.Physiol. 139:479–491; 2012.
[21] Alves, R.; Antunes, F.; Salvador, A. Tools for kinetic modeling of biochemicalnetworks. Nat. Biotechnol. 24:667–672; 2006.
[22] Peskin, A. V.; Dickerhof, N.; Poynton, R. A.; Paton, L. N.; Pace, P. E.; Hampton,M. B.; Winterbourn, C. C. Hyperoxidation of peroxiredoxins 2 and 3: rateconstants for the reactions of the sulfenic acid of the peroxidatic cysteine.J. Biol. Chem. 288:14170–14177; 2013.
[23] Peskin, A. V.; Low, F. M.; Paton, L. N.; Maghzal, G. J.; Hampton, M. B.;Winterbourn, C. C. The high reactivity of peroxiredoxin 2 with H2O2 is notreflected in its reaction with other oxidants and thiol reagents. J. Biol. Chem.282:11885–11892; 2007.
[24] Manta, B.; Hugo, M.; Ortiz, C.; Ferrer-Sueta, G.; Trujillo, M.; Denicola, A. Theperoxidase and peroxynitrite reductase activity of human erythrocyte perox-iredoxin 2. Arch. Biochem. Biophys. 484:146–154; 2009.
[25] Moore, R. B.; Shriver, S. K. Protein 7.2b of human erythrocyte membranesbinds to calpromotin. Biochem. Biophys. Res. Commun. 232:294–297; 1997.
[26] Rinalducci, S.; D'Amici, G. M.; Blasi, B.; Zolla, L. Oxidative stress-dependentoligomeric status of erythrocyte peroxiredoxin II (PrxII) during storage understandard blood banking conditions. Biochimie 93:845–853; 2011.
[27] Matte, A.; Bertoldi, M.; Mohandas, N.; An, X.; Bugatti, A.; Brunati, A. M.;Rusnati, M.; Tibaldi, E.; Siciliano, A.; Turrini, F.; Perrotta, S.; De Franceschi, L.
R. Benfeitas et al. / Free Radical Biology and Medicine 74 (2014) 35–4948
Membrane association of peroxiredoxin-2 in red cells is mediated by theN-terminal cytoplasmic domain of band 3. Free Radic. Biol. Med. 55:27–35; 2013.
[28] Pallotta, V.; D'Alessandro, A.; Rinalducci, S.; Zolla, L. Native protein complexesin the cytoplasm of red blood cells. J. Proteome Res. 12:3529–3546; 2013.
[29] Flohé, L.; Loschen, G.; Günzler, W.; Eichele, E. Glutathione peroxidase. V. Thekinetic mechanism. Hoppe Seylers Z. Physiol. Chem. 353:987–999; 1972.
[30] Mannervik, B. A branching reaction mechanism of glutathione reductase.Biochem. Biophys. Res. Commun. 53:1151–1158; 1973.
[31] Thorburn, D. R.; Kuchel, P. W. Regulation of the human-erythrocyte hexose–monophosphate shunt under conditions of oxidative stress: a study usingNMR spectroscopy, a kinetic isotope effect, a reconstituted system andcomputer simulation. Eur. J. Biochem. 150:371–386; 1985.
[32] Worthington, D. J.; Rosemeyer, M. A. Glutathione reductase from humanerythrocytes: catalytic properties and aggregation. Eur. J. Biochem. 67:231–238; 1976.
[33] Chance, B.; Greenstein, D. S.; Roughton, F. J. W. The mechanism of catalaseaction. I. Steady-state analysis. Arch. Biochem. Biophys. 37:301–321; 1952.
[34] Nicholls, P. The formation and catalytic role of catalase peroxide compound II.Biochim. Biophys. Acta 81:479–495; 1964.
[35] Kirkman, H. N.; Rolfo, M.; Ferraris, A. M.; Gaetani, G. F. Mechanisms ofprotection of catalase by NADPH: kinetics and stoichiometry. J. Biol. Chem.274:13908–13914; 1999.
[36] Urig, S.; Lieske, J.; Fritz-Wolf, K.; Irmler, A.; Becker, K. Truncated mutants ofhuman thioredoxin reductase 1 do not exhibit glutathione reductase activity.FEBS Lett. 580:3595–3600; 2006.
[37] Turanov, A. A.; Su, D.; Gladyshev, V. N. Characterization of alternative cytosolicforms and cellular targets of mouse mitochondrial thioredoxin reductase.J. Biol. Chem. 281:22953–22963; 2006.
[38] Grattagliano, I.; Russmann, S.; Palmieri, V. O.; Portincasa, P.; Palasciano, G.;Lauterburg, B. H. Glutathione peroxidase, thioredoxin, and membrane proteinchanges in erythrocytes predict ribavirin-induced anemia. Clin. Pharmacol.Ther. 78:422–432; 2005.
[39] Wagner, T. C.; Scott, M. D. Single extraction method for the spectrophoto-metric quantification of oxidized and reduced pyridine nucleotides in ery-throcytes. Anal. Biochem. 222:417–426; 1994.
[40] George, A.; Pushkaran, S.; Konstantinidis, D. G.; Koochaki, S.; Malik, P.;Mohandas, N.; Zheng, Y.; Joiner, C. H.; Kalfa, T. A. Erythrocyte NADPH oxidaseactivity modulated by Rac GTPases, PKC, and plasma cytokines contributes tooxidative stress in sickle cell disease. Blood 121:2099–2107; 2013.
[41] Giustarini, D.; Dalle-Donne, I.; Colombo, R.; Milzani, A.; Rossi, R. Interferenceof plasmatic reduced glutathione and hemolysis on glutathione disulfidelevels in human blood. Free Radic. Res. 38:1101–1106; 2004.
[42] Albrecht, V.; Roigas, H.; Schultze, M.; Jacobasch, G.; Rapoport, S. The influenceof pH and methylene blue on the pathways of glucose utilization and lactateformation in erythrocytes of man. Eur. J. Biochem. 20:44–50; 1971.
[43] Lacy, F.; Gough, D. A.; Schmid, S. Role of xanthine oxidase in hydrogenperoxide production. Free Radic. Biol. Med. 25:720–727; 1998.
[44] Liu, X. P.; Zweier, J. L. A real-time electrochemical technique for measurementof cellular hydrogen peroxide generation and consumption: evaluation inhuman polymorphonuclear leukocytes. Free Radic. Biol. Med. 31:894–901;2001.
[45] Antunes, F.; Cadenas, E. Cellular titration of apoptosis with steady stateconcentrations of H2O2: submicromolar levels of H2O2 induce apoptosisthrough Fenton chemistry independent of the cellular thiol state. Free Radic.Biol. Med. 30:1008–1018; 2001.
[46] Niethammer, P.; Grabher, C.; Look, A. T.; Mitchison, T. J. A tissue-scale gradientof hydrogen peroxide mediates rapid wound detection in zebrafish. Nature459:996–999; 2009.
[47] Hogg, J. C.; Coxson, H. O.; Brumwell, M. L.; Beyers, N.; Doerschuk, C. M.;MacNee, W.; Wiggs, B. R. Erythrocyte and polymorphonuclear cell transit timeand concentration in human pulmonary capillaries. J. Appl. Physiol. 77:1795–1800; 1994.
[48] Kuebler, W. M.; Parthasarathi, K.; Lindert, J.; Bhattacharya, J. Real-time lungmicroscopy. J. Appl. Physiol. 102:1255–1264; 2007.
[49] Sutton, G. C.; Karnell, J.; Nylin, G. Studies on the rapidity of complete bloodcirculation in man. Am. Heart J. 39:741–748; 1950.
[50] Mueller, S.; Riedel, H. D.; Stremmel, W. Direct evidence for catalase as thepredominant H2O2-removing enzyme in human erythrocytes. Blood90:4973–4978; 1997.
[51] Paglia, D. E.; Valentine, W. N. Studies on quantitative and qualitativecharacterization of erythrocyte glutathione peroxidase. J. Lab. Clin. Med.70:158–169; 1967.
[52] Takebe, G.; Yarimizu, J.; Saito, Y.; Hayashi, T.; Nakamura, H.; Yodoi, J.;Nagasawa, S.; Takahashi, K. A comparative study on the hydroperoxide andthiol specificity of the glutathione peroxidase family and selenoprotein P.J. Biol. Chem. 277:41254–41258; 2002.
[53] Kirkman, H. N.; Galiano, S.; Gaetani, G. F. The function of catalase-boundNADPH. J. Biol. Chem. 262:660–666; 1987.
[54] Kirkman, H. N.; Gaetani, G. F. Catalase: a tetrameric enzyme with four tightlybound molecules of NADPH. Proc. Natl. Acad. Sci. USA 81:4343–4347; 1984.
[55] Chang, T. -S.; Jeong, W.; Woo, H. A.; Lee, S. M.; Park, S.; Rhee, S. G.Characterization of mammalian sulfiredoxin and its reactivation of hyperox-idized peroxiredoxin through reduction of cysteine sulfinic acid in the activesite to cysteine. J. Biol. Chem. 279:50994–51001; 2004.
[56] Woo, H. A.; Jeong, W.; Chang, T. -S.; Park, K. J.; Park, S. J.; Yang, J. S.; Rhee, S. G.Reduction of cysteine sulfinic acid by sulfiredoxin is specific to 2-Cysperoxiredoxins. J. Biol. Chem. 280:3125–3128; 2005.
[57] Watson, W. H.; Pohl, J.; Montfort, W. R.; Stuchlik, O.; Reed, M. S.; Powis, G.;Jones, D. P. Redox potential of human thioredoxin 1 and identification of asecond dithiol/disulfide motif. J. Biol. Chem. 278:33408–33415; 2003.
[58] Gromer, S.; Arscott, L. D.; Williams Jr C. H.; Schirmer, R. H.; Becker, K. Humanplacenta thioredoxin reductase: isolation of the selenoenzyme, steady statekinetics, and inhibition by therapeutic gold compounds. J. Biol. Chem.273:20096–20101; 1998.
[59] Mathematica. Technical computing software. Champaign, IL: WolframResearch; 2012.
[60] Salvador, A. Synergism analysis of metabolic processes. I. Conceptual frame-work. Math. Biosci. 163:105–129; 2000.
[61] Salvador, A. Synergism analysis of metabolic processes. II. Tensor formulationand treatment of stoichiometric constraints. Math. Biosci. 163:131–158; 2000.
[62] Hoops, S.; Sahle, S.; Gauges, R.; Lee, C.; Pahle, J.; Simus, N.; Singhal, M.; Xu, L.;Mendes, P.; Kummer, U. COPASI—a complex pathway simulator. Bioinformatics22:3067–3074; 2006.
[63] Hucka, M.; Finney, A.; Sauro, H. M.; Bolouri, H.; Doyle, J. C.; Kitano, H.; Arkin,A. P.; Bornstein, B. J.; Bray, D.; Cornish-Bowden, A.; Cuellar, A. A.; Dronov, S.;Gilles, E. D.; Ginkel, M.; Gor, V.; Goryanin, I. I.; Hedley, W. J.; Hodgman, T. C.;Hofmeyr, J. H.; Hunter, P. J.; Juty, N. S.; Kasberger, J. L.; Kremling, A.; Kummer,U.; Le Novere, N.; Loew, L. M.; Lucio, D.; Mendes, P.; Minch, E.; Mjolsness, E. D.;Nakayama, Y.; Nelson, M. R.; Nielsen, P. F.; Sakurada, T.; Schaff, J. C.; Shapiro, B.E.; Shimizu, T. S.; Spence, H. D.; Stelling, J.; Takahashi, K.; Tomita, M.; Wagner,J.; Wang, J. The Systems Biology Markup Language (SBML): a medium forrepresentation and exchange of biochemical network models. Bioinformatics19:524–531; 2003.
[64] Moore, R. B.; Mankad, M. V.; Shriver, S. K.; Mankad, V. N.; Plishker, G. A.Reconstitution of Ca2þ-dependent Kþ transport in erythrocyte membranevesicles requires a cytoplasmic protein. J. Biol. Chem. 266:18964–18968; 1991.
[65] Einstein, A. Über die von der molekularkinetischen Theorie der Wärmegeforderte Bewegung von in ruhenden Flüssigkeiten suspendierten Teilchen.Ann. Phys. 322:549–560; 1905.
[66] (a) Smoluchowski, M. V. Zur kinetischen Theorie der Brownschen Moleku-larbewegung und der Suspensionen. Ann. Phys. 326:756–780; 1906;
(b) vanStroe-Biezen, S. A. M.; Everaerts, F. M.; Janssen, L. J. J.; Tacken, R. A.Diffusion coefficients of oxygen, hydrogen peroxide and glucose in ahydrogel. Anal. Chim. Acta 273:553–560; 1993.
[67] Jacob, H. S.; Ingbar, S. H.; Jandl, J. H. Oxidative hemolysis and erythrocytemetabolism in hereditary acatalasia. J. Clin. Invest. 44:1187–1199; 1965.
[68] Cho, C. -S.; Kato, G. J.; Yang, S. H.; Bae, S. W.; Lee, J. S.; Gladwin, M. T.; Rhee, S. G.Hydroxyurea-induced expression of glutathione peroxidase 1 in red blood cellsof individuals with sickle cell anemia. Antioxid. Redox Signaling 13:1–11; 2010.
[69] Moore, R. B.; Plishker, G. A.; Shriver, S. K. Purification and measurement ofcalpromotin, the cytoplasmic protein which activates calcium-dependentpotassium transport. Biochem. Biophys. Res. Commun. 166:146–153; 1990.
[70] Shau, H.; Gupta, R. K.; Golub, S. H. Identification of a natural killer enhancingfactor (NKEF) from human erythroid cells. Cell. Immunol. 147:1–11; 1993.
[71] Ferrer-Sueta, G.; Manta, B.; Botti, H.; Radi, R.; Trujillo, M.; Denicola, A. Factorsaffecting protein thiol reactivity and specificity in peroxide reduction. Chem.Res. Toxicol. 24:434–450; 2011.
[72] Ogasawara, Y.; Ohminato, T.; Nakamura, Y.; Ishii, K. Structural and functionalanalysis of native peroxiredoxin 2 in human red blood cells. Int. J. Biochem. CellBiol. 44:1072–1077; 2012.
[73] Jaeschke, H.; Bautista, A. P.; Spolarics, Z.; Spitzer, J. J. Superoxide generation byneutrophils and Kupffer cells during in vivo reperfusion after hepatic ischemiain rats. J. Leukocyte Biol. 52:377–382; 1992.
[74] Barranco-Medina, S.; Kakorin, S.; Lázaro, J. J.; Dietz, K. -J. Thermodynamics ofthe dimer–decamer transition of reduced human and plant 2-Cys peroxir-edoxin. Biochemistry 47:7196–7204; 2008.
[75] Moon, J. C.; Hah, Y. -S.; Kim, W. Y.; Jung, B. G.; Jang, H. H.; Lee, J. R.; Kim, S. Y.;Lee, Y. M.; Jeon, M. G.; Kim, C. W.; Cho, M. J.; Lee, S. Y. Oxidative stress-dependent structural and functional switching of a human 2-Cys peroxire-doxin isotype II that enhances HeLa cell resistance to H2O2-induced cell death.J. Biol. Chem. 280:28775–28784; 2005.
[76] Choi, M. H.; Lee, I. K.; Kim, G. W.; Kim, B. U.; Han, Y. -H.; Yu, D. -Y.; Park, H. S.;Kim, K. Y.; Lee, J. S.; Choi, C.; Bae, Y. S.; Lee, B. I.; Rhee, S. G.; Kang, S. W.Regulation of PDGF signalling and vascular remodelling by peroxiredoxin II.Nature 435:347–353; 2005.
[77] Pace, P. E.; Peskin, A. V.; Han, M. -H.; Hampton, M. B.; Winterbourn, C. C.Hyperoxidized peroxiredoxin 2 interacts with the protein disulphide isomer-ase ERp46. Biochem. J. 453:475–485; 2013.
[78] Dammeyer, P.; Arnér, E. S. J. Human protein Atlas of redox systems—what canbe learnt? Biochim. Biophys. Acta 1810:111–138; 2011.
R. Benfeitas et al. / Free Radical Biology and Medicine 74 (2014) 35–49 49
1
SUPPLEMENTARY INFORMATION FOR
BENFEITAS ET AL. (2014) “HYDROGEN PEROXIDE
METABOLISM AND SENSING IN HUMAN ERYTHROCYTES: A
VALIDATED KINETIC MODEL AND REAPPRAISAL OF THE ROLE
OF PEROXIREDOXIN II”
Table of Contents
1. Unit conversions ........................................................................................................ 2
2. Endogenous H2O2 production ................................................................................... 2
3. H2O2 permeation ....................................................................................................... 4
4. H2O2 production and concentrations in blood plasma .............................................. 5
5. GPx1 kinetics and concentration ............................................................................... 8
6. Cat concentration and catalytic cycle ...................................................................... 10
7. Prx2 concentration and rate constant for H2O2 reduction ....................................... 13
8. Trx cycle .................................................................................................................. 16
9. TrxR activity ........................................................................................................... 18
10. NADPH concentration and binding equilibria ........................................................ 19
11. NADPH regeneration by the hexose monophosphates shunt.................................. 20
12. Sensitivity analysis .................................................................................................. 22
13. Model validation and refinement ............................................................................ 23
13.1 Evidence that Prx2’s contribution for H2O2 consumption in erythrocytes is
comparable to Cat’s .................................................................................................... 23
13.2 Model validation .............................................................................................. 24
13.3 Analysis of experiments by Cho et al. [37] ..................................................... 28
13.4 Analysis of experiments of Jacob et al. [75] ................................................... 33
14. Additional notes ...................................................................................................... 34
14.1 Energetic cost of inhibiting the peroxidase activity of Prx2 through covalent
modification ................................................................................................................ 34
15. References ............................................................................................................... 35
2
1. Unit conversions
We refer all metabolite and protein concentrations and rates to erythrocyte water
volume, rather than total cell volume as is more usual in the literature. We made this
choice because the former concentrations are more relevant for determining the rates of
intracellular biochemical processes. Conversions assume water volume to cell volume
ratio of 0.717 [7] and an erythrocyte volume of 10-13
dm3 [8]. Accordingly, in
conversions from quantities expressed in terms of hemoglobin mass we consider an
erythrocyte contents of 485 g hemoglobin / dm3 erythrocyte water [7]. Except where
otherwise stated, in converting from quantities expressed in terms of protein mass we
assume that hemoglobin accounts for 90% of erythrocyte protein mass.
2. Endogenous H2O2 production
The autoxidation of oxyhemoglobin to methemoglobin is often cited as the main
endogenous source of H2O2, via O2–
, in the erythrocyte [2, 9, 10]. The mean rate of
O2–
production in vivo from this process can be estimated as follows. The main enzyme
responsible for methemoglobin reduction is Cyt b5 reductase, and in
methemoglobinuria patients carrying a mutation that eliminates this activity 0.5 to 3%
of the hemoglobin is oxidized to methemoglobin each day [11]. Considering [Hb]= 7
mM [5] and 3% oxidation/day, this gives 0.034710-3
/[(24 h)(3600 s/h)]= 9.6 nM
subunits/s, and an equal O2–
production. This rate is of the same order of magnitude as
the 20 nM s-1
rate determined in ref.[12] for hemolyzates of packed cells at the pO2= 90
Torr prevailing in arterial blood. Virtually all this O2–
is dismutated, yielding 1/2 H2O2
per O2–
.
GSH autoxidation may also contribute relevantly to H2O2 production. This process
occurs both enzymatically [13] and non-enzymatically [14]. The non-enzymatic
oxidation is a multi-step process that follows overall second-order kinetics — and
pseudo-first-order kinetics for O2 and for GSH — with an apparent rate constant kspont=
0.10 M-1
s-1
(expressed in terms of GSSG production) determined at pH 9.2, 23 ºC [14].
In order to estimate the implied H2O2 production under physiological conditions one
must take into account that it is the thiolate anion (GS-), not the protonated thiol, that
reacts with O2. As follows from applying the Henderson-Hasselbach equation, the
3
concentration of GS- at the physiological pH (7.2) is just 5.0% of that at pH 9.2,
considering that the thiol has pKa= 8.7 [15]. The apparent rate constant will thus be
proportionally lower at pH 7.2. Therefore, at pO2= 90 Torr and a fully reduced GSH
pool of 3.2 mM ref.[1], considering an O2 solubility of 1.7×10⁻⁶
M Torr-1
[16], this rate
constant translates into a rate of H2O2 production of 0.05×(90 Torr)×(1.7×10⁻⁶
M
Torr-1
)×(0.10 M-1
s-1
)×(3.2×10⁻³
M)= 2.5 nM s-1
at 23 ºC.
The enzymatic GSH autoxidation is catalyzed by Cu-Zn superoxide dismutase (SOD,
EC 1.15.1.1) [13]. This thiol oxidase activity of SOD is still poorly characterized.
However, Winterbourn et al. [13] have shown that 1.2 M of bovine SOD incubated in
air at pH 7.4 and 37 ºC, catalyzes the oxidation of 1 mM GSH at a rate of 8.3 nM s-1
.
Given the higher concentrations of GSH and SOD (2 M [17]) and slightly lower pH in
human erythrocytes, the contribution of this process towards endogenous H2O2
production might be relevant.
The following experiment [1] further highlights the potential relevance of GSH
autoxidation in vivo. In erythrocytes incubated at 37 ºC under a humidified stream of
O2:CO2 19:1 (pO2= 722 Torr) in absence of glucose the concentration of GSH decayed
over 6 h with first-order kinetics. The rate constant was kox= 7.410-5
s-1
(expressed in
terms of GSSG production) *
. One can estimate the pseudo-first-order rate constant and
the rate of H2O2 production by this process under physiological conditions with a fully
reduced 3.2 mM GSH pool by assuming that the kinetics of the reaction was first-order
with respect to O2 [14] and correcting for pO2= 90 Torr: k= (90 Torr)×(7.410-5
s-1
)/(722 Torr)= 9.2×10⁻⁶
s-1
, v= k×(3.2×10⁻³
M) = 30 nM s-1
.
Altogether, the reduction of the H2O2 generated from hemoglobin autoxidation plus the
reduction of both the H2O2 and the oxidized glutathione generated by GSH autoxidation
would require a NADPH expenditure of 0.5×9.6×10-9
M s-1
+ 2×30×10-9
M s-1
= 65 nM
s-1
. This value is in the range of the NADPH production — 56±13 nM s-1
— inferred
* Should the observed GSH decay be due to GPx-catalyzed GSH oxidation it would have exhibited zero-
order kinetics. This because at plausible intracellular H2O2 concentrations GPx1 shows a very low
App
M,GPx1,GSHK and should thus remain effectively saturated with GSH down to very low GSH
concentrations.
Salvador
Sticky Note
Note that as discussed in the main text Cat should consume >50% of the H2O2. So, less than 52 nM NADPH/s would be necessary.
Salvador
Sticky Note
The exponential decay of GSH might also have been due to glutathionylation of oxidized protein thiols. However, this process would have required the previous oxidation of those thiols anyway, and therefore also implies a similar endogenous H2O2 production.
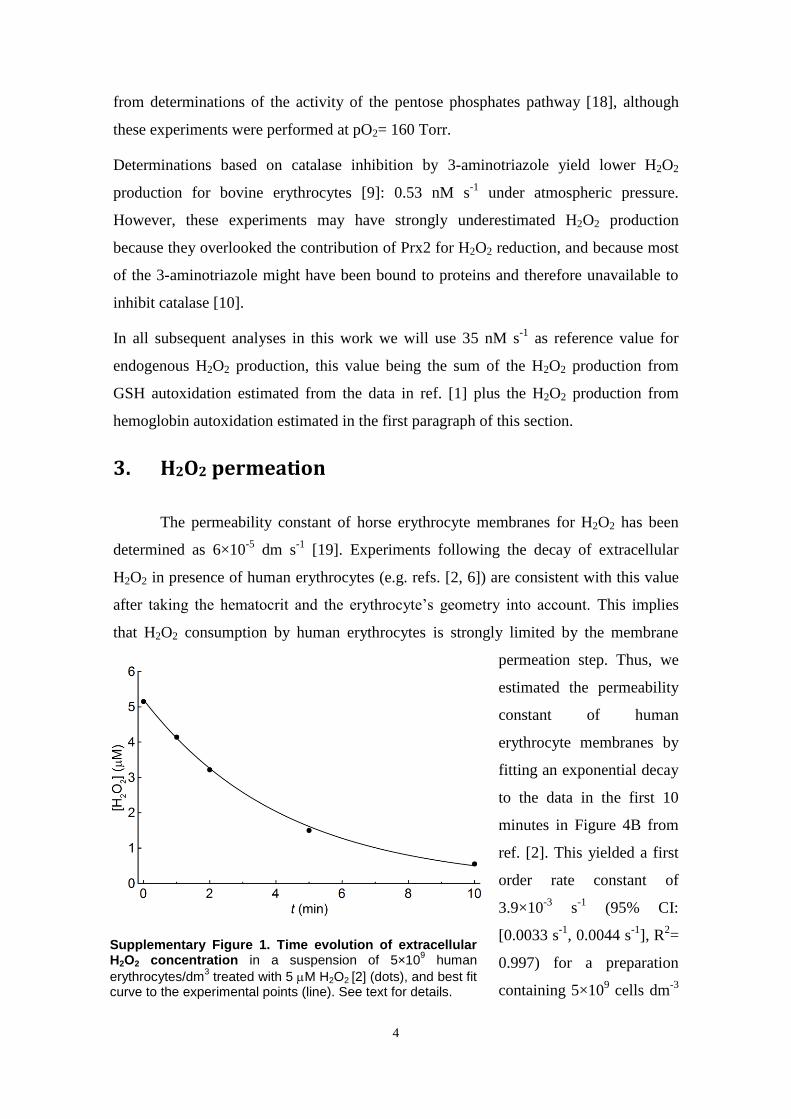
4
from determinations of the activity of the pentose phosphates pathway [18], although
these experiments were performed at pO2= 160 Torr.
Determinations based on catalase inhibition by 3-aminotriazole yield lower H2O2
production for bovine erythrocytes [9]: 0.53 nM s-1
under atmospheric pressure.
However, these experiments may have strongly underestimated H2O2 production
because they overlooked the contribution of Prx2 for H2O2 reduction, and because most
of the 3-aminotriazole might have been bound to proteins and therefore unavailable to
inhibit catalase [10].
In all subsequent analyses in this work we will use 35 nM s-1
as reference value for
endogenous H2O2 production, this value being the sum of the H2O2 production from
GSH autoxidation estimated from the data in ref. [1] plus the H2O2 production from
hemoglobin autoxidation estimated in the first paragraph of this section.
3. H2O2 permeation
The permeability constant of horse erythrocyte membranes for H2O2 has been
determined as 6×10⁻⁵
dm s-1
[19]. Experiments following the decay of extracellular
H2O2 in presence of human erythrocytes (e.g. refs. [2, 6]) are consistent with this value
after taking the hematocrit and the erythrocyte’s geometry into account. This implies
that H2O2 consumption by human erythrocytes is strongly limited by the membrane
permeation step. Thus, we
estimated the permeability
constant of human
erythrocyte membranes by
fitting an exponential decay
to the data in the first 10
minutes in Figure 4B from
ref. [2]. This yielded a first
order rate constant of
3.9×10⁻³
s-1
(95% CI:
[0.0033 s-1
, 0.0044 s-1
], R2=
0.997) for a preparation
containing 5×10⁹ cells dm
-3
Supplementary Figure 1. Time evolution of extracellular H2O2 concentration in a suspension of 5×10
9 human
erythrocytes/dm3 treated with 5 M H2O2 [2] (dots), and best fit
curve to the experimental points (line). See text for details.
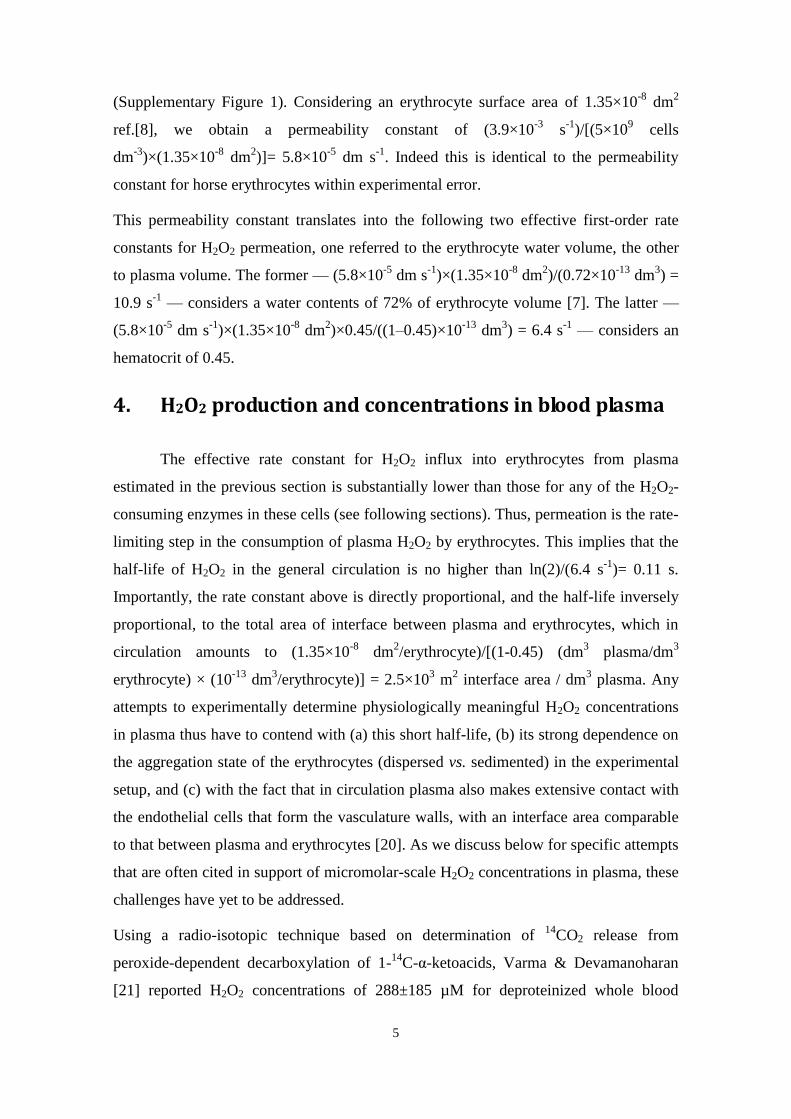
5
(Supplementary Figure 1). Considering an erythrocyte surface area of 1.35×10⁻⁸
dm2
ref.[8], we obtain a permeability constant of (3.9×10⁻³
s-1
)/[(5×109 cells
dm-3
)×(1.35×10⁻⁸
dm2)]= 5.8×10
-5 dm s
-1. Indeed this is identical to the permeability
constant for horse erythrocytes within experimental error.
This permeability constant translates into the following two effective first-order rate
constants for H2O2 permeation, one referred to the erythrocyte water volume, the other
to plasma volume. The former — (5.8×10⁻⁵
dm s-1
)×(1.35×10⁻⁸
dm2)/(0.72×10
-13 dm
3) =
10.9 s-1
— considers a water contents of 72% of erythrocyte volume [7]. The latter —
(5.8×10⁻⁵
dm s-1
)×(1.35×10⁻⁸
dm2)×0.45/((1–0.45)×10
-13 dm
3) = 6.4 s
-1 — considers an
hematocrit of 0.45.
4. H2O2 production and concentrations in blood plasma
The effective rate constant for H2O2 influx into erythrocytes from plasma
estimated in the previous section is substantially lower than those for any of the H2O2-
consuming enzymes in these cells (see following sections). Thus, permeation is the rate-
limiting step in the consumption of plasma H2O2 by erythrocytes. This implies that the
half-life of H2O2 in the general circulation is no higher than ln(2)/(6.4 s-1
)= 0.11 s.
Importantly, the rate constant above is directly proportional, and the half-life inversely
proportional, to the total area of interface between plasma and erythrocytes, which in
circulation amounts to (1.35×10⁻⁸
dm2/erythrocyte)/[(1-0.45) (dm
3 plasma/dm
3
erythrocyte) × (10-13
dm3/erythrocyte)] = 2.5×10
3 m
2 interface area / dm
3 plasma. Any
attempts to experimentally determine physiologically meaningful H2O2 concentrations
in plasma thus have to contend with (a) this short half-life, (b) its strong dependence on
the aggregation state of the erythrocytes (dispersed vs. sedimented) in the experimental
setup, and (c) with the fact that in circulation plasma also makes extensive contact with
the endothelial cells that form the vasculature walls, with an interface area comparable
to that between plasma and erythrocytes [20]. As we discuss below for specific attempts
that are often cited in support of micromolar-scale H2O2 concentrations in plasma, these
challenges have yet to be addressed.
Using a radio-isotopic technique based on determination of 14
CO2 release from
peroxide-dependent decarboxylation of 1-14
C-α-ketoacids, Varma & Devamanoharan
[21] reported H2O2 concentrations of 288±185 µM for deproteinized whole blood
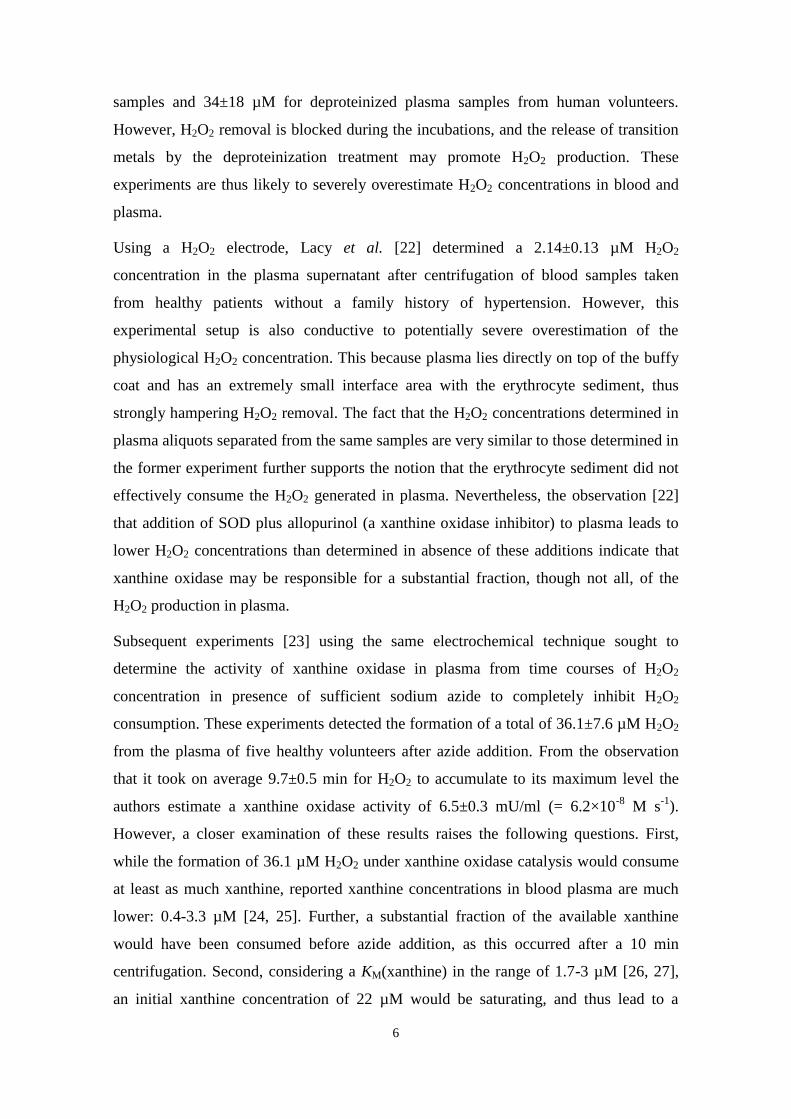
6
samples and 34±18 µM for deproteinized plasma samples from human volunteers.
However, H2O2 removal is blocked during the incubations, and the release of transition
metals by the deproteinization treatment may promote H2O2 production. These
experiments are thus likely to severely overestimate H2O2 concentrations in blood and
plasma.
Using a H2O2 electrode, Lacy et al. [22] determined a 2.14±0.13 µM H2O2
concentration in the plasma supernatant after centrifugation of blood samples taken
from healthy patients without a family history of hypertension. However, this
experimental setup is also conductive to potentially severe overestimation of the
physiological H2O2 concentration. This because plasma lies directly on top of the buffy
coat and has an extremely small interface area with the erythrocyte sediment, thus
strongly hampering H2O2 removal. The fact that the H2O2 concentrations determined in
plasma aliquots separated from the same samples are very similar to those determined in
the former experiment further supports the notion that the erythrocyte sediment did not
effectively consume the H2O2 generated in plasma. Nevertheless, the observation [22]
that addition of SOD plus allopurinol (a xanthine oxidase inhibitor) to plasma leads to
lower H2O2 concentrations than determined in absence of these additions indicate that
xanthine oxidase may be responsible for a substantial fraction, though not all, of the
H2O2 production in plasma.
Subsequent experiments [23] using the same electrochemical technique sought to
determine the activity of xanthine oxidase in plasma from time courses of H2O2
concentration in presence of sufficient sodium azide to completely inhibit H2O2
consumption. These experiments detected the formation of a total of 36.1±7.6 µM H2O2
from the plasma of five healthy volunteers after azide addition. From the observation
that it took on average 9.7±0.5 min for H2O2 to accumulate to its maximum level the
authors estimate a xanthine oxidase activity of 6.5±0.3 mU/ml (= 6.2×10⁻⁸
M s-1
).
However, a closer examination of these results raises the following questions. First,
while the formation of 36.1 µM H2O2 under xanthine oxidase catalysis would consume
at least as much xanthine, reported xanthine concentrations in blood plasma are much
lower: 0.4-3.3 µM [24, 25]. Further, a substantial fraction of the available xanthine
would have been consumed before azide addition, as this occurred after a 10 min
centrifugation. Second, considering a KM(xanthine) in the range of 1.7-3 µM [26, 27],
an initial xanthine concentration of 22 µM would be saturating, and thus lead to a
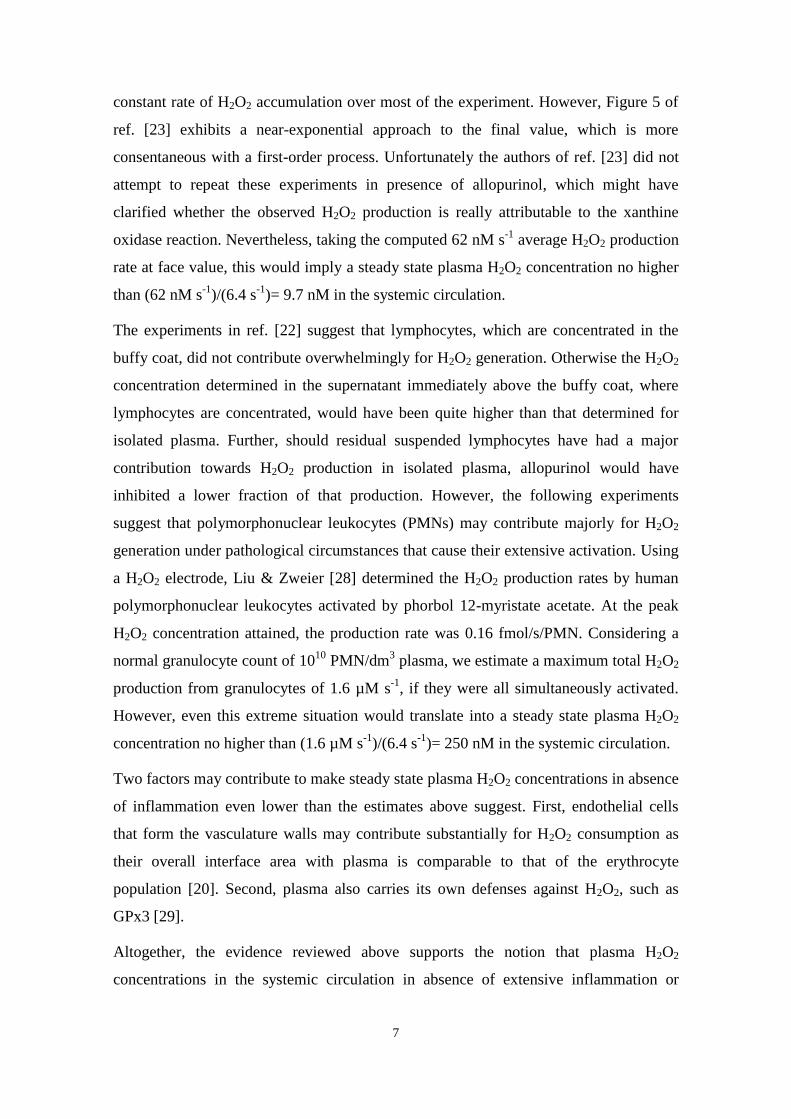
7
constant rate of H2O2 accumulation over most of the experiment. However, Figure 5 of
ref. [23] exhibits a near-exponential approach to the final value, which is more
consentaneous with a first-order process. Unfortunately the authors of ref. [23] did not
attempt to repeat these experiments in presence of allopurinol, which might have
clarified whether the observed H2O2 production is really attributable to the xanthine
oxidase reaction. Nevertheless, taking the computed 62 nM s-1
average H2O2 production
rate at face value, this would imply a steady state plasma H2O2 concentration no higher
than (62 nM s-1
)/(6.4 s-1
)= 9.7 nM in the systemic circulation.
The experiments in ref. [22] suggest that lymphocytes, which are concentrated in the
buffy coat, did not contribute overwhelmingly for H2O2 generation. Otherwise the H2O2
concentration determined in the supernatant immediately above the buffy coat, where
lymphocytes are concentrated, would have been quite higher than that determined for
isolated plasma. Further, should residual suspended lymphocytes have had a major
contribution towards H2O2 production in isolated plasma, allopurinol would have
inhibited a lower fraction of that production. However, the following experiments
suggest that polymorphonuclear leukocytes (PMNs) may contribute majorly for H2O2
generation under pathological circumstances that cause their extensive activation. Using
a H2O2 electrode, Liu & Zweier [28] determined the H2O2 production rates by human
polymorphonuclear leukocytes activated by phorbol 12-myristate acetate. At the peak
H2O2 concentration attained, the production rate was 0.16 fmol/s/PMN. Considering a
normal granulocyte count of 1010
PMN/dm3 plasma, we estimate a maximum total H2O2
production from granulocytes of 1.6 µM s-1
, if they were all simultaneously activated.
However, even this extreme situation would translate into a steady state plasma H2O2
concentration no higher than (1.6 µM s-1
)/(6.4 s-1
)= 250 nM in the systemic circulation.
Two factors may contribute to make steady state plasma H2O2 concentrations in absence
of inflammation even lower than the estimates above suggest. First, endothelial cells
that form the vasculature walls may contribute substantially for H2O2 consumption as
their overall interface area with plasma is comparable to that of the erythrocyte
population [20]. Second, plasma also carries its own defenses against H2O2, such as
GPx3 [29].
Altogether, the evidence reviewed above supports the notion that plasma H2O2
concentrations in the systemic circulation in absence of extensive inflammation or
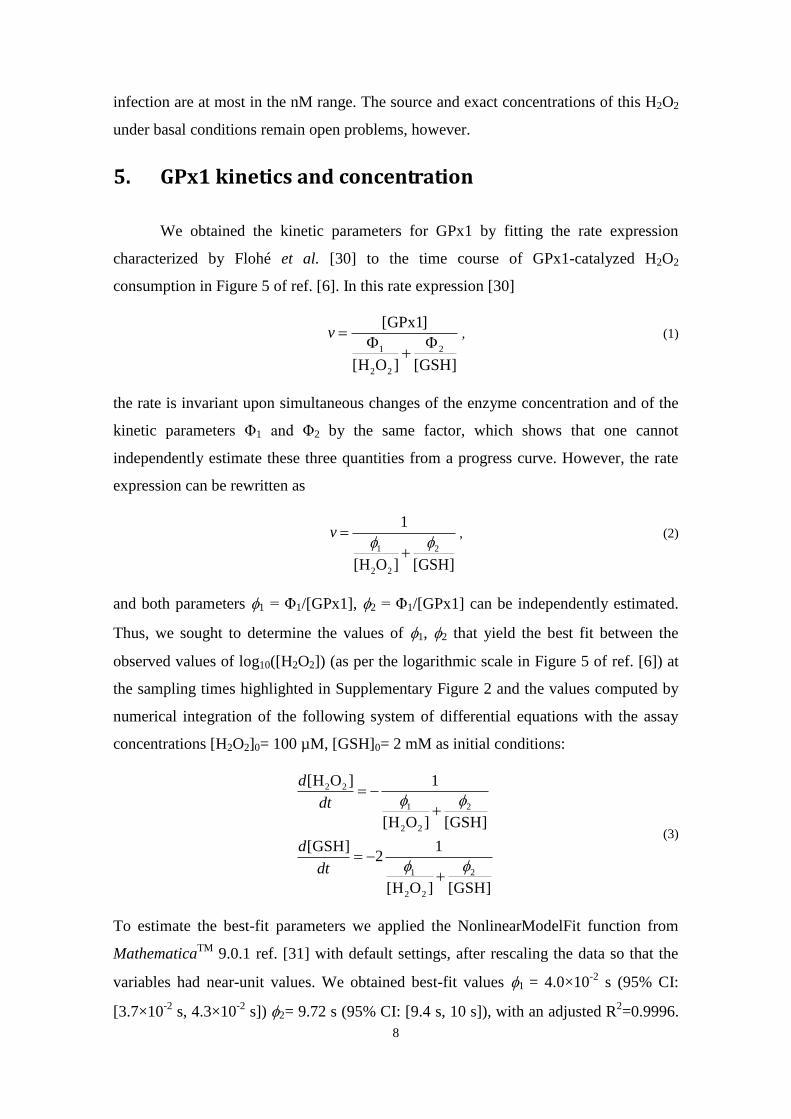
8
infection are at most in the nM range. The source and exact concentrations of this H2O2
under basal conditions remain open problems, however.
5. GPx1 kinetics and concentration
We obtained the kinetic parameters for GPx1 by fitting the rate expression
characterized by Flohé et al. [30] to the time course of GPx1-catalyzed H2O2
consumption in Figure 5 of ref. [6]. In this rate expression [30]
1 2
2 2
[GPx1]
[H O ] [GSH]
v
, (1)
the rate is invariant upon simultaneous changes of the enzyme concentration and of the
kinetic parameters Φ1 and Φ2 by the same factor, which shows that one cannot
independently estimate these three quantities from a progress curve. However, the rate
expression can be rewritten as
1 2
2 2
1
[H O ] [GSH]
v
, (2)
and both parameters 1 = Φ1/[GPx1], 2 = Φ1/[GPx1] can be independently estimated.
Thus, we sought to determine the values of 1, 2 that yield the best fit between the
observed values of log10([H2O2]) (as per the logarithmic scale in Figure 5 of ref. [6]) at
the sampling times highlighted in Supplementary Figure 2 and the values computed by
numerical integration of the following system of differential equations with the assay
concentrations [H2O2]0= 100 µM, [GSH]0= 2 mM as initial conditions:
2 2
1 2
2 2
1 2
2 2
[H O ] 1
[H O ] [GSH]
[GSH] 12
[H O ] [GSH]
d
dt
d
dt
(3)
To estimate the best-fit parameters we applied the NonlinearModelFit function from
MathematicaTM
9.0.1 ref. [31] with default settings, after rescaling the data so that the
variables had near-unit values. We obtained best-fit values 1 = 4.0×10⁻²
s (95% CI:
[3.7×10⁻²
s, 4.3×10⁻²
s]) 2= 9.72 s (95% CI: [9.4 s, 10 s]), with an adjusted R2=0.9996.
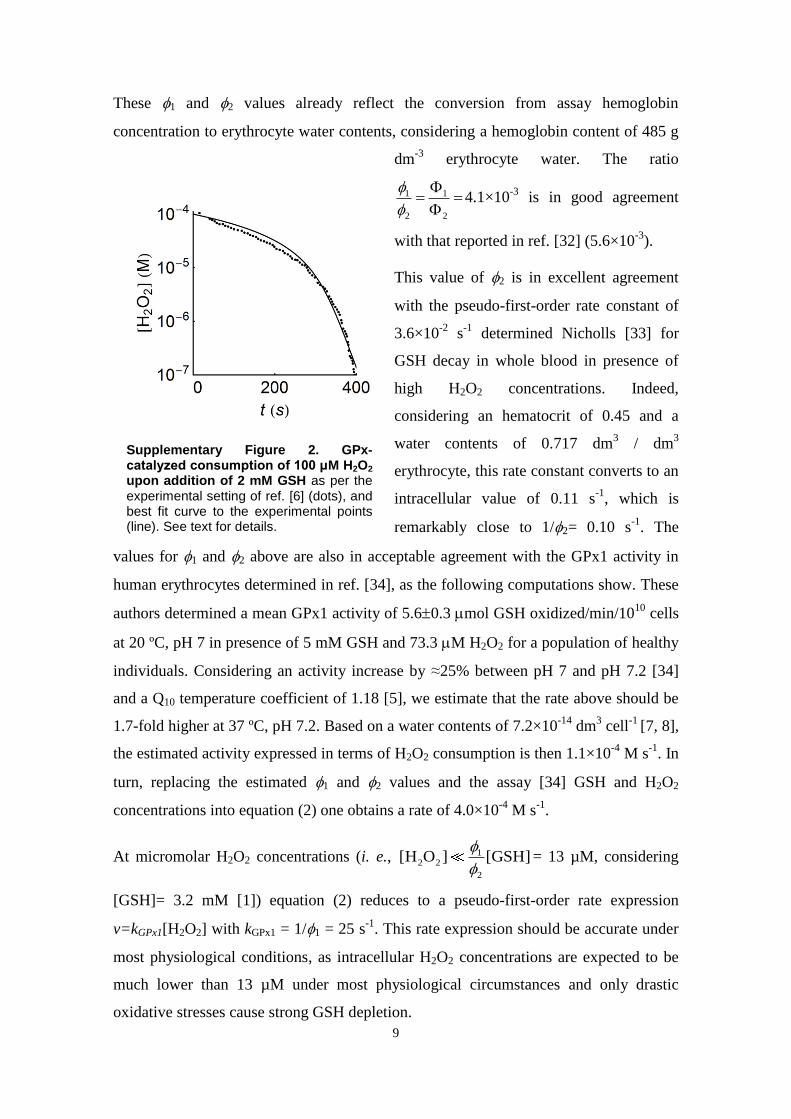
9
These 1 and 2 values already reflect the conversion from assay hemoglobin
concentration to erythrocyte water contents, considering a hemoglobin content of 485 g
dm-3
erythrocyte water. The ratio
1 1
2 2
4.1×10⁻³
is in good agreement
with that reported in ref. [32] (5.6×10⁻³
).
This value of 2 is in excellent agreement
with the pseudo-first-order rate constant of
3.6×10⁻²
s-1
determined Nicholls [33] for
GSH decay in whole blood in presence of
high H2O2 concentrations. Indeed,
considering an hematocrit of 0.45 and a
water contents of 0.717 dm3 / dm
3
erythrocyte, this rate constant converts to an
intracellular value of 0.11 s-1
, which is
remarkably close to 1/2= 0.10 s-1
. The
values for 1 and 2 above are also in acceptable agreement with the GPx1 activity in
human erythrocytes determined in ref. [34], as the following computations show. These
authors determined a mean GPx1 activity of 5.60.3 mol GSH oxidized/min/1010
cells
at 20 ºC, pH 7 in presence of 5 mM GSH and 73.3 M H2O2 for a population of healthy
individuals. Considering an activity increase by ≈25% between pH 7 and pH 7.2 [34]
and a Q10 temperature coefficient of 1.18 [5], we estimate that the rate above should be
1.7-fold higher at 37 ºC, pH 7.2. Based on a water contents of 7.2×10⁻¹⁴
dm3 cell
-1 [7, 8],
the estimated activity expressed in terms of H2O2 consumption is then 1.1×10⁻⁴
M s-1
. In
turn, replacing the estimated 1 and 2 values and the assay [34] GSH and H2O2
concentrations into equation (2) one obtains a rate of 4.0×10⁻⁴
M s-1
.
At micromolar H2O2 concentrations (i. e., 12 2
2
[H O ] [GSH]
= 13 µM, considering
[GSH]= 3.2 mM [1]) equation (2) reduces to a pseudo-first-order rate expression
v=kGPx1[H2O2] with kGPx1 = 1/1 = 25 s-1
. This rate expression should be accurate under
most physiological conditions, as intracellular H2O2 concentrations are expected to be
much lower than 13 µM under most physiological circumstances and only drastic
oxidative stresses cause strong GSH depletion.
Supplementary Figure 2. GPx-catalyzed consumption of 100 μM H2O2 upon addition of 2 mM GSH as per the experimental setting of ref. [6] (dots), and best fit curve to the experimental points (line). See text for details.
10
Although there is relatively good agreement between GPx1 activity determinations in
the literature [6, 32, 34, 35], these activities imply concentrations of active GPx1
monomers that are much lower than the total concentration of monomers determined
through immunochemical methods [36]. Thus, from the data in refs. [6, 32] one
estimates concentrations of 0.61 µM and 0.45 µM by dividing the values of Φ1 and Φ2
determined by ref. [32] by the values of 1 and 2, respectively. From the above-
mentioned data in ref. [34] we estimate a 0.51 µM by applying the rate expression (1)
with the kinetic parameters determined by ref. [32]. From the reported activity in the
outdated-blood hemolyzates used by Awasthi et al. [35] to purify GPx1 and again
applying the values of Φ1 and Φ2 determined by ref. [32] one can estimate a 0.11 µM
GPx1 monomer concentration. Should one assume that all the final purified protein was
100% pure GPx1 and that this enzyme did not lose activity during purification, the
estimated cellular GPx1 concentration would be 1.7 µM. However, using an
immunochemical approach Cho et al. [36] determined an erythrocyte GPx1 contents of
6.0±2.0 µg/mg lysate protein, from which, considering an hemoglobin contents of 485 g
dm-3
erythrocyte water and a monomer molecular weight of 23 kDa [35] we estimate a
concentration of 1.3×10⁻⁴
M GPx1 monomers. The recent discovery [37] that peroxides
gradually inactivate GPx1 by converting the selenocysteine residue at the active site to
dehydroalanine can only partially explain this ≈270-fold discrepancy between activity-
based and immunochemistry-based determinations. This because the GPx1 activity
decreases by just ≈50% over the erythrocyte life span [37].
This inactivation process did not affect the kinetic determinations in ref. [6] because
these used an initial 100 µM H2O2 which was rapidly consumed over a period of just 6
min, whereas in the experiments in ref. [37] a 60 min exposure of GPx1 to a constant
200 µM H2O2 caused a 15% activity decrease.
6. Cat concentration and catalytic cycle
Experimental observations [6] indicate that at H2O2 concentrations > 0.1 M the
kinetics of catalase are well described by a pseudo-first-order rate expression over the
whole biological range of H2O2 concentrations. We estimated the rate constant for this
rate expression as kCat= 218 s-1
from the data obtained for the lowest H2O2 concentration
assayed in ref. [6] assuming an erythrocyte water contents of 2.06 dm3/g hemoglobin
[7].
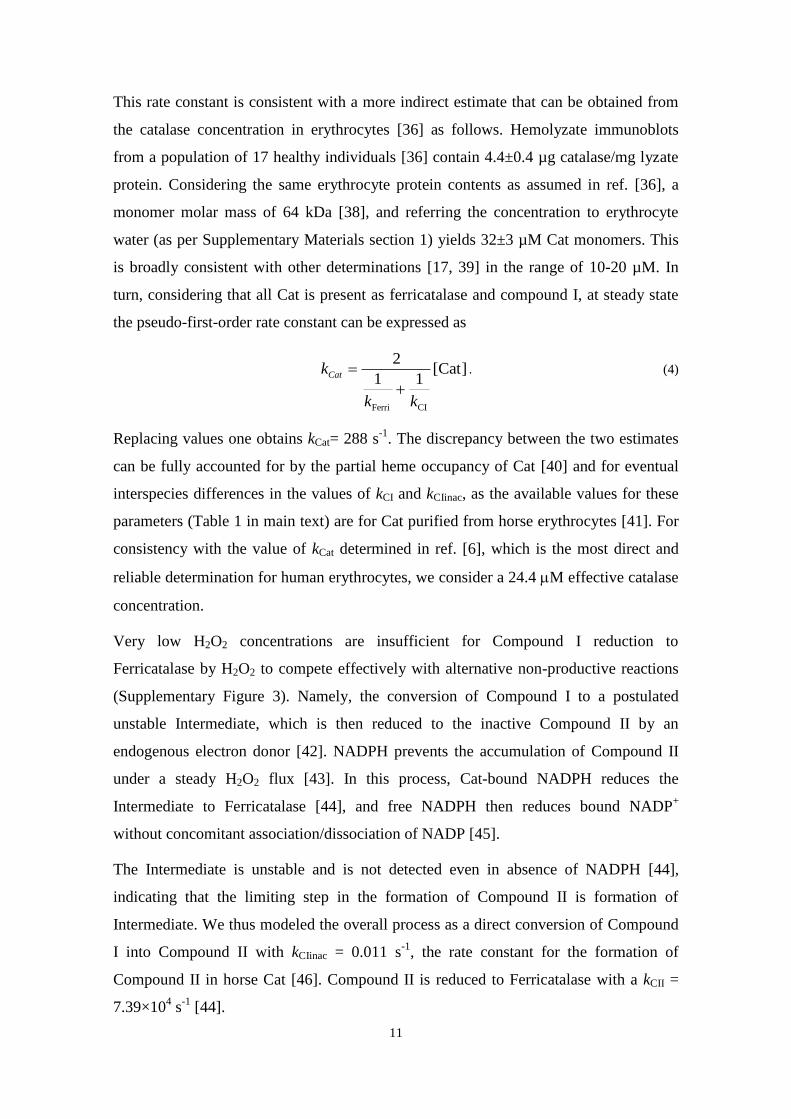
11
This rate constant is consistent with a more indirect estimate that can be obtained from
the catalase concentration in erythrocytes [36] as follows. Hemolyzate immunoblots
from a population of 17 healthy individuals [36] contain 4.4±0.4 µg catalase/mg lyzate
protein. Considering the same erythrocyte protein contents as assumed in ref. [36], a
monomer molar mass of 64 kDa [38], and referring the concentration to erythrocyte
water (as per Supplementary Materials section 1) yields 32±3 µM Cat monomers. This
is broadly consistent with other determinations [17, 39] in the range of 10-20 µM. In
turn, considering that all Cat is present as ferricatalase and compound I, at steady state
the pseudo-first-order rate constant can be expressed as
Ferri CI
2[Cat]
1 1Catk
k k
. (4)
Replacing values one obtains kCat= 288 s-1
. The discrepancy between the two estimates
can be fully accounted for by the partial heme occupancy of Cat [40] and for eventual
interspecies differences in the values of kCI and kCIinac, as the available values for these
parameters (Table 1 in main text) are for Cat purified from horse erythrocytes [41]. For
consistency with the value of kCat determined in ref. [6], which is the most direct and
reliable determination for human erythrocytes, we consider a 24.4 M effective catalase
concentration.
Very low H2O2 concentrations are insufficient for Compound I reduction to
Ferricatalase by H2O2 to compete effectively with alternative non-productive reactions
(Supplementary Figure 3). Namely, the conversion of Compound I to a postulated
unstable Intermediate, which is then reduced to the inactive Compound II by an
endogenous electron donor [42]. NADPH prevents the accumulation of Compound II
under a steady H2O2 flux [43]. In this process, Cat-bound NADPH reduces the
Intermediate to Ferricatalase [44], and free NADPH then reduces bound NADP+
without concomitant association/dissociation of NADP [45].
The Intermediate is unstable and is not detected even in absence of NADPH [44],
indicating that the limiting step in the formation of Compound II is formation of
Intermediate. We thus modeled the overall process as a direct conversion of Compound
I into Compound II with kCIinac = 0.011 s-1
, the rate constant for the formation of
Compound II in horse Cat [46]. Compound II is reduced to Ferricatalase with a kCII =
7.39×10⁴ s
-1 [44].
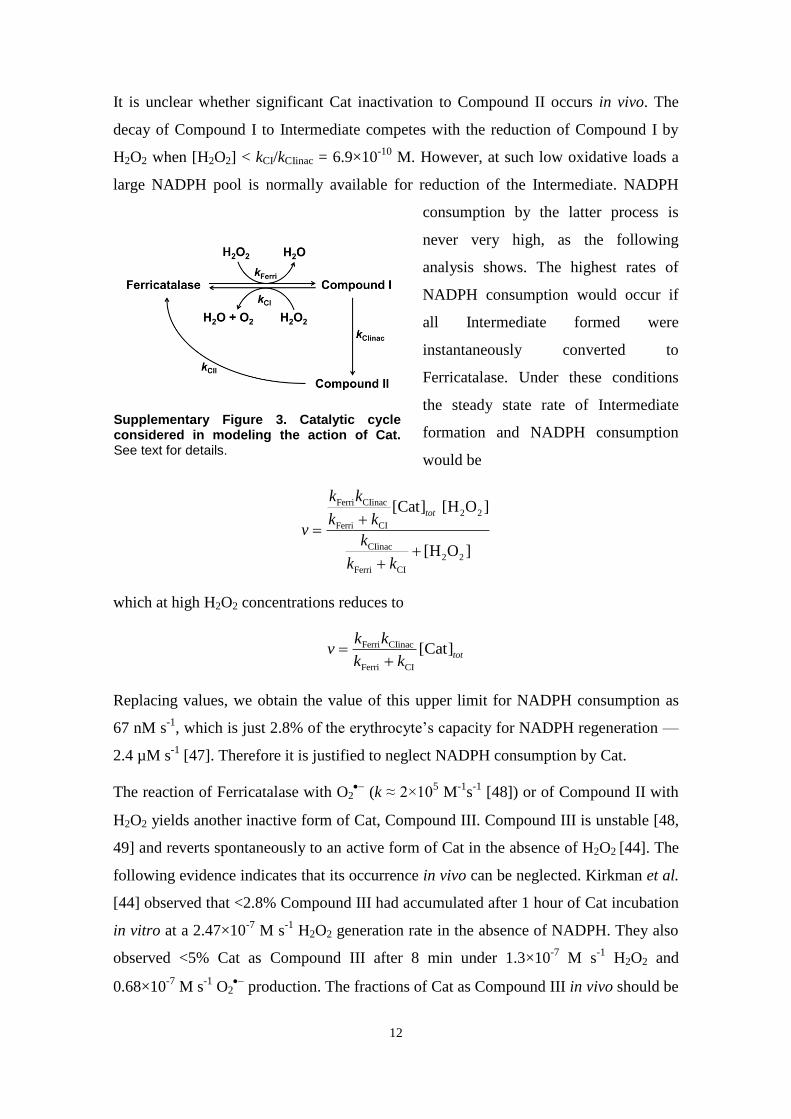
12
It is unclear whether significant Cat inactivation to Compound II occurs in vivo. The
decay of Compound I to Intermediate competes with the reduction of Compound I by
H2O2 when [H2O2] < kCI/kCIinac = 6.9×10⁻¹⁰
M. However, at such low oxidative loads a
large NADPH pool is normally available for reduction of the Intermediate. NADPH
consumption by the latter process is
never very high, as the following
analysis shows. The highest rates of
NADPH consumption would occur if
all Intermediate formed were
instantaneously converted to
Ferricatalase. Under these conditions
the steady state rate of Intermediate
formation and NADPH consumption
would be
Ferri CIinac2 2
Ferri CI
CIinac2 2
Ferri CI
[Cat] [H O ]
[H O ]
tot
k k
k kv
k
k k
which at high H2O2 concentrations reduces to
Ferri CIinac
Ferri CI
[Cat]tot
k kv
k k
Replacing values, we obtain the value of this upper limit for NADPH consumption as
67 nM s-1
, which is just 2.8% of the erythrocyte’s capacity for NADPH regeneration —
2.4 µM s-1
[47]. Therefore it is justified to neglect NADPH consumption by Cat.
The reaction of Ferricatalase with O2
(k ≈ 2×10⁵ M
-1s
-1 [48]) or of Compound II with
H2O2 yields another inactive form of Cat, Compound III. Compound III is unstable [48,
49] and reverts spontaneously to an active form of Cat in the absence of H2O2 [44]. The
following evidence indicates that its occurrence in vivo can be neglected. Kirkman et al.
[44] observed that <2.8% Compound III had accumulated after 1 hour of Cat incubation
in vitro at a 2.47×10⁻⁷
M s-1
H2O2 generation rate in the absence of NADPH. They also
observed <5% Cat as Compound III after 8 min under 1.3×10⁻⁷
M s-1
H2O2 and
0.68×10⁻⁷
M s-1
O2
production. The fractions of Cat as Compound III in vivo should be
Supplementary Figure 3. Catalytic cycle considered in modeling the action of Cat. See text for details.
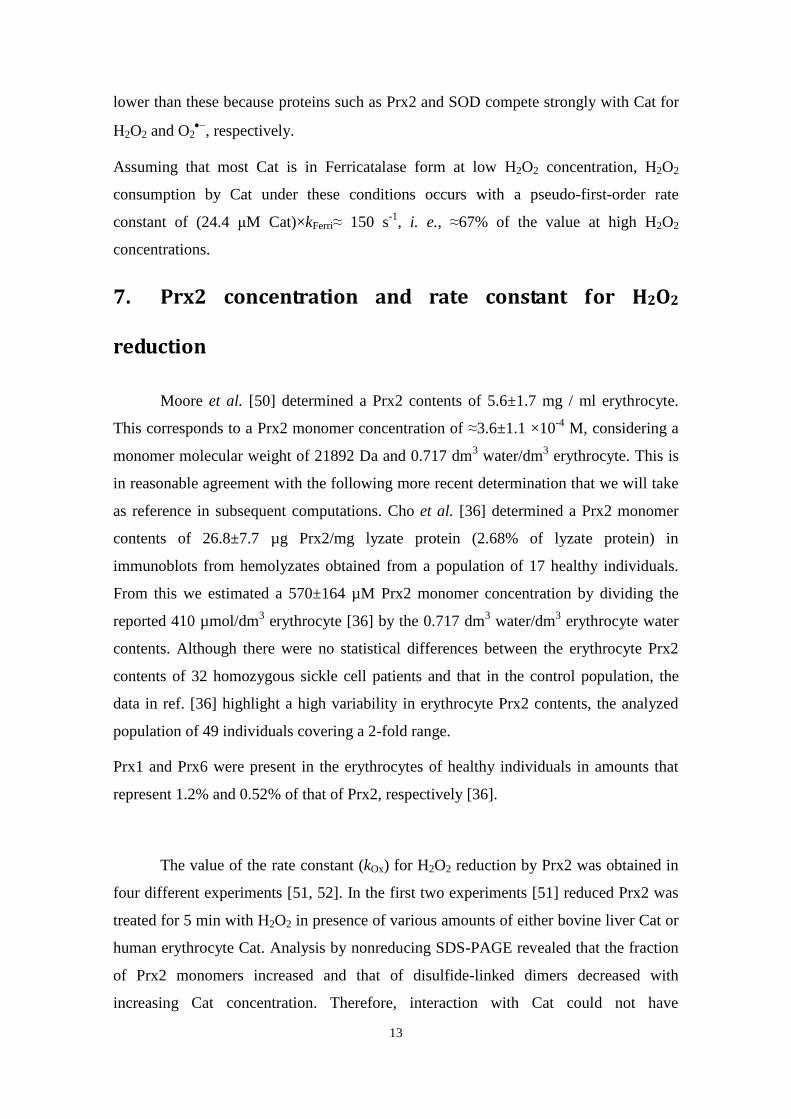
13
lower than these because proteins such as Prx2 and SOD compete strongly with Cat for
H2O2 and O2
, respectively.
Assuming that most Cat is in Ferricatalase form at low H2O2 concentration, H2O2
consumption by Cat under these conditions occurs with a pseudo-first-order rate
constant of (24.4 μM Cat)×kFerri≈ 150 s-1
, i. e., ≈67% of the value at high H2O2
concentrations.
7. Prx2 concentration and rate constant for H2O2
reduction
Moore et al. [50] determined a Prx2 contents of 5.6±1.7 mg / ml erythrocyte.
This corresponds to a Prx2 monomer concentration of ≈3.6±1.1 ×10⁻⁴
M, considering a
monomer molecular weight of 21892 Da and 0.717 dm3 water/dm
3 erythrocyte. This is
in reasonable agreement with the following more recent determination that we will take
as reference in subsequent computations. Cho et al. [36] determined a Prx2 monomer
contents of 26.8±7.7 µg Prx2/mg lyzate protein (2.68% of lyzate protein) in
immunoblots from hemolyzates obtained from a population of 17 healthy individuals.
From this we estimated a 570±164 µM Prx2 monomer concentration by dividing the
reported 410 µmol/dm3 erythrocyte [36] by the 0.717 dm
3 water/dm
3 erythrocyte water
contents. Although there were no statistical differences between the erythrocyte Prx2
contents of 32 homozygous sickle cell patients and that in the control population, the
data in ref. [36] highlight a high variability in erythrocyte Prx2 contents, the analyzed
population of 49 individuals covering a 2-fold range.
Prx1 and Prx6 were present in the erythrocytes of healthy individuals in amounts that
represent 1.2% and 0.52% of that of Prx2, respectively [36].
The value of the rate constant (kOx) for H2O2 reduction by Prx2 was obtained in
four different experiments [51, 52]. In the first two experiments [51] reduced Prx2 was
treated for 5 min with H2O2 in presence of various amounts of either bovine liver Cat or
human erythrocyte Cat. Analysis by nonreducing SDS-PAGE revealed that the fraction
of Prx2 monomers increased and that of disulfide-linked dimers decreased with
increasing Cat concentration. Therefore, interaction with Cat could not have
14
substantially increased Prx2’s reactivity with H2O2. Further, the amounts of each Cat
necessary to achieve 50% protection against Prx2 oxidation reflect the relationship
between the rate constants of these Cat, and both point to a kOx 6×10⁶ M
-1s
-1.
The other two experiments [51, 52], were competition assays with horseradish
peroxidase (HRP), based on the procedure of Ogusucu et al. [53]. Peskin et al. [51] used
10 M HRP and 7 – 28 M Prx2 monomers and plotted the values of [HRP]1
HRP
Fk
F
vs. [Prx2]. (Here, F and kHRP stand for the fractional inhibition of HRP conversion to
Compound I, and for the rate constant for this reaction of HRP with H2O2.) The results
are well fit by a straight line, and thus do not show evidence of potential artifacts caused
by an eventual binding of Prx2 to HRP. This fit yields the value kOx= 1.3×10⁷ M
-1s
-1 for
pH 7.4, 20 ºC.
In turn, Manta et al. [52] used 5 M HRP and 0.4 – 1.7 M Prx2 monomers and
determined an estimate of kOx for each Prx2 concentration used. These estimates were
all in the range 0.5×10⁸ – 1.2×10
8 M
-1s
-1 (mean 1.0×10
8 M
-1s
-1 for pH 7.4, 25ºC),
without a directional trend that could indicate eventual artifacts.
The 5 ºC temperature difference can only partially account for the discrepancy between
the rate constants determined in refs. [51, 52], as the implied Q10= 52 temperature
coefficient is unrealistically high. Considering a more plausible Q10= 2. to extrapolate to
37 ºC the value of kOx obtained in ref. [52] at 25 ºC one would obtain a kOx= 2.×108
M-1
s-1
. Given the uncertainty in the experimental determinations, this value is not
significantly different from that at 25 ºC. Adopting the value obtained in ref. [52] at 25
ºC is a more conservative assumption considering the main point being made in the
present work.
Given the high value of the rate constant, one may wonder whether the reaction might
become diffusion limited in the cellular environment. The following estimate strongly
argues against that possibility. The diffusion limit (kd) for a bimolecular reaction is
given by the expression *4d Ak R D N , where R* is the distance at which the
molecules must come from each other in order to react, D is the sum of the diffusion
coefficients of the molecules, and NA is Avogadro’s number [54]. By approximating R*
by the lower limit for the hydrodynamic radius of H2O2 (0.21 nm) and D by the
15
diffusion constant for H2O2 in a
hydrogel, 3.7×10⁻⁸
dm2 s
-1 [55], we
estimate a lower limit 5.9×10⁸
M-1
s-1
for kd in the cellular
environment.
The rate constant for H2O2
reduction by Prx6 is 3.3×10⁶
M-1
s-1
[56], and the pseudo-first-
order rate constant is thus
(5.2×10⁻³
)×(5.7×10⁻⁴
M)×(3.3×10⁶
M-1
s-1
)= 9.8 s-1
. This is much lower
than the pseudo-first-order rate
constant for catalase, and lower
than that for GPx1. Therefore, we
neglected the contribution of this
protein for H2O2 elimination.
We are unaware of any
determinations of the rate constant
for H2O2 reduction by Prx1, and for this reason the model neglects this process. Shall
this rate constant be similar to that for Prx2 [52], the pseudo-first-order rate constant
will be (1.2×10⁻²
) ×(5.7×10⁻⁴
M)×(108 M
-1s
-1)= 6.8×10
2 s
-1, which is 3-fold higher than
that for catalase at low H2O2 concentrations and would make Prx1 the major contributor
for H2O2 consumption where Prx2 is fully inhibited. However, the following estimates
show that the effective rate constant for H2O2 reduction by Prx2 cannot be much lower
than 105 M
-1s
-1. Low et al. [2] observed that exposure of 5×10
9 erythrocytes/dm
3 to a 5
M H2O2 causes substantial Prx2 oxidation within 1 min. Figure 4B from ref. [2] shows
that the cells consumed 1 M H2O2 during the first minute of the experiment. Because
each cell carries 7.2×10⁻¹³
dm3 water the H2O2 intake by each cell was (1 M)/((5×10
9
cell dm-3
)×(7.2×10⁻¹⁴
dm3 cell
-1))= 2.8 mM. Based on Figure 4A from ref. [2] we
conservatively consider that 50% of the Prx2 peroxidatic thiols, amounting 285 M,
were oxidized to disulfides during the same time, corresponding to 10% of the intake.
Supplementary Figure 4. Simulated Prx2
oxidation 1 min after a 5 M H2O2 bolus under the conditions of the experiment in Fig. 4A of ref. [2] as function of kOx. Black, fraction of crosslinked Prx2 monomers, based on Model D (Table 1 from main text) modified by (i) treating the extracellular concentration of H2O2 as a dependent variable, with compartment volumes accounting for the hematocrit of the assay medium, and (ii) assuming a 57 nM s
-1
endogenous H2O2 production reflecting the higher rate of GSH autoxidation under atmospheric pressure (discussed in Supplementary Materials section 2). Red, fraction of H2O2 consumed by Prx2 under basal conditions implied by the same value of kOx, based on unmodified Model D.
16
Conservatively assuming pseudo-first-order rate constants of 150 s-1
for Cat
(Supplementary Materials section 6) and 25 s-1
for GPx1 (Supplementary Materials
section 5) under these conditions, we find that the effective kOx must be at least 0.1×(150
s-1
+ 25 s-1
)/(5.7×10-4
M)= 3×10⁴ M
-1s
-1. Simulations based on Model D (Supplementary
Figure 4) yield a more precise lower limit: kOx> 3×10⁴ M
-1s
-1. This suggests that Prx2
does not contribute much less than 50% for H2O2 consumption under low H2O2
supplies, and that the effective rate constant for H2O2 reduction by Prx1 is also lower
than 108 M
-1s
-1. The latter is consistent with the rate constant determined for
Saccharomyces cerevisiae TSA1 (a Prx1 ortholog) using method and conditions similar
to those used in ref. [52] for Prx2: 107 M
-1s
-1 at pH 7.4, 25ºC [53].
8. Trx cycle
Human Trx1 possesses a regulatory dithiol (C62,C69) whose oxidation to
disulfide prevents the reduction of the active site dithiol (C32,C35) via TrxR [57]. Go et
al. [58] recently found that all Trx1 was in doubly oxidized form in HT29 cells (a colon
cancer cell line) exposed to a 2 mM H2O2 bolus, and this form was also detectable in
cells exposed to 20 μM auranofin, a TrxR inhibitor. The redox state of the regulatory
dithiol is modulated by oxidation/reduction by the active site dithiol of a second Trx1
molecule [57]. In modeling these reactions we made the following three assumptions.
First, oxidation of the regulatory dithiol fully prevents TrxR-catalyzed reduction of the
active site. Second, the regulatory dithiol of a Trx1 can only be oxidized and reduced by
the active site of other Trx1 molecule. Third, the redox state of the active site does not
affect the redox potential nor the oxidation/reduction rate constants of the regulatory
site. Fourth, all reactions between the active site of one molecule and the regulatory site
of another molecule follow mass action kinetics. Under these assumptions, the possible
reactions between active and regulatory dithiols are:
DD TT TD
DD TT DT
DD DT TD DD
DT TT TT TD
Trx1 Trx1 2 Trx1
Trx1 Trx1 2 Trx1
Trx1 Trx1 Trx1 Trx1
Trx1 Trx1 Trx1 Trx1
(5)
Here, Trx1xy indicates thioredoxin with the active site dithiol in state x, and the regulatory
dithiol in state y where T stands for thiol and D for disulfide. We assumed that the redox
state of each dithiol does not influence the midpoint potential nor the rate constants for
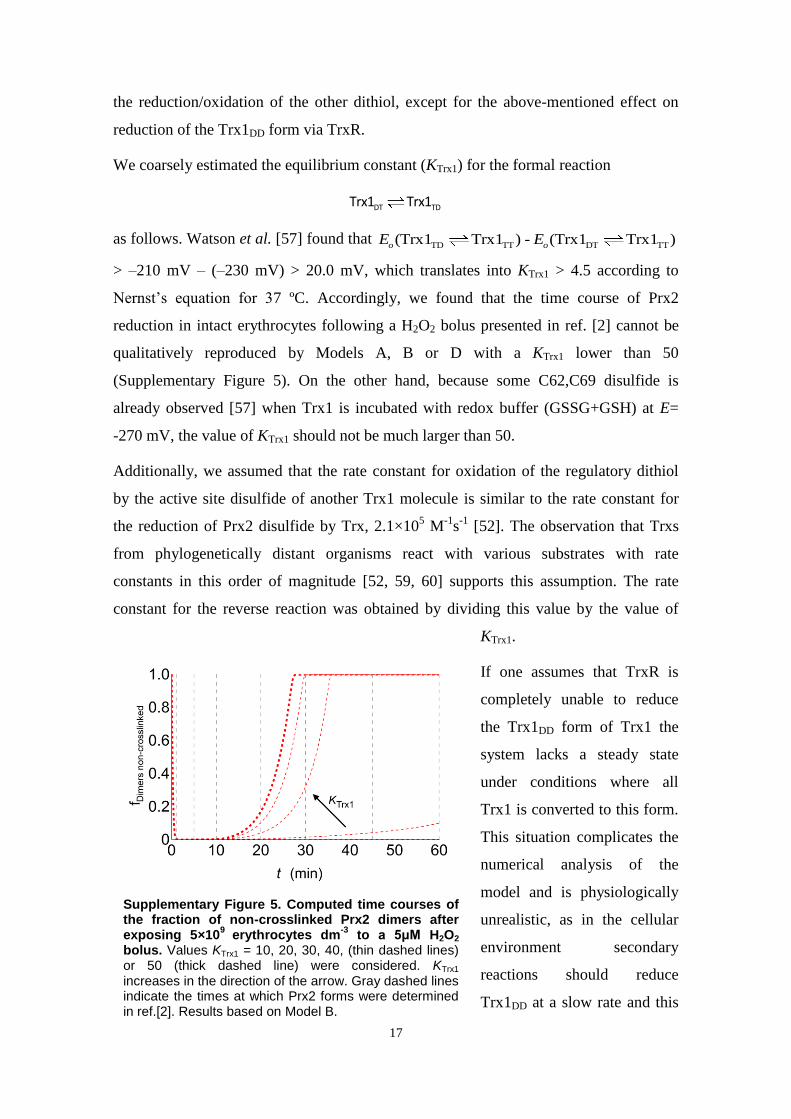
17
Supplementary Figure 5. Computed time courses of the fraction of non-crosslinked Prx2 dimers after exposing 5×10
9 erythrocytes dm
-3 to a 5μM H2O2
bolus. Values KTrx1 = 10, 20, 30, 40, (thin dashed lines) or 50 (thick dashed line) were considered. KTrx1
increases in the direction of the arrow. Gray dashed lines indicate the times at which Prx2 forms were determined in ref.[2]. Results based on Model B.
the reduction/oxidation of the other dithiol, except for the above-mentioned effect on
reduction of the Trx1DD form via TrxR.
We coarsely estimated the equilibrium constant (KTrx1) for the formal reaction
DT TDTrx1 Trx1
as follows. Watson et al. [57] found that TD TT DT TT(Trx1 Trx1 ) - (Trx1 Trx1 )o oE E
> –210 mV – (–230 mV) > 20.0 mV, which translates into KTrx1 > 4.5 according to
Nernst’s equation for 37 ºC. Accordingly, we found that the time course of Prx2
reduction in intact erythrocytes following a H2O2 bolus presented in ref. [2] cannot be
qualitatively reproduced by Models A, B or D with a KTrx1 lower than 50
(Supplementary Figure 5). On the other hand, because some C62,C69 disulfide is
already observed [57] when Trx1 is incubated with redox buffer (GSSG+GSH) at E=
-270 mV, the value of KTrx1 should not be much larger than 50.
Additionally, we assumed that the rate constant for oxidation of the regulatory dithiol
by the active site disulfide of another Trx1 molecule is similar to the rate constant for
the reduction of Prx2 disulfide by Trx, 2.1×10⁵ M
-1s
-1 [52]. The observation that Trxs
from phylogenetically distant organisms react with various substrates with rate
constants in this order of magnitude [52, 59, 60] supports this assumption. The rate
constant for the reverse reaction was obtained by dividing this value by the value of
KTrx1.
If one assumes that TrxR is
completely unable to reduce
the Trx1DD form of Trx1 the
system lacks a steady state
under conditions where all
Trx1 is converted to this form.
This situation complicates the
numerical analysis of the
model and is physiologically
unrealistic, as in the cellular
environment secondary
reactions should reduce
Trx1DD at a slow rate and this
18
reaction will ultimately oxidize NADPH. In order to avoid these problems we
considered that Trx1DD is a very poor substrate for TrxR, with a KM 1000-fold higher
than that for Trx1DT. This assumption does not affect the relevant results in this work.
We implemented TrxR-catalyzed reduction of Trx1DT form as described in the next
section.
9. TrxR activity
Low et al. [2] determined the Trx reductase activity in human erythrocytes for
5-(3-Carboxy-4-nitrophenyl)disulfanyl-2-nitrobenzoic acid (DTNB) as substrate as 7.9
M s-1
at 37 ºC, pH 7.4, and Urig et al. [61] determined a kcat= 33.3 s-1
for the same
substrate at 25 ºC, pH 7.4. Assuming that the ratio between the activity at 25 ºC and the
activity at 37 ºC is 0.562 [5] as for the homologous enzyme GSR, this kcat would
translate into a kcat = 59.2 s-1
at 37 ºC. The activity above would then correspond to 0.13
M active protein, which is consistent with the lower estimate >44 nM obtained from
the determinations by Meplan et al. [62]. In order to coarsely estimate the activity for
the relevant physiological substrate, we drew on the determination by Turanov et al.
[63] for recombinant human Trx: kcat = 25.8 s-1
at 22ºC, pH 7.0. Assuming Q10= 2.06 as
determined for GSR from the activities ratio 25 ºC/37 ºC provided by ref. [5], this
implies a kcat (Trx1) = 76.3 s-1
= 1.3 kcat(DTNB), leading to a corresponding activity of
VMax,TrxR= 1.3(7.9 µM s-1
) = 10 M s-1
. However, the actual maximal rate of PSS
reduction achievable is lower for the following two reasons. First, because the Trx
concentration — 0.56 µM — is lower than KM,TrxR,Trx1DT = 1.83 M [63]. One can
estimate the maximal reduction rate knowing that TrxR follows a ping-pong catalytic
mechanism [64, 65], assuming that KM,TrxR,NADPH = 6.0 µM [61] † and [NADPH]= 2.6
µM [66], considering [Trx1DT]= [Trx]Tot, and replacing values on the rate expression:
Max,TrxR
M,TrxR,NADPH M,TrxR,Trx1DT
DT
1[NADPH] [Trx1 ]
Vv
K K
(6)
† Although this KM was determined for DTNB as co-substrate it should hold as well for Trx as co-
substrate. This because in a ping-pong mechanism the enzyme form binding one substrate is the same
irrespective of the co-substrate.
19
This computation yields v= 1.5 µM s-1
(1.2 µM s-1
if we consider the activity
determined by ref. [2]). The second reason is that under high oxidative loads Trx never
fully accumulates in the Trx1DT form (Section 8) that is substrate for TrxR, but instead
is further oxidized to the Trx1DD form, which is not reduced by TrxR. Using the model
described in Section 8 we estimate that the maximal rate of Trx reduction is ≈1.0 μM
s-1
, which is slightly lower than the estimated erythrocyte’s capacity for NADPH
regeneration. Thus, the capacity for NADPH supply, the TrxR activity and the
concentration of Trx, all have some influence on the rate of PSS reduction at high
oxidative loads.
At the maximal rate of Trx reduction estimated above it takes about (5.7×10⁻⁵
M)/(1.0×10-6
M s-1
)= 570 s to fully regenerate Prx2 if it gets completely converted to
the PSS form.
The pseudo-first-order rate constant for Trx reduction at low concentrations of Trx1DT is
(1.0×10⁻⁵
M s-1
)/(1.83 µM)= 5.5 s-1
.
10. NADPH concentration and binding equilibria
Human erythrocytes contain 39.97.0 M NADPH [67] but most of it is bound
to proteins [68]. Catalase tightly binds about 16 M NADPH [68]. Because this
NADPH exchanges with unbound NADPH very slowly [69] we discounted it from the
total concentration of NADP. Thus, we consider [NADP]tot = 28 M, as obtained in ref.
[67] with a method that determines only unbound and loosely bound NADP. The
following evidence indicates that most of this NADP is loosely bound. First, 2.5-fold
more NADP binds to proteins when submitting a chromatography column to 10 M
NADP+
+ 10 M NADPH than when submitting a similar preparation to 2.5 M
NADP+ + 2.5 M NADPH [68]. As some of the major NADP binding peaks in the
former chromatogram are barely detectable in the latter, NADP binding is probably not
saturated at 10 M NADP+ + 10 M NADPH. Thus, a substantial fraction of the NADP
binding sites in erythrocytes have dissociation constants that are not much lower than
[NADP]tot. The data in ref. [67] also indicates the existence of more than 154 M
NADP binding sites. Second, good fittings to published ultrafiltration data [68] are only
achieveable by considering high concentrations of low-affinity binding sites for NADP+
and NADPH. Third, ref. [70] presents the concentrations of bound and unbound NADP+
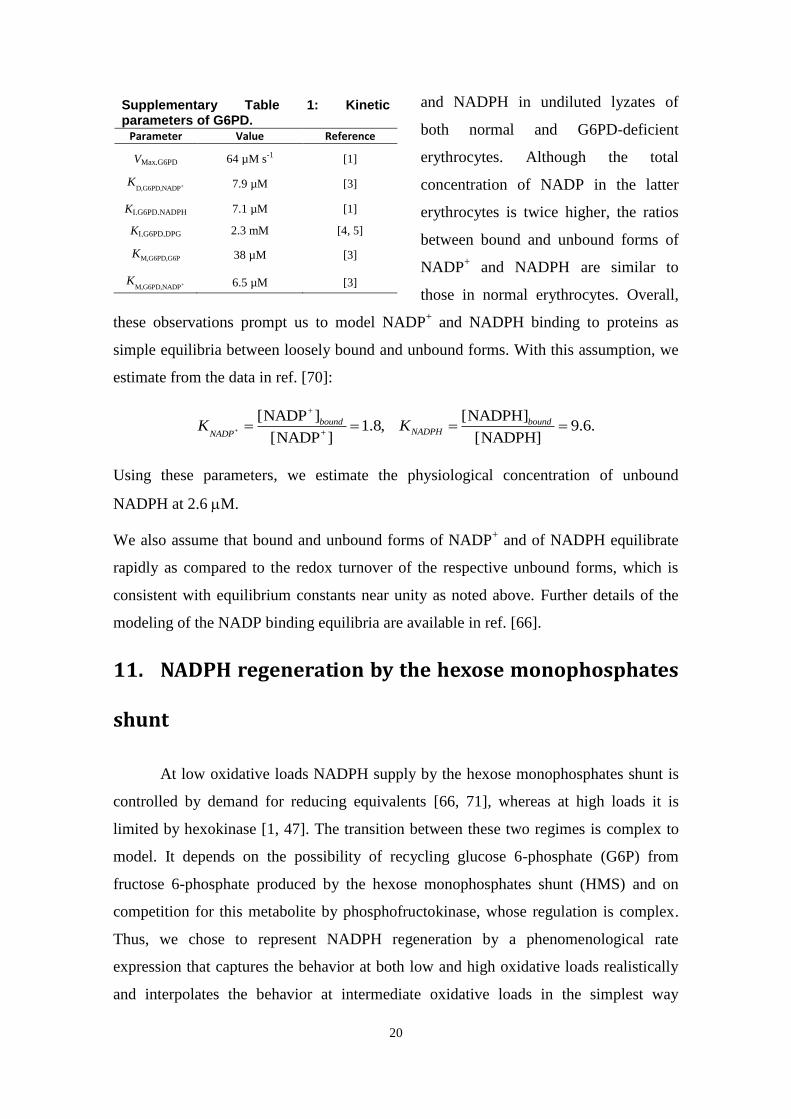
20
and NADPH in undiluted lyzates of
both normal and G6PD-deficient
erythrocytes. Although the total
concentration of NADP in the latter
erythrocytes is twice higher, the ratios
between bound and unbound forms of
NADP+ and NADPH are similar to
those in normal erythrocytes. Overall,
these observations prompt us to model NADP+ and NADPH binding to proteins as
simple equilibria between loosely bound and unbound forms. With this assumption, we
estimate from the data in ref. [70]:
+
+
[NADP ] [NADPH]1.8, 9.6.
[NADP ] [NADPH]+
bound boundNADPHNADP
K K
Using these parameters, we estimate the physiological concentration of unbound
NADPH at 2.6 M.
We also assume that bound and unbound forms of NADP+ and of NADPH equilibrate
rapidly as compared to the redox turnover of the respective unbound forms, which is
consistent with equilibrium constants near unity as noted above. Further details of the
modeling of the NADP binding equilibria are available in ref. [66].
11. NADPH regeneration by the hexose monophosphates
shunt
At low oxidative loads NADPH supply by the hexose monophosphates shunt is
controlled by demand for reducing equivalents [66, 71], whereas at high loads it is
limited by hexokinase [1, 47]. The transition between these two regimes is complex to
model. It depends on the possibility of recycling glucose 6-phosphate (G6P) from
fructose 6-phosphate produced by the hexose monophosphates shunt (HMS) and on
competition for this metabolite by phosphofructokinase, whose regulation is complex.
Thus, we chose to represent NADPH regeneration by a phenomenological rate
expression that captures the behavior at both low and high oxidative loads realistically
and interpolates the behavior at intermediate oxidative loads in the simplest way
Supplementary Table 1: Kinetic parameters of G6PD.
Parameter Value Reference
VMax,G6PD
64 µM s-1 [1]
D,G6PD,NADPK
7.9 µM [3]
KI,G6PD,NADPH 7.1 µM [1]
KI,G6PD,DPG 2.3 mM [4, 5]
M,G6PD,G6PK 38 µM [3]
+M,G6PD,NADPK 6.5 µM [3]
21
possible. Namely, we use a hyperbolic (i. e., Michaelis-Menten-like) rate expression
whose parameters are specified as follows. The VMax,HMS= 2.4 µM s-1
is twice the
maximum rate of the pentose phosphate pathway determined by ref. [47], accounting for
the fact that two molecules of NADPH are regenerated per G6P molecule consumed by
the HMS. The KM,HMS= 0.45 µM is such that the pseudo-first-order rate constant for
NADP+ reduction at low NADP
+ concentration is the same as that determined by G6PD
kinetics: + +
App App
Max,HMS Max,G6PDM,HMS,NADP M,G6PD,NADP/ 2 /V K V K . In order to estimate these
apparent kinetic parameters of G6PD we considered the following rate expression [72]:
+ +
Max,G6PD
M,G6PD,G6P D,G6PD,NADP M,G6PD,NADP
+ +
I,G6PD,NADPH I,G6PD,DPG
[NADPH] [DPG]1 1 1
[G6P] [NADP ] [NADP ]
Vv
K KK
K K
,
(7)
with DPG standing for 2,3-diphosphoglycerate (DPG), the kinetic parameters as
presented in Supplementary Table 1, [G6P]= 39 µM [5], [DPG] = 2.8 mM, which is the
average concentration between arterial [73] and venous [74] blood, and unbound
[NADPH] = 2.6 µM [66].
We obtain:
Max,G6PDApp 1
Max,G6PD
M,G6PD,G6P
32 Ms
1[G6P]
VV
K
,
+ +
+
M,G6PD,G6P
M,G6PD,NADP D,G6PD,NADPI,G6PD,NADPH I,G6PD,DPGApp
M,G6PD,NADPM,G6PD,G6P
[NADPH] [DPG]1
[ ]12 M
1[G6P]
KK K
K K G6PK
K
,
which yields VMax,HMS/KM,HMS = 5.3 s-1
, translating into a +M,HMS,NADPK = (2.4 μM
s-1
)/5.3 = 0.45 μM.
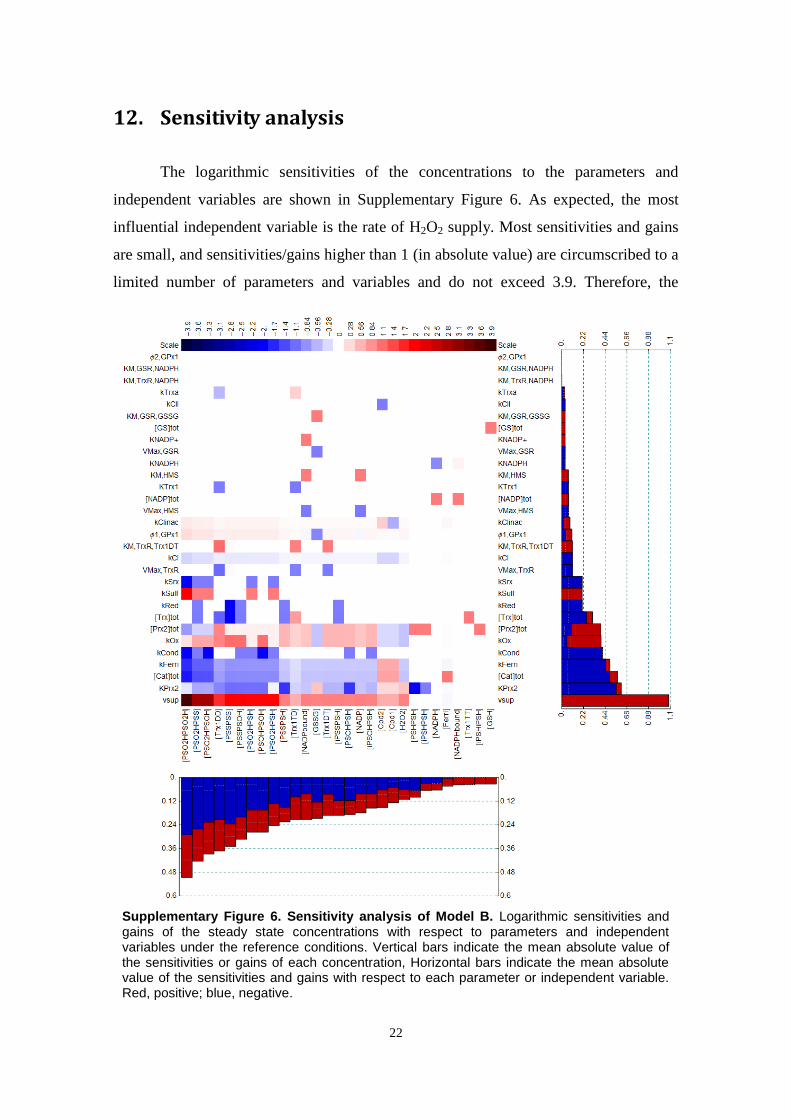
22
12. Sensitivity analysis
The logarithmic sensitivities of the concentrations to the parameters and
independent variables are shown in Supplementary Figure 6. As expected, the most
influential independent variable is the rate of H2O2 supply. Most sensitivities and gains
are small, and sensitivities/gains higher than 1 (in absolute value) are circumscribed to a
limited number of parameters and variables and do not exceed 3.9. Therefore, the
Supplementary Figure 6. Sensitivity analysis of Model B. Logarithmic sensitivities and gains of the steady state concentrations with respect to parameters and independent variables under the reference conditions. Vertical bars indicate the mean absolute value of the sensitivities or gains of each concentration, Horizontal bars indicate the mean absolute value of the sensitivities and gains with respect to each parameter or independent variable. Red, positive; blue, negative.
23
concentrations are quite robust with respect to uncertainties in the parameters and
independent variables. The high gain (3.9) of the concentration of doubly sulfinylated
Prx2 dimers with respect to the H2O2 supply reflects the fact that formation of this
species requires four consecutive oxidations by H2O2. This species could thus be an
extremely sensitive H2O2 sensor.
13. Model validation and refinement
13.1 Evidence that Prx2’s contribution for H2O2 consumption in erythrocytes is
comparable to Cat’s
We are aware of the following five lines of evidence that Prx2’s contribution for H2O2
consumption in intact erythrocytes at low oxidative loads is comparable to that of Cat.
First, Jakob et al. [75] found that erythrocytes from acatalasemic individuals exhibited
2.6-fold higher rates of NADPH production than those from normal individuals when
incubated with glucose. This observation suggests that in the latter erythrocytes the
Prx2- and GPx1-catalyzed processes together consume ≈40% of the H2O2
(Supplementary Materials section 13.4). Likewise, Gaetani et al. [18] found that the rate
of the hexose monophosphate shunt in the erythrocytes from acatalasemic individuals
was about twice that in the erythrocytes from healthy individuals.
Second, Johnson et al. [10] found that in erythrocytes from GPx1-deficient mice
irreversible inactivation of Cat by 3-AT was substantially slower than expected if Cat
were the sole enzyme eliminating H2O2. They were able to fit the observed data with a
model that considered a contribution of peroxiredoxin consuming 55% of the H2O2,
with a pseudo-first-order rate constant of 24 s-1
. Note that this value is just 0.04% of the
one that we estimated in this work from the kinetic data obtained in vitro [36, 52]. Thus,
Prx2 ought to be practically fully (99.96%) inhibited for that result to obtain if Prx2 in
mice erythrocytes is as active and abundant as in human erythrocytes. Likewise, Matte
et al. [76] observed that Cat inhibition caused a noticeable increased in Prx2 oxidation
in mice erythrocytes.
Third, Johnson et al. [77] observed just 1.6-fold higher rates of Cat inactivation by
3-AT in the erythrocytes from Prx2-/-
knockout mice than in the erythrocytes from wild
type mice. From this result, and considering the diminished Cat activity in the Prx2-/-
mice [77], one estimates that in the erythrocytes from wild type mice Prx2 consumes
24
75% of the intracellular H2O2, according to a model [77] that already accounts for the
lower specific activity of Cat at low H2O2 concentrations.
Fourth, Cho et al. [36] found that Cat inhibition caused a 5- to 10-fold increase in Prx2
sulfinylation in erythrocytes incubated for 3 h at a 50% hematocrit at a purportedly
steady rate of H2O2 generation. Taken at face value, this observation suggests that Prx2
consumes no more than 45% of the H2O2, but questions can be raised about this
experimental setup (Supplementary Materials section 13.3).
Fifth, Low et al. [2] observed that exposure of 5×10⁹ erythrocytes/dm
3 to a 5 M H2O2
causes incomplete Prx2 oxidation within 1 min. (Note that the second lane in Figure 4A
from ref. [2] exhibits a strong band corresponding to singly-crosslinked dimers, adjacent
to the slightly more mobile band corresponding [78] to doubly-crosslinked dimers.
Also, the incomplete crosslinking cannot be attributed to sulfinylation, of which Low et
al. [2] did not detect any traces under the conditions of the experiment.) From Figure 4B
in ref. [2] we estimated (Supplementary Materials section 7) that during this time period
2.9 mM H2O2 entered the cell, which is 5-fold the concentration of Prx2 monomers.
This (2.9×10⁻³
M)/(60 s)= 48 M s-1
mean H2O2 influx rate far exceeds the estimated
maximal rate of Prx2 reduction (1 M s-1
, Supplementary Materials section 9).
Therefore, should Prx2 be strongly competitive with Cat it should have been totally
oxidized by the end of the first minute (see also Figure 3E in the main text).
13.2 Model validation
We validated the model by comparing the predicted responses to H2O2 under
various conditions to the experimental observations reported by Low et al. [2]. In a first
set of experiments these authors exposed human erythrocytes (5×10⁹ or 5×10
10 cells
dm-3
, pH 7.4, 37º C, 5 mM glucose) to various H2O2 boluses for 10 min and determined
the fractions of Prx2 monomers or disulfide-crosslinked dimers in non-reducing SDS-
polyacrylamide gel electrophoresis (PAGE) gels. In another experiment these authors
followed the cross-linking status of Prx2 over time upon exposing 5×10⁹ erythrocytes
dm-3
to a 5 μM H2O2 bolus for 60 minutes. We simulated these experiments as
described in Figure 3 of the main text. Simulations based on Models B (inhibition of
Prx2’s peroxidase activity) and D (constitutively low peroxidase activity) reached near-
quantitative agreement with the experimental results without requiring the adjustment of
any further parameters (Figure 3B,D,F,H, Supplementary Figure 7A).
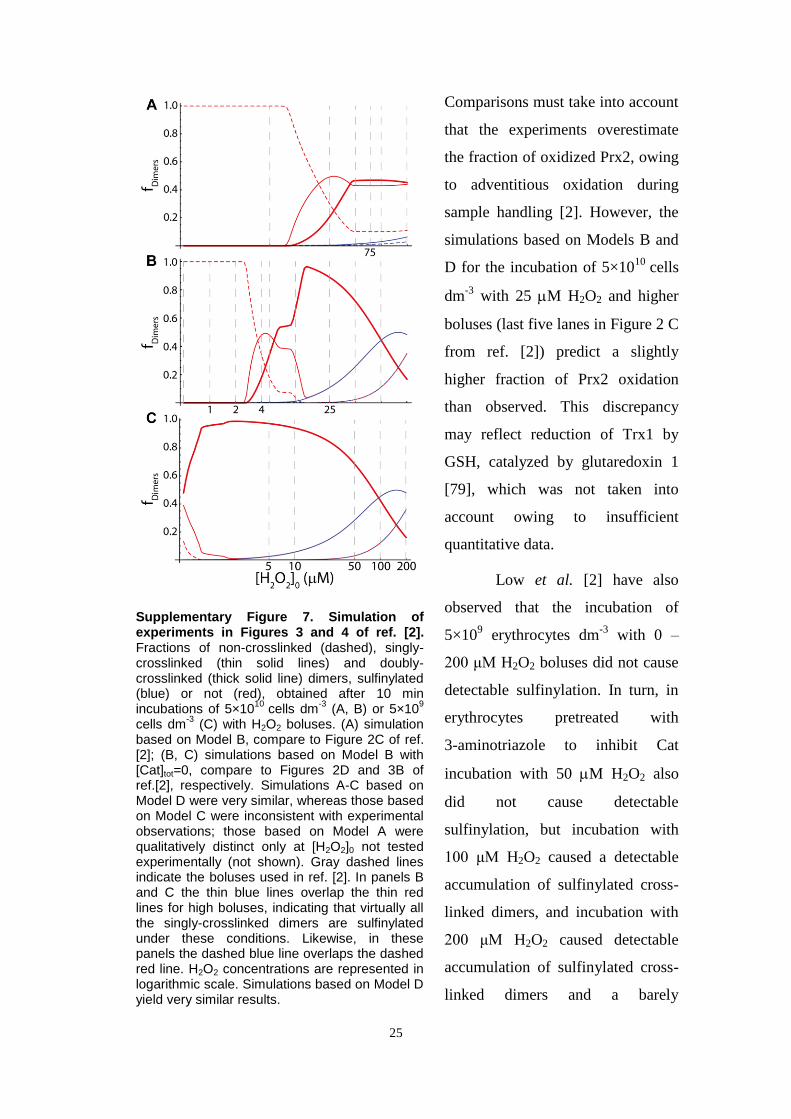
25
Comparisons must take into account
that the experiments overestimate
the fraction of oxidized Prx2, owing
to adventitious oxidation during
sample handling [2]. However, the
simulations based on Models B and
D for the incubation of 5×10¹⁰
cells
dm-3
with 25 M H2O2 and higher
boluses (last five lanes in Figure 2 C
from ref. [2]) predict a slightly
higher fraction of Prx2 oxidation
than observed. This discrepancy
may reflect reduction of Trx1 by
GSH, catalyzed by glutaredoxin 1
[79], which was not taken into
account owing to insufficient
quantitative data.
Low et al. [2] have also
observed that the incubation of
5×10⁹ erythrocytes dm
-3 with 0 –
200 μM H2O2 boluses did not cause
detectable sulfinylation. In turn, in
erythrocytes pretreated with
3-aminotriazole to inhibit Cat
incubation with 50 M H2O2 also
did not cause detectable
sulfinylation, but incubation with
100 μM H2O2 caused a detectable
accumulation of sulfinylated cross-
linked dimers, and incubation with
200 μM H2O2 caused detectable
accumulation of sulfinylated cross-
linked dimers and a barely
Supplementary Figure 7. Simulation of experiments in Figures 3 and 4 of ref. [2]. Fractions of non-crosslinked (dashed), singly-crosslinked (thin solid lines) and doubly-crosslinked (thick solid line) dimers, sulfinylated (blue) or not (red), obtained after 10 min incubations of 5×10
10 cells dm
-3 (A, B) or 5×10
9
cells dm-3
(C) with H2O2 boluses. (A) simulation based on Model B, compare to Figure 2C of ref. [2]; (B, C) simulations based on Model B with [Cat]tot=0, compare to Figures 2D and 3B of ref.[2], respectively. Simulations A-C based on Model D were very similar, whereas those based on Model C were inconsistent with experimental observations; those based on Model A were qualitatively distinct only at [H2O2]0 not tested experimentally (not shown). Gray dashed lines indicate the boluses used in ref. [2]. In panels B and C the thin blue lines overlap the thin red lines for high boluses, indicating that virtually all the singly-crosslinked dimers are sulfinylated under these conditions. Likewise, in these panels the dashed blue line overlaps the dashed red line. H2O2 concentrations are represented in logarithmic scale. Simulations based on Model D yield very similar results.
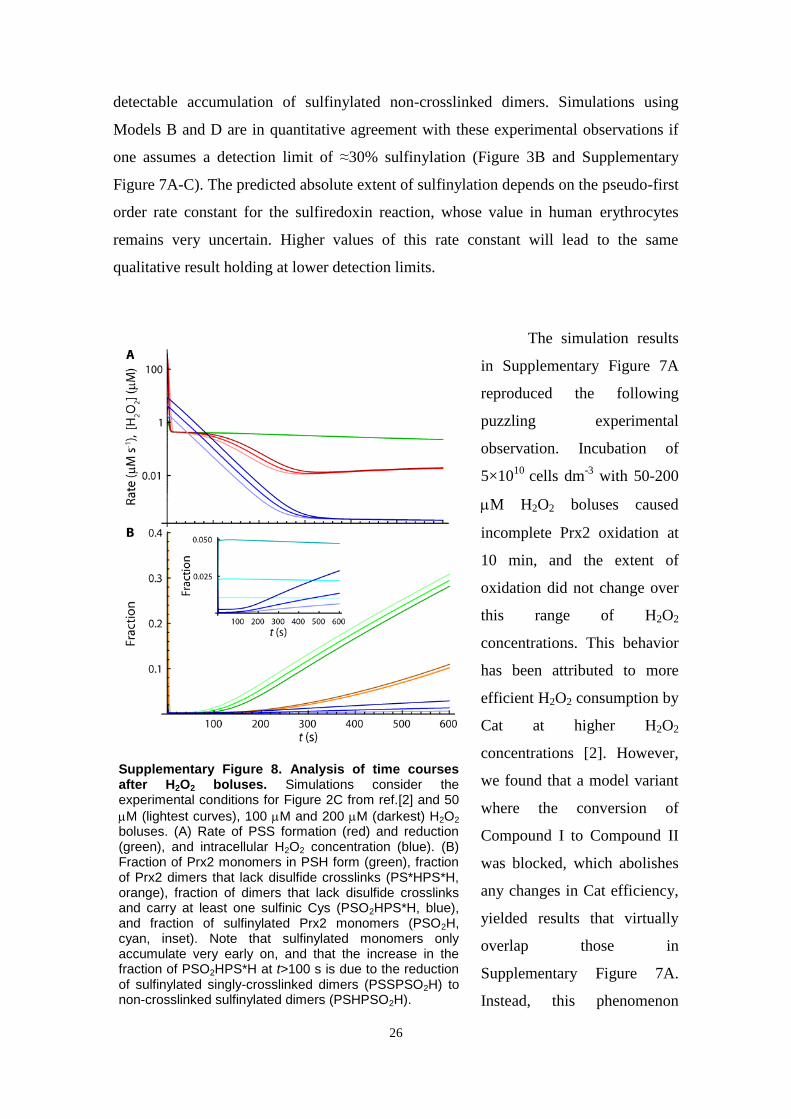
26
Supplementary Figure 8. Analysis of time courses after H2O2 boluses. Simulations consider the experimental conditions for Figure 2C from ref.[2] and 50
M (lightest curves), 100 M and 200 M (darkest) H2O2 boluses. (A) Rate of PSS formation (red) and reduction (green), and intracellular H2O2 concentration (blue). (B) Fraction of Prx2 monomers in PSH form (green), fraction of Prx2 dimers that lack disulfide crosslinks (PS*HPS*H, orange), fraction of dimers that lack disulfide crosslinks and carry at least one sulfinic Cys (PSO2HPS*H, blue), and fraction of sulfinylated Prx2 monomers (PSO2H, cyan, inset). Note that sulfinylated monomers only accumulate very early on, and that the increase in the fraction of PSO2HPS*H at t>100 s is due to the reduction of sulfinylated singly-crosslinked dimers (PSSPSO2H) to non-crosslinked sulfinylated dimers (PSHPSO2H).
detectable accumulation of sulfinylated non-crosslinked dimers. Simulations using
Models B and D are in quantitative agreement with these experimental observations if
one assumes a detection limit of ≈30% sulfinylation (Figure 3B and Supplementary
Figure 7A-C). The predicted absolute extent of sulfinylation depends on the pseudo-first
order rate constant for the sulfiredoxin reaction, whose value in human erythrocytes
remains very uncertain. Higher values of this rate constant will lead to the same
qualitative result holding at lower detection limits.
The simulation results
in Supplementary Figure 7A
reproduced the following
puzzling experimental
observation. Incubation of
5×10¹⁰
cells dm-3
with 50-200
M H2O2 boluses caused
incomplete Prx2 oxidation at
10 min, and the extent of
oxidation did not change over
this range of H2O2
concentrations. This behavior
has been attributed to more
efficient H2O2 consumption by
Cat at higher H2O2
concentrations [2]. However,
we found that a model variant
where the conversion of
Compound I to Compound II
was blocked, which abolishes
any changes in Cat efficiency,
yielded results that virtually
overlap those in
Supplementary Figure 7A.
Instead, this phenomenon
27
appears to be due to the following more complex interplay of factors. Strong H2O2
boluses lead to a transient state where the rate of Prx2 disulfide (PSS) production is
limited by the rate of Prx2 thiol (PSH) regeneration by the Trx1/TrxR system
(Supplementary Figure 8A). Due to the low activity of the latter system Prx2
accumulates almost completely in PSS form under these conditions, and the elimination
of H2O2 is then mostly carried out by Cat with approximately pseudo-first-order
kinetics. The intracellular H2O2 concentration thus decays exponentially
(Supplementary Figure 8A, t < 300 s), tracking the permeation-limited exponential
decay of extracellular H2O2. Therefore, at some point in time the oxidation of PSH by
H2O2 becomes the rate-limiting step, and eventually becomes negligible compared to
the rate (vred) of PSS reduction (Supplementary Figure 8A, t > 100 s). Considering the
exponential decay of intracellular H2O2, the time (t*) at which net PSH accumulation
begins scales approximately as the logarithm of bolus intensity ([H2O2]0). Thus, each
doubling of [H2O2]0 will delay t* by just t* ln(2)/(0.039 s-1
)= 18 s, where the
denominator is the decay exponent of H2O2 concentration inferred from the curve in
Figure 4B of ref. [2] (Supplementary Materials section 3) corrected for 5×10¹⁰
cells
dm-3
. From then on, the concentration of PSH increases at the approximately constant
rate vred, which is independent of the concentration of H2O2 (Supplementary Figure 8B).
Each doubling in [H2O2]0 thus decreases the extent of Prx2 reduction at 10 min by just
vred/t*.‡ The fraction of non-crosslinked dimers changes even less due to the
following compensatory factor (Supplementary Figure 8B). Sulfinylated Prx2 (PSO2H)
accumulates for a short period while there is some accumulation of PSOH. This
accumulation increases with [H2O2]0 and hinders the formation of disulfide crosslinks.
When Cat is inhibited as per the experiment in Figure 3B of ref. [2], all the
redox pools are strongly depleted, and Prx2 is not significantly reduced over the 10 min
duration of the incubation. Further, the concentration of H2O2 stays high during this
period, leading to progressive Prx2 sulfinylation.
‡ The value of vred is much lower than Max,TrxRV because such strong H2O2 boluses cause substantial
GSSG accumulation, leading GSR to outcompete TrxR for NADPH. The fact that the less GSSG
accumulated in response to lower H2O2 boluses can be reduced in less than 10 min explains the higher
extent of Prx2 reduction at 10 min after those boluses.
28
Model B predicts redox potentials of the Trx and NADPH pools at rest (Table 2
in main text) that are in line with those characterized experimentally in other cells: –280
mV for Trx1 in proliferating THP1 human monocytes [57] and –400 mV for NADPH
[80]. However, it predicts a more negative redox potential for GSH than the –250 mV
determined [81] for human erythrocytes or the –259 mV determined [57] for
proliferating THP1 human monocytes. This discrepancy is mainly due to the following
two reasons. First, the model neglects various processes that oxidize the GSH pool, such
as the reduction of organic peroxides and of protein sulfenic acids and dithiols. Second,
experimental determinations tend to overestimate the extent of GSH oxidation in vivo
because they are usually carried out at O2 partial pressures much above physiological
values. This discrepancy could be resolved by assuming an additional process oxidizing
GSH and does not change the conclusions of this work.
Despite the good agreement with the experimental observations in ref. [1], Models B
and D are inconsistent with the high Prx2 sulfinylation observed by Cho et al. [37] at
low H2O2 supplies. However, this discrepancy is likely due to a strong underestimation
of H2O2 supply in this experiment. We examine this problem in the next section.
13.3 Analysis of experiments by Cho et al. [37]
Cho et al. [37] incubated erythrocytes at a 50% hematocrit with glucose oxidase
(GO) at an activity that generates H2O2 at a purported rate of 4.5 M min-1
= 75 nM s-1
.
They found that ≈10% of Prx2 becomes sulfinylated after 3 h, corresponding to a mean
sulfinylation rate of 0.1×(5.7×10-4
M)/(3×3600 s)= 5.3 nM s-1
in excess of the
sulfiredoxin-catalyzed sulfinic acid reduction rate.
The extracellular H2O2 concentration at steady state in this experiment can be estimated
from the purported H2O2 production rate as follows. The 50% hematocrit corresponds to
a pseudo-first-order rate constant for H2O2 clearance by erythrocytes of (5.8×10⁻⁵
dm
s-1
)×(1.35×10⁻⁸
dm2)×0.5/((1–0.5)×10
-13 dm
3) = 7.8 s
-1, considering the permeability
constant estimated in Supplementary Materials section 3, an erythrocyte surface area of
1.35×10⁻⁸
dm2 [8] and an erythrocyte volume of 10
-13 dm
3 [8]. Thus, the steady state
extracellular H2O2 concentration is (75 nM s-1
)/(7.8 s-1
)= 9.6 nM.
In order to examine the consistency of Model A with the mean sulfinylation rate
implied by the experiment above we first estimate the H2O2 influx referred to
Salvador
Cross-Out
Salvador
Inserted Text
disulfides.
29
intracellular concentrations. Because the hematocrit is 50% and considering a water to
cell volume ratio of 0.717 [7] this influx is simply (75 nM s-1
)/0.717= 0.11 μM s-1
. The
endogenous H2O2 production can be estimated as 0.057 μM s-1
, per Supplementary
Materials section 2 and accounting for the higher H2O2 production from GSH
autoxidation under atmospheric pressure (pO2= 160 Torr) (Supplementary Materials
section 2). The total H2O2 supply is thus around 0.16 μM s-1
. This is still sufficiently
low that the GSH, Trx1 and Prx2 pools remain overwhelmingly in the reduced forms.
Therefore, the intracellular H2O2 concentration according to Model A will be
approximately the ratio between the supply rate and the sum of the pseudo-first-order
rate constants (kPrx2 + kCat + kGPx1 = 57000 s-1
+ 218 s-1
+ 25 s-1
= 57243 s-1
) for H2O2
elimination by the three main defenses: (0.16 μM s-1
)/(57243 s-1
= 2.8 pM. This
concentration will form (5.7×10⁴ s
-1)×(2.8×10
-12 M)= 0.16 μM s
-1 sulfenic Prx2.
Neglecting the activity of sulfiredoxin and considering the rate constants for
condensation and sulfinylation (kCond= 1.7 s-1
, kSulf= 1.2×10⁴ M
-1s
-1) determined in ref.
[78] this flux leads to a (0.16 μM s-1
)/[1.7 s-1
+ (1.2×10⁴ M
-1s
-1)×(2.8 pM)]= 94 nM
steady state concentration of sulfenic Prx2, and a (1.2×10⁴ M
-1s
-1)×(2.8 pM)×(94 nM)=
3.2 fM s-1
sulfinylation rate. This rate is six orders of magnitude lower than that implied
by the results in ref. [37]. Further, in order to achieve consistency the value of kSulf
would have to be (1.7 s-1
× 5.3 nM s-1
)/[2.8 pM ×(0.16 μM s-1
– 0.0053 μM s-1
)] =
2.1×10¹⁰
M-1
s-1
, which is unrealistically high.
Cho et al. [37] further observed that under the same conditions as in the experiment
described above Cat inhibition caused a 5- to 10-fold increase in the Prx2 sulfinylation
rate. In order to examine the implications of this observation with respect to the fraction
of H2O2 consumed by Prx2 we considered the simplified model outlined in
Supplementary Figure 9A.
A steady state analysis of this model shows that the ratio (r) between the sulfinylation
rate at the normal Cat activity and that with Cat fully inhibited can be written as
function of two reduced parameters as follows:
2 21 1
1 ( 1) 4 1 ( 1)2
r , (8)
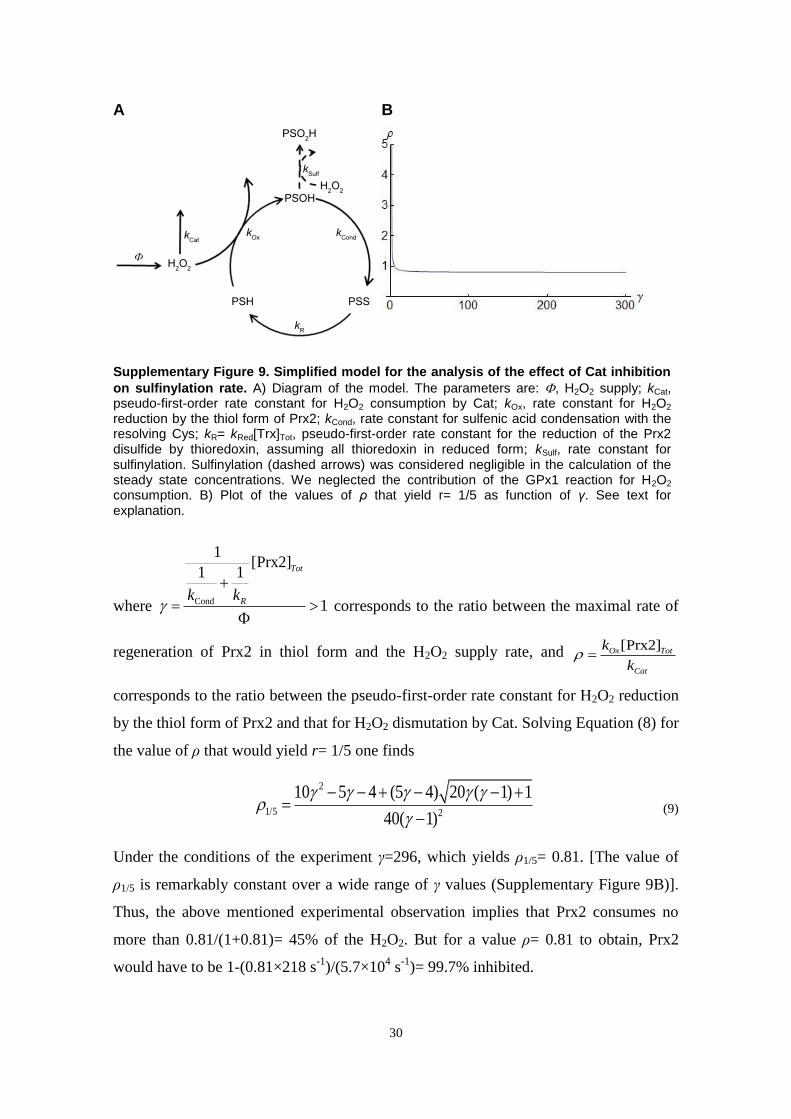
30
A
B
Supplementary Figure 9. Simplified model for the analysis of the effect of Cat inhibition
on sulfinylation rate. A) Diagram of the model. The parameters are: , H2O2 supply; kCat, pseudo-first-order rate constant for H2O2 consumption by Cat; kOx, rate constant for H2O2 reduction by the thiol form of Prx2; kCond, rate constant for sulfenic acid condensation with the resolving Cys; kR= kRed[Trx]Tot, pseudo-first-order rate constant for the reduction of the Prx2 disulfide by thioredoxin, assuming all thioredoxin in reduced form; kSulf, rate constant for sulfinylation. Sulfinylation (dashed arrows) was considered negligible in the calculation of the steady state concentrations. We neglected the contribution of the GPx1 reaction for H2O2 consumption. B) Plot of the values of ρ that yield r= 1/5 as function of γ. See text for explanation.
where Cond
1[Prx2]
1 1
1
Tot
Rk k
corresponds to the ratio between the maximal rate of
regeneration of Prx2 in thiol form and the H2O2 supply rate, and [Prx2]Ox Tot
Cat
k
k
corresponds to the ratio between the pseudo-first-order rate constant for H2O2 reduction
by the thiol form of Prx2 and that for H2O2 dismutation by Cat. Solving Equation (8) for
the value of ρ that would yield r= 1/5 one finds
2
1/5 2
10 5 4 (5 4) 20 ( 1) 1
40( 1)
(9)
Under the conditions of the experiment γ=296, which yields ρ1/5= 0.81. [The value of
ρ1/5 is remarkably constant over a wide range of γ values (Supplementary Figure 9B)].
Thus, the above mentioned experimental observation implies that Prx2 consumes no
more than 0.81/(1+0.81)= 45% of the H2O2. But for a value ρ= 0.81 to obtain, Prx2
would have to be 1-(0.81×218 s-1
)/(5.7×104 s
-1)= 99.7% inhibited.
31
Although a strong reversible inhibition of Prx2 can explain the experimentally observed
effects of changes in Cat activity in intact cells the following analysis shows that it
cannot explain the extent of Prx2 sulfinylation observed by Cho et al. [37].
Consider that Prx2 oxidation to the sulfenic form is inhibited to the extent that it
accounts for the consumption of 50% of the H2O2. Under these circumstances the
intracellular steady state concentrations of H2O2 and of Prx2 sulfenic form are
2 2[H O ]2 Ok
and
Cond Sulf 2 2Cond Sulf
O
1[PSOH]
2 [H O ]2
k kk k
k
, with kO standing
for the pseudo-first-order rate constant for all the other processes consuming H2O2. The
sulfinylation rate will thus be
2 2
SulfSulf 2 2
Cond Cond
Sulf
1 1[PSOH][H O ]
2 42
SO O
kv k
k k k k
k
(10)
Considering kO= 243 s-1
, as per the estimated contributions of Cat and GPx1, and
replacing values one finds vS= 190 fM s-1
, which is still four orders of magnitude lower
than the mean sulfinylation rate implied by the experiments of Cho et al. [37]. In order
to explain the reported sulfinylation flux under these conditions, kSulf/kCond would have
to exceed the 7.1×10³ M
-1 determined in ref. [78] by a 4×10
4 factor.
In order to determine if such values of kSulf/kCond would be consistent with the results
from ref. [2] described in Supplementary Materials section 13.2 in the framework of
Model B we proceeded as follows. We varied the value of kCond from 10-5
s-1
up to 20 s-1
while keeping the ratio kSulf/kCond fixed at 2.8×10⁸ M
-1 and examined whether any values
in this range would yield results qualitatively consistent with those in Figures 2, 3 and 4
of ref. [2]. (kCond ≤ 10-5
s-1
yields <7% reduced Prx2 monomers without exogenous H2O2
addition, contrary to observations [2] that most Prx2 is reduced under such conditions;
kCond > 20 s-1
yield kSulf values beyond the diffusion limit.) All kCond values in the
considered range yielded results that are qualitatively inconsistent with the experimental
observations in ref. [2]. Therefore, the observations by Cho et al. [37] cannot be
explained in the framework of Model B simply by assuming that the values of kCond and
kSulf differ from the experimentally determined ones.
As follows from equation (10), vS depends quadratically on the rate of H2O2 production
and therefore any error in the latter rate will have a strong effect on the former. This
32
prompted us to investigate if Cho et al. [37] could have underestimated the H2O2
production rate. The reported 4.5 M min-1
rate of H2O2 production via GO was
determined in an experiment where H2O2 accumulated for 3 h to concentrations in
excess of 6 mM. The concentration of O2 in the medium cannot exceed 186 M as per
the water solubility, and can be much lower owing to consumption by the GO reaction
under only mild agitation. Because H2O2 is a competitive inhibitor of GO with a KI that
is similar to the KM for O2 [82], GO is strongly inhibited under these conditions.
However, in presence of erythrocytes at a 50% hematocrit the situation is dramatically
different for the following two reasons. First, the steady state H2O2 concentration in the
assay medium is much lower owing to consumption by the cells. Second, erythrocytes
carry a total ≈10 mM O2 bound to hemoglobin, which can be readily delivered owing to
the very large total area of contact between cells and the medium. Therefore, the ratio
between the concentrations of H2O2 and O2 will be much lower, GO will be much less
inhibited and the rate of H2O2 production will be much higher under these conditions.
The extent of this effect is difficult to determine accurately because the O2
concentrations attained in the control experiment are dependent on geometrical factors
that were not reported. However, we can obtain a lower estimate under the optimistic
assumption that the medium was saturated with O2 in both experiments. Considering
that at the solubility limit [O2]KM(O2) [82], that KIKM(O2) and that [H2O2]>>[O2], the
ratio between the non-inhibited and the inhibited rate of H2O2 production is
approximately
2 222
2 2 2
2, 2 2
2 22
[H O ][O ]1 [O ]
[O ] [H O ] 3mM8.1
[O ] [O ] 2[O ] 0.372 mM
[H O ]1 [O ]
App
MaxM
IGO M
App
MaxGO inh M
M
I
VK
Kv K
Vv K
KK
(Here, 3 mM is taken as the mean H2O2 concentration over the experiment for
determining the rate of H2O2 production.) Thus, even under this optimistic assumption
the sulfinylation rate would be 8.1266-fold higher than predicted based on the reported
rate of H2O2 production. Furthermore, the long incubation with high initial glucose
concentrations (25 mM) may have caused strong acidification of the medium owing to
lactate accumulation from glucose catabolism. Acidic conditions have recently been
33
shown to promote Prx2 oxidation in human erythrocytes [83], presumably due to
enhanced superoxide production via hemoglobin autoxidation [83, 84].
Recent carefully designed experiments did not detect Prx2 sulfinylation in HEK293
cells exposed to steady 3.7 M H2O2 up to 24h, but showed evidence of Prx2
overoxidation following administration of >25 M H2O2 boluses [85]. The
computational results based on Models B and D, which consider the condensation and
sulfinylation rate constants determined in ref. [78], are consistent with these
experimental observations and also with those in ref. [2]. Therefore, there is no
substantial reason to question the ability of these models to simulate the responses of
Prx2 sulfinylation to H2O2.
13.4 Analysis of experiments of Jacob et al. [75]
Jacob et al. [75] incubated normal and acatalasemic erythrocytes at a hematocrit
of 35% with 15 mM glucose plus tracer quantities of 14
C-glucose at 37 ºC and
quantified the amount of 14
CO2 accumulated after 4 hours. Whereas normal erythrocytes
produced 48 µmol CO2/dm3 cells/hour, corresponding to 38 nM NADPH/s,
acatalasemic erythrocytes produced 123 µmol CO2/dm3 cells/hour, corresponding to 98
nM NADPH/s. This suggests that in normal erythrocytes Prx2 and GPx1 together
consume ≈39% of the H2O2. This estimate follows from the following analysis based on
the assumptions that most NADPH was being used towards H2O2 reduction, that H2O2
production is identical in both normal and acatalasemic cells, and that acatalasemic
erythrocytes have normal GPx1 and Prx2 activities. The intracellular concentration of
H2O2 in normal and acatalasemic erythrocytes at steady state are given by
2 2
1
[H O ]
GPx Prx2 Catk k k
and 2 2
1
[H O ]
GPx Prx2k k
, respectively. Thus, the rates of
NADPH consumption in each case are 2 2[H O ]( )
1
normal Prx2 GPx1
Cat
GPx1 Prx2
v k kk
k + k
and 2 2[H O ]( ) acatalasemic Prx2 GPx1v k +k , respectively, from which it follows
1
1
38nMs0.39
98nMs
normal GPx1 Prx2
acatalasemic Cat GPx1 Prx2
v k + k
v k + k + k
.
The estimated contribution of GPx1 and Prx2 will be even lower for the following two
reasons. First, because part of the NADPH is consumed for processes other than H2O2
34
reduction the ratios of NADPH regeneration rates above underestimate the ratio
between NADPH consumption by H2O2 reduction in normal erythrocytes and that in
acatalasemic erythrocytes. Second, the rate of endogenous H2O2 generation may have
been higher in normal than in acatalasemic erythrocytes. This because normal
erythrocytes accumulated more lactate than acatalasemic ones, which should have
caused higher acidification in the former than in the latter erythrocytes. Acidic
environments exacerbate Prx2 oxidation, presumably due to increased hemoglobin
autoxidation generating superoxide [83].
14. Additional notes
14.1 Energetic cost of inhibiting the peroxidase activity of Prx2 through covalent
modification
The observation that most Prx2 is oxidized to disulfide form within 1 min after
erythrocytes are exposed to a 5 M H2O2 bolus [2] implies an inhibition-activation
turnover in the order of 0.1 s-1
. This turnover amounts to a flux approaching (0.1
s-1
)×(570 M)= 57 M s-1
, which is 18-fold the erythrocyte’s maximal ATP production
rate [47]. Because each covalent modification cycle costs at least one ATP or one
reducing equivalent, this mode of regulation would make such a rate of cycling
energetically forbidding.
35
15. References
[1] Thorburn, D. R.; Kuchel, P. W. Regulation of the human-erythrocyte hexose-
monophosphate shunt under conditions of oxidative stress. A study using NMR spectroscopy, a
kinetic isotope effect, a reconstituted system and computer simulation. Eur. J. Biochem.
150:371-386; 1985. http://dx.doi.org/10.1111/j.1432-1033.1985.tb09030.x.
[2] Low, F. M.; Hampton, M. B.; Peskin, A. V.; Winterbourn, C. C. Peroxiredoxin 2
functions as a noncatalytic scavenger of low-level hydrogen peroxide in the erythrocyte. Blood
109:2611-2617; 2007. http://dx.doi.org/10.1182/blood-2006-09-048728.
[3] Kirkman, H. N.; Wilson, W. G.; Clemons, E. H. Regulation of glucose-6-phosphate-
dehydrogenase .1. Intact red- cells. J. Lab. Clin. Med. 95:877-887; 1980.
[4] Buckwitz, D.; Schonian, G.; Holzhötter, H. G.; Jacobasch, G. Kinetic model of glucose-
6-phosphate dehydrogenase from red blood cells. Parameter estimation from progress curves
and simulation of regulatory properties. Biomed. Biochim. Acta 45:429-439; 1986.
[5] Beutler, E. Red cell metabolism: a manual of biochemical methods. New York: Grune
and Stratton; 1984.
[6] Mueller, S.; Riedel, H. D.; Stremmel, W. Direct evidence for catalase as the
predominant H2O2 -removing enzyme in human erythrocytes. Blood 90:4973-4978; 1997.
[7] Savitz, D.; Sidel, V. W.; Solomon, A. K. Osmotic properties of human red cells. J. Gen.
Physiol. 48:79-94; 1964.
[8] Evans, E.; Fung, Y. C. Improved measurements of the erythrocyte geometry.
Microvasc. Res. 4:335-347; 1972.
[9] Giulivi, C.; Hochstein, P.; Davies, K. J. Hydrogen peroxide production by red blood
cells. Free Radic. Biol. Med. 16:123-129; 1994. http://dx.doi.org/10.1016/0891-5849(94)90249-
6.
[10] Johnson, R. M.; Goyette, G.; Ravindranath, Y.; Ho, Y.-S. Hemoglobin autoxidation and
regulation of endogenous H2O2 levels in erythrocytes. Free Radic. Biol. Med. 39:1407-1417;
2005. http://dx.doi.org/10.1016/j.freeradbiomed.2005.07.002.
[11] Eder, H. A.; Finch, C.; McKee, R. W. Congenital methemoglobinemia. A clinical and
biochemical study of a case. J. Clin. Invest. 28:265-272; 1949.
[12] Scarpa, M.; Viglino, P.; Contri, D.; Rigo, A. Generation of superoxide ion in human red
blood cell lysates. J. Biol. Chem. 259:10657-10659; 1984.
[13] Winterbourn, C. C.; Peskin, A. V.; Parsons-Mair, H. N. Thiol oxidase activity of
copper,zinc superoxide dismutase. J. Biol. Chem. 277:1906-1911; 2002.
[14] Scarpa, M.; Momo, F.; Viglino, P.; Vianello, F.; Rigo, A. Activated oxygen species in
the oxidation of glutathione - A kinetic study. Biophys. Chem. 60:53-61; 1996.
[15] Houk, J.; Singh, R.; Whitesides, G. M.; William B. Jakoby, O. W. G. Measurement of
thiol-disulfide interchange reactions and thiol pKa values. In: Jakoby, W. B.; Griffith, O. W.,
eds. Methods In Enzymology, Sulfur and Sulfur Amino Acids. Orlando, Florida: Academic Press;
1987: 129-140.
[16] Wilhelm, E.; Battino, R.; Wilcock, R. J. Low-pressure solubility of gases in liquid
water. Chem. Rev. 77:219-262; 1977. http://dx.doi.org/10.1021/cr60306a003.
[17] Hartz, J. W.; Funakoshi, S.; Deutsch, H. F. The levels of superoxide dismutase and
catalase in human tissues as determined immunochemically. Clin. Chim. Acta 46:125-132;
1973.
36
[18] Gaetani, G. F.; Galiano, S.; Canepa, L.; Ferraris, A. M.; Kirkman, H. N. Catalase and
glutathione peroxidase are equally active in detoxification of hydrogen peroxide in human
erythrocytes. Blood 73:334-339; 1989.
[19] Nicholls, P. Activity of catalase in the red cell. Biochim. Biophys. Acta 99:286-297;
1965.
[20] Aird, W. C. Spatial and temporal dynamics of the endothelium. J. Thromb. Haemost.
3:1392-1406; 2005. http://dx.doi.org/10.1111/j.1538-7836.2005.01328.x.
[21] Varma, S. D.; Devamanoharan, P. S. Hydrogen peroxide in human blood. Free Radic.
Res. Commun. 14:125-131; 1991.
[22] Lacy, F.; Connor, D. T.; Schmid, S. Plasma hydrogen peroxide production in
hypertensives and normotensive subjects at genetic risk of hypertension. J. Hypertens. 16:291-
303; 1998.
[23] Lacy, F.; Gough, D. A.; Schmid, S. Role of xanthine oxidase in hydrogen peroxide
production. Free Radic. Biol. Med. 25:720-727; 1998. http://dx.doi.org/10.1016/S0891-
5849(98)00154-3.
[24] Harkness, R. A.; Coade, S. B.; Webster, A. D. ATP, ADP and AMP in plasma from
peripheral venous blood. Clin. Chim. Acta 143:91-98; 1984.
[25] Kock, R.; Delvoux, B.; Greiling, H. A high-performance liquid chromatographic
method for the determination of hypoxanthine, xanthine, uric acid and allantoin in serum. Eur.
J. Clin. Chem. Clin. Biochem. 31:303-310; 1993.
[26] Radi, R.; Rubbo, H.; Bush, K.; Freeman, B. A. Xanthine oxidase binding to
glycosaminoglycans: Kinetics and superoxide dismutase interactions of immobilized xanthine
oxidase-heparin complexes. Arch. Biochem. Biophys. 339:125-135; 1997.
http://dx.doi.org/10.1006/abbi.1996.9844.
[27] Kudo, M.; Moteki, T.; Sasaki, T.; Konno, Y.; Ujiie, S.; Onose, A.; Mizugaki, M.;
Ishikawa, M.; Hiratsuka, M. Functional characterization of human xanthine oxidase allelic
variants. Pharmacogenet. Genomics 18:243-251; 2008.
http://dx.doi.org/10.1097/FPC.0b013e3282f55e2e.
[28] Liu, X. P.; Zweier, J. L. A real-time electrochemical technique for measurement of
cellular hydrogen peroxide generation and consumption: evaluation in human
polymorphonuclear leukocytes. Free Radic. Biol. Med. 31:894-901; 2001.
http://dx.doi.org/10.1016/S0891-5849(01)00665-7.
[29] Maddipati, K. R.; Gasparski, C.; Marnett, L. J. Characterization of the hydroperoxide-
reducing activity of human-plasma. Arch. Biochem. Biophys. 254:9-17; 1987.
http://dx.doi.org/10.1016/0003-9861(87)90075-0.
[30] Flohé, L.; Loschen, G.; Gunzler, W. A.; Eichele, E. Glutathione peroxidase, V. The
kinetic mechanism. Hoppe-Seyler's Z. Physiol. Chem. 353:987-999; 1972.
[31] Wolfram Research, I. Mathematica. Champaign, Illinois: Wolfram Research, Inc.; 2012.
[32] Takebe, G.; Yarimizu, J.; Saito, Y.; Hayashi, T.; Nakamura, H.; Yodoi, J.; Nagasawa,
S.; Takahashi, K. A comparative study on the hydroperoxide and thiol specificity of the
glutathione peroxidase family and selenoprotein P. J. Biol. Chem. 277:41254-41258; 2002.
http://dx.doi.org/10.1074/jbc.M202773200.
[33] Nicholls, P. Contributions of catalase and glutathione peroxidase to red cell peroxide
removal. Biochim. Biophys. Acta 279:306-309; 1972. http://dx.doi.org/10.1016/0304-
4165(72)90147-X.
[34] Paglia, D. E.; Valentine, W. N. Studies on quantitative and qualitative characterization
of erythrocyte glutathione peroxidase. J. Lab. Clin. Med. 70:158-169; 1967.
37
[35] Awasthi, Y. C.; Beutler, E.; Srivastava, S. K. Purification and properties of human
erythrocyte glutathione peroxidase. J. Biol. Chem. 250:5144-5149; 1975.
[36] Cho, C.-S.; Kato, G. J.; Yang, S. H.; Bae, S. W.; Lee, J. S.; Gladwin, M. T.; Rhee, S. G.
Hydroxyurea-induced expression of glutathione peroxidase 1 in red blood cells of individuals
with sickle cell anemia. Antioxid. Redox Signal. 13:1-11; 2010.
http://dx.doi.org/10.1089/ars.2009.2978.
[37] Cho, C. S.; Lee, S.; Lee, G. T.; Woo, H. A.; Choi, E. J.; Rhee, S. G. Irreversible
inactivation of glutathione peroxidase 1 and reversible inactivation of peroxiredoxin II by H2O2
in red blood cells. Antioxid. Redox Signal. 12:1235-1246; 2010.
http://dx.doi.org/10.1089/ars.2009.2701.
[38] Bonaventura, J.; Schroeder, W. A.; Fang, S. Human erythrocyte catalase: an improved
method of isolation and a reevaluation of reported properties. Arch. Biochem. Biophys. 150:606-
617; 1972.
[39] Ben, Y.; Shapira, E. Specific immunoassay for quantitative determination of human
erythrocyte catalase. J. Lab. Clin. Med. 81:133-139; 1973.
[40] Sies, H.; Bücher, T.; Oshino, N.; Chance, B. Heme occupancy of catalase in
hemoglobin-free perfused rat liver and of isolated rat liver catalase. Arch. Biochem. Biophys.
154:106-116; 1973.
[41] Chance, B.; Greenstein, D. S.; Roughton, F. J. W. The mechanism of catalase action. I.
Steady-state analysis. Arch. Biochem. Biophys. 37:301-321; 1952.
http://dx.doi.org/10.1016/0003-9861(52)90194-x.
[42] Hillar, A.; Nicholls, P.; Switala, J.; Loewen, P. C. NADPH binding and control of
catalase compound II formation: comparison of bovine, yeast, and Escherichia coli enzymes.
Biochem. J. 300:531-539; 1994.
[43] Kirkman, H. N.; Galiano, S.; Gaetani, G. F. The function of catalase-bound NADPH. J.
Biol. Chem. 262:660-666; 1987.
[44] Kirkman, H. N.; Rolfo, M.; Ferraris, A. M.; Gaetani, G. F. Mechanisms of protection of
catalase by NADPH. Kinetics and stoichiometry. J. Biol. Chem. 274:13908-13914; 1999.
http://dx.doi.org/10.1074/jbc.274.20.13908.
[45] Gaetani, G. F.; Ferraris, A. M.; Sanna, P.; Kirkman, H. N. A novel NADPH :(bound)
NADP(+) reductase and NADH :(bound) NADP(+) transhydrogenase function in bovine liver
catalase. Biochem. J. 385:763-768; 2005.
[46] Nicholls, P. The formation and catalytic role of catalase peroxide compound II.
Biochim. Biophys. Acta 81:479-495; 1964. http://dx.doi.org/10.1016/0926-6569(64)90133-6.
[47] Albrecht, V.; Roigas, H.; Schultze, M.; Jacobasch, G.; Rapoport, S. The influence of pH
and methylene blue on the pathways of glucose utilization and lactate formation in erythrocytes
of man. Eur. J. Biochem. 20:44-50; 1971. http://dx.doi.org/10.1111/j.1432-
1033.1971.tb01360.x.
[48] Shimizu, N.; Kobayashi, K.; Hayashi, K. The reaction of superoxide radical with
catalase. Mechanism of the inhibition of catalase by superoxide radical. J. Biol. Chem.
259:4414-4418; 1984.
[49] Lardinois, O. M. Reactions of bovine liver catalase with superoxide radicals and
hydrogen peroxide. Free Radic. Res. 22:251-274; 1995.
[50] Moore, R. B.; Mankad, M. V.; Shriver, S. K.; Mankad, V. N.; Plishker, G. A.
Reconstitution of Ca(2+)-dependent K+ transport in erythrocyte membrane vesicles requires a
cytoplasmic protein. J. Biol. Chem. 266:18964-18968; 1991.
38
[51] Peskin, A. V.; Low, F. M.; Paton, L. N.; Maghzal, G. J.; Hampton, M. B.; Winterbourn,
C. C. The high reactivity of peroxiredoxin 2 with H2O2 is not reflected in its reaction with other
oxidants and thiol reagents. J. Biol. Chem. 282:11885-11892; 2007.
http://dx.doi.org/10.1074/jbc.M700339200.
[52] Manta, B.; Hugo, M.; Ortiz, C.; Ferrer-Sueta, G.; Trujillo, M.; Denicola, A. The
peroxidase and peroxynitrite reductase activity of human erythrocyte peroxiredoxin 2. Arch.
Biochem. Biophys. 484:146-154; 2009. http://dx.doi.org/10.1016/j.abb.2008.11.017.
[53] Ogusucu, R.; Rettori, D.; Munhoz, D. C.; Netto, L. E. S.; Augusto, O. Reactions of
yeast thioredoxin peroxidases I and II with hydrogen peroxide and peroxynitrite: rate constants
by competitive kinetics. Free Radic. Biol. Med. 42:326-334; 2007.
http://dx.doi.org/10.1016/j.freeradbiomed.2006.10.042.
[54] Atkins, P. W. Physical chemistry. Oxford: Oxford University Press; 1994.
[55] van Stroe-Biezen, S. A. M.; Everaerts, F. M.; Janssen, L. J. J.; Tacken, R. A. Diffusion
coefficients of oxygen, hydrogen peroxide and glucose in a hydrogel. Anal. Chim. Acta
273:553-560; 1993. http://dx.doi.org/10.1016/0003-2670(93)80202-V.
[56] Fisher, A. B.; Dodia, C.; Manevich, Y.; Chen, J. W.; Feinstein, S. I. Phospholipid
hydroperoxides are substrates for non-selenium glutathione peroxidase. J. Biol. Chem.
274:21326-21334; 1999.
[57] Watson, W. H.; Pohl, J.; Montfort, W. R.; Stuchlik, O.; Reed, M. S.; Powis, G.; Jones,
D. P. Redox potential of human thioredoxin 1 and identification of a second dithiol/disulfide
motif. J. Biol. Chem. 278:33408-33415; 2003. http://dx.doi.org/10.1074/jbc.M211107200.
[58] Go, Y.-M.; Roede, J. R.; Walkers, D.; Duong, D. M.; Seyfried, N. T.; Orr, M.; Liang,
Y.; Pennell, K. D.; Jones, D. P. Selective targeting of the cysteine proteome by thioredoxin and
glutathione redox systems. Mol. Cell. Proteomics 12:3285-3296; 2013.
[59] Holmgren, A. Reduction of disulfides by thioredoxin. Exceptional reactivity of insulin
and suggested functions of thioredoxin in mechanism of hormone action. J. Biol. Chem.
254:9113-9119; 1979.
[60] Perez-Jimenez, R.; Li, J. Y.; Kosuri, P.; Sanchez-Romero, I.; Wiita, A. P.; Rodriguez-
Larrea, D.; Chueca, A.; Holmgren, A.; Miranda-Vizuete, A.; Becker, K.; Cho, S. H.; Beckwith,
J.; Gelhaye, E.; Jacquot, J. P.; Gaucher, E.; Sanchez-Ruiz, J. M.; Berne, B. J.; Fernandez, J. M.
Diversity of chemical mechanisms in thioredoxin catalysis revealed by single-molecule force
spectroscopy. Nat. Struct. Mol. Biol. 16:890-896; 2009. http://dx.doi.org/10.1038/nsmb.1627.
[61] Urig, S.; Lieske, J.; Fritz-Wolf, K.; Irmler, A.; Becker, K. Truncated mutants of human
thioredoxin reductase 1 do not exhibit glutathione reductase activity. FEBS Lett. 580:3595-
3600; 2006. http://dx.doi.org/10.1016/j.febslet.2006.05.038.
[62] Meplan, C.; Crosley, L. K.; Nicol, F.; Beckett, G. J.; Howie, A. F.; Hill, K. E.; Horgan,
G.; Mathers, J. C.; Arthur, J. R.; Hesketh, J. E. Genetic polymorphisms in the human
selenoprotein P gene determine the response of selenoprotein markers to selenium
supplementation in a gender-specific manner (the SELGEN study). FASEB J. 21:3063-3074;
2007. http://dx.doi.org/10.1096/fj.07-8166com.
[63] Turanov, A. A.; Su, D.; Gladyshev, V. N. Characterization of alternative cytosolic
forms and cellular targets of mouse mitochondrial thioredoxin reductase. J. Biol. Chem.
281:22953-22963; 2006. http://dx.doi.org/10.1074/jbc.M604326200.
[64] Gromer, S.; Arscott, L. D.; Williams, C. H.; Schirmer, R. H.; Becker, K. Human
placenta thioredoxin reductase. Isolation of the selenoenzyme, steady state kinetics, and
inhibition by therapeutic gold compounds. J. Biol. Chem. 273:20096-20101; 1998.
[65] Zhong, L. W.; Arner, E. S. J.; Holmgren, A. Structure and mechanism of mammalian
thioredoxin reductase: The active site is a redox-active selenolthiol/selenenylsulfide formed
39
from the conserved cysteine-selenocysteine sequence. Proc. Natl. Acad. Sci. U. S. A. 97:5854-
5859; 2000.
[66] Salvador, A.; Savageau, M. A. Quantitative evolutionary design of glucose 6-phosphate
dehydrogenase expression in human erythrocytes. Proc. Natl. Acad. Sci. U. S. A. 100:14463-
14468; 2003. http://dx.doi.org/10.1073/pnas.2335687100.
[67] Wagner, T. C.; Scott, M. D. Single extraction method for the spectrophotometric
quantification of oxidized and reduced pyridine-nucleotides in erythrocytes. Anal. Biochem.
222:417-426; 1994. http://dx.doi.org/10.1006/abio.1994.1511.
[68] Kirkman, H. N.; Gaetani, G. F. Regulation of glucose-6-phosphate dehydrogenase in
human erythrocytes. J. Biol. Chem. 261:4033-4038; 1986.
[69] Kirkman, H. N.; Gaetani, G. F. Catalase: a tetrameric enzyme with four tightly bound
molecules of NADPH. Proc. Natl. Acad. Sci. U. S. A. 81:4343-4347; 1984.
http://dx.doi.org/10.1073/pnas.81.14.4343.
[70] Canepa, L.; Ferraris, A. M.; Miglino, M.; Gaetani, G. F. Bound and unbound pyridine
dinucleotides in normal and glucose- 6-phosphate dehydrogenase-deficient erythrocytes.
Biochim. Biophys. Acta 1074:101-104; 1991.
[71] Salvador, A.; Savageau, M. A. Evolution of enzymes in a series is driven by dissimilar
functional demands. Proc. Natl. Acad. Sci. U. S. A. 103:2226-2231; 2006.
http://dx.doi.org/10.1073/pnas.0510776103.
[72] Wang, X. T.; Au, S. W. N.; Lam, V. M. S.; Engel, P. C. Recombinant human glucose-6-
phosphate dehydrogenase. Eur. J. Biochem. 269:3417-3424; 2002.
[73] Mulquiney, P. J.; Kuchel, P. W. Model of 2,3-bisphosphoglycerate metabolism in the
human erythrocyte based on detailed enzyme kinetic equations: equations and parameter
refinement. Biochem. J. 342:581-596; 1999.
[74] Hickey, T. M.; Uddin, D. E.; Kiesow, L. A. Measurement of Erythrocyte 2,3-
diphosphoglycerate with a centrifugal analyzer. Clin. Chem. 25:1314-1317; 1979.
[75] Jacob, H. S.; Ingbar, S. H.; Jandl, J. H. Oxidative hemolysis and erythrocyte metabolism
in hereditary acatalasia. J. Clin. Invest. 44:1187-1199; 1965.
http://dx.doi.org/10.1172/JCI105225.
[76] Matte, A.; Low, P. S.; Turrini, F.; Bertoldi, M.; Campanella, M. E.; Spano, D.; Pantaleo,
A.; Siciliano, A.; De Franceschi, L. Peroxiredoxin-2 expression is increased in beta-thalassemic
mouse red cells but is displaced from the membrane as a marker of oxidative stress. Free Radic.
Biol. Med. 49:457-466; 2010. http://dx.doi.org/10.1016/j.freeradbiomed.2010.05.003.
[77] Johnson, R. M.; Ho, Y.-S.; Yu, D.-Y.; Kuypers, F. A.; Ravindranath, Y.; Goyette, G. W.
The effects of disruption of genes for peroxiredoxin-2, glutathione peroxidase-1, and catalase on
erythrocyte oxidative metabolism. Free Radic. Biol. Med. 48:519-525; 2010.
http://dx.doi.org/10.1016/j.freeradbiomed.2005.07.002.
[78] Peskin, A. V.; Dickerhof, N.; Poynton, R. A.; Paton, L. N.; Pace, P. E.; Hampton, M.
B.; Winterbourn, C. C. Hyperoxidation of peroxiredoxins 2 and 3: Rate constants for the
reactions of the sulfenic acid of the peroxidatic cysteine. J. Biol. Chem. 288:14170-14177;
2013. http://dx.doi.org/10.1074/jbc.M113.460881.
[79] Du, Y.; Zhang, H.; Lu, J.; Holmgren, A. Glutathione and glutaredoxin act as a backup
of human thioredoxin reductase 1 to reduce thioredoxin 1 preventing cell death by
aurothioglucose. J. Biol. Chem. 287:38210-38219; 2012.
http://dx.doi.org/10.1074/jbc.M112.392225.
[80] Jones, D. P.; Helmut, S.; Lester, P. Redox potential of GSH/GSSG couple: Assay and
biological significance. In: Sies, H.; Packer, L., eds. Methods In Enzymology, Protein Sensors
40
and Reactive Oxygen Species - Part B: Thiol Enzymes and Proteins. San Diego, California:
Academic Press; 2002: 93-112. http://dx.doi.org/10.1016/S0076-6879(02)48630-2.
[81] Colombo, G.; Dalle-Donne, I.; Giustarini, D.; Gagliano, N.; Portinaro, N.; Colombo, R.;
Rossi, R.; Milzani, A. Cellular redox potential and hemoglobin S-glutathionylation in human
and rat erythrocytes: A comparative study. Blood Cells Mol. Dis. 44:133-139; 2010.
http://dx.doi.org/10.1016/j.bcmd.2009.11.005.
[82] Bao, J.; Furumoto, K.; Yoshimoto, M.; Fukunaga, K.; Nakao, K. Competitive inhibition
by hydrogen peroxide produced in glucose oxidation catalyzed by glucose oxidase. Biochem.
Eng. J. 13:69-72; 2003. http://dx.doi.org/10.1016/S1369-703X(02)00120-1.
[83] Bayer, S. B.; Maghzal, G.; Stocker, R.; Hampton, M. B.; Winterbourn, C. C.
Neutrophil-mediated oxidation of erythrocyte peroxiredoxin 2 as a potential marker of oxidative
stress in inflammation. FASEB J. 27:3315-3322; 2013. http://dx.doi.org/10.1096/fj.13-227298.
[84] Brown, W. D.; Mebine, L. B. Autoxidation of Oxymyoglobins. J. Biol. Chem.
244:6696-6701; 1969.
[85] Sobotta, M. C.; Barata, A. G.; Schmidt, U.; Mueller, S.; Millonig, G.; Dick, T. P.
Exposing cells to H2O2: a quantitative comparison between continuous low-dose and one-time
high-dose treatments. Free Radic. Biol. Med. 60:325-335; 2013.
Related Documents