This document was prepared in conjunction with work accomplished under Contract No. DE-AC09-96SR18500 with the U. S. Department of Energy. DISCLAIMER This report was prepared as an account of work sponsored by an agency of the United States Government. Neither the United States Government nor any agency thereof, nor any of their employees, nor any of their contractors, subcontractors or their employees, makes any warranty, express or implied, or assumes any legal liability or responsibility for the accuracy, completeness, or any third party's use or the results of such use of any information, apparatus, product, or process disclosed, or represents that its use would not infringe privately owned rights. Reference herein to any specific commercial product, process, or service by trade name, trademark, manufacturer, or otherwise, does not necessarily constitute or imply its endorsement, recommendation, or favoring by the United States Government or any agency thereof or its contractors or subcontractors. The views and opinions of authors expressed herein do not necessarily state or reflect those of the United States Government or any agency thereof.

Welcome message from author
This document is posted to help you gain knowledge. Please leave a comment to let me know what you think about it! Share it to your friends and learn new things together.
Transcript
This document was prepared in conjunction with work accomplished under Contract No. DE-AC09-96SR18500 with the U. S. Department of Energy.
DISCLAIMER This report was prepared as an account of work sponsored by an agency of the United States Government. Neither the United States Government nor any agency thereof, nor any of their employees, nor any of their contractors, subcontractors or their employees, makes any warranty, express or implied, or assumes any legal liability or responsibility for the accuracy, completeness, or any third party's use or the results of such use of any information, apparatus, product, or process disclosed, or represents that its use would not infringe privately owned rights. Reference herein to any specific commercial product, process, or service by trade name, trademark, manufacturer, or otherwise, does not necessarily constitute or imply its endorsement, recommendation, or favoring by the United States Government or any agency thereof or its contractors or subcontractors. The views and opinions of authors expressed herein do not necessarily state or reflect those of the United States Government or any agency thereof.
WSRC-MS-2005-00155
Hydrogen Permeation Resistant Coatings
Keywords: hydrogen permeation, stainless steels, coatings
Paul Korinko, Thad Adams, and Greggory Creech
Presented at Materials Science & Technology 2005 Pittsburg, PA, USA
September 25 – 28, 2005
This work was conducted for the US Department of Energy at Savannah River National Laboratory under
Contract DE-AC09-96SR18500.
Hydrogen Permeation Resistant Coatings
Paul Korinko, Thad Adams, and Gregory Creech
Savannah River National Laboratory, Aiken, SC 29808
Keywords: hydrogen permeation, stainless steels, coatings
Abstract
As the National Hydrogen Economy continues to develop and evolve the need for structural materials that can resist hydrogen assisted degradation will become critical. To date austenitic stainless steel materials have been shown to be mildly susceptible to hydrogen attack which results in lower mechanical and fracture strengths. As a result, hydrogen permeation barrier coatings may be applied to these ferrous alloys to retard hydrogen ingress. Hydrogen is known to be very mobile in materials of construction. In this study, the permeation resistance of bare stainless steel samples and coated stainless steel samples was tested. The permeation resistance was measured using a modular permeation rig using a pressure rise technique. The coating microstructure and permeation results will be discussed in this document as will some additional testing.
Introduction
With the resurgence of interest in the development of a national hydrogen economy a considerable increase in scientific exploration concerning hydrogen production and storage has occurred within the last five years. Numerous technologies including biomass production, high temperature electrolysis, thermochemical cycles, advanced gaseous storage tanks, chemical hydrides, and advanced metal hydrides are being developed to provide competitive alternatives to fossil fuel energy technologies. One issue for successful commercial implementation of these technologies is the ability of structural materials for process vessels and piping, storage containers, and engineered components to resist embrittlement from hydrogen.
Hydrogen embrittlement, hydrogen induced cracking, and hydrogen corrosion cracking have long been studied for a wide variety of materials and operating conditions [1-8]. NASA in 1997 performed a comprehensive review of hydrogen compatibility data of various materials as part of a safety analysis. From this review NASA developed a hydrogen materials compatability matrix that identified acceptable and unacceptable materials for hydrogen service environments.
A major structural component material for hydrogen service applications are austenitic stainless steels—304L, 316L, etc. These austenitic stainless steels have been previously shown to have a mild susceptibility to hydrogen embrittlement. However, this susceptibility can vary with changing environmental conditions--temperature, pressure, surface finish—and as such these materials are often coated with permeation barriers to minimize the potential impact from hydrogen exposure. Many
permeation barrier coating materials—Al, Al2O3, TiC, TiN, W, BN, Ni, Mo, Sn, H3PO4 glass, TiO2, Cr, Cr2O3--have been evaluated through the years [9]. These materials have shown permeation reductions that range from 10-10000X during laboratory testing. This variation is due to several factors such as the inherent permeation resistance of the coating material, surface preparation, coating microstructure, and application technique. Of the various permeation barrier materials studied, Al/Al2O3 structures have had the most commercial success and implementation—as diffused aluminide coatings-- and have shown permeation reduction factors on the order of 10000+. In previous applications, Al2O3 permeation barriers resulted from application techniques used to apply Al-rich coatings [10-12]. Aluminum rich coatings applied by either vapor deposition or packed bed technologies have been shown to possess inherent Al2O3 layers at their outermost surface. It has long been perceived that this outer 1-2µm of oxide provides the majority of the permeation resistance for these Al-rich coatings [10]. Additionally, much attention has been given to evaluating the permeation resistance of natively grown oxides on these austenitic stainless steel and Ni-base alloys. These oxides primarily consist of Fe2O3, Cr2O3, or spinel-Cr2MO4 (M= Ni, Fe, Co). Of these three surface oxides, Cr2O3 has been shown to be the most hydrogen/hydrogen isotope resistant reducing the permeation in some cases by up to 2-3 orders of magnitude.
As a result of the previously demonstrated successes of both Al2O3 and Cr2O3 with respect to hydrogen permeation resistance [13-15], this study was undertaken to test whether advanced aluminide coatings would have improved permeation resistance since they tend to form alpha alumina more readily and could confer improved permeation resistance on the material.
Experimental Approach
Coated samples were examined using optical microscopy and scanning electron microscopy (SEM). The coating chemistry was determined using Energy Dispersion Spectroscopy (EDS).
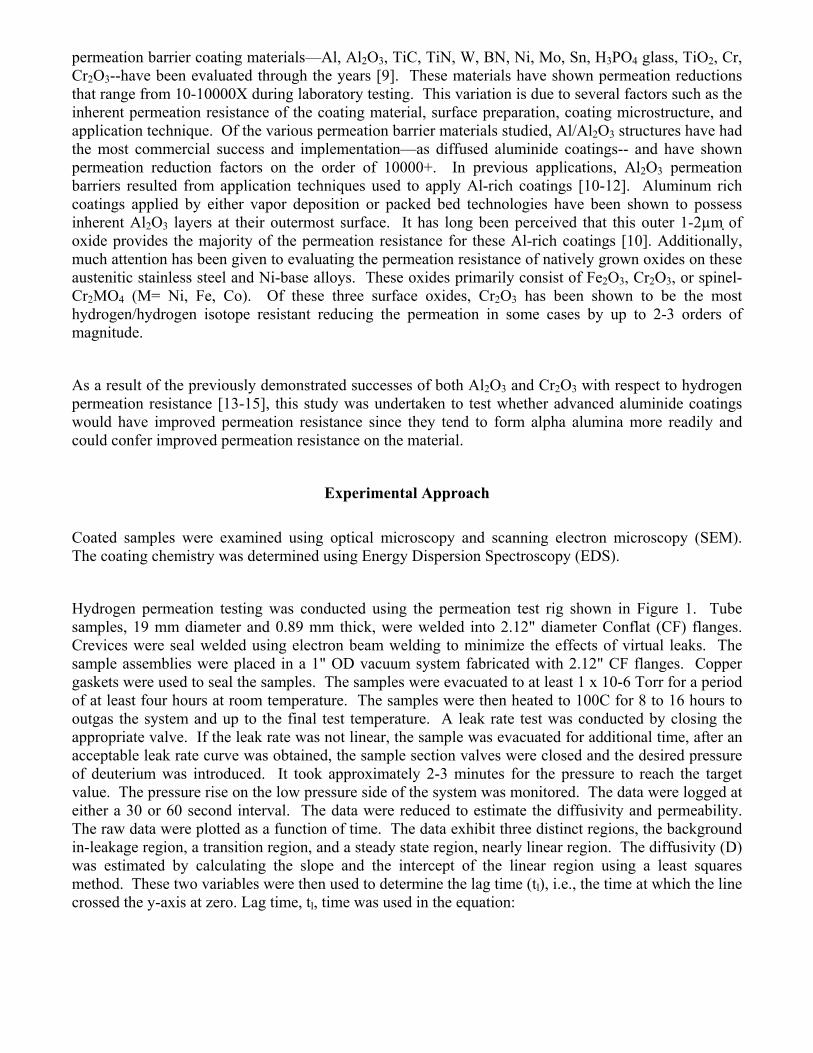
Hydrogen permeation testing was conducted using the permeation test rig shown in Figure 1. Tube samples, 19 mm diameter and 0.89 mm thick, were welded into 2.12" diameter Conflat (CF) flanges. Crevices were seal welded using electron beam welding to minimize the effects of virtual leaks. The sample assemblies were placed in a 1" OD vacuum system fabricated with 2.12" CF flanges. Copper gaskets were used to seal the samples. The samples were evacuated to at least 1 x 10⁻⁶ Torr for a period of at least four hours at room temperature. The samples were then heated to 100C for 8 to 16 hours to outgas the system and up to the final test temperature. A leak rate test was conducted by closing the appropriate valve. If the leak rate was not linear, the sample was evacuated for additional time, after an acceptable leak rate curve was obtained, the sample section valves were closed and the desired pressure of deuterium was introduced. It took approximately 2-3 minutes for the pressure to reach the target value. The pressure rise on the low pressure side of the system was monitored. The data were logged at either a 30 or 60 second interval. The data were reduced to estimate the diffusivity and permeability. The raw data were plotted as a function of time. The data exhibit three distinct regions, the background in-leakage region, a transition region, and a steady state region, nearly linear region. The diffusivity (D) was estimated by calculating the slope and the intercept of the linear region using a least squares method. These two variables were then used to determine the lag time (tl), i.e., the time at which the line crossed the y-axis at zero. Lag time, tl, time was used in the equation:
tl = x2 / 6 D (1)
to determine D. The permeability (Φ) was estimated from the slope (M) of the curve, the expansion volume (V), the sample area (A), and the test pressure (∆P) as shown in Eq. 2.
Φ = M * V * t / A √∆P (2)
The permeability is the product of the solubility (S) and the diffusivity as shown in Eq. 3.
Φ = S * D (3)
Pressure Control Valve
Sample Pressure Transducer
Control Pressure Transducer
Turbo Pump and Scroll Pump
Split Tube Furnace
D2 In
SV1
Manual metering valve
To Scroll Pump
Sample
Figure 1. Photograph and schematic of test rig
Results and Discussion
Coatings Tested
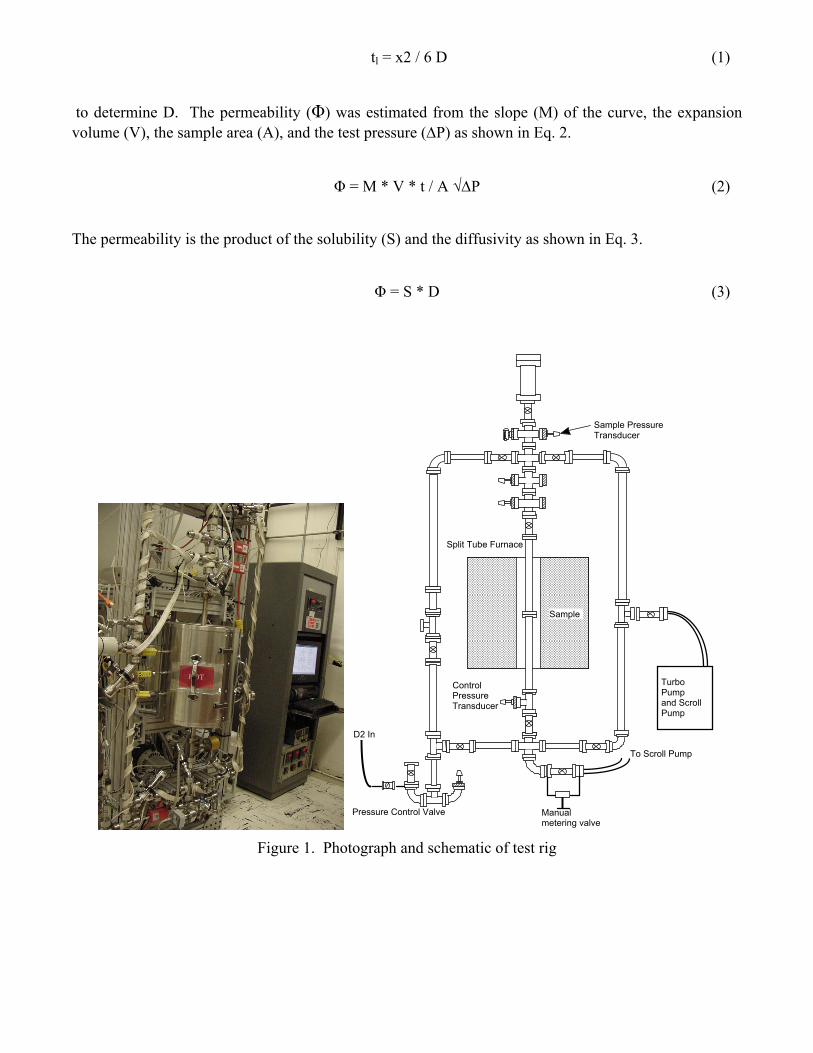
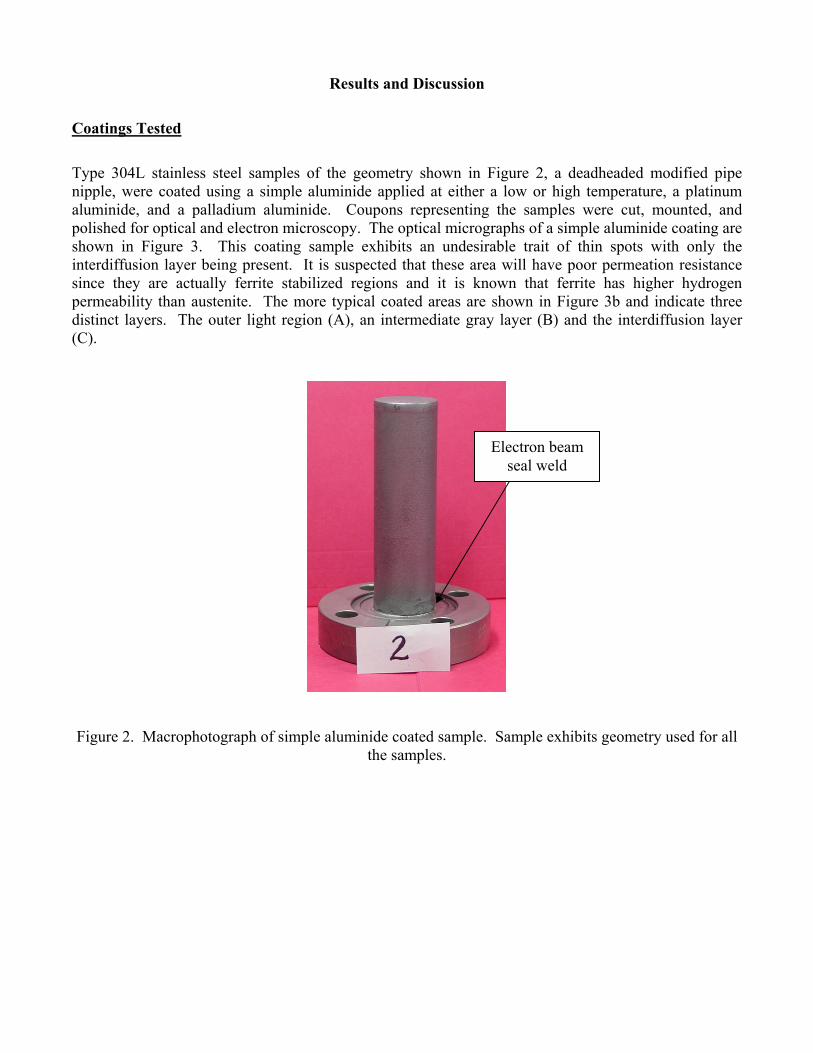
Type 304L stainless steel samples of the geometry shown in Figure 2, a deadheaded modified pipe nipple, were coated using a simple aluminide applied at either a low or high temperature, a platinum aluminide, and a palladium aluminide. Coupons representing the samples were cut, mounted, and polished for optical and electron microscopy. The optical micrographs of a simple aluminide coating are shown in Figure 3. This coating sample exhibits an undesirable trait of thin spots with only the interdiffusion layer being present. It is suspected that these area will have poor permeation resistance since they are actually ferrite stabilized regions and it is known that ferrite has higher hydrogen permeability than austenite. The more typical coated areas are shown in Figure 3b and indicate three distinct layers. The outer light region (A), an intermediate gray layer (B) and the interdiffusion layer (C).
Figure 2. Macrophotograph of simple aluminide coated sample. Sample exhibits geometry used for all the samples.
Electron beam seal weld
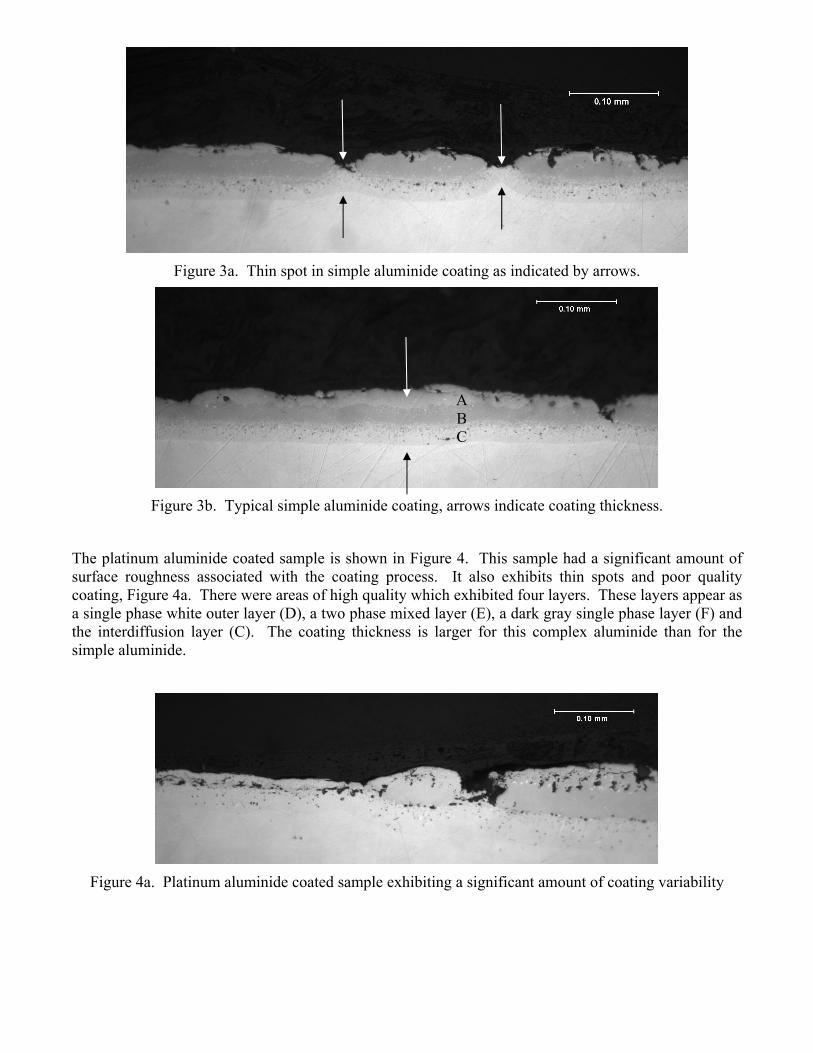
Figure 3a. Thin spot in simple aluminide coating as indicated by arrows.
Figure 3b. Typical simple aluminide coating, arrows indicate coating thickness.
The platinum aluminide coated sample is shown in Figure 4. This sample had a significant amount of surface roughness associated with the coating process. It also exhibits thin spots and poor quality coating, Figure 4a. There were areas of high quality which exhibited four layers. These layers appear as a single phase white outer layer (D), a two phase mixed layer (E), a dark gray single phase layer (F) and the interdiffusion layer (C). The coating thickness is larger for this complex aluminide than for the simple aluminide.
Figure 4a. Platinum aluminide coated sample exhibiting a significant amount of coating variability
A B C
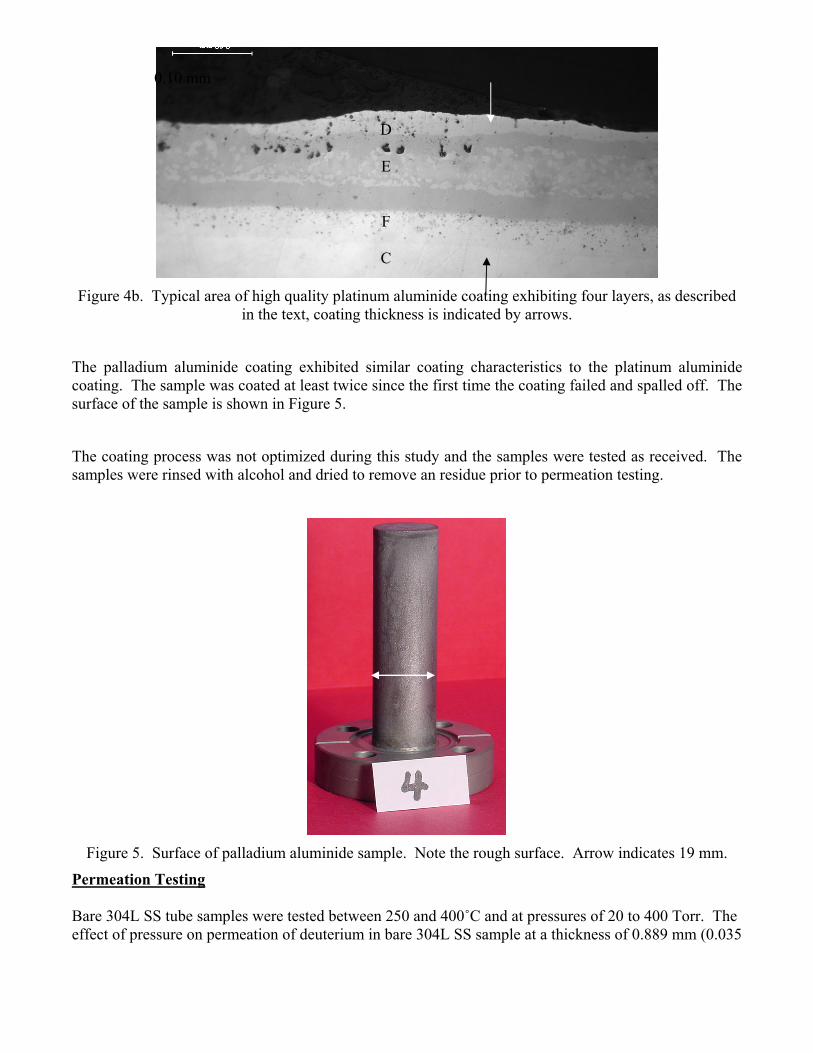
Figure 4b. Typical area of high quality platinum aluminide coating exhibiting four layers, as described
in the text, coating thickness is indicated by arrows.
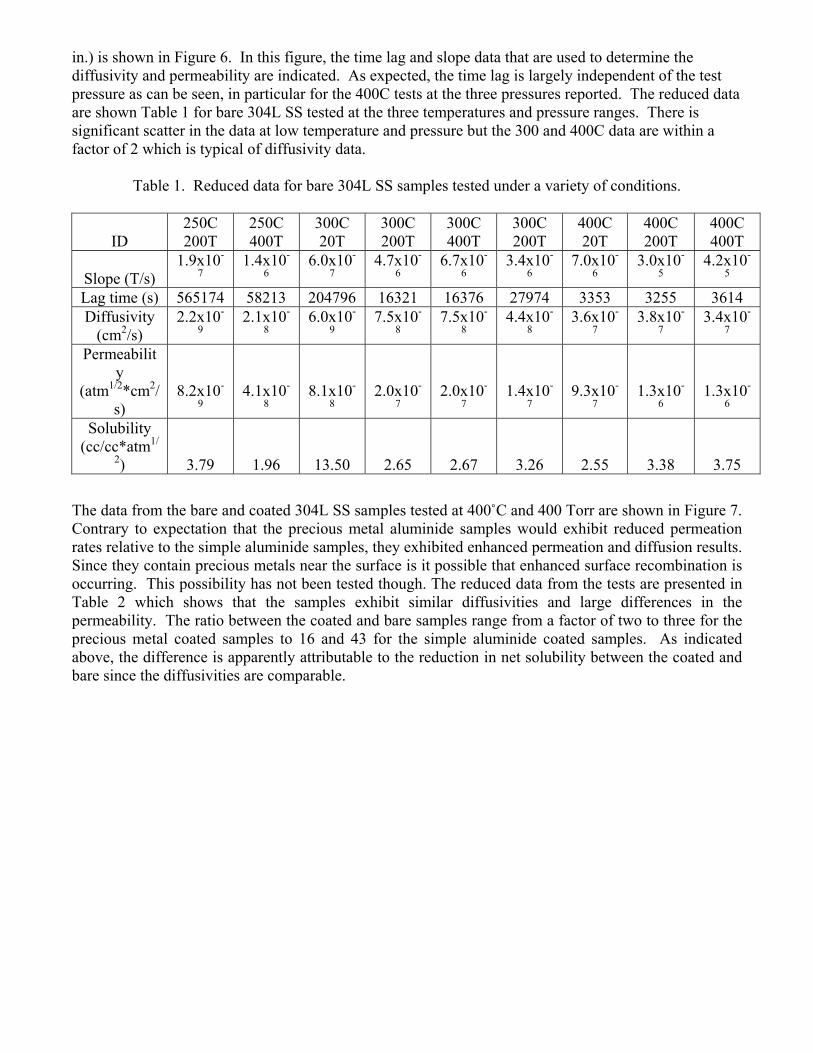
The palladium aluminide coating exhibited similar coating characteristics to the platinum aluminide coating. The sample was coated at least twice since the first time the coating failed and spalled off. The surface of the sample is shown in Figure 5.
The coating process was not optimized during this study and the samples were tested as received. The samples were rinsed with alcohol and dried to remove an residue prior to permeation testing.
Figure 5. Surface of palladium aluminide sample. Note the rough surface. Arrow indicates 19 mm.
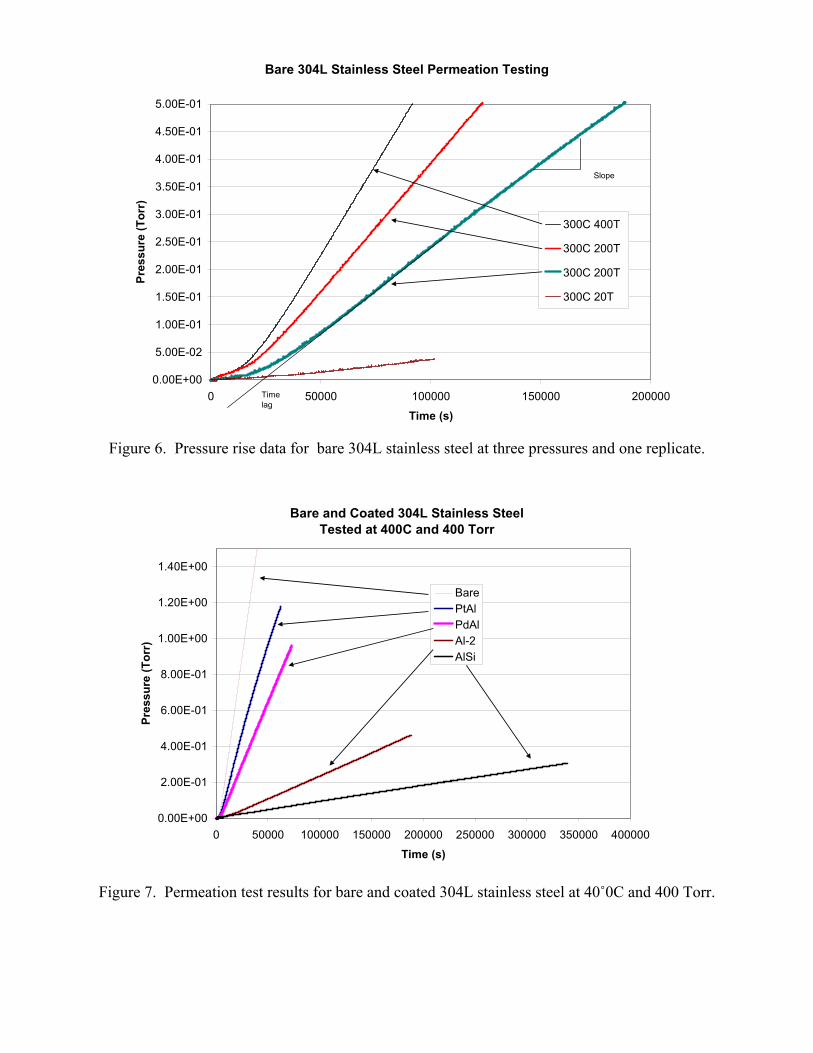
Permeation Testing Bare 304L SS tube samples were tested between 250 and 400˚C and at pressures of 20 to 400 Torr. The effect of pressure on permeation of deuterium in bare 304L SS sample at a thickness of 0.889 mm (0.035
0.10 mm
D
E
F
C
in.) is shown in Figure 6. In this figure, the time lag and slope data that are used to determine the diffusivity and permeability are indicated. As expected, the time lag is largely independent of the test pressure as can be seen, in particular for the 400C tests at the three pressures reported. The reduced data are shown Table 1 for bare 304L SS tested at the three temperatures and pressure ranges. There is significant scatter in the data at low temperature and pressure but the 300 and 400C data are within a factor of 2 which is typical of diffusivity data.
Table 1. Reduced data for bare 304L SS samples tested under a variety of conditions.
ID 250C 200T
250C 400T
300C 20T
300C 200T
300C 400T
300C 200T
400C 20T
400C 200T
400C 400T
Slope (T/s) 1.9x10-
7 1.4x10-
6 6.0x10-
7 4.7x10-
6 6.7x10-
6 3.4x10-
6 7.0x10-
6 3.0x10-
5 4.2x10-
5 Lag time (s) 565174 58213 204796 16321 16376 27974 3353 3255 3614 Diffusivity
(cm2/s) 2.2x10-
9 2.1x10-
8 6.0x10-
9 7.5x10-
8 7.5x10-
8 4.4x10-
8 3.6x10-
7 3.8x10-
7 3.4x10-
7 Permeabilit
y (atm1/2*cm2/
s) 8.2x10-
9 4.1x10-
8 8.1x10-
8 2.0x10-
7 2.0x10-
7 1.4x10-
7 9.3x10-
7 1.3x10-
6 1.3x10-
6 Solubility
(cc/cc*atm1/
2) 3.79 1.96 13.50 2.65 2.67 3.26 2.55 3.38 3.75
The data from the bare and coated 304L SS samples tested at 400˚C and 400 Torr are shown in Figure 7. Contrary to expectation that the precious metal aluminide samples would exhibit reduced permeation rates relative to the simple aluminide samples, they exhibited enhanced permeation and diffusion results. Since they contain precious metals near the surface is it possible that enhanced surface recombination is occurring. This possibility has not been tested though. The reduced data from the tests are presented in Table 2 which shows that the samples exhibit similar diffusivities and large differences in the permeability. The ratio between the coated and bare samples range from a factor of two to three for the precious metal coated samples to 16 and 43 for the simple aluminide coated samples. As indicated above, the difference is apparently attributable to the reduction in net solubility between the coated and bare since the diffusivities are comparable.
Bare 304L Stainless Steel Permeation Testing
0.00E+00
5.00E-02
1.00E-01
1.50E-01
2.00E-01
2.50E-01
3.00E-01
3.50E-01
4.00E-01
4.50E-01
5.00E-01
0 50000 100000 150000 200000
Time (s)
Pres
sure
(Tor
r)
300C 400T
300C 200T
300C 200T
300C 20T
Time lag
Slope
Figure 6. Pressure rise data for bare 304L stainless steel at three pressures and one replicate.
Bare and Coated 304L Stainless SteelTested at 400C and 400 Torr
0.00E+00
2.00E-01
4.00E-01
6.00E-01
8.00E-01
1.00E+00
1.20E+00
1.40E+00
0 50000 100000 150000 200000 250000 300000 350000 400000
Time (s)
Pres
sure
(Tor
r)
BarePtAlPdAlAl-2AlSi
Figure 7. Permeation test results for bare and coated 304L stainless steel at 40˚0C and 400 Torr.
Table 2. Reduced data for bare and coated 304L SS tested at 400˚C and 400 Torr.
ID Bare AlSi Al-2 PtAl PdAl
Slope (T/s) 4.2x10⁻⁵ 9.9x10-
7 2.5x10-
6 2.3x10-
5 1.4x10-
5 Lag time (s) 3614 1710 7167 4029 4075 Diffusivity
(cm2/s) 3.4x10⁻⁷ 7.2x10-
7 1.7x10-
7 3.0x10-
7 3.0x10-
7
Permeability (atm1/2*cm2/s) 1.3x10⁻⁶
3.0x10-
8 7.5x10-
8 6.9x10-
7 4.3x10-
7 Solubility
(cc/cc*atm1/2) 3.75 0.04 0.44 2.26 1.42 Ratio 1.00 42.82 16.98 1.85 2.97
Conclusions
The consistency of the precious metal coated 304L microstructure was poor. The coating exhibited some thin spots and some areas with up to four distinct layers. Permeation testing of bare 304L SS revealed rates consistent with previously published data, however, the permeability of the samples measured at lower temperatures exhibited more scatter in the data than desired. The composite permeability measured for the precious metal aluminide coated 304L samples was only slightly different than the measured permeability of the bare. The reason for the poor performance could be attributed to the inconsistent coating quality, the presence of more active surfaces for recombination of the monotonic hydrogen at the low pressure surface, etc. The simple aluminide coated samples exhibited lower composite permeability values by factors of 17 to 43. The diffusivity values for both bare and coated samples were similar. The calculated solubility was lower for the coated compared to the bare samples.
Acknowledgements
The authors would like to acknowledge metallography that was conducted by C. Foreman and D.Z.
Nelson.
We would also like to acknowledge the U.S. Department of Energy for support of this work under contract DE-AC09-96SR18500.
References
1. H. H. McCoy, Jr. USAEC Report ORNL-3600 June (1964).
2. M. R. Louthan, Jr., in Hydrogen in Metals, ASM, Metals Park, OH, p.53, (1964).
3. M. R. Louthan and A. H. Dexter, Metallurgical Transactions, 6A, 1655, (1975).
4. M. R. Louthan, G. R. Caskey, J. A. Donovan, and D. E. Rawl, Materials Science and Engineering, 10, 357, (1972).
5. M. Mohitpour and H. Solansky, Proceedings of ASME PVP Conference 2004, La Jolla, CA July 2004.
6. K. N. Ankhurst and T. J. Baker, Metallurgical Transactions, 12A, 1059-1070, (1981).
7. G. Yu, B. Jiang, and L. Qiao, Scripta Materialia, 36, 1467-1470, 1997.
8. D. Burwell, M. Brongiers, and J. Beavers, Proceedings of ASME PVP Conference 2004, La Jolla, CA, July, 2004.
9. G. W. Hollenberg, E. P. Simonen, G. Kalinin, and A. Terlain, Fusion Engineering and Design 28, 190-208, (1995).
10. K. Forcey, D. Ross, C. Wu, Journal of Nuclear Materials, 182, 36-51, (1991).
11. A. Perujo, E. Serra, H. Kolbe, and T. Sample, Journal of Nuclear Materials, 233-237, 1102-1106, (1996).
12. C. Fazio, K. Stein-Fechner, E. Serra, H, Glasbrenner, and G. Benamati, Journal of Nuclear Materials, 273, 233-238, (1999).
13. Y. Ishikawa, T. Yoshimura, and M. Arai, Vacuum, 47(6-8), 701-704, (1996).
14. W. Song, J. Du, Y. Xu, and B. Long, Journal of Nuclear Materials, 246, 139-143, (1997).
15. Y. Yamada-Takamura, F. Koch, H. Maier, and H. Bolt, Surface Coatings & Technology, 153, 114-118, (2002).
16. G. Betz, G. Wehner, L. Toth, and A. Joshi, Journal of Applied Physics, 45, 5312, (1974).
17. G. Hultquist and C. Leygraf, Materials Science and Engineering, 42, 199, (1980).
Related Documents