PHYSICAL REVIEW B 85, 165211 (2012) Hydrogen impurity in yttria: Ab initio and μSR perspectives E. L. Silva * and A. G. Marinopoulos Centro de Estudos de Materiais por Difracc ¸˜ ao de Raios-x (CEMDRX) and Center for Computational Physics, Department of Physics, University of Coimbra, P-3004-516 Coimbra, Portugal R. C. Vil˜ ao, R. B. L. Vieira, H. V. Alberto, J. Piroto Duarte, † and J. M. Gil Centro de Estudos de Materiais por Difracc ¸˜ ao de Raios-x (CEMDRX), Department of Physics, University of Coimbra, P-3004-516 Coimbra, Portugal (Received 23 January 2012; published 27 April 2012) The incorporation of interstitial hydrogen in yttria was studied by means of ab initio calculations based on density-functional theory (DFT) and muonium spin polarization spectroscopy (μSR). The density-functional calculations, based on a semilocal functional within the GGA-PBE and a hybrid functional, uncovered multiple geometrical configurations for the neutral, H 0 , and the negatively charged, H − , states of hydrogen, thus demonstrating the existence of metastable minimum-energy sites. It was observed that the low-energy configurations for H 0 and H − are similar: they prefer to relax in deep, interstitial sites, whereas the equilibrium configurations for the positively charged state, H + , were bond-type configurations with the hydrogen forming a covalent O-H bond with an O anion. For all neutral and negative configurations, localized defect levels were found inside the gap. Overall, the results for the formation energies obtained by the two different functionals are qualitatively similar; an amphoteric behavior was found for hydrogen after considering the lowest-energy structures for each charge state. The calculated acceptor transition level, obtained by the hybrid functional and seen near midgap, is consistent with μSR data from literature. The results are consistent with the present μSR data, where the observed diamagnetic signal is attributed to a donor-like muonium at the oxygen-bonded configurations and the paramagnetic signal to an acceptor-like deep muonium at the interstitial sites. DOI: 10.1103/PhysRevB.85.165211 PACS number(s): 61.72.−y, 71.55.−i, 71.15.Nc, 76.75.+i I. INTRODUCTION Yttria (Y 2 O 3 ) is a transition-metal oxide of the sesquioxide family, with a wide range of applications in ceramic mate- rials’ processing and as a host material for rare-earth-doped lasers. 1,2 It is also a candidate high dielectric constant (high-κ ) oxide to replace SiO 2 as the gate dielectric in metal-oxide- semiconductor devices. 3 High-κ oxides can serve as suitable replacements, since the thicker layer of the candidate oxide may exponentially decrease the tunneling currents arising from the reduction of the layer thickness of the SiO 2 gate dielectric, 3 while achieving the same level of capacitance as the devices of SiO 2 . 1 Y 2 O 3 is being considered as a suitable candidate for this purpose as it possesses relatively high dielectric constant (∼15) 3 and acts as an insulator with a 6-eV gap width, 3 which enables band offsets with respect to the adjoining Si semiconductor of over 1 eV, thus minimizing carrier injection into its bands by acting as barriers of potential. 3–5 This oxide is also thermodynamically stable in contact with Si, inhibiting the formation of thin insulating layers at the interface. 3 Y 2 O 3 is one of the few oxides epitaxially matched with the silicon lattice, therefore enabling a potentially low density of interface defects, 2,3 mainly attributed to oxygen related defects 6 that are responsible for device degradation due to trap carriers, threshold voltage instability and charge scattering in the semiconductor channel. 2,3,7 Considerable effort has been directed toward the study of defects in semiconductors and insulators and how these can affect device properties and reliability. 3,7 The interstitial hydrogen is most prominent among such defects, since it can be unintentionally incorporated during the growth or the processing of the material. 8 It is well known that interstitial hydrogen exhibits complex behaviors when introduced in materials. 9 Hydrogen can interact with other dopants, as happens for example in Ge, where hydrogen is found to counteract electrical defects and activate neutral impurities. 10 Hydrogen is also used to passivate the dangling bonds at the SiO 2 /Si interface. 11 In many other materials (as happens for example in GaN, where H 0 is never the lowest-energy state and a negative-U system is obtained) hydrogen acts as a deep, amphoteric impurity, which always counteracts the prevailing conductivity. 12 Hydrogen can also behave as a donor dopant, for instance in ZnO, 8,12,13 enabling a shallow defect level close to the conduction band. These findings motivate the research of the hydrogen behavior in other semiconductors and oxides, where it can influence the electrical properties. 8 The dominant native ionic defects in Y 2 O 3 are O interstitials and vacancies and it has been observed that undoped Y 2 O 3 is a p conductor at high O 2 pressure. 14,15 The p conductivity usually decreases when the H 2 O pressure increases, going from electronic to an ionic conductor due to the compensation of positively charged hydrogen impurities, mainly occurring as interstitial protons and/or hydroxide ions. 14,15 Therefore, when samples are exposed to hydrogen-containing gas and/or high water-vapor pressures, at low temperatures, hydrogen impurities have to be taken into account, 14,15 for these will dominate the ionic conductivity. 14,15 Since hydrogen defects are very difficult to study exper- imentally, because hydrogen possesses high mobility and tends to pair with other defects, 16 μSR spectroscopy has become the standard technique to study isolated hydrogen in materials. 8,9,13,17 This technique exploits the rotation, relaxation and resonance of the spin of implanted muons and uses muonium, an electron bound to a positive muon, as a 165211-1 1098-0121/2012/85(16)/165211(14) ©2012 American Physical Society

Welcome message from author
This document is posted to help you gain knowledge. Please leave a comment to let me know what you think about it! Share it to your friends and learn new things together.
Transcript
PHYSICAL REVIEW B 85, 165211 (2012)
Hydrogen impurity in yttria: Ab initio and μSR perspectives
E. L. Silva* and A. G. MarinopoulosCentro de Estudos de Materiais por Difraccao de Raios-x (CEMDRX) and Center for Computational Physics, Department of Physics,
University of Coimbra, P-3004-516 Coimbra, Portugal
R. C. Vilao, R. B. L. Vieira, H. V. Alberto, J. Piroto Duarte,† and J. M. GilCentro de Estudos de Materiais por Difraccao de Raios-x (CEMDRX), Department of Physics, University of Coimbra,
P-3004-516 Coimbra, Portugal(Received 23 January 2012; published 27 April 2012)
The incorporation of interstitial hydrogen in yttria was studied by means of ab initio calculations based ondensity-functional theory (DFT) and muonium spin polarization spectroscopy (μSR). The density-functionalcalculations, based on a semilocal functional within the GGA-PBE and a hybrid functional, uncoveredmultiple geometrical configurations for the neutral, H0, and the negatively charged, H−, states of hydrogen,thus demonstrating the existence of metastable minimum-energy sites. It was observed that the low-energyconfigurations for H0 and H− are similar: they prefer to relax in deep, interstitial sites, whereas the equilibriumconfigurations for the positively charged state, H+, were bond-type configurations with the hydrogen forminga covalent O-H bond with an O anion. For all neutral and negative configurations, localized defect levels werefound inside the gap. Overall, the results for the formation energies obtained by the two different functionalsare qualitatively similar; an amphoteric behavior was found for hydrogen after considering the lowest-energystructures for each charge state. The calculated acceptor transition level, obtained by the hybrid functionaland seen near midgap, is consistent with μSR data from literature. The results are consistent with the presentμSR data, where the observed diamagnetic signal is attributed to a donor-like muonium at the oxygen-bondedconfigurations and the paramagnetic signal to an acceptor-like deep muonium at the interstitial sites.
DOI: 10.1103/PhysRevB.85.165211 PACS number(s): 61.72.−y, 71.55.−i, 71.15.Nc, 76.75.+i
I. INTRODUCTION
Yttria (Y2O3) is a transition-metal oxide of the sesquioxidefamily, with a wide range of applications in ceramic mate-rials’ processing and as a host material for rare-earth-dopedlasers.1,2 It is also a candidate high dielectric constant (high-κ)oxide to replace SiO2 as the gate dielectric in metal-oxide-semiconductor devices.3 High-κ oxides can serve as suitablereplacements, since the thicker layer of the candidate oxidemay exponentially decrease the tunneling currents arising fromthe reduction of the layer thickness of the SiO2 gate dielectric,3
while achieving the same level of capacitance as the devicesof SiO2.1 Y2O3 is being considered as a suitable candidate forthis purpose as it possesses relatively high dielectric constant(∼15)3 and acts as an insulator with a 6-eV gap width,3
which enables band offsets with respect to the adjoining Sisemiconductor of over 1 eV, thus minimizing carrier injectioninto its bands by acting as barriers of potential.3–5 This oxideis also thermodynamically stable in contact with Si, inhibitingthe formation of thin insulating layers at the interface.3 Y2O3
is one of the few oxides epitaxially matched with the siliconlattice, therefore enabling a potentially low density of interfacedefects,2,3 mainly attributed to oxygen related defects6 thatare responsible for device degradation due to trap carriers,threshold voltage instability and charge scattering in thesemiconductor channel.2,3,7
Considerable effort has been directed toward the studyof defects in semiconductors and insulators and how thesecan affect device properties and reliability.3,7 The interstitialhydrogen is most prominent among such defects, since itcan be unintentionally incorporated during the growth or theprocessing of the material.8 It is well known that interstitial
hydrogen exhibits complex behaviors when introduced inmaterials.9 Hydrogen can interact with other dopants, ashappens for example in Ge, where hydrogen is found tocounteract electrical defects and activate neutral impurities.10
Hydrogen is also used to passivate the dangling bonds at theSiO2/Si interface.11 In many other materials (as happens forexample in GaN, where H0 is never the lowest-energy stateand a negative-U system is obtained) hydrogen acts as a deep,amphoteric impurity, which always counteracts the prevailingconductivity.12 Hydrogen can also behave as a donor dopant,for instance in ZnO,8,12,13 enabling a shallow defect level closeto the conduction band. These findings motivate the researchof the hydrogen behavior in other semiconductors and oxides,where it can influence the electrical properties.8
The dominant native ionic defects in Y2O3 are O interstitialsand vacancies and it has been observed that undoped Y2O3 isa p conductor at high O2 pressure.14,15 The p conductivityusually decreases when the H2O pressure increases, goingfrom electronic to an ionic conductor due to the compensationof positively charged hydrogen impurities, mainly occurringas interstitial protons and/or hydroxide ions.14,15 Therefore,when samples are exposed to hydrogen-containing gas and/orhigh water-vapor pressures, at low temperatures, hydrogenimpurities have to be taken into account,14,15 for these willdominate the ionic conductivity.14,15
Since hydrogen defects are very difficult to study exper-imentally, because hydrogen possesses high mobility andtends to pair with other defects,16 μSR spectroscopy hasbecome the standard technique to study isolated hydrogenin materials.8,9,13,17 This technique exploits the rotation,relaxation and resonance of the spin of implanted muons anduses muonium, an electron bound to a positive muon, as a
165211-11098-0121/2012/85(16)/165211(14) ©2012 American Physical Society
E. L. SILVA et al. PHYSICAL REVIEW B 85, 165211 (2012)
pseudoisotope of hydrogen.18,19 The short lifetime (2.2 μs)of the implanted positive muonium is reflected on the shorttime-scale measurements performed under nonequilibriumconditions and allows the observation of the isolated defectcenters that are responsible for the electrical activity ofhydrogen.17,20,21 Although the muon is only one ninth the massof the proton, the reduced mass of muonium is 99.6% of thatof hydrogen, so that the respective electronic properties arebasically the same in both atoms.20 μSR spectroscopy has alsothe advantage of being sensitive to both neutral (paramagnetic)and charged (electronically diamagnetic) states of muoniumand of being able to distinguish deep22 and shallow centers.16,23
Thus, extensive studies have already been carried out to verifywhether deep muonium (resembling the atom-like localizedstate of hydrogen) or shallow-donor muonium are formedin different semiconductors and oxides, hence providing areasonably good comparison to whether hydrogen behavesas a deep or shallow impurity, respectively.17,18,22–26 Amongthese materials is Y2O3 where Cox et al.18 have predicted thecoexistence of deep muonium with the extended orbitals of ashallow-donor state. It was suggested from indirect evidencethat the two states coexist at low temperatures and that deepmuonium can also persist above room temperatures, enablingan acceptor level near midgap at 2.5 ± 1.5 eV18 above thevalence-band maximum (VBM).
The present ab initio study was focused on density-functional theory (DFT) calculations by employing bothsemilocal and hybrid nonlocal functionals, for hydrogen inthe Y2O3 lattice. We determined the minimum-energy sites ofthe hydrogen impurity for all its different charge states (H+,H−, and H0). Our aim was to obtain not only the lowest-energyconfigurations of hydrogen but also higher-energy metastablestructures with different geometrical configurations. The for-mation energies were also calculated to study the behaviorthat hydrogen exhibits in Y2O3 for the different geometricalconfigurations in order to compare to nonequilibrium μSRmeasurements that can access these higher-energy states.The position of the defect energy levels in the band gapwere also evaluated, as well as the charge isosurfaces ofthe neutral paramagnetic systems in order to provide a moredetailed information regarding the nature and localization ofthe impurity states.
Due to the highly reasonable description of the structuralparameters with respect to experimental data and to smallercomputational cost, ab initio calculations in solids are gener-ally carried out by applying local and semilocal functionalsof the exchange and correlation, although it is well knownthat these type of functionals provide poor accuracy of theenergy band gaps of materials.27,28 Therefore, new levels oftheory are needed in order to overcome these uncertainties andhence attain more accurate results. For solid-state systems, thehybrid screened Heyd-Scuseria-Ernzerhof (HSE)29 functionalproved to give very good results for oxides, where the structuralparameters result in better agreement with experiment than theresults evaluated by employing the local density approximation(LDA) and the gradient generalized approximation (GGA)functionals.27,30–37 Calculations based on this level of theoryfor the hydrogen impurity in Y2O3 are lacking and as such thepresent work provides accurate theoretical results to comparewith the μSR data.
In the μSR experiments reported here, positive muons wereimplanted in a polycrystalline Y2O3 sample and conventionaltransverse-field measurements19 were undertaken from liquid-helium temperature up to room temperature. We were able tofollow directly the deep muonium state with high-resolutionmeasurements at the Paul Scherrer Institut in Switzerland.The discussion of results is intended to be developed takinginto account the comparison between the theoretical and theexperimental data.
In Sec. II the theoretical and experimental methodologiesare introduced. In Sec. II A, the description of the theoreticalframework, including the requirements for the numericalaccuracy of the calculations and the formation energies ofinterstitial hydrogen are included. In Sec. II B the conditionsand settings of the μSR measurements and apparatus aredescribed. In Sec. III the results from theory and experimentare presented in detail and comparisons are made betweensimilarities encountered throughout the work.
II. THEORETICAL AND EXPERIMENTALMETHODOLOGIES
A. Theoretical method and bulk-crystal calculations
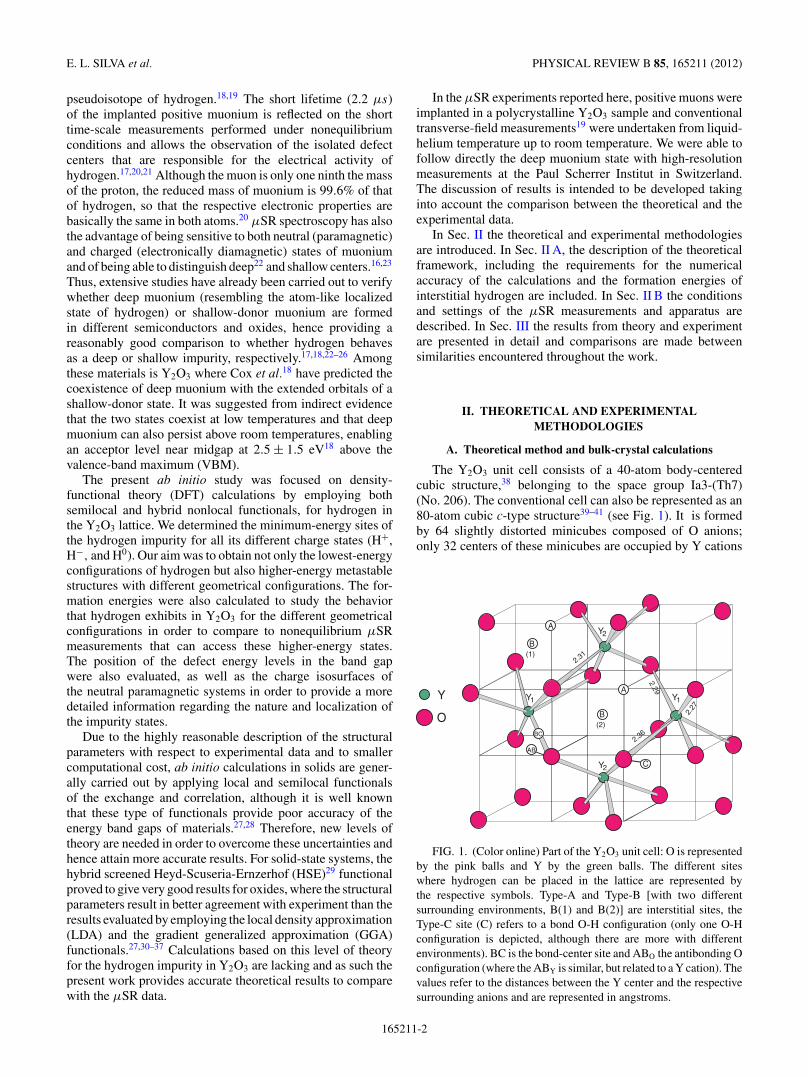
The Y2O3 unit cell consists of a 40-atom body-centeredcubic structure,38 belonging to the space group Ia3-(Th7)(No. 206). The conventional cell can also be represented as an80-atom cubic c-type structure39–41 (see Fig. 1). It is formedby 64 slightly distorted minicubes composed of O anions;only 32 centers of these minicubes are occupied by Y cations
2.29
2.36
2.27
Y1
Y2
Y2
Y1
O
Y
B
B
A
A
BC
AB
C
(1)
(2)
2.31
FIG. 1. (Color online) Part of the Y2O3 unit cell: O is representedby the pink balls and Y by the green balls. The different siteswhere hydrogen can be placed in the lattice are represented bythe respective symbols. Type-A and Type-B [with two differentsurrounding environments, B(1) and B(2)] are interstitial sites, theType-C site (C) refers to a bond O-H configuration (only one O-Hconfiguration is depicted, although there are more with differentenvironments). BC is the bond-center site and ABO the antibonding Oconfiguration (where the ABY is similar, but related to a Y cation). Thevalues refer to the distances between the Y center and the respectivesurrounding anions and are represented in angstroms.
165211-2

HYDROGEN IMPURITY IN YTTRIA: AB INITIO . . . PHYSICAL REVIEW B 85, 165211 (2012)
TABLE I. Values of the internal parameters, lattice constant, bulk modulus, and energy band gap obtained from the GGA-PBE and HSE06present calculations for the Y2O3 lattice and compared with other theoretical and experimental data.
u x y z a0 (A) B (GPa) Egap (eV)
GGA-PBE (PAW)a –0.0326 0.3913 0.1519 0.3795 10.706 136.111 4.13HSE06 (PAW)a –0.0326 0.3914 0.1518 0.3795 10.623 151.238 5.95LDA (PAW)53 –0.0326 0.3907 0.1514 0.3797 10.515 – 4.00GGA (PAW)53 –0.0327 0.3908 0.1516 0.3799 10.700 – 4.00GGA-PW92 (PAW)2 –0.0324 0.3908 0.1515 0.3798 10.700 150.000 4.10Exp.4,38,50 –0.0314 0.3890 0.1500 0.3770 10.604 150.000 6.00
aPresent calculations.
(the centers of the empty minicubes are structural vacant Ysites, denoted as Type-B sites). The structure has two differentcation sites, Y1 and Y2; Y1 is at the 8b site and Y2 at the24d site (see Fig. 1). The anions are at the 48e sites. Only sixanions occupy eight of the corners of the minicubes, enablingan octahedral coordination for the cations.2,39,42 The emptycorners are therefore structural vacant O sites and are denotedas Type-A sites.2,39,42 For the Y2-centered minicubes, three Oions are at one face of the cube, and the other three are atthe opposite face, all of the six anions being equally distancedfrom the cation center. The Y1-centered minicubes have fourO ions at one face and the other two at the opposite face; thedistance between the anions and the respective cation centeroccurs with three different paired distances (Fig. 1).42
In the present study, the DFT calculations were performedby employing the generalized gradient approximation (GGA)with the Perdew, Burke, and Enzerhof (PBE) parametrization43
and the Heyd-Scuseria-Ernzerhof (HSE06)29 hybrid func-tional. The two referenced functionals are implemented in theVienna Ab Initio Simulation Package (VASP)44–46 code, whichperforms electronic structure calculations by employing plane-wave basis sets to expand the Kohn-Sham wave functions,thus taking advantage of the periodicity of extended systems.In order to represent the valence and semicore states thatenter the chemical binding of the system projector augmentedwave (PAW) pseudopotentials47,48 were used (Y configuration:4s24p65s24d1 and O configuration: 2s22p4).
Within the HSE06 hybrid-functional scheme the resultingexpression for the exchange and correlation energy is
EHSExc = αEHF,SR
x (μ) + (1 − α)EPBE,SRx (μ)
+ EPBE,LRx (μ) + EPBE
c (1)
where EPBEc is the PBE correlation energy and EPBE
x the PBEexchange energy. Assuming a dependency on a screenedCoulomb potential, SR and LR denote the short- and long-range exchange energies, respectively. μ is the screeningparameter and is chosen to be 0.2 A−1 for the HSE06functional.27 α is the mixing fraction of the exact exchange andin the present study for yttria it was taken to be 30% in orderto match the calculated band-gap energy [equal to 5.95 eV(see Fig. 2)] to the experimental value of ∼6 eV found byphotoemission and internal photoemission spectroscopy.4
Convergence tests and full structural relaxations werecarried out for the bulk Y2O3 lattice against different valuesof the plane-wave cutoff energy and the Brillouin zone (BZ)
sampling, for the two functionals. Within GGA-PBE, whenemploying a plane-wave cutoff energy of 450 eV and an
FIG. 2. (Color online) Band structure and density of states ofY2O3. The upper plot is evaluated using the GGA-PBE functional,where it can be observed that this structure has a direct energy gap of4.13 eV. The lower plot refers to the HSE06 calculations where theincrease of the gap width up to 5.95 eV is well noticed.
165211-3
E. L. SILVA et al. PHYSICAL REVIEW B 85, 165211 (2012)
automatic mesh of 4 × 4 × 4 Monkhorst-Pack grids49 (toevaluate the total energies and the structural lattice relaxations)the lattice parameter of 10.706 A was obtained, ∼1% higherthan the experimental value of 10.604 A.50 Due to this increasewe therefore observe an underestimation of the bulk modu-lus, with 136.111 ± 0.280 GPa obtained by using a Birch-Murningham equation of state fit, against the experimentalvalue of 150 GPa50 (deduced from compressive measurementson densified polycrystalline samples). The low value of thebulk modulus (theoretical and experimental) indicates theexistence of soft bonds and, comparing to other results fromGGA-PBE calculations performed on other sesquioxides, it isobserved that these are of the same order of magnitude (127GPa for La2O3,51 154 GPa for Lu2O3
52). Results obtained fromthe present GGA-PBE calculations are summarized in Table Iand are compared to other DFT results and experimental datafor Y2O3.
To sample the BZ for the density of states (DOS), andtherefore obtain a high-quality DOS, an automatic 6 × 6 × 6�-point-centered mesh was chosen for the GGA-PBE func-tional calculations.
To determine how the partial occupancies fnk are setfor each orbital, Gaussian smearing was applied, with thesmearing width fixed at 0.2 eV. For the DOS calculationsthe tetrahedron method with Blochl corrections was used,employing the same order of smearing width.
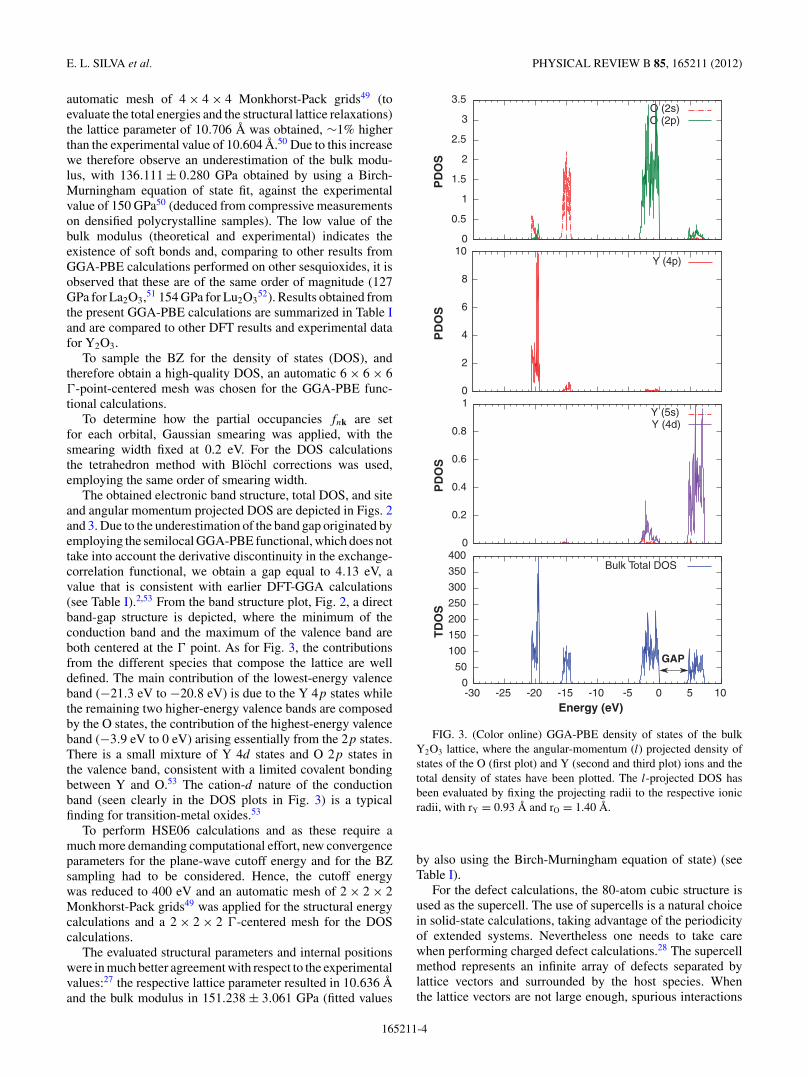
The obtained electronic band structure, total DOS, and siteand angular momentum projected DOS are depicted in Figs. 2and 3. Due to the underestimation of the band gap originated byemploying the semilocal GGA-PBE functional, which does nottake into account the derivative discontinuity in the exchange-correlation functional, we obtain a gap equal to 4.13 eV, avalue that is consistent with earlier DFT-GGA calculations(see Table I).2,53 From the band structure plot, Fig. 2, a directband-gap structure is depicted, where the minimum of theconduction band and the maximum of the valence band areboth centered at the � point. As for Fig. 3, the contributionsfrom the different species that compose the lattice are welldefined. The main contribution of the lowest-energy valenceband (−21.3 eV to −20.8 eV) is due to the Y 4p states whilethe remaining two higher-energy valence bands are composedby the O states, the contribution of the highest-energy valenceband (−3.9 eV to 0 eV) arising essentially from the 2p states.There is a small mixture of Y 4d states and O 2p states inthe valence band, consistent with a limited covalent bondingbetween Y and O.53 The cation-d nature of the conductionband (seen clearly in the DOS plots in Fig. 3) is a typicalfinding for transition-metal oxides.53
To perform HSE06 calculations and as these require amuch more demanding computational effort, new convergenceparameters for the plane-wave cutoff energy and for the BZsampling had to be considered. Hence, the cutoff energywas reduced to 400 eV and an automatic mesh of 2 × 2 × 2Monkhorst-Pack grids49 was applied for the structural energycalculations and a 2 × 2 × 2 �-centered mesh for the DOScalculations.
The evaluated structural parameters and internal positionswere in much better agreement with respect to the experimentalvalues:27 the respective lattice parameter resulted in 10.636 Aand the bulk modulus in 151.238 ± 3.061 GPa (fitted values
GAP
0
50
100
150
200
250
300
350
400
-30 -25 -20 -15 -10 -5 0 5 10
TD
OS
Energy (eV)
Bulk Total DOS
0
0.2
0.4
0.6
0.8
1
PD
OS
Y (5s)Y (4d)
0
2
4
6
8
10
PD
OS
Y (4p)
0
0.5
1
1.5
2
2.5
3
3.5
PD
OS
O (2s)O (2p)
FIG. 3. (Color online) GGA-PBE density of states of the bulkY2O3 lattice, where the angular-momentum (l) projected density ofstates of the O (first plot) and Y (second and third plot) ions and thetotal density of states have been plotted. The l-projected DOS hasbeen evaluated by fixing the projecting radii to the respective ionicradii, with rY = 0.93 A and rO = 1.40 A.
by also using the Birch-Murningham equation of state) (seeTable I).
For the defect calculations, the 80-atom cubic structure isused as the supercell. The use of supercells is a natural choicein solid-state calculations, taking advantage of the periodicityof extended systems. Nevertheless one needs to take carewhen performing charged defect calculations.28 The supercellmethod represents an infinite array of defects separated bylattice vectors and surrounded by the host species. Whenthe lattice vectors are not large enough, spurious interactions
165211-4
HYDROGEN IMPURITY IN YTTRIA: AB INITIO . . . PHYSICAL REVIEW B 85, 165211 (2012)
can take place from the nearby copies of the defect thusleading to systematic errors. In the case of charged defects,a neutralizing background charge had to be introduced inorder to cancel electrostatic divergences. The electrostaticinteraction between the defect cell and its periodic images canlead to slow convergence with respect to the supercell size.28
Image corrections based on multipole expansion were thusadded (up to the monopole-quadrupole interaction) to the totalenergies of the charged systems. The calculated correctionswere found to be between the range of 0.13 eV to 0.15 eV, forthe GGA-PBE and, for the hybrid calculations these were ofthe order of 0.10 eV to 0.14 eV.
The formation energies were evaluated in order to obtainthe properties of hydrogen in the host material. The formationenergy of interstitial hydrogen is defined as the energyneeded to incorporate this impurity in the host lattice andis calculated by taking into account hydrogen in a chargestate q = {−1, 0, +1} by following the procedure fromRefs. 9, 12, 54, and 55:
Eform(Hq) = Etot(Hq) − Etot(bulk) − 1
2 Etot(H2)
+ q(EF + EVBM + �V ). (2)
Etot(Hq) is the total energy of the supercell with thehydrogen impurity of charge q, Etot(bulk) is the total energyof the bulk supercell and 1
2 Etot(H2) is the reference energy forhydrogen that is given by an H2 molecule at T = 054 (thoughthis could be generalized by including a term for the chemicalpotential of hydrogen).56 The Fermi level, EF, is referenced tothe valence-band maximum of the bulk supercell, EVBM. �V
denotes a correction term that aligns the average electrostaticpotential of the defect supercell with that in the bulk55 (thechange of the reference potential after introducing a defect).
B. Experimental details
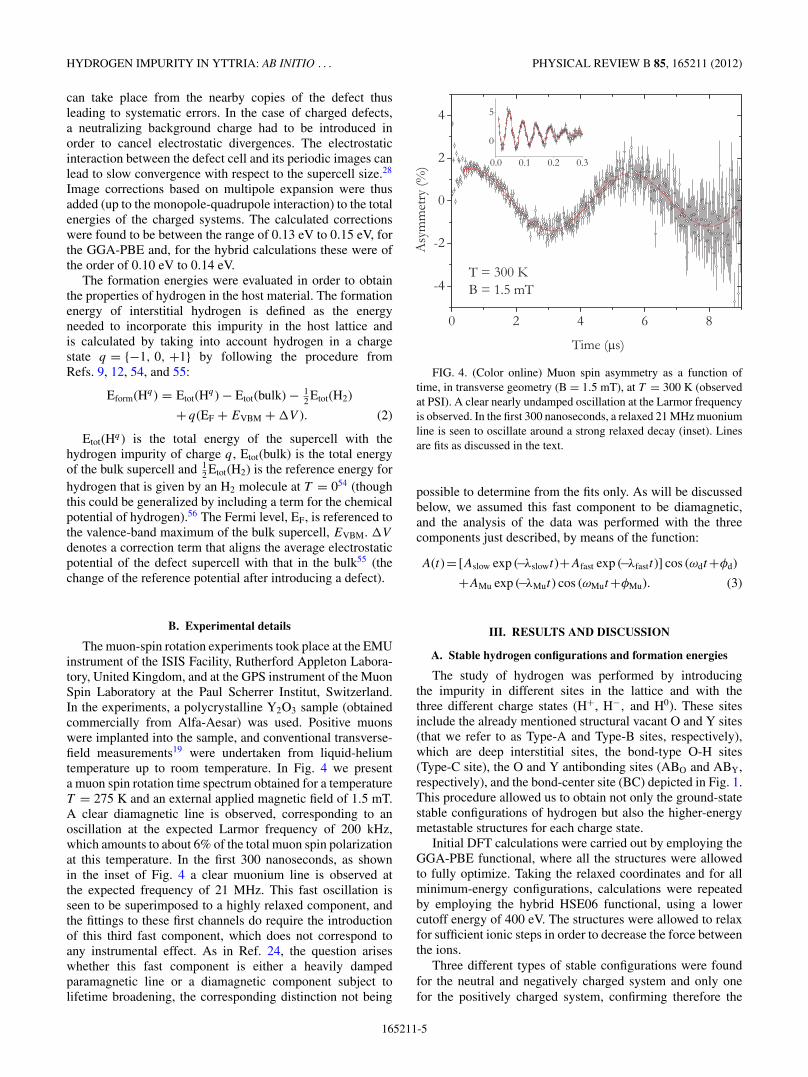
The muon-spin rotation experiments took place at the EMUinstrument of the ISIS Facility, Rutherford Appleton Labora-tory, United Kingdom, and at the GPS instrument of the MuonSpin Laboratory at the Paul Scherrer Institut, Switzerland.In the experiments, a polycrystalline Y2O3 sample (obtainedcommercially from Alfa-Aesar) was used. Positive muonswere implanted into the sample, and conventional transverse-field measurements19 were undertaken from liquid-heliumtemperature up to room temperature. In Fig. 4 we presenta muon spin rotation time spectrum obtained for a temperatureT = 275 K and an external applied magnetic field of 1.5 mT.A clear diamagnetic line is observed, corresponding to anoscillation at the expected Larmor frequency of 200 kHz,which amounts to about 6% of the total muon spin polarizationat this temperature. In the first 300 nanoseconds, as shownin the inset of Fig. 4 a clear muonium line is observed atthe expected frequency of 21 MHz. This fast oscillation isseen to be superimposed to a highly relaxed component, andthe fittings to these first channels do require the introductionof this third fast component, which does not correspond toany instrumental effect. As in Ref. 24, the question ariseswhether this fast component is either a heavily dampedparamagnetic line or a diamagnetic component subject tolifetime broadening, the corresponding distinction not being
FIG. 4. (Color online) Muon spin asymmetry as a function oftime, in transverse geometry (B = 1.5 mT), at T = 300 K (observedat PSI). A clear nearly undamped oscillation at the Larmor frequencyis observed. In the first 300 nanoseconds, a relaxed 21 MHz muoniumline is seen to oscillate around a strong relaxed decay (inset). Linesare fits as discussed in the text.
possible to determine from the fits only. As will be discussedbelow, we assumed this fast component to be diamagnetic,and the analysis of the data was performed with the threecomponents just described, by means of the function:
A(t)= [Aslow exp (−λslowt)+Afast exp (−λfastt)] cos (ωdt+φd)
+AMu exp (−λMut) cos (ωMut+φMu). (3)
III. RESULTS AND DISCUSSION
A. Stable hydrogen configurations and formation energies
The study of hydrogen was performed by introducingthe impurity in different sites in the lattice and with thethree different charge states (H+, H−, and H0). These sitesinclude the already mentioned structural vacant O and Y sites(that we refer to as Type-A and Type-B sites, respectively),which are deep interstitial sites, the bond-type O-H sites(Type-C site), the O and Y antibonding sites (ABO and ABY,respectively), and the bond-center site (BC) depicted in Fig. 1.This procedure allowed us to obtain not only the ground-statestable configurations of hydrogen but also the higher-energymetastable structures for each charge state.
Initial DFT calculations were carried out by employing theGGA-PBE functional, where all the structures were allowedto fully optimize. Taking the relaxed coordinates and for allminimum-energy configurations, calculations were repeatedby employing the hybrid HSE06 functional, using a lowercutoff energy of 400 eV. The structures were allowed to relaxfor sufficient ionic steps in order to decrease the force betweenthe ions.
Three different types of stable configurations were foundfor the neutral and negatively charged system and only onefor the positively charged system, confirming therefore the
165211-5

E. L. SILVA et al. PHYSICAL REVIEW B 85, 165211 (2012)
Y
X
Z
O
Y
H
Type-B
Type-A
Type-C
Y1
H0
Y2
(2)
H-
(1)
Y2
Y2
Y1
H0
H+
(1)
H +
(2)
Y2
Y2
Y2
Y1
2.3
1.0
1.9 1.0
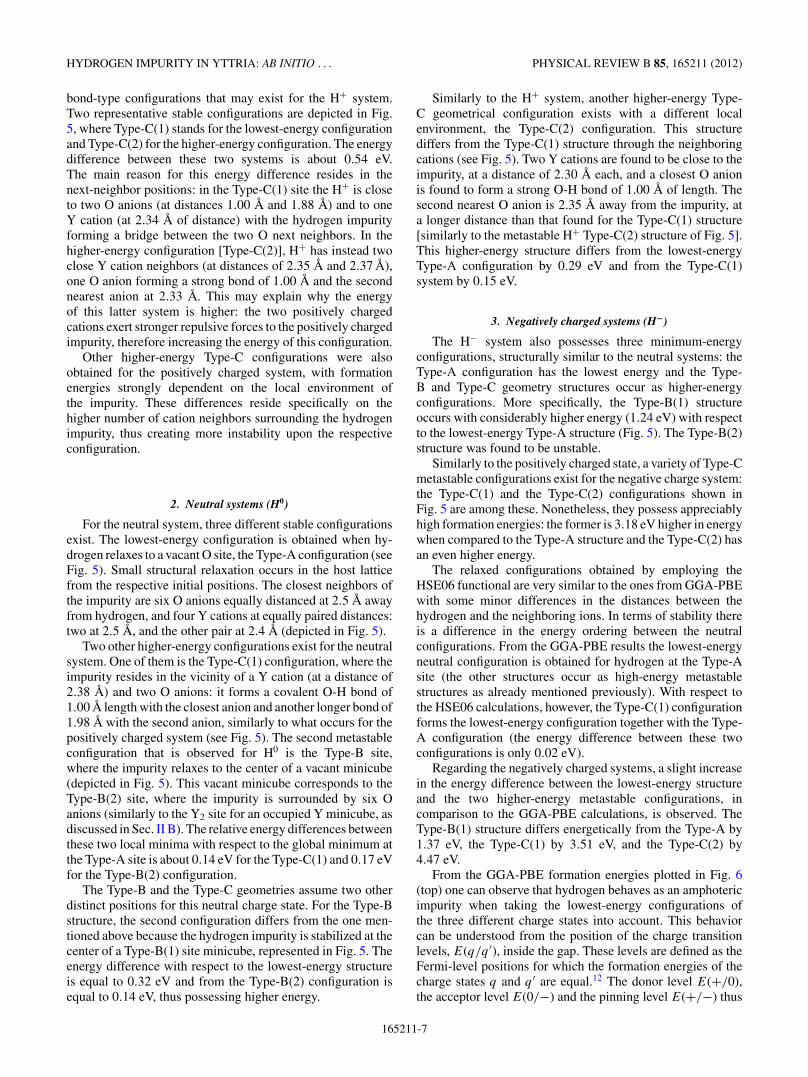
FIG. 5. (Color online) Representation of the hydrogen stable relaxed configurations for the three different charge states. The hydrogenis shown in white and by its charge states. For simplicity the Y2O3 lattice is represented by a perfect structure, where the distortion of theminicubes or the structural relaxations due to the incorporated impurity are not considered. Two different hydrogen positions appear forthe Type-B configuration, Type-B(1) and Type-B(2), where the first position is assumed by the negatively charged and neutral system andthe latter position only by the neutral system (the differences are due to the surrounding number of O ions). The Type-C configuration is foundfor the three charged states of hydrogen, and for the positively charged system this is the only stable configuration: the Type-C(1) is found tobe the lowest-energy configuration, whereas the Type-C(2) is a higher-energy metastable configuration. The values refer to the distancesbetween the hydrogen impurity with respect to the neighbor anions (GGA-PBE) and are represented in angstroms.
existence of multiple geometrical configurations with higherenergies. In these stable configurations hydrogen occupiedthe Type-A, Type-B, and Type-C sites (see Figs. 1 and 5).The Type-C bond-type configuration was found to be theonly stable configuration for the positively charged system.In contrast to what has been commonly found in covalentmaterials, the bond-center and antibonding sites are not stablesites for hydrogen in Y2O3. This suggests that this oxide hasa sufficiently high degree of ionicity to destabilize these latterhydrogen configurations.
1. Positively charged systems (H+)
The only type of stable configuration for the positivelycharged system occurs when the hydrogen impurity formsa strong covalent bond with an O anion, with a bondlength of 1.00 A. In this Type-C configuration, shown inFig. 5, the impurity is strongly attracted by the anion andrepelled by the nearest Y cation, hence displacing the Oanion about 5% from its original position, placing it furtheraway from the Y charge density. This bond-type configuration[Type-C(1) configuration] (see Fig. 5) is one of the different
165211-6
HYDROGEN IMPURITY IN YTTRIA: AB INITIO . . . PHYSICAL REVIEW B 85, 165211 (2012)
bond-type configurations that may exist for the H+ system.Two representative stable configurations are depicted in Fig.5, where Type-C(1) stands for the lowest-energy configurationand Type-C(2) for the higher-energy configuration. The energydifference between these two systems is about 0.54 eV.The main reason for this energy difference resides in thenext-neighbor positions: in the Type-C(1) site the H+ is closeto two O anions (at distances 1.00 A and 1.88 A) and to oneY cation (at 2.34 A of distance) with the hydrogen impurityforming a bridge between the two O next neighbors. In thehigher-energy configuration [Type-C(2)], H+ has instead twoclose Y cation neighbors (at distances of 2.35 A and 2.37 A),one O anion forming a strong bond of 1.00 A and the secondnearest anion at 2.33 A. This may explain why the energyof this latter system is higher: the two positively chargedcations exert stronger repulsive forces to the positively chargedimpurity, therefore increasing the energy of this configuration.
Other higher-energy Type-C configurations were alsoobtained for the positively charged system, with formationenergies strongly dependent on the local environment ofthe impurity. These differences reside specifically on thehigher number of cation neighbors surrounding the hydrogenimpurity, thus creating more instability upon the respectiveconfiguration.
2. Neutral systems (H0)
For the neutral system, three different stable configurationsexist. The lowest-energy configuration is obtained when hy-drogen relaxes to a vacant O site, the Type-A configuration (seeFig. 5). Small structural relaxation occurs in the host latticefrom the respective initial positions. The closest neighbors ofthe impurity are six O anions equally distanced at 2.5 A awayfrom hydrogen, and four Y cations at equally paired distances:two at 2.5 A, and the other pair at 2.4 A (depicted in Fig. 5).
Two other higher-energy configurations exist for the neutralsystem. One of them is the Type-C(1) configuration, where theimpurity resides in the vicinity of a Y cation (at a distance of2.38 A) and two O anions: it forms a covalent O-H bond of1.00 A length with the closest anion and another longer bond of1.98 A with the second anion, similarly to what occurs for thepositively charged system (see Fig. 5). The second metastableconfiguration that is observed for H0 is the Type-B site,where the impurity relaxes to the center of a vacant minicube(depicted in Fig. 5). This vacant minicube corresponds to theType-B(2) site, where the impurity is surrounded by six Oanions (similarly to the Y2 site for an occupied Y minicube, asdiscussed in Sec. II B). The relative energy differences betweenthese two local minima with respect to the global minimum atthe Type-A site is about 0.14 eV for the Type-C(1) and 0.17 eVfor the Type-B(2) configuration.
The Type-B and the Type-C geometries assume two otherdistinct positions for this neutral charge state. For the Type-Bstructure, the second configuration differs from the one men-tioned above because the hydrogen impurity is stabilized at thecenter of a Type-B(1) site minicube, represented in Fig. 5. Theenergy difference with respect to the lowest-energy structureis equal to 0.32 eV and from the Type-B(2) configuration isequal to 0.14 eV, thus possessing higher energy.
Similarly to the H+ system, another higher-energy Type-C geometrical configuration exists with a different localenvironment, the Type-C(2) configuration. This structurediffers from the Type-C(1) structure through the neighboringcations (see Fig. 5). Two Y cations are found to be close to theimpurity, at a distance of 2.30 A each, and a closest O anionis found to form a strong O-H bond of 1.00 A of length. Thesecond nearest O anion is 2.35 A away from the impurity, ata longer distance than that found for the Type-C(1) structure[similarly to the metastable H+ Type-C(2) structure of Fig. 5].This higher-energy structure differs from the lowest-energyType-A configuration by 0.29 eV and from the Type-C(1)system by 0.15 eV.
3. Negatively charged systems (H−)
The H− system also possesses three minimum-energyconfigurations, structurally similar to the neutral systems: theType-A configuration has the lowest energy and the Type-B and Type-C geometry structures occur as higher-energyconfigurations. More specifically, the Type-B(1) structureoccurs with considerably higher energy (1.24 eV) with respectto the lowest-energy Type-A structure (Fig. 5). The Type-B(2)structure was found to be unstable.
Similarly to the positively charged state, a variety of Type-Cmetastable configurations exist for the negative charge system:the Type-C(1) and the Type-C(2) configurations shown inFig. 5 are among these. Nonetheless, they possess appreciablyhigh formation energies: the former is 3.18 eV higher in energywhen compared to the Type-A structure and the Type-C(2) hasan even higher energy.
The relaxed configurations obtained by employing theHSE06 functional are very similar to the ones from GGA-PBEwith some minor differences in the distances between thehydrogen and the neighboring ions. In terms of stability thereis a difference in the energy ordering between the neutralconfigurations. From the GGA-PBE results the lowest-energyneutral configuration is obtained for hydrogen at the Type-Asite (the other structures occur as high-energy metastablestructures as already mentioned previously). With respect tothe HSE06 calculations, however, the Type-C(1) configurationforms the lowest-energy configuration together with the Type-A configuration (the energy difference between these twoconfigurations is only 0.02 eV).
Regarding the negatively charged systems, a slight increasein the energy difference between the lowest-energy structureand the two higher-energy metastable configurations, incomparison to the GGA-PBE calculations, is observed. TheType-B(1) structure differs energetically from the Type-A by1.37 eV, the Type-C(1) by 3.51 eV, and the Type-C(2) by4.47 eV.
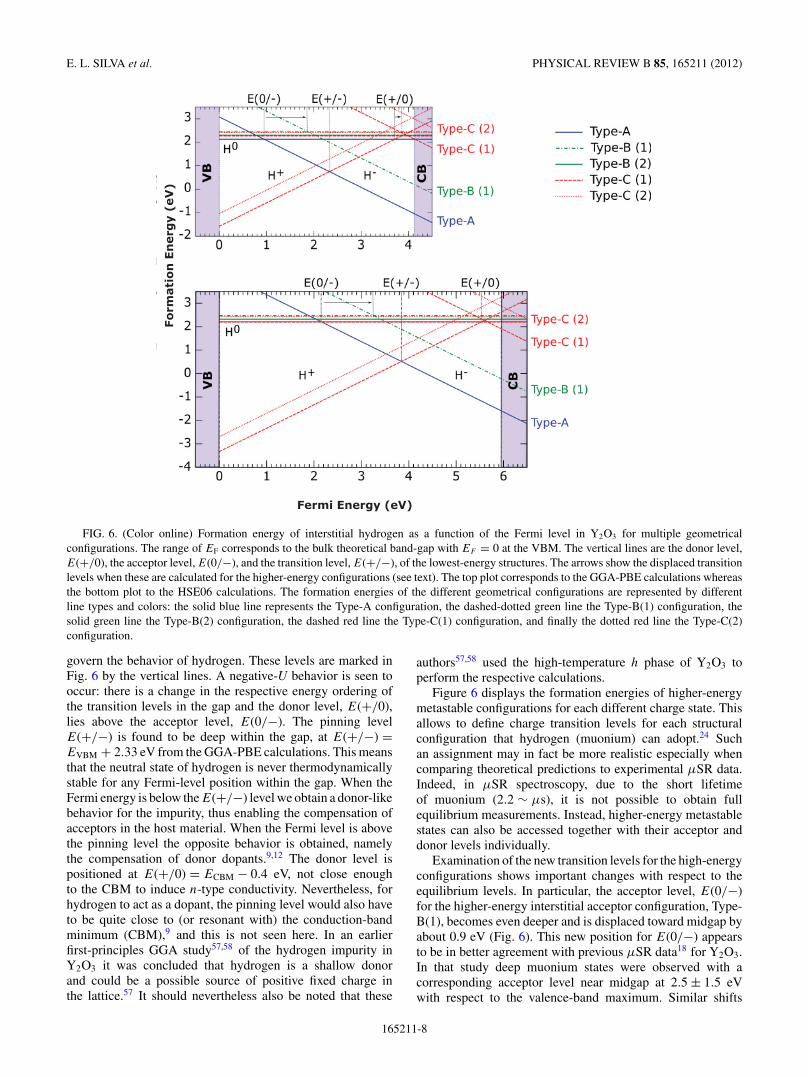
From the GGA-PBE formation energies plotted in Fig. 6(top) one can observe that hydrogen behaves as an amphotericimpurity when taking the lowest-energy configurations ofthe three different charge states into account. This behaviorcan be understood from the position of the charge transitionlevels, E(q/q ′), inside the gap. These levels are defined as theFermi-level positions for which the formation energies of thecharge states q and q ′ are equal.12 The donor level E(+/0),the acceptor level E(0/−) and the pinning level E(+/−) thus
165211-7
E. L. SILVA et al. PHYSICAL REVIEW B 85, 165211 (2012)
FIG. 6. (Color online) Formation energy of interstitial hydrogen as a function of the Fermi level in Y2O3 for multiple geometricalconfigurations. The range of EF corresponds to the bulk theoretical band-gap with EF = 0 at the VBM. The vertical lines are the donor level,E(+/0), the acceptor level, E(0/−), and the transition level, E(+/−), of the lowest-energy structures. The arrows show the displaced transitionlevels when these are calculated for the higher-energy configurations (see text). The top plot corresponds to the GGA-PBE calculations whereasthe bottom plot to the HSE06 calculations. The formation energies of the different geometrical configurations are represented by differentline types and colors: the solid blue line represents the Type-A configuration, the dashed-dotted green line the Type-B(1) configuration, thesolid green line the Type-B(2) configuration, the dashed red line the Type-C(1) configuration, and finally the dotted red line the Type-C(2)configuration.
govern the behavior of hydrogen. These levels are marked inFig. 6 by the vertical lines. A negative-U behavior is seen tooccur: there is a change in the respective energy ordering ofthe transition levels in the gap and the donor level, E(+/0),lies above the acceptor level, E(0/−). The pinning levelE(+/−) is found to be deep within the gap, at E(+/−) =EVBM + 2.33 eV from the GGA-PBE calculations. This meansthat the neutral state of hydrogen is never thermodynamicallystable for any Fermi-level position within the gap. When theFermi energy is below the E(+/−) level we obtain a donor-likebehavior for the impurity, thus enabling the compensation ofacceptors in the host material. When the Fermi level is abovethe pinning level the opposite behavior is obtained, namelythe compensation of donor dopants.9,12 The donor level ispositioned at E(+/0) = ECBM − 0.4 eV, not close enoughto the CBM to induce n-type conductivity. Nevertheless, forhydrogen to act as a dopant, the pinning level would also haveto be quite close to (or resonant with) the conduction-bandminimum (CBM),9 and this is not seen here. In an earlierfirst-principles GGA study57,58 of the hydrogen impurity inY2O3 it was concluded that hydrogen is a shallow donorand could be a possible source of positive fixed charge inthe lattice.57 It should nevertheless also be noted that these
authors57,58 used the high-temperature h phase of Y2O3 toperform the respective calculations.
Figure 6 displays the formation energies of higher-energymetastable configurations for each different charge state. Thisallows to define charge transition levels for each structuralconfiguration that hydrogen (muonium) can adopt.24 Suchan assignment may in fact be more realistic especially whencomparing theoretical predictions to experimental μSR data.Indeed, in μSR spectroscopy, due to the short lifetimeof muonium (2.2 ∼ μs), it is not possible to obtain fullequilibrium measurements. Instead, higher-energy metastablestates can also be accessed together with their acceptor anddonor levels individually.
Examination of the new transition levels for the high-energyconfigurations shows important changes with respect to theequilibrium levels. In particular, the acceptor level, E(0/−)for the higher-energy interstitial acceptor configuration, Type-B(1), becomes even deeper and is displaced toward midgap byabout 0.9 eV (Fig. 6). This new position for E(0/−) appearsto be in better agreement with previous μSR data18 for Y2O3.In that study deep muonium states were observed with acorresponding acceptor level near midgap at 2.5 ± 1.5 eVwith respect to the valence-band maximum. Similar shifts
165211-8
HYDROGEN IMPURITY IN YTTRIA: AB INITIO . . . PHYSICAL REVIEW B 85, 165211 (2012)
also occur for the transition levels of other configurations: thedonor level of the bond-type C(1) configuration has an energyshift of 0.2 eV (Fig. 6) towards the CBM. For this Type-C(1)configuration the three transition levels are very close to eachother. In fact there is an energy range where the neutralType-C(1) configuration is stable (below the pinning level),hence indicating a positive-U ordering for hydrogen. TheE(+/−) and E(+/0) levels are located 0.2 eV and 0.25 eV,respectively, below the CBM (depicted in Fig. 6, top plot),suggesting a donor behavior of hydrogen in this metastablegeometric configuration. For the Type-C(2) configuration apositive-U ordering is also observed but the correspondingdonor level lies further away from the CBM. From these resultswe infer that a portion of these bond-type configurations aredonor-like configurations (Fig. 6) with corresponding donorand pinning levels very close to the CBM. Nevertheless, wecannot argue on the possibility of hydrogen behaving as ashallow donor due to the distance between the transition levelsand the CBM.
The HSE06 results for the formation energies [Fig. 6(bottom)] are similar to the GGA-PBE results. Again, anamphoteric behavior for hydrogen is obtained by consideringthe lowest-energy configurations for each charge state, withthe pinning level E(+/−) found in the upper half of the gap.Nonetheless, differences in the transition levels can easilybe seen since these are shifted proportionally in the gapfor the HSE06 framework: the E(+/−) transition level ofthe lowest-energy configurations is pinned at 3.85 eV andthe acceptor level E(0/−) at 2.15 eV, above the valence-band maximum. The latter is consistent with the acceptorlevel that Cox and coworkers observed at 2.5 ± 1.5 eV (fordeep muonium) through high-temperature μSR measurementsperformed above room temperature.18
Other differences between the GGA-PBE and HSE06results also arise for the neutral system where a slight change ofenergy ordering between the different geometrical structures isobserved (as already mentioned above). The neutral Type-C(1)configuration has now a lower energy, only by 0.02 eV withrespect to the Type-A configuration, implying the existence ofdegenerate states.
Regarding the HSE06 formation energies and associatedtransition levels of the different geometrical configurationsdepicted in Fig. 6 (bottom), the results are also similar to theGGA-PBE results. The acceptor level corresponding to theinterstitial Type-B(1) geometrical configuration is displacedto higher Fermi energies, 3.25 eV above the valence-bandmaximum, and is still in good agreement with the μSR data.18
The donor level for the bond-type C(1) configuration is located0.4 eV below the CBM, slightly deeper with respect to theGGA-PBE result. Similarly, the pinning level for Type-C(1)is also positioned 0.35 eV below the CBM, and a positive-Uordering can be observed with the neutral state being stablewithin a small-energy range.
B. Position of defect levels
In order to study the defect levels in the gap, the DOSof the different geometrical configurations were evaluatedby applying the two mentioned functionals. For the neutraland negatively charged systems, a defect level in the gap is
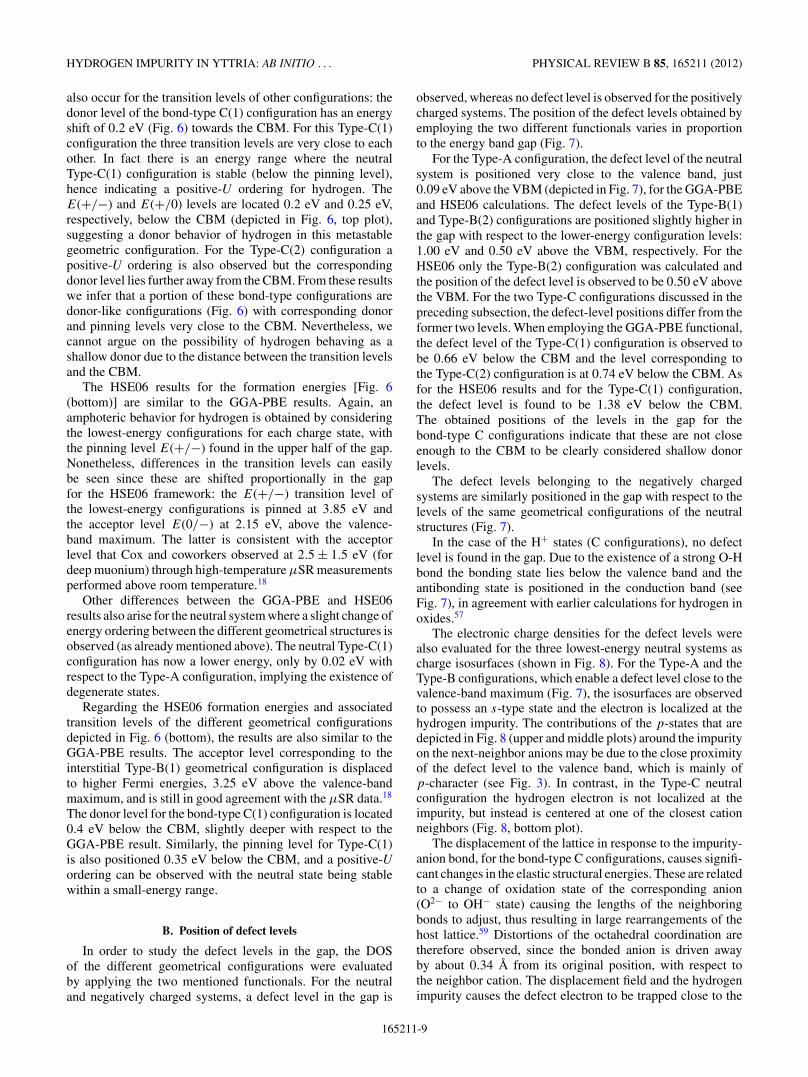
observed, whereas no defect level is observed for the positivelycharged systems. The position of the defect levels obtained byemploying the two different functionals varies in proportionto the energy band gap (Fig. 7).
For the Type-A configuration, the defect level of the neutralsystem is positioned very close to the valence band, just0.09 eV above the VBM (depicted in Fig. 7), for the GGA-PBEand HSE06 calculations. The defect levels of the Type-B(1)and Type-B(2) configurations are positioned slightly higher inthe gap with respect to the lower-energy configuration levels:1.00 eV and 0.50 eV above the VBM, respectively. For theHSE06 only the Type-B(2) configuration was calculated andthe position of the defect level is observed to be 0.50 eV abovethe VBM. For the two Type-C configurations discussed in thepreceding subsection, the defect-level positions differ from theformer two levels. When employing the GGA-PBE functional,the defect level of the Type-C(1) configuration is observed tobe 0.66 eV below the CBM and the level corresponding tothe Type-C(2) configuration is at 0.74 eV below the CBM. Asfor the HSE06 results and for the Type-C(1) configuration,the defect level is found to be 1.38 eV below the CBM.The obtained positions of the levels in the gap for thebond-type C configurations indicate that these are not closeenough to the CBM to be clearly considered shallow donorlevels.
The defect levels belonging to the negatively chargedsystems are similarly positioned in the gap with respect to thelevels of the same geometrical configurations of the neutralstructures (Fig. 7).
In the case of the H+ states (C configurations), no defectlevel is found in the gap. Due to the existence of a strong O-Hbond the bonding state lies below the valence band and theantibonding state is positioned in the conduction band (seeFig. 7), in agreement with earlier calculations for hydrogen inoxides.57
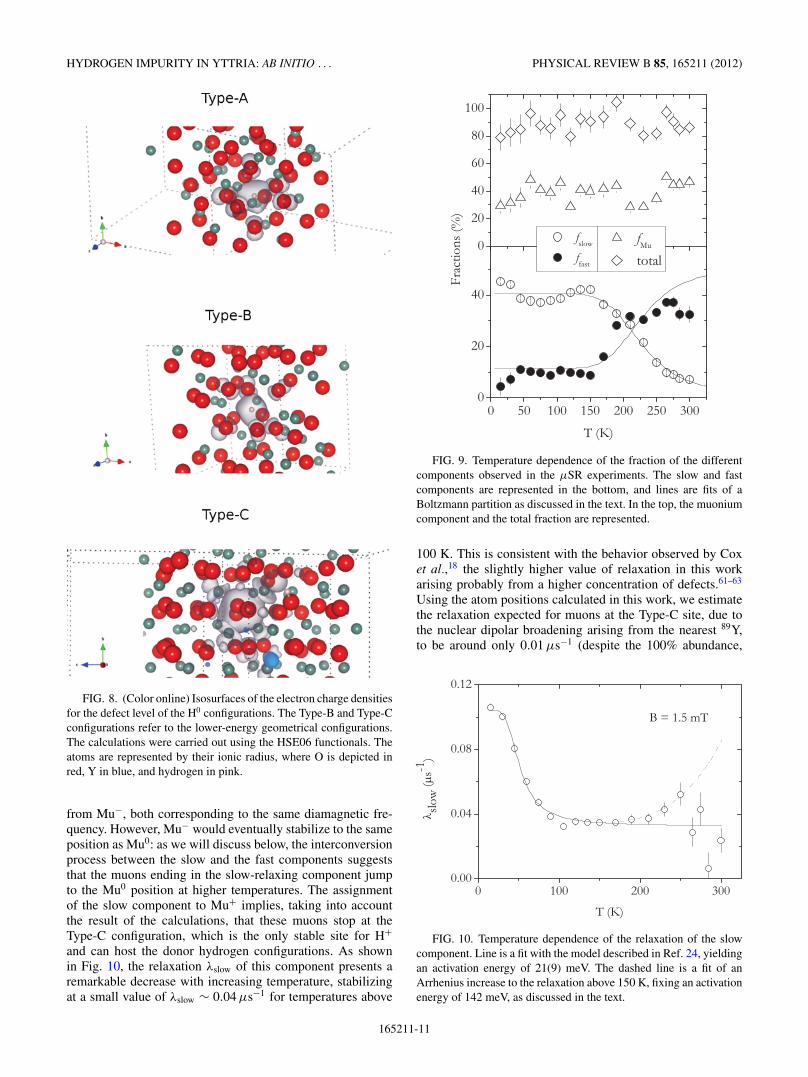
The electronic charge densities for the defect levels werealso evaluated for the three lowest-energy neutral systems ascharge isosurfaces (shown in Fig. 8). For the Type-A and theType-B configurations, which enable a defect level close to thevalence-band maximum (Fig. 7), the isosurfaces are observedto possess an s-type state and the electron is localized at thehydrogen impurity. The contributions of the p-states that aredepicted in Fig. 8 (upper and middle plots) around the impurityon the next-neighbor anions may be due to the close proximityof the defect level to the valence band, which is mainly ofp-character (see Fig. 3). In contrast, in the Type-C neutralconfiguration the hydrogen electron is not localized at theimpurity, but instead is centered at one of the closest cationneighbors (Fig. 8, bottom plot).
The displacement of the lattice in response to the impurity-anion bond, for the bond-type C configurations, causes signifi-cant changes in the elastic structural energies. These are relatedto a change of oxidation state of the corresponding anion(O2− to OH− state) causing the lengths of the neighboringbonds to adjust, thus resulting in large rearrangements of thehost lattice.59 Distortions of the octahedral coordination aretherefore observed, since the bonded anion is driven awayby about 0.34 A from its original position, with respect tothe neighbor cation. The displacement field and the hydrogenimpurity causes the defect electron to be trapped close to the
165211-9
E. L. SILVA et al. PHYSICAL REVIEW B 85, 165211 (2012)
FIG. 7. (Color online) GGA-PBE (left) and HSE06 (right) defect levels (the respective occupations are represented by the red circles) ofthe three different charge states of the stable hydrogen configurations. The defect levels of the two different local environment of the Type-Band Type-C configurations, represented in Fig. 5, are denoted by (1) and (2). For the HSE06 calculations only the lowest-energy configurationsare shown for the neutral charge systems. The energies are referenced from the VBM.
impurity atom, in which the singly occupied orbital is localizedin a single metal cation.18 These effects resemble the situationsuggested by Cox et al.18 for polaron formation where thedefect centers may be either shallow or deep.
The alternative to the situation just described would be thecompeting tendency for the defect electron to delocalize.59
If this was the case, the isosurfaces should evidence thedelocalization of the charge densities of the defect electronthroughout the lattice, suggesting that the impurity electronshould be ionized to the conduction band due to the shallow-donor behavior of the hydrogen impurity. This hypothesisdoes not seem to be consistent with what is observed inthe theoretical calculations: the defect level for the Type-Cconfiguration not being close enough to the CBM to allowfor a shallow-donor behavior (Fig. 7), the localized behaviorobserved from the isosurfaces plot (bottom plot of Fig. 8),and the lattice displacement observed for the structure of theType-C configuration (as discussed in Sec. III A).
C. μSR results and discussion
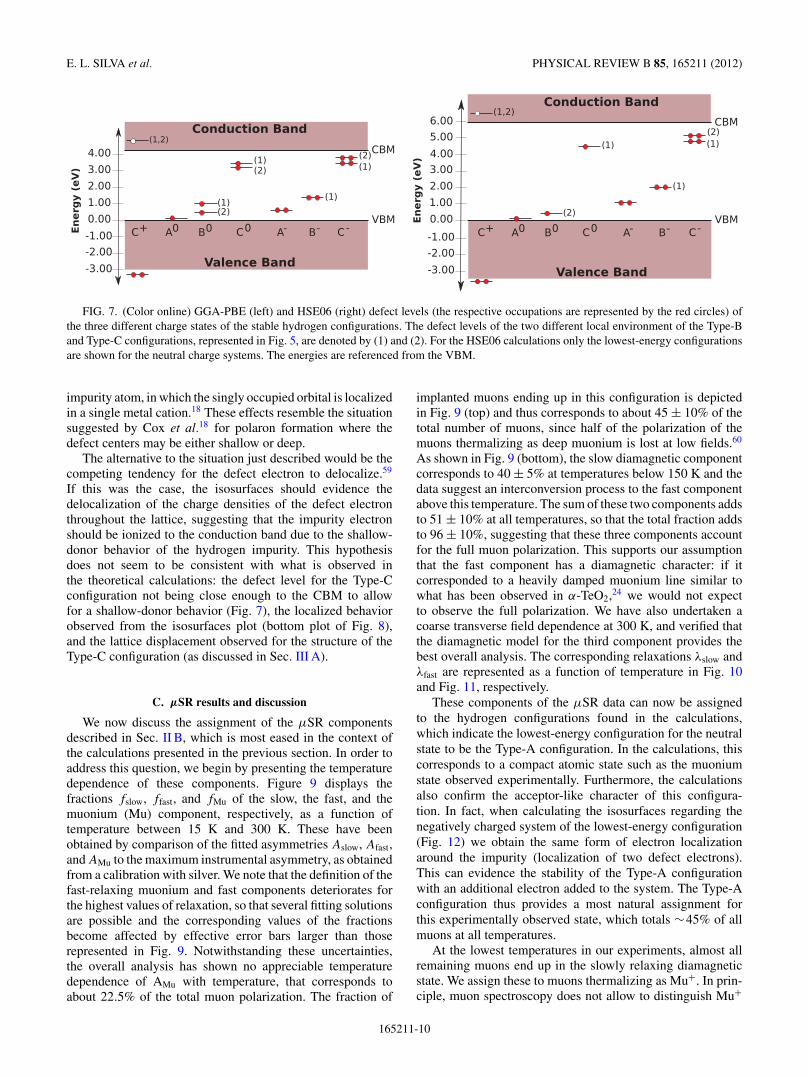
We now discuss the assignment of the μSR componentsdescribed in Sec. II B, which is most eased in the context ofthe calculations presented in the previous section. In order toaddress this question, we begin by presenting the temperaturedependence of these components. Figure 9 displays thefractions fslow, ffast, and fMu of the slow, the fast, and themuonium (Mu) component, respectively, as a function oftemperature between 15 K and 300 K. These have beenobtained by comparison of the fitted asymmetries Aslow, Afast,and AMu to the maximum instrumental asymmetry, as obtainedfrom a calibration with silver. We note that the definition of thefast-relaxing muonium and fast components deteriorates forthe highest values of relaxation, so that several fitting solutionsare possible and the corresponding values of the fractionsbecome affected by effective error bars larger than thoserepresented in Fig. 9. Notwithstanding these uncertainties,the overall analysis has shown no appreciable temperaturedependence of AMu with temperature, that corresponds toabout 22.5% of the total muon polarization. The fraction of
implanted muons ending up in this configuration is depictedin Fig. 9 (top) and thus corresponds to about 45 ± 10% of thetotal number of muons, since half of the polarization of themuons thermalizing as deep muonium is lost at low fields.60
As shown in Fig. 9 (bottom), the slow diamagnetic componentcorresponds to 40 ± 5% at temperatures below 150 K and thedata suggest an interconversion process to the fast componentabove this temperature. The sum of these two components addsto 51 ± 10% at all temperatures, so that the total fraction addsto 96 ± 10%, suggesting that these three components accountfor the full muon polarization. This supports our assumptionthat the fast component has a diamagnetic character: if itcorresponded to a heavily damped muonium line similar towhat has been observed in α-TeO2,24 we would not expectto observe the full polarization. We have also undertaken acoarse transverse field dependence at 300 K, and verified thatthe diamagnetic model for the third component provides thebest overall analysis. The corresponding relaxations λslow andλfast are represented as a function of temperature in Fig. 10and Fig. 11, respectively.
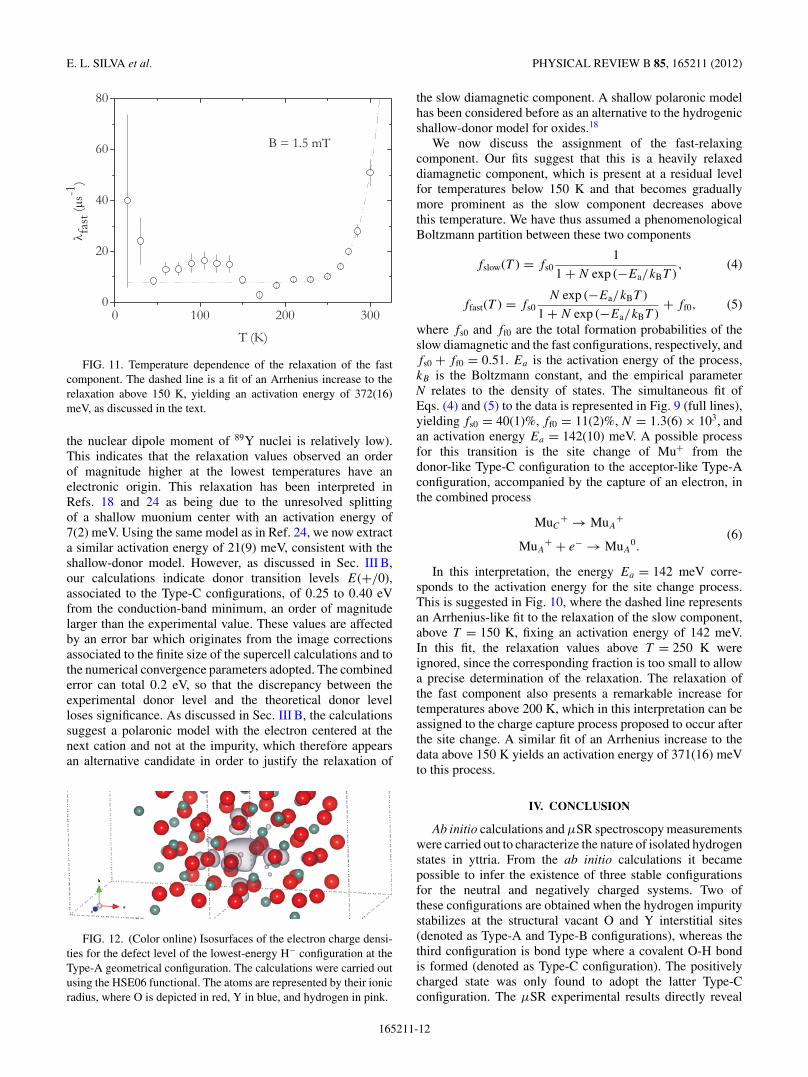
These components of the μSR data can now be assignedto the hydrogen configurations found in the calculations,which indicate the lowest-energy configuration for the neutralstate to be the Type-A configuration. In the calculations, thiscorresponds to a compact atomic state such as the muoniumstate observed experimentally. Furthermore, the calculationsalso confirm the acceptor-like character of this configura-tion. In fact, when calculating the isosurfaces regarding thenegatively charged system of the lowest-energy configuration(Fig. 12) we obtain the same form of electron localizationaround the impurity (localization of two defect electrons).This can evidence the stability of the Type-A configurationwith an additional electron added to the system. The Type-Aconfiguration thus provides a most natural assignment forthis experimentally observed state, which totals ∼45% of allmuons at all temperatures.
At the lowest temperatures in our experiments, almost allremaining muons end up in the slowly relaxing diamagneticstate. We assign these to muons thermalizing as Mu+. In prin-ciple, muon spectroscopy does not allow to distinguish Mu+
165211-10
HYDROGEN IMPURITY IN YTTRIA: AB INITIO . . . PHYSICAL REVIEW B 85, 165211 (2012)
FIG. 8. (Color online) Isosurfaces of the electron charge densitiesfor the defect level of the H0 configurations. The Type-B and Type-Cconfigurations refer to the lower-energy geometrical configurations.The calculations were carried out using the HSE06 functionals. Theatoms are represented by their ionic radius, where O is depicted inred, Y in blue, and hydrogen in pink.
from Mu−, both corresponding to the same diamagnetic fre-quency. However, Mu− would eventually stabilize to the sameposition as Mu0: as we will discuss below, the interconversionprocess between the slow and the fast components suggeststhat the muons ending in the slow-relaxing component jumpto the Mu0 position at higher temperatures. The assignmentof the slow component to Mu+ implies, taking into accountthe result of the calculations, that these muons stop at theType-C configuration, which is the only stable site for H+and can host the donor hydrogen configurations. As shownin Fig. 10, the relaxation λslow of this component presents aremarkable decrease with increasing temperature, stabilizingat a small value of λslow ∼ 0.04 μs−1 for temperatures above
FIG. 9. Temperature dependence of the fraction of the differentcomponents observed in the μSR experiments. The slow and fastcomponents are represented in the bottom, and lines are fits of aBoltzmann partition as discussed in the text. In the top, the muoniumcomponent and the total fraction are represented.
100 K. This is consistent with the behavior observed by Coxet al.,18 the slightly higher value of relaxation in this workarising probably from a higher concentration of defects.61–63
Using the atom positions calculated in this work, we estimatethe relaxation expected for muons at the Type-C site, due tothe nuclear dipolar broadening arising from the nearest 89Y,to be around only 0.01 μs−1 (despite the 100% abundance,
FIG. 10. Temperature dependence of the relaxation of the slowcomponent. Line is a fit with the model described in Ref. 24, yieldingan activation energy of 21(9) meV. The dashed line is a fit of anArrhenius increase to the relaxation above 150 K, fixing an activationenergy of 142 meV, as discussed in the text.
165211-11
E. L. SILVA et al. PHYSICAL REVIEW B 85, 165211 (2012)
FIG. 11. Temperature dependence of the relaxation of the fastcomponent. The dashed line is a fit of an Arrhenius increase to therelaxation above 150 K, yielding an activation energy of 372(16)meV, as discussed in the text.
the nuclear dipole moment of 89Y nuclei is relatively low).This indicates that the relaxation values observed an orderof magnitude higher at the lowest temperatures have anelectronic origin. This relaxation has been interpreted inRefs. 18 and 24 as being due to the unresolved splittingof a shallow muonium center with an activation energy of7(2) meV. Using the same model as in Ref. 24, we now extracta similar activation energy of 21(9) meV, consistent with theshallow-donor model. However, as discussed in Sec. III B,our calculations indicate donor transition levels E(+/0),associated to the Type-C configurations, of 0.25 to 0.40 eVfrom the conduction-band minimum, an order of magnitudelarger than the experimental value. These values are affectedby an error bar which originates from the image correctionsassociated to the finite size of the supercell calculations and tothe numerical convergence parameters adopted. The combinederror can total 0.2 eV, so that the discrepancy between theexperimental donor level and the theoretical donor levelloses significance. As discussed in Sec. III B, the calculationssuggest a polaronic model with the electron centered at thenext cation and not at the impurity, which therefore appearsan alternative candidate in order to justify the relaxation of
FIG. 12. (Color online) Isosurfaces of the electron charge densi-ties for the defect level of the lowest-energy H− configuration at theType-A geometrical configuration. The calculations were carried outusing the HSE06 functional. The atoms are represented by their ionicradius, where O is depicted in red, Y in blue, and hydrogen in pink.
the slow diamagnetic component. A shallow polaronic modelhas been considered before as an alternative to the hydrogenicshallow-donor model for oxides.18
We now discuss the assignment of the fast-relaxingcomponent. Our fits suggest that this is a heavily relaxeddiamagnetic component, which is present at a residual levelfor temperatures below 150 K and that becomes graduallymore prominent as the slow component decreases abovethis temperature. We have thus assumed a phenomenologicalBoltzmann partition between these two components
fslow(T ) = fs01
1 + N exp (−Ea/kBT ), (4)
ffast(T ) = fs0N exp (−Ea/kBT )
1 + N exp (−Ea/kBT )+ ff0, (5)
where fs0 and ff0 are the total formation probabilities of theslow diamagnetic and the fast configurations, respectively, andfs0 + ff0 = 0.51. Ea is the activation energy of the process,kB is the Boltzmann constant, and the empirical parameterN relates to the density of states. The simultaneous fit ofEqs. (4) and (5) to the data is represented in Fig. 9 (full lines),yielding fs0 = 40(1)%, ff0 = 11(2)%, N = 1.3(6) × 103, andan activation energy Ea = 142(10) meV. A possible processfor this transition is the site change of Mu+ from thedonor-like Type-C configuration to the acceptor-like Type-Aconfiguration, accompanied by the capture of an electron, inthe combined process
MuC+ → MuA
+(6)
MuA+ + e− → MuA
0.
In this interpretation, the energy Ea = 142 meV corre-sponds to the activation energy for the site change process.This is suggested in Fig. 10, where the dashed line representsan Arrhenius-like fit to the relaxation of the slow component,above T = 150 K, fixing an activation energy of 142 meV.In this fit, the relaxation values above T = 250 K wereignored, since the corresponding fraction is too small to allowa precise determination of the relaxation. The relaxation ofthe fast component also presents a remarkable increase fortemperatures above 200 K, which in this interpretation can beassigned to the charge capture process proposed to occur afterthe site change. A similar fit of an Arrhenius increase to thedata above 150 K yields an activation energy of 371(16) meVto this process.
IV. CONCLUSION
Ab initio calculations and μSR spectroscopy measurementswere carried out to characterize the nature of isolated hydrogenstates in yttria. From the ab initio calculations it becamepossible to infer the existence of three stable configurationsfor the neutral and negatively charged systems. Two ofthese configurations are obtained when the hydrogen impuritystabilizes at the structural vacant O and Y interstitial sites(denoted as Type-A and Type-B configurations), whereas thethird configuration is bond type where a covalent O-H bondis formed (denoted as Type-C configuration). The positivelycharged state was only found to adopt the latter Type-Cconfiguration. The μSR experimental results directly reveal
165211-12
HYDROGEN IMPURITY IN YTTRIA: AB INITIO . . . PHYSICAL REVIEW B 85, 165211 (2012)
the presence of two distinct muonium configurations, proposedto correspond to the Type-A acceptor-like configuration and tothe Type-C donor-like configuration. Despite the metastabilityobserved at low temperatures, the μSR results strongly suggestthat at temperatures near room temperature all muons end upin the stable Type-A configuration, which thus appears quiterobust.
The calculated formation energies obtained by both thesemilocal and hybrid functionals place the hydrogen pinninglevel, E(+/−), deep in the band gap, suggesting therefore anamphoteric behavior for hydrogen. The calculated acceptorlevels are governed by the Type-A interstitial configurationsand are consistent with earlier μSR data that inferred anacceptor level near midgap. The bond-type C configurationsprovide a range of donor levels within 0.25 eV (GGA-PBE)and 0.4 eV (HSE06) from the CBM overestimating the presentμSR findings that place the donor level at 21(9) meV from theCBM.
The defect levels of the neutral and negatively chargedsystems lie close to the VBM, although for the Type-Cstructures this evidence is not observed. For the latter, thecorresponding defect levels are positioned close to the CBM,although not close enough to allow a shallow-donor behavior
of hydrogen. From the calculation of the isosurfaces forthe Type-A and Type-B structures it was observed that theimpurity electron is strongly localized at the hydrogen, henceindicating that these interstitial hydrogen configurations aredeep, localized states. Concerning the Type-C configurations,the defect charge density is centered on a neighboring cation,which may suggest a lattice polaronic effect.
ACKNOWLEDGMENTS
The work was supported by the Program COMPETE:FCOMP-01-0124-FEDER-010450 and by the PortugueseFundacao para a Ciencia e a Tecnologia (FCT) underCiencia 2007 and PTDC/FIS/102722/2008 research projects,and under the COMPETE: PEst-C/FIS/UI0036/2011 strategicproject. The authors would also like to thank the computingsupport from the Department of Physics and the Milipeiacluster at the Laboratory for Advanced Computing of theUniversity of Coimbra. Acknowledgments are also to be madeto Fernando Nogueira and to the Condensed Matter Group ofthe Center for Computational Physics for fruitful discussions.The support of the muon teams at ISIS and PSI is also gratefullyacknowledged.
*[email protected]†Also at: Escola Superior de Tecnologia da Saude de Coimbra,Polytechnic Institute of Coimbra, P-3040-854 Coimbra, Portugal.1G.-M. Rignanese, J. Phys.: Condens. Matter 17, R357 (2005).2J. X. Zheng, G. Ceder, T. Maxisch, W. K. Chim, and W. K. Choi,Phys. Rev. B 73, 104101 (2006).
3J. Robertson, Rep. Prog. Phys. 69, 327 (2006).4P. W. Peacock and J. Robertson, J. Appl. Phys. 92, 4712 (2002).5W. C. Wang, M. Badylevich, V. V. Afana’ev, A. Stesmans,C. Adelmann, S. Van Elshocht, J. A. Kittl, M. Lukosius, Ch.Walczyk, and Ch. Wenger, Appl. Phys. Lett. 95, 132903 (2009).
6J. X. Zheng and W. K. Chim, Phys. Status Solidi (RRL) 2, 227(2008).
7K. Xiong, J. Robertson, S. J. Clark, and S. J. Clark, in Defectsin High-K Gate Dielectric Stacks, edited by E. Gusev, Vol. 220(Springer, The Netherlands, 2006), p. 175.
8C. G. Van de Walle, Phys. Rev. Lett. 85, 1012 (2000).9C. G. Van de Walle and J. Neugebauer, Annu. Rev. Mater. Res. 36,179 (2006).
10J. M. Kahn, R. E. McMurray, E. E. Haller, and L. M. Falicov, Phys.Rev. B 36, 8001 (1987).
11L. Tsetseris, D. M. Fleetwood, R. D. Schrimpf, and S. T. Pantelides,in Defects in Microelectronic Materials and Devices, edited byDaniel M. Fleetwood and Ronald D. Schrimpf (CRC Press Taylor& Francis Group, Boca Raton, 2009), Ch. 13, p. 381.
12C. G. Van de Walle and J. Neugebauer, Nature (London) 423, 626(2003).
13C. G. Van de Walle, P. J. H. Denteneer, Y. Bar-Yam, and S. T.Pantelides, Phys. Rev. B 39, 10791 (1989).
14T. Norby and P. Kofstad, Solid State Ionics 20, 169 (1986).15T. Norby and P. Kofstad, J. Am. Ceram. Soc. 69, 784 (1986).16K. Xiong and J. Robertson, J. Appl. Phys. 102, 083710 (2007).17R. L. Lichti, K. H. Chow, and S. F. J. Cox, Phys. Rev. Lett. 101,
136403 (2008).
18S. F. J. Cox, J. L. Gavartin, J. S. Lord, S. P. Cottrell, J. M. Gil, H. V.Alberto, J. P. Duarte, R. C. Vilao, N. A. de Campos, D. J. Keeble,E. A. Davis, M. Charlton, and D. P. van der Werf, J. Phys.: Condens.Matter 18, 1079 (2006).
19K. H. Chow, B. Hitti, and R. F. Kiefl, in Identification of Defectsin Semiconductors, edited by M. Stavola, Semiconductors andSemimetals, Vol. 51A (Academic Press, San Diego, 1998), p. 137,treatise edited by R. K. Willardson and E. R. Weber.
20S. F. J. Cox, J. S. Lord, S. P. Cottrell, J. M. Gil, H. V. Alberto,A. Keren, D. Prabhakaran, R. Scheuermann, and A. Stoykov, J.Phys.: Condens. Matter 18, 1061 (2006), and included referencestherein.
21R. L. Lichti, K. H. Chow, J. M. Gil, D. L. Stripe, R. C. Vilao, andS. F. J. Cox, Physica B 376–377, 587 (2006).
22R. C. Vilao, J. M. Gil, A. Weidinger, H. V. Alberto, J. Piroto Duarte,N. Ayres de Campos, R. L. Lichti, K. H. Chow, S. P. Cottrell, andS. F. J. Cox, Phys. Rev. B 77, 235212 (2008).
23J. M. Gil, H. V. Alberto, R. C. Vilao, J. Piroto Duarte, N. Ayres deCampos, A. Weidinger, J. Krauser, E. A. Davis, S. P. Cottrell, andS. F. J. Cox, Phys. Rev. B 64, 075205 (2001).
24R. C. Vilao, A. G. Marinopoulos, R. B. L. Vieira, A. Weidinger,H. V. Alberto, J. P. Duarte, and J. M. Gil, J. S. Lord, and S. F. J.Cox, Phys. Rev. B 84, 045201 (2011).
25P. D. C. King, R. L. Lichti, Y. G. Celebi, J. M. Gil, R. C. Vilao, H. V.Alberto, J. Piroto Duarte, D. J. Payne, R. G. Egdell, I. McKenzie,C. F. McConville, S. F. J. Cox, and T. D. Veal, Phys. Rev. B 80,081201(R) (2009).
26J. M. Gil, H. V. Alberto, R. C. Vilao, J. Piroto Duarte, N. Ayresde Campos, A. Weidinger, E. A. Davis, and S. F. J. Cox, J. Phys.:Condens. Matter 13, L613 (2001).
27S. Park, B. Lee, S. H. Jeon, and S. Han, Current Applied Physics11, S337 (2011).
28R. M. Nieminen, Model. Simul. Mater. Sc. Eng. 17, 084001(2009).
165211-13
E. L. SILVA et al. PHYSICAL REVIEW B 85, 165211 (2012)
29J. Heyd, G. E. Scuseria, and M. Ernzerhof, J. Chem. Phys. 118,8207 (2003).
30A. Stroppa and S. Picozzi, Phys. Chem. Chem. Phys. 12, 5405(2010).
31A. Stroppa and G. Kresse, New J. Phys. 10, 063020 (2008).32A. Stroppa and G. Kresse, Phys. Rev. B 79, 201201(R) (2009).33A. Stroppa, K. Termentzidis, J. Paier, G. Kresse, and J. Hafner,
Phys. Rev. B 76, 195440 (2007).34M. Marsman, J. Paier, A. Stroppa, and G. Kresse, J. Phys.: Condens.
Matter 20, 064201 (2008).35A. Stroppa, M. Marsman, G. Kresse, and S. Picozzi, New J. Phys.
12, 093026 (2010).36H. Wu, A. Stroppa, S. Sakong, S. Picozzi, M. Scheffler, and
P. Kratzer, Phys. Rev. Lett. 105, 267203 (2010).37A. Stroppa, G. Kresse, and A. Continenza, Phys. Rev. B 83, 085201
(2011).38R. Wyckoff, Crystal Structures (Wiley, New York, 1963), Vol. 1.39F. Jollet, C. Noguera, N. Thromat, M. Gautier, and J. P. Duraud,
Phys. Rev. B 42, 7587 (1990).40H. Yusa, T. Tsuchiya, N. Sata, and Y. Ohishi, Inorg. Chem. 49, 4478
(2010).41P. Villars and L. D. Calvert, Pearson’s Handbook of Crystallo-
graphic Data for Intermetallic Phases, 2nd Ed. (ASM International,Ohio, 1991), Vol. IV.
42Y.-N. Xu, Z. Q. Gu, and W. Y. Ching, Phys. Rev. B 56, 14993(1997).
43J. P. Perdew, K. Burke, and M. Ernzerhof, Phys. Rev. Lett. 77, 3865(1996); 78, 1396(E) (1997).
44G. Kresse and J. Furthmuller, Phys. Rev. B 54, 11169 (1996).45G. Kresse and J. Hafner, Phys. Rev. B 47, R558 (1993).
46G. Kresse and J. Furthmuller, Comput. Mat. Sci. 6, 15 (1996).47G. Kresse and D. Joubert, Phys. Rev. B 59, 1758 (1999).48P. E. Blochl, Phys. Rev. B 50, 17953 (1994).49H. J. Monkhorst and J. D. Pack, Phys. Rev. B 13, 5188 (1976).50O. Unal and M. Akinc, J. Am. Ceram. Soc. 79, 805 (1996).51B. Xu, V. R. Cooper, D. J. Singh, and Y. P. Feng, Phys. Rev. B 83,
064115 (2011).52L. Ning, Y. Zhang, and Z. Cui, J. Phys.: Condens. Matter 21, 455601
(2009).53L. Marsella and V. Fiorentini, Phys. Rev. B 69, 172103 (2004).54C. G. Van de Walle, Physica B: Condens. Matter 376–377, 1
(2006).55C. G. Van de Walle and J. Neugebauer, J. Appl. Phys. 95, 3851
(2004).56C. G. Van de Walle, in Electron Devices Meeting, 2005 (IEDM
Technical Digest. IEEE International, 2005), p. 403.57J. Robertson and P. W. Peacock, Thin Solid Films 445, 155 (2003).58P. W. Peacock and J. Robertson, Appl. Phys. Lett. 83, 2025 (2003).59P. A. Cox, in Transition Metal Oxides (Clarendon Press, Oxford,
1992), ch. 2.60B. D. Patterson, Rev. Mod. Phys. 60, 69 (1988).61J. M. Gil, P. J. Mendes, L. P. Ferreira, H. V. Alberto, R. C. Vilao,
N. Ayres de Campos, A. Weidinger, Y. Tomm, Ch. Niedermayer,M. V. Yakushev, R. D. Tomlinson, S. P. Cottrell, and S. F. J. Cox,Phys. Rev. B 59, 1912 (1999).
62R. C. Vilao, J. M. Gil, H. V. Alberto, J. Piroto Duarte, N. Ayres deCampos, A. Weidinger, M. V. Yakushev, and S. F. J. Cox, PhysicaB 326, 181 (2003).
63V. Corregidor, D. Martın y Marero, J. M. Gil, and E. Dıeguez,Europhys. Lett. 67, 247 (2004).
165211-14
Related Documents