Hydrogen Adsorption and Storage on Porous Materials K. M. Thomas. School of Chemical Engineering and Advanced Materials Newcastle University United Kingdom H2FC SUPERGEN Conference Birmingham University, 16-18 th December 2013

Welcome message from author
This document is posted to help you gain knowledge. Please leave a comment to let me know what you think about it! Share it to your friends and learn new things together.
Transcript
Hydrogen Adsorption and Storage on Porous Materials
K. M. Thomas.
School of Chemical Engineering and Advanced Materials
Newcastle University
United Kingdom
H2FC SUPERGEN Conference
Birmingham University,
16-18th December 2013
Structure of Presentation • Background on the Hydrogen Economy • H2 adsorption capacities for carbon,
polymer and metal organic framework porous materials
• Quantum kinetic molecular sieving of H2 and D2
• H2 surface interaction energy, adsorption enthalpies at zero surface coverage
• Hysteretic adsorption of H2 on porous metal organic frameworks
• Conclusions
Why are we considering the possibility of the hydrogen economy?
• We are close to, or at, peak oil production
• Future decline in petroleum reserves
will probably lead to high cost of petroleum
• Security of supply issues, environment
• Medium Term Replacement: Shale gas
• Longer term: Hydrogen
Current Hydrogen Use
• Hydrogen is widely used in industry where safety issues and use can be controlled. It is distributed in pipelines over a limited area to different chemical processes.
• The problems arise in the use of hydrogen for transport applications
• Storage of hydrogen with a 300 mile refuelling range is an unsolved problem. The problem is fitting the required volume of the fuel tank into a car
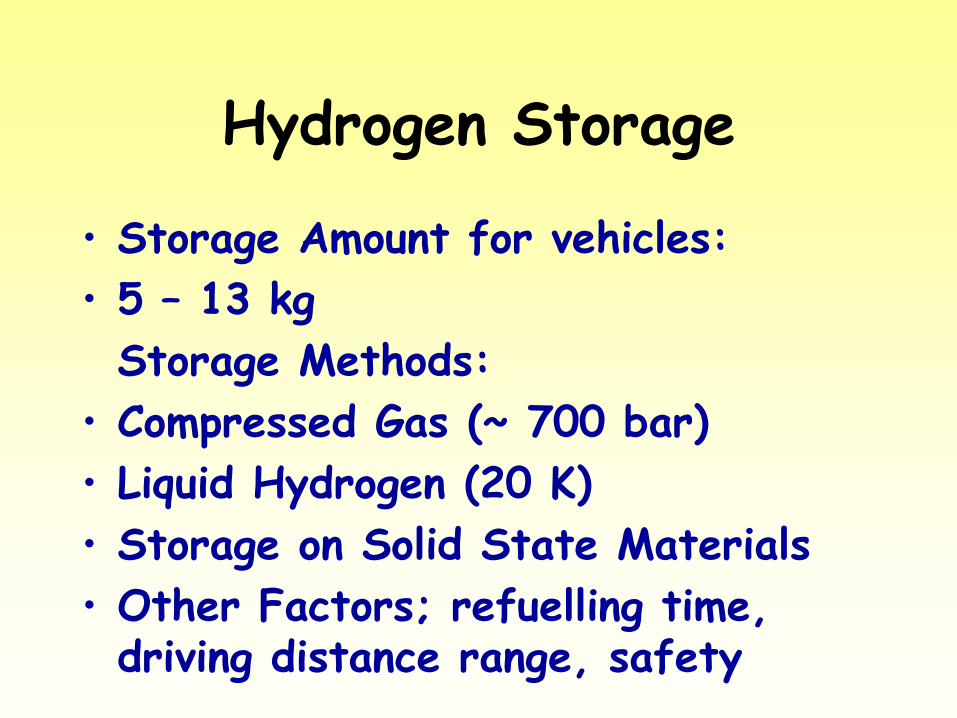
Hydrogen Storage
• Storage Amount for vehicles:
• 5 – 13 kg
Storage Methods:
• Compressed Gas (~ 700 bar)
• Liquid Hydrogen (20 K)
• Storage on Solid State Materials
• Other Factors; refuelling time, driving distance range, safety
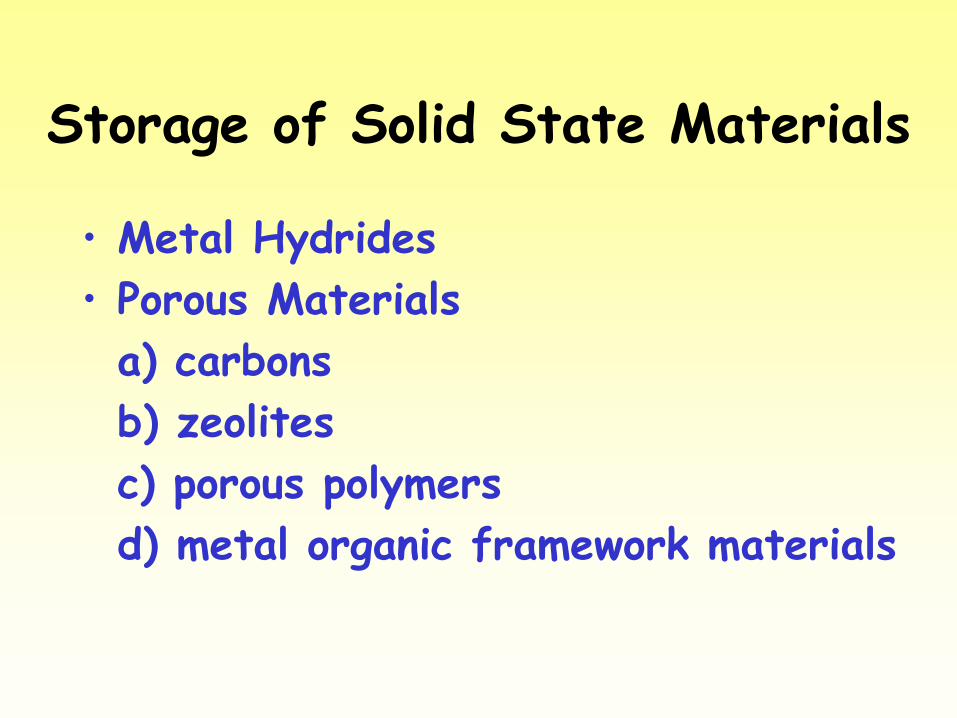
Storage of Solid State Materials
• Metal Hydrides
• Porous Materials
a) carbons
b) zeolites
c) porous polymers
d) metal organic framework materials
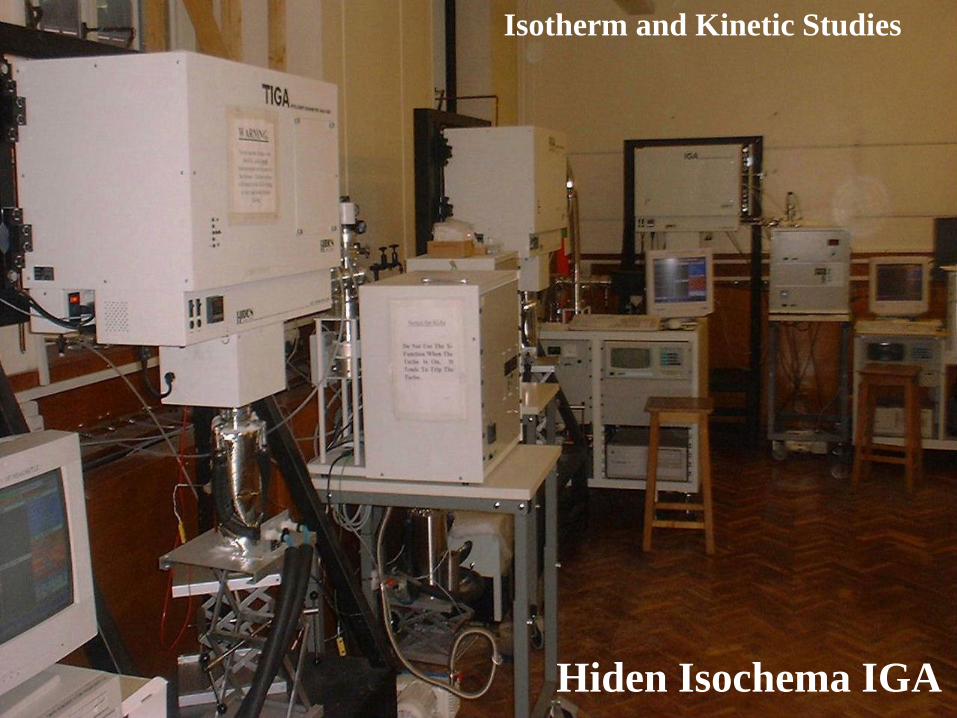
Hiden Isochema IGA
Isotherm and Kinetic Studies
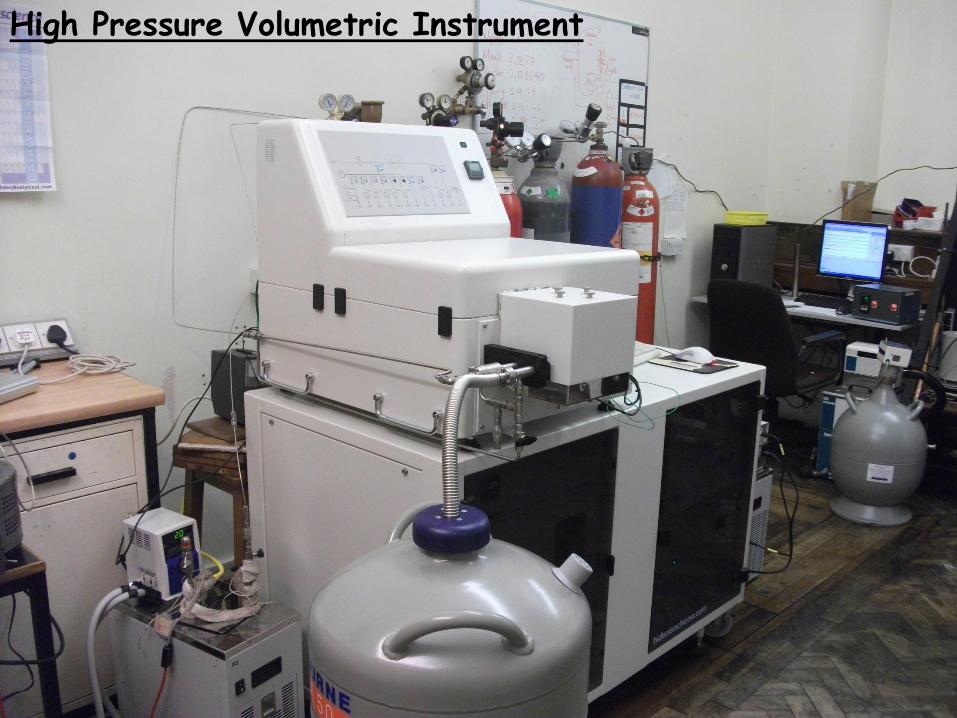
High Pressure Volumetric Instrument
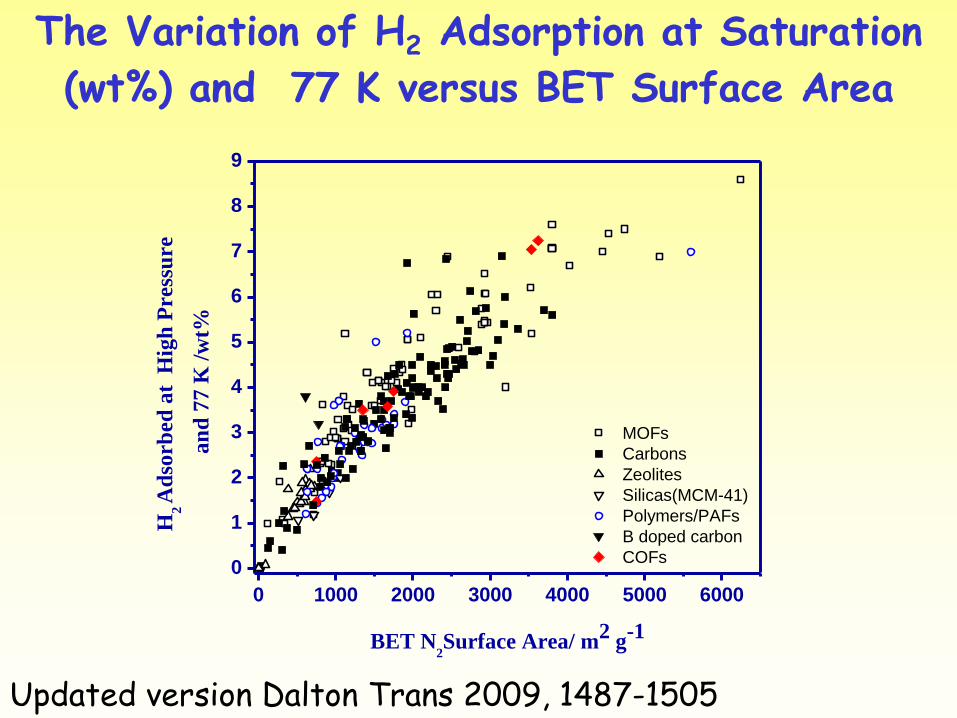
The Variation of H2 Adsorption at Saturation
(wt%) and 77 K versus BET Surface Area
Updated version Dalton Trans 2009, 1487-1505
0 1000 2000 3000 4000 5000 6000
0
1
2
3
4
5
6
7
8
9H
2 A
dso
rb
ed
at
Hig
h P
ress
ure
an
d 7
7 K
/w
t%
BET N2Surface Area/ m
2 g
-1
MOFs
Carbons
Zeolites
Silicas(MCM-41)
Polymers/PAFs
B doped carbon
COFs
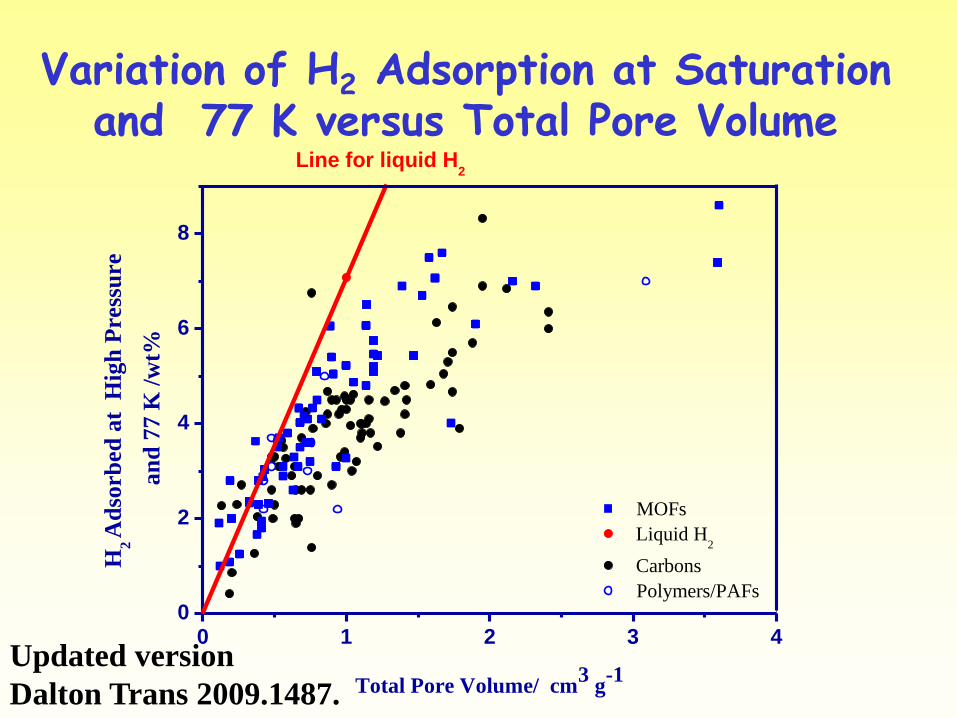
Variation of H2 Adsorption at Saturation and 77 K versus Total Pore Volume
0 1 2 3 40
2
4
6
8
H2 A
dso
rb
ed
at
Hig
h P
ress
ure
an
d 7
7 K
/w
t%
Total Pore Volume/ cm3
g-1
MOFs
Liquid H2
Carbons
Polymers/PAFs
Line for liquid H2
Updated version
Dalton Trans 2009.1487.
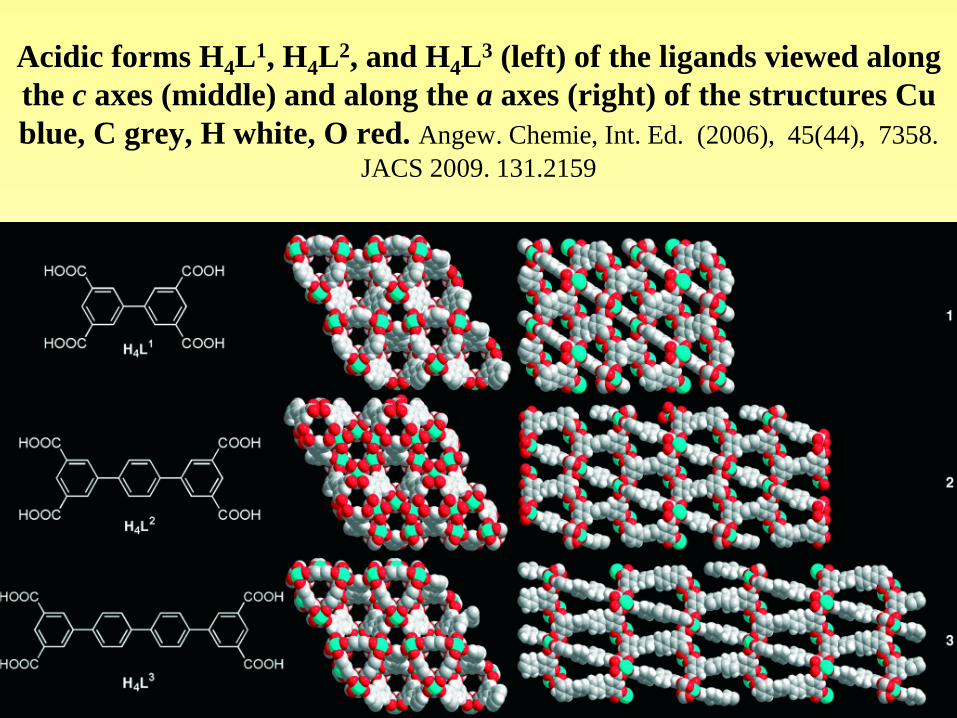
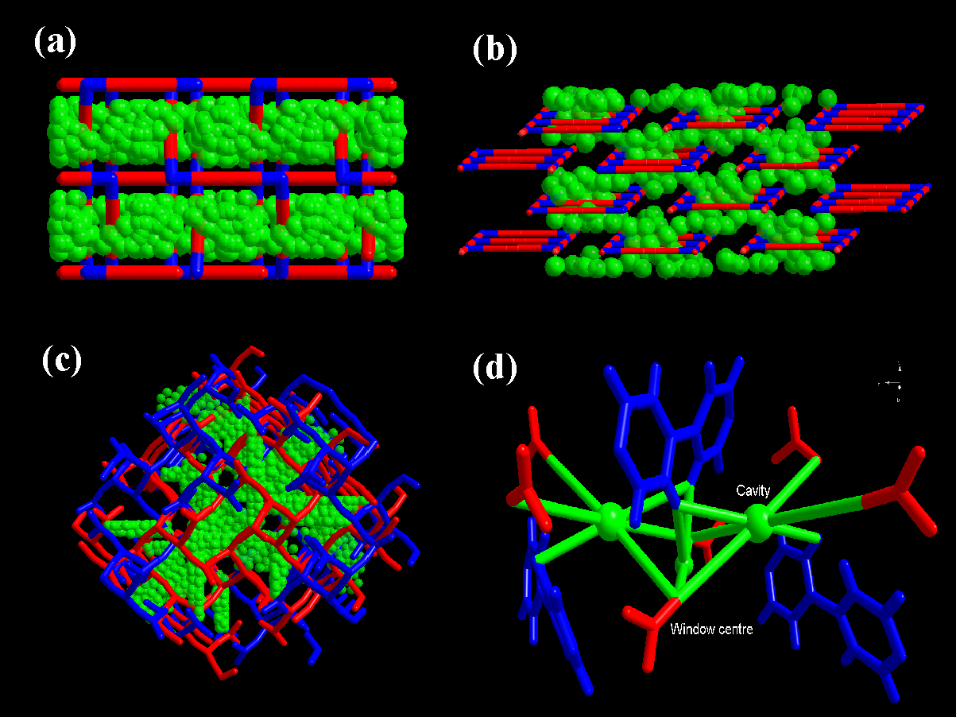
Acidic forms H4L1, H4L
2, and H4L3 (left) of the ligands viewed along
the c axes (middle) and along the a axes (right) of the structures Cu
blue, C grey, H white, O red. Angew. Chemie, Int. Ed. (2006), 45(44), 7358.
JACS 2009. 131.2159
Hydrogen Adsorption Capacities
• 7-12 wt% maximum surface excess hydrogen can be adsorbed at 77 K
• The highest values (MOF200, MOF210 and NU100) are achieved for very low density materials, which, as a consequence, have low volumetric capacities
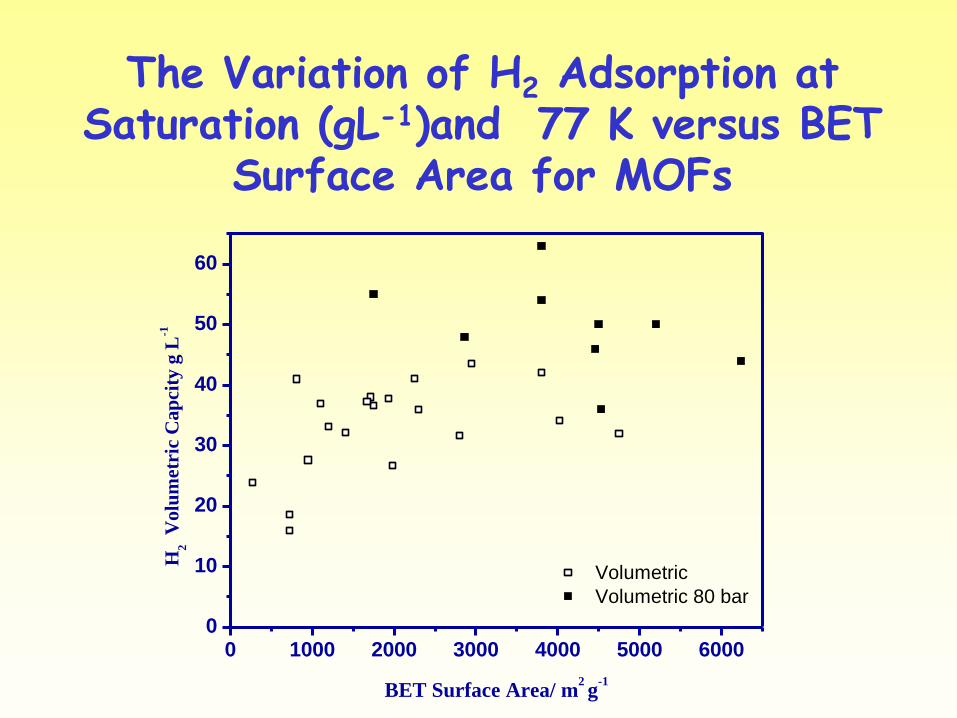
The Variation of H2 Adsorption at Saturation (gL-1)and 77 K versus BET
Surface Area for MOFs
0 1000 2000 3000 4000 5000 60000
10
20
30
40
50
60
Volumetric
Volumetric 80 bar
H2 V
olu
metr
ic C
ap
city
g L
-1
BET Surface Area/ m2 g
-1
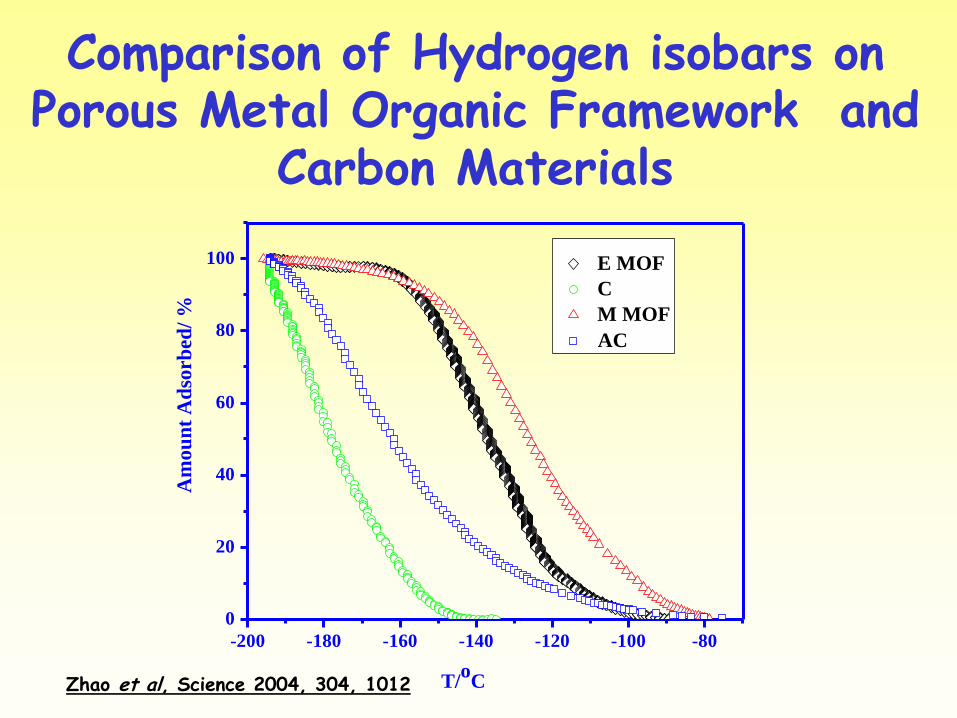
Comparison of Hydrogen isobars on Porous Metal Organic Framework and
Carbon Materials
-200 -180 -160 -140 -120 -100 -80
0
20
40
60
80
100
Am
ou
nt
Ad
sorb
ed/
%
T/o
C
E MOF
C
M MOF
AC
Zhao et al, Science 2004, 304, 1012
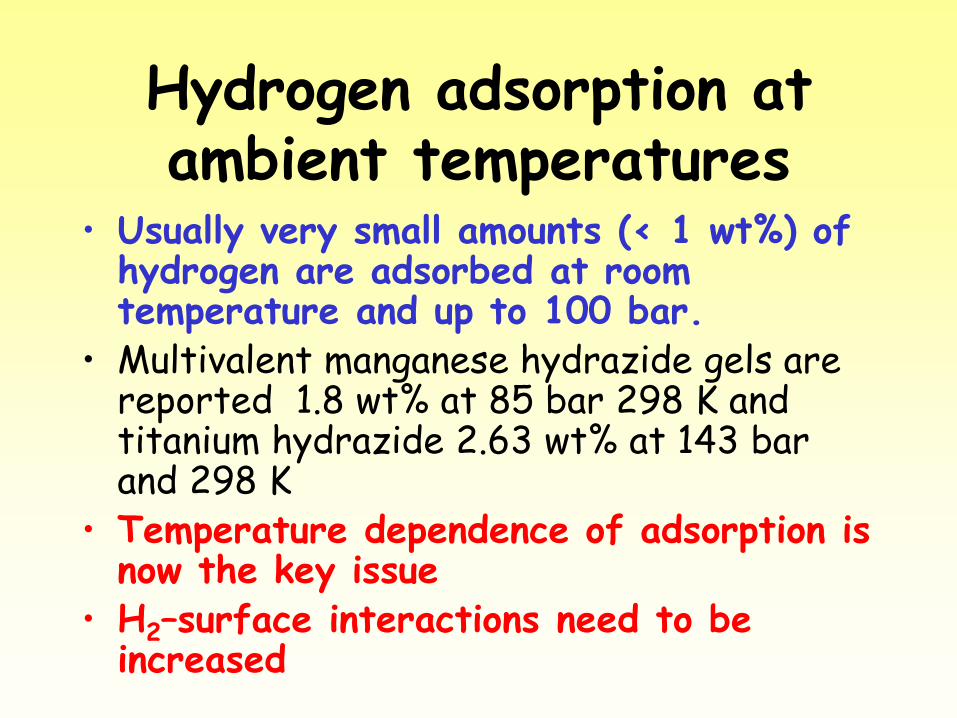
Hydrogen adsorption at ambient temperatures
• Usually very small amounts (< 1 wt%) of hydrogen are adsorbed at room temperature and up to 100 bar.
• Multivalent manganese hydrazide gels are reported 1.8 wt% at 85 bar 298 K and titanium hydrazide 2.63 wt% at 143 bar and 298 K
• Temperature dependence of adsorption is now the key issue
• H2–surface interactions need to be increased
Aspects of hydrogen adsorption
• Quantum effects for porous carbons and metal organic frameworks
• Enhanced surface interactions in metal organic frameworks
• Hysteretic hydrogen adsorption in metal organic framework materials
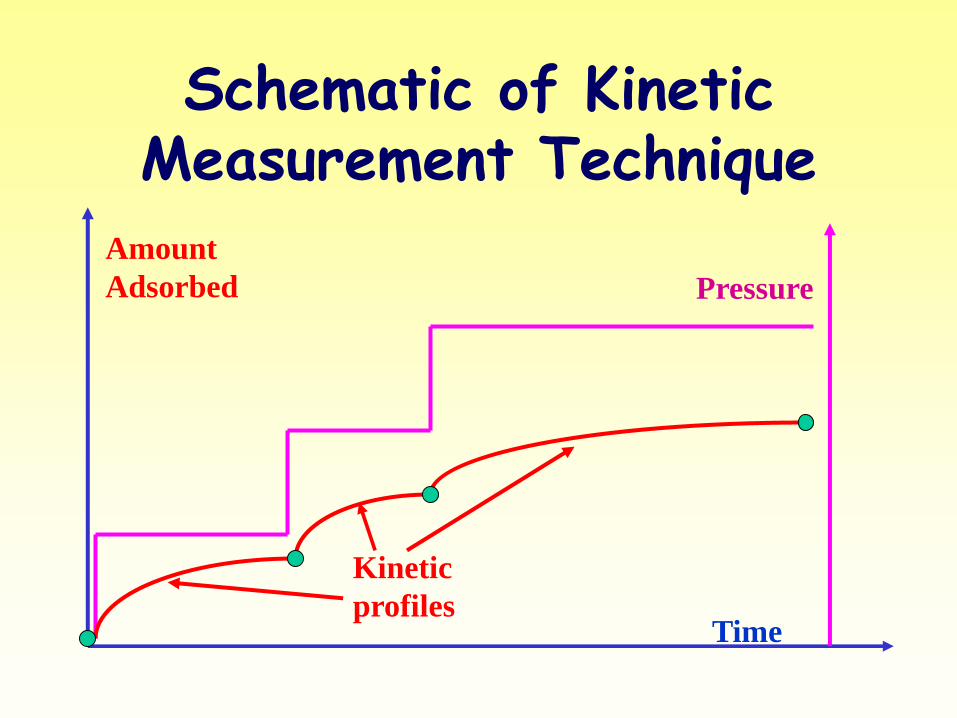
Schematic of Kinetic Measurement Technique
Pressure
Amount
Adsorbed
Kinetic
profiles Time
Quantum Effects in Adsorption • Kinetic Isotope Molecular Sieving • This occurs when the differences between the
adsorptive and the pore sizes are similar to the de Broglie wavelength.
• First experimental observation was for H2 and D2 adsorption on a carbon molecular sieve used for air separation and the corresponding activated carbon substrate.(J Phys Chem B 2006,110,9947)
• In the case of carbons the pores size is not known precisely but probe molecules show that molecular cross sections of 4.5 A are the upper limit (J Phys Chem B 2001,105, 10619)
• In contrast, the pore sizes in MOFs are known from crystallographic studies.
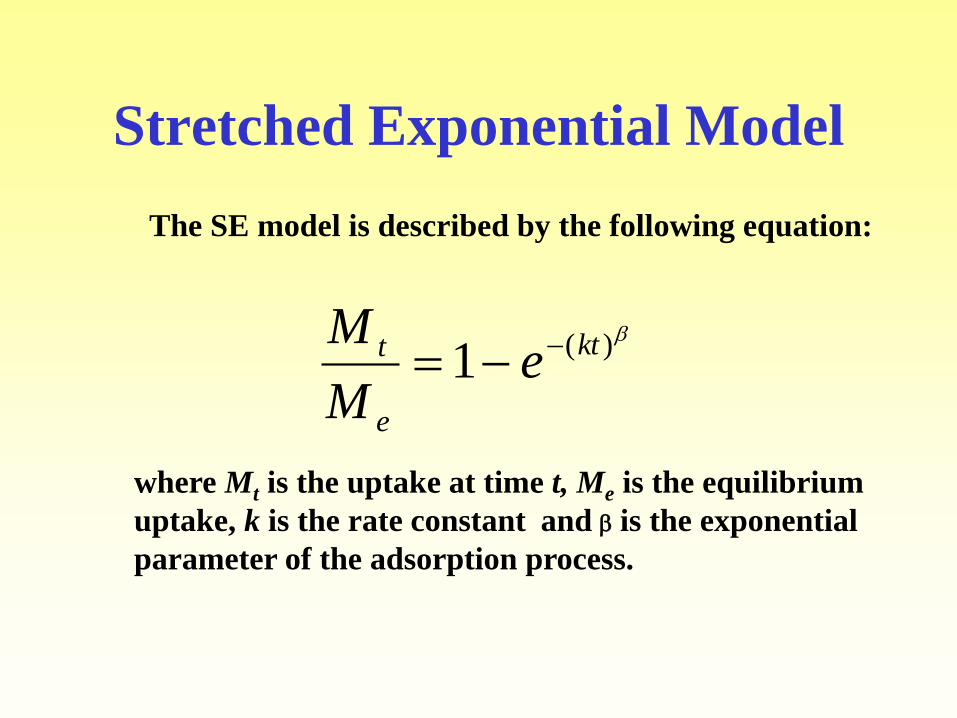
Stretched Exponential Model
)(1 kt
e
t eM
M
The SE model is described by the following equation:
where Mt is the uptake at time t, Me is the equilibrium
uptake, k is the rate constant and is the exponential
parameter of the adsorption process.
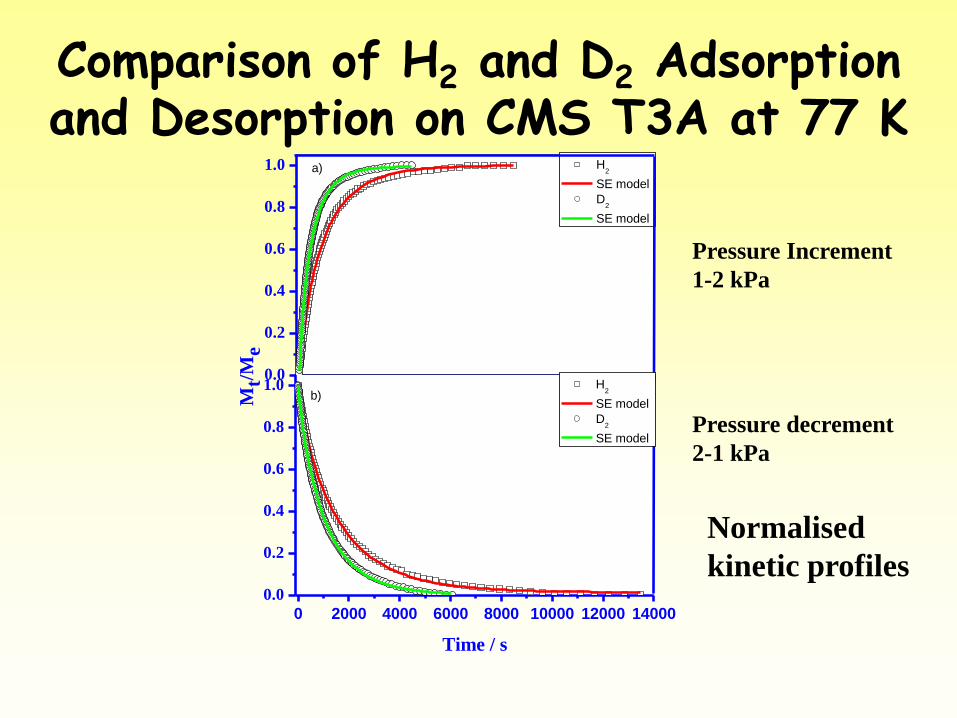
Comparison of H2 and D2 Adsorption and Desorption on CMS T3A at 77 K
0.0
0.2
0.4
0.6
0.8
1.0
0 2000 4000 6000 8000 10000 12000 14000
0.0
0.2
0.4
0.6
0.8
1.0 M
t/M
e
H2
SE model
D2
SE model
a)
Time / s
H2
SE model
D2
SE model
b)
Pressure Increment
1-2 kPa
Pressure decrement
2-1 kPa
Normalised
kinetic profiles
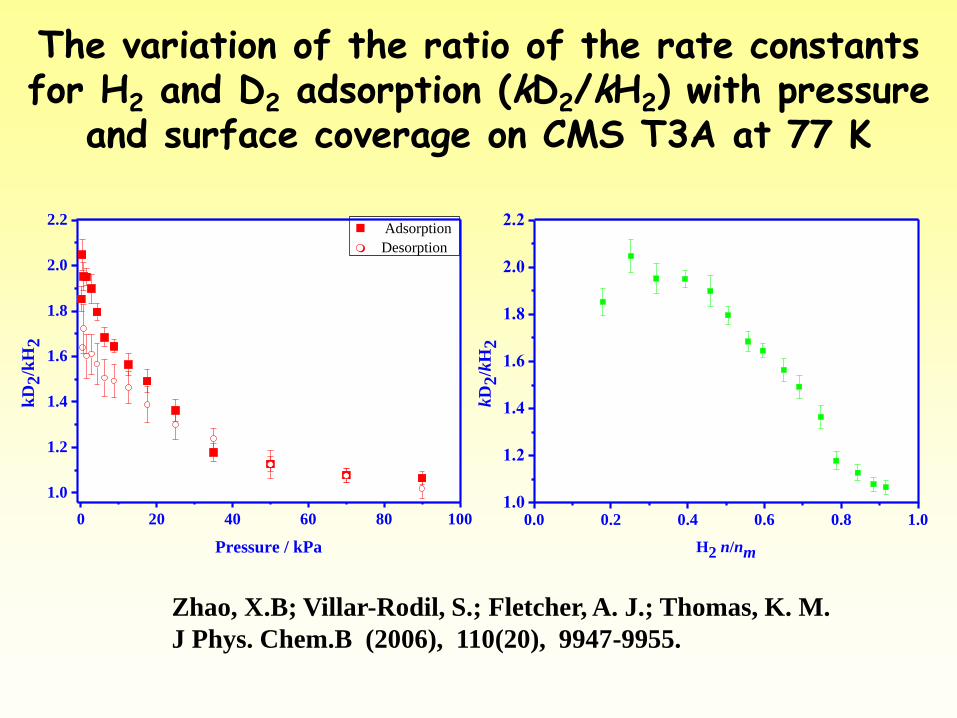
The variation of the ratio of the rate constants for H2 and D2 adsorption (kD2/kH2) with pressure
and surface coverage on CMS T3A at 77 K
0 20 40 60 80 100
1.0
1.2
1.4
1.6
1.8
2.0
2.2
kD
2/k
H2
Pressure / kPa
Adsorption
Desorption
0.0 0.2 0.4 0.6 0.8 1.01.0
1.2
1.4
1.6
1.8
2.0
2.2
kD
2/k
H2
H2 n/nm
Zhao, X.B; Villar-Rodil, S.; Fletcher, A. J.; Thomas, K. M.
J Phys. Chem.B (2006), 110(20), 9947-9955.
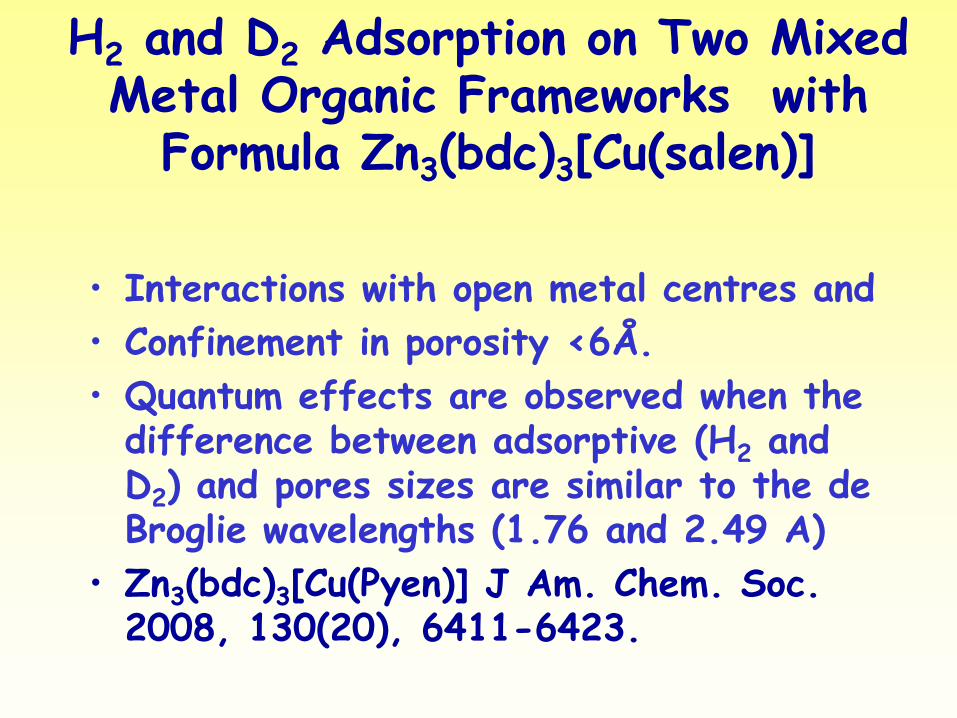
H2 and D2 Adsorption on Two Mixed Metal Organic Frameworks with
Formula Zn3(bdc)3[Cu(salen)]
• Interactions with open metal centres and
• Confinement in porosity <6Å.
• Quantum effects are observed when the difference between adsorptive (H2 and D2) and pores sizes are similar to the de Broglie wavelengths (1.76 and 2.49 A)
• Zn3(bdc)3[Cu(Pyen)] J Am. Chem. Soc. 2008, 130(20), 6411-6423.
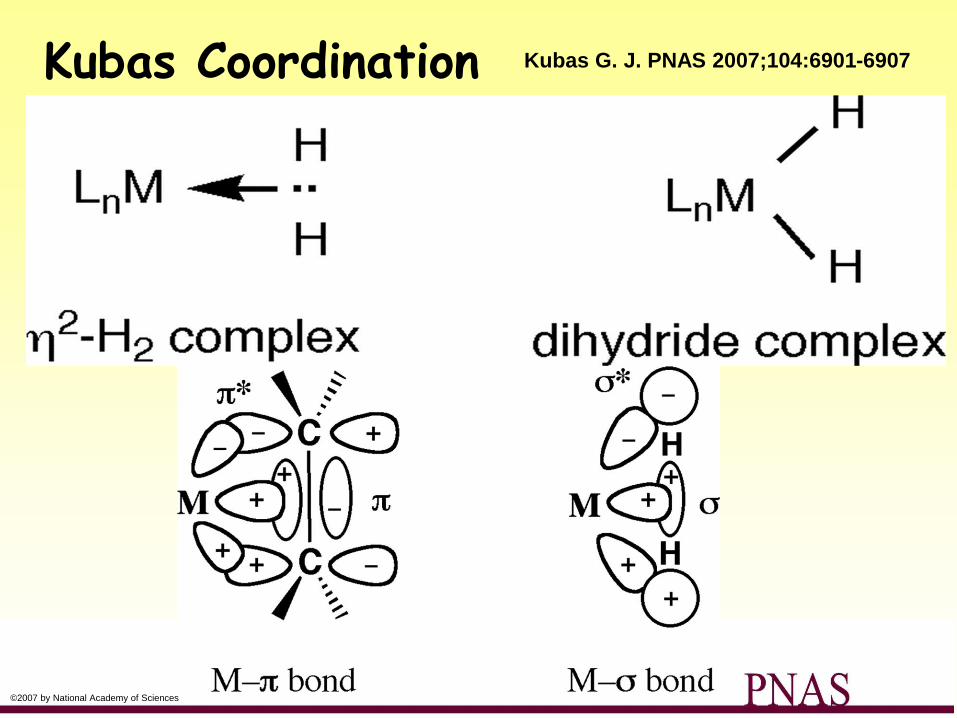
©2007 by National Academy of Sciences
Kubas Coordination Kubas G. J. PNAS 2007;104:6901-6907
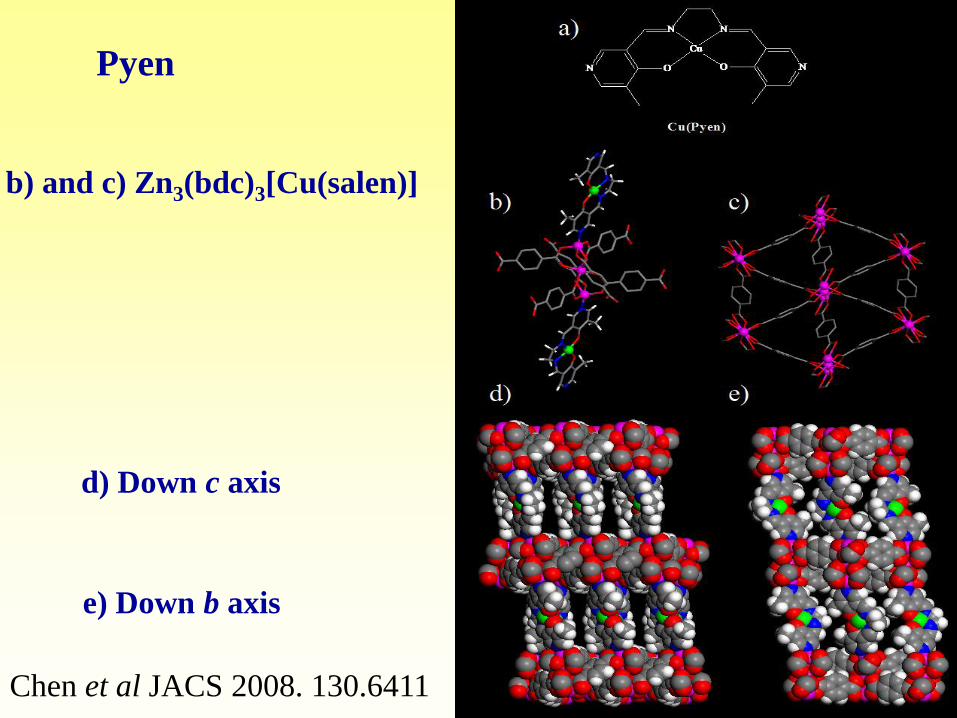
Pyen
d) Down c axis
e) Down b axis
b) and c) Zn3(bdc)3[Cu(salen)]
Chen et al JACS 2008. 130.6411
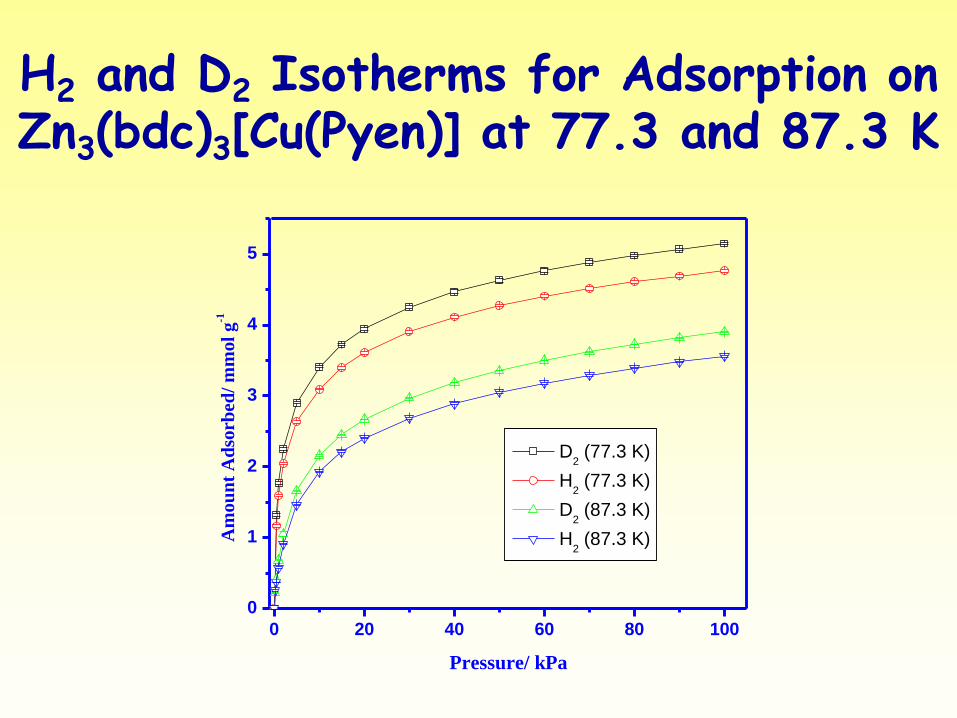
H2 and D2 Isotherms for Adsorption on Zn3(bdc)3[Cu(Pyen)] at 77.3 and 87.3 K
0 20 40 60 80 100
0
1
2
3
4
5
Am
ou
nt
Ad
sorb
ed/
mm
ol
g-1
Pressure/ kPa
D2 (77.3 K)
H2 (77.3 K)
D2 (87.3 K)
H2 (87.3 K)
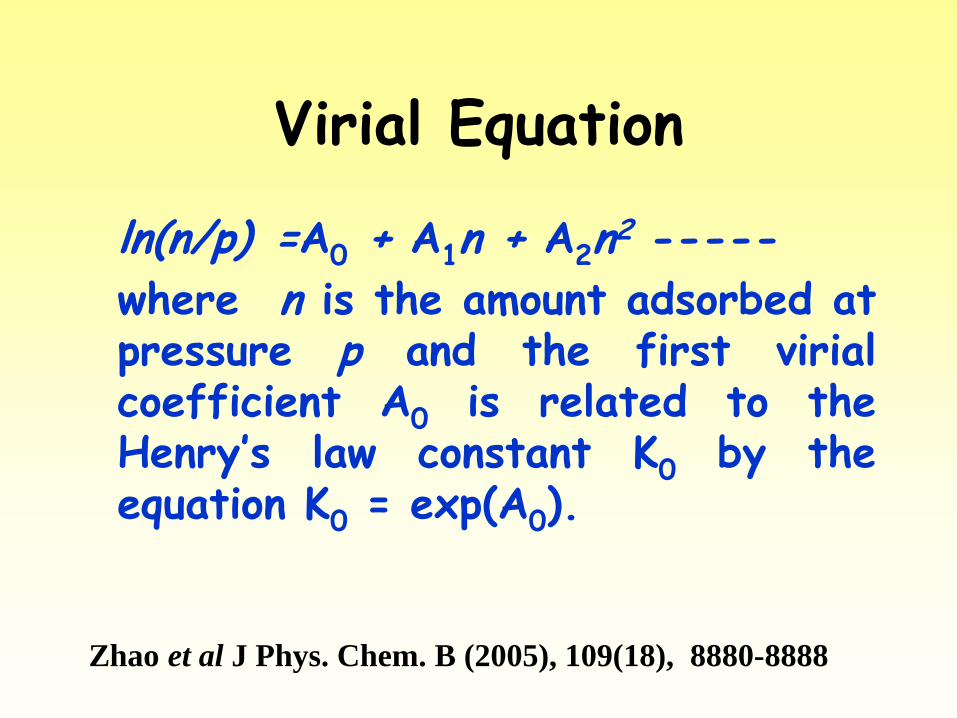
Virial Equation
ln(n/p) =A0 + A1n + A2n2 -----
where n is the amount adsorbed at pressure p and the first virial coefficient A0 is related to the Henry’s law constant K0 by the equation K0 = exp(A0).
Zhao et al J Phys. Chem. B (2005), 109(18), 8880-8888
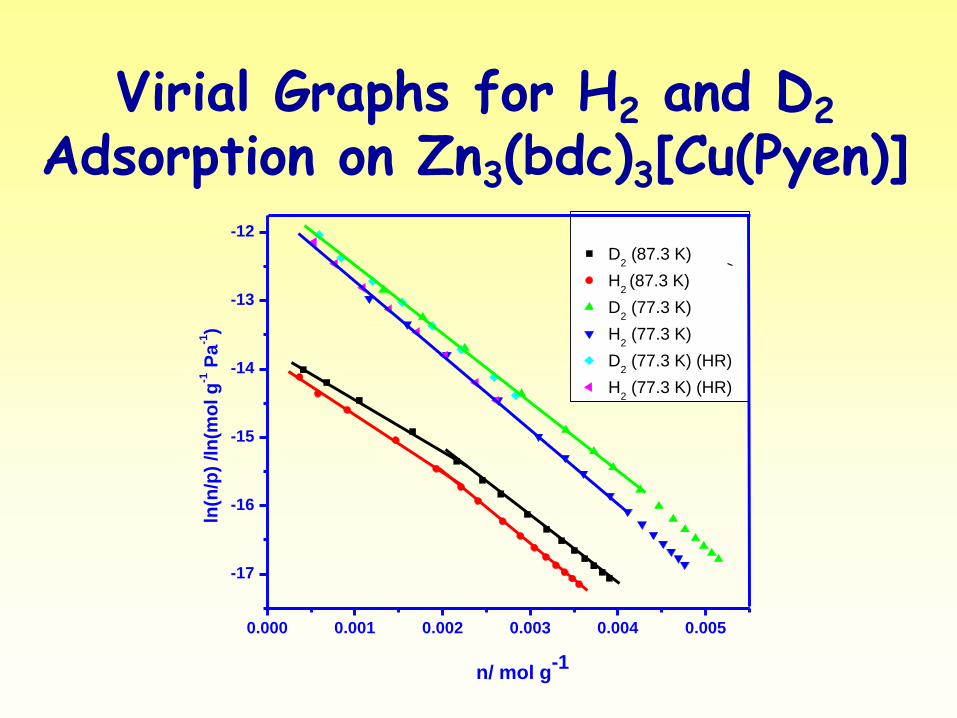
Virial Graphs for H2 and D2 Adsorption on Zn3(bdc)3[Cu(Pyen)]
0.000 0.001 0.002 0.003 0.004 0.005
-17
-16
-15
-14
-13
-12
ln(n
/p)
/ln
(mo
l g
-1 P
a-1)
n/ mol g-1
D2 (87.3 K)
H2 (87.3 K)
D2 (77.3 K)
H2 (77.3 K)
D2 (77.3 K) (HR)
H2 (77.3 K) (HR)
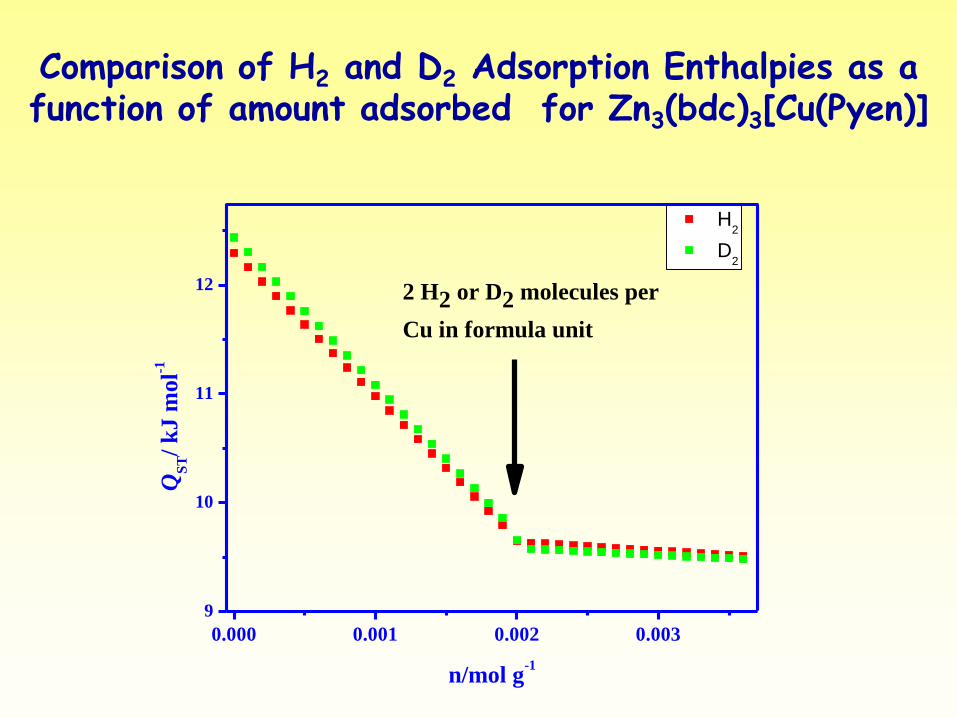
Comparison of H2 and D2 Adsorption Enthalpies as a function of amount adsorbed for Zn3(bdc)3[Cu(Pyen)]
0.000 0.001 0.002 0.003
9
10
11
12
QS
T/
kJ
mo
l-1
n/mol g-1
H2
D2
2 H2 or D2 molecules per
Cu in formula unit
Quantum Kinetic Effects for H2 and D2 Adsorption on
Zn3(bdc)3[Cu(Pyen)]
• 2-dimensional porous structure in the bc crystallographic plane
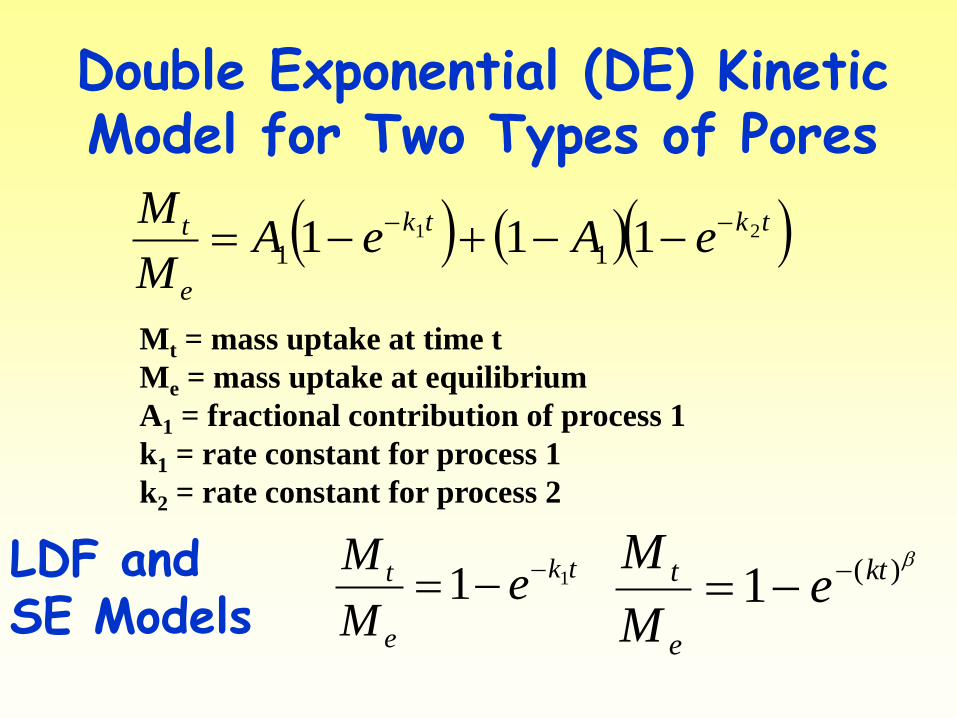
Double Exponential (DE) Kinetic Model for Two Types of Pores
tktk
e
t eAeAM
M21 111 11
Mt = mass uptake at time t
Me = mass uptake at equilibrium
A1 = fractional contribution of process 1
k1 = rate constant for process 1
k2 = rate constant for process 2
tk
e
t eM
M11
LDF and SE Models
)(1 kt
e
t eM
M
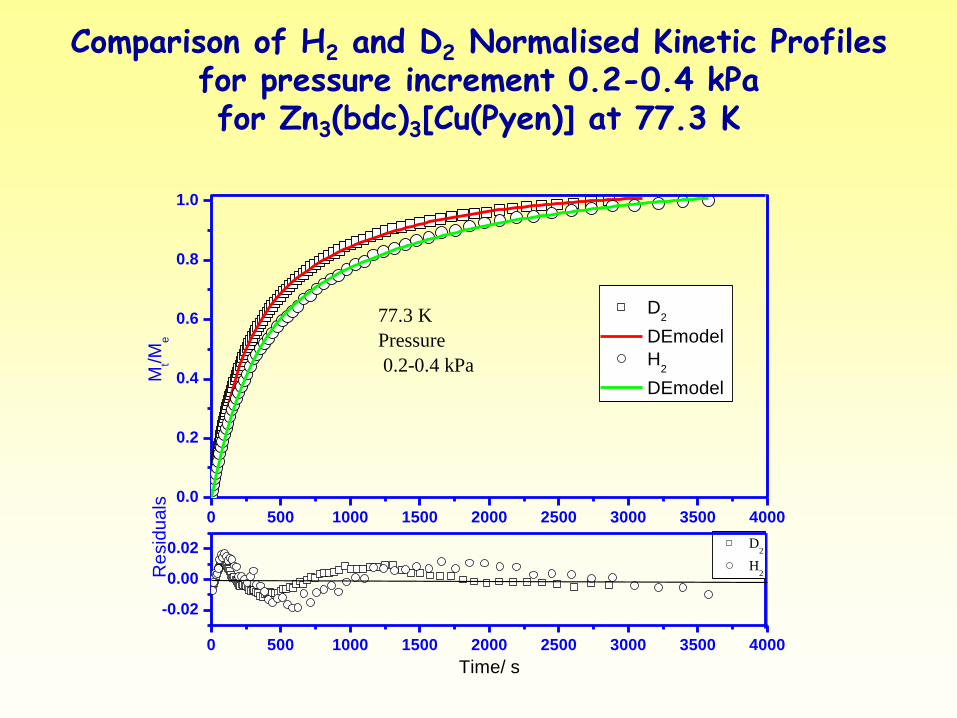
Comparison of H2 and D2 Normalised Kinetic Profiles for pressure increment 0.2-0.4 kPa for Zn3(bdc)3[Cu(Pyen)] at 77.3 K
0 500 1000 1500 2000 2500 3000 3500 4000
0.0
0.2
0.4
0.6
0.8
1.0
0 500 1000 1500 2000 2500 3000 3500 4000
-0.02
0.00
0.02
Re
sid
ua
lsM
t/Me
Time/ s
D2
DEmodel
H2
DEmodel
77.3 K
Pressure
0.2-0.4 kPa
D2
H2
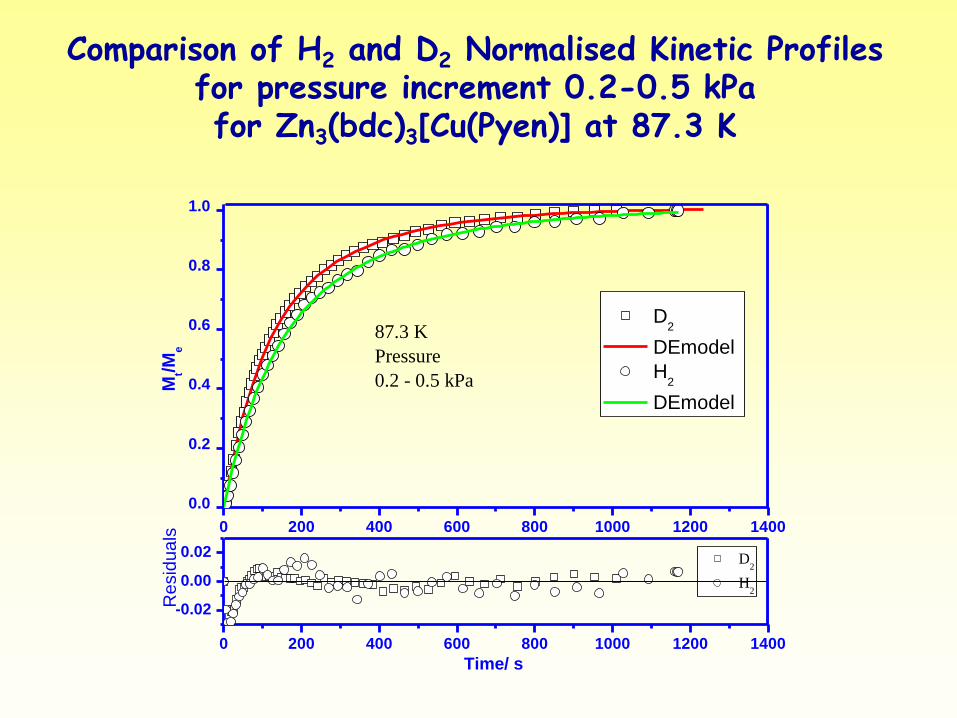
Comparison of H2 and D2 Normalised Kinetic Profiles for pressure increment 0.2-0.5 kPa for Zn3(bdc)3[Cu(Pyen)] at 87.3 K
0 200 400 600 800 1000 1200 1400
0.0
0.2
0.4
0.6
0.8
1.0
0 200 400 600 800 1000 1200 1400
-0.02
0.00
0.02
Time/ s
Mt/M
e
D2
DEmodel
H2
DEmodel
87.3 K
Pressure
0.2 - 0.5 kPa
Re
sid
ua
ls
D2
H2
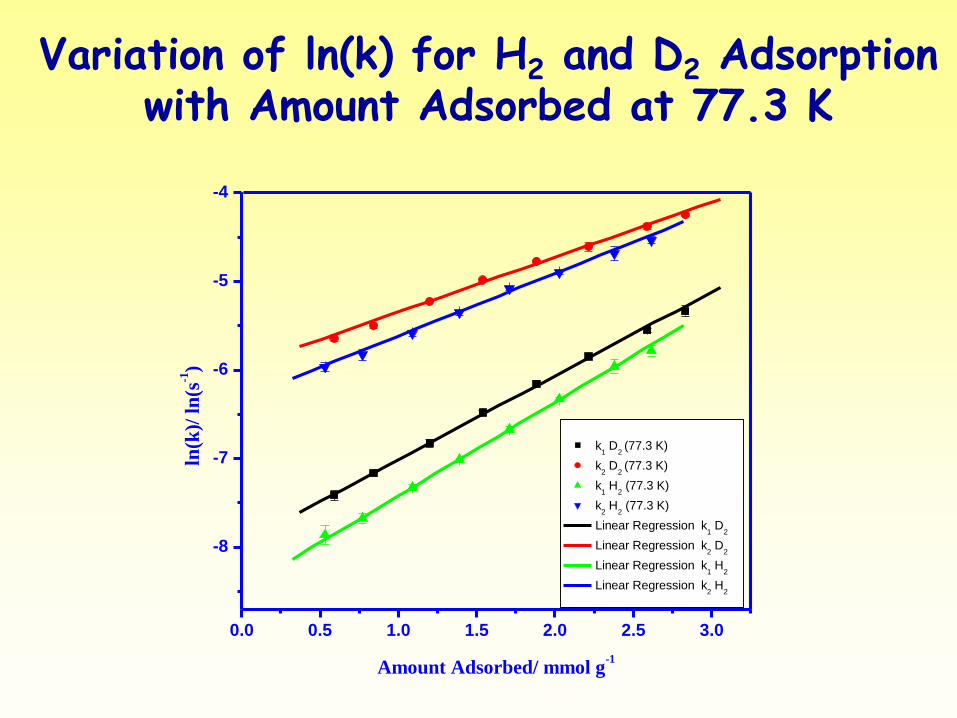
Variation of ln(k) for H2 and D2 Adsorption with Amount Adsorbed at 77.3 K
0.0 0.5 1.0 1.5 2.0 2.5 3.0
-8
-7
-6
-5
-4ln
(k)/
ln
(s-1)
Amount Adsorbed/ mmol g-1
k1 D
2 (77.3 K)
k2 D
2 (77.3 K)
k1 H
2 (77.3 K)
k2 H
2 (77.3 K)
Linear Regression k1 D
2
Linear Regression k2 D
2
Linear Regression k1 H
2
Linear Regression k2 H
2
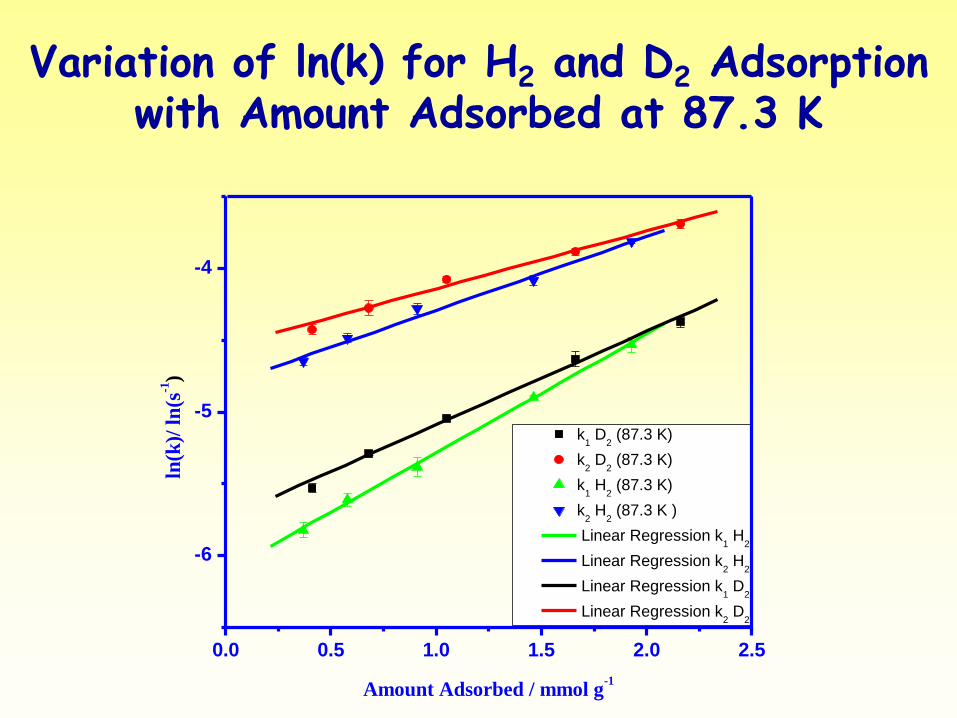
Variation of ln(k) for H2 and D2 Adsorption with Amount Adsorbed at 87.3 K
0.0 0.5 1.0 1.5 2.0 2.5
-6
-5
-4
ln(k
)/ l
n(s
-1)
Amount Adsorbed / mmol g-1
k1 D
2 (87.3 K)
k2 D
2 (87.3 K)
k1 H
2 (87.3 K)
k2 H
2 (87.3 K )
Linear Regression k1 H
2
Linear Regression k2 H
2
Linear Regression k1 D
2
Linear Regression k2 D
2
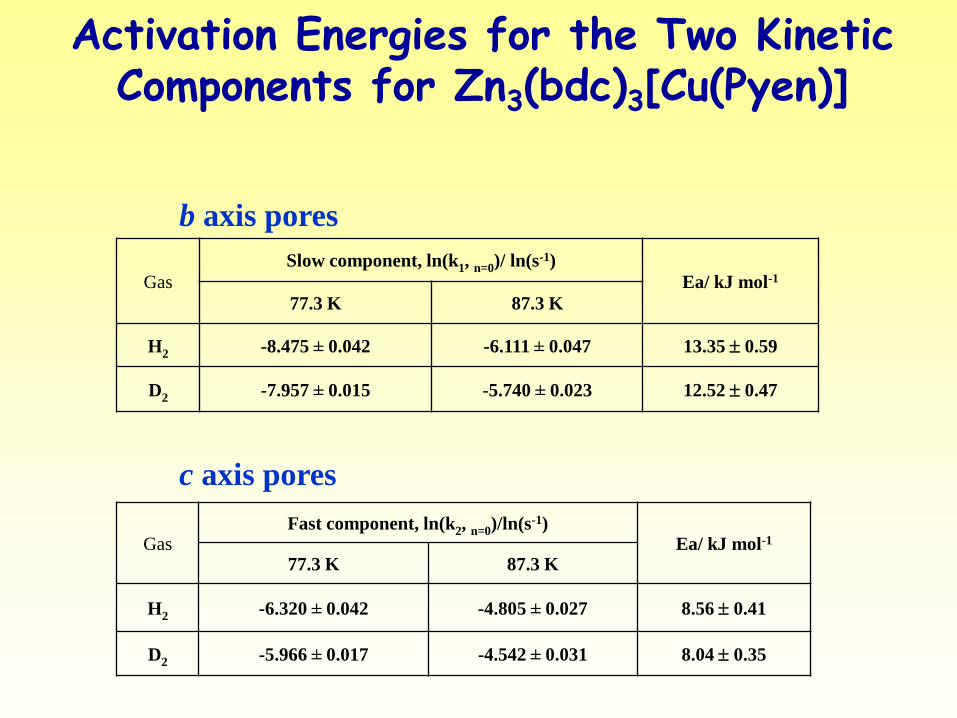
Activation Energies for the Two Kinetic Components for Zn3(bdc)3[Cu(Pyen)]
Gas
Slow component, ln(k1, n=0)/ ln(s-1)
Ea/ kJ mol-1
77.3 K 87.3 K
H2 -8.475 ± 0.042 -6.111 ± 0.047 13.35 0.59
D2 -7.957 ± 0.015 -5.740 ± 0.023 12.52 0.47
Gas Fast component, ln(k2, n=0)/ln(s-1)
Ea/ kJ mol-1 77.3 K 87.3 K
H2 -6.320 ± 0.042 -4.805 ± 0.027 8.56 0.41
D2 -5.966 ± 0.017 -4.542 ± 0.031 8.04 0.35
c axis pores
b axis pores
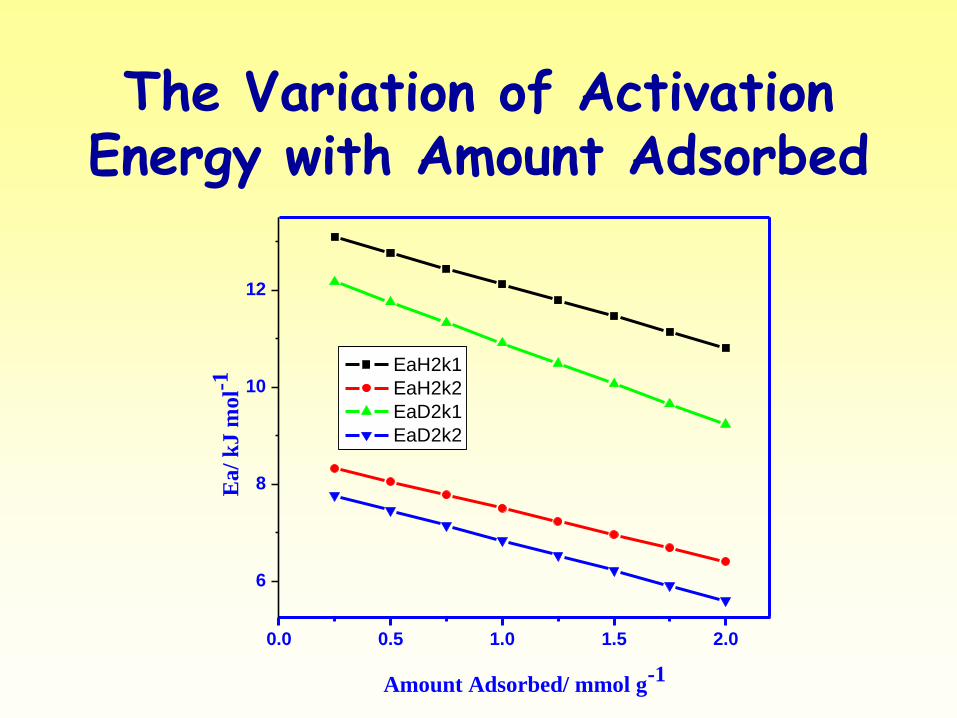
The Variation of Activation Energy with Amount Adsorbed
0.0 0.5 1.0 1.5 2.0
6
8
10
12
Ea
/ k
J m
ol-1
Amount Adsorbed/ mmol g-1
EaH2k1
EaH2k2
EaD2k1
EaD2k2
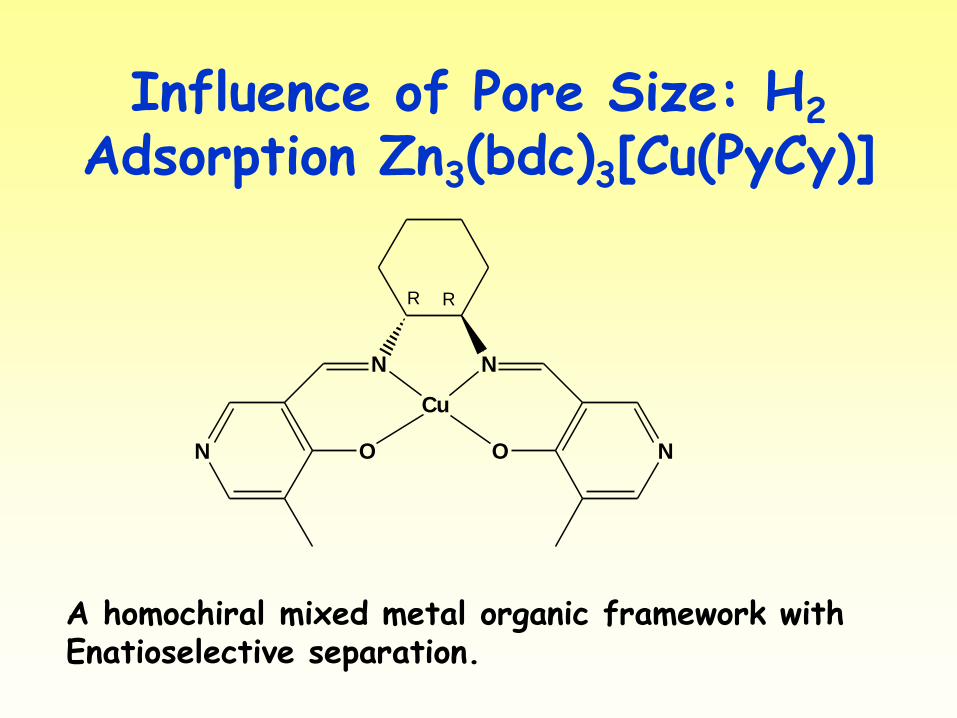
Influence of Pore Size: H2 Adsorption Zn3(bdc)3[Cu(PyCy)]
N
N N
NO O
Cu
RR
A homochiral mixed metal organic framework with Enatioselective separation.
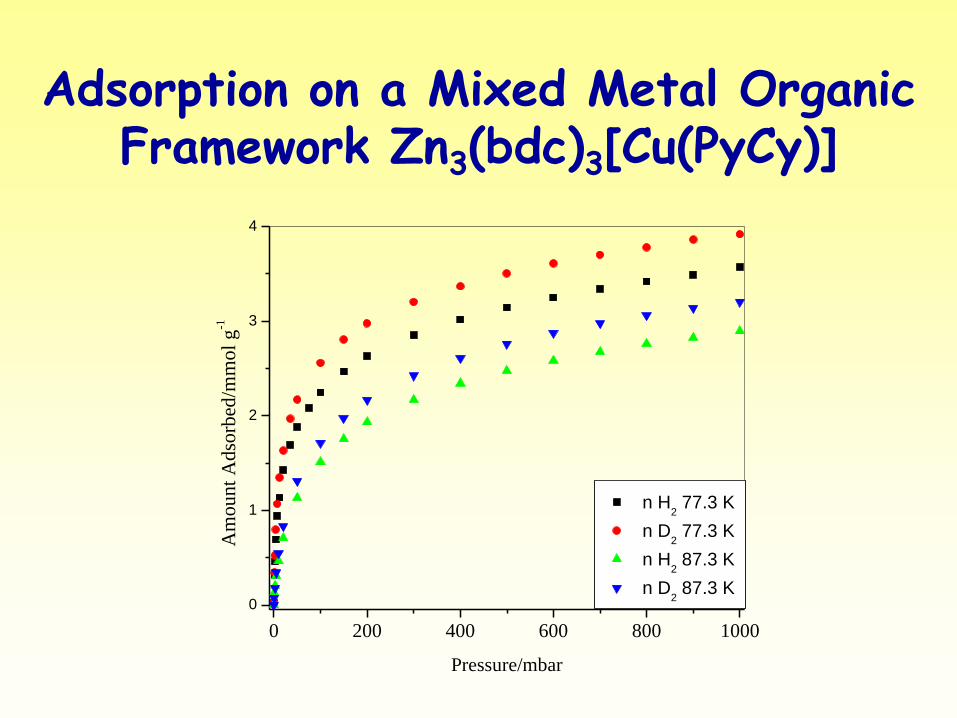
Adsorption on a Mixed Metal Organic Framework Zn3(bdc)3[Cu(PyCy)]
0 200 400 600 800 1000
0
1
2
3
4A
mount
Adso
rbed
/mm
ol
g-1
Pressure/mbar
n H2 77.3 K
n D2 77.3 K
n H2 87.3 K
n D2 87.3 K
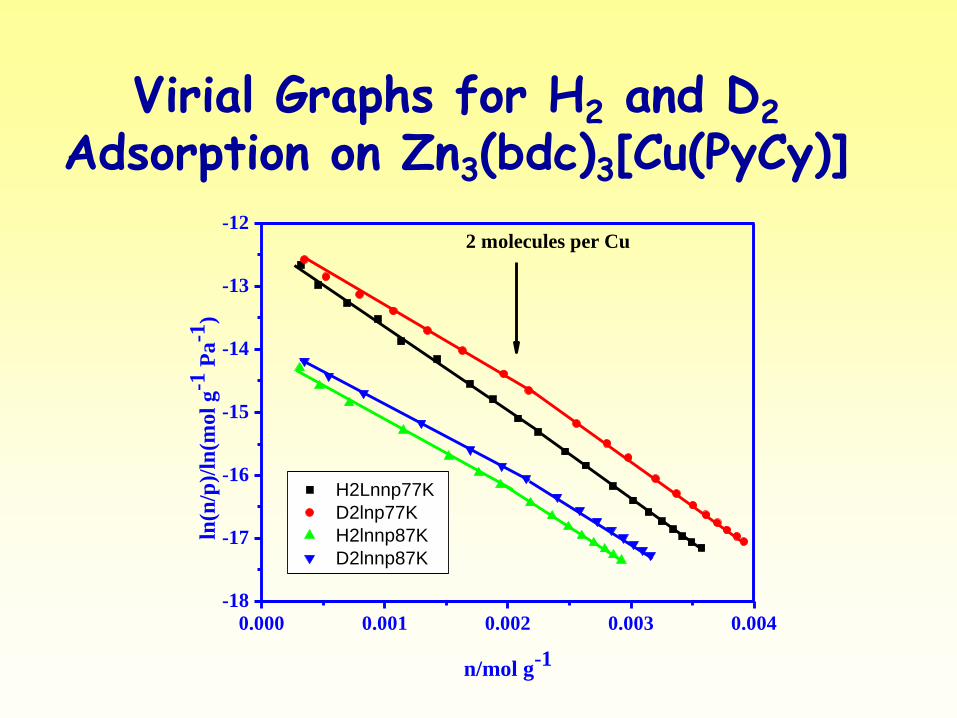
Virial Graphs for H2 and D2 Adsorption on Zn3(bdc)3[Cu(PyCy)]
0.000 0.001 0.002 0.003 0.004
-18
-17
-16
-15
-14
-13
-12ln
(n/p
)/ln
(mol
g-1
Pa
-1)
n/mol g-1
H2Lnnp77K
D2lnp77K
H2lnnp87K
D2lnnp87K
2 molecules per Cu
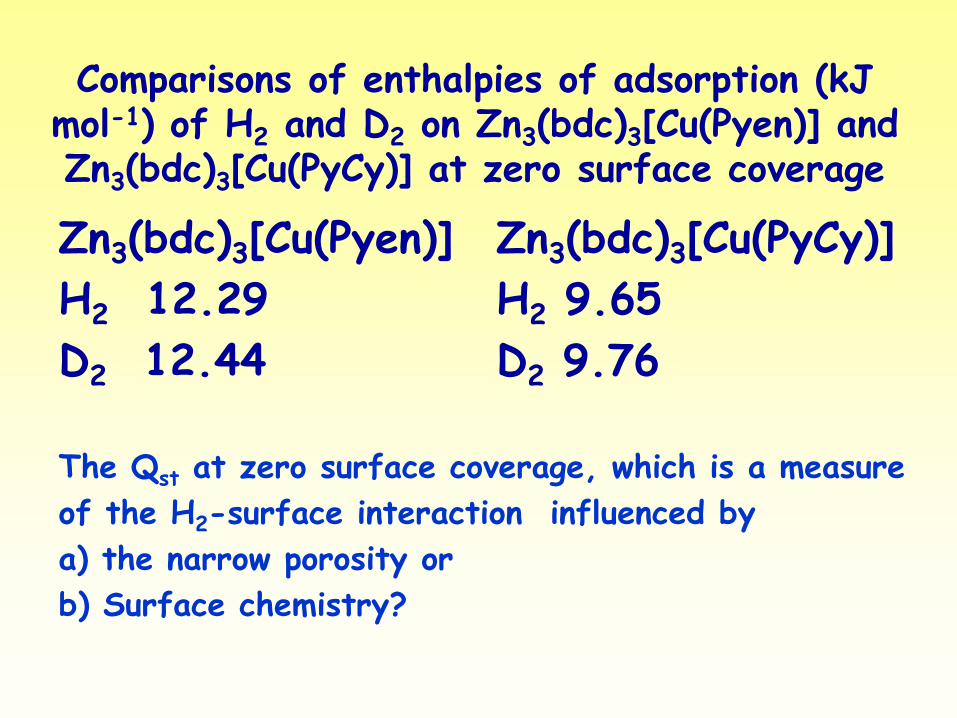
Comparisons of enthalpies of adsorption (kJ mol-1) of H2 and D2 on Zn3(bdc)3[Cu(Pyen)] and Zn3(bdc)3[Cu(PyCy)] at zero surface coverage
Zn3(bdc)3[Cu(Pyen)]
H2 12.29
D2 12.44
Zn3(bdc)3[Cu(PyCy)]
H2 9.65
D2 9.76
The Qst at zero surface coverage, which is a measure
of the H2-surface interaction influenced by
a) the narrow porosity or
b) Surface chemistry?
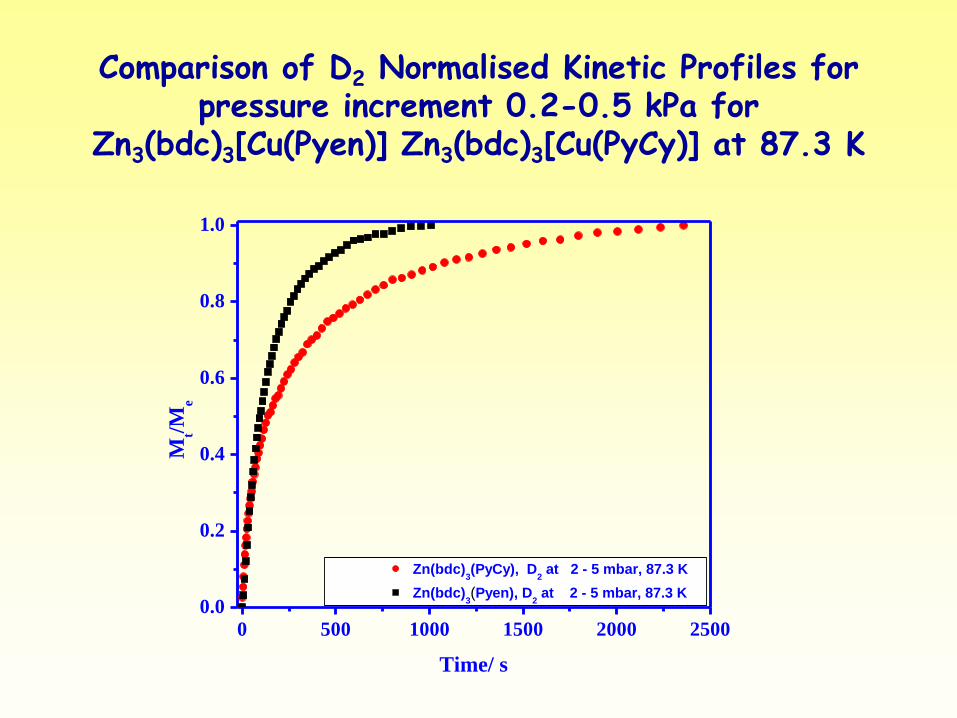
Comparison of D2 Normalised Kinetic Profiles for pressure increment 0.2-0.5 kPa for
Zn3(bdc)3[Cu(Pyen)] Zn3(bdc)3[Cu(PyCy)] at 87.3 K
0 500 1000 1500 2000 2500
0.0
0.2
0.4
0.6
0.8
1.0
Mt/M
e
Time/ s
Zn(bdc)3(PyCy), D
2 at 2 - 5 mbar, 87.3 K
Zn(bdc)3(Pyen), D
2 at 2 - 5 mbar, 87.3 K
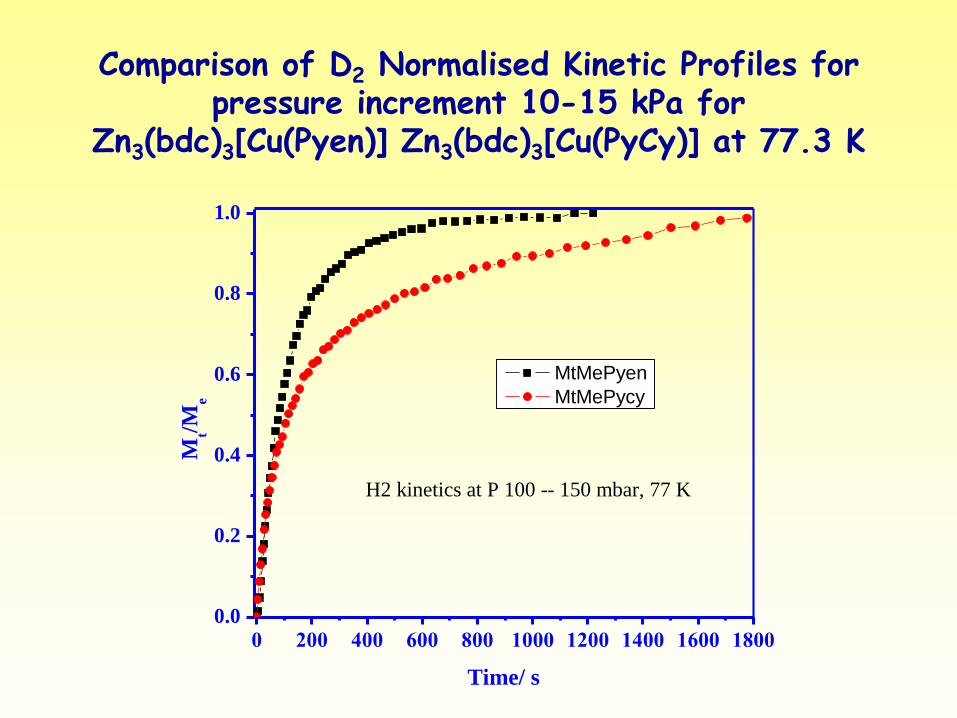
Comparison of D2 Normalised Kinetic Profiles for pressure increment 10-15 kPa for
Zn3(bdc)3[Cu(Pyen)] Zn3(bdc)3[Cu(PyCy)] at 77.3 K
0 200 400 600 800 1000 1200 1400 1600 1800
0.0
0.2
0.4
0.6
0.8
1.0M
t/Me
Time/ s
MtMePyen
MtMePycy
H2 kinetics at P 100 -- 150 mbar, 77 K
Comparisons of adsorption of H2 and D2 on Zn3(bdc)3[Cu(Pyen)] and Zn3(bdc)3[Cu(PyCy)]
• Crystallographic studies show smaller pore sizes and adsorption kinetics for Zn3(bdc)3[Cu(PyCy)] are slower than for Zn3(bdc)3[Cu(Pyen)] indicating narrower porosity.
• nD2/nH2 ratios do not vary greatly with surface coverage and are ~1.1 at 77 and 87 K
• Isosteric Enthalpies for adsorption at Zero Surface Coverage are higher for Zn3(bdc)3[Cu(Pyen)] than for Zn3(bdc)3[Cu(PyCy)]
• The Qst at zero surface coverage is very sensitive to the spatial and/or electronic environments around Cu2+ sites which influence interactions with hydrogen molecules. Smaller pores do not necessarily increase Qst
Hysteretic Adsorption
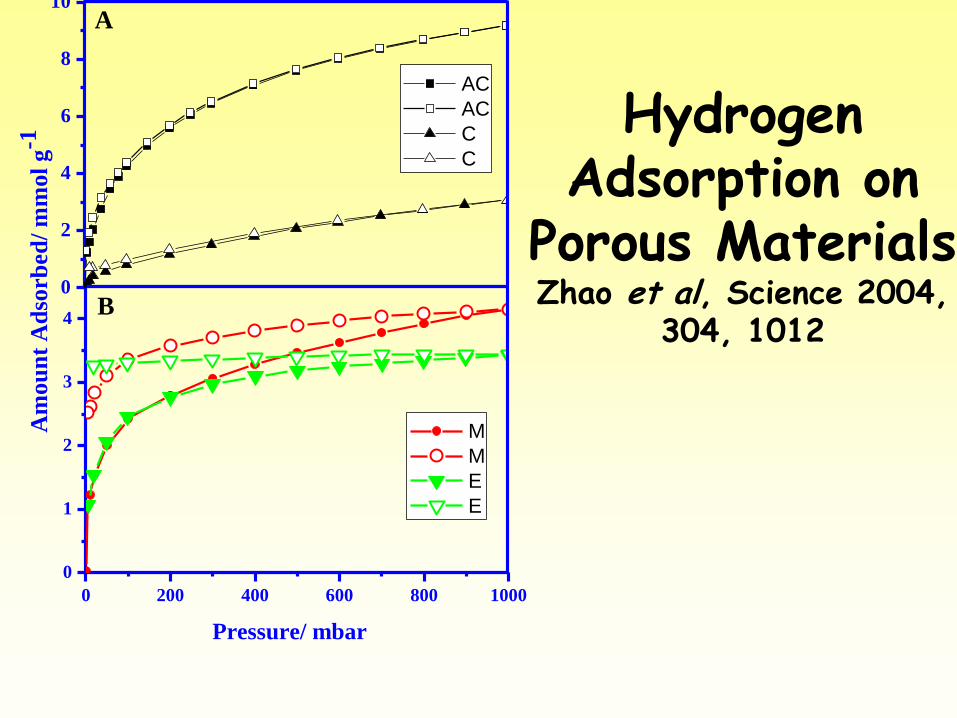
Hydrogen Adsorption on
Porous Materials Zhao et al, Science 2004,
304, 1012
0
2
4
6
8
10
0 200 400 600 800 1000
0
1
2
3
4
AC
AC
C
C
AA
mou
nt
Ad
sorb
ed
/ m
mol
g-1
Pressure/ mbar
M
M
E
E
B
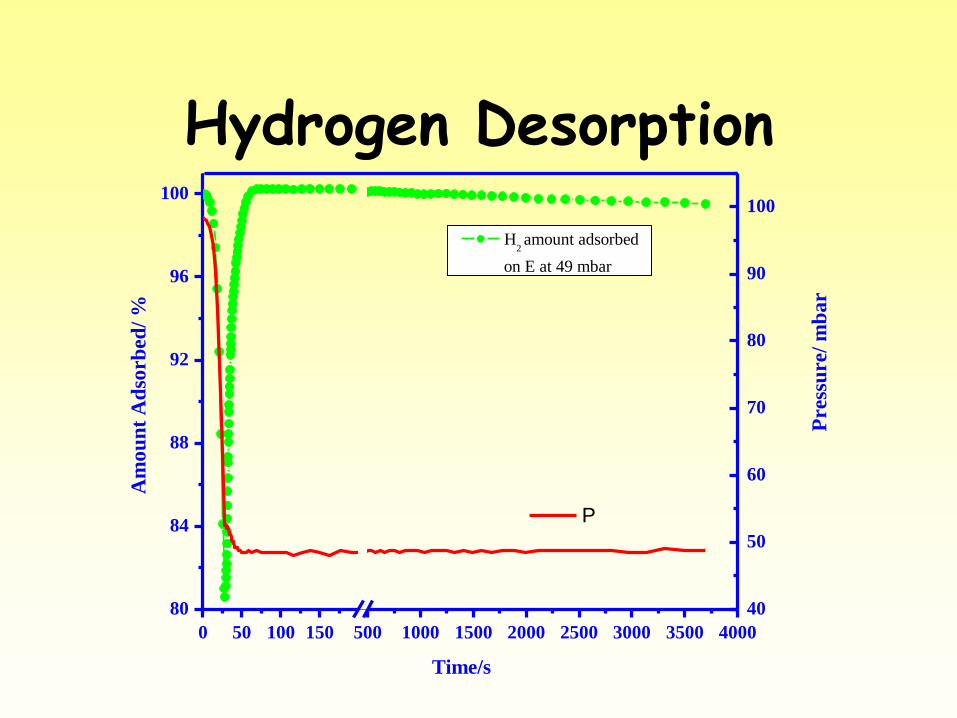
Hydrogen Desorption
0 50 100 150 500 1000 1500 2000 2500 3000 3500 4000
80
84
88
92
96
100
40
50
60
70
80
90
100
Am
ou
nt
Ad
sorb
ed/
%
Time/s
H2 amount adsorbed
on E at 49 mbar
Pre
ssu
re/
mb
ar
P
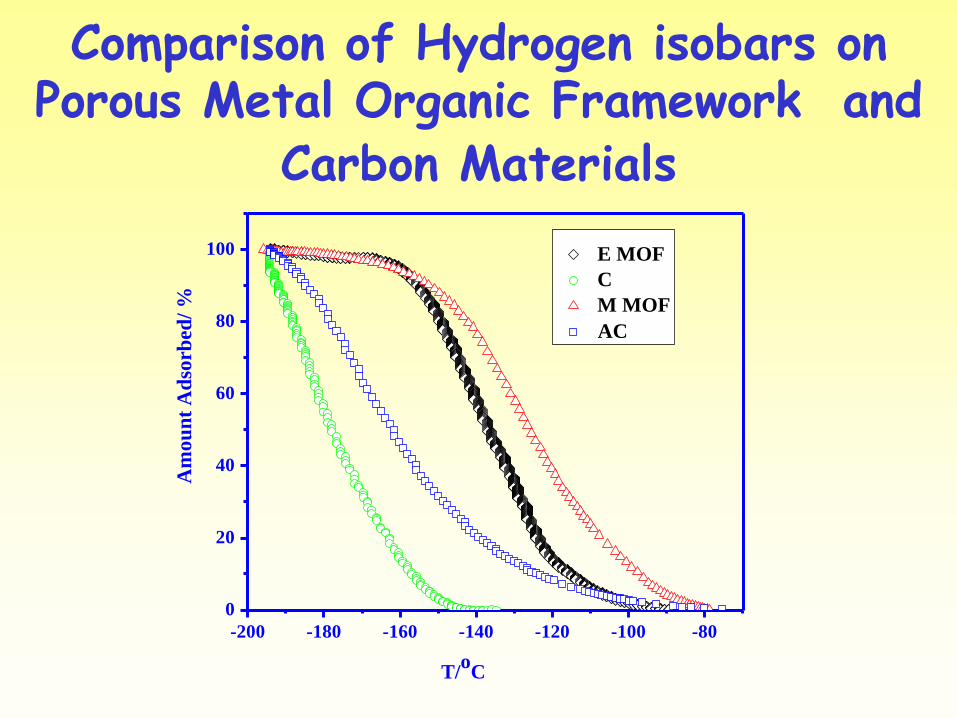
Comparison of Hydrogen isobars on Porous Metal Organic Framework and
Carbon Materials
-200 -180 -160 -140 -120 -100 -80
0
20
40
60
80
100
Am
ou
nt
Ad
sorb
ed/
%
T/o
C
E MOF
C
M MOF
AC
Possible Mechanism
• Adsorption of hydrogen may result in stiffening of the metal organic framework. In this case the desorption should change with hydrogen loading
• Thermally activated structural change
How can we improve the adsorption capacity and temperature dependence?
• Larger pore volumes,
• Cage structures
• Narrow windows in the structure
• Surface chemistry: Unsaturated metal centres,
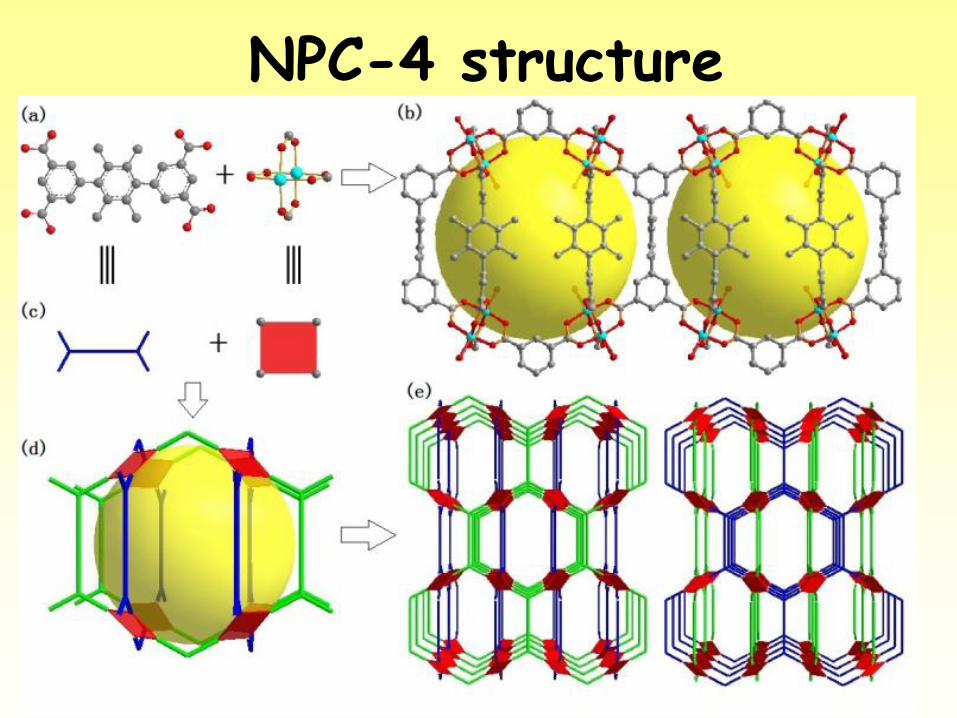
NPC-4 structure
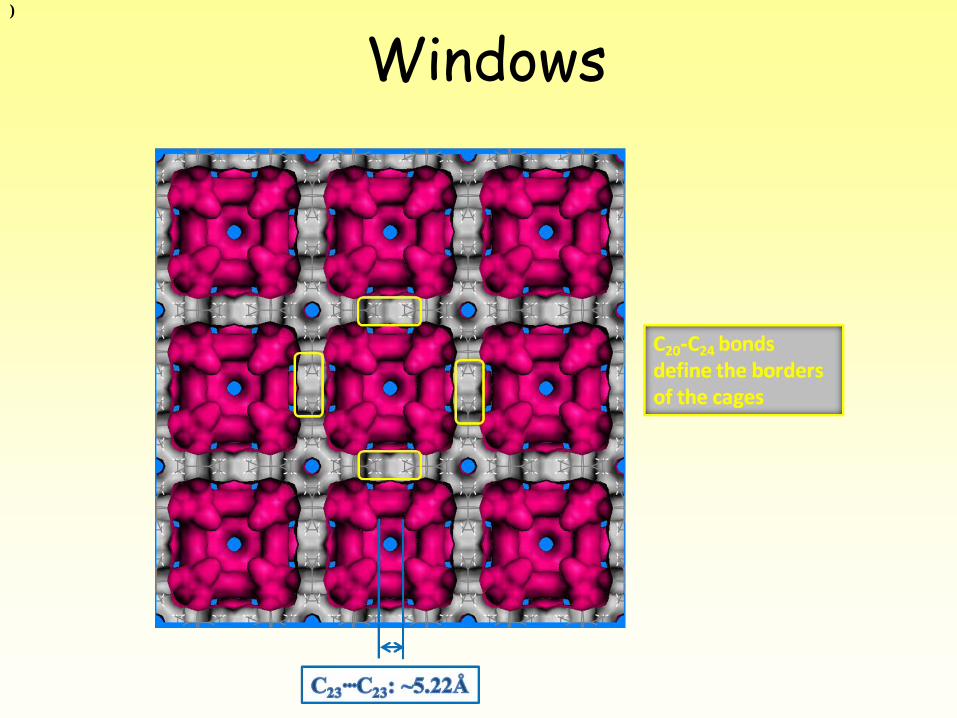
Windows )
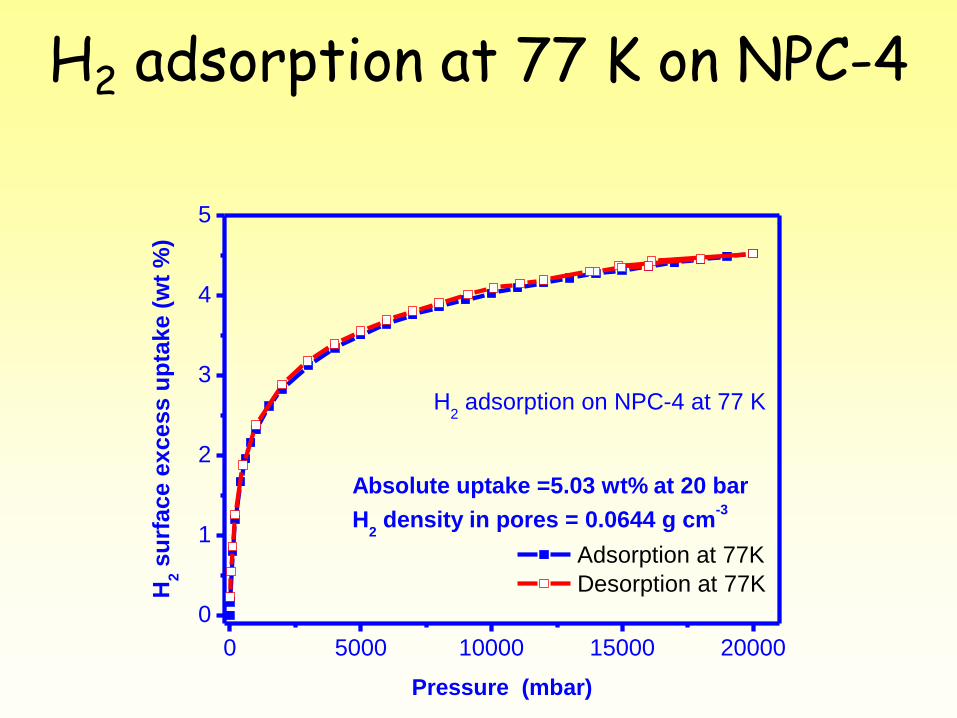
H2 adsorption at 77 K on NPC-4
0 5000 10000 15000 20000
0
1
2
3
4
5
H2 s
urf
ace e
xcess u
pta
ke (
wt
%)
Pressure (mbar)
Adsorption at 77K
Desorption at 77K
H2 adsorption on NPC-4 at 77 K
Absolute uptake =5.03 wt% at 20 bar
H2 density in pores = 0.0644 g cm
-3

H2 adsorption at 77 K on NPC-4
0 5000 10000 15000 20000
0
1
2
3
4
5
20 bar 2 nd
20 bar 1st
Su
rfa
ce
Ex
ce
ss
H2
Up
tak
e (
wt%
)
Pressure (mbar)
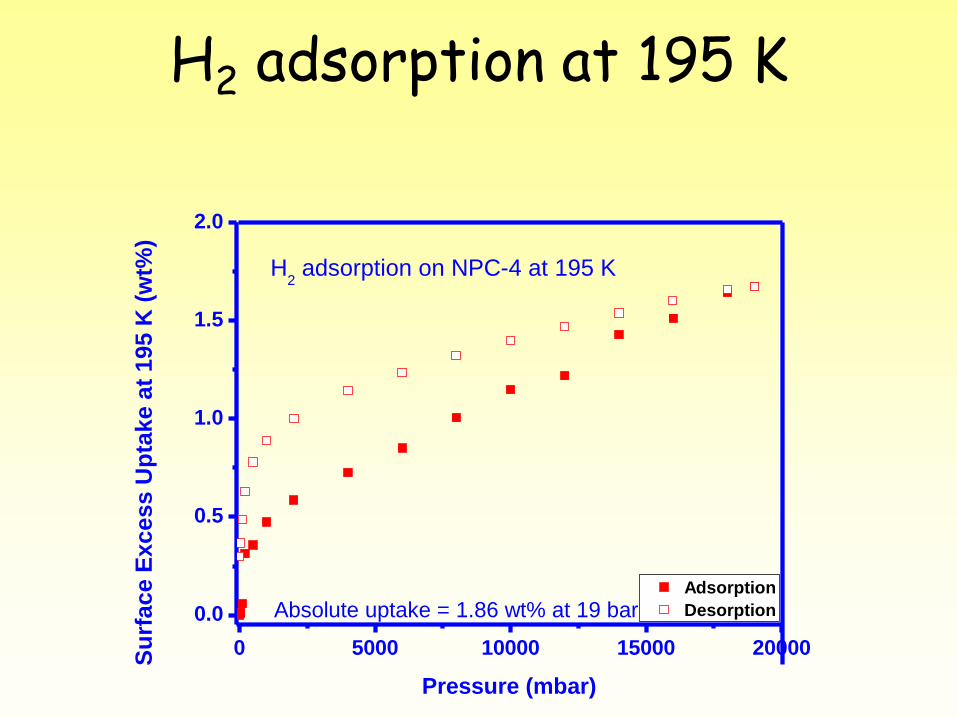
H2 adsorption at 195 K
0 5000 10000 15000 20000
0.0
0.5
1.0
1.5
2.0
H2 adsorption on NPC-4 at 195 K
Adsorption
Desorption
Su
rfa
ce
Ex
ce
ss
Up
tak
e a
t 1
95
K (
wt%
)
Pressure (mbar)
Absolute uptake = 1.86 wt% at 19 bar
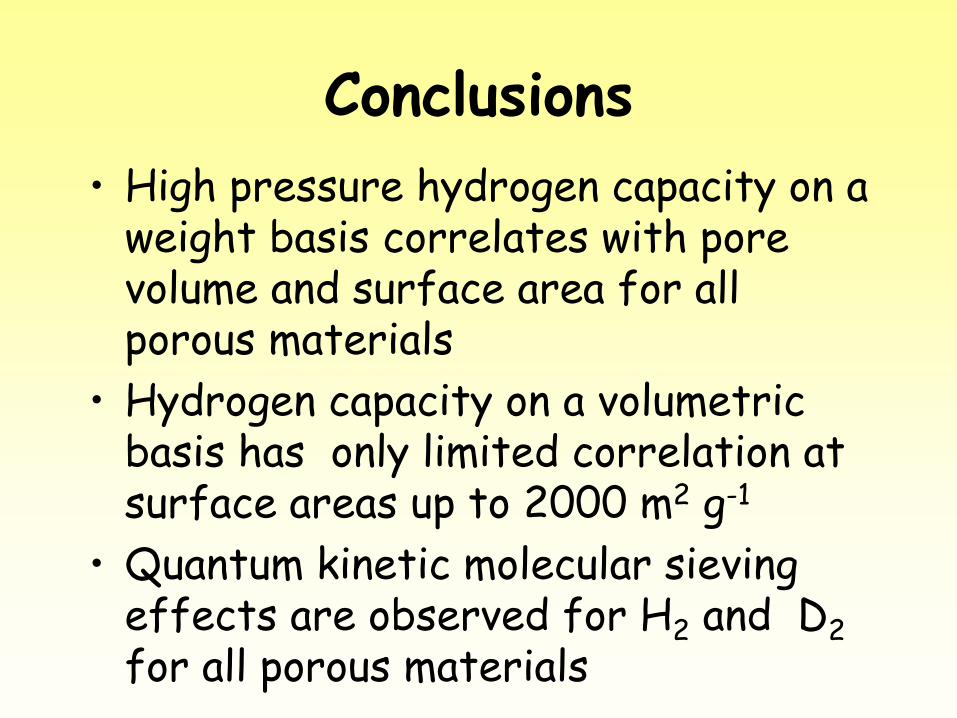
Conclusions
• High pressure hydrogen capacity on a weight basis correlates with pore volume and surface area for all porous materials
• Hydrogen capacity on a volumetric basis has only limited correlation at surface areas up to 2000 m2 g-1
• Quantum kinetic molecular sieving effects are observed for H2 and D2 for all porous materials
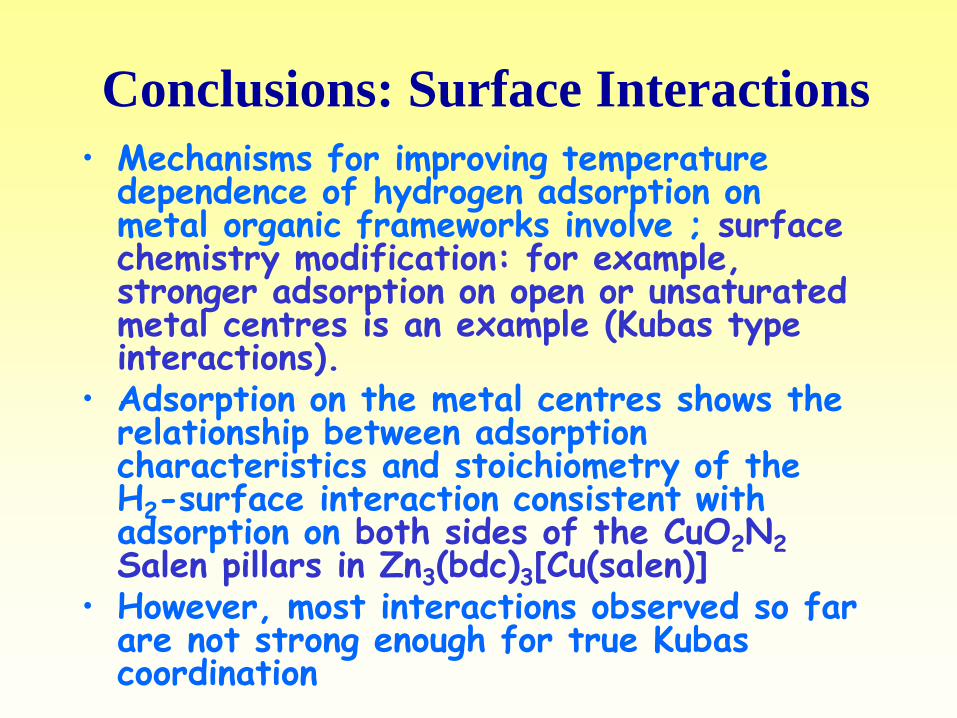
Conclusions: Surface Interactions
• Mechanisms for improving temperature dependence of hydrogen adsorption on metal organic frameworks involve ; surface chemistry modification: for example, stronger adsorption on open or unsaturated metal centres is an example (Kubas type interactions).
• Adsorption on the metal centres shows the relationship between adsorption characteristics and stoichiometry of the H2-surface interaction consistent with adsorption on both sides of the CuO2N2 Salen pillars in Zn3(bdc)3[Cu(salen)]
• However, most interactions observed so far are not strong enough for true Kubas coordination
Conclusions
• Qst values are sensitive to the spatial and/or electronic environments around Cu2+ sites, which influence interactions with hydrogen molecules.
• Cage structures with narrow windows have some interesting temperature dependent characteristics, which are being investigated further
Acknowledgements • Adsorption Studies: X. B. Zhao, B. Xiao, A. Putkham,
J. Bell, R. Gill, A. J. Fletcher, M. Kennedy, J Armstrong and T Rexer.
• Synthesis and Structure Zn3(bdc)3[Cu(Pyen)], Zn3(bdc)3[Cu(PyCy)] B. Chen, K. Hong, E. B. Lobkovsky, E. J. Hurtado, S. Xiang, M-H Xie, C. D Wu,
• Synthesis and Structures of Ni2(bpy)3.(NO3)4 phases
D. Bradshaw, J. Barrio and M. J. Rosseinsky
• M. Schroder (Nottingham University, Angew. Chemie. 2006, 45, 7358; Chem. Comm. 2008,6108; JACS 2009,131,2159) and R. Morris (St Andrews University; JACS 2007, 129.1203 and Nature Chem 2009 and 2011)
Related Documents


