Hydrodynamic Simulation of Oil Sand Multiphase Flow in At Face Slurry System by Enzu Zheng A thesis submitted in partial fulfillment of the requirements for the degree of Master of Science in Mining Engineering Department of Civil and Environmental Engineering University of Alberta © Enzu Zheng, 2015

Welcome message from author
This document is posted to help you gain knowledge. Please leave a comment to let me know what you think about it! Share it to your friends and learn new things together.
Transcript

Hydrodynamic Simulation of Oil Sand Multiphase Flow in At Face Slurry System
by
Enzu Zheng
A thesis submitted in partial fulfillment of the requirements for the degree of
Master of Science
in
Mining Engineering
Department of Civil and Environmental Engineering
University of Alberta
© Enzu Zheng, 2015

ii
Abstract
Hydraulic transportation efficiency and production cost optimization are required in the
surface extraction of Athabasca oil sand deposits. Currently, stationary pipelines are used
for slurry transportation in many mines. In order to reduce the dependence on haulage
truck for long haulage distances, there is a desire to extend the hydraulic transport system
to production faces in oil sands mines using mobile At Face Slurry System (AFSS). The
AFSS consists of pipelines connected together with flexible joints and would be capable
to create slurrified minerals from the mining faces to be transported to the processing
plant. Slurry transportation based on mobile pipelines has been shown to be more
effective than the shovel-truck haulage system. This flexible arrangement introduces a
unique set of hydraulic transport problems. Rigorous modeling and experimentation of oil
sand slurry multiphase flow in this mobile system are required to understand its technical
viability and effectiveness. The thesis focuses to develop the mathematic models
governing the friction loss of oil sand slurry associated with the AFSS. Computational
Fluid Dynamics (CFD) simulation of slurry flow using the academic package Ansys-
Fluent 14.5 is conducted. A flexible arrangement of pipe loops imitating the AFSS are set
up in the laboratory. Experimental and modelling results are compared to test the
accuracy of CFD modelling to predict friction loss in the flexible pipeline system. Results
indicate that Granular-Eulerian Multiphase model is reasonably effective in predicting the
pressure drop of the at face slurry loop (with a percentage error in the range ±10%) at all
the solid concentrations under different configurations. For oil sand slurry with specific
gravity 1.44, solid volume fraction 0.27 and velocity 4 m/s, the simulated pressure
gradient associated with the AFSS of diameter 0.762m is 220Pa/m, compared with the
158Pa/m for the existing stationary system at Syncrude under the same conditions.

iii
Acknowledgements
I would like to extend my deep gratitude to Prof. Jozef Szymanski, my supervisor, who
has provided me with this research opportunity and given me patient guidance and great
support. I would also like to thank Prof. Tim Joseph for his unending support and
guidance on my graduate study.
I am grateful to have worked with every member of AEGIS research group who give me
encouragement, assistance, and suggestions during the course of my research.
I acknowledge the University of Alberta and the Faculty of Civil and Environmental
Engineering which provide me with the research assistantship as well as the financial
support.
Finally thanks to my families who give me love and support.

iv
Contents
ABSTRACT ................................................................................................................................... II
ACKNOWLEDGEMENTS .......................................................................................................... III
LIST OF FIGURES ...................................................................................................................... VI
LIST OF TABLES ..................................................................................................................... VIII
1 INTRODUCTION ................................................................................................................ 1 1.1 Background of the Problem ..................................................................................................1 1.2 Conceptual Design of the AFSS ............................................................................................2 1.3 Objectives and Scope of Study ..............................................................................................5
2 LITERATURE REVIEW ..................................................................................................... 6 2.1 Previous Research Work of Multiphase-Flows ...................................................................6
2.1.1 Flow of Solid-Liquid Mixture in Pipe ............................................................... 6 2.1.2 Flow of Oil Sand Slurry in Pipe ........................................................................ 8
2.2 Pressure Drop of Multiphase-Flows in Pipe ...................................................................... 10 2.2.1 Pressure Drop of Solid-Liquid Slurry .............................................................. 10 2.2.2 Pressure Drop of Oil Sand Flow in Pipeline .................................................... 16 2.2.3 Effect of 90 Degree Bend on Pressure Drop ................................................... 20
2.3 Research Methodology and Structure of the Thesis ......................................................... 29
3 CFD SIMULATION OF OIL SAND SLURRY FLOW IN PIPE .................................. 30 3.1 CFD Basics of Multiphase Modelling ................................................................................. 30
3.1.1 The Basic CFD Approach ............................................................................... 31 3.1.2 General Hydrodynamic Equations for Multiphase Flow ................................. 33 3.1.3 Turbulence Model ........................................................................................... 42
3.2 CFD Mathematical Model ................................................................................................... 43 3.2.1 Input of Oil Sand Properties for Simulation .................................................... 43 3.2.2 Mathematical Model ........................................................................................ 45
3.3 Simulation Results of the Eulerian Two-Phase Model ..................................................... 52 3.3.1 Velocity Profile ............................................................................................... 52 3.3.2 Sand Concentration Profile .............................................................................. 54 3.3.3 Pressure Drop .................................................................................................. 57
4 AT FACE SLURRY EXPERIMENT................................................................................ 63 4.1 Set Up of Experimental Pipe Loop ..................................................................................... 63 4.2 Slurry Velocity Requirement for the Experiment ............................................................. 66 4.3 CFD Simulation of the Experimental Pipe Loop .............................................................. 68
4.3.1 Geometry ......................................................................................................... 68 4.3.2 Boundary Conditions ....................................................................................... 69
4.4 Results and Analysis ............................................................................................................ 70 4.4.1 Velocity and Concentration Profile ................................................................. 70 4.4.2 Pressure Drop Profile ...................................................................................... 73

v
5 CFD SIMULATION OF AT FACE SLURRY SYSTEM ................................................ 78 5.1 Geometry .............................................................................................................................. 78 5.2 Boundary Conditions ........................................................................................................... 78 5.3 Results ................................................................................................................................... 79
5.3.1 Velocity and Concentration profile ................................................................. 79 5.3.2 Pressure Drop .................................................................................................. 81
6 CONCLUSION ................................................................................................................... 83 6.1 Conclusion ............................................................................................................................ 83 6.2 Recommendations ................................................................................................................ 84
7 BIBLIOGRAPHY .............................................................................................................. 86

vi
List of Figures
Figure 1-1 Double ball joint unit ........................................................................................ 4 Figure 1-2 Conceptual design of AFSS .............................................................................. 4 Figure 2-1 Idealized concentration and velocity distribution used in the SRC two-layer
model (after Gillies, 2004) ................................................................................................ 12 Figure 2-2 Parity plot for frictional pressure gradient compared to experimental data from
Schaan et al.; Gillies and Shook; Gillies et al.; and Kaushal (after Kalekudithi, 2009) ... 16 Figure 2-3 Friction pressure losses for water flow in oil sand hydrotransport pipeline (D =
0.737 m) and normal tailings pipeline (D = 0.737 m) (after Sanders, 2004) .................... 18 Figure 2-4 SRC Two-Layer model predictions for oil sand ‘Typical’ slurry (specific
gravity 1.50; roughness 70 μm; dSRC 0.18 mm, viscosity 0.003 Pa·s) and ‘Coarse’ slurry
(specific gravity 1.50; roughness 70 μm; dSRC 0.40 mm, viscosity 0.002 Pa·s) (after
Sanders, 2004) .................................................................................................................. 19 Figure 2-5 The simplified swivel joint unit model of the AFSS’s double ball joint for
slurry flow ......................................................................................................................... 20 Figure 2-6 Schematic diagram of a double spiral flow in a bend: a) longitudinal section; b)
cross-section; (c) cross-section (circular cross-section) (after Idelchik, 1986) ................. 21 Figure 2-7 Total pressure contours in a U-bend of a bend-to-pipe diameter ratio of 24;
Reynolds number = 236000 (after Rowe, 1970). .............................................................. 21 Figure 2-8 Bend loss coefficients for a pipe (after Babcock & Wilcox Co., 1978) .......... 23 Figure 2-9 A typical pipe bend ......................................................................................... 23 Figure 2-10 the elbow and T-joint model using SolidWorks Program ............................ 25 Figure 3-1 Lagrangian Description of Fluid Motion (after Kundu, 2002) ........................ 32 Figure 3-2 Temperature dependence of bitumen viscosity (after Mochinaga, 2006) ....... 44 Figure 3-3 Meshing of the pipe geometry ........................................................................ 46 Figure 3-4 Pipe Inlet domain ............................................................................................ 47 Figure 3-5 Subdivisions of the Near-wall Region (after Fluent User Guide, 2003) ......... 49 Figure 3-6 Boundary layer of the pipe .............................................................................. 50 Figure 3-7 Liquid phase velocity profile at the outlet along the pipe of diameter 0.6096m
(velocity: 4m/s) ................................................................................................................. 53 Figure 3-8 Liquid phase velocity development along the pipe of diameter 0.6096m
(velocity: 4m/s) a) Inlet; (b) z = 10 m (axial coordinate); (c) z = 20 m (axial coordinate);
(d) Outlet ........................................................................................................................... 54 Figure 3-9 sand concentration profile at the outlet along the pipe of diameter 0.6096m
(velocity: 4m/s) ................................................................................................................. 55 Figure 3-10 Sand concentration profile development along the pipe of diameter 0.6096m
.......................................................................................................................................... 56 Figure 3-11 The average friction pressure losses for oil sand slurry flow in Pipelines of
diameter 0.6096m, 0.7366m and 0.762m under different velocities. ............................... 58 Figure 3-12 Pressure drop along the pipe of diameter 0.6096m at different velocities .... 59 Figure 3-13 Pressure drop along the pipe of diameter 0.7366m at different velocities .... 60 Figure 3-14 Pressure drop along the pipe of diameter 0.762m at different velocities ...... 60 Figure 3-15 Comparison between operational and predicted pressure drop in pipe of
diameter 0.6096 m ............................................................................................................ 61 Figure 3-16 Comparison between operational and predicted pressure drop in pipe of
diameter 0.7366 m ............................................................................................................ 61 Figure 3-17 Comparison between operational and predicted pressure drop in pipe of
diameter 0.762m ............................................................................................................... 62 Figure 4-1 At face slurry test loop ................................................................................... 63

vii
Figure 4-2 Pressure transducer location ............................................................................ 64 Figure 4-3 Pipe loop with alignment angle 0
o ................................................................... 65
Figure 4-4 Pipe loop with alignment angle 30o ................................................................. 65
Figure 4-5 Pipe loop with alignment angle 60o ................................................................. 66
Figure 4-6 Pipe loop with alignment angle 80o ................................................................. 66
Figure 4-7 limit-deposit velocity for solid particles: (a) uniform size particles; (b) non-
uniform size particles (after Durand, 1953) ...................................................................... 67 Figure 4-8 Pipe geometries with different alignment angles ............................................ 69 Figure 4-9 Velocity profile in the first swivel joint unit (Cv =0.12, alignment angle 0
o). 71
Figure 4-10 Velocity profile in the second swivel joint unit (Cv =0.12, alignment angle 0o)
.......................................................................................................................................... 71 Figure 4-11 Sand deposition in the (a) transparent experimental pipe; (b) corresponding
pipe section in CFD simulation ......................................................................................... 72 Figure 4-12 Sand concentration profiles in the two swivel joint units (Cv =0.12,
alignment angle 0o) ........................................................................................................... 72
Figure 4-13 Pressure drop of sand slurry (Cv = 0.04, alignment angle 0o) ....................... 73
Figure 4-14 Pressure drop of sand slurry (Cv = 0.12, alignment angle 0o) ....................... 74
Figure 4-15 Pressure drop of sand slurry (Cv = 0.27, alignment angle 0o) ....................... 74
Figure 4-16 Predicted pressure drop of at face slurry loop unit under different alignment
angles ................................................................................................................................ 75 Figure 4-17 Experimental pressure drop of at face slurry loop unit under different
alignment angles ............................................................................................................... 76 Figure 5-1 Sand concentration profiles in the two swivel joint units (Cv =0.27, alignment
angle 0o) ............................................................................................................................ 79
Figure 5-2 Velocity profile in the first swivel joint unit (Cv =0.27, alignment angle 0o) . 80
Figure 5-3 Velocity profile in the second swivel joint unit (Cv =0.27, alignment angle 0o)
.......................................................................................................................................... 80
viii
List of Tables
Table 3-1 Oil sand properties for CFD simulation ........................................................... 44 Table 3-2 Numerical solution input data of the CFD Two-Phase Model ......................... 45 Table 3-3 Mesh details of all three pipes .......................................................................... 46 Table 3-4 Mesh independency study for the pipe (Diameter: 0.6096m, length: 30 m) .... 47 Table 3-5 Boundary conditions of the model.................................................................... 51 Table 4-1 Mesh details of all four pipes with different configurations ............................. 69 Table 4-2 Boundary conditions of the model.................................................................... 70 Table 4-3 Predicted and experimental pressure drop data of at face slurry loop unit ....... 76 Table 5-1 Mesh details of all four pipes with different configurations ............................. 78 Table 5-2 Input parameters of the model .......................................................................... 79 Table 5-3 Predicted pressure drop in one typical unit of the at face slurry system .......... 81 Table 5-4 Predicted pressure gradient in one typical unit of the at face slurry system ..... 82

1
1 Introduction
1.1 Background of the Problem
Large-capacity shovels and dump trucks are increasingly utilized for excavation, loading
and hauling in the operation of surface mining. Production cost and efficiency
optimization are demanded during the Athabasca oil sands mining process in order to
secure North America’s energy supply. However, increasing haulage distances, rugged
terrain and constrained mine environment will reduce the effectiveness of the shovel-
truck haulage system (Frimpong, 2003). In such conditions, tires are susceptible to
failures with the tire heat index and the ton/km/h limit for truck haulage exceeded,
simultaneously creating extreme tire wear and high maintenance costs. Besides
production cost and equipment effectiveness, a mining environment also requires
efficient waste materials recycling and distribution. Waste materials need to be recycled
from the processing plant to a new destination like tailings dam, or to the mined out areas
as a backfill. With such configuration and location characteristics, the mining
environment requires flexible pipelines for access and efficient recycling process.
Slurry transportation is an economic and viable alternative in oil sands operations.
Alberta, as the primary supply and service hub for Canada's crude oil and oil sands
industries, it might represent the world’s most intensive slurry pipeline technology
application. Three operating plants produce approximately 3.5 million cubic metres of
bitumen per year, the solids flow associated with this production rate is 1/2 million tonnes
per day (Sanders, 2004). Hydraulic transportation has been proved to be a viable
technology for slurry transportation in a constrained mining environment. The original oil
sand extraction processes applies belt conveyor to transport the mined ore, and a rotating
inclined tumbler to liberate the bitumen from the sand. Large particles are not present in

2
the tailings stream as they are separated from the slurry at the tumbler outlet and
transported to disposal sites by truck. Nowadays, belt conveyors have been replaced by
oil sand hydrotransport operation. The ore is initially crushed and screened with a top size
ranging between 50 and 150 mm. The crushed ore is then mixed with water, with lumps
ablating and liberating oil to produce dense slurry. Considering its viability and efficiency
in the oil sand extraction, slurry transport research has been sponsored by the industry for
many years. Much of the research work has been conducted at the Saskatchewan
Research Council’s Pipe Flow Technology Centre in Saskatoon, SK (Sanders, 2004).
The oil sand industry currently utilizes mainly stationary pipeline for transporting
minerals in most mines. In order to reduce the dependence on haulage truck for long
haulage distances, there is a desire to extend the hydraulic transport system to production
faces in oil sands mines using mobile pipeline systems. The mobile At Face Slurry
System (AFSS) consists of a slurry production system on mobile units and flexible
arrangement of pipelines, making it feasible to accept the feed from a large-capacity
shovel. The ground articulating pipeline (GAP) system developed is capable to fold,
extend and follow the excavators radially, horizontally and vertically. Oil sand converted
to slurry at the mining face is delivered to a fixed pipeline by the GAP system.
1.2 Conceptual Design of the AFSS
The AFSS is intended to convert oil sands into slurry at mining faces and delivered to
join a fixed pipeline via flexible GAP system. This concept requires innovative solutions
to a complicated material handling need. Oil sands mechanical and chemical
characteristics are demanded to be taken into consideration for the system design. A
completed AFSS consists of one process platform working together with one pipeline
system. For the processing platform, it would use a mixing tower to add water and size

3
material for pumping, or a large rotating tumbler to break up the oil sand material, with
water added in the tumbler to create slurrified minerals. Shovel and mobile slurry system
are directly connected to the folding pipeline system supported by tracked carbodies. The
folding pipeline is a series of rigid trusses that carry slurry and water pipes. It forms the
link between the processing platform and the fixed pipeline to the plant. Fresh water is
carried on the flexible pipeline system to the processing platform, and the resulting slurry
is carried back to the fixed pipeline for transport to the plant. Flexible pipeline is
automatically controlled to follow the processing platform as needed anywhere during the
mining operation. Sufficient flexibility should be achieved in order to meet the
requirement. The folding pipeline system consists of a series of rigid truss frames that are
allowed to swivel relative to each other. Truss joints at the end of each truss allow
deflection to avoid torsional twist from the adjoining frames. A double ball joint is
designed to permit the position change between adjacent trusses as well as to allow flow
of both fresh water and oil sand slurry. The structure of the double ball joint is shown in
Figure 1-1.
The unique ball joint assembly consists of an inner ball joint located inside an outer ball
joint to allow the flow of slurry and fresh water. The ball joint should swivel around its
vertical axis and flex longitudinally and laterally. The internal and external ball joints are
co-axial as illustrated. An internal ball joint allows the flow of slurry while the external
joint channels fresh water to produce oil sands slurry. Programmable control system or
Global Positioning Satellite system is utilized to control track movement. It tells the track
bodies the direction to follow the processing platform and the shovel.

4
Figure 1-1 Double ball joint unit
Figure 1-2 Conceptual design of AFSS

5
The operation concept of the AFSS is simply illustrated in Figure 1-2. A shovel dumps
oil sand into the apron feeder, water is then added to produce oil sand slurry on the
processing platform. Slurry is pumped through a connecting line to the flexible pipeline.
The folding pipeline then transfer the slurry to the fixed pipeline connected directly to the
plant. The folding pipeline has a minimum retracted length and a maximum extended
length to enable the adjustment of the working length. A mining sequence will be
established for the movement of the shovel within the pit, the design will allow the pipes
to make zigzag movements and follow the shovels as needed at mining face.
1.3 Objectives and Scope of Study
AFSS concept has become a competitive means for materials handling toward the
objective to optimize haulage system efficiency and cost. This mobile and flexible
arrangement introduces a unique set of hydraulic transport problems. The scope of this
thesis will focus to develop the mathematic models governing the friction and head losses
with the AFSS concept and validate the model using data from Syncrude Canada Ltd. and
Suncor Energy, Inc. via computational fluid dynamics (CFD) simulation.

6
2 Literature Review
2.1 Previous Research Work of Multiphase-Flows
2.1.1 Flow of Solid-Liquid Mixture in Pipe
Solid-liquid transportation has been widely used in the long-distance materials handling
industry like coal, oil sand, and tailings. Many engineering models of slurry flow have
been developed to predict and simulate frictional pressure loss and deposition velocity of
“settling” slurries. Most of these models are phenomenological that they all require
certain empirically derived parameters as input of the model and possess varying degrees
of success in predicting the friction loss and deposition velocity. An initial empirical
prediction model was developed by Durand (1953). It predicted the hydraulic gradients
for coarse particle slurry flows. The model’s calculation approach was improved by Wasp
(1970) and applied to the commercial slurry pipeline design. Shook and Daniel (1968)
later proposed a less complicated pseudo homogeneous approach to model slurry flow.
This unique technique allowed description of the flow using a single set of conservation
equations. The pseudo homogeneous approach had certain limitations as it assumed the
slurry with no deposition velocity, which worked reasonably well for slurry with
relatively fine particles, low solids volume fraction and a narrow range of operation
velocities. The carrier fluid’s density and viscosity were expected to increase with
increasingly dispersed solid phase amount related to the in situ solids volume fraction.
Considering the pseudo homogeneous approach’s limitation, Shook and Daniel (1969)
improved the model by considering the slurry as a pseudo single-phase fluid with variable
density. However, the boundary conditions adopted in their approach made it difficult to
apply to actual flow situations. An oversimplified model was proposed by Oroskar and
Turian (1980), also known as “constructive energy” approach. The model was not
intended for dense slurries and was used to calculate the deposition velocity. They

7
assumed that the kinetic energy of turbulent fluctuations was transferred to discrete
particles, suspending them in the flow. This approach predicted deposition velocities
reasonably well with the experimental data over a wide range of solids volume fractions.
Based on previous research work, Wilson (1976) developed a one-dimensional two-layer
model. The model assumed that the particles being very coarse were contained in the
lower layer while upper layer’s solids concentration being zero. The coarse-particle slurry
flow consisted of two separate layers with each having a uniform concentration and
velocity. Momentum transfer existed between the layers through interfacial shear forces.
The two-layer model had been widely accepted and revised by many researchers. By
assuming the lower layer to be stationary, Doron (1987) used the two-layer model for the
prediction of flow patterns and pressure drops in slurry pipelines. However, failure to
predict the existence of a stationary bed at low flow rates reduced the reliability of the
friction loss predictions by this model. The dispersive force model developed by Wilson
and Pugh (1988) was appropriate for predicting heterogeneous slurry flow, which made
up for the limitations of pseudo homogeneous model. It took into consideration the
particles suspended by fluid turbulence providing contact-load (Coulombic) friction and
received extended applicability compared to the initial layer model by Wilson. Particle
concentration and velocity profiles predicted using this model was in good agreement
with experimental data. For a two layer slurry flow, slip characteristics and interaction
between the layers demand detailed investigation. The most widely accepted two layer
model is the SRC model developed by Gillies and co-workers (2004). The SRC two-layer
model differs from the above phenomenological models since it does not depend on any
empirically determined coefficients. On the contrary, effect of related parameters on
friction loss is specified mechanistically. The model predicts pressure gradient and
deposition velocity as a function of particle diameter, pipe diameter, solids volume
fraction, and mixture velocity. Experiments for SRC two-layer model were mostly done

8
at the Saskatchewan Research Council Pipe Flow Technology Centre. Thousands of
controlled experiments were conducted to obtain the semiempirical coefficients for the
model. Data incorporated in the model was obtained at mixture velocities that were just
greater than the deposition velocity (𝑉𝑐 ≤ 𝑉 ≤ 1.3𝑉𝑐) based on the fact that the optimum
pipeline velocity being normally close to the Deposition velocity (𝑉𝑐). By considering the
existence of a dispersive layer sandwiching between the suspended layer and a bed,
Doron and Barnea (1993) extended the two-layer modeling approach to a three-layer
model for prediction of slurry low in horizontal pipelines. When the flow was in
horizontal or near horizontal configurations, it was reasonable to assume a no-slip
condition between the fluid and the solid parts. The dispersive layer displayed a higher
concentration gradient outstripping the suspended layer. Satisfactory agreement with
experimental data was achieved by the three-layer model. Transition lines between “flow
patterns” also had drawn a lot of attention from researchers. Flow pattern maps
essentially indicated the degree of flow heterogeneity. Doron and Barnea completed the
flow pattern maps and determined the transition lines between the flow patterns based on
a three-layer model. Solid-liquid slurry research work mentioned above is of great
significance for the oil sand hydraulic transportation.
2.1.2 Flow of Oil Sand Slurry in Pipe
The oil sands slurry is a three-phase system that water, sand and bitumen phases co-exist
with their superimposed behaviors affecting the entire system rheology (Noda, 1972).
Frimpong (2003) conducted computational simulation of oil sand flow under steady-state
conditions. Based on his previous work, he introduced higher level of complexity and
relaxed some of the assumptions underlying the previous study. Frimpong (2010)
simulated the system as an unsteady state model by incorporating the conditions for the
flow system to evolve over time as it progressed from the initial steady condition to

9
unsteady flow situation. Multiphase flow modeling is very challenging. It becomes more
complex with the introduction of the flexible at face slurry system. Due to its complexity,
solutions of multiphase problems demand certain assumptions for reasonable
simplification to yield tractable equations more effectively. According to Frimpong’s
work, following assumptions apply to the simulated unsteady-state oil sand slurry flow:
(1) the flow is transient three-phase incompressible flow containing immiscible phases of
hot water, oil, and solid sand. Air trapped is neglected; (2) the three-phase can be simply
regarded as a liquid-solid two-phase model with oil and water combing to form a pseudo
single fluid phase. Properties of oil and water are averaged into a single-phase component
liquid phase; (3) no-slip condition is assumed between the phases. Solid particles are
completely dispersed or suspended and carried continuously in the slurry; (4) adequate
energy is provided by centrifugal pump that slurry velocity is above minimum deposition
velocity. Sand particles are fully dispersed and no stationary bed exists at the bottom
along the pipe length; (5) the pseudo single fluid phase is regarded as a continuous phase.
Bitumen is a viscous fluid with high viscosity, but the existence of hot water reduces
bitumen viscosity to a continuous viscous fluid (Frimpong, 2004); (6) the slurry
temperature is assumed to be constant through the pipe length isothermal condition ; (7)
solid particles are approximately spherical with a median diameter; (8) mixture properties:
solid particles density of 2,650 kg/m3, bitumen API 10° and density of 995 kg/m3 and
water/hot water density of 1,000 kg/m3 (McDonell, 2002); (9) flow rates and volume
fractions of the phases are assumed to remain steady along the pipe length; (11) outlet
pressure of pipe equals to the standard atmospheric value. Frimpong’s work provided a
further step toward a more realistic modeling of flexible-pipe system. Oluyemi (2011)
provided more insight into oil sand multiphase flow in horizontal and inclined pipe
configurations under a low sand loading. A steady-state turbulent flow simulation of this
complex oil-sand-water-gas multiphase fluid was conducted using commercial CFD

10
software FLUENT. Most of the deep water reservoirs contained friable unconsolidated
rocks. Sand in horizontal and deviated well would settle in the flow line depending on the
flow parameters and pipe orientation. Deposited sand would directly result in reduction of
the cross sectional area of the wellbore or pipe available for fluid flow. Industry’s
approach to managing sand deposition was to keep the carrier fluid velocity above the
minimum transport velocity. The pressure drop mechanism in various pipe configurations
was investigated by Oluyemi for a specified sand particle size and loading limit. Results
indicated that sand deposited on the internal surface of pipe formed an extra layer of
material at low sand loading, which led to increased pipe roughness and observed
pressure drop.
2.2 Pressure Drop of Multiphase-Flows in Pipe
2.2.1 Pressure Drop of Solid-Liquid Slurry
2.2.1.1 The SRC Model
Pipeline friction losses are of great concern during slurry transportation. Slurry flows are
normally divided into two categories in predicting pipeline friction losses. The two
categories are non-settling or homogeneous flows and settling or heterogeneous flows,
respectively. The first category is also occasionally denoted as pseudo homogeneous flow.
The diameters of the particles in non-settling slurries are very fine and stationary bed is
not expected to occur along the pipe length at low velocities. Pipeline flow patterns of the
first category may be either laminar or turbulent with solid particles distributed uniformly
in the carrier fluid at all velocities. A non-Newtonian fluid model is suitable for
description of the flow characteristics of non-settling flow. The second category presents
a more complicated flow pattern contrary to the homogeneous flow. With the presence of
large diameter particles, stationary deposits will usually form at low velocities. The

11
heterogeneous flows are usually turbulent, with concentration distribution being less
uniform and velocity distribution asymmetric.
As mentioned above, the most widely accepted two-layer model for predicting friction
loss is the SRC model developed by Gillies and co-workers (2004). Gillies developed the
most recent version of the SRC model based on slurry tests with high solids concentration.
Data incorporated in their SRC model is obtained at velocity close to the deposition
velocity. Wilson (2000) proposed that particles may experience a lift force repelling them
from the wall and this repulsion can lead to reduced friction at high velocities. Gillies
(2004) then conducted experiments to investigate this repulsion effect and incorporated it
in the SRC model.
The particle adjacent to the pipe wall would experience the lift force in high velocity
slurry flows. Wilson (2000) derived an expression to express this lift force to explain the
repulsion effect that reduced the friction in high velocity slurry flows. This lift force was
generated due to a portion of the particle projects beyond the viscous sub-layer and into
the non-linear fluid velocity distribution region. Lift force investigated here neglected the
effect of particles smaller than the viscous sub-layer. Friction between particle and wall
would decrease with the parameter d+
as a result of the lift force. d+
was expressed as,
d+ = d𝜌𝑓𝑢∗/𝜇𝑓 (2-1)
Where
d+ Dimensionless particle diameter
d Median particle diameter, (m)
𝜌𝑓 Fluid density (kg/m3)
u* The friction velocity (τw ρf⁄ )0.5 (m/s)

12
τw Wall shear stress, (Pa)
𝜇𝑓 Fluid viscosity (Pa·s)
The SRC model had assumed a constant coefficient of Coulombic friction 𝜂𝑠 relating
normal and shearing stresses at the pipe wall:
ηs = τs
σs (2-2)
σs was resulted from the unsuspended portion of the immersed weight of the particles by
lift forces. A constant friction coefficient was assumed under the condition that the fluid
suspending forces being ineffective and presence of high solids concentration near the
bottom of the pipe or channel. However, solid concentration near the bottom of the pipe
may decrease prominently when fluid suspension was effective, which should be
considered and incorporated into the SRC model. The SRC model retained the basic
assumption that the friction coefficient was constant with certain correction of its
variation effect, as Prasad’s research had shown that the coefficient of friction increased
as the solids concentration decreased based on their experiments conducted with a rotary
shear apparatus (Prasad, 1995). Conceptual basis of the SRC model was illustrated in
Figure 2-1.
Figure 2-1 Idealized concentration and velocity distribution used in the SRC two-layer
model (after Gillies, 2004)

13
Particles concentrated in the lower layer resulted in the Coulombic friction. The rest of
particles were suspended by turbulence and distributed uniformly throughout the flow.
This phenomenon contributed to the velocity and concentration distributing as step
function. Clim, the value calculated at (y/D = 0.15) using the method of Shook et al.
(2002), represented the total concentration in the lower layer. The concentration of
suspended particles C1 was denoted as,
𝐶1 = 𝐶𝑟 − 𝐶𝑐 (2-3)
Where Cr was the total in-situ solids concentration and Cc was the fraction that
contributed Coulombic (contact load) friction. An empirical equation based on
experimental pressure gradient measurements was used to calculate the ratio (Cc / Cr).
This empirical equation has undergone changes as the model evolves to better understand
the factors that govern wall friction. The equation for axial pressure gradient in horizontal
flow was expressed as,
𝑑𝑃
𝑑𝑍=
τ1𝑆1+τ2𝑆2+𝐹2
𝐴 (2-4)
Where S Partial perimeter (m)
Z Axial distance, (m)
𝜏 Shear stress, (Pa)
1 upper layer; 2 lower layer
A Cross-sectional area of pipe, (m2)
Wilson’s approach was used to calculate the Coulombic wall force F2, this frictional force
was resulted from the concentration difference (Clim – C1):
𝐹2 = 0.5𝑔𝐷2(𝜌𝑠−𝜌𝑓)(1−𝐶𝑙𝑖𝑚)(𝐶𝑙𝑖𝑚− 𝐶1)(sin 𝛽−𝛽 sin 𝛽)𝜂𝑠
1−𝐶𝑙𝑖𝑚+𝐶1 (2-5)
β was the angle defined by the cross-sectional area of the lower layer:
𝐴2 = 0.5𝐷2(𝛽 − sin 𝛽 cos 𝛽) (2-6)

14
Stress τ1 and τ2 were dependent on the velocity and were calculated based on the velocity
of the respective layers. Equation used for calculating the stress was as follows,
𝜏𝑖 = 0.5 𝑉𝑖2(𝑓𝑓𝑖𝜌𝑓 + 𝑓𝑠𝑖𝜌𝑠) (2-7)
Fluid Reynolds number and the wall roughness provided the basis for calculating the
fluid friction factor ffi, while the particle friction factor fsi turned out to be a function of
the linear concentration λ1 according to Gillies and Shook (2000), the linear concentration
λ was expressed as,
λ = [(𝐶
𝐶𝑚𝑎𝑥)
1
3− 1]−1 (2-8)
Where C was solids concentration, (volume fraction), 𝐶𝑚𝑎𝑥 was settled deposit
concentration (volume fraction). Based on the most recent version of SRC model
mentioned above, Gillies and Shook conducted experiments in a closed loop pipeline of
internal diameter 0.103 m, using sands with median diameters 0.09 and 0.27 mm.
Pressure drops were measured under different slurry velocities and concentrations. Mean
in-situ concentration Cr for each experiment was selected by adding weighed quantities
of sand to the loop in a stepwise manner, whose initial volume was known. They
proposed a new correlation for the particle friction factor that being used to modify the
contact load fraction expression in the SRC model in predicting the pressure drop of
heterogeneous slurry flows. Results obtained indicated that pipeline friction to be lower
than expected at high velocities for slurries of sands with particle diameters of 0.09 mm
and 0.27 mm, and the forces acting on particles in the near-wall region demanded further
investigation.
The SRC two-layer model provides accurate predictions of frictional pressure drop and
deposition velocity over a wide range of pipe diameter, particle size, particle

15
concentration under different slurry velocity, but it has certain limitations. The SRC
model provides no detailed information about fluid turbulence, local particle velocities, or
local particle concentrations, and is limited in application to straight runs of pipeline
having a circular cross-sectional area or other complex geometries for slurry
transportation (Kalekudithi, 2009). Kalekudithi (2009) launched a hydrodynamic
simulation of horizontal slurry pipeline flow using ANSYS-CFX based on the kinetic
theory of granular flow in view of these limitations. Computational Fluid Dynamics
(CFD) is very promising in modeling hydrodynamics with the advent of increased
computational capabilities. It is fully capable to simulate the single-phase flows, and is
currently developing for modelling multiphase systems. The kinetic theory component of
the CFD model takes into account the effects of the interactions between solid-solid
phased and solid-liquid phase. Kalekudithi carried out simulation to investigate the effect
of solids volume fraction, particle size, mixture velocity, and pipe diameter on spatial
variations of particle concentrations and frictional pressure losses. The simulated data
was then compared with existing experimental data over a wide range of pipeline
operating conditions. Most of the existing experimental data were obtained with average
solids concentrations ranging from 8 to 45% (by volume), median particle sizes ranging
from 90 to 500 μm, slurry mixture velocities ranging from 1.5 to 5.5 m/s, and pipe
diameters ranging from 50 to 500 mm. The predicted pressure drop was reasonably
agreed with the experimental data. The comparison of predicted frictional pressure drop
and experimental results over these wide range of pipeline operating conditions is shown
in Figure 2-2.

16
Figure 2-2 Parity plot for frictional pressure gradient compared to experimental data
from Schaan et al.; Gillies and Shook; Gillies et al.; and Kaushal (after Kalekudithi, 2009)
2.2.2 Pressure Drop of Oil Sand Flow in Pipeline
Pressure drop is of great concern for oil sand slurry transportation. SRC Two-Layer
model has been used to predict deposition velocities and pressure drops in oil sand
industry. Much of this research has been conducted at the Saskatchewan Research
Council’s Pipe Flow Technology Centre in Saskatoon, SK (Sanders, 2004). However, as
the limitations mentioned above, the SRC Two-Layer model does not account for the
friction associated with the presence of large particles, and their effect on frictional
pressure loss remains unknown. Seldom research has investigated the effect of large
particles on slurry transportation. Presence of large particles, or lumps, may require a
high slurry velocity to prevent its deposition and produce pressure drop measurements
that are greater than the predicted data. Besides the effect of large particles,

17
hydrodynamic roughness of the pipe walls and presence of a stationary bed need to be
considered to analyze the pressure drop of oil sand slurry pipelines. The hydrodynamic
roughness of the pipe walls would increase if the walls are coated with bitumen or
decrease if the walls have been smoothed from abrasion by sand particles (Sanders, 2000).
Sanders initiated a quantitative analysis of the effects combining lumps, hydrodynamic
roughness and the presence of a stationary bed on oil sand slurry friction losses. The
pipelines considered in the study represented some of the most important hydrotransport
applications in the oil sand industry. Most of these pipelines were substantially horizontal
or contained sloped sections of considerable length, with sand being the primary solids
component accounting for up to 60% (mass fraction).
Pressure drop is influenced by many independent variables like velocity, slurry density,
pipe diameter and particle size distribution, etc. The fines fraction and the median particle
size are the two most important particle size distribution (PSD) parameters in
hydrodynamic transportation. The fines fraction determines the viscosity of the fines-
water mixture that provides the carrier fluid for large particles. Typical size distributions
have been reported by Sanders (Sanders, 2000). The conventional definition of fines
employed in the oil sand slurry industry is 44 mm. However, the most recent version of
the SRC Two-layer model also regards the 74 mm particles as fines fraction. The median
particle size defined in the SRC Two-Layer differs from the regularly used median
particle size as determined from a core sample (d50). The median particle size defined in
the SRC Two-Layer is denoted as dSRC, which is the median of the +74 mm particles.
Sanders investigated the friction loss of five pipelines including two normal tailings
pipelines, one hydro cyclone underflow pipeline, and two oil sand hydrotransport

18
pipelines. Figure 2-3 shows the friction pressure losses for water flow in one oil sand
hydrotransport pipeline (D = 0.737 m) and one normal tailings pipeline (D = 0.737 m).
Figure 2-3 Friction pressure losses for water flow in oil sand hydrotransport pipeline (D =
0.737 m) and normal tailings pipeline (D = 0.737 m) (after Sanders, 2004)
Because of the presence of deposits and different pipe wall roughness, each pipeline
presented a unique water friction locus. The influence of these factors on friction loss was
investigated. Friction loss data during water flushing was collected and compared to the
data simulated by the SRC Two-Layer model. Discrepancy emerged between the friction
pressure losses for slurry flows in the operating pipelines and predicted by the SRC Two-
Layer model. When assuming the particle size distribution being the same as that
provided by analysis of the core samples, operational data was always greater than the
correspondingly predicted one. Presence of large particles and/or stationary deposits may
have contributed to this discrepancy. The deviation was more pronounced for pipelines
containing inclined sections than those primarily horizontal pipelines. Figure 2-4 shows

19
the friction pressure losses for pipeline (oil sand hydrotransport, D = 0.737 m). The
curves show SRC Two-Layer model predictions for ‘Typical’ slurry (specific gravity
1.50; roughness 70 μm; dSRC 0.18 mm and viscosity 0.003 Pa·s) and ‘Coarse’ slurry
(specific gravity 1.50; roughness 70 μm; dSRC 0.40 mm and viscosity 0.002 Pa·s). Sanders
recommended that the effect of pipe inclination on friction and a model to predict friction
losses for slurries containing large particles should be developed.
Figure 2-4 SRC Two-Layer model predictions for oil sand ‘Typical’ slurry (specific
gravity 1.50; roughness 70 μm; dSRC 0.18 mm, viscosity 0.003 Pa·s) and ‘Coarse’ slurry
(specific gravity 1.50; roughness 70 μm; dSRC 0.40 mm, viscosity 0.002 Pa·s) (after
Sanders, 2004)

20
2.2.3 Effect of 90 Degree Bend on Pressure Drop
2.2.3.1 Effect of Bend on Single-Phase Flow
As mentioned in Chapter one, pipe arm systems of the AFSS must be connected together
with flexible double ball joints in each pipe section that allows flow of both fresh water
and slurry. For the convenience of research, pressure drop of only slurry flow is
considered in this paper, the double ball joint of the AFSS then can be simplified as a
model as shown in Figure 2-5, denominated as a swivel joint unit. The unit contains a
vertical pipe section and two 90o elbows with r/d = 1.5. The two elbows should swivel
around the vertical axis of the vertical pipe section to allow the pipes making zigzag
movements.
Figure 2-5 The simplified swivel joint unit model of the AFSS’s double ball joint for
slurry flow
For flow through a bend, the centrifugal force acting on the fluid produces a radial
pressure gradient. A double spiral flow field is created by the fluid at the center of the
pipe moving towards the outer edge and coming back along the wall towards the inner

21
edge because of the radial pressure gradient. Figure 2-6 shows the double spiral flow field.
A large increase in pressure losses will probably be resulted from the bend curvature if it
is strong enough, since flow separation may occur at these locations due to the adverse
pressure gradient near the outer wall in the bend and near the inner wall after the bend.
Rowe’ data (1970), as shown in Figure 2-7, clearly illustrates the severe distortion effect
of the bend in the flow field, even for fairly large-radius bends.
Figure 2-6 Schematic diagram of a double spiral flow in a bend: a) longitudinal section; b)
cross-section; (c) cross-section (circular cross-section) (after Idelchik, 1986)
Figure 2-7 Total pressure contours in a U-bend of a bend-to-pipe diameter ratio of 24;
Reynolds number = 236000 (after Rowe, 1970).

22
The change in the direction of flow in a bend causes pressure losses by both friction and
momentum exchanges. Factors including bend angle, the curvature ratio and
the Reynolds Number, they all have a significant impact on pressure loss. The
overall pressure drop is equal to the sum of two components: 1) pressure drop resulted
from friction in a straight pipe of equivalent length depending mainly on the Reynolds
number; and 2) friction losses resulted from change of direction depending mainly on the
curvature ratio and the bend angle, it can be normally expressed in terms of a bend-loss
coefficient. Extensive data on loss coefficient for bends are given by Idelchik (1986).The
single-phase pressure loss in a bend can thus be calculated as:
∆𝑃 = 1
2𝑓𝑠 𝜌𝜇2 𝜋𝑅𝑏
𝐷
𝜃
180𝑜 +1
2𝑘𝑏 𝜌𝜇2 (2-9)
Where fs is the Moody friction factor in a straight pipe; ρ, the density; u, the mean flow
velocity; Rb the bend radius; D, the tube diameter; θ, the bend angle; and kb, the bend loss
coefficient obtained from Figure 2-8.
Flow in pipe bend could also be characterized by the Dean number De (Dean, 1928). The
Dean number can be defined in terms of pipe diameter D or the center-line bend radius R.
It governs the relative importance of viscous, inertia and curvature terms, which is
represented by the ratio of the product of the inertia and centrifugal forces to the viscous
forces. The equation is expressed as,
𝐷𝑒 = (𝑑𝑣𝜌
𝜇) (
𝑟
𝑅)
1
2 (2-10)
Where d is pipe diameter, v is velocity, 𝜌 is density, 𝜇 is dynamic viscosity, r is pipe
radius and R is pipe bend center-line radius.

23
A typical 90o bend is shown in Figure 2-9. We denoted point A on the surface of the bend
outer wall and point B at the inside surface of the bend.
Figure 2-8 Bend loss coefficients for a pipe (after Babcock & Wilcox Co., 1978)
Figure 2-9 A typical pipe bend

24
The pressure drop for bend can defined in terms of head loss coefficient K or the
equivalent pipe length Le. According to Crawford (2003), two separate effects combined
together and resulted in the bend pressure drop. As fluid flows around the bend, it would
encounter the pressure gradient and led to excess friction around point A. This effect is
denoted as the adverse pressure gradient at the outer wall. The second effect is resulted
from the secondary flow that aroused due to the geometry of the bend. The flow separates
from the pipe wall at the inside surface around point B. The value of R/d is critical to
determine the significance of each effect. The bend is referred to as a curved pipe when
R/d > 15 and as an elbow while below this value. Ito (1959) developed a model to
describe the first effect for curved pipes at higher R/d values.
K (𝐷
𝑑)
0.5= 0.00362 + 0.038 [𝑅𝑒 (
𝑑
𝐷)
2]
−0.25
(2-11)
This effect also corresponded well with Mori and Nakayama’s model (1967), which is
expressed as,
K (𝐷
𝑑)
0.5= 0.0375 [𝑅𝑒 (
𝑑
𝐷)
2]
−0.22
× {1 + 0.112 [𝑅𝑒 (𝑑
𝐷)
2]
−0.2
} (2-12)
Where
(𝐿𝑒
𝑑) = 19.8333𝐾𝑅𝑒0.25 (
𝐷
𝑑) (2-13)
Meanwhile the second effect of separation at the inner part of the bend could be predicted
by the relation,
(𝐿𝑒
𝑑) = 22.2126 [𝑅𝑒 (
𝑑
𝐷)
2]
0.7888
𝑅𝑒−0.71438 (2-14)
Crawford compared the data predicted by these models with existing bend pressure drop
data. It turned out that these equations could reasonably predict the bend pressure drop
data over the turbulent range up to 𝑅𝑒 = 3 × 10⁵ within a spread of +3 to -2 percent.

25
Besides theoretical model evaluation of pressure drop, Computational fluid dynamics
(CFD) is also very promising in modeling hydrodynamics with the advent of increased
computational capabilities. CFD validation is also of great significance for both
experimental work and empirical model prediction of bend pressure drop. CFD has been
proved to be successful in simulating various kinds of engineering problems over the last
50 years. Ellison et al (1997) conducted experiments for air water through branching and
developed a two-dimensional CFD model to predict the phase separation in branching
junctions. A CFD code was developed by Hatziavramidis et al. (1997) to simulate the
transient flow simulations of air-water and steam-water flows through branching and
impacting T-junctions. Coffieldet al. (1997) used CFD analysis to study their recoverable
pressure loss coefficients for two elbows in series. Wang and Shirazi (2001), Peniguel et
al (2003), Guessous (2004), Song et al. (2004), Akilli et al. (2001), and Riffat and Gan
(1997) all conducted research work and developed a 3D CFD model using an Eulerian
continuum approach in conjunction with the k-𝜀 turbulence model related to pipe fittings.
A 3D CFD model had been constructed to simulate single-phase fluid flow in two
commonly used pipe fittings: an elbow and a T-joint using the STAR-CD code by
Moujaes (2006). The elbow and T-joint model used in Moujaes’s research is shown in
Figure 2-10.
Elbow model T-joint model
Figure 2-10 the elbow and T-joint model using SolidWorks Program

26
A variety of flow conditions with Re number ranging from 0.78×10⁵
to 1.56×10⁵
were
simulated. Six uniformly distributed values of Re numbers were chosen within the above
range. Flow reversal regions near the inner radius and high velocity regions near the outer
radius downstream of the elbow were indicated based on the velocity profile. Pressure
located on the outer radius was high and changed significantly to a low one on the inner
radius. For the T-joint flow scenario, recirculation occurred immediately downstream of
the elbows when flow into the center leg. Velocity was high just downstream from the
stagnation zone. Significant pressure gradients existed across the flow area before the
flow split into the two legs of the T-joint.
2.2.3.2 Effect of Bend on Multi-phases Flow
The research discussed above for bend is just for single-phase flow. However, two-phase
or multiphase flow is constantly observed in many industries including petroleum,
chemical, oil, and gas industries, etc. (Sanchez, 2010). Multiphase flow is defined as the
simultaneous flow of several phases, with two-phase flow being the simplest case (Wallis,
1969). Due to the presence of different flow patterns, the equations governing two-phase
flow are more complex than single-phase flow (Benbella, 2009). Friction factor and
pressure drops have been investigated in several horizontal (Cole, 2004) and vertical
(Kongkiatwanitch, 2001) two-phase and multiphase flows (Spedding, 2006). The two-
phase flow typically produces an undesirable higher pressure drop compared to single-
phase flow. Same as the single-phase flow in bend, secondary flow will be produced
under the joint effect of centrifugal force and boundary layer at the wall. Centrifugal
force is caused by the curvature of bend as fluid flows through the bend and then directed
from the momentary center of the curvature toward the outer wall of the pipe. The
undesirable high-pressure drop is difficult to predict due to the lack of a model for
determining the two-phase flow through pipe components. Chisholm (1983) presented an

27
elementary model for prediction of two-phase flow in bends, where he introduced a liquid
two-phase multiplier based on different pipe diameters, r/d values, and flow rates.
According to Chisholm’s model, stratification of the two phases was induced by the
centrifugal force in the bend, making the two-phase flow in bends more complex. The
normal practice to calculate two-phase pressure drop is to multiply the single phase
pressure losses by a factor known as the empirically-correlated two-phase multiplier.
∆PTP
∆PLO= 1 + (
ρL
ρG− 1) × [{1 +
2.2
kLO(2+RbD
)} × (1 − x) + x2] (2-15)
Where ΔPTP is the pressure drop in two-phase flow, ΔPLO is pressure drop in a single
phase flow of the total mass flux and liquid properties, kLO is the bend loss coefficient for
single phase flow, and x is the dry quality.
However, most of these two-phase pressure loss studies have been confined to the
horizontal plane. Chenoweth and Martin (1955) adopted the Lockhart-Martinelli (1949)
model to predict the two-phase pressure drop around bends, a model initially developed
for straight pipe. The correlation turned out effective in predicting loss in bends and other
pipe fittings. Fitzsimmons (1964) presented two-phase pressure loss data for bend in
terms of the equivalent length and the ratio of the bend pressure loss to the straight pipe
frictional pressure gradient. Sekoda et al. predicted the two-phase bend pressure drop
using a two-phase multiplier, referred to as a single-phase liquid pressure loss in the bend.
Results indicated that the two-phase pressure drop was dependent on the r/D ratio while
independent of pipe diameters (Sekoda, 1969). Flow pattern also has an impact on the
pressure drop for flow through 90 degree bend. Orientation of the plane of the bend
giving contrary results has been reported by previous research work. Debold (1962)

28
declared that the same bend pressure loss was found in horizontal bend, the horizontal to
vertical up-bend, and the vertical down to horizontal bend, but not the horizontal to
vertical down-bend, which had a 35% less pressure drop than the other three. Debold’s
model correlating the elevation with pressure drop for the homogeneous model was
assumed to be suitable for the two-phase flow. Alves (1954), though, completely ignored
the influence of head pressure differences. Impact of flow patterns on pressure drop is
complicated and uncertain that even opposite conclusions would be reached. Peshkin
(1961) reported that horizontal to vertical down flow shows 10% greater pressure drop
through bend than the corresponding horizontal to vertical up-flow case, while
Kutateladze (1969) declared that the horizontal to vertical up-flow bend created more
pressure drop. Moujaes and Aekula developed CFD models in HVAC pipes to investigate
the effects of pressure drop on turning vanes in 90 degree duct elbows (Moujaes and
Aekula, 2009). It can be seen that various approaches have been applied to predict
pressure drop in elbows. Mazumder (2012) conducted CFD analysis of air-water two-
phase flow in four different elbows based on the previous research work. His simulated
results were validated using Azzi’s (2005) and Chisholm’s (1983) empirical models.
Kumar conducted experiments to measure pressure drop of sand-water two-phase slurry
flow through the pipe bend. Data was compared to the simulated result using commercial
CFD package Fluent. Result indicated that the Eulerian two-phase model could
reasonably predict the pressure drop with a slurry pipe bend in the horizontal plane.
Pressure drop along the pipe bend increased with flow velocity and particle concentration.
Pressure at the inner wall was less than that at the outer wall in the bend, the velocity and
concentration distribution of solids became more uniform downstream.

29
2.3 Research Methodology and Structure of the Thesis
The At Face Slurry System introduces a unique set of hydraulic transport problems.
Based on the previous research work mentioned above, SRC Two-Layer model has been
used to predict deposition velocities and pressure drop of oil sand slurry in horizontal
pipelines. Oil sand slurry flow in flexible pipeline and pipe bend has been scarcely
investigated. Frimpong (2003) simulated the oil sand slurry flow in the ground
articulating pipeline using finite difference equations and computer modeling. Computer
simulation and experimentation of oil sand flow in AFSS urgently demand further
research work. CFD is very promising in modeling hydrodynamics with the advent of
increased computational capabilities and its more suitably finite volume approach
compared to finite difference approach. The paper will focus to develop the mathematic
models governing the friction and head losses with the AFSS concept. The research work
is basically divided into three separate parts in this paper.
(1) Flow of oil sand slurry in horizontal pipeline is simulated using the commercial
CFD package Ansys – Fluid dynamics – Fluent 14.5. Results are compared to
field pressure drop data from Syncrude Canada, Ltd. and Suncor Energy, Inc.’s
stationary pipeline system to develop a mathematic model suitable governing the
friction loss for horizontal pipeline.
(2) A flexible arrangement of pipe loops capable of folding and extending imitating
the AFSS concept are set up in the laboratory. Experimental and modelling
results are obtained and compared to test the accuracy of CFD modelling to
predict pressure drop in flexible pipeline system.
(3) Based on research work in the previous two parts, flow of oil sand slurry in the
folding pipeline of the At Face Slurry System is simulated to validate its
technical viability.

30
3 CFD Simulation of Oil Sand Slurry Flow in Pipe
3.1 CFD Basics of Multiphase Modelling
Appropriate physical and mathematical model is essential for CFD simulation. Finite
element, finite volume and finite difference method are used to obtain a set of partial
differential equations based on the mathematical model. Due to its inherent conservation,
finite volume method is mostly applied in discrediting the partial differential equations.
Navier-Stokes equations are commonly used to describe the state of flow and are
generally solved for all flows in CFD modelling. The continuity and the momentum
expression of Navier-Stokes equations are shown as (ANSYS CFX Solver Theory Guide,
2011),
𝛿𝜌
𝛿𝜏+ ∇ ∙ (𝜌𝑢) = 0 (3-1)
𝛿𝜌𝑢
𝛿𝜏+ ∇ ∙ (𝜌𝑢𝑢) = −∇p + +∇ ∙ 𝜏 + 𝜌𝑔 (3-2)
Where ρ is density, u is instantaneous velocity, p is pressure, τ is the viscous stress tensor
and g is the gravity vector. Full description of a flow may require additional equations,
such as the energy equation and/or turbulence equations.
Direct numerical simulation (DNS) is a method to solve the governing equations without
any modelling. However, this method is time-consuming and ineffective. Flows in most
engineering problems are turbulent and would exhibit time scales of significantly
different magnitudes. This demands fine mesh resolution, which makes the calculation
become unfeasible. Effects of turbulence thus have been the main focus of single-phase
CFD research for the last couple of years. Multiphase flow is even more complex than
single-phase flow and demands more in-depth modelling due to the interaction between

31
different phases. Section 3.1 introduces some basics of multiphase flow and fundamental
concepts of CFD multiphase model based on the Fluent User Guide (Fluent, 2003).
3.1.1 The Basic CFD Approach
Multiphase flow is constantly observed in many industries including petroleum, chemical,
oil, and gas industries, etc. Physical phases of matter are gas, liquid and solid; however,
in multiphase flow, a phase can be defined as an identifiable class of material that has a
particular inertial response to and interaction with the flow and the potential field in
which it is immersed (Fluent, 2003). For instance, Solid particles made of same material
but with different diameters would be regarded as different phases based on the
assumption that particles with the same size will have a similar dynamical response to the
flow field. Multiphase flow can be grouped into four categories including gas-liquid or
liquid-liquid flows, gas-solid flows, liquid-solid flows and three-phase flows. Advances
in computational fluid dynamics technology allow further insight into the mechanism of
multiphase flows. Two approaches are commonly used for the numerical calculation of
multiphase flows: the Euler-Lagrange approach and the Euler-Euler approach.
3.1.1.1 The Euler-Lagrange Approach
The history of individual fluid particles is essentially tracked (Figure 3-1) in the
Lagrangian approach. Flow variable F in Lagrangian description is expressed as a
function of time, t, and the position vector of the particle at reference zero time, x0. While
the Eulerian description depicts the change of flow variables at a fixed spatial point, x,
which is a function of both spatial position, x, and time, t. The Euler-Lagrange Approach
tracks the particulates through the flow using Lagrangian description and describes the
fluid in the Eulerian way. The fluid phase is regarded as a continuum by solving the time-
averaged Navier-Stokes equations. The approach assumes that the dispersed second phase

32
occupies only a low volume fraction and is solved by tracking a large number of particles,
bubbles, or droplets through the calculated flow field. Momentum, mass, and energy are
interchangeable between the dispersed phase and fluid phase. Behavior of the particles in
the flow could be tracked by integrating a set of ordinary differential equations in time for
each sample particle. Since it is not realistic to track each particle even in dilute
suspension, the full particulate phase is modeled by just a sample of individual particles
(ANSYS, 2003). The Euler-Lagrange Approach is not applied in the CFD simulation of
oil sand flow in this paper, so it is not introduced here.
.
Figure 3-1 Lagrangian Description of Fluid Motion (after Kundu, 2002)
3.1.1.2 Euler-Euler Methods
For the purpose of simplifying the derivation of the hydrodynamic equations, phases in
the Euler-Euler approach are treated mathematically as interpenetrating continua. The
concept of phasic volume fraction is introduced in the approach. The computational
domain is divided into control volumes where volume of a phase cannot be occupied by
the other phases. Volume fractions of phases are expressed as continuous functions of
space and time with their sum equal to one. The computational efforts of modeling the
solid-liquid flow is significantly reduced by following the volume fraction of each phase,

33
especially the solid phase in each control volume instead of tracking each individual solid
particle. Conservation equations with similar structure are derived for each phase.
Constitutive relations obtained from empirical information are provided for closing these
equations. The following section will introduce the details of these hydraulic equations
and their closure.
3.1.2 General Hydrodynamic Equations for Multiphase Flow
The conservation equation can be derived by ensemble averaging the local instantaneous
balance for each of the phase or by using the mixture theory approach (Syamlal, 1993).
Phases in this approach are treated mathematically as interpenetrating continua. The
portion of volume occupied by each phase in a control volume is described as the concept
of phasic volume fractions αq. Based on the concept that conservation equations should
be satisfied by each phase individually, governing equations of conservation of mass and
momentum are derived. The sum of volume fractions of all phases in any control volume
equals to 1, as expressed as,
∑ α𝑞𝑛𝑞=1 = 1 (3-3)
The volume of phase q, expressed as Vq, is calculated as,
𝑉𝑞 = ∫ α𝑞𝑑𝑉𝑉
(3-4)
The effective density is expressed as
𝜌�̂� = 𝛼𝑞𝜌𝑞 (3-5)
Where 𝜌𝑞 is the physical density of phase q.
3.1.2.1 Continuity Equations
The continuity equation for phase q is

34
𝜕
𝜕𝑡(𝛼𝑞𝜌𝑞 ) + ∇ ∙ (𝛼𝑞𝜌𝑞 �⃗�𝑞) = ∑ �̇�𝑝𝑞
𝑛𝑝=1 (3-6)
Where �⃗�𝑞 is the velocity of phase q and �̇�𝑝𝑞 is the mass transfer from the pth to q
th phase.
3.1.2.2 Conservation of Momentum
The conservation of momentum for a liquid phase q is
𝜕
𝜕𝑡(𝛼𝑞𝜌𝑞 �⃗�𝑞) + ∇ ∙ (𝛼𝑞𝜌𝑞 �⃗�𝑞�⃗�𝑞) = −𝛼𝑞∇𝑝 + ∇ ∙ �̿�𝑞 + 𝛼𝑞𝜌𝑞 �⃗�
+𝛼𝑞𝜌𝑞 (�⃗�𝑞 + �⃗�𝑙𝑖𝑓𝑡,𝑞 + �⃗�𝑣𝑚,𝑞) (3-7)
Where �⃗� is the acceleration due to gravity, �̿�𝑞 is the qth phase stress-strain tensor, p is the
pressure, �⃗�𝑞 is an external body force, �⃗�𝑙𝑖𝑓𝑡,𝑞 is a lift force, and �⃗�𝑣𝑚,𝑞 is a virtual mass
force, Kpq is the momentum exchange coefficient between pth and q
th phases. The term
�̇�𝑝𝑞 characterizes the mass transfer from pth to q
th phase, �⃗�𝑞𝑝 is the relative velocity
between qth and p
th phase.
The conservation of momentum for sth solid phase is,
𝜕
𝜕𝑡(𝛼𝑠𝜌𝑠 �⃗�𝑠) + ∇ ∙ (𝛼𝑠𝜌𝑠 �⃗�𝑠�⃗�𝑠) = −𝛼𝑠∇𝑝 − ∇𝑝𝑠 + ∇ ∙ �̿�𝑠 + 𝛼𝑠𝜌𝑠 �⃗� +
𝛼𝑠𝜌𝑠 (�⃗�𝑠 + �⃗�𝑙𝑖𝑓𝑡,𝑠 + �⃗�𝑣𝑚,𝑠) + ∑ (�̇�𝑙𝑠�⃗�𝑠 + 𝐾𝑙𝑠(𝑁𝑙=1 �⃗�𝑙 − �⃗�𝑠)) (3-8)
Where ps is the sth solids pressure, Kls is the momentum exchange coefficient between
fluid or solid phase l and solid phase s, N is the total number of phases. �̿�𝑠 is the sth phase
stress-strain tensor, �⃗�𝑠 is an external body force, �⃗�𝑙𝑖𝑓𝑡,𝑠 is a lift force, and �⃗�𝑣𝑚,𝑠 is a virtual
mass force. Kls is the momentum exchange coefficient between lth and s
th phases. �̇�𝑙𝑠 is
the mass transfer from lth to s
th phase, �⃗�𝑙𝑠 is the relative velocity between l
th and s
th phase.

35
3.1.2.3 Closure of Momentum Conservation Equation
As shown in the above momentum conservation equations, it is necessary to determine
the solid shear stress, fluid shear stress as well as momentum exchanges between solid
and fluid and between solid and solid phase. The formulations for liquid-solid momentum
transfer and solid-solid momentum transfer are briefed for the CFD commercial package
Fluent.
(A) Fluid Stress Tensor
In Fluent, the fluid viscous stress tensor,�̿�𝑔 is assumed to be of Newtonian form:
�̿�𝑔 = 2𝛼𝑔𝜇𝑔�̿�𝑔 + 𝛼𝑔𝜆𝑔𝑡𝑟(�̿�𝑔 )𝐼 ̿ (3-9)
where �̿�𝑔 is the strain tensor for fluid phase, 𝜇𝑔 and 𝜆𝑔 are dynamic viscosity and bulk
viscosity for fluid phase.
(B) Fluid-Solid Momentum Exchange Coefficient
The fluid-solid exchange coefficient is expressed as,
𝐾𝑠𝑙 = 𝛼𝑠𝜌𝑠𝑓
𝜏𝑠 (3-10)
where drag function, f, is defined differently for the different exchange-coefficient
models,𝜏𝑠, the particulate relaxation time, is defined as
𝜏𝑠 = 𝜌𝑠𝑑𝑠
2
18𝜇𝑙 (3-11)
where ds is the diameter of particles of phase s.
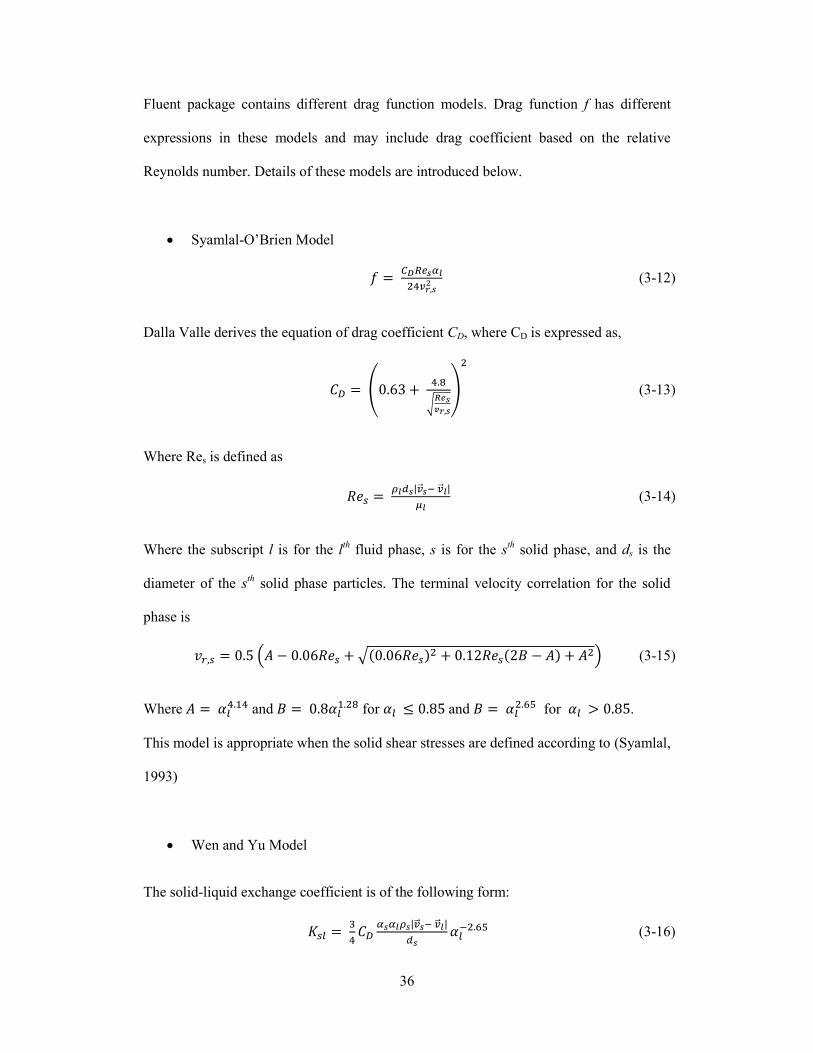
36
Fluent package contains different drag function models. Drag function f has different
expressions in these models and may include drag coefficient based on the relative
Reynolds number. Details of these models are introduced below.
Syamlal-O’Brien Model
𝑓 = 𝐶𝐷𝑅𝑒𝑠𝛼𝑙
24𝑣𝑟,𝑠2 (3-12)
Dalla Valle derives the equation of drag coefficient CD, where CD is expressed as,
𝐶𝐷 = (0.63 + 4.8
√𝑅𝑒𝑠𝑣𝑟,𝑠
)
2
(3-13)
Where Res is defined as
𝑅𝑒𝑠 = 𝜌𝑙𝑑𝑠|�⃗⃗�𝑠− �⃗⃗�𝑙|
𝜇𝑙 (3-14)
Where the subscript l is for the lth fluid phase, s is for the s
th solid phase, and ds is the
diameter of the sth solid phase particles. The terminal velocity correlation for the solid
phase is
𝑣𝑟,𝑠 = 0.5 (𝐴 − 0.06𝑅𝑒𝑠 + √(0.06𝑅𝑒𝑠)2 + 0.12𝑅𝑒𝑠(2𝐵 − 𝐴) + 𝐴2) (3-15)
Where 𝐴 = 𝛼𝑙4.14 and 𝐵 = 0.8𝛼𝑙
1.28 for 𝛼𝑙 ≤ 0.85 and 𝐵 = 𝛼𝑙2.65 for 𝛼𝑙 > 0.85.
This model is appropriate when the solid shear stresses are defined according to (Syamlal,
1993)
Wen and Yu Model
The solid-liquid exchange coefficient is of the following form:
𝐾𝑠𝑙 = 3
4𝐶𝐷
𝛼𝑠𝛼𝑙𝜌𝑠|�⃗⃗�𝑠− �⃗⃗�𝑙|
𝑑𝑠𝛼𝑙
−2.65 (3-16)

37
Where the drag coefficient
𝐶𝐷 = 24
𝛼𝑙𝑅𝑒𝑠[1 + 0.15(𝛼𝑙𝑅𝑒𝑠)0.687] (3-17)
This model is appropriate for dilute systems.
Gidaspow Model
This model is a combination of the Wen and Yu model and the Ergun equation.
When 𝛼𝑙 > 0.8, the fluid-solid exchange coefficient Ksl is expressed as:
𝐾𝑠𝑙 = 3
4𝐶𝐷
𝛼𝑠𝛼𝑙𝜌𝑠|�⃗⃗�𝑠− �⃗⃗�𝑙|
𝑑𝑠𝛼𝑙
−2.65 (3-18)
Where
𝐶𝐷 = 24
𝛼𝑙𝑅𝑒𝑠[1 + 0.15(𝛼𝑙𝑅𝑒𝑠)0.687] (3-19)
When 𝛼𝑙 ≤ 0.8,
𝐾𝑠𝑙 = 150𝛼𝑠(1−𝛼𝑙)𝜇𝑙
𝛼𝑙𝑑𝑠2 + 1.75
𝜌𝑙𝛼𝑠|�⃗⃗�𝑠− �⃗⃗�𝑙|
𝑑𝑠 (3-20)
This model is recommended for dense fluidized beds.
(C) Solid Pressure and Solid Stress Tensor
(a) Solid pressure
For granular flows in the compressible regime (i.e., where the solids volume fraction is
less than its maximum allowed value, a solid pressure is calculated independently and
used for the pressure gradient term,∇𝑃𝑠, in the granular phase momentum equation. Due
to the fact that a Maxwellian velocity distribution is used for the particles, a granular
temperature is introduced into the model, and appears in the expression for the solids
pressure and viscosities. The solids pressure is composed of a kinetic term and a second
term due to particle collisions:

38
𝑝𝑠 = 𝛼𝑠𝜌𝑠Θ𝑆 + 2𝜌𝑠(1 + 𝑒𝑠𝑠)𝛼𝑠2𝑔0,𝑠𝑠Θ𝑆 (3-21)
Where ess is the coefficient of restitution for particle collisions, 𝑔0,𝑠𝑠 is the radial
distribution function, and Θ𝑆 is the granular temperature. FLUENT uses a default value of
0.9 for ess, but the value can be adjusted to suit the particle type. The granular temperature
Θ𝑆 is proportional to the kinetic energy of the fluctuating particle motion. The
function𝑔0,𝑠𝑠is a distribution function that governs the transition from the compressible
condition withα < 𝛼𝑠,𝑚𝑎𝑥, where the spacing betweenthe solid particles can continue to
decrease, to the incompressible condition withα = 𝛼𝑠,𝑚𝑎𝑥, where no further decrease in
the spacing can occur.
Radial Distribution Function, g0, is a correction factor that modifies the probability of
collisions between grains when the solid granular phase becomes dense. This function
may be regarded as the non-dimensional distance between spheres:
𝑔0 = 𝑠+ 𝑑𝑝
𝑠 (3-22)
Where s is the distance between grains, FLUENT implemented the radial distribution
function proposed by Ranz (1958):
𝑔0 = [1 − (𝛼𝑠
𝛼𝑠,𝑚𝑎𝑥)
1/3
]
−1
(3-23)
If the number of solid phase is greater than 1, the radial distribution function is extended
to
𝑔0.𝑙𝑙 = [1 − (𝛼𝑙
𝛼𝑙,𝑚𝑎𝑥)
1/3
]
−1
(3-24)
Where 𝛼𝑙,𝑚𝑎𝑥 is specified during the problem setup, and

39
𝑔0,𝑙𝑚 = 𝑑𝑚𝑔0,𝑙𝑙+ 𝑑𝑙𝑔0,𝑚𝑚
𝑑𝑚+𝑑𝑙 (3-25)
(b) Solid shear stress
The solid shear stress tensor appears in the liquid-solid momentum equations. It contains
shear and bulk viscosities arising from particle momentum exchange due to translation
and collision. A friction component of viscosity can be included to account for the
viscous-plastic transition that occurs when particles of a solid phase reach the maximum
solid volume fraction.
The solid shear viscosity is the sum of the collisional and kinetic parts, and the optional
friction part:
𝜇𝑠 = 𝜇𝑠.𝑐𝑜𝑙 + 𝜇𝑠,𝑘𝑖𝑛 + 𝜇𝑠,𝑓𝑟 (3-26)
(b.1) Collisional Viscosity
𝜇𝑠,𝑐𝑜𝑙 = 4
5𝛼𝑠𝜌𝑠𝑑𝑠𝑔0,𝑠𝑠(1 + 𝑒𝑠𝑠) (
Θ𝑆
𝜋)
1
2 (3-27)
(b.2) Kinetic Viscosity
Expressions for kinetic viscosity, proposed by Syamlal et al. (1993) and Gidaspow et al.
(1992) are available in FLUENT. The expression proposed by Syamlal et al (1993) is
expressed as:
𝜇𝑠,𝑘𝑖𝑛 = 𝛼𝑠𝜌𝑠𝑑𝑠√Θ𝑆𝜋
6(3−𝑒𝑠𝑠)[1 +
2
5𝛼𝑠𝑔0,𝑠𝑠(1 + 𝑒𝑠𝑠)(3𝑒𝑠𝑠 − 1)] (3-28)
The expression proposed by Gidaspow et al. (1992) is:
𝜇𝑠,𝑘𝑖𝑛 = 10𝜌𝑠𝑑𝑠√Θ𝑆𝜋
96𝛼𝑠(1+𝑒𝑠𝑠)𝑔0,𝑠𝑠[1 +
4
5𝛼𝑠𝑔0,𝑠𝑠(1 + 𝑒𝑠𝑠)]
2 (3-29)
(b.3) Frictional Viscosity

40
In dense flow at low shear rate, the generation of stress is mainly due to friction between
particles when the secondary volume fraction for a solid phase approaches the packing
limit. Schaeffer (1987) calculated the frictional viscosity as:
𝜇𝑠,𝑓𝑟 = 𝑝𝑠 𝑠𝑖𝑛 𝜑
𝑠√𝐼2𝐷 (3-30)
Where ps is the solid pressure,φ is the angle of internal friction, and I2D is the second
invariant of the deviatoric stress tensor.
(b.4) Bulk Viscosity
The solids bulk viscosity accounts for the resistance of the granular particles to
compression and expansion. It has the following form from Lun et al (1984).
𝜆𝑠 = 4
3𝛼𝑠𝜌𝑠𝑑𝑠𝑔0,𝑠𝑠(1 + 𝑒𝑠𝑠) (
Θ𝑆
𝜋)
1
2 (3-31)
(D) Solid-Solid Momentum Exchange Coefficient
Fluent adopts the calculation of solid-solid momentum exchange coefficient derived by
Syamlal (1987). This approach is based on a simplified version of kinetic theory:
𝐾𝑙𝑠 = 3(1+𝑒𝑙𝑠)(
𝜋
2+𝐶𝑓𝑟,𝑙𝑠
𝜋2
8)𝛼𝑠𝜌𝑠𝛼𝑙𝜌𝑙(𝑑1+𝑑2)2𝑔0,𝑙𝑠
2𝜋(𝜌𝑙𝑑𝑙3+𝜌𝑠𝑑𝑠
3)|�⃗�𝑙 − �⃗�𝑠| (3-32)
Where els is the coefficient of restitution, Cfr,ls is the coefficient of friction between the lth
and sth solid phase particle s, dls is the diameter of the particles of solid l, and g0,ls is the
radial distribution coefficient.
(E) Granular Temperature
The granular temperature for the sth solid phase is proportional to the kinetic energy of the
random motion of the particles. The transport equation derived from kinetic theory is
expressed as:

41
3
2[
𝜕
𝜕𝑡(𝛼𝑠𝜌𝑠Θ𝑆) + ∇ ∙ (𝛼𝑠𝜌𝑠�⃗�𝑠Θ𝑆)] = (−𝑝𝑠𝐼 ̿ + �̿�𝑠): ∇�⃗�𝑠
+∇ ∙ (𝑘Θ𝑆∇Θ𝑆) − γΘ𝑆 + 𝜑𝑙𝑠 (3-33)
where (−𝑝𝑠𝐼 ̿ + �̿�𝑠): ∇�⃗�𝑠 is the generation of energy by the solid stress tensor,𝑘Θ𝑆∇Θ𝑆 is
the diffusion of energy, γΘ𝑆 is the collisional dissipation of energy, and 𝜑𝑙𝑠is the energy
exchange between the lth fluid or solid phase and the s
th solid phase. When the Syamlal
(1987) model is used, the diffusion coefficient for granular temperature is given by
𝑘Θ𝑆=
15𝛼𝑠𝜌𝑠𝑑𝑠√𝛩𝑆𝜋
4(41−33𝜂)[1 +
12
5𝜂2(4𝜂 − 3)𝛼𝑠𝑔0,𝑠𝑠 +
16
15𝜋(41 − 33𝜂)𝜂𝛼𝑠𝑔0,𝑠𝑠] (3-34)
Where
𝜂 = 1
2(1 + 𝑒𝑠𝑠) (3-35)
Following expression is used if the model of Gidaspow is enabled:
𝑘Θ𝑆=
150𝜌𝑠𝑑𝑠√𝛩𝑆𝜋
384(1 + 𝑒𝑠𝑠)𝑔0,𝑠𝑠[1 +
6
5(1 + 𝑒𝑠𝑠)𝛼𝑠𝑔0,𝑠𝑠]
2
+2𝜌𝑠𝛼𝑠2𝑑𝑠(1 + 𝑒𝑠𝑠)𝑔0,𝑠𝑠√𝛩𝑆/𝜋 (3-36)
The collisional dissipation of energy γΘ𝑆is represented by the expression derived by Lun
et al. (1984):
𝛾Θ𝑚=
12(1−𝑒𝑠𝑠2)𝑔0,𝑠𝑠
𝑑𝑠√𝜋𝜌𝑠𝛼𝑠
2𝛩𝑆3/2
(3-37)
The transfer of the kinetic energy of random fluctuations in particle velocity from the sth
solid phase to the lth fluid or solid phase is represented by 𝜑𝑙𝑠:
𝜑𝑙𝑠 = −3 𝐾𝑙𝑠𝛩𝑆 (3-38)
FLUENT uses an algebraic relation for the granular temperature by neglecting convection
and diffusion in the transport equation of granular temperature.

42
3.1.3 Turbulence Model
Three methods are provided in Fluent for modeling turbulence in multiphase flows within
the context of the k-ε models including mixture turbulence model, dispersed turbulence
model and turbulence model for each phase. Considering the accuracy and computational
efforts, Mixture Turbulence Model is selected for the simulation in this paper. The k and
ε equations describing this model are as follows:
𝜕
𝜕𝑡(𝜌𝑚 𝑘) + ∇ ∙ (𝜌𝑚 �⃗�𝑚𝑘) = ∇ ∙ (
𝜇𝑡,𝑚
𝜎𝑘∇𝑘) + 𝐺𝑘,𝑚 − 𝜌𝑚 𝜖 (3-39)
and
𝜕
𝜕𝑡(𝜌𝑚 𝜖) + ∇ ∙ (𝜌𝑚 �⃗�𝑚𝜖) = ∇ ∙ (
𝜇𝑡,𝑚
𝜎𝜖∇𝜖) +
𝜖
𝑘(𝐶1𝜖𝐺𝑘,𝑚 − 𝐶2,𝜖𝜌𝑚 𝜖) (3-40)
Where the mixture density and velocity, 𝜌𝑚 and �⃗�𝑚 are computed from
𝜌𝑚 = ∑ 𝛼𝑖𝜌𝑖𝑁𝑖=1 (3-41)
and
�⃗�𝑚 = ∑ 𝛼𝑖𝜌𝑖�⃗⃗�𝑖
𝑁𝑖=1
∑ 𝛼𝑖𝜌𝑖𝑁𝑖=1
(3-42)
the turbulent viscosity, 𝜇𝑡,𝑚is computed from
𝜇𝑡,𝑚 = 𝜌𝑚𝐶𝜇𝑘2
𝜖 (3-43)
and the production of turbulence kinetic energy, 𝐺𝑘,𝑚 is computed from
𝐺𝑘,𝑚 = 𝜇𝑡,𝑚(∇�⃗�𝑚 + (∇�⃗�𝑚)𝑇) ∶ ∇�⃗�𝑚 (3-44)
The constants in these equations are the same as described for the single-phase k-ε model
in FLUENT.

43
3.2 CFD Mathematical Model
3.2.1 Input of Oil Sand Properties for Simulation
Oil sand slurry investigated here is considered to be a transient multiphase flow of
incompressible and immiscible phases including hot water, oil and solid phases. Oil and
water can be combined to generate a pseudo single fluid phase that their properties are
averaged into a single liquid phase. This thesis develops a Two-Phase (sand, pseudo
single fluid phase combining water and bitumen) CFD model to simulate the oil sand
flow behavior.
Bitumen viscosity in oil sand depends significantly on the temperature, as shown in
Figure 3-2. Puttagunta (1993) developed a viscosity-temperature correlation over a wide
range of temperatures for all Alberta heavy oils and bitumen. Properties of oil sand
adopted from Frimpong’s (2002) and Puttagunta (1993) are given in Table 3-1. Viscosity
and density of the pseudo single fluid phase are obtained by averaging the properties of
bitumen and water according to the principles developed by Refutas (2000), as shown in
Table 3-2. Since field data are obtained for a wide range of slurry densities (specific
gravities between 1.37 and 1.57). The specific gravity is acted as a variable input
parameter in the CFD model. The appropriate specific gravity of 1.44 is obtained by
comparing simulated pressure drop data with operational data in the field pipelines. The
corresponding mass fraction of sand, water and bitumen are 50%, 40% and 10%,
respectively.

44
Figure 3-2 Temperature dependence of bitumen viscosity (after Mochinaga, 2006)
Table 3-1 Oil sand properties for CFD simulation
Type parameter Values
Phase data Solid density 2650 kg/m3
Water density 1000 kg/m3
Bitumen density 960 kg/m3
Temperature 25 ℃
Water viscosity 0.001003Pa.s
Bitumen viscosity 30Pa.s
Solid inlet fraction 50% (by mass)
Water inlet fraction 40% (by mass)
Bitumen inlet fraction 10% (by mass)

45
Table 3-2 Numerical solution input data of the CFD Two-Phase Model
Type parameter Values
Phase data Solid density 2650 kg/m3
Pseudo single fluid phase 990 kg/m3
Pseudo single fluid phase viscosity 0.007Pa.s
Solid inlet fraction 50% (by mass)
Pseudo single fluid phase inlet fraction 50% (by mass)
3.2.2 Mathematical Model
Fluent has several general multiphase model like the Volume of Fluid (VOF) model,
mixture model and Eulerian model. The choosing of a specific multiphase flow model
depends on the volume fraction of solid particles and on fulfilment of the simulation
requirements. The VOF model is appropriate for stratified or free-surface flows, and the
mixture and Eulerian models are appropriate for flows in which the phases mix or
separate and/or dispersed-phase volume fractions exceed 10% (Fluent User Guide, 2003).
As a matter of fact, solid concentration in oil sand slurry could even reach 60% that the
mixture model and Eulerian model can be used. Due to the high solid concentration
presented, the dispersed phases would be concentrated in portions of the pipe domain,
Eulerian model therefore would be more appropriate in this case. For the two versions of
the Eulerian model, the granular version is chosen since the non-granular model does not
consider friction and collisions between particles. This effect is believed to be of great
importance in a slurry pipeline system. Besides, a maximum packing limit can be set in
the granular version, making it more suitable for modelling flows with a particulate
secondary phase.

46
3.2.2.1 Geometry and Meshing
To conduct this study, three three-dimensional horizontal pipes are created using Ansys-
Geometry. Pipes are of diameter 0.6096m, 0.7366m and 0.762m, respectively. Pipe
length of 30m is used. The geometries are then imported to Fluent to simulate pressure
drop. Table 3-3 lists the mesh details of all three pipes. Hexahedral mesh is used, due to
its capabilities in providing high-quality solution, with a fewer number of cells than
comparable tetrahedral mesh for simple geometry (Fluent User Guide, 2003). The pipe
meshing details are shown in Figure 3-3 and Figure 3-4.
Table 3-3 Mesh details of all three pipes
Number of nodes Number of hexahedral elements
Pipe (0.6096m) 215,517 203,236
Pipe (0.7366m) 391,092 376,110
Pipe (0.762m) 291,249 275,716
Figure 3-3 Meshing of the pipe geometry

47
Figure 3-4 Pipe Inlet domain
3.2.2.2 Mesh Independency Study
A mesh independency study is performed using the pipe of diameter 0.6096m.
Reasonable results independent of the grid size can be obtained. The results are shown in
Table 3-4.
Table 3-4 Mesh independency study for the pipe (Diameter: 0.6096m, length: 30 m)
Slurry velocity Mesh elements Pressure drop predicted (Pa) Error*
4 m/s 203,236 5975 2.1%
393,296 5980 2.2%
748,238 6019 2.9%
2,277,056 6074 3.8%
* Experimental pressure drop for oil sand slurry in pipe of diameter 0.6096m at the velocity 4m/s
is 195 Pa/m.

48
Results indicated that reasonable pressure drop independent of the size of the grid could
be obtained when the grid size reaches adequately small and accurate value.
3.2.2.3 Wall Function and Boundary Layer
Turbulent flows are greatly affected by the presence of walls. The near-wall modeling
significantly impacts the accuracy of numerical solutions. In the near-wall region,
solution variables normally have large gradients. In addition, the momentum and other
scalar transport occur most vigorously. Numerous experiments have shown that the near-
wall region can be largely subdivided into three layers (Fluent User Guide, 2003). The
innermost layer is called the “viscous sub-layer". Laminar flow is the primary pattern
here and the (molecular) viscosity dominates the momentum, heat or mass transfer. The
layer where turbulence plays a major role is called the fully-turbulent layer. The interim
region exists between the viscous sub-layer and the fully turbulent layer. Effects of
molecular viscosity and turbulence are equally important in this region. The subdivisions
of the near-wall region are illustrated in Figure 3-5, which is plotted in semi-log
coordinates. These three zones are separated based on their corresponding wall y+,
namely the viscous sub-layer (y+<5), buffer layer or blending region (5<y
+<30) and fully
turbulent or log-law region (30<y+<60).
Similar to local Reynolds number, the wall y+ is a non-dimensional distance used in CFD
to determine how coarse or fine a mesh is for a particular flow. It is normally expressed
as the ratio between the turbulent and laminar influences in a cell. Tangential velocity
fluctuations are reduced by viscous damping, while the normal fluctuations are reduced
by kinematic blocking at inner part of the near wall region. However, the turbulence is
rapidly increased by the turbulent kinetic energy produced due to the presented large
gradients in mean velocity at the outer part of the near-wall region. Values of y+ close to

49
the lower bound (y+≈30) are most desirable for wall functions (Fluent User Guide,
2003).
Figure 3-5 Subdivisions of the Near-wall Region (after Fluent User Guide, 2003)
Due to the large gradient presented, the fact that near-wall requires fine grids makes the
calculation to become more expensive both in terms of time and the complexity of the
equations. Computer of greater memory and faster processing is needed. Successful
predictions of wall-bounded turbulent flows require accurate characterization of the flow
in the near-wall region. The k-ε model is primarily valid for turbulent core flows where in
the regions somewhat far from walls. Wall-function is developed in Fluent to make the k-
ε model suitable for wall-bounded flows. A wall function is a collection of semi-
empirical formulae and functions. It provides a cheaper calculation by substituting the
fine grids with a set of equations linking the solutions’ variables at near-wall cells and the
corresponding quantities on the wall.

50
In this thesis, the Scalable wall function proposed by Launder and Spalding (1974) is
used. Launder proposes that in the scalable wall-function approach, the viscosity affected
sub-layer region is bridged by employing empirical formulas to provide near-wall
boundary conditions for the mean flow and turbulence transport equations. These
formulas connect the wall conditions (e.g. the wall shear stress) to the dependent
variables at the near-wall grid node, which is presumed to lie in the fully-turbulent region
of the boundary layer. The wall function helps in more precise calculation of near-wall
shear stresses for both liquid and solid phases in the Eulerian two-phase model. A
boundary layer that contains five cells with a distance of the cell adjacent to the wall at 5%
of the diameter of the pipe and a growth factor of 1.2 is initially employed on the wall to
improve the performance of the wall function, as shown in Figure 3-6. The y+/y*
adaption function in Fluent is also adopted to fulfil the requirement of y+ for the cell
adjacent to the wall. The y+ in this thesis falls between 30 and 200.
Figure 3-6 Boundary layer of the pipe

51
3.2.2.4 Boundary Conditions
The calculation domain is bounded by three faces including the inlet boundary, the wall
boundary, and the outlet boundary. At the inlet, velocities and concentrations of liquid
and solid phases are specified. The mean flow velocity is measured experimentally in
field using an electromagnetic flowmeter. Velocities of the solid and liquid phases are
specified as the same. Velocities of magnitudes of 3 m/s, 4 m/s and 5 m/s are used as
input for the model. As mentioned above, the appropriate slurry specific gravity 1.44 is
obtained by comparing simulated pressure drop data with operational data in field
pipelines. The corresponding volume fractions of sand and liquid phase are 0.27 and 0.73,
respectively. Detailed input parameters are shown in Table 3-5.
Table 3-5 Boundary conditions of the model
Type Parameter Values
Phase data Solid density 2650 kg/m3
Liquid-phase density 992 kg/m3
Solid volume fraction 0.27
Liquid-phase viscosity 0.007Pa.s
Solid diameter 0.18 mm
Velocity 3m/s, 4m/s and 5m/s
The inlet is specified as velocity-inlet; the outlet pressure is specified as atmospheric
pressure. At the wall, the liquid and particles velocities are set to zero as no-slip condition.
3.2.2.5 Solution Strategy and Convergence
For the purpose of obtaining satisfactory accuracy, stability and convergence, a second-
order upwind discretisation scheme is used for the momentum equation, and a first-order

52
upwind discretization is used for volume fraction, turbulent kinetic and turbulent
dissipation rate. The convergence criterion is based on the residual value of the calculated
variables including continuity, mass and velocity components, turbulent kinetic energies,
turbulent dissipation energies and volume fraction. Threshold values are set to 1e-04 of
the initial residual value of each variable. Phase-coupled Simple algorithm is used in
pressure–velocity coupling. The calculation also applies other solution strategies like the
reduction of under-relaxation factors of momentum, volume fraction, turbulence kinetic
energy and turbulence dissipation for better convergence and stability. A time step of
0.0001s is initially set up and gradually increased during the simulation for the transient
calculation.
3.3 Simulation Results of the Eulerian Two-Phase Model
3.3.1 Velocity Profile
Three velocity magnitudes of 3 m/s, 4 m/s and 5 m/s are used as input for the model. The
liquid phase velocity profile (slurry velocity: 4 m/s) in the horizontal pipe of diameter
0.6096m is shown in Figure 3-7. Velocity profiles in horizontal slurry flow are directly
linked to many factors including the solid concentration, particle size and mixture
viscosity. It can be seen that the velocity profiles are mostly symmetrical about the pipe
axis. The maximum local velocity 4.581 m/s is found in a little bit upper portion of the
pipe and not at the centerline. The sand deposition at the bottom of the pipe may impede
the velocity development in the lower portion of the pipe.
As fluid progresses from the inlet to outlet, flow develops gradually to a fully turbulent
flow. The velocity profile development of oil sand slurry from the inlet to outlet is
indicated in Figure 3-8. Contour plots of liquid velocity along the pipe cross section at
various axial positions separated by 10 m intervals are indicated. Significant differences

53
in liquid velocity can be observed between the inlet and outlet axial positions. Generally,
the velocity contour plots are mostly symmetrical about the pipe axis.
Velocity profile indicates the similar pattern in pipes of diameter 0.7366m and 0.762m.
However, solid particle size is specified as the median size of 0.18 mm in this thesis, the
effects of particle size distribution and large particle on velocity profile are not indicated
from the simulation. Kalekudithi (2009) predicted liquid velocity profiles for slurries
containing particles with different sizes (90, 270 and 480μm, respectively). His study
showed that the velocity profiles became increasingly asymmetrical with increasing
particle size. This phenomenon has also been demonstrated experimentally by Gillies
(2004) and Roco (1983).
Figure 3-7 Liquid phase velocity profile at the outlet along the pipe of diameter 0.6096m
(velocity: 4m/s)

54
(a) (b)
(c) (d)
Figure 3-8 Liquid phase velocity development along the pipe of diameter 0.6096m
(velocity: 4m/s) a) Inlet; (b) z = 10 m (axial coordinate); (c) z = 20 m (axial coordinate); (d)
Outlet
3.3.2 Sand Concentration Profile
Sand concentration profile is influenced by many parameters including mixture velocity,
mixture density, pipe diameter, particle size, and particle density. Due to the high
concentration presented of up to 50% by mass, the ability of a model to predict the solid
concentration distribution profiles remains great significance. In addition, the evaluation
or prediction of pipeline wear also demands the knowledge of solids distribution across

55
the pipe cross-section (Guangchuan, 2013). Reasonable velocity should be ensured to
suspend solid particles in the pipe. Figure 3-9 shows the predicted concentration profiles
(slurry velocity: 4m/s) at the outlet in the pipe of diameter 0.6096m. The maximum sand
volume concentration of 0.3137 is found at the bottom of the pipe. Figure 3-10 indicates
the contour plots of sand concentration along the pipe cross section at various axial
positions. It can be observed from that for these high concentration slurries, fluid
turbulence is not fully effective in suspending the solid particles and sand gradually
deposits along the pipe from the inlet to outlet. The nearly identical contour plots shown
in Figure 3-10 for axial positions (e) and (f) shows that the obtained numerical results are
basically provided for fully developed flow. Sand concentration profile indicates the
similar pattern in pipes of diameter 0.7366m and 0.762m.
Figure 3-9 sand concentration profile at the outlet along the pipe of diameter 0.6096m
(velocity: 4m/s)

56
(a) (b)
(c) (d)
(e) (f)
Figure 3-10 Sand concentration profile development along the pipe of diameter 0.6096m
a) Inlet; (b) z = 10 m; (c) z = 15 m; (d) z = 20 m; (e) z = 25m; f) Outlet

57
3.3.3 Pressure Drop
3.3.3.1 Analysis of Field Pipeline Performance
For the operation of sand slurry pipelines in the oil sand industry, presence of lumps,
stationary bed formed and hydrodynamic roughness all contribute to slurry pressure drops
measured in industrial pipelines. The focus of this thesis for oil sand slurry pressure drop
is intended to be general that pipelines selected here represent the most important
hydrotransport applications in the oil sand industry and are not identified by the name of
the owner. Most of these Pipelines are from Suncor Energy Inc. and Syncrude Canada
Ltd. Data is monitored continuously and recorded in digital form. Operating data are
obtained for a wide range of slurry densities (specific gravities between 1.37 and 1.57)
and ore grades under different velocities. These samples selected are estimated to
adequately represent a range of operating conditions but should not be regarded as
limiting cases. Oil sand hydrotransport pipelines of diameter 0.6096m, 0.7366m and
0.762m are considered here. Pressure drop data of these pipelines under different slurry
velocities is obtained. The data is shown in Figure 3-11.
The quotient of the pressure difference and the density is calculated for a 30-minute
average period. Operators examine the 30-minute averages of the flow rate, density and
static pressure data to identify periods in which the flow rate and density are nearly
constant. There is no kinetic energy difference over the pipe section since the pipe cross-
sectional area is constant. The Mechanical Energy Balance between the upstream plane1
and downstream plane 2 is interpreted as:
(𝑃2 − 𝑃1) + 𝜌𝑔(ℎ2 − ℎ1) + 𝜌𝑔𝑗𝐿 = 0 (3-45)
Where P is the water static pressure, 𝜌 is the density, j is the friction loss per pipe length
and L is pipe section length. This equation indicates that the frictional pressure loss (𝜌g j
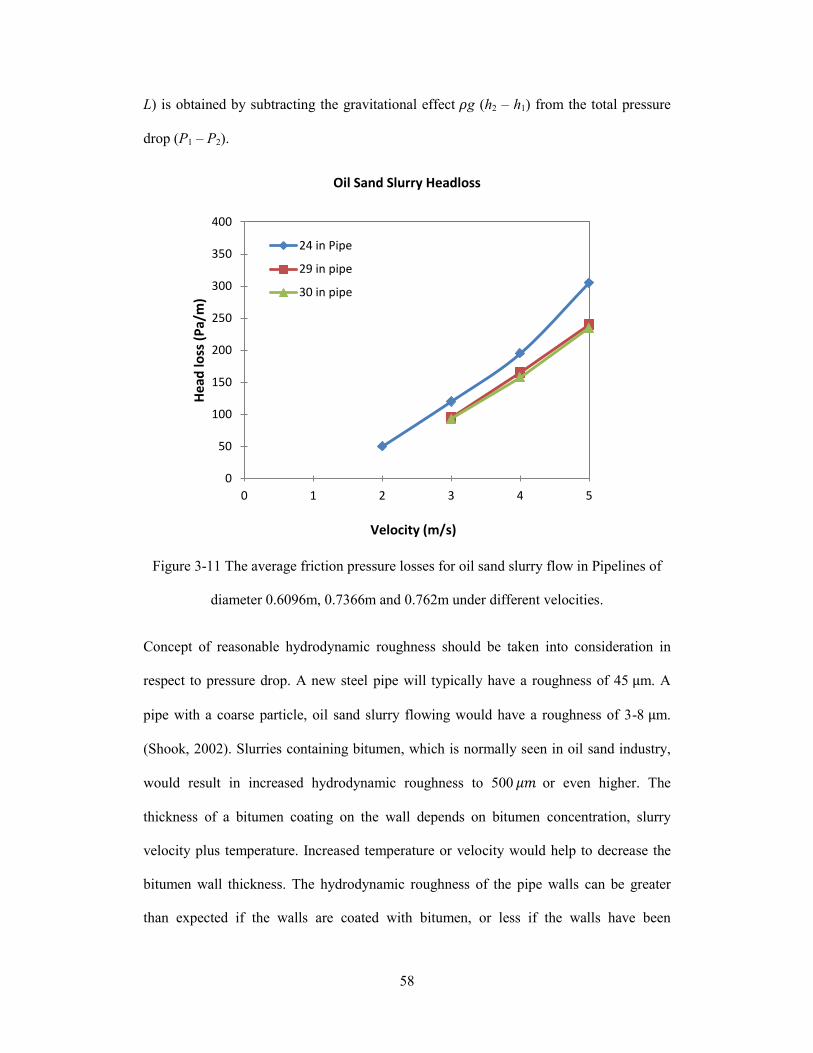
58
L) is obtained by subtracting the gravitational effect 𝜌g (h2 – h1) from the total pressure
drop (P1 – P2).
Figure 3-11 The average friction pressure losses for oil sand slurry flow in Pipelines of
diameter 0.6096m, 0.7366m and 0.762m under different velocities.
Concept of reasonable hydrodynamic roughness should be taken into consideration in
respect to pressure drop. A new steel pipe will typically have a roughness of 45 μm. A
pipe with a coarse particle, oil sand slurry flowing would have a roughness of 3-8 μm.
(Shook, 2002). Slurries containing bitumen, which is normally seen in oil sand industry,
would result in increased hydrodynamic roughness to 500 𝜇𝑚 or even higher. The
thickness of a bitumen coating on the wall depends on bitumen concentration, slurry
velocity plus temperature. Increased temperature or velocity would help to decrease the
bitumen wall thickness. The hydrodynamic roughness of the pipe walls can be greater
than expected if the walls are coated with bitumen, or less if the walls have been
0
50
100
150
200
250
300
350
400
0 1 2 3 4 5
Hea
d lo
ss (
Pa/
m)
Velocity (m/s)
Oil Sand Slurry Headloss
24 in Pipe
29 in pipe
30 in pipe

59
smoothed from abrasion by sand (Sanders, 2000). In addition to the hydrodynamic wall
roughness, presence of lumps or large particles, as mentioned in Chapter 2, is expected to
contribute to greater slurry pressure drop measurements than those predicted by the
model. Due to these uncertainties, pipe simulated in Fluent is assumed to be smooth with
its roughness being zero. Since operating data are obtained for a wide range of slurry
densities (specific gravities between 1.37 and 1.57), slurry density is acted as a variable
parameter in the CFD model. The appropriate slurry density is obtained by comparing
simulated pressure drop data with operational data in field pipelines. The mathematical
model developed suitable to modelling oil sand slurry flow in horizontal pipeline then
will be used in the AFSS folding pipelines.
Pressure drops along the pipe at different velocities for the pipes of diameters 0.6096m,
0.7366m and 0.762m are shown in Figure 3-12, Figure 3-13 and Figure 3-14, respectively.
Figure 3-12 Pressure drop along the pipe of diameter 0.6096m at different velocities
0
2000
4000
6000
8000
10000
0 10 20 30
Pre
ssu
re (
Pa)
Distance from inlet (m)
Pressure drop in pipe (D = 0.6096m)
v = 3 m/s
v = 4 m/s
v = 5 m/s

60
Figure 3-13 Pressure drop along the pipe of diameter 0.7366m at different velocities
Figure 3-14 Pressure drop along the pipe of diameter 0.762m at different velocities
0
2000
4000
6000
8000
10000
0 10 20 30
Pre
ssu
re (
Pa)
Distance from inlet (m)
Pressure drop in pipe (D = 0.7366m)
v = 3 m/s
v = 4 m/s
v = 5 m/s
0
2000
4000
6000
8000
10000
0 10 20 30
Pre
ssu
re (
Pa)
Distance from inlet (m)
Pressure drop in pipe (D = 0.762m)
v = 3 m/s
v = 4 m/s
v = 5 m/s

61
The comparison between operational and predicted pressure drop data at different
velocities for the pipes with diameters 0.6096m, 0.7366m and 0.762m are shown in
Figure 3-15, Figure 3-16 and Figure 3-17, respectively. The predicted pressure drop is in
good agreement (within a percentage deviation of ±3% ) with the experimental
measurements for the wide range of slurry flow conditions.
Figure 3-15 Comparison between operational and predicted pressure drop in pipe of
diameter 0.6096 m
Figure 3-16 Comparison between operational and predicted pressure drop in pipe of
diameter 0.7366 m
0
50
100
150
200
250
300
350
2 3 4 5
Pre
ssu
re d
rop
(P
a/m
)
Velocity (m/s)
Oil Sand Slurry Headloss (D = 0.6096m)
Experimental Pressure Drop
Predicted Pressure Drop
0
50
100
150
200
250
300
350
2 3 4 5
Pre
ssu
re d
rop
(P
a/m
)
Velocity (m/s)
Oil Sand Slurry Headloss (D = 0.7366m)
Experimental Pressure Drop
Predicted Pressure Drop

62
Figure 3-17 Comparison between operational and predicted pressure drop in pipe of
diameter 0.762m
The Eulerian Multiphase model has accurately predicted the pressure drop of oil sand
slurry flow in horizontal pipeline. The same mathematical model will be used to predict
the pressure drop in the folding pipelines of the At Face Slurry System, which will be
introduced in the following section.
0
50
100
150
200
250
300
350
2 3 4 5
Pre
ssu
re d
rop
(P
a/m
)
Velocity (m/s)
Oil Sand Slurry Headloss (0.762m pipe)
Experimental Pressure Drop
Predicted Pressure Drop

63
4 At Face Slurry Experiment
4.1 Set Up of Experimental Pipe Loop
Figure 4-1 shows the At Face Slurry Test loop. The test loop is 27.5 m long of inside
diameter 50.8 mm. it is built to obtain hydraulic data regarding various characteristics of
the flow including flow rates, pressure drop and flow patterns across the pipe cross-
section, etc.
Figure 4-1 At face slurry test loop
The rig consists of a closed circulating pipe loop, slurry mixture tank and a centrifugal
pump to maintain the slurry flow. Water and the solid particles are mixed mechanically in
the tank. A stirring arrangement is provided to keep the slurry well mixed. An
electromagnetic flux flowmeter is installed in the pipe for continuous monitoring of
slurry velocity. Since it is a closed loop, water and solid particles pumped into the pipe
system are accurately measured to ensure the desired slurry solid concentration. Each
experiment is repeated three times to obtain the average value for accuracy demand. For

64
the study in this thesis, sand concentration of 10%, 25% and 50% (by mass) are used
under the velocity of 2.3 m/s. The detailed velocity selection (above the slurry deposition
velocity) of the experimental system is described in section 4.2.
To measure the pressure drop distribution in the pipe and the swivel joint unit, pressure
transducers are provided at the inlet of the loop, upstream and downstream sides of each
swivel bend. Detailed distribution of the pressure transducers in the swivel joint units are
shown in Figure 4-2.
Figure 4-2 Pressure transducer location
The swivel joint unit is made up of two commercial bends with r/d of 1.5 and a vertical
pipe section. The bend is capable to swivel around the vertical axis of the vertical pipe
section so that the pipes could fold and extend to make zigzag movements and display
different configurations. Transparent pipes are used to connect these swivel joint units for
the convenience to observe the flow pattern and sand deposition of the slurry. The solid

65
particles used here is silica sand. These solid particles have a measured specific gravity of
2.65 and a median particle size of 480𝜇𝑚. For the two-phase flow, an equivalent pipe
length to pipe diameter ratio of approximately 100–150 is required for fully developed
flow (Mazumder, 2008). Due to limitations of the experimental test system, the ratio used
in this study is 30. Experimental loop is checked for correct alignment between the bend
and the straight pipe before taking each measurement. The pipe loop experiments are
conducted with different alignment angles of 0 degree, 30 degree, 60 degree and 80
degree, respectively. These configurations are shown in Figure 4-3 to Figure 4-6.
Figure 4-3 Pipe loop with alignment angle 0o
Figure 4-4 Pipe loop with alignment angle 30o

66
Figure 4-5 Pipe loop with alignment angle 60o
Figure 4-6 Pipe loop with alignment angle 80o
4.2 Slurry Velocity Requirement for the Experiment
The minimum velocity required to suspend a solid particle in a pipe is known as the limit-
deposit velocity, VL. It is also referred to as the deposition velocity, which corresponds to
the velocity for transition from the moving bed regime to the heterogeneous regime.
Durand (1953) conducted extensive tests with pipes ranging in diameter from 38 to 710
mm, using particles of sand and gravel measuring from 0.2 to 25 mm, at volume
concentrations between 2 and 23%. Figure 4-7 shown below summarizes Durand’s work
for solid particles of uniform or nearly uniform size and for particles of rather non-
uniform size distribution. VL therefore can be determined from this figure that once the
particle diameter ds, pipe diameter D, solid specific gravity S, solid volumetric

67
concentration Cv, and gravitational acceleration g are known. The value of ds is based on
the mesh size that passes 85% for non-uniform particles. The equation to obtain V1 is
expressed as,
𝐹1 =𝑉1
√2𝑔𝐷(𝑆−1) (4-1)
Where F1 is the densimetric Froude number of the slurry flow in pipe corresponding to
particle deposition, FL can be determined from Figure 4-7.
Figure 4-7 limit-deposit velocity for solid particles: (a) uniform size particles; (b) non-
uniform size particles (after Durand, 1953)

68
A velocity V slightly higher than VL (say V =1.2 VL) would be necessary to make sure that
the flow is heterogeneous with fully suspended solids. The other deposition velocity
theory is proposed by Govier (1972). The velocity demanded for hydrautransport is rather
greater than the velocity required to keep the solids “float” in an upward stream of the
fluid. Normally, a useful practice guide for choosing the velocity is
𝑣 = 𝐾 √[𝑑 (𝑠−𝑟
𝑟)] (4-2)
Where K is a constant, equal to 3 or 4, depending on the particle size, d is the pipe
diameter in metres, s is the solid density and r is the fluid density.
The experiment in this thesis investigates the pressure drop of slurry with sand
concentration 0.04, 0.12 and 0.27 (by volume) in a flexible pipe loop of diameter
0.0508m. According to the equations above, take the maximum FL value of 1.2, the
velocity required to transport the slurry should be above 1.87 m/s. In this experiment,
velocity of 2.3 m/s is used based on the pump power provided.
4.3 CFD Simulation of the Experimental Pipe Loop
4.3.1 Geometry
To conduct this study, four three-dimensional pipes with alignment angles of 0o, 30
o, 60
o
and 80o
are created using Ansys-Geometry. Pipes are of diameter 0.0508m. The entire
pipe length simulated is 6.095m. The geometries are then imported to Fluent to simulate
pressure drop. Table 4-1 lists the mesh details of all the four pipes. Hexahedral mesh is
mainly used, due to its capabilities in providing high-quality solution. The bend in the
unit is refined by using the function Face Sizing. The geometries with different
configurations are shown in Figure 4-8. Each unit includes two swivel joint units and
three horizontal pipe sections.

69
(a) Alignment angle 0o (b) Alignment angle 30
o
(c) Alignment angle 60o (d) Alignment angle 80
o
Figure 4-8 Pipe geometries with different alignment angles
Table 4-1 Mesh details of all four pipes with different configurations
Number of nodes Number of hexahedral elements
Pipe (0o) 413,285 390,524
Pipe (30o) 406,868 382,800
Pipe (60o) 414,794 389,400
Pipe (80o) 442,535 417,120
4.3.2 Boundary Conditions
The calculation domain is bounded by three faces including the inlet boundary, the wall
boundary, and the outlet boundary. At the inlet, velocities and concentrations of liquid

70
and solid phases are specified. Velocities of the solid and liquid phases are specified as
the same. Velocity of magnitude of 2.3 m/s is used. Sand concentration of 0.04, 0.12 and
0.27 (by volume) are investigated. Detailed input parameters are shown in Table 4-2.
Table 4-2 Boundary conditions of the model
Type Parameter Values
Phase data Sand density 2650 kg/m3
Water density 1000 kg/m3
Sand volume fraction 0.04, 0.12 or 0.27
Water viscosity 0.001003 Pa.s
Sand diameter 0.48 mm
Velocity 2.3 m/s
The inlet is specified as velocity-inlet; the outlet pressure is specified as atmospheric
pressure. At the wall, the liquid and particles velocities are set to zero as no-slip condition.
The solution strategy and convergence are the same as the model developed for
horizontal pipe in Chapter 3.
4.4 Results and Analysis
4.4.1 Velocity and Concentration Profile
Since the velocity and concentration profiles in the swivel joint unit present mostly
similar pattern for all the experiments, the concentration and velocity profiles of the
slurry with sand concentration (Cv = 0.12) and alignment angle 0o are illustrated. The
velocity profiles in the two swivel joints are shown in Figure 4-9 and Figure 4-10,
respectively.

71
Figure 4-9 Velocity profile in the first swivel joint unit (Cv =0.12, alignment angle 0o)
Figure 4-10 Velocity profile in the second swivel joint unit (Cv =0.12, alignment angle 0o)
These two figures depict that a lower velocity magnitude exists close to the outer radius
and a higher velocity near the inner radius. At the inner radius, recirculation of fluid is
suspected, contributing a good percentage of the pressure drop in the bend. On the
straight run of the elbow downstream, a reversed picture emerges with the higher

72
velocities at the outer radius and the lower ones close to the inner radius due to larger
centrifugal forces on the outside radius.
As indicated in Figure 4-11 and Figure 4-12, it can be observed that for these high
concentration slurries, fluid turbulence is not fully effective in suspending the solid
particles and sand gradually deposits along the pipe from the inlet to outlet. Maximum
sand volume fraction of up to 0.194 (when Cv = 0.12) is found at the outer edge of the
bend from horizontal to vertical upward direction and at the inner edge of the bend from
horizontal to vertical downward direction.
(a) (b)
Figure 4-11 Sand deposition in the (a) transparent experimental pipe; (b) corresponding
pipe section in CFD simulation
Figure 4-12 Sand concentration profiles in the two swivel joint units (Cv =0.12,
alignment angle 0o)

73
4.4.2 Pressure Drop Profile
Pressure drops at loop inlet, swivel joint unit and outlet are measured experimentally.
Experimental data are compared to the results modelled by running the commercial CFD
package Fluent. Predicted and experimental pressure drops of sand slurry with different
sand volume fractions under alignment angle 0o are shown in Figure 4-13, Figure 4-14
and Figure 4-15.
Bend and swivel joints have a significant impact on the pressure drop. As shown in these
figures, the pressure steadily decreases along the flow, the gap in the graph indicate the
pressure decreases rapidly in comparison with the horizontal pipeline as the flow
approaches the pipe bend. Due to the influence of gravity, the first gap is much higher
than the second gap in the graph.
Figure 4-13 Pressure drop of sand slurry (Cv = 0.04, alignment angle 0o)
0
2
4
6
8
10
12
0 1 2 3 4 5 6
Pre
ssu
re (
KP
a)
Horizontal distance from inlet (m)
Slurry pressure drop (Cv = 0.04, alignment angle 0o)
Predicted data
Experimental data

74
Figure 4-14 Pressure drop of sand slurry (Cv = 0.12, alignment angle 0o)
Figure 4-15 Pressure drop of sand slurry (Cv = 0.27, alignment angle 0o)
0
2
4
6
8
10
12
14
0 1 2 3 4 5 6
Pre
ssu
re (
KP
a)
Horizontal distance from inlet (m)
Slurry pressure drop (Cv = 0.12, alignment angle 0o)
Predicted data
Experimental data
0
2
4
6
8
10
12
14
16
0 1 2 3 4 5 6
Pre
ssu
re (
KP
a)
Horizontal distance from inlet (m)
Slurry pressure drop (Cv = 0.27, alignment angle 0o)
Predicted data
Experimental data

75
The centrifugal force acting on the fluid produces a radial pressure gradient when flow
through the bend. A double spiral flow field is created by the fluid at the center of the
pipe moving towards the outer edge and coming back along the wall towards the inner
edge because of the radial pressure gradient. The change in the direction of flow results in
flow separation and causes pressure losses by both friction and momentum exchanges.
The overall pressure drop gap is equal to the sum of pressure drop resulted from friction
in a straight pipe of equivalent length depending mainly on the Reynolds number and
friction losses resulted from change of direction depending mainly on the curvature ratio
and the bend angle.
Predicted and experimental pressure drop data of at face slurry loop unit under different
alignment angles is shown in Table 4-3. Detailed comparisons are shown in Figure 4-16
and Figure 4-17. Pressure drop in the Table is obtained by dividing the pressure drop
from inlet to outlet by the entire length of the flow path (straight pipe section) of the
simulated at face slurry loop.
Figure 4-16 Predicted pressure drop of at face slurry loop unit under different alignment
angles
1000
1500
2000
2500
3000
0 20 40 60 80
Pre
ssu
re d
rop
(P
a/m
)
Alignment angle
Predicted pressure drop of At face slurry loop
Cv = 0.04
Cv = 0.12
Cv = 0.27

76
Figure 4-17 Experimental pressure drop of at face slurry loop unit under different
alignment angles
Table 4-3 Predicted and experimental pressure drop data of at face slurry loop unit
Cv (alignment angle) Pressure Drop (Pa/m)
__ Experimental Predicted (Error)
0.04 (0o) 1699 Pa/m 1588 Pa/m (-6.5%)
0.04 (30o) 1715 Pa/m 1618 Pa/m (-5.7%)
0.04 (60o) 1726 Pa/m 1625 Pa/m (-5.9%)
0.04 (80o) 1710 Pa/m 1616 Pa/m (-5.5%)
0.12 (0o) 2021 Pa/m 1896Pa/m (-6.2%)
0.12 (30o) 2060 Pa/m 1937 Pa/m (-6.0%)
0.12 (60o) 2016 Pa/m 1918 Pa/m (-4.9%)
0.12 (80o) 2088 Pa/m 1930 Pa/m (-7.6%)
0.27 (0o) 2312 Pa/m 2079 Pa/m (-10.1%)
1000
1500
2000
2500
3000
0 20 40 60 80
Pre
ssu
re d
rop
(P
a/m
)
Alignment angle
Experimental pressure drop of At face slurry loop
Cv = 0.04
Cv = 0.12
Cv = 0.27

77
0.27 (30o) 2347 Pa/m 2134 Pa/m (-9.1%)
0.27 (60o) 2345 Pa/m 2159 Pa/m (-8.0%)
0.27 (80o) 2320 Pa/m 2135 Pa/m (-8.0%)
The At Face Slurry System consists of a flexible arrangement of pipelines that are
capable to fold and extend to display any alignment angle. Results in Figure 4-16 and
Figure 4-17 indicate that the impact of alignment angle is not very influential. Pressure
drop is more related with the change of direction in the bend. The results indicate that the
Eulerian Multiphase model is reasonably effective in predicting the pressure drop of the
at face slurry loop (with a percentage error in the range ± 10%) at all the efflux
concentrations and configurations considered in this experiment. The Eulerian Multiphase
model underestimates the pressure drop compared to experimental data. The deviation
may result from the input parameter of solid particle size. The Eulerian model requires
the input of median particle size and doesn’t consider the effect of size distribution on
pressure drop. As mentioned previously, the presence of large particles, or lumps, is
expected to produce slurry pressure drop measurements that are greater than those
predicted by the model. A model to predict friction losses for slurries containing large
particles should be developed.
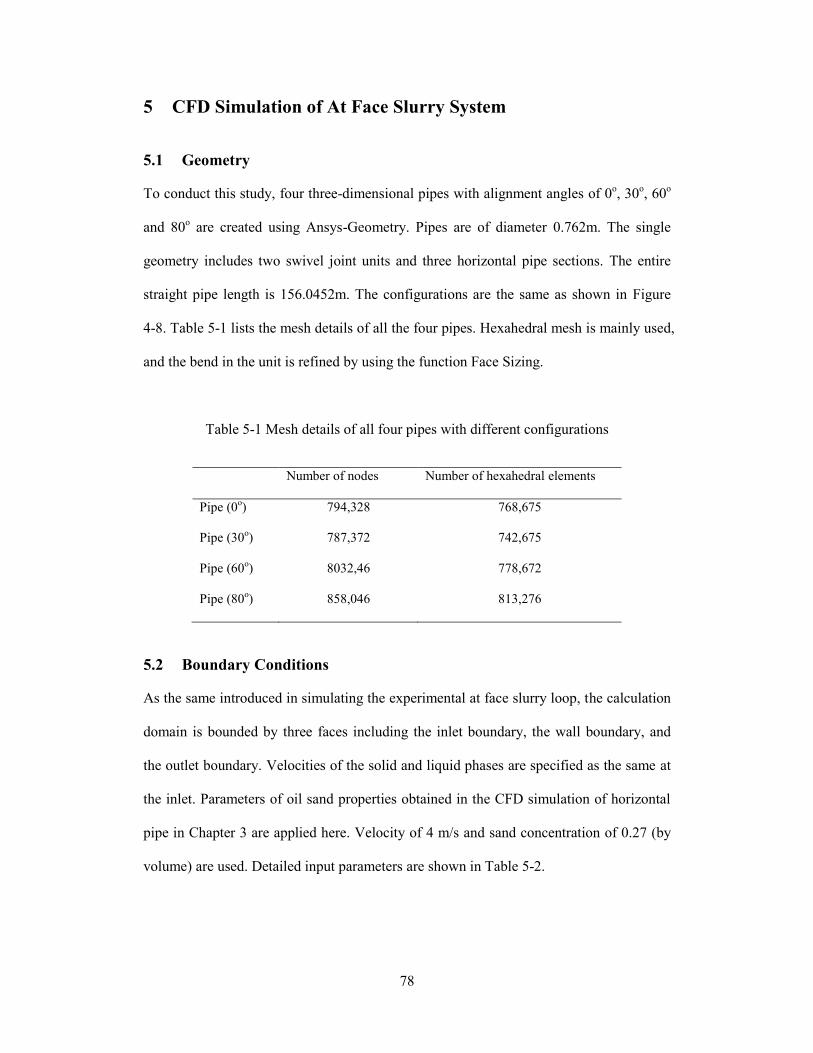
78
5 CFD Simulation of At Face Slurry System
5.1 Geometry
To conduct this study, four three-dimensional pipes with alignment angles of 0o, 30
o, 60
o
and 80o are created using Ansys-Geometry. Pipes are of diameter 0.762m. The single
geometry includes two swivel joint units and three horizontal pipe sections. The entire
straight pipe length is 156.0452m. The configurations are the same as shown in Figure
4-8. Table 5-1 lists the mesh details of all the four pipes. Hexahedral mesh is mainly used,
and the bend in the unit is refined by using the function Face Sizing.
Table 5-1 Mesh details of all four pipes with different configurations
Number of nodes Number of hexahedral elements
Pipe (0o) 794,328 768,675
Pipe (30o) 787,372 742,675
Pipe (60o) 8032,46 778,672
Pipe (80o) 858,046 813,276
5.2 Boundary Conditions
As the same introduced in simulating the experimental at face slurry loop, the calculation
domain is bounded by three faces including the inlet boundary, the wall boundary, and
the outlet boundary. Velocities of the solid and liquid phases are specified as the same at
the inlet. Parameters of oil sand properties obtained in the CFD simulation of horizontal
pipe in Chapter 3 are applied here. Velocity of 4 m/s and sand concentration of 0.27 (by
volume) are used. Detailed input parameters are shown in Table 5-2.

79
Table 5-2 Input parameters of the model
Type Parameter Values
Phase data Sand density 2650 kg/m3
Liquid-phase density 992 kg/m3
Sand volume fraction 0.27
Liquid-phase viscosity 0.007 Pa.s
Sand diameter 0.18 mm
Velocity 4.0 m/s
The solution strategy and convergence are the same as the model developed for
horizontal pipe in Chapter 3.
5.3 Results
5.3.1 Velocity and Concentration profile
Velocity and concentration profiles under the alignment angle 0o are shown in Figure 5-1,
Figure 5-2 and Figure 5-3.
Figure 5-1 Sand concentration profiles in the two swivel joint units (Cv =0.27, alignment
angle 0o)

80
Figure 5-2 Velocity profile in the first swivel joint unit (Cv =0.27, alignment angle 0o)
Figure 5-3 Velocity profile in the second swivel joint unit (Cv =0.27, alignment angle 0o)
They indicate the similar patterns as shown in the experimental at face slurry loop
mentioned in Chapter 4. The maximum velocity and minimum velocity are found at the
inner edge and outer edge of the bend in the swivel joint unit respectively. The maximum
sand volume fraction is 0.3045 found at the entrance of each swivel joint unit.

81
5.3.2 Pressure Drop
The pressure drop data is shown in Table 5-3. Pressure drops for oil sand slurry flow with
solid volume fraction of 0.27 at mean flow velocity of 4.0 m/s under different alignment
angles of 0o, 30
o, 60
o and 80
o are simulated. Each AFSS unit includes two straight folding
pipelines and two swivel joint units, as shown in Figure 1-2.
Table 5-3 Predicted pressure drop in one typical unit of the at face slurry system
Cv (alignment angle) Predicted Pressure Drop (Pa)
0.27 (0o) 23377
0.27 (30o) 23595
0.27 (60o) 23329
0.27 (80o) 23215
The whole AFSS consists of five typical units. The folding pipelines have a retracted
length of approximately 80m and extended length of 500m (length of each straight
folding pipeline is 50m). The swivel joint unit consists of two elbows and a vertical pipe
section of 3.0226 m.
Since the pipe cross-sectional area is constant, there is no kinetic energy difference over
the pipe section The Mechanical Energy Balance between the upstream plane1 and
downstream plane 2 is interpreted as the same as equation (3-45):
(𝑃2 − 𝑃1) + 𝜌𝑔(ℎ2 − ℎ1) + 𝜌𝑔𝑗𝐿 = 0 (5-1)
Where P is the mixture static pressure, 𝜌 is the density, j is the friction loss per pipe
length and L is pipe section length. This equation indicates that the frictional pressure loss

82
(𝜌g j L) is obtained by subtracting the gravitational effect 𝜌g (h2 – h1) from the total
pressure drop (P1 – P2).
The pipe length L in the equation represents the straight pipe length only and does not
include the flow distance through the elbows. It is technically wrong and a waste of time
trying to measure all the flow path lengths, the error is normally well within the tolerance
of the results (Crane, 1991). For a typical at face slurry system unit, the whole straight
pipe length equals to 106.0452m (two folding pipelines of length 100m and two vertical
pipe sections in swivel joint units of length 6.0452m). So the pressure gradient can be
obtained as shown in Table 5-4.
Table 5-4 Predicted pressure gradient in one typical unit of the at face slurry system
Cv (alignment angle) Predicted Pressure Gradient (Pa/m)
0.27 (0o) 220
0.27 (30o) 222
0.27 (60o) 220
0.27 (80o) 219
As described in Chapter 3, the pressure gradient of oil sand slurry flow in horizontal pipe
with the same solid volume fraction of 0.27 and velocity of 4 m/s is 158 Pa/m. Compared
to the stationary pipeline, more powerful pump are required for the feasibility of the at
face slurry system. The at face slurry design will allow the pipes to make zigzag
movements and follow the shovels as needed at mining face. Results in Table 5-4 indicate
that alignment angle displayed has no obvious impact on the pressure drop.

83
6 Conclusion
6.1 Conclusion
The At Face Slurry System introduces a unique set of hydraulic transport problems. This
thesis focuses to develop the mathematic models governing the friction loss associated
with the AFSS. The oil sand slurry flow is simulated using the academic CFD package
Fluent. Results are compared to field pressure drop data from oil sand industry for the
stationary pipeline system. A flexible arrangement of pipe loop imitating the AFSS is set
up in the laboratory. Experimental and modelling results are obtained and compared to
test the accuracy of CFD modelling to predict pressure drop in flexible pipeline system.
Based on these work, oil sand flow in the flexible pipeline of AFSS is simulated to
validate its technical viability. Summarily, some conclusions through this study can be
reached as follows:
1. The granular Eulerian Multiphase model has accurately predicted the pressure
drop of oil sand slurry flow in horizontal pipeline. The predicted pressure drop is
in good agreement (within a percentage deviation of ±3%) with the experimental
measurements for the wide range of slurry flow conditions (specific gravities
between 1.37 and 1.57). For a typical slurry (specific gravity 1.44, Cv = 0.27, d =
0.18 mm and V = 4 m/s) in the pipe of diameter 0.762m, the experimental and
simulated pressure drop are 158 Pa/m and 155 Pa/m, respectively.
.
2. Results from the experimental at face slurry loop indicate that a lower velocity
magnitude exists close to the outer radius and a higher velocity near the inner
radius at the elbows of the swivel joint unit. For high concentration slurries, fluid
turbulence is not fully effective in suspending the solid particles and sand

84
gradually deposits along the pipe from the inlet to outlet. Pressure decreases
rapidly in comparison with the horizontal pipe as the flow approaches the elbow
in the swivel joint unit. Eulerian multiphase model is reasonably effective in
predicting the pressure drop of the at face slurry loop (with a percentage error in
the range ±10%) at all the efflux concentrations and configurations considered in
this experiment. The model underestimates the pressure drop compared to
experimental data. Presence of large particles, or lumps, is expected to produce
slurry pressure drop measurements that are greater than those predicted by the
model.
3. The simulated pressure drop for a typical oil sand slurry (specific gravity 1.44,
Cv = 0.27, d = 0.18 mm and V = 4 m/s) in a single unit of the AFSS of diameter
0.762m is 220 Pa/m. This alternative haulage system requires more powerful
pump to satisfy its capability to create slurrified minerals from the mining faces
to be transported to the processing plant.
4. The at face slurry design allow the pipes to make zigzag movements and follow
the shovels as needed at mining face. Results indicate that alignment angle
displayed has no obvious impact on the pressure drop.
6.2 Recommendations
To make the AFSS a viable technology to meet the challenges in oil sands mining
operations in a sustainable environment, the research in the AFSS will be demanded in
the following areas:

85
1. The cause of difference between the experimental and predicted friction losses in
the at face slurry loop should be investigated. A model to predict friction losses
for slurries containing large particles should be developed.
2. Scale effect between the experimental pipe loop set up in the lab and large
industrial pipe utilized in the At Face Slurry System remains further investigation.
3. Oil sand is a three-phase system that it contains water, sand and bitumen. The
thesis only conducted experimentation of sand slurry flow in the at face slurry
loop. Oil sand three-phase flow in the experimental at face slurry pipe loop
should be conducted in the future.

86
7 Bibliography
Aekula, S. F. (2009). CFD predictions and experimental comparisons of pressure drop
effects of turning vanes in 90 degree duct elbows. Journal of Energy Engineering,
vol. 135, no. 4, pp. 119-126.
Akilli, H. L. (2001). Gas-solid flow behavior in a horizontal pipe after a 90° vertical-to-
horizontal elbow. Powder Technol., 116 (1), 43–52.
Alves, G. E. (1954). Co-current liquid-gas flow in a pipe-line contactor. Chemical
Engineering Progress, vol. 50, no. 9, pp.449–456.
ANSYS Inc., CFX 5.6 User Manual. (2003).
Babcock and Wilcox Company. (1978). Steam: Its Generation and Use.
Chisholm, D. (1983). Two-Phase Flow in Pipelines and Heat Exchangers. Godwin.
Crane, C. (1991). Flow of Fluids Through Valves, Fittings and Pipe. Tech Paper 410,
1991.
Coffield, R. D. (1997). Irrecoverable pressure loss coefficients for two elbows in series
with various orientation angles and separation distances. ASME, Fluids Eng. Div.
(Publ.) FED, 5, Fluid Measurements and Instrumentation, 7p.
Dean, W. (1928). Fluid motion in a curved channel. Proc. R. Soc.(Lond.) A., (pp. 121,
402–420).
Deobold, T. L. (1962). An experimental investigation of two-phase pressure losses in
pipe elbows. Tech. Rep.HW-SA, 2564, MSc. University of Idaho, Chemical
Engineering.
Deshmukh, S. F. (2006). Three-Dimensional CFD Predications and Experimental
Comparison of Pressure Drop of Some Common Pipe Fittings in Turbulent Flow.
J. Energy Eng., 132:61-66.
Doron, P., & Barnea, D. (1993). A Three-Layer Model for Solid-Liquid Flow in
Horizontal Pipes. Int. J. Multiphase Flow, 19, 1029–1043.
Doron, P., Granica, D., & Barnea, D. (1987). Slurry Flow in Horizontal Pipes-
Experimental and Modeling. Int. J. Multiphase Flow, 13, 535–547.
Durand, R. (1953). Basic Relationships of the Transportation of Solids in pipes:
Experimental Research. Proceedings of the 5th Congress, International
Association of Hydraulic Research. Minneapolis, Minnesota.
Durand, R. (1953). Basic Solids in Pipes—Experimental Research. Proceedings
International Hydraulics Conference, (pp. 89-103). Minneapolis, MN.

87
Ellison, T. K. (1997). Computational fluid dynamics CFD model for phase separation at
branching tee junctions. Proc., SPE Annual Western Regional Meeting, A New
Dawn in the Old West, (pp. 211-225).
Fitzsimmons, P. E. (1964). Two phase pressure drop in pipe components. Tech. Rep.HW-
80970 Rev 1, General Electric Research.
FLUENT Inc., Fluent User Guide. 6.3 (February 2003). Chapter 10 Modelling
Turbulence; Chapter 18 Introduction to Modeling Multiphase Flow; Chapter 20
General Multiphase Models.
Friedel, A. A. (2005). Two-phase upward flow 90◦ bend pressure loss model. Forschung
im Ingenieurwesen, vol. 69, no. 2, pp. 120–130.
Frimpong, S. (2003). Oil sands slurry and waste recycling mechanics in. Resources,
Conservation and Recycling 39, 33-50.
Frimpong, S. A. (2004). Oil sands slurry flow in flexible pipe. ASME J. Fluids Eng, 126,
133–138.
Frimpong, S., Ayodele, O. R., Awuah-Offei, K., & Brown, a. O. (2010). Numerical
Simulation Software for Oil Sand Slurry Flow in Flexible Pipelines. J. Energy
Eng, 136:50-57.
Gambill, W. (1959). How to estimate mixtures viscosities. Chemical Engineering, vol 66,
pp 151-152.
Gidaspow, D. B. (1992). Hydrodynamics of Circulating Fluidized Beds, Kinetic Theory
Approach. In Fluidization VII. Proceedings of the 7th Engineering Foundation
Conference on Fluidization, (pp. 75-82).
Gillies, R. a. (2000). Modelling High Concentration Slurry Flows. Can. J. Chem. Eng, 78,
709-716.
Gillies, R. G., Shook, C. A., & Xu, J. (2004). Modelling Heterogeneous Slurry Flows at
High Velocities. Can. J. Chem. Eng, 82, 1060–1065.
Govier, G. a. (1972). The Flow of Complex Mixture in Pipes . Van Nostrand Reinhold.
New York.
H.Mazumder, Q. (2012). CFD Analysis of the Effect of Elbow Radius on Pressure Drop
in Multiphase Flow. Modelling and Simulation in Engineering.
Hatziavramidis, D. S. (1997). Gas-liquid flow through horizontal tees of branching and
impacting type. AIChE J., 43 (7), 1675–1683.
Idelchik, I. E. (1986). Handbook of Hydraulic Resistance. Hemisphere Publishing Corp.,
Washington.

88
Ito, M. (1959). Friction factors for turbulent fow in curved pipes. Trans. ASME, J. Basic
Engng, 81D, 123–134.
Cole J. S. (2004). Friction factors in two phase horizontal pipe flow. International
Communications in Heat and Mass Transfer, vol. 31, no. 7, pp. 909–917.
Sekoda, K. (1969). Horizontal two-phase air-water flow characteristics in the disturbed
region due to a 90-degree bend . Japan Society Mechanical Engineering, vol, 35,
no. 289, pp. 2227–2333.
Kalekudithi Ekambara, R. S. (2009). Hydrodynamic Simulation of Horizontal Slurry
Pipeline Flow Using ANSYS-CFX. Ind. Eng. Chem. Res, 48, 8159–8171.
Kaushal, D. R., & Tomita, Y. (2003). Comparative Study of Pressure Drop in Multisized
Particulate Slurry Flow through Pipe and Rectangular Duct. Int. J. Multiphase
Flow, 29, 1473–1487.
Kongkiatwanitch, S. W. (2001). Interfacial friction factor in vertical upward gas-liquid
annular two-phase flow. International Communications in Heat and Mass
Transfer, Vol 28, no. 3, pp. 323–336.
Kundu, P. a. (2002). Fluid Mechanics, second edition. Academic Press,.
Kutateladze, S. S. (1969). Problems of Heat Transfer and Hydraulics of Two-Phase
Media. Pergamon Press, Oxford, UK.
Lun, G. (2004). Incorporating Matlab and fluent in an introductory computational fluid
dynamics course. Computers in Education J., 14 (1), 82–91.
Launder BE, S. B. (1974). The numerical computation of turbulent flows.
Lun, C. K. (1984). Kinetic Theories for Granular Flow: Inelastic Particles in Couette
Flow and Slightly Inelastic Particles in a General Flow Field . J. Fluid Mech , vol.
140, p.223-256.
Maples., R. (2000). Petroleum Refinery Process Economics. PennWell, ISBN 978-0-
87814-779-3.
Martin, J. M. (1955). Turbulent two-phase flow. Petroleum Refiner, vol. 34, no. 10, pp.
151–155.
Martinelli, R. W. (1949). Proposed correlation of data for isothermal two-phase two-
component flow in pipes. Chemical Engineering Progress, vol. 45, no. 1, pp. 39–
48.
McDonell, B. (2002). Slurry systems: Design and equipment selection with examples
from Syncrude’s operation. Proc., MIN E 420 Seminar.

89
McKee, W. (1988). An overview of the Syncrude Oilsands Mine. The 9th Annual
General Meeting of CIM. Edmonton, Alberta.
Mochinaga, H. (2006). Properties of Oil sands and Bitumen in Athabasca. CSPG-CSEG-
CWLS Convention.
Mori, Y., & Nakayama, W. (1967). Study of forced convective heat transfer in curved
pipes 2nd Report: turbulent region. Int. J. Heat Mass Transfer, 10, 37–59.
Crawford, N.M. (2003). Prediction of pressure drop for turbulent fluid flow in 90 degree
bend. J. Process Mechanical Engineering.
Noda, K. T. (1972). Studies on three-phase flow in an inclined pipe: determination of
entrance region of pipe measurements of pressure loss. Proceedings of the 2nd
International Conference on Hydraulic Transport of Solids in Pipes, (pp. 49-61).
Warwick, UK.
Oroskar, A. R., & Turian, R. M. (1980). The Critical Velocity in Pipeline Flow of
Slurries. AIChE J, 26, 551–558.
Osman, S. M. (1964). The mechanics of soil cutting blades. Journal of Agriculture
Engineering Research, 313-328.
Spedding P.L. (2006). Prediction of pressure drop in multiphase horizontal pipe flow.
International Communications in Heat and Mass Transfer, vol. 33, no.1053–
1062.
Peniguel, C. S. M. (2003). Presentation of a numerical 3D approach to tackle thermal
striping in a PWR nuclear T-junction. ASME J. Pressure Vessel Technol.,, 469,
125-132.
Peshkin, M. A. (1961). About the hydraulic resistance of pipe bends to the flow of gas-
liquid mixtures. Teploenergetika, vol. 8, no.6, pp. 79–80.
Sanders, R. (2004 , August). Performance of Sand Slurry Pipelines in the Oil. The
Canadian Journal of Chemical Engineering, 850-857.
Randall G. Gillies, C. A. (2004). Modelling Heterogeneous Slurry Flows at High
Velocities. The Canadian Journal of Chemical Engineering, 82, 1060-1065.
Riffat, S. B. (1997). CFD prediction of k-factors of duct elbows. Int. J. Energy Res., 21
(7), 675–681.
Roco, M. C., & Shook, C. A. (1983). Modeling of Slurry Flow: The Effect of Particle
Size. Can. J. Chem. Eng., 61, 494–503.
Rowe, M. (1970). Measurement and computation of flow in pipe bends. J. Fluid Mech,
43, 771-783.

90
Benbella, S. (2009). Gas-liquid pressure drop in vertical internally wavy 90 degree bend.
Experimental Thermal and Fluid Science, vol. 33, no. 2, pp.340-347.
Sanchez, S. F. (2010). Pressure drop models evaluation for two-phase flow in 90 degree
horizontal elbows. Ingenieria Mecanica Techilogia Y Desarrollo, vol. 3, no. 4, pp.
115–122.
Sanders, R. A. (2000). Bitumen Effects on Pipeline Hydraulics During Oil Sand
Hydrotransport. Can. J. Chem. Eng, 78, 731–742.
Schaeffer, D. G. (1987). Instability in the Evolution Equations Describing Incompressible
Granular Flow. J. Di . Eq. vol. 66, p.19-50.
Shook, C. A., & Daniel, S. M. (1968). Flow of Suspensions of Solids in Pipelines, Part 2:
Two Mechanisms of Particle Suspension. Can. J. Chem.Eng., 46, 238-244.
Shook, C. A., & Daniel, S. M. (1969). A Variable Density Model of the Pipeline Flow of
Suspensions. Can. J. Chem. Eng, 47,196.
Shook, C. R. (2002). Pipeline Hydrotransport with Applications in the Oil Sand Industry.
Saskatchewan Research Council, Saskatoon, Canada.
Song, X. W. (2004). Computational fluid dynamics study of the fourth generation
prototype of a continuous flow ventricular assist device . ASME J. Biomech. Eng.,
126 (2), 180–187.
Puttagunta, V. R. (June 1993). Correlation of Bitumen Viscosity with Temperature and
Pressure. The Canadian Journal Of Chemical Engineering, Vol, 71.
Wallis, G. B. (1969). One Dimensional Two-Phase Flow, McGraw-Hill.
Wang, J. A. (2001). A CFD-based correlation for mass transfer coefficient in elbows. Int.
J. Heat Mass Transfer, 44 (9),1817–1822. .
Wasp, E. J. (1970). Deposition Velocities, Transition Velocities and Spatial Distribution
of Solids in Slurry Pipelines. Proceedings of the 1st International Conference on
the Hydraulic Transport of Solids in Pipes (Hydrotransport 1),BHRA: Fluid
Engineering, (pp. 53-76). Cranfield, U.K.
Wilson, K. (1976). A Unified Physically Based Analysis of Solid-Liquid pipeline Flows.
Proc. 4th Int. Conf. On Hydraulic Transport of SolidsH.S.Stephens, Ed., BHRA
Fluid Engineering, Cranfi eld, UK, (pp. Paper A1, pp. 1–16).
Wilson, K. A. (September, 2000). Near-Wall Fluid Lift of Particles in Slurry Pipelines.
Proc. 10th Int. Conf. on Transport and Sedimentation of Solid Particles, (pp.
435–444). Wroclaw,Poland.

91
Wilson, K. C. (1976). A Unified Physical-based Analysis of Solid-Liquid Pipeline Flow.
Proceedings of the 4th International Conference of Hydraulic Transport of Solids
in pipes (Hydrotransport 4), BHRA Fluid Engineering , (pp. 1-16). Cranfield,
U.K.
Wilson, K. C., & Pugh, F. J. (1988). Dispersive-Force Modeling of Turbulent Suspension
in Heterogeneous Slurry Flow. Can. J. Chem. Eng, 66, 721-727.
Related Documents