Water Resources Management 12: 251–269, 1998. © 1998 Kluwer Academic Publishers. Printed in the Netherlands. 251 Hydrodynamic Modeling of Wetlands for Flood Detention VASSILIOS A. TSIHRINTZIS 1,? , DAVID L. JOHN 2 and PAUL J. TREMBLAY 2 1 Department of Environmental Engineering, Democritus University of Thrace, Xanthi 67100, Greece, e-mail: [email protected] 2 Miller, Legg and Associates, Inc., Pembroke Pines, FL 33024, U.S.A. (Received: 7 February 1997; in final form: 28 May 1998) Abstract. The application of a link-node model in modeling hydrodynamics of wetland areas related to flood detention design is presented through the description of modeling and design efforts of an actual project, the first privately-owned wetland mitigation bank in Florida. The 142-ha project is located in the Chapel Trail Preserve of the City of Pembroke Pines, South Florida, where a degraded site is transformed into a healthy, self-sustaining wetland ecosystem. Creation of the wetlands, located adjacent to an existing development, required careful evaluation of drainage conditions. To properly design the wetland site, a hydrodynamic model was developed which allowed sizing of hydraulic structures and computation of maximum water surface elevations. The paper presents model description and calibration using field data, parameter sensitivity, general application in the project and use as a design tool. The model was found to be a valuable tool that can be applied in similar projects. Key words: detention basin, drainage, flood control, hydrodynamic modeling, wetland mitigation, wetland restoration. 1. Introduction Wetlands serve multiple functions, including flood attenuation, pollutant uptaking, recharge of the groundwater table, habitats for flora and fauna, and general en- hancement of the landscape. In addition, they provide recreational and educational opportunities. However, in the past, their value was not recognized; wetland de- struction was not only permitted, but encouraged by governments to allow drainage for urban and agricultural development (Bueno et al., 1994; Mitsch and Gosselink, 1986). The importance of wetlands is now becoming increasingly understood. In the U.S.A., federal, state, and local resource protection laws and ordinances pro- hibit further destruction and alteration, and all levels of government focus on how best to enhance and manage existing systems. The trend is to restore historic wet- lands (Tsihrintzis et al., 1995a, b, 1996), and construct new ones to mitigate the impact of development on existing wetlands. However, the feasibility of mitigation is a controversial issue (Coats et al., 1989; Miller and Hopen, 1993). ? Author for all correspondence.

Welcome message from author
This document is posted to help you gain knowledge. Please leave a comment to let me know what you think about it! Share it to your friends and learn new things together.
Transcript

Water Resources Management12: 251–269, 1998.© 1998Kluwer Academic Publishers. Printed in the Netherlands.
251
Hydrodynamic Modeling of Wetlandsfor Flood Detention
VASSILIOS A. TSIHRINTZIS1,?, DAVID L. JOHN2 and PAUL J. TREMBLAY2
1 Department of Environmental Engineering, Democritus University of Thrace, Xanthi 67100,Greece, e-mail: [email protected] Miller, Legg and Associates, Inc., Pembroke Pines, FL 33024, U.S.A.
(Received: 7 February 1997; in final form: 28 May 1998)
Abstract. The application of a link-node model in modeling hydrodynamics of wetland areas relatedto flood detention design is presented through the description of modeling and design efforts of anactual project, the first privately-owned wetland mitigation bank in Florida. The 142-ha project islocated in the Chapel Trail Preserve of the City of Pembroke Pines, South Florida, where a degradedsite is transformed into a healthy, self-sustaining wetland ecosystem. Creation of the wetlands,located adjacent to an existing development, required careful evaluation of drainage conditions.To properly design the wetland site, a hydrodynamic model was developed which allowed sizingof hydraulic structures and computation of maximum water surface elevations. The paper presentsmodel description and calibration using field data, parameter sensitivity, general application in theproject and use as a design tool. The model was found to be a valuable tool that can be applied insimilar projects.
Key words: detention basin, drainage, flood control, hydrodynamic modeling, wetland mitigation,wetland restoration.
1. Introduction
Wetlands serve multiple functions, including flood attenuation, pollutant uptaking,recharge of the groundwater table, habitats for flora and fauna, and general en-hancement of the landscape. In addition, they provide recreational and educationalopportunities. However, in the past, their value was not recognized; wetland de-struction was not only permitted, but encouraged by governments to allow drainagefor urban and agricultural development (Buenoet al., 1994; Mitsch and Gosselink,1986). The importance of wetlands is now becoming increasingly understood. Inthe U.S.A., federal, state, and local resource protection laws and ordinances pro-hibit further destruction and alteration, and all levels of government focus on howbest to enhance and manage existing systems. The trend is to restore historic wet-lands (Tsihrintziset al., 1995a, b, 1996), and construct new ones to mitigate theimpact of development on existing wetlands. However, the feasibility of mitigationis a controversial issue (Coatset al., 1989; Miller and Hopen, 1993).
? Author for all correspondence.

252 VASSILIOS A. TSIHRINTZIS ET AL.
Hydrology, including quantity, distribution and flow patterns, and quality ofwater, is possibly the most important factor affecting wetland design. Accuratehydrologic, hydraulic and water quality computations significantly reduce designfailures. Particularly necessary are accurate hydraulic computations in cases wherewetlands are located adjacent to existing developments, to reduce flooding risks.When wetlands are used for flood detention, traditional single detention pond cal-culation methods (e.g., the Puls method) may not be applicable because mostwetlands, both natural and manmade, are divided into various cells, usually com-municating by culverts under berms or roadways, weirs, pumps or other hydraulicstructures. Advanced hydrodynamic mathematical models need then to be utilizedto compute water surface elevations in each cell. Water surface elevations may varyfrom cell to cell depending on the capacity of the connecting hydraulic structures.In the case of constructed wetlands, such models can also be used as planning anddesign tools in sizing hydraulic structures and calculating water surface elevations(Tsihrintziset al., 1995b).
Hydrodynamic mathematical models for wetland areas emerged from thoseused in inland surface water bodies and estuaries. They can be widely classifiedinto one-dimensional, link-node (pseudo two-dimensional), two-dimensional andthree-dimensional. Their characteristics and differences have been discussed byTsihrintziset al. (1995b). Link node models were found advantageous in wetlandengineering studies, their main advantages being ease in input data preparation andapplication and sufficient accuracy for engineering planning and design.
The use of SWMM-EXTRAN link-node model (Roesneret al., 1989) is pre-sented herein in modeling hydrodynamics of wetlands for flood detention. Objec-tives of the study included: (1) testing the applicability of this model in wetlandhydrodynamics; (2) presenting a methodology for calibrating this model with mea-sured flow and stage data; and (3) applying the calibrated model, using it withsynthetic storms in wetland design for flood control. An attempt was made tocompare the predictions of this model with those of the Puls method for reservoirrouting. The entire process is presented here through the description of a case studyin South Florida.
2. Case Study: Florida Wetlandsbank
2.1. PROJECT OVERVIEW
As a result of many failures of wetland mitigation projects, a new approach towetland preservation has been recently endorsed by the U.S. federal government(August 23, 1993). It involves the creation of ‘private wetland mitigation banks,’which are areas of restored, enhanced and/or created wetlands that are undertakendeliberately to provide off-site compensation for wetland losses caused by per-mitted projects (Miller and Hopen, 1993). Following the federal endorsement, theFlorida Department of Environmental Protection, the Florida water managementdistricts, and various local environmental agencies have amended their regulations

HYDRODYNAMIC MODELING OF WETLANDS FOR FLOOD DETENTION 253
Figure 1. Project location map.
to allow mitigation banks, viewing them as an effective way to eliminate wetlandimpacts without hindering development.
The first privately owned wetland mitigation bank in Florida (and the secondin the U.S.A.) has received various required permits (Tsihrintziset al., 1995) andis under construction by Florida Wetlandsbank (a corporation) on a 142-ha areaowned by the City of Pembroke Pines (City) in Broward County, Florida (Figure 1).The area is located in the C-11 canal basin, south of Sheridan Street, approximately1.6 km east of the Florida Water Conservation Areas. To the south, it is adjacent toa large residential development known as Chapel Trail (Figures 1 and 2). The pre-project area (referred herein as the ‘Pre-project Preserve’) was donated to the Cityin 1986 as mitigation credit for this development without any obligations by thedeveloper for wetland restoration. This area is currently being transformed from adegraded, sterile, non-functioning site, infested with a monoculture of exotic plantspecies, (i.e., melaleuca), into a balanced, healthy, self-sustaining ecosystem withdiverse habitats, representative of those normally found in the Florida Everglades.Plant species include cypress stands, emergent marshes, forested wetlands, saw-grass prairies, wading bird feeding areas, and tree island habitats. Parts of the areawill be open to the public for recreational activities (e.g., canoeing trails, naturewalks, fishing docks, and picnic areas) and educational opportunities (e.g., inter-pretive tours). The Florida Wetlandsbank corporation is obliged to maintain the

254 VASSILIOS A. TSIHRINTZIS ET AL.
Figure 2. Drainage system in the vicinity of the project: pre-project and project hydraulicstructures.
newly planted native wetland plants for a period of five years. After the wetlandcredits have been sold and the restoration and monitoring have been completed,the corporation will return responsibility of the site to the City as a preserve (Millerand Hopen, 1993).
2.2. DESCRIPTION OF THE PRE-PROJECT SITE
Creation of the Wetlands Bank, located adjacent to and downstream of the existingChapel Trail development, required careful evaluation of drainage conditions. Thewetland restoration project could not jeopardize drainage in the Chapel Trail devel-opment (Figure 2). Therefore, the restoration could not increase maximum watersurface elevations permitted by regulatory agencies in the upstream development.This development is approximately 526 ha in surface area, and contains a series

HYDRODYNAMIC MODELING OF WETLANDS FOR FLOOD DETENTION 255
of lakes (Figure 2) interconnected with culverts, which were designed to collectthe 100 yr/3 d storm runoff and deliver it through an open cut (short canal), ap-proximately 45 m long (Figure 2), to the downstream Pre-project Preserve whichis being restored to the Wetlands Bank.
Before the project, a nearly rectangular open channel, approximately 15 m wideand 2.4 km long, used to run through the Preserve conveying drainage from ChapelTrail development, the Preserve itself, and small adjacent areas (Figure 2 and 3a).Drainage was delivered through the canal to a structure containing 3 weirs, whichare gated and can be closed (Figures 2 and 3b). Two of the weirs are 1.22 m longand the third 0.76 m long. Crest elevations of the three weirs were surveyed at 0.30,0.31 and –0.07 m NGVD. The three weirs form the upstream side and dischargeinto a reinforced concrete box with dimensions 4.88 m wide and 0.91 m long(Figure 3b). The downstream side of the box connects to two 1524 mm corrugatedmetal pipes (CMP), as shown in Figure 2. The soffits of these two culverts weresurveyed at 0.96 and 0.93 m NGVD. The lengths of these two culverts were readfrom construction plans at 70 m. They cross Sheridan Street (north boundary ofthe project, Figures 1 and 2) and empty into the South Broward Drainage District(SBDD) Canal No. 13, which is 15 m wide, nearly rectangular in cross section.This canal connects to the South Florida Water Management District (SFWMD)C-11 canal (Figure 2). Water surface control elevation in this canal is set throughpumping operation rules at approximately 1.07 m NGVD.
2.3. DESCRIPTION OF THE PROJECT
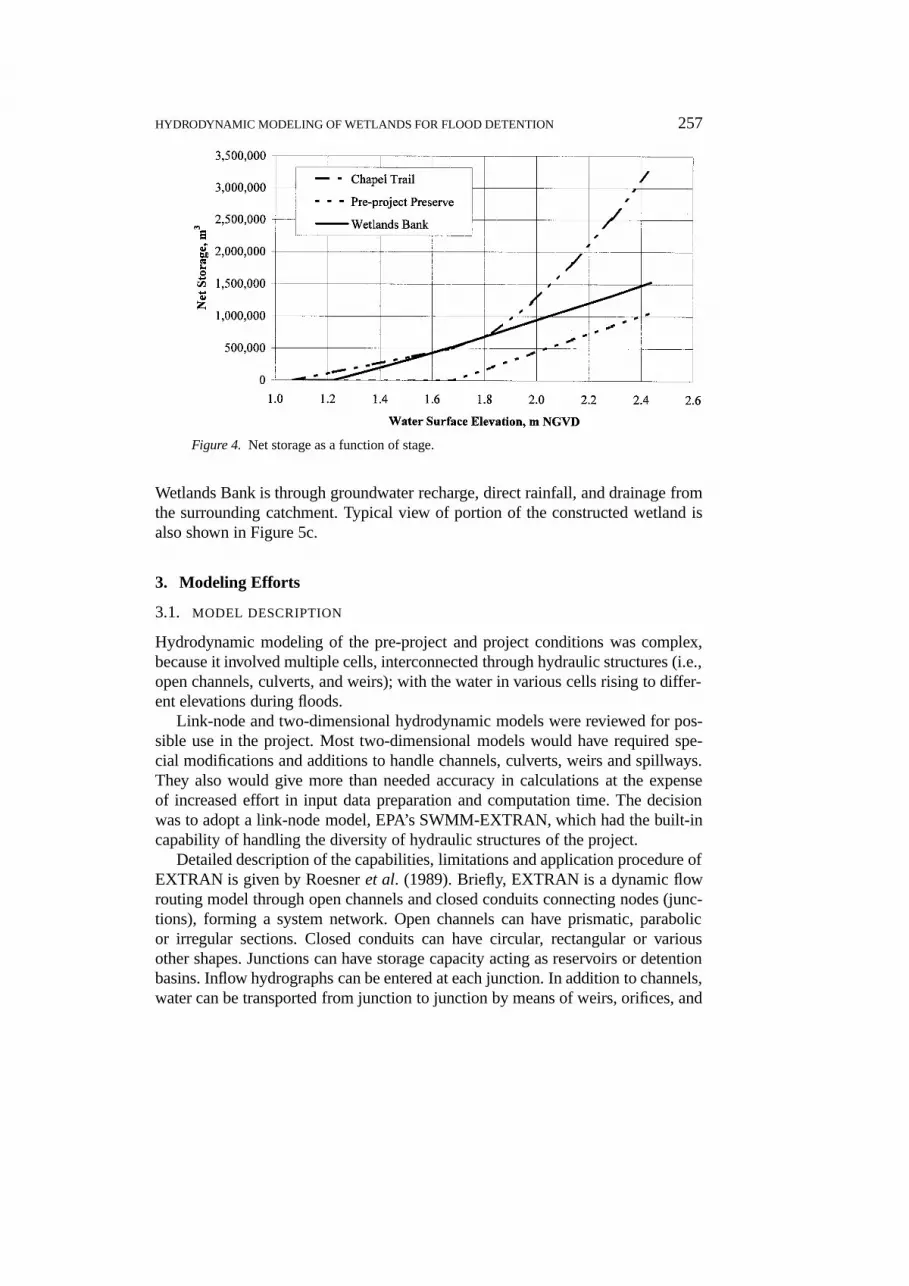
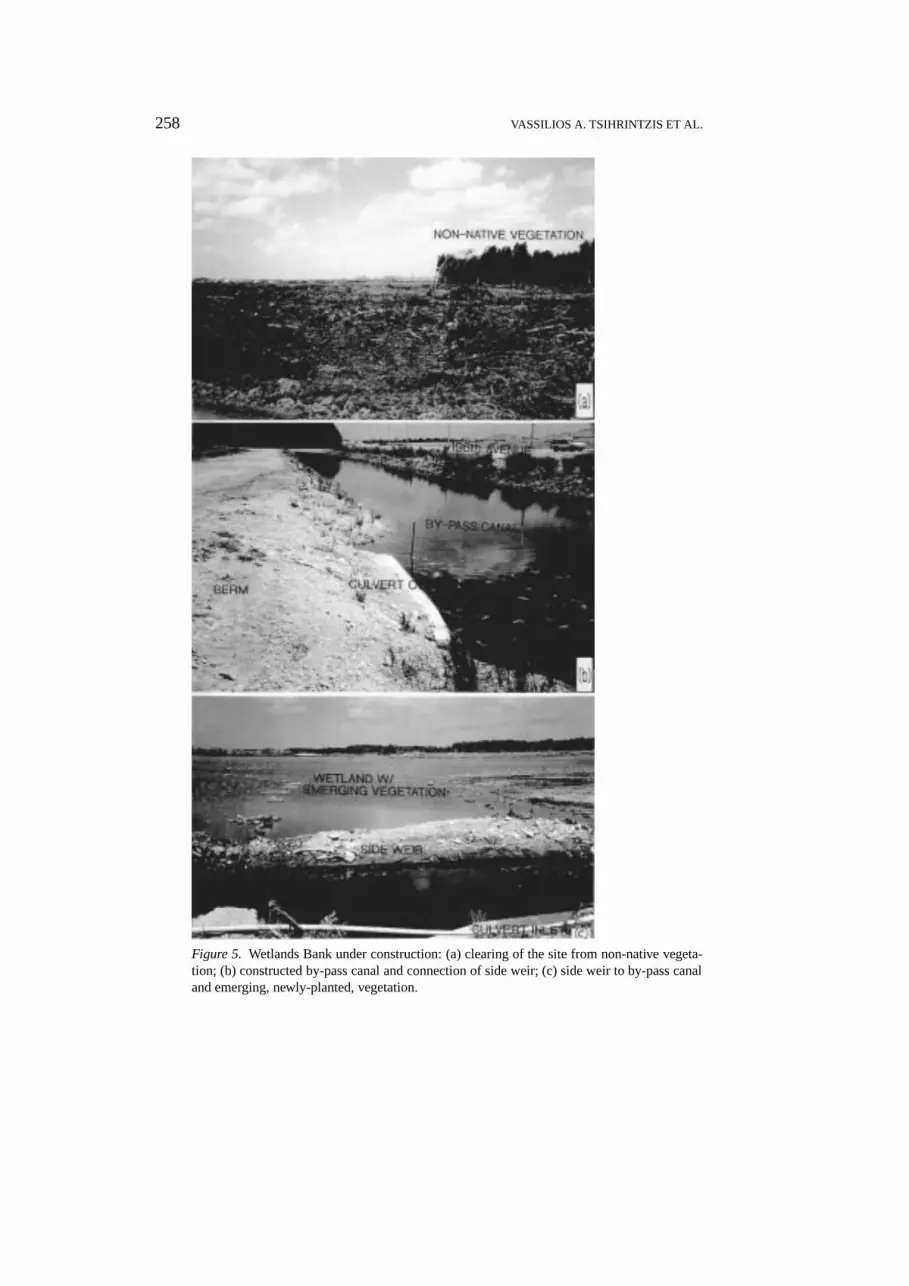
After construction, most of the Wetlands Bank area was graded to elevations ap-proximately 0.3 m lower than pre-project conditions, significantly increasing itsstorage volume (Figure 4). Figure 5a shows the site clearing process that occursbefore grading. One can see the dead non-native trees (foreground) and other onesstill standing as the process continues (background-right). Most of the 15 m wideopen channel currently crossing the Pre-project Preserve is backfilled, and the con-nection to Chapel Trail development (45 m long open cut) is eliminated. A bermis constructed around the wetland to isolate it from the surrounding sites. A by-pass canal (Figure 2) is constructed along the east periphery of the Wetlands Bankconnecting to the lakes of Chapel Trail. This canal merges into a short remainingportion of the pre-project 15 m wide canal in the Wetlands Bank, upstream of theexisting weir structure (Figures 2 and 5b). A diversion weir set at an elevationof 1.68 m NGVD, is constructed further upstream at about mid-distance in thisdiversion canal (Figures 2 and 5c), spilling excess water from this canal to theWetlands Bank when water surface elevations in the canal and the Wetlands Bankpermit this to happen by gravity. A small notch in this weir, 15 cm wide, is set atcrest elevation 1.22 m NGVD. The water surface in the Wetlands Bank is that wayraised to a minimum of 1.22 m NGVD. The weir is located upstream of a box cul-vert which crosses the Wetlands Bank berm (Figures 5b and 5c). Water inflow to the

256 VASSILIOS A. TSIHRINTZIS ET AL.
Figure 3. Pre-project Preserve: (a) existing canal upstream of weir and box structure; (b) weirand box structure at the end of the existing canal.
HYDRODYNAMIC MODELING OF WETLANDS FOR FLOOD DETENTION 257
Figure 4. Net storage as a function of stage.
Wetlands Bank is through groundwater recharge, direct rainfall, and drainage fromthe surrounding catchment. Typical view of portion of the constructed wetland isalso shown in Figure 5c.
3. Modeling Efforts
3.1. MODEL DESCRIPTION
Hydrodynamic modeling of the pre-project and project conditions was complex,because it involved multiple cells, interconnected through hydraulic structures (i.e.,open channels, culverts, and weirs); with the water in various cells rising to differ-ent elevations during floods.
Link-node and two-dimensional hydrodynamic models were reviewed for pos-sible use in the project. Most two-dimensional models would have required spe-cial modifications and additions to handle channels, culverts, weirs and spillways.They also would give more than needed accuracy in calculations at the expenseof increased effort in input data preparation and computation time. The decisionwas to adopt a link-node model, EPA’s SWMM-EXTRAN, which had the built-incapability of handling the diversity of hydraulic structures of the project.
Detailed description of the capabilities, limitations and application procedure ofEXTRAN is given by Roesneret al. (1989). Briefly, EXTRAN is a dynamic flowrouting model through open channels and closed conduits connecting nodes (junc-tions), forming a system network. Open channels can have prismatic, parabolicor irregular sections. Closed conduits can have circular, rectangular or variousother shapes. Junctions can have storage capacity acting as reservoirs or detentionbasins. Inflow hydrographs can be entered at each junction. In addition to channels,water can be transported from junction to junction by means of weirs, orifices, and
258 VASSILIOS A. TSIHRINTZIS ET AL.
Figure 5. Wetlands Bank under construction: (a) clearing of the site from non-native vegeta-tion; (b) constructed by-pass canal and connection of side weir; (c) side weir to by-pass canaland emerging, newly-planted, vegetation.

HYDRODYNAMIC MODELING OF WETLANDS FOR FLOOD DETENTION 259
pumps. Flow in a conduit can be in either direction, according to the water surfaceelevation at the connecting junctions. A boundary condition at the system outletcan be specified as a constant or a time-varying control depth. Initial conditionsfor conduit flows and junction depths also can be specified in the model. Junctionlosses, sudden expansion or contraction losses, and generally minor losses can notbe simulated by EXTRAN. However, these losses can be represented by increasingthe roughness factors applied to the open and closed conduits (Tsihrintziset al.,1995b).
The theory behind EXTRAN is based on the one-dimensional, unsteady flowequations for open channels (i.e., St. Venant equations). Momentum and continuityare combined into one equation that is solved along each conduit during each timestep (Roesneret al., 1989):
∂Q
∂t+ gASf − 2v
∂A
∂t− v2∂A
∂x+ gA∂H
∂x= 0 , (1)
whereQ is the discharge through the conduit,v is the velocity,A is the flow area,H is the hydraulic head andSf is the friction slope, which is computed usingManning’s equation:
Sf = n2
k2AR4/3Q|v|, (2)
wherek is 1.00 for metric and 1.49 for English units,n is the Manning’s roughnesscoefficient andR is the hydraulic radius. The continuity equation at each node reads
∂(HAs)
∂t=∑
Q, (3)
whereAs is the surface area of the node, and the summation includes all inflowsand outflows from conduits connecting to the node and direct external inflows,e.g., rainfall. The equations are expressed in the model in finite difference form.The continuity equation is checked at each node and an iterative procedure adjustsheads and flows through each conduit after each time step to satisfy continuity ateach junction. The concept of ‘equivalent pipes’ (computational substitution of anactual element of the drainage system by an imaginary conduit which is hydrauli-cally similar to the element it replaces) is used in EXTRAN to resolve problems
260 VASSILIOS A. TSIHRINTZIS ET AL.
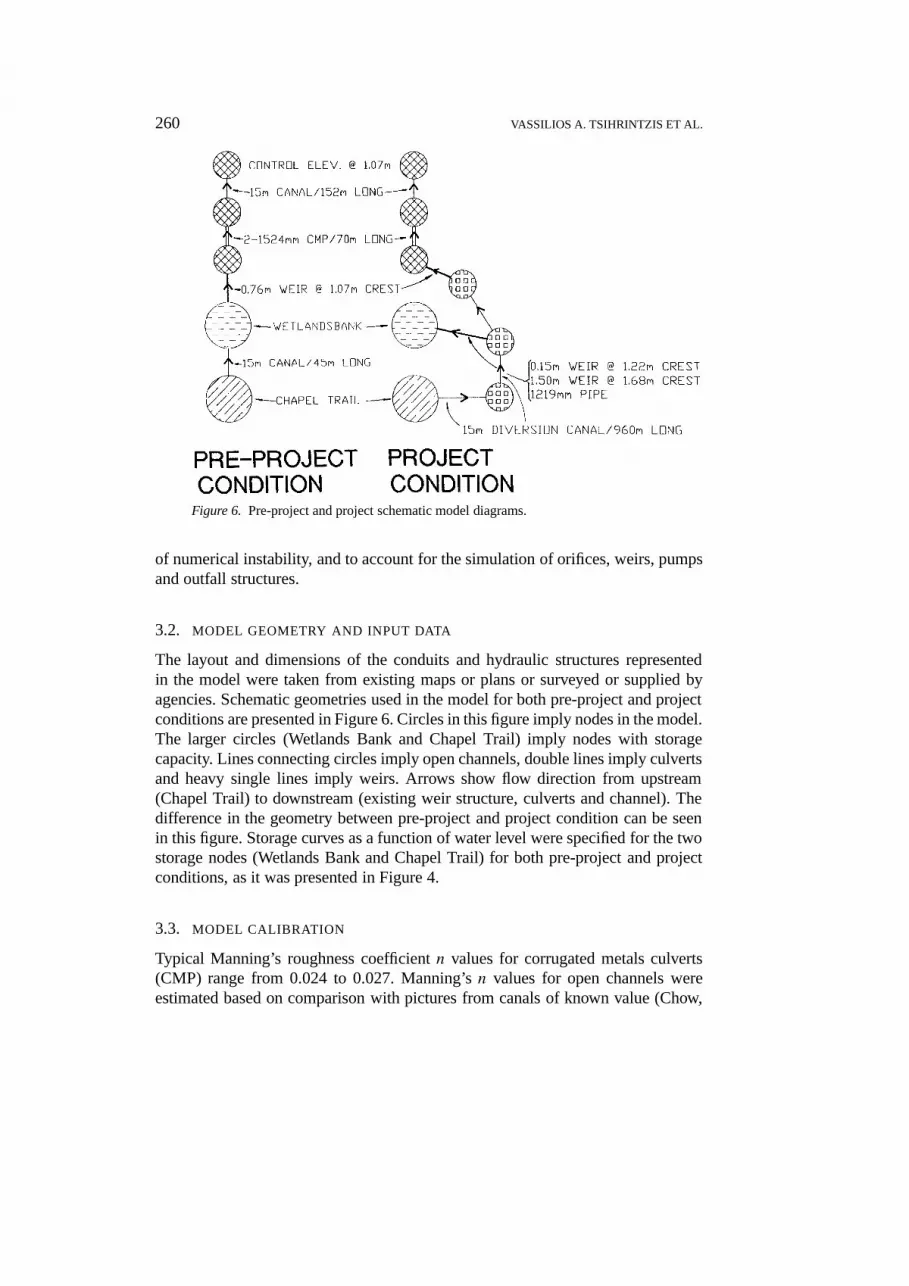
Figure 6. Pre-project and project schematic model diagrams.
of numerical instability, and to account for the simulation of orifices, weirs, pumpsand outfall structures.
3.2. MODEL GEOMETRY AND INPUT DATA
The layout and dimensions of the conduits and hydraulic structures representedin the model were taken from existing maps or plans or surveyed or supplied byagencies. Schematic geometries used in the model for both pre-project and projectconditions are presented in Figure 6. Circles in this figure imply nodes in the model.The larger circles (Wetlands Bank and Chapel Trail) imply nodes with storagecapacity. Lines connecting circles imply open channels, double lines imply culvertsand heavy single lines imply weirs. Arrows show flow direction from upstream(Chapel Trail) to downstream (existing weir structure, culverts and channel). Thedifference in the geometry between pre-project and project condition can be seenin this figure. Storage curves as a function of water level were specified for the twostorage nodes (Wetlands Bank and Chapel Trail) for both pre-project and projectconditions, as it was presented in Figure 4.
3.3. MODEL CALIBRATION
Typical Manning’s roughness coefficientn values for corrugated metals culverts(CMP) range from 0.024 to 0.027. Manning’sn values for open channels wereestimated based on comparison with pictures from canals of known value (Chow,
HYDRODYNAMIC MODELING OF WETLANDS FOR FLOOD DETENTION 261
1959) and based on previous modeling studies in South Florida; values of 0.030to 0.035 are typical. Minor head losses (e.g., entrance, exit, and others) are notaccounted for by EXTRAN. The way to account for minor losses is by artificiallyincreasing the value of Manning’sn in the model to values above those given inthe literature. A procedure to do this is described by Tsihrintziset al. (1995b).
Another way to estimate the proper value ofn is when field measurements areavailable, and is described here. Manning’snwas used as a calibration parameter tomatch model predicted water surface elevations to measured ones in the field underpre-project conditions. Field flow and water surface elevation measurements weretaken once every 3 to 5 days during January 1 to July 16, 1993 at the Pre-projectPreserve. Flow was estimated utilizing the downstream weir and culvert structurerating curve based on the stage upstream of the structure. During the entire year allthree existing weirs were operational. The measured hydrograph in 1993 (Figure 7a– measured hydrograph) is a result of both groundwater recharge into the lakes andcanals, and direct rainfall.
Stage measurements were taken in the canal within the Pre-project Preserve(Wetlands Bank area) and in the lake of Chapel Trail that is located upstream ofthe 45 m open cut, and are presented in Figures 7b and c (measured water sur-face elevation). In addition, groundwater level was measured at a monitoring welllocated on the west side of the Pre-project Preserve. Water level in this well wasalways higher (by approximately 0.15 to 0.30 m) than both the stage in the canaland in the lake of Chapel Trail, indicating discharge of groundwater into the canaland the lake. The stage in Chapel Trail was, for most measurements, approximatelythe same or slightly higher (less than 0.15 m) than that in the Pre-project Preserve.
Calibration of the model was done by adjusting the value of Manning’sn forboth the culverts and the pre-project canal. Figure 8a indicates the effect on thecomputed maximum water surface elevation and the outflow hydrograph of in-creasing (and also decreasing) the value of Manning’sn by a certain percentageabove (or below) the values 0.027 for culverts and 0.035 for canals. One can see,that as Manning’sn increases, so do the maximum observed water surface eleva-tions in both the Pre-Project Preserve and Chapel Trail. As expected, at the sametime predicted flow peaks reduce due to flow attenuation. The value of Manning’sn was adjusted until the best match was obtained between predicted and measuredwater surface elevations. Best match was determined when the summation of thesquare deviations between observed and predicted values was minimum. This isshown in Figure 8b, where the summation of the square deviations between mea-sured and predicted water surface elevations and outflow hydrograph are presentedas a function of the percent deviation of Manning’sn from the previously men-tioned values (i.e., 0.027 and 0.035). Manning’sn values were selected in this casewhen the sum square deviations was minimum which approximately correspondedto a 15% increase. Therefore, selected Manning’sn values from the calibrationwere 0.031 and 0.040 for culverts and canals, respectively, which incorporate minorlosses.

262 VASSILIOS A. TSIHRINTZIS ET AL.
Figure 7. Comparison between predicted and measured flow hydrographs through existingweirs/culverts, and predicted and measured water surface elevations from calibration run.

HYDRODYNAMIC MODELING OF WETLANDS FOR FLOOD DETENTION 263
Figure 8. Effect of change of Manning’s roughnessn on computed maximum water sur-face elevation and outflow hydrograph, and on the summation of square deviations betweenmeasured and predicted water surface elevations or flow rates.
264 VASSILIOS A. TSIHRINTZIS ET AL.
Results of the calibration are presented in Figures 7. The geometry of Figure 6(pre-project) was used in the model with the above mentioned calibrated Man-ning’s n values. Figure 7a shows comparison between computed and measuredflow hydrographs through the existing downstream weir structure and culverts.The comparison is quite good in both the time and the magnitude of the peaks.Figures 7b and c show comparison between observed and computed water surfaceelevations in the Pre-project Preserve and Chapel Trail, respectively, which is alsoquite good.
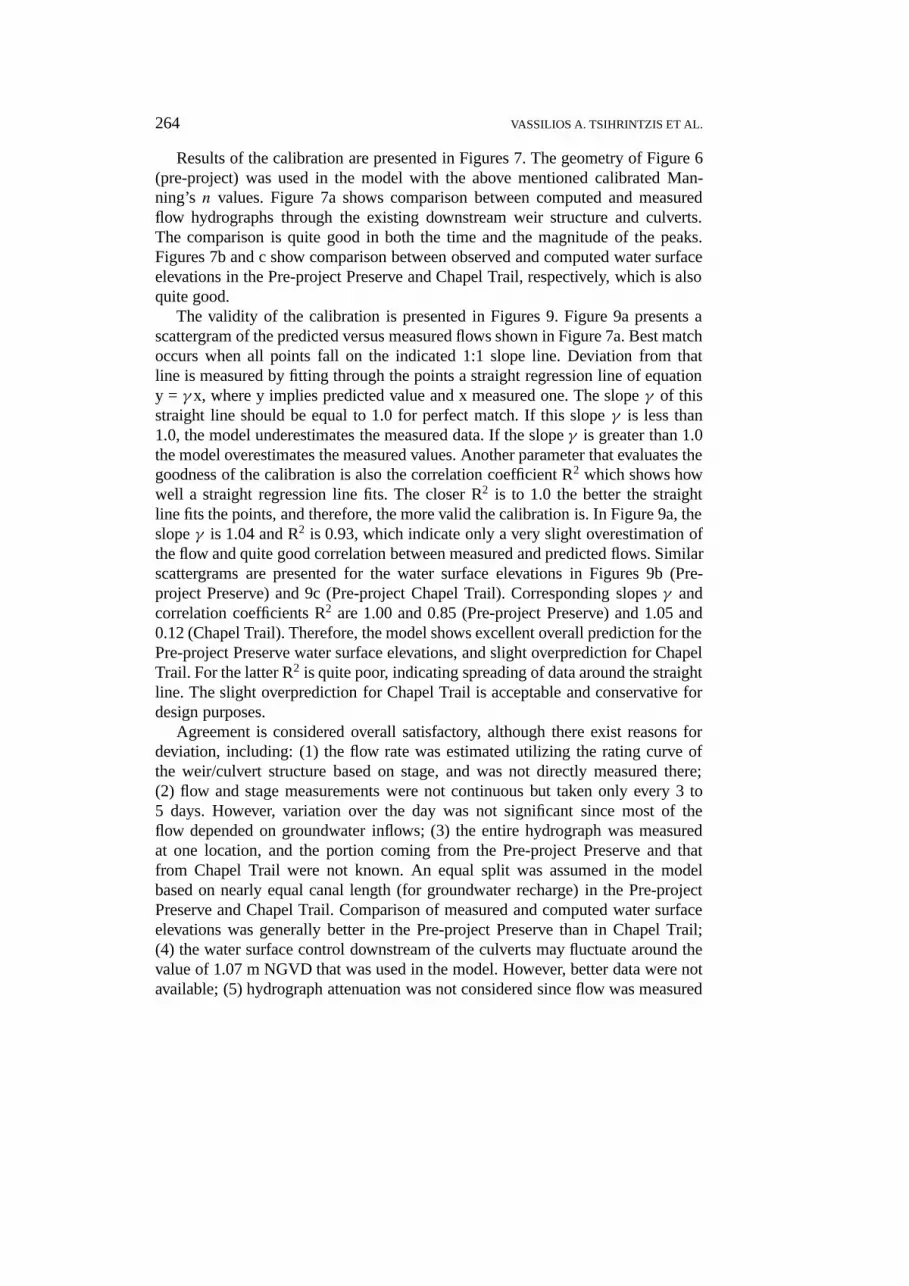
The validity of the calibration is presented in Figures 9. Figure 9a presents ascattergram of the predicted versus measured flows shown in Figure 7a. Best matchoccurs when all points fall on the indicated 1:1 slope line. Deviation from thatline is measured by fitting through the points a straight regression line of equationy = γ x, where y implies predicted value and x measured one. The slopeγ of thisstraight line should be equal to 1.0 for perfect match. If this slopeγ is less than1.0, the model underestimates the measured data. If the slopeγ is greater than 1.0the model overestimates the measured values. Another parameter that evaluates thegoodness of the calibration is also the correlation coefficient R2 which shows howwell a straight regression line fits. The closer R2 is to 1.0 the better the straightline fits the points, and therefore, the more valid the calibration is. In Figure 9a, theslopeγ is 1.04 and R2 is 0.93, which indicate only a very slight overestimation ofthe flow and quite good correlation between measured and predicted flows. Similarscattergrams are presented for the water surface elevations in Figures 9b (Pre-project Preserve) and 9c (Pre-project Chapel Trail). Corresponding slopesγ andcorrelation coefficients R2 are 1.00 and 0.85 (Pre-project Preserve) and 1.05 and0.12 (Chapel Trail). Therefore, the model shows excellent overall prediction for thePre-project Preserve water surface elevations, and slight overprediction for ChapelTrail. For the latter R2 is quite poor, indicating spreading of data around the straightline. The slight overprediction for Chapel Trail is acceptable and conservative fordesign purposes.
Agreement is considered overall satisfactory, although there exist reasons fordeviation, including: (1) the flow rate was estimated utilizing the rating curve ofthe weir/culvert structure based on stage, and was not directly measured there;(2) flow and stage measurements were not continuous but taken only every 3 to5 days. However, variation over the day was not significant since most of theflow depended on groundwater inflows; (3) the entire hydrograph was measuredat one location, and the portion coming from the Pre-project Preserve and thatfrom Chapel Trail were not known. An equal split was assumed in the modelbased on nearly equal canal length (for groundwater recharge) in the Pre-projectPreserve and Chapel Trail. Comparison of measured and computed water surfaceelevations was generally better in the Pre-project Preserve than in Chapel Trail;(4) the water surface control downstream of the culverts may fluctuate around thevalue of 1.07 m NGVD that was used in the model. However, better data were notavailable; (5) hydrograph attenuation was not considered since flow was measured

HYDRODYNAMIC MODELING OF WETLANDS FOR FLOOD DETENTION 265
Figure 9. Scattergrams of flow hydrograph and water surface elevation from calibration run.

266 VASSILIOS A. TSIHRINTZIS ET AL.
Figure 10. 100 yr frequency storm inflow hydrographs.
at the downstream end of the site. However, attenuation is not expected to be signif-icant because measured flows were relatively low. The predicted peaks also matchquite well with the measured ones (Figure 7); and (6) evapotranspiration was notconsidered. It may be significant over long time periods, however, in this project itwas more conservative for flood control design to ignore it.
3.4. MODEL RESULTS AND DESIGN CONSIDERATIONS
The SFWMD hydrology method (SCS) was used (SFWMD, 1984) in project de-sign. Synthetic inflow hydrographs for the Wetlands Bank and Chapel Trail wereprepared for the 100, 25, and 10 yr/3 d storms, for the 10 and 5 yr/1 d storms,and for the 3, 2, and 1 yr/1-hour storms based on the SCS method (Tsihrintzis andHamid, 1997; Tsihrintzis and Sidan, 1998). Figure 10 shows the derived synthetic100 yr frequency storm hydrographs in both the Wetlands Bank (peak 66 m3/s) andChapel Trail (peak 280 m3/s).
Figure 11 presents computed water surface elevations for pre-project and projectconditions for the 100 yr/3 d design storm (using the hydrographs of Figure 10) forboth Chapel Trail and the Wetlands Bank as a function of time (Tsihrintziset al.,1995). In these runs, only the 0.76 m wide weir was used based on instructions ofthe permitting agency (conservative approach). Computed water surface elevationsunder pre-project conditions for Chapel Trail and the Pre-project Preserve nearlycoincide (shown as the dash line in the figure). Computed water surface elevationsunder project conditions for both Chapel Trail and the Wetlands Bank are belowor at the pre-project water surface elevations. This is a result of the excess storage(due to excavation) in the Wetlands Bank, compared to the Pre-project Preservecondition. Similar computer runs were prepared for all the other design storms.

HYDRODYNAMIC MODELING OF WETLANDS FOR FLOOD DETENTION 267
Figure 11. Computed 100 yr water surface elevations under pre-project and project condi-tions.
Table I. Computed maximum water surface elevations
EXTRAN model Puls method
Storm Pre-project cond. Project cond. Pre-project cond. Project cond.
frequency C. T. W. B. C. T. W. B. C. T. W. B. C. T. W. B.
(yrs) (m) (m) (m) (m) (m) (m) (m) (m)
100 (3 day) 2.12 2.12 2.13 1.90 2.11 2.02 2.11 1.65
25 (3 day) 2.05 2.05 2.05 1.81 2.03 1.97 2.03 1.58
10 (1 day) 1.84 1.84 1.83 1.49 1.77 1.84 1.77 1.43
5 (1 day) 1.81 1.81 1.78 1.46 1.70 1.83 1.73 1.41
C. T. = Chapel Trail.W. B. = Wetlands Bank.
Table I presents maximum water surface elevations computed by the model forboth pre-project and project conditions for all modeled storms.
Results of the Puls method, applied for the Wetlands Bank and Chapel Trailseparately, are also shown in Table I for comparison. Under pre-project conditions,when the Preserve and Chapel Trail are freely connected through the open cut(Figure 2), the Puls method and the model predict nearly the same water surfaceelevations. However, under project conditions, when water surface elevations inthe two cells are different, the Puls method predicts lower (less conservative forflooding) elevations in the Wetlands Bank.
For the optimum sizing of each hydraulic structure during project design asensitivity analysis was performed. This was done by running the model several

268 VASSILIOS A. TSIHRINTZIS ET AL.
Figure 12. Example of hydraulic structure sizing procedure: side weir crest elevation.
times for various structure sizes. As a sensitivity parameter the computed 100 yrmaximum water surface elevations in the Wetlands Bank and Chapel Trail werechecked. For a particular structure, a very large size was used first and the modelwas run. The size of the structure was subsequently decreased to that size thatstarted affecting (increasing) the maximum predicted water surface elevations. Thisprocedure was followed for all hydraulic structures. As an example, Figure 12shows the results of this analysis for determining the crest elevation of the diversionweir (Figure 2) between Wetlands Bank and the diversion channel. The WetlandsBank provides maximum storage for weir crest elevations of 1.68 m NGVD or less,in which case the maximum water surface elevation in Chapel Trail is lower.
4. Conclusions
The link-node model EXTRAN-SWMM was calibrated using measured flow andwater surface elevation data. The calibration parameter used was the Manning’sroughness coefficientn. Predicted flows and water surface elevations showed goodcomparison with the measured ones. The model was then applied in modelinghydrodynamics for designing the restoration of the Florida Wetlands Bank usingsynthetic storms. Presented model results, i.e., water surface elevations under bothflood and normal flow conditions, were essential in the permitting process of theproject. In addition, the model was used as a design tool to optimally size hydraulicstructures connecting wetland cells. The model can also be used in the future duringproject operation to assist in effectively making decisions on possible hydraulicstructure configuration adjustments, and system/water management.

HYDRODYNAMIC MODELING OF WETLANDS FOR FLOOD DETENTION 269
References
Bueno, J. A., Tsihrintzis, V. A. and Alvarez, L.: 1994, South Florida greenways: a conceptualframework for ecological reconnectivity of the region,Landscape and Urban Planning33,247–266.
Chow, V. T.: 1959,Open-Channel Flow, McGraw-Hill, New York.Coats, R., Swanson, M. and Williams, P.: 1989, Hydrologic analysis for coastal wetland restoration,
Environ. Manage., 13(6), 715–727.Miller, R. H. and Hopen, R. M.: 1993, Wetlands mitigation banking: trend or fad?Florida Eng. Soc.
J. 47(2), October, 15–17.Mitsch, W. J. and Gosselink, J. G.: 1986,Wetlands, Van Nostrand Reinhold, New York.Roesner, L. A., Aldrich, J. A. and Dickinson, R. E.: 1989,Storm Water Management Model User’s
Manual Version 4: EXTRAN Addendum, Environmental Research Laboratory, Office of Researchand Development, U.S. Environmental Protection Agency, Athens, Georgia.
South Florida Water Management District (SFWMD): 1984,Management and Storage of SurfaceWaters, Permit Information Manual, Volume IV, Resource Control Department, West PalmBeach, Florida, January.
Tsihrintzis, V. A. and Hamid, R.: 1997, Urban stormwater quantity/quality modeling using the SCSmethod and empirical equations,J. Am. Water Resour. Assoc., AWRA, 33(1), February, 163–176.
Tsihrintzis, V. A., John, D. and Tremblay, P.: 1995, Modeling wetland hydrodynamics using SWMM-EXTRAN, Proceedings of the First International Conference on Water Resources Engineering,ASCE, San Antonio, Texas, U.S.A., August 14–18, pp. 269–273.
Tsihrintzis, V. A. and Sidan, C. B.: 1998, Modeling urban stormwater runoff processes using theSanta Barbara method,Water Resour. Manage., EWRA,12, 139–166.
Tsihrintzis, V. A., Vasarhelyi, G. M., Lipa, J.: 1995a, Multiobjective approaches in freshwaterwetland restoration and design,Water International, IWRA, 20(2), 98–105.
Tsihrintzis, V. A., Vasarhelyi, G. M. and Lipa, J.: 1995b, Hydrodynamic and constituent transportmodeling of coastal wetlands,J. Marine Environ. Eng.1(4), 295–314.
Tsihrintzis, V. A., Vasarhelyi, G. M. and Lipa, J.: 1996, Ballona Wetland: a multi-objective salt marshrestoration plan,Water, Maritime and Energy, ICE, London, UK,118(2), 131–144.
Related Documents