This article appeared in a journal published by Elsevier. The attached copy is furnished to the author for internal non-commercial research and education use, including for instruction at the authors institution and sharing with colleagues. Other uses, including reproduction and distribution, or selling or licensing copies, or posting to personal, institutional or third party websites are prohibited. In most cases authors are permitted to post their version of the article (e.g. in Word or Tex form) to their personal website or institutional repository. Authors requiring further information regarding Elsevier’s archiving and manuscript policies are encouraged to visit: http://www.elsevier.com/copyright

Welcome message from author
This document is posted to help you gain knowledge. Please leave a comment to let me know what you think about it! Share it to your friends and learn new things together.
Transcript
This article appeared in a journal published by Elsevier. The attachedcopy is furnished to the author for internal non-commercial researchand education use, including for instruction at the authors institution
and sharing with colleagues.
Other uses, including reproduction and distribution, or selling orlicensing copies, or posting to personal, institutional or third party
websites are prohibited.
In most cases authors are permitted to post their version of thearticle (e.g. in Word or Tex form) to their personal website orinstitutional repository. Authors requiring further information
regarding Elsevier’s archiving and manuscript policies areencouraged to visit:
http://www.elsevier.com/copyright
Author's personal copy
Hydrodynamic impact of a tidal barrage in the Severn Estuary, UK
Junqiang Xia a,b,*, Roger A. Falconer a, Binliang Lin a
a Hydro-environmental Research Centre, School of Engineering, Cardiff University, Cardiff CF24 3AA, UKb State Key Laboratory of Water Resources and Hydropower Engineering Science, Wuhan University, Wuhan 430072, China
a r t i c l e i n f o
Article history:Received 13 January 2009Accepted 22 December 2009Available online 29 January 2010
Keywords:Severn EstuaryTidal barrageHydrodynamicsNumerical modelFinite volume methodDomain decomposition
a b s t r a c t
The Severn Estuary has a spring tidal range approaching 14 m, which is among the highest tides in theworld. Various proposals have been made regarding the construction of a tidal barrage across the estuaryto enable tidal energy to be generated. The aim of the current study is to investigate the impact ofconstructing a tidal barrage on the hydrodynamic processes in the Severn Estuary using a numericalmodel. A two-dimensional hydrodynamic model based on an unstructured triangular mesh has beenused in this study. The model employs a TVD finite volume method to solve the 2D shallow waterequations, with the numerical scheme being second-order accurate in both time and space. The modelhas been calibrated by comparing model predictions with observed tidal levels and currents at differentsites, for typical spring and neap tides, and it has also been verified using tidal level time series at fourtide gauging stations measured in 2003. In order to predict the hydrodynamic processes with a barrage,the model domain was divided into two subdomains: one each side of the barrage. Details were given ofthe method used for representing the various hydraulic structures, including the sluices and turbines,along the proposed Cardiff-Weston barrage. The impact of constructing the barrage on the water levelsand velocities was then investigated using this model. Model-predicted hydrodynamic parameters,without and with the barrage, were analysed in detail. Model predictions indicated that with the barragethe mean power output could reach 2.0 GW with up to 25 GWh units of electricity being generated overa typical mean spring tidal cycle. At some cross-sections, the maximum discharges were predicted todecrease by 30–50%, as compared with the corresponding discharges predicted without the barrage. Themodel also predicted that with the barrage, the maximum water levels upstream of the barrage woulddecrease by 0.5–1.5 m, and with the peak tidal currents also being reduced considerably. For differentoperating modes, complex velocity fields were predicted to occur in the vicinity of the barrage.
� 2009 Elsevier Ltd. All rights reserved.
1. Introduction
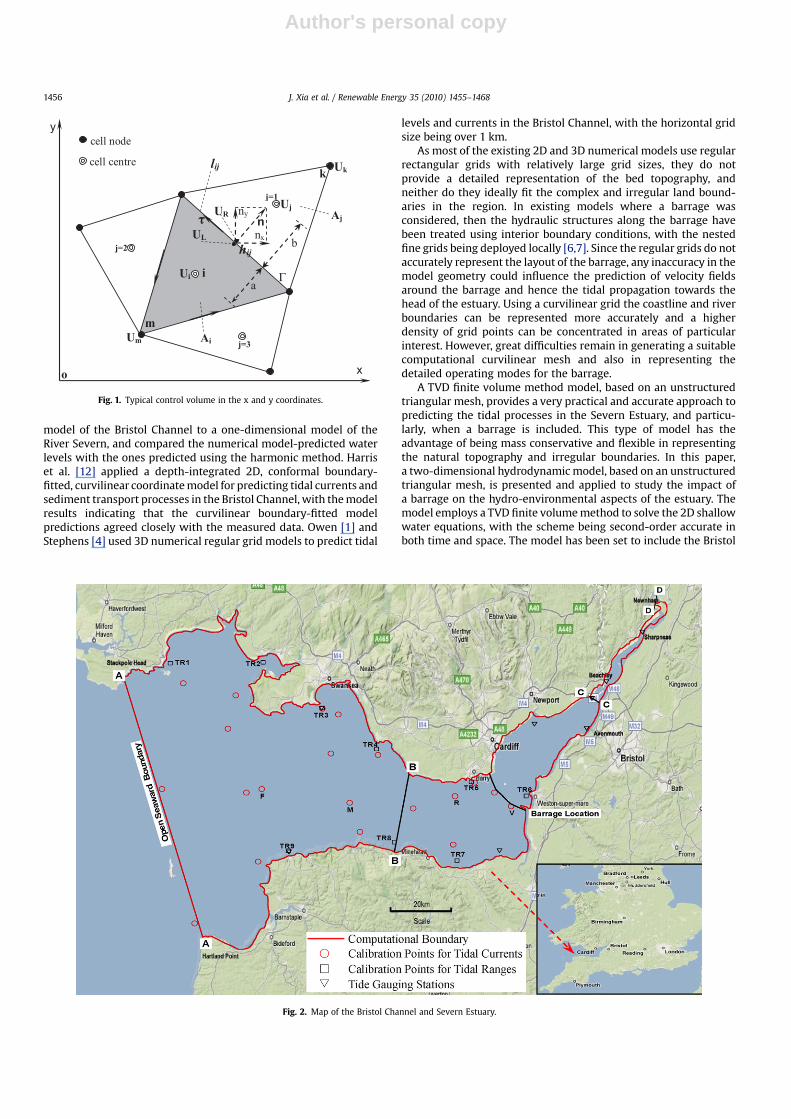
The Bristol Channel and Severn Estuary constitute a large, semi-enclosed body of water in the southwest part of the UK, see Fig. 1.This water body has been the focus of attention of politicians,planners, engineers, environmentalists for many years because ofits vast potential for tidal power generation. The Severn Estuary isnotable for its large tidal range, with the peak value approaching14 m during spring tides at Avonmouth, and with the estuary beinggenerally regarded as having one of the highest tides worldwide.The tidal hydrodynamic processes in the Bristol Channel andSevern Estuary have therefore been studied extensively byresearchers and organisations using numerical models [1–11].
Uncles [2,3] used a depth-averaged 2D hydrodynamic model toinvestigate the M2 tide processes in the Bristol Channel and SevernEstuary, and predicted the distribution of tidal shear stress on theseabed. Uncles and Jordan [8] derived co-phase and co-amplitudelines for the M2 surface elevations and obtained estimates of theassociated tidal energy fluxes through typical cross-sections,according to the observed current data from 1975 to 1977. Evanset al. [7] calibrated a depth-averaged 2D hydrodynamic model forthe Bristol Channel and investigated the effect of constructinga barrage on the water quality parameters in the estuary. In thisstudy four types of nested grids of square cells were used torepresent the topography, in which the finest grid size of 0.167 kmwas used to cover the proposed barrage site. Barber and Scott [10]used a 2D model with a depth-adapted grid to simulate theprocesses of tidal propagation in the Severn Estuary, upstream ofAvonmouth. The use of a curvilinear non-orthogonal coordinatesystem provided an accurate representation of the complex estuarygeometry. Amin and Flather [9] dynamically linked a 2D numerical
* Corresponding author at: Hydro-environmental Research Centre, School ofEngineering, Cardiff University, Cardiff CF24 3AA, UK.
E-mail address: [email protected] (J. Xia).
Contents lists available at ScienceDirect
Renewable Energy
journal homepage: www.elsevier .com/locate/renene
0960-1481/$ – see front matter � 2009 Elsevier Ltd. All rights reserved.doi:10.1016/j.renene.2009.12.009
Renewable Energy 35 (2010) 1455–1468
Author's personal copy
model of the Bristol Channel to a one-dimensional model of theRiver Severn, and compared the numerical model-predicted waterlevels with the ones predicted using the harmonic method. Harriset al. [12] applied a depth-integrated 2D, conformal boundary-fitted, curvilinear coordinate model for predicting tidal currents andsediment transport processes in the Bristol Channel, with the modelresults indicating that the curvilinear boundary-fitted modelpredictions agreed closely with the measured data. Owen [1] andStephens [4] used 3D numerical regular grid models to predict tidal
levels and currents in the Bristol Channel, with the horizontal gridsize being over 1 km.
As most of the existing 2D and 3D numerical models use regularrectangular grids with relatively large grid sizes, they do notprovide a detailed representation of the bed topography, andneither do they ideally fit the complex and irregular land bound-aries in the region. In existing models where a barrage wasconsidered, then the hydraulic structures along the barrage havebeen treated using interior boundary conditions, with the nestedfine grids being deployed locally [6,7]. Since the regular grids do notaccurately represent the layout of the barrage, any inaccuracy in themodel geometry could influence the prediction of velocity fieldsaround the barrage and hence the tidal propagation towards thehead of the estuary. Using a curvilinear grid the coastline and riverboundaries can be represented more accurately and a higherdensity of grid points can be concentrated in areas of particularinterest. However, great difficulties remain in generating a suitablecomputational curvilinear mesh and also in representing thedetailed operating modes for the barrage.
A TVD finite volume method model, based on an unstructuredtriangular mesh, provides a very practical and accurate approach topredicting the tidal processes in the Severn Estuary, and particu-larly, when a barrage is included. This type of model has theadvantage of being mass conservative and flexible in representingthe natural topography and irregular boundaries. In this paper,a two-dimensional hydrodynamic model, based on an unstructuredtriangular mesh, is presented and applied to study the impact ofa barrage on the hydro-environmental aspects of the estuary. Themodel employs a TVD finite volume method to solve the 2D shallowwater equations, with the scheme being second-order accurate inboth time and space. The model has been set to include the Bristol
Fig. 1. Typical control volume in the x and y coordinates.
Fig. 2. Map of the Bristol Channel and Severn Estuary.
J. Xia et al. / Renewable Energy 35 (2010) 1455–14681456
Author's personal copy
Channel and a large part of the Severn Estuary, with the modeldomain covering an area of about 5700 km2. The model was firstcalibrated using tidal level and current data at various sites shownon the Admiralty Chart No.1179, with the model then being verifiedusing the water level measurements recorded in 2003 by theProudman Oceanographic Laboratory (POL). Using the domaindecomposition technique and interior open boundaries to repre-sent the barrage operation, the numerical model was applied topredict the impact of constructing a tidal barrage on the hydrody-namic processes in the Severn Estuary. The key hydrodynamicprocesses, for conditions both without and with the tidal barrage,were predicted and included the maximum water levels, dischargesat several cross-sections, and velocity fields around the barrage fordifferent barrage operating modes. In addition, the mean poweroutput was calculated for spring tides.
2. Description of hydrodynamic model
In estuarine and coastal waters, if the flow is primarily ina horizontal plane and does not display any significant verticalvelocity or stratification, then the 2D shallow water equations canbe used to describe the motion. In this section, the governingequations and corresponding numerical solution methods used torepresent the hydrodynamic processes in the Bristol Channel andSevern Estuary are outlined, with more details of the method beinggiven in Xia et al. [13].
2.1. Governing equations
The governing equations used in the current study are depth-averaged 2D shallow water equations, which can be written ina general conservative form as given below:
vUvtþ vE
vxþ vG
vy¼ v~E
vxþ v~G
vyþ S (1)
where U¼ vector of conserved variables; E and G¼ convective fluxvectors of flow in the x and y directions, respectively; ~E and~G¼ diffusive vectors related to the turbulent stresses in the x and ydirections, respectively; and S¼ source term including: bed
friction, bed slope and the Coriolis force. The above terms can beexpressed in detail as:
U ¼
264
h
hu
hv
375; E ¼
264
hu
hu2þ 12gh2
huv
375; G ¼
264
hv
huv
hv2þ 12gh2
375;
~E ¼
264
0
sxx
syx
375; ~G ¼
264
0
sxy
syy
375; and S ¼
2664
qs
þhf vþ gh�
Sbx� Sfx
�
�hfuþgh�
Sby� Sfy
�
3775 ð2Þ
where u, v¼ depth-averaged velocities (m/s) in the x and y direc-tions, respectively; h¼ total water depth (m); qs¼ source (or sink)discharge per unit area; g¼ gravitational acceleration; f¼ Coriolisacceleration due to the earth’s rotation, in which f¼ 2u sin f,u¼ earth’s angular velocity (7.29�10�5 rad/s) and f¼ latitude ofstudy domain (rad); Sbx and Sby¼ bed slopes in the x and y direc-tions, respectively; Sfx and Sfy¼ friction slopes in the x and ydirections, respectively; and sxx, sxy, syx and syy¼ components of theturbulent shear stress over the plane.
2.2. Numerical solution
The study region is first divided into a set of triangular cells, toform an unstructured computational mesh (see Fig.1). A cell-centred
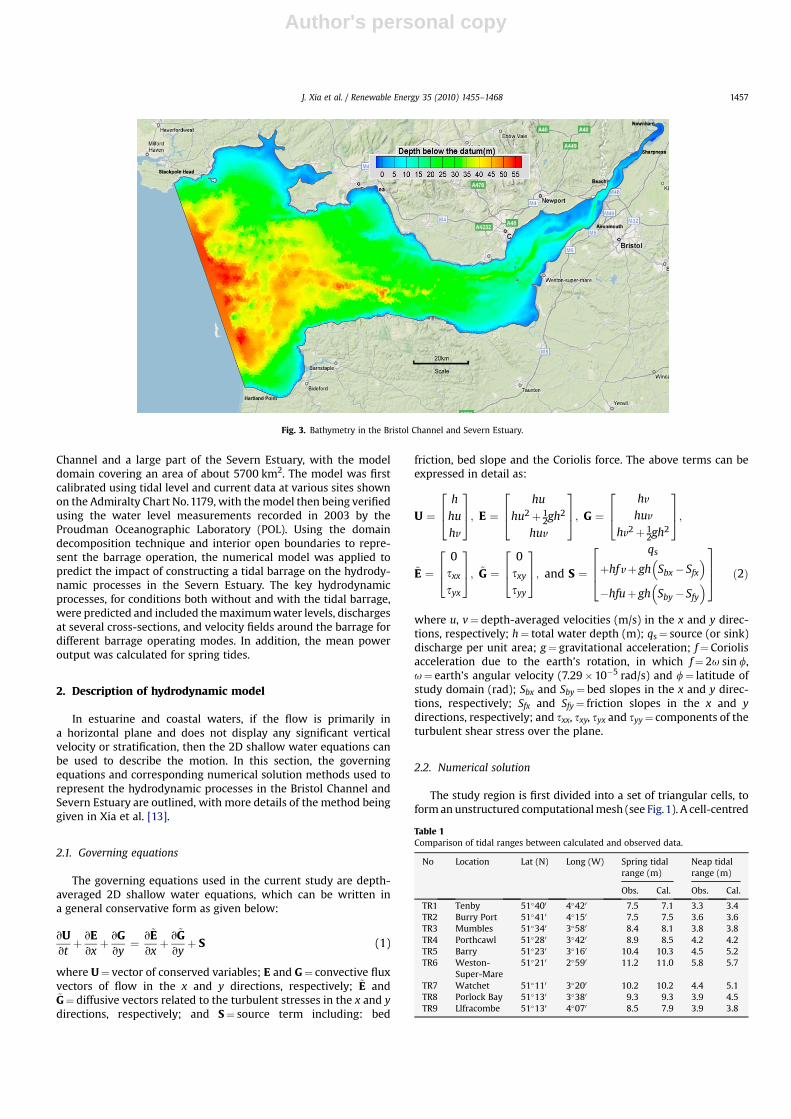
Fig. 3. Bathymetry in the Bristol Channel and Severn Estuary.
Table 1Comparison of tidal ranges between calculated and observed data.
No Location Lat (N) Long (W) Spring tidalrange (m)
Neap tidalrange (m)
Obs. Cal. Obs. Cal.
TR1 Tenby 51�400 4�420 7.5 7.1 3.3 3.4TR2 Burry Port 51�410 4�150 7.5 7.5 3.6 3.6TR3 Mumbles 51�340 3�580 8.4 8.1 3.8 3.8TR4 Porthcawl 51�280 3�420 8.9 8.5 4.2 4.2TR5 Barry 51�230 3�160 10.4 10.3 4.5 5.2TR6 Weston-
Super-Mare51�210 2�590 11.2 11.0 5.8 5.7
TR7 Watchet 51�110 3�200 10.2 10.2 4.4 5.1TR8 Porlock Bay 51�130 3�380 9.3 9.3 3.9 4.5TR9 Llfracombe 51�130 4�070 8.5 7.9 3.9 3.8
J. Xia et al. / Renewable Energy 35 (2010) 1455–1468 1457

Author's personal copy
finite volume method has been adopted in this model, in which theaverage values of conserved variables are stored at the centre of eachcell with the three edges of each cell defining the interface ofa triangular control volume. At an interface between two neigh-bouring cells, the calculation of the flow flux can be treated asa locally one-dimensional problem in the direction normal to theinterface [14], thus the flux can be obtained by an approximateRiemann solver. Existing approximate Riemann solvers for the 2DSWEs are usually derived from air dynamics problems [15,16]. Sleighet al. [17] found that Roe’s solver was more stable than several knownsolvers for 2D practical simulations. In the current model, the Roe’sapproximate Riemann solver and the MUSCL scheme were employed
for evaluating the normal fluxes across the cell face, with a procedureof predictor–corrector time stepping being used to provide second-order accuracy in both time and space. Furthermore, a refinedprocedure for treating wetting and drying fronts was used, based onan algorithm developed for a regular grid finite difference model[18]. This method has been shown to be effective in simulating thewetting and drying processes over large tidal flats.
2.3. Treatment of open seaward boundary
A non-reflecting boundary flux function was used in themodel in order to eliminate the reflection of waves, generated
a
b
Current speeds
Current directions
Site F (51°21.5' N, 4°19.4' W)
0.0
0.4
0.8
1.2
1.6
2.0
2.4
-6 -5 -4 -3 -2 -1 0 1 2 3 4 5 6Time referred to HW at Avonmouth(h)
Spee
d (m
/s) Cal.
Obs.
Site F(51°21.5' N, 4°19.4' W)
0
60
120
180
240
300
360
-6 -5 -4 -3 -2 -1 0 1 2 3 4 5 6
Time referred to HW at Avonmouth(h)
Dire
ctio
n (d
egre
es)
Cal.Obs.
Site M (51°20.1' N, 3°50.3' W)
0.0
0.4
0.8
1.2
1.6
2.0
2.4
-6 -5 -4 -3 -2 -1 0 1 2 3 4 5 6
Time referred to HW at Avonmouth(h)
Spee
d (m
/s) Cal.
Obs.
Site M (51°20.1' N, 3°50.3' W)
0
60
120
180
240
300
360
-6 -5 -4 -3 -2 -1 0 1 2 3 4 5 6
Time referred to HW at Avonmouth(h)
Dire
ctio
n (d
egre
es)
Cal.Obs.
Site R (51°14.2' N, 3°21.1' W)
0.0
0.4
0.8
1.2
1.6
2.0
2.4
-6 -5 -4 -3 -2 -1 0 1 2 3 4 5 6
Time referred to HW at Avonmouth(h)
Spee
d (m
/s)
Cal.Obs.
Site R (51°14.2' N, 3°21.1' W)
0
60
120
180
240
300
360
-6 -5 -4 -3 -2 -1 0 1 2 3 4 5 6
Time referred to HW at Avonmouth(h)
Dire
ctio
n (d
egre
es)
Cal.Obs.
Site V (51°19.6' N, 3°04.8' W)
0.0
0.4
0.8
1.2
1.6
2.0
2.4
-6 -5 -4 -3 -2 -1 0 1 2 3 4 5 6
Time referred to HW at Avonmouth(h)
Spee
d (m
/s)
Cal.Obs.
Site V (51°19.6' N, 3°04.8' W)
0
60
120
180
240
300
360
-6 -5 -4 -3 -2 -1 0 1 2 3 4 5 6
Time referred to HW at Avonmouth(h)
Dire
ctio
n (d
egre
es)
Cal.Obs.
Fig. 4. Calculated and observed current (a) speeds and (b) directions during spring tides.
J. Xia et al. / Renewable Energy 35 (2010) 1455–14681458
Author's personal copy
within the numerical model, at the seaward boundary. Details ofthe treatment of these waves are described in Sanders [19] andXia et al. [20], and only a brief outline of the method is givenherein.
The interface of a grid cell is an open boundary if the right sideof this interface is outside the computational domain and thereexists a flow flux across this interface. As shown in Fig. 1, the statevariable (UL) can be expressed respectively as (hL, uL, vL)T on theleft side of a boundary interface, and these values can be calcu-lated by the spatial reconstruction of the state variables, whichcan give second-order spatial accuracy. At the midpoint of
a boundary interface, the state variable (Ub) on the interface canbe expressed as (hb, ub, vb)T in the coordinates of x and y. For thereal case in modelling a coastal or estuarine basin, the water levelis conventionally specified in the form of a hydrograph at a sectionalong the seaward boundary, with the water depth hb (or eleva-tion) at each node for this boundary being specified directly ateach time level. However, a reflected wave generated within thedomain needs to be permitted to pass out through this boundaryand not re-reflected back into the domain. This is achieved in themodel by slightly adjusting the specified velocity at the boundaryto enable any reflected waves to be permitted to travel out of the
b
a Current speeds
Current directions
Site F (51°21.5' N, 4°19.4' W)
0.0
0.4
0.8
1.2
1.6
2.0
2.4
-6 -5 -4 -3 -2 -1 0 1 2 3 4 5 6Time referred to HW at Avonmouth(h)
Spee
d (m
/s) Cal.
Obs.
Site F(51°21.5' N, 4°19.4' W)
0
60
120
180
240
300
360
-6 -5 -4 -3 -2 -1 0 1 2 3 4 5 6
Time referred to HW at Avonmouth(h)
Dire
ctio
n (d
egre
es)
Cal.Obs.
Site M (51°20.1' N, 3°50.3' W)
0.0
0.4
0.8
1.2
1.6
2.0
2.4
-6 -5 -4 -3 -2 -1 0 1 2 3 4 5 6
Time referred to HW at Avonmouth(h)
Spee
d (m
/s) Cal.
Obs.
Site M (51°20.1' N, 3°50.3' W)
0
60
120
180
240
300
360
-6 -5 -4 -3 -2 -1 0 1 2 3 4 5 6
Time referred to HW at Avonmouth(h)
Dire
ctio
n (d
egre
es)
Cal.Obs.
Site R (51°14.2' N, 3°21.1' W)
0.0
0.4
0.8
1.2
1.6
2.0
2.4
-6 -5 -4 -3 -2 -1 0 1 2 3 4 5 6
Time referred to HW at Avonmouth(h)
Spee
d (m
/s)
Cal.Obs.
Site R (51°14.2' N, 3°21.1' W)
0
60
120
180
240
300
360
-6 -5 -4 -3 -2 -1 0 1 2 3 4 5 6
Time referred to HW at Avonmouth(h)
Dire
ctio
n (d
egre
es)
Cal.Obs.
Site V (51°19.6' N, 3°04.8' W)
0.0
0.4
0.8
1.2
1.6
2.0
2.4
-6 -5 -4 -3 -2 -1 0 1 2 3 4 5 6
Time referred to HW at Avonmouth(h)
Spee
d (m
/s)
Cal.Obs.
Site V (51°19.6' N, 3°04.8' W)
0
60
120
180
240
300
360
-6 -5 -4 -3 -2 -1 0 1 2 3 4 5 6
Time referred to HW at Avonmouth(h)
Dire
ctio
n (d
egre
es)
Cal.Obs.
Fig. 5. Calculated and observed current (a) speeds and (b) directions during neap tides.
J. Xia et al. / Renewable Energy 35 (2010) 1455–1468 1459
Author's personal copy
domain by using the method of characteristics. Thus, in Fig. 1, ‘‘n’’and ‘‘s’’ denote the outward normal and tangential directions ofthe interface, respectively, and ubn and ubs are velocity compo-nents in the local coordinates of n and s, which can be expressed
as ubn¼ ubnxþ vbny and ubs¼ ubny� vbnx, respectively. Here nx andny are components of the unit normal vector in the x and ydirections, respectively and ubn can be solved according to thetheory of characteristics, giving:
Ava
b
c
d
onmouth
-6-5-4-3-2-101234567
48 72 96 120 144 168 192 216 240Time(h)
Wat
er L
evel
(m)
Obs.Cal.
Newport
-6-5-4-3-2-101234567
48 72 96 120 144 168 192 216 240Time(h)
Wat
er L
evel
(m)
Obs.Cal.
Mumbles
-6-5-4-3-2-101234567
48 72 96 120 144 168 192 216 240Time(h)
Wat
er L
evel
(m)
Obs.Cal.
Hinkley Point
-6-5-4-3-2-101234567
48 72 96 120 144 168 192 216 240Time(h)
Wat
er L
evel
(m)
Obs.Cal.
Fig. 6. Calculated and observed tidal levels in May 2003.
J. Xia et al. / Renewable Energy 35 (2010) 1455–14681460
Author's personal copy
ubn ¼ uLn þ 2� ffiffiffiffiffiffiffiffi
ghL
p�
ffiffiffiffiffiffiffiffighb
q �(3)
in which hL¼water depth on the left hand side of the interface; anduLn¼ uLnxþ vLny. In addition, the assumption is usually adopted inFVM models that ubs¼ uLs. According to the values of ubs and ubn inthe local coordinates of n and s, the velocity components on theboundary interface in the x and y coordinates are now obtained fromthe following relations: ub¼ ubnnx� ubsny and vb¼ ubnnyþ ubsnx.This method enables reflected waves generated within the domainto be fully passed out through the open boundary without inter-fering with the internal flow field.
3. Model validation
The hydrodynamic processes in the Bristol Channel and SevernEstuary are highly complex due to the irregular land boundariesand the extremely high tidal range. Fig. 2 shows a map of the studydomain, with the Bristol Channel being defined as the regionbetween sections A–A and B–B, and the Severn Estuary as theregion landward of section B–B [8]. With a mean spring tidal rangeof 12.2 m and a high spring tidal range approaching 14.0 m atAvonmouth, the Severn Estuary has one of the largest tidal rangesin the world. The study domain is also characterised by steepgradients of the seabed level, with the average depth decreasingfrom about 60 m near the seaward boundary A–A to about 10 mnear Avonmouth over an estuary length of 150 km. In addition, thesurface width in the area also decreases greatly, from about 72 kmat section A–A to about 200 m at the landward boundary D–D.Therefore, this study domain presents a severe test of the numericalhydrodynamic model and its capabilities in modelling extremeflooding and drying processes. A rigorous validation of the modelwas undertaken using field observations of tidal levels and currentsat different sites, to ensure the reliability of model predictions.
3.1. Model calibration
The computational domain covers the area between sectionsA–A and D–D (see Fig. 2), with a plan water surface area of about5700 km2. Section D–D is located about 30 km upstream of the M4Bridge and near the outlet of a sharp meandering reach at Newn-ham. The model domain was divided into 37,423 unstructuredtriangular cells. The computational grid was refined locally to givea higher resolution around the deep channels and at the barragesite. Fig. 3 shows the bathymetry in the study domain. Thebathymetry used in this model was obtained by interpolation usinga digital bathymetric chart of the area downstream of the secondSevern Bridge and observed cross-sectional profiles upstream of thebridge and up through the River Severn. There was an overlap reachbetween these two sets of data to enable validation and synchro-nisation of the data. The open seaward boundary was located alongthe section A–A (see Fig. 2), from Hartland Point in England toStackpole Head in Wales, with the water levels being specified atthis boundary. At the landward boundary, the water level distribu-tion obtained from a linked 1D and 2D model [21] was used tospecify the boundary condition. The value of the Manning rough-ness coefficient was calibrated by comparing the predicted tidalranges and currents at different sites along the estuary with theobserved data, and with the closest agreement being obtained whenthe Manning roughness coefficients were 0.022 m�1/3 s for springtides and 0.025 m�1/3 s for neap tides, respectively. The relationshipbetween the bottom drag coefficient (Cf) and Manning roughnesscoefficient (n) is given as Cf¼ gn2/h1/3. For a location of an averageddepth of 30 m, a Manning roughness of 0.022 m�1/3 s is equivalentto a bottom drag coefficient of 0.0015. The Manning roughnesscoefficient is often used in 1D and 2D models to represent the bedfriction in estuarine and riverine studies. In the current 2D model,the bed friction terms in the x and y directions are respectivelywritten as Sfx ¼ n2u
ffiffiffiffiffiffiffiffiffiffiffiffiffiffiffiffiu2 þ v2
p=h4=3 and Sfy ¼ n2v
ffiffiffiffiffiffiffiffiffiffiffiffiffiffiffiffiu2 þ v2
p=h4=3.
Fig. 7. Sketch of the Cardiff-Weston barrage layout (from STPG, 1989).
J. Xia et al. / Renewable Energy 35 (2010) 1455–1468 1461
Author's personal copy
A constant time step of 2 s was used in this study. In the initialcalibration of the model, the observed data for tidal ranges andcurrents were obtained from the Admiralty Chart No.1179, see Table1.
A comparison between the model predicted and observed tidalranges at the calibration sites is given in Table 1, with the degree ofagreement generally being very good at almost all sites. For springtides, the predicted tidal ranges at the majority of sites wereunderestimated by about 0.3 m. For neap tides, the predicted tidalranges were overestimated at three sites by about 0.6–0.7 m, butthe predicted values were in good agreement with the observeddata at the remaining sites. The degree of accuracy was regardedas acceptable, particularly when considering the complexity of thetidal flows in such a large model domain and for such extremetidal conditions. It should be noted that the predicted spring andneap tidal ranges at Weston-Super-Mare, near the proposedbarrage site, were very close to the observed values for both springand neap tides. Tidal stream data given in Admiralty Chart No.1179 were also used for tidal current calibration, with the pre-dicted current speeds and directions generally agreeing well withthe observed values.
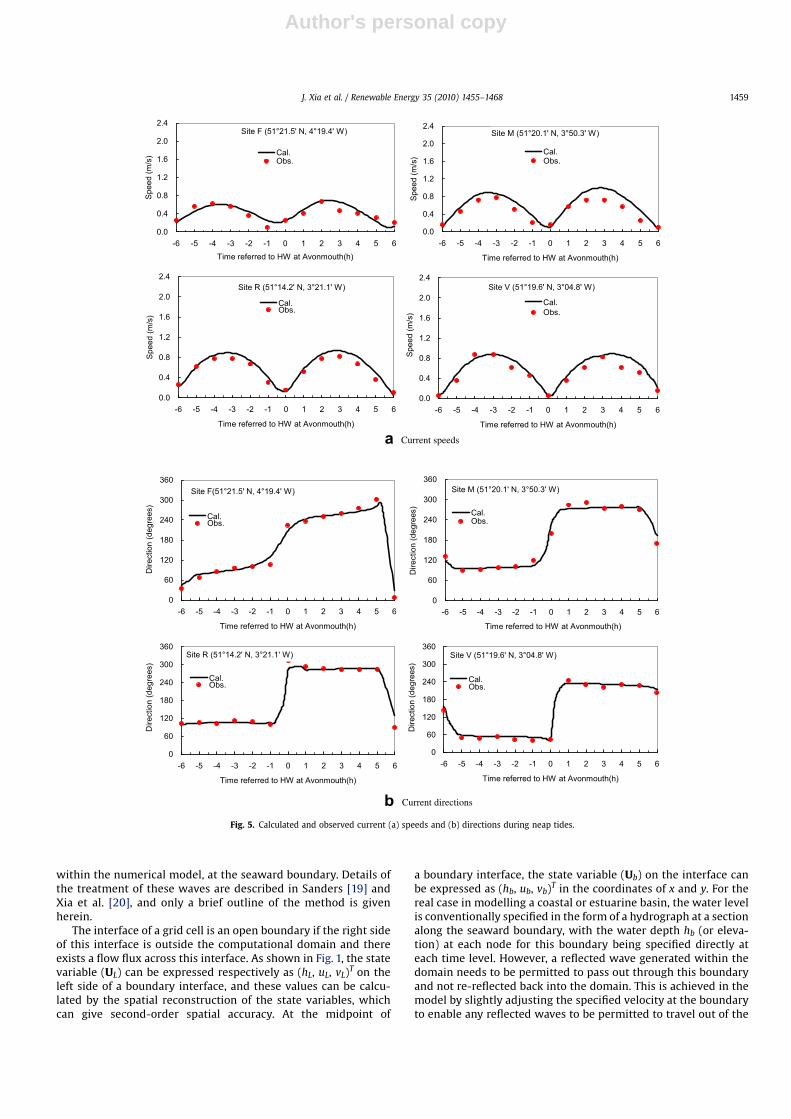
Comparisons between the model predictions and observationswere made at all of the sites where data were available, for bothspring and neap tides. However, results are only shown herein atfour sites in Figs. 4 and 5. It can be seen from Fig. 4a that thenumerical model accurately predicted the current speed varia-tions for spring tides. Fig. 4b indicates the comparisons betweenthe predicted and measured current directions at these sites forspring tides, with the results showing that the directions at sitesM, R, and V are near constant values during both flood and ebbtides. This was thought to reduce to these sites being located inthe middle channel, with relatively large water depths, and wherethe tidal currents generally respond well to the water levelchanges. Fig. 5a and b indicates respectively the comparisons ofthe current speeds and directions at the above four sites for neaptides. Again the model predictions were in good agreement withthe observed data.
3.2. Model verification
The model was then verified using continuously observed fielddata at four tide gauging stations. In this verification process, a time
series of tidal levels was specified at the open seaward boundary,based on the predicted data from the POLPRED software modeldeveloped by POL [22]. Water levels were also specified at the openlandward boundary using the predictions made by the linked1D–2D model described above.
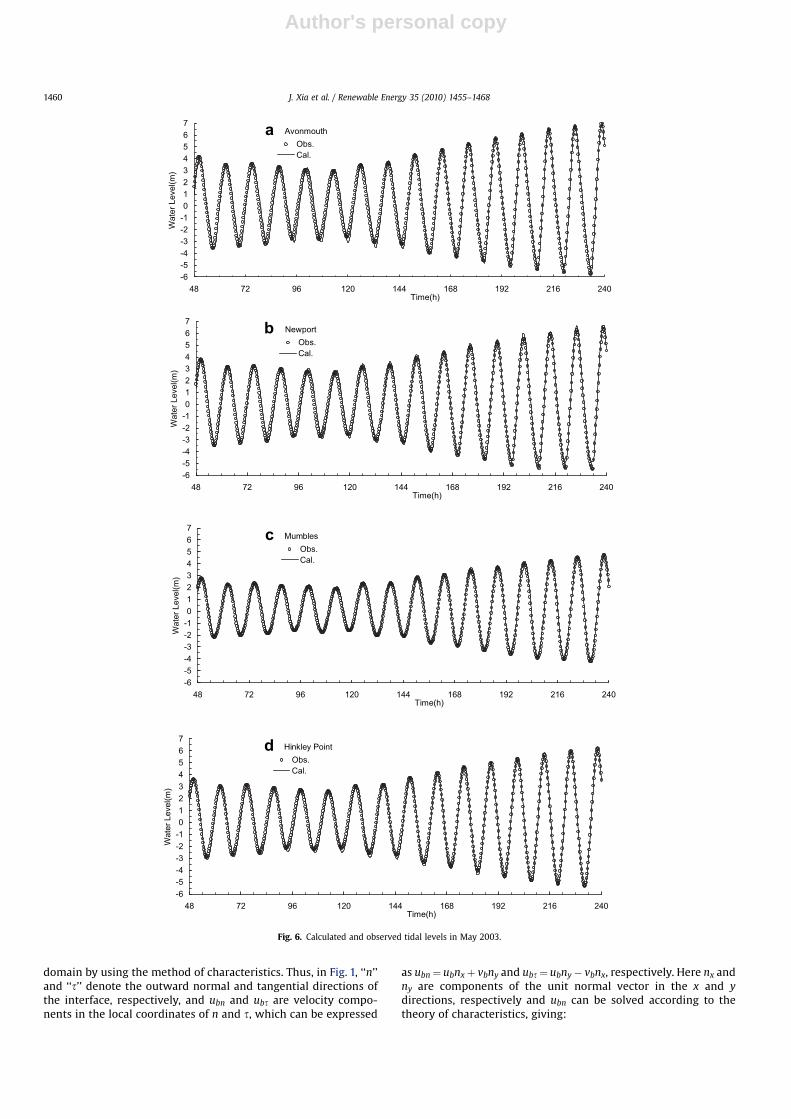
The simulation period lasted for 240 h, starting from 20:00 PMon May 5, 2003, and with the simulation results being recorded andcommenced after 4 tidal cycles. Fig. 6a–d shows the comparisonsbetween the model predicted tidal levels at the four tide gaugingstations and the corresponding observed data. It can be seen thatfor spring tides the model predictions followed the observed dataclosely, with both the maximum and minimum tidal levels beingmatched satisfactorily. For neap tides, the model predictions alsogenerally reproduced the variation in water level accurately, exceptfor the minimum tidal levels where elevations were sometimesoverestimated by 10–20 cm.
In using a 2D horizontal model, the vertical gradients in thehorizontal velocity cannot be accurately represented. This will havean effect on the model predictions. This problem is usually ignored,but a momentum correction factor could be added to the advectiveterms in the momentum equation to reduce the effect, see Falconeret al. [23]. Further studies will be undertaken to investigate themethod for implementing the momentum correction factor infinite volume models.
4. Model application
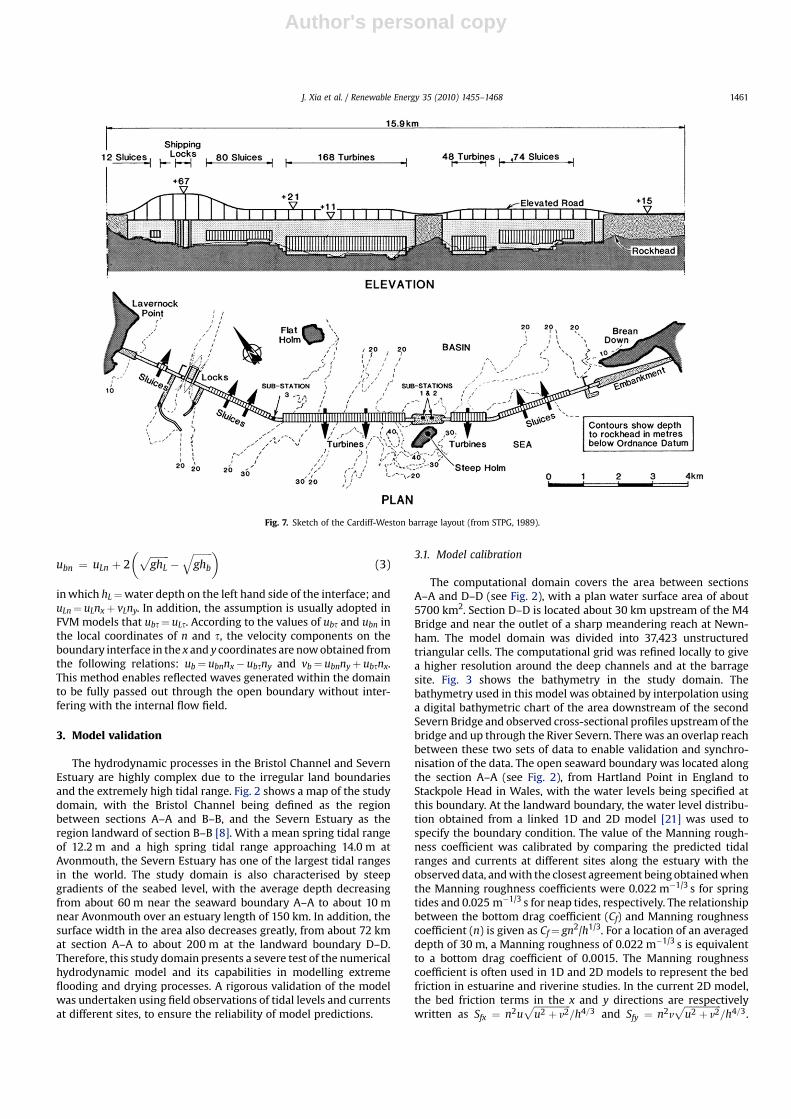
The model was then applied to predict the impact of con-structing a tidal barrage on the hydrodynamic processes in theSevern Estuary. The Cardiff-Weston barrage, as proposed by SevernTidal Power Group [5], was studied with the barrage being locatedjust west of Cardiff and Weston-Super-Mare (see Fig. 2). Theproposed barrage would be 16 km long and would be constructedof reinforced concrete caissons. These caissons would incorporate216 bulb turbines and electricity generators, 166 sluice gates, shiplocks and other hydraulic structures such as locks and fish passage.A single caisson width across the barrage varies from 45 m to 80 m,as determined by their functional requirements, with the length ofeach caisson along the barrage also varying between 80 and 90 mfor the largest caisson. Fig. 7 shows a sketch of the barrage layout[5]. It was estimated that the energy stored in this water system canbe harnessed to generate up to 5% of the electricity for England and
Shipping locks
80 Sluices
12 Sluices
Sub-stations
168 Turbines
48 Turbines
Sub-stations
74 Sluices
Embankment
Flat Holm
Steep Holm
Embankment
Cardiff
Weston
Sub-domain II
Sub-domain I
Fig. 8. Sketch of the domain decomposition and grid refinement.
J. Xia et al. / Renewable Energy 35 (2010) 1455–14681462
Author's personal copy
Wales. If the barrage is built to this scale, then the Severn Barragewould be a significant project with engineering for the UK, but withthe barrage expected to have a significant impact on the hydro-environmental processes in the Severn Estuary and with thisimpact needing to be fully assessed. This assessment formed themain aims and objectives of an ongoing research project as repor-ted herein.
The presence of the proposed barrage could significantly affectthe water levels at the seaward boundary if it was located close to thebarrage site. In order to reduce such an effect, in the current studythe seaward model boundary was located about 120 km down-stream of the proposed barrage site. The selection of the boundarysite was also influenced by the previous studies of the SevernBarrage [5]. Since the aim of the current study was to investigate theimpact of constructing a tidal barrage on the hydrodynamicprocesses in the Severn Estuary. Additionally, a non-reflectingboundary condition was used in the model to reduce further theeffect of tidal wave reflection [19], and this method solved theboundary Riemann problem with the second-order accuracy inspace [20]. In order to reduce the effect of the proposed barrage onthe open seaward boundary, a numerical model with a largerdomain will be setup in the near future, using the similar methodsadopted in the publications by Garrett [24] or Greenberg [25].
4.1. Domain decomposition and grid refinement
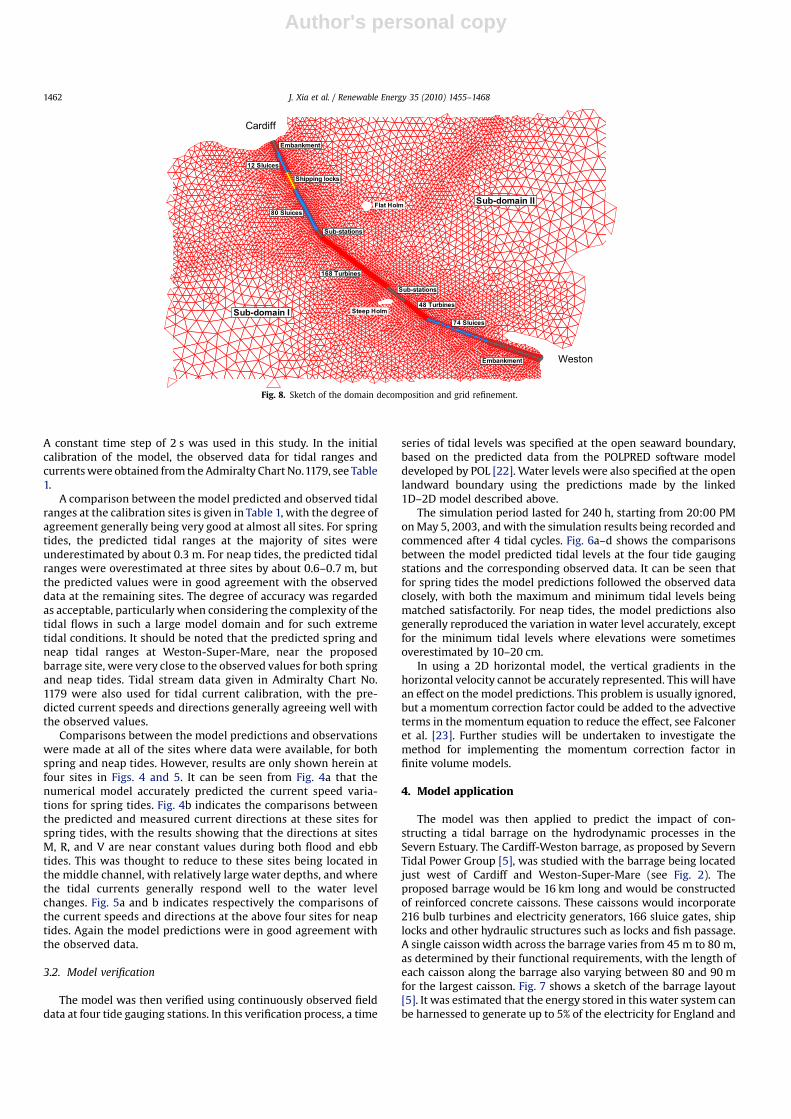
In modelling the hydrodynamic processes with the SevernBarrage included in the domain, the study domain was identical tothat used in the model validation process, i.e., the domain withoutthe barrage. In order to take into account the complex distributionsof water levels and velocities in the vicinity of the hydraulicstructures to be built along the barrage, a higher resolution modelmesh was applied around the region of the barrage. To simulateadequately the hydrodynamic processes caused by the barrageoperation, a technique of domain decomposition was applied inthis study, instead of employing only interior boundaries. Thistechnique is widely recognised as an efficient and flexible way ofsimulating complex physical processes. In the current study themodel domain was divided into two subdomains. Subdomains I andII were located downstream and upstream of the barrage, respec-tively, as shown in Fig. 8. At the barrage site open boundaryconditions were specified for both subdomains, and the two sub-domains were linked dynamically using a Q–H relationship. Thedischarge Q through a hydraulic structure, such as a sluice gate orturbine, was obtained by linking Q with the difference between theupstream and downstream water levels and given by:
Q ¼ CdAffiffiffiffiffiffiffiffiffiffiffiffiffiffiffiffiffiffiffiffiffiffiffiffiffi2gðZu � ZdÞ
p(4)
where Cd¼ discharge coefficient of sluice or turbine; A¼wet flow-through area; Zu and Zd¼ upstream and downstream water levels,respectively; and H¼ Zu� Zd. The discharge coefficient in the Q–Hrelation is dependent on the type of hydraulic structure beingconsidered. In this initial study, it was assumed that the samedischarge coefficient of 0.75 could be used for both the sluice gatesand turbines. According to the data reported by STPG [5], the meanopening area of each sluice gate was set to be 210.8 m2, while themean wet flow-through area of each turbine was set to 63.6 m2. Thedischarge through each sluice gate or turbine was determined usingEq. (4). After each time step, the water levels both downstream and
Wa
te
r L
ev
el (m
)
Po
we
r o
utp
ut (G
W)
0 2 4 6 8 10 12 14 16 18 20 22 24-10
-9-8-7-6-5-4-3-2-10123456
0
2
4
6
8
10
12
14
16
Time (hour)
Water level (m)
upstream of the barrrage
Water level (m)downstream of the barrrage
Power Generation Power Generation
I=Filling (3.5h)
II=Holding (2.1h+1.7h)
III=Generating (5.2h)
0
0
2
4
6
8
10
12
14
16I II III II
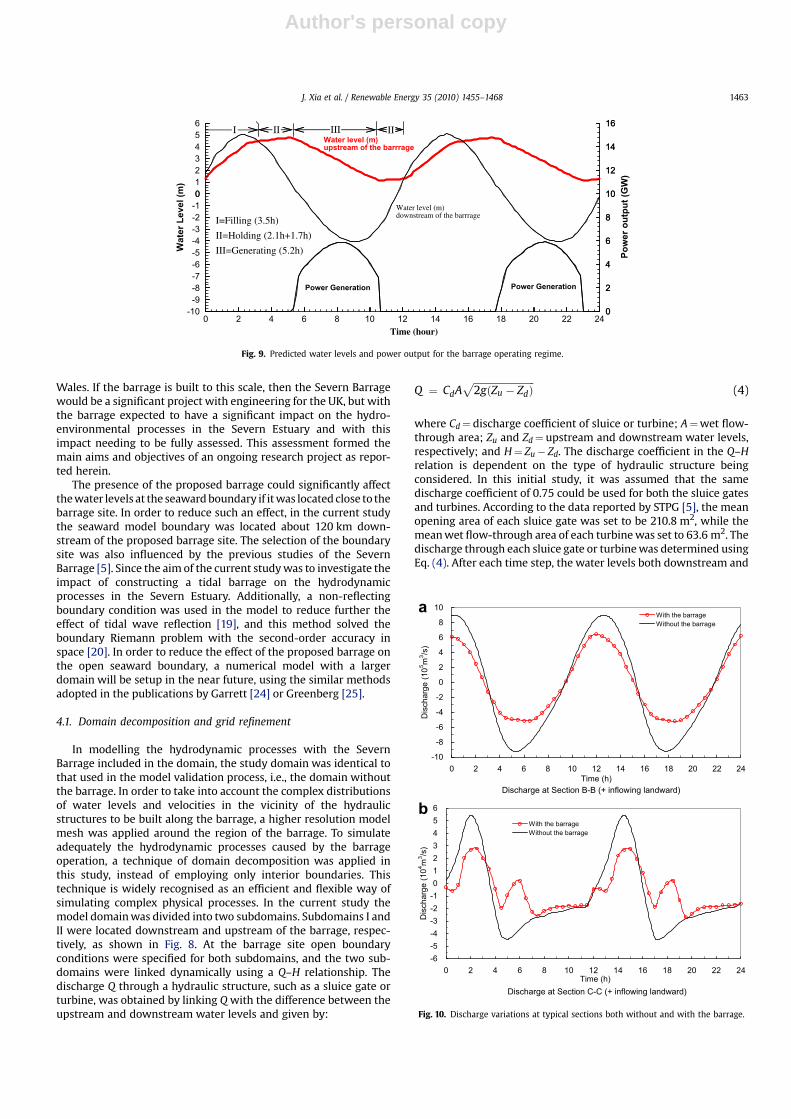
Fig. 9. Predicted water levels and power output for the barrage operating regime.
Discharge at Section B-B (+ inflowing landward)
-10
-8
-6
-4
-2
0
2
4
6
8
10
0 2 4 6 8 10 12 14 16 18 20 22 24Time (h)
Dis
char
ge (1
05 m3 /s
)
With the barrageWithout the barrage
-6-5-4-3-2-10123456
0 2 4 6 8 10 12 14 16 18 20 22 24Time (h)
Dis
char
ge (1
04 m3 /s
)
With the barrageWithout the barrage
Discharge at Section C-C (+ inflowing landward)
a
b
Fig. 10. Discharge variations at typical sections both without and with the barrage.
J. Xia et al. / Renewable Energy 35 (2010) 1455–1468 1463
Author's personal copy
upstream of the barrage were determined, with the total dischargeacross the barrage then being calculated from within the model.
The model grid was refined in the region around the barrage inorder to allow the sluice gates and turbines to be modelled indi-vidually. The total computational domain was divided into 22,925nodes and 44,407 cells, with Fig. 8 showing the distribution of thegrid cells in the region along the barrage. It can be seen that thecomputational grid was locally refined significantly in order tosimulate the complex flow patterns around the barrage, with theminimum grid size being reduced to about 40 m. The islands of FlatHolm and Steep Holm, near the barrage site, were modelled usingland boundaries, and the ship locks, sub-stations and embank-ments along the barrage were all treated as wall boundaries.
4.2. Proposed barrage operating regime
In this study, the barrage operating regime proposed in the STPGstudy [5], i.e. one way generation only during ebb tides, was used tocontrol the opening or closing of the sluices and turbines. The time
period for a full barrage operating regime was set to a tide cycle,namely 12.4 h for a mean spring tide. The minimum water head forpower generation was assumed to be 4.0 m, with the dischargeacross each sluice gate or turbine being evaluated using Eq. (4).
4.3. Analysis of model results without and with a barrage
In this section, the model-predicted hydrodynamic parametersfor scenarios both without and with the barrage were analysed indetail for a mean spring tide, and for different tidal times, includingevaluating: the tidal power output for ebb generation mode, thedischarge across key cross-sections, the maximum water levels andtidal currents, and the velocity fields through and around thebarrage structure.
4.3.1. Tidal power output for ebb generation modeThe formula for computing the generation power of P can be
expressed by P¼ gQHh, where g¼ specific density of sea water(ton/m3); Q¼ discharge across the turbines (m3/s); and
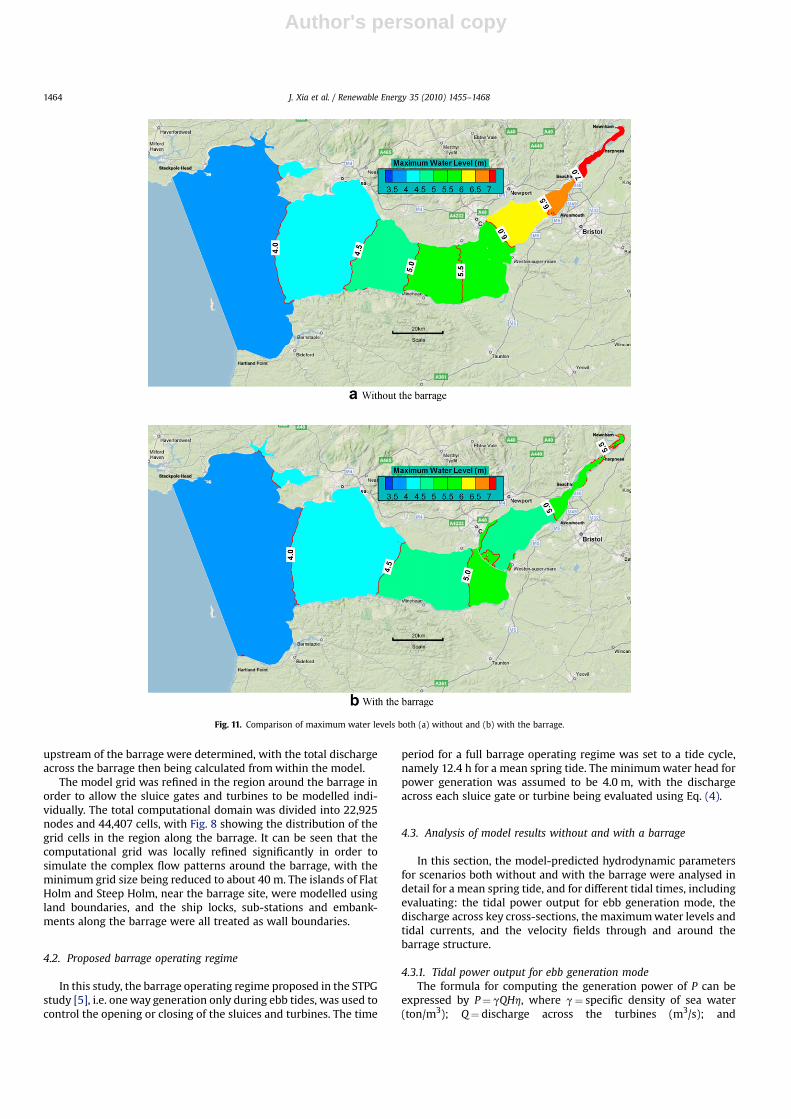
Fig. 11. Comparison of maximum water levels both (a) without and (b) with the barrage.
J. Xia et al. / Renewable Energy 35 (2010) 1455–14681464
Author's personal copy
h¼ efficiency coefficient of the turbines. In this preliminary study,the same efficiency coefficient of 0.80 was used in all the turbines.Fig. 9 shows the water level time series, both upstream anddownstream of the barrage, together with the power output valuefor mean spring tides. A full cycle of barrage operating regimeincluded four stages: (i) filling, (ii) holding, (iii) generating and (iv)holding. In the first stage, the cycle began at the flood tide, whenthe sluice gates and turbines were both set to open, to allow thewater to flow into the basin upstream of the barrage, with thisfilling stage lasting about 3.4 h. In the second stage, just before thehigh tide, the sluice gates and turbines were both closed for about2.1 h. As the water head between the basin level and the down-stream sea level increased to a sufficient value to enable efficientelectricity generation, then the turbines were set to their operatingstage, and the water upstream of the barrage was allowed todischarge out of the basin. This process of power generation lastedabout 5.2 h, with the maximum water head reaching over 6.0 mand with a corresponding maximum power output being about6 GW. For the final stage, when the water head had been reduced to
a value which was insufficient for further electricity generation,then the turbines were shut and the sluice gates remained closeduntil the next rising tide. This holding stage only lasted only 1.7 h,until the low water level was again reached. The numerical model-predicted barrage operating processes were very similar to theproposed processes in the STPG report [5]. However, no computa-tional details were given in that STPG report. From Fig. 9, it can beseen that over a typical cycle of a mean spring tide, the averagevalue of power output was about 2.0 GW, with the total electricitygenerated being about 25 GWh. In addition, the power outputvalues over a mean mid-range tide and a mean neap tide were alsopredicted, and they were about 14.6 GWh and 6.9 GWh,respectively.
4.3.2. Discharge processes at typical sectionsThe hydrodynamic processes will significantly change in the
Bristol Channel and Severn Estuary if a Severn Barrage is built. Oneof the prominent characteristics would be change of the totalamount of water flowing into and out of the Severn Estuary. Fig. 10a
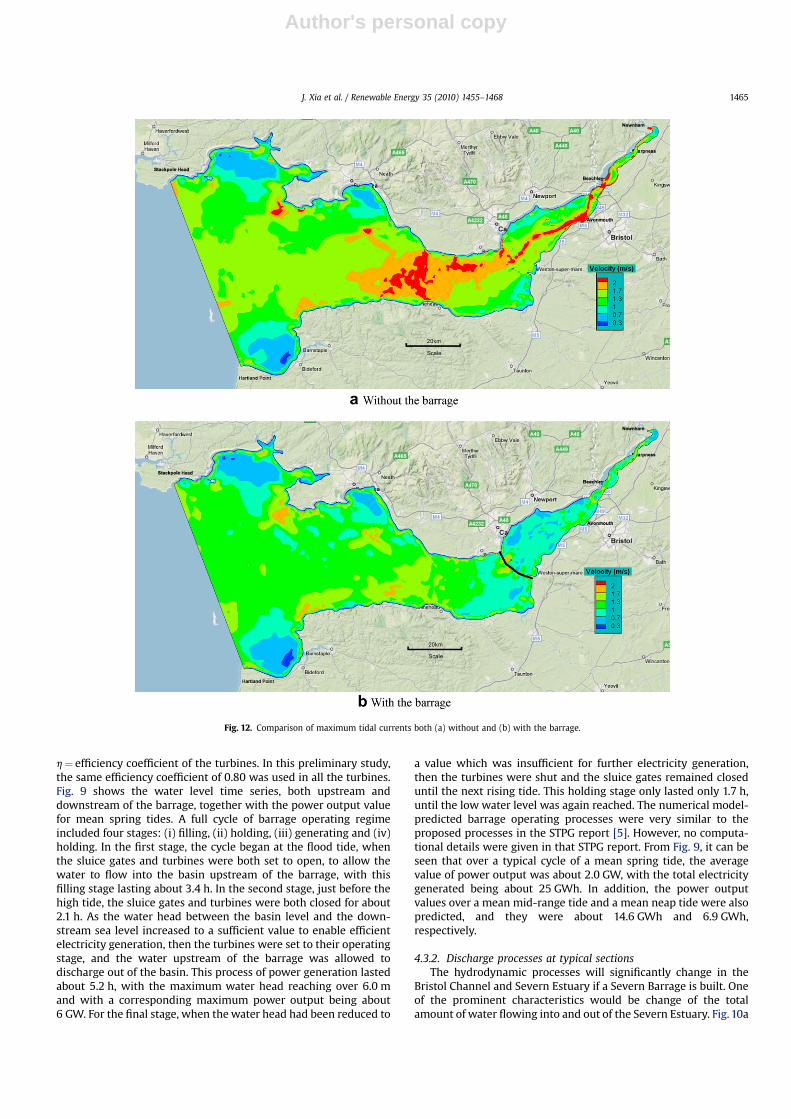
Fig. 12. Comparison of maximum tidal currents both (a) without and (b) with the barrage.
J. Xia et al. / Renewable Energy 35 (2010) 1455–1468 1465
Author's personal copy
and b shows the variations in the total discharge over a tidal cycle atsections B–B and C–C for conditions without and with a barrage,respectively. With the barrage in place the maximum dischargeflowing into the estuary was predicted to decrease from 9.0�105 to6.5�105 m3/s at section B–B. This represents about a 30% reductionas compared with the discharge predicted without the barrage. Atthe section located upstream of the barrage, namely section C–C, thedischarge process was also predicted to change significantly. Due tothe barrage operation, two additional but smaller peak dischargeswere predicted to occur over a tidal cycle. In addition, the maximumdischarge flowing landwards was predicted to decrease from5.4�104 to 2.8� 104 m3/s, i.e., a reduction in the flow of about 50%,as compared with the corresponding discharge without the barrage.Therefore, the barrage was predicted to influence the dischargeprocesses more upstream than downstream of the barrage, with the
reduction in the landward discharge resulting in lower maximumwater levels in the upstream basin area.
4.3.3. Maximum and minimum water levelsAfter construction of a barrage, the maximum water levels in the
study domain were predicted to change significantly. Fig. 11 showsa comparison between the model predicted maximum water leveldistributions both without and with the barrage, for a mean springtide. It can be seen from this figure that the barrage was predictedto have a very limited influence on the maximum water levels inthe outer region of the Bristol Channel. However, in the regionbetween section B–B and the barrage site, the maximum waterlevels were predicted to decrease by 0.50 m with the barrage. In theregion upstream of the barrage, the maximum water levels werepredicted to decrease by 0.5–1.5 m due to the presence of the
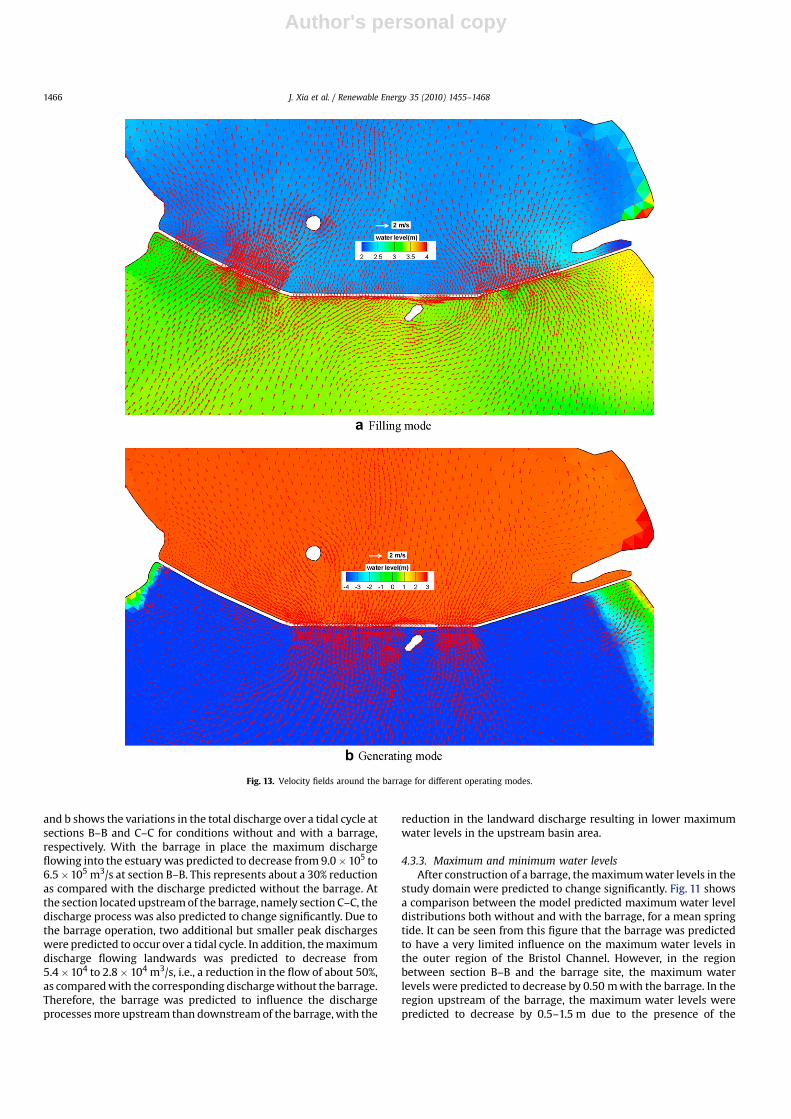
Fig. 13. Velocity fields around the barrage for different operating modes.
J. Xia et al. / Renewable Energy 35 (2010) 1455–14681466
Author's personal copy
barrage. For example, the predicted maximum water level duringspring tides at Avonmouth decreased from 6.5 m without thebarrage to 5.1 m with the barrage. At Sharpness the value decreasedfrom 7.3 m to 5.5 m. Thus these predicted results confirm that theconstruction of a barrage would cause a reduction in the flood riskupstream of the barrage. However, it should be pointed out that theconstruction of a barrage would have some significant environ-mental impacts such as the reduction of water body exchange andthe degeneration of some marshes. These perceived negativeimpacts of a barrage on the environmental conditions of theestuary need further investigation.
After construction of a barrage, the minimum water levels in thestudy domain were also predicted to change significantly. Thesimulated results indicated that the effect of barrage constructionon the minimum water levels was limited in the region seaward ofthe barrage, but this effect was very noticeable in the basin land-ward of the barrage. The minimum water level at Avonmouth waspredicted to increase by about 5.0 m, and the Welsh Grounds nearNewport would be fully submerged during a tidal cycle. This wouldcause an adverse impact on the ecological systems of mudflats.
4.3.4. Maximum tidal currentsSince construction of a barrage will cause a decrease in the
water volume entering into the Severn Estuary, the maximum tidalcurrents within the Severn Estuary will also reduce considerably.Fig. 12 shows a comparison between the predicted maximum tidalcurrent distributions without and with a barrage during a meanspring tide. It can be seen that the maximum currents will reduceconsiderably in the main channel upstream of the barrage andparticularly in a fairly large area across the estuary, seaward of thebarrage and west of Cardiff. This area is one of the few sites in theestuary evaluated for the siting of tidal stream turbines.
4.3.5. Velocity fields around the barrageThe velocity distribution in the Bristol Channel and Severn
Estuary will become more complicated across the estuary due tothe combined effect of the oscillatory tidal flow and the jet flowstructure along the barrage. Detailed velocity distribution predic-tions for different operating stages can contribute to a betterunderstanding of navigating conditions around the barrage. Fig. 13aand b shows the complex velocity fields around the barrage for twodifferent operating modes. During the filling mode, the wateroutside of the barrage enters the upstream basin through theturbines and sluice gates, with the total discharge through the sluicegates being considerably greater than that through the turbines. Inthis mode the water head between the downstream and upstreamsides of the barrage was usually less than 1.0 m. The maximumvelocity was less than 2.0 m/s in the area downstream of the sluicegates, and 1.0 m/s downstream of the turbines. The lateral flows,i.e., where the flow direction is parallel to the barrage, can be foundin the middle channel. During the generating mode, the waterstored in the upstream basin is released through the 216 turbineswith all sluice gates being closed. Thus the maximum water leveldifference between upstream and downstream of the turbines canbe over 6.0 m, with the velocity near the turbines being typically1.50 m/s or more, but near the sluices the velocity is much lowerduring this stage of operation.
5. Conclusions
In this paper, a two-dimensional hydrodynamic model based onan unstructured triangular mesh has been used to assess thehydrodynamic impact of constructing a tidal barrage across theSevern Estuary. This model used a TVD finite volume method to solve2D shallow water equations, with the numerical scheme used being
second-order accurate in both time and space. The model was firstrefined to include the need to simulate extreme flooding and dryingprocesses. Details were given of the model calibration and verifica-tion processes, which indicate that the numerical model predictionsgenerally agreed closely with the observed data. The model was thenapplied to predict the water levels and velocity distributions in theSevern Estuary, both without and with the proposed Cardiff-Westonbarrage. The results have shown that the velocity field wouldbecome more complex in the area around the barrage site. Thebarrage was predicted to generate 25 GWh units of electricity overa mean spring tidal cycle, with the average power output being about2.0 GW. Model predictions also showed that with the barrage inplace, the maximum water levels upstream of the barrage woulddecrease by 0.50–1.50 m, which would reduce the risk of floodingalong the Severn Estuary. The maximum tidal currents were pre-dicted to decrease considerably in the main channel and, in partic-ular, an area near the downstream boundary of the estuary, wherethe scope for tidal stream turbines would consequently be restricted.The maximum discharge across an upstream section, near the M4Bridge, was also predicted to decrease considerably.
Acknowledgements
The research reported in this paper was conducted as part of theFlood Risk Management Research Consortium (Phase II), supportedby the UK Engineering and Physical Sciences Research Council (GR/S76304). In addition, this work was partly supported by the fund fora research group project, financed by the State Key Laboratory ofWater Resources and Hydropower Engineering Science, WuhanUniversity. The authors thank very much the reviewer for his or herconstructive comments that improved the paper.
References
[1] Owen A. A three-dimensional model of the Bristol Channel. Journal of PhysicalOceanography 1980;10:1290–302.
[2] Uncles RJ. A numerical simulation of the vertical and horizontal M2 tide in theBristol Channel and comparisons with observed data. Limnology and Ocean-ography 1981;26(3):571–7.
[3] Uncles RJ. Hydrodynamics of the Bristol Channel. Marine Pollution Bulletin1983;15(2):47–53.
[4] Stephens CV. A three-dimensional model for tides and salinity in the BristolChannel. Continental Shelf Research 1986;6(4):531–60.
[5] Severn Tidal Power Group (STPG). The Severn barrage project: general report,energy paper No. 57. London: Her Majesty’s Stationery Office (HMSO); 1989.
[6] Department of Energy, Central Electricity Generating Board, Severn TidalPower Group. Severn barrage project: detailed report. Harwell, UK: EnergyTechnology Support Unit; 1989. Report No. TID 4060.
[7] Evans GP, Mollowney BM, Spoel NC. Two-dimensional modelling of the BristolChannel, UK. In: Spaulding ML, editor. Proceedings of the conference onestuarine and coastal modelling; 1990. p. 331–40.
[8] Uncles RJ, Jordan MB. Measurements of tidal currents and estimated energyfluxes in the Bristol Channel. In: Beven KJ, editor. Mixing and transport in theenvironment. Chichester, UK: John Wiley; 1984. p. 221–45.
[9] Amin M, Flather RA. Investigation into the possibilities of using BristolChannel models for tidal predictions. In: Spaulding ML, Cheng RT, editors.Proceedings of the 4th international conference on estuarine and coastalmodelling; 1995. p. 41–52.
[10] Barber RW, Scott RJ. Numerical modelling of tidal propagation in the SevernEstuary using a depth-adapted non-orthogonal grid. In: Rodriguez GR, et al.,editors. Environmental coastal regions III; 2000. p. 126–36.
[11] Kirby R, Shaw TL. Severn Barrage, UK – environmental reappraisal. Proceed-ings of the Institution of Civil Engineers, Engineering Sustainability 2005;158(ES1):31–9.
[12] Harris EL, Falconer RA, Lin B. Modelling hydroenvironmental and health riskassessment parameters along the South Wales Coast. Journal of Environ-mental Management 2004;73:61–70.
[13] Xia JQ, Falconer RA, Lin BL, Wang GQ. Modelling floods routing on initially drybeds with the refined treatment of wetting and drying. EnvironmentalModelling & Software; under review.
[14] Godunov SK. A difference method for the numerical calculation of discon-tinuous solutions of hydrodynamic equations. In: Matemsticheskly Sboraik,vol. 47. US Joint Publications Research Service; 1959.
J. Xia et al. / Renewable Energy 35 (2010) 1455–1468 1467

Author's personal copy
[15] Roe PL. Approximate Riemann solvers, parameter vectors and differenceschemes. Journal of Computational Physics 1981;43:357–72.
[16] Osher S, Solomone F. Upwind difference schemes for hyperbolic systems ofconservation laws. Mathematics of Computation 1982;38:339–74.
[17] Sleigh PA, Gaskell PH, Berzins M, Wright NG. An unstructured finite-volumealgorithm for predicting flow in rivers and estuaries. Computers and Fluids1998;27(4):479–508.
[18] Falconer RA, Chen Y. An improved representation of flooding and drying andwind stress effects in a 2D tidal numerical model. Proceedings of the Insti-tution of Civil Engineers (Part 2) 1991;2:659–72.
[19] Sanders BF. Non-reflecting boundary flux function for finite volume shallow-water models. Advances in Water Resources 2002;25:195–202.
[20] Xia JQ, Lin BL, Falconer RA, Wu BS. An unstructured finite volume algorithmfor predicting man-made flood routing in the Lower Yellow River. In:Proceedings of the BHS 10th national hydrology symposium. British
Hydrological Society, ISBN 1-903741-16-5; 2008. p. 289–95, www.hydrology.org.uk/Publications/exeter/45.pdf; 2008.
[21] Kashefipour SM, Lin B, Harris E, Falconer RA. Hydro-environmental modellingfor bathing water compliance of an estuarine basin. Water Research2002;36:1854–68.
[22] Proudman Oceanographic Laboratory (POL). POLPRED for Windows userguide. POL; 2004. 1–62.
[23] Falconer RA, Lin BL, Kashefipour SM. Modelling water quality processes inestuaries. In: Bates PD, Ferguson R, Lane S, editors. Computational fluidmechanics: applications in environmental hydraulics. John Wiley & Sons Ltd;2005. p. 305–28.
[24] Garrett C, Greenberg DA. Predicting changes in tidal regime: the openboundary problem. Journal of Physical Oceanography 1977;7:171–81.
[25] Greenberg DA. A numerical model investigation of tidal phenomena in the Bayof Fundy and Gulf of Maine. Marine Geodesy 1979;2:161–87.
J. Xia et al. / Renewable Energy 35 (2010) 1455–14681468
Related Documents


![Sensitivity of tidal lagoon and barrage hydrodynamic ...Lake Sihwa tidal power station in South Korea [8]. Contrary to their successful performance for sustainable and predictable](https://static.cupdf.com/doc/110x72/5f4c40969efdd42ffc01008b/sensitivity-of-tidal-lagoon-and-barrage-hydrodynamic-lake-sihwa-tidal-power.jpg)