561 Physical Geography, 2011, 32, 6, pp. 561–582. http://dx.doi.org/10.2747/0272-3646.32.6.561 Copyright © 2011 by Bellwether Publishing, Ltd. All rights reserved. HYDROCLIMATOLOGY OF THE U.S. GULF COAST UNDER GLOBAL CLIMATE CHANGE SCENARIOS Barry D. Keim and Royce Fontenot 1 Department of Geography and Anthropology Louisiana State University Baton Rouge, Louisiana 70803 Claudia Tebaldi Climate Central One Palmer Square, Suite 330 Princeton, New Jersey 08542 David Shankman Department of Geography University of Alabama Tuscaloosa, Alabama 35487 Abstract: The historical climate record and climate change scenarios of the north-central Gulf of Mexico Coast (roughly from Houston, Texas to Mobile, Alabama) was examined to assess past and future temperature and hydrology of the region. Historical temperature data show an annual temperature pattern with high values in the 1920s–1940s, a drop in annual temperatures in late 1950s, persisting through the 1970s, and then an increase over the past two-plus decades. However, recent temperatures have mostly not reached the highs of previous decades. Annual precipitation is generally increasing, with some climate divi- sions, in particular those in Mississippi and Alabama, having significant long-term trends. Over the entire record since 1919, there was an increase in rainfall, and that, combined with relatively cool temperatures, led to a 36% increase in runoff. To assess future extremes in regional hydroclimatology, the A1B and B1 emission scenarios were examined for the region. Output from an ensemble of 21 global climate models run with the two emission scenarios indicates a wide range of possible climates in the mid-21st century, centered on the year 2050. The models suggest a warmer Gulf Coast region of about 1.5°C ± 1°C. Precipitation projections are more uncertain, with conflicting increases and decreases pro- jected by the various models, although most suggest a decrease in annual rainfall across the Gulf Coast. By compounding changing precipitation with increasing temperatures, overall runoff is likely to remain the same or decrease, while deficits (or droughts) could become less severe because of possible increases in summer and autumn precipitation. Impacts to the natural landscape (geomorphology and ecology) would likely be negligible. [Key words: hydroclimatology, climate change, Gulf Coast, runoff, drought, Thornthwaite model.] INTRODUCTION The north-central Gulf Coast of the United States was selected by the United States Department of Transportation as a test case for planning in the face of climate 1 Current address: Lower Mississippi River Forecast Center, Slidell, Louisiana 70460.

Welcome message from author
This document is posted to help you gain knowledge. Please leave a comment to let me know what you think about it! Share it to your friends and learn new things together.
Transcript
561
Physical Geography, 2011, 32, 6, pp. 561–582. http://dx.doi.org/10.2747/0272-3646.32.6.561Copyright © 2011 by Bellwether Publishing, Ltd. All rights reserved.
HYDROCLIMATOLOGY OF THE U.S. GULF COAST UNDER GLOBAL CLIMATE CHANGE SCENARIOS
Barry D. Keim and Royce Fontenot1
Department of Geography and Anthropology Louisiana State University
Baton Rouge, Louisiana 70803
Claudia TebaldiClimate Central
One Palmer Square, Suite 330 Princeton, New Jersey 08542
David ShankmanDepartment of Geography
University of Alabama Tuscaloosa, Alabama 35487
Abstract: The historical climate record and climate change scenarios of the north- central Gulf of Mexico Coast (roughly from Houston, Texas to Mobile, Alabama) was examined to assess past and future temperature and hydrology of the region. Historical temperature data show an annual temperature pattern with high values in the 1920s–1940s, a drop in annual temperatures in late 1950s, persisting through the 1970s, and then an increase over the past two-plus decades. However, recent temperatures have mostly not reached the highs of previous decades. Annual precipitation is generally increasing, with some climate divi-sions, in particular those in Mississippi and Alabama, having significant long-term trends. Over the entire record since 1919, there was an increase in rainfall, and that, combined with relatively cool temperatures, led to a 36% increase in runoff. To assess future extremes in regional hydroclimatology, the A1B and B1 emission scenarios were examined for the region. Output from an ensemble of 21 global climate models run with the two emission scenarios indicates a wide range of possible climates in the mid-21st century, centered on the year 2050. The models suggest a warmer Gulf Coast region of about 1.5°C ± 1°C. Precipitation projections are more uncertain, with conflicting increases and decreases pro-jected by the various models, although most suggest a decrease in annual rainfall across the Gulf Coast. By compounding changing precipitation with increasing temperatures, overall runoff is likely to remain the same or decrease, while deficits (or droughts) could become less severe because of possible increases in summer and autumn precipitation. Impacts to the natural landscape (geomorphology and ecology) would likely be negligible. [Key words: hydroclimatology, climate change, Gulf Coast, runoff, drought, Thornthwaite model.]
INTRODUCTION
The north-central Gulf Coast of the United States was selected by the United States Department of Transportation as a test case for planning in the face of climate
1Current address: Lower Mississippi River Forecast Center, Slidell, Louisiana 70460.

562 KEIM ET AL.
change. The region selected, roughly from Houston, Texas to Mobile, Alabama (Fig. 1), is important to the nation with regard to the oil and gas industry, strategic port facilities, abundant fisheries, and tourism, and the built environment rests within dynamic and biologically productive wetland environments. Climate change in this region could have dramatic impacts on the built infrastructure as well as on these fragile ecosystems through changes in the hydroclimatology. Regarding the trans-portation infrastructure, for example, roadbeds for highways desiccate and dete-riorate during periods of drought. Conversely, road surfaces are often inundated during periods of heavy rainfall and flash flooding, and bridges are compromised during extreme river basin floods. Therefore, some understanding of past and future droughts and floods is imperative for purposes of planning (e.g., see Svoma and Balling, 2010).
This paper assesses change in the hydroclimatology over the instrumental climate record, as well as how the regional climate may change in the future according to an ensemble of state-of-the-art general circulation models (GCMs). The GCMs used here are also used in the latest Intergovernmental Panel on Climate Change (IPCC) report for future projections at global and regional scales (Christensen et al., 2007; IPCC, 2007; Meehl et al., 2007b). Keim et al. (1995) focused on the hydroclimatology of the region and found that runoff had increased over time in Louisiana, resulting from an increasing trend in precipitation and relatively lower temperatures in more recent decades. Grundstein (2009) also found significantly wetter conditions in much of the eastern United States, including portions of the Central Gulf Coast. However, these papers did not examine climate change scenarios, nor did they examine impacts of climate extremes, which tend to have greater implications for the built and natural environment. Looking beyond changes in global mean temperature signals is criti-cal to better address societally relevant questions at appropriate geographical scales (i.e., regional) for temperatures and other climatic variables, in particular precipita-tion, and then assess impacts to the hydrology.
DATA AND SCOPE
The north-central Gulf Coast is one of wettest regions in the United States, with annual rainfall averages over 1500 mm per year (NOAA, 2002). This rainfall has little seasonality, yet with slightly higher rainfall values in spring and summer relative to fall and winter. The topography of the region is relatively flat, rising only tens of meters above mean sea level in higher locations.
For examination of change in both the historical record and analysis of climate change scenarios, the baseline climatology is built around climatic data from the United States Climate Division datasets (CDDs) (Guttman and Quayle, 1996) and the United States Historical Climate Network (USHCN) (Karl et al., 1990; Easterling et al., 1996). Because CDDs are used in a portion of this analysis, caution needs to be taken with data from 1905–1930, which are generated from statewide data as described by Guttman and Quayle (1996).
Historical trends and variability are analyzed for temperature and precipitation at the CDD level for the climate divisions along the Gulf Coast from southeast-ern Texas to the coast of Alabama, including Texas Climate Division 8, Louisiana

GULF COAST HYDROCLIMATOLOGY 563
Divisions 6–9, Mississippi Division 10, and Alabama Division 8 (Figs. 1 and 2). Because Keim et al. (2003) showed that CDD can have spurious temperature trends, this analysis generates CDDs consisting of averages of stations within each division from the USHCN FILNET dataset (Table 1). USHCN data are excellent for this pur-pose because stations were selected based on length and quality of data. In addition, these data have undergone numerous quality assurances and adjustments to best
Fig. 1. Temperature variability from 1905 to 2003 for the seven climate divisions constituting the Gulf Coast region.

564 KEIM ET AL.
characterize the actual variability in climate, including time of observation bias (Karl et al., 1986), changes in instrumentation (Quayle et al., 1991), random relocations of stations (Karl and Williams, 1987), and urban warming biases (Karl et al., 1988). Furthermore, missing data are estimated from surrounding stations to produce a nearly continuous data set for each station.
Monthly averages from the USHCN stations, from 1905 to 2003 within each climate division, are then averaged for each division by month and year. Data were organized in this fashion to provide some geographical weighting to the various regions, despite the differing number of USHCN stations available within each
Fig. 2. Precipitation variability from 1905 to 2003 for the seven climate divisions constituting the Gulf Coast region.

GULF COAST HYDROCLIMATOLOGY 565
climate division. The year 1905 begins a common period of record for all but one of the USHCN stations utilized in the study. The exception is Fairhope, Alabama, the only USHCN station available in Alabama Climate Division 8, where data begin in 1919. Only USHCN FILNET stations with a continuous monthly record of tempera-ture from January 1905 through December 2003 were included in the analysis, with the exception of Fairhope. The data were not brought further to date because some of the USHCN station records have gaps in the more recent record or quit report-ing altogether, especially after the region suffered the ravages of Hurricane Ivan in 2004, and Hurricanes Dennis, Katrina, and Rita in 2005. USHCN precipitation data were not as serially complete as temperature and there were even fewer stations available. As a result, this study incorporated the National Climate Data Center–generated CDD for precipitation. This decision seems reasonable given results of Keim et al. (2005) and Allard et al. (2009), which both showed that the redistribution of stations within a climate division had less severe impacts on precipitation than on temperature, and that impacts were less in the southeastern United States than in the northeastern United States.
WATER BALANCE MODEL
The primary tool used to investigate the regional hydroclimatology is a modified Thornthwaite Water Balance Model, first introduced by Thornthwaite (1948). This model, despite its age, is still widely used in modern applied climate studies (Keim, 2010) and is recommended for assessments of climate change (Gleick, 1986a, 1986b). The Thornthwaite model is simply an accounting of hydroclimatological inputs and outputs (Mather, 1978). We used updated equations by Dingman (2002) to simulate hydrological interactions in subfreezing temperatures.
Monthly values of temperature and precipitation are entered into the budget, and potential evapotranspiration—called reference evapotranspiration—is generated, as well as rain/snow ratios, soil moisture, soil moisture deficits, and runoff. The model
Table 1. USHCN Stations within the Seven Climate Divisions of the Gulf Coast Region
Climate division USHCN stations
Texas CD 8 Danevang, Liberty
Louisiana CD Jenningsa
Louisiana CD 8 Franklin, Lafayette
Louisiana CD 9 Donaldsonville, Houma, New Orleans, Thibodaux
Louisiana CD 6 Amite, Baton Rouge, Covington
Mississippi 10 Pascagoula, Poplarville, Waveland
Alabama CD 8 Fairhope
aThe Jennings climate record only dates back to the late 1960s. As a result, LA-CD 7 consissts of an average of Liberty, TX to the west and Lafayette, LA to the east.
566 KEIM ET AL.
is therefore appropriate for use in this study, as the climate-change scenario output data are also temperature and precipitation only. Hydrologic models that require input of additional, more sophisticated data (i.e., humidity levels) could not have been implemented in this study.
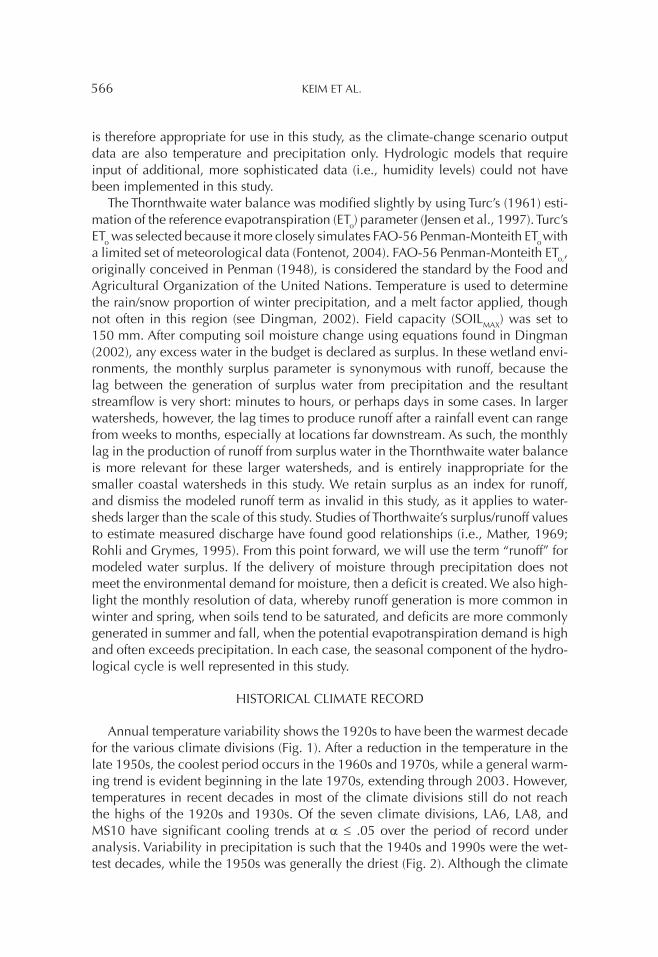
The Thornthwaite water balance was modified slightly by using Turc’s (1961) esti-mation of the reference evapotranspiration (ETo) parameter (Jensen et al., 1997). Turc’s ETo was selected because it more closely simulates FAO-56 Penman-Monteith ETo with a limited set of meteorological data (Fontenot, 2004). FAO-56 Penman-Monteith ETo,, originally conceived in Penman (1948), is considered the standard by the Food and Agricultural Organization of the United Nations. Temperature is used to determine the rain/snow proportion of winter precipitation, and a melt factor applied, though not often in this region (see Dingman, 2002). Field capacity (SOILMAX) was set to 150 mm. After computing soil moisture change using equations found in Dingman (2002), any excess water in the budget is declared as surplus. In these wetland envi-ronments, the monthly surplus parameter is synonymous with runoff, because the lag between the generation of surplus water from precipitation and the resultant streamflow is very short: minutes to hours, or perhaps days in some cases. In larger watersheds, however, the lag times to produce runoff after a rainfall event can range from weeks to months, especially at locations far downstream. As such, the monthly lag in the production of runoff from surplus water in the Thornthwaite water balance is more relevant for these larger watersheds, and is entirely inappropriate for the smaller coastal watersheds in this study. We retain surplus as an index for runoff, and dismiss the modeled runoff term as invalid in this study, as it applies to water-sheds larger than the scale of this study. Studies of Thorthwaite’s surplus/runoff values to estimate measured discharge have found good relationships (i.e., Mather, 1969; Rohli and Grymes, 1995). From this point forward, we will use the term “runoff” for modeled water surplus. If the delivery of moisture through precipitation does not meet the environmental demand for moisture, then a deficit is created. We also high-light the monthly resolution of data, whereby runoff generation is more common in winter and spring, when soils tend to be saturated, and deficits are more commonly generated in summer and fall, when the potential evapotranspiration demand is high and often exceeds precipitation. In each case, the seasonal component of the hydro-logical cycle is well represented in this study.
HISTORICAL CLIMATE RECORD
Annual temperature variability shows the 1920s to have been the warmest decade for the various climate divisions (Fig. 1). After a reduction in the temperature in the late 1950s, the coolest period occurs in the 1960s and 1970s, while a general warm-ing trend is evident beginning in the late 1970s, extending through 2003. However, temperatures in recent decades in most of the climate divisions still do not reach the highs of the 1920s and 1930s. Of the seven climate divisions, LA6, LA8, and MS10 have significant cooling trends at α ≤ .05 over the period of record under analysis. Variability in precipitation is such that the 1940s and 1990s were the wet-test decades, while the 1950s was generally the driest (Fig. 2). Although the climate

GULF COAST HYDROCLIMATOLOGY 567
division data indicate long-term patterns of increasing rainfall, only MS10 and AL8 had increases that are significant at α ≤ 0.05.
Data for each of the seven climate divisions were amalgamated into a regional dataset for the north-central Gulf Coast, by month, and the continuous monthly water balance model was run. Clearly, there is local or subregional variability inher-ent in the regional data that is not captured in this analysis. As such, input and output data from the model should be interpreted as a regional generalization.
In a typical year, ETo is low in winter and early spring, and most rainfall is converted to runoff because soil moisture storage remains at, or near, capacity. As temperatures rise in late spring and early summer and the number of hours of daylight increases, ETo also increases. ETo will often exceed rainfall in July, August, and September, which leads to soil moisture utilization, on the average. Then in late fall, precipita-tion often exceeds ETo, leading to recharge of soil moisture.
Regional trends in model-derived runoff, accumulated by month for each year, show large inter-annual variability with relatively high values in the 1940s and from 1975 to 2003 (Fig. 3). Despite the variability, a long-term trend was detected in the data at α ≤ 0.05. Moisture deficits show high values from the mid-1940s through the mid-1960s, with 1998–2000 also high, but with no long-term trend (Fig. 3).
GCM ENSEMBLE OF CLIMATE CHANGE SCENARIOS
Two climate change scenarios were computed for the north-central Gulf Coast region on the basis of GCM output at the grid points (land areas only) shown in Fig-ure 4. The scope of these grid points represents the north-central Gulf Coast region, but at a scale somewhat larger than that depicted in our historical analysis. Change in GCM values from grid point to grid point across earth, however, generally occurs gradually. Thus, we feel that these GCM data reflect output for our specific region, while we ensure that we consider output from these large-scale models consistent with their expected skill, which is expected to be greater over larger rather than very limited regions.
Fig. 3. Inter-annual variability in model-derived surplus (runoff) and deficit accumulated annually from 1919 to 2003 for the Gulf Coast region, with trends lines on each.

568 KEIM ET AL.
Projections of temperature and precipitation change for this region for the middle of the 21st century are presented in the form of probability density functions (PDFs) by applying the method of Tebaldi et al. (2004, 2005) for scenarios A1B (mid-range emission scenario) and B1 (low emissions scenario) (Nakicenovic et al., 2000). These two specific scenarios were selected for analysis by the United States Department of Transportation. Each of these scenarios assumes that society will evolve along a future path characterized by a certain level of future energy use, use of emissions sources, technology changes, and environmental awareness. For example, the A1B scenario has balance across all energy sources, meaning it does not rely too heavily on any one particular future energy source and mixes fossil fuels and clean, renew-able sources. It is therefore based on the assumption that improvement rates apply to all energy sources and end-use technologies. The B1 scenario assumes a high level of social and environmental awareness, including an increase in resource efficiency and diffusion of cleaner technologies, making it a more conservative scenario than A1B (Nakicenovic et al., 2000).
Data forming the basis of the PDF estimation shown in Figures 5 and 6 are an ensemble of historical and future climate simulations (from which temperature and precipitation are extracted) by all the GCMs that contributed to the IPCC 2007 Assessment Report, forming the Coupled Model Intercomparison Project (CMIP3) archive (Meehl et al., 2007a). Output from 21 different models (Table 2) is available in the CMIP3 archive for the two scenarios chosen. Area averages of temperature and precipitation projections were extracted from each model/scenario combina-tion, over the four seasons, and over two 20-year periods, one representative of the modern climatology (1980–1999) and one representative of the future mid-century time period (2040–2059), referred to from this point forward as 2050. This period was selected because it represents the time horizon relevant to planning for the
Fig. 4. Grid area for the Gulf Coast GCM projections.

GULF COAST HYDROCLIMATOLOGY 569
United States Department of Transportation. Thus projections of “change” should be interpreted with respect to these two time periods and are conditional on the scenarios A1B and B1.
The statistical procedure synthesizes the multi-model ensemble of projections into a PDF by applying a Bayesian hierarchical model. Both observations and mod-eled temperature and precipitation are synthesized in the final estimate of PDFs. At the core of the method is the idea that different models have different reliabilities in simulating climate over the region and the final probabilistic representation of climate change should reflect that, by weighting more those models that agree better with observations, and discounting models with larger biases. In its initial concep-tion, the statistical treatment also rewarded convergence of the different models when considering future trajectories, weighting more those models that agree with one another and downweighting outliers. In the version of the statistical procedure applied here (described in Tebaldi et al., 2004), the convergence criterion is dis-counted, ensuring that even model projections that disagree with the consensus inform the shape of the final PDFs.
Thus, we prefer a method that produces conservative estimates of the uncertainty by allowing outliers among model projections to shape our future probabilities of climate change. The result of applying the statistical analysis to the GCM output are PDFs of temperature (as absolute values of change in °C) and precipitation change (as percent change with respect to historical precipitation averages) from which any percentile can be straightforwardly derived. Challenges of interpreting multi-GCM
Fig. 5. Probability density functions for seasonal temperature change (in °C) in the U.S. Gulf Coast region for the mid-21st century centered on 2050 using the A1B scenario.

570 KEIM ET AL.
model results are discussed in Tebaldi and Knutti (2007) and Knutti et al. (2010). A refinement to the statistical model used here is described in Smith et al. (2009).
EXTREME VALUE ANALYSIS
Because extremes are important to both wetland ecology and to the transporta-tion sector, we examine monthly extremes of precipitation, runoff, and deficit in the north-central Gulf Coast. The efficacy of GCMs in analyzing future climatologies of extreme events is still under debate. The problem is that GCMs do not resolve specific weather event types very well, e.g., hurricanes or thunderstorms (Broccoli and Manabe, 1990; Henderson-Sellers et al., 1998; Keim et al., 2004; Tebaldi et al., 2006), because of the fine-scale structures of the events that cannot be effectively represented at the level of discretization in space that these models typically adopt when computing finite difference equations (the median resolution of this generation of GCMs is about 250 km in the horizontal dimension and 1000 m in the vertical). As such, this analysis examines monthly extremes, without analyzing shorter- duration specific weather event types, i.e., thunderstorms, heat waves, or hurricanes.
Measured data from the period 1971–2000 serves as the baseline climatology for the hydroclimatic variables. Using water balance output for this 30-year period, partial duration series (PDS) are generated for the three variables: precipitatation, runoff, and deficit. A PDS includes the number of events (monthly extremes) equal to the number of years under examination (Dunne and Leopold, 1978). As such, the 30 largest monthly totals of precipitation, runoff, and deficit are extracted from each
Fig. 6. Probability density functions for seasonal precipitation change (in percent) in the U.S. Gulf Coast region for the mid-21st century centered on 2050 using the A1B scenario.
GULF COAST HYDROCLIMATOLOGY 571
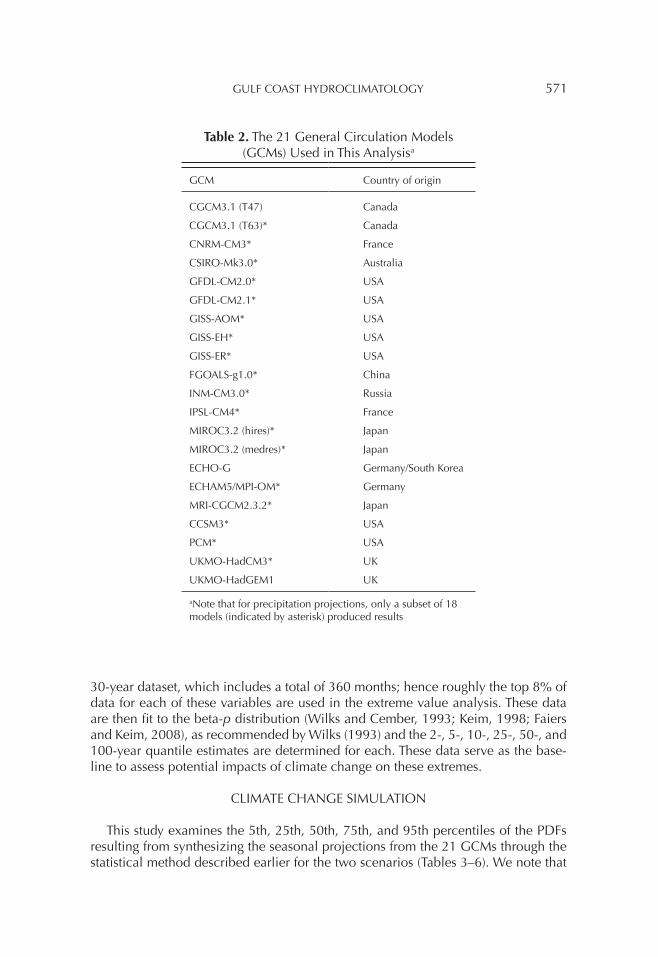
30-year dataset, which includes a total of 360 months; hence roughly the top 8% of data for each of these variables are used in the extreme value analysis. These data are then fit to the beta-p distribution (Wilks and Cember, 1993; Keim, 1998; Faiers and Keim, 2008), as recommended by Wilks (1993) and the 2-, 5-, 10-, 25-, 50-, and 100-year quantile estimates are determined for each. These data serve as the base-line to assess potential impacts of climate change on these extremes.
CLIMATE CHANGE SIMULATION
This study examines the 5th, 25th, 50th, 75th, and 95th percentiles of the PDFs resulting from synthesizing the seasonal projections from the 21 GCMs through the statistical method described earlier for the two scenarios (Tables 3–6). We note that
Table 2. The 21 General Circulation Models (GCMs) Used in This Analysisa
GCM Country of origin
CGCM3.1 (T47) Canada
CGCM3.1 (T63)* Canada
CNRM-CM3* France
CSIRO-Mk3.0* Australia
GFDL-CM2.0* USA
GFDL-CM2.1* USA
GISS-AOM* USA
GISS-EH* USA
GISS-ER* USA
FGOALS-g1.0* China
INM-CM3.0* Russia
IPSL-CM4* France
MIROC3.2 (hires)* Japan
MIROC3.2 (medres)* Japan
ECHO-G Germany/South Korea
ECHAM5/MPI-OM* Germany
MRI-CGCM2.3.2* Japan
CCSM3* USA
PCM* USA
UKMO-HadCM3* UK
UKMO-HadGEM1 UK
aNote that for precipitation projections, only a subset of 18 models (indicated by asterisk) produced results

572 KEIM ET AL.
the 50th percentile corresponds to the center of the distribution, given the regular symmetric shape of these PDFs, whereas the 5th and 95th percentiles represent the margins of the PDF.
As a general rule, the GCMs in the A1B and B1 scenarios are predicting a warmer north-central Gulf Coast region, with the greatest increase in temperature occur-ring, surprisingly, in summer when variability is considerably less than in winter, with minimal increases in winter (Tables 3 and 5); these results are consistent with findings reported in IPCC Assessment Report 4–Working Group 1 (Christensen et al., 2007). The 5th percentile even shows some modest winter cooling in the B1 scenario. The models, however, are inconsistent regarding precipitation. For both scenarios, the 5th percentile depicts reductions in precipitation in all seasons, up to 36% and 27% in summer, for A1B and B1, respectively (Tables 4 and 6). The 50th percentile shows only modest changes to precipitation, with three of four seasons showing small reductions in both scenarios. The 75th and 95th percentiles show increases in precipitation for all seasons. At the 75th percentile, the season with the largest projected change is autumn in both the A1B and B1 scenarios, while at the 95th, the largest projected changes are in summer in both scenarios.
Because the two scenarios demonstrate a large degree of similarity—a well-known feature of projections by the mid-term of the century caused by the inertia of the system responding to different forcings that diverge only gradually from the end of the 20th century—the A1B scenario is retained for further analysis because it shows slightly greater levels of regional change. Therefore, to determine potential changes
Table 3. Predicted Temperature Change from a Suite of GCMs for the 5th, 25th, 50th, 75th, and 95th Percentiles for the A1B Scenario for Mid-21st Century,
Centered on 2050 Relative to GCM-Derived 1980–1999 Means
5th 25th 50th 75th 95th
Winter 0.18 0.95 1.42 1.89 2.56
Spring 1.22 1.55 1.80 2.04 2.38
Summer 1.24 1.66 1.94 2.23 2.70
Autumn 1.31 1.69 1.93 2.22 2.62
Table 4. Predicted Precipitation Change (in percent) from a Suite of GCMs for the 5th, 25th, 50th, 75th, and 95th Percentiles for the A1B Scenario for Mid-21st
Century, Centered on 2050 Relative to GCM-Derived 1980–1999 Means
5th 25th 50th 75th 95th
Winter –13.30 –5.95 –1.79 2.49 9.01
Spring –21.07 –11.04 –5.04 1.80 10.17
Summer –36.10 –17.77 –6.39 6.25 26.24
Autumn –8.20 0.46 5.97 12.05 21.50

GULF COAST HYDROCLIMATOLOGY 573
to hydrological extremes across the region, paired percentiles (i.e., the 5th, 50th, and 95th) for temperature and precipitation from the A1B PDFs in Tables 3 and 4 (from Figs. 5 and 6) were used, as in Groves et al. (2008). The paired percentiles include the 5th percentile projections for both temperature and precipitation, the 50th for both temperature and precipitation, and the 95th combined. In addition, because the models generally suggest increasing temperatures and less precipitation across the region, a “worst case scenario” is developed that pairs the 5th percentile precipi-tation (dry) with the 95th temperature (large increases in temperature), which could lead to more intense and protracted drought conditions. In contrast, a “best-case scenario” is also developed, pairing the 95th percentile precipitation (wet) estimate with 5th percentile (modest) temperature increases. The terms best-case and worst-case are used loosely here because of the anticipated impacts on runoff and deficit, fully realizing that a 95th percentile estimate in precipitation could create a host of other problems involving trends in extreme storms (e.g., Karl et al., 1996; Keim, 1997). There is physical grounding for the worst-case (and best-case) scenario(s) in that temperatures generally trend upward during periods of deficient precipitation (and vice-versa). This could be particularly acute in summer, when the A1B scenario shows a possible (95th percentile) increase in temperature of 2.7°C and a possible (5th percentile) 36.1% decrease in precipitation. These paired percentiles examine most of the range of GCM output. In addition, we also analyze the middle of the PDF, or region under the curve, where there is most agreement between the models.
Table 5. Predicted Temperature Change from a Suite of GCMs for the 5th, 25th, 50th, 75th, and 95th Percentiles for the B1 Scenario for Mid-21st Century, Centered
on 2050 Relative to GCM-Derived 1980–1999 Means
5th 25th 50th 75th 95th
Winter –0.31 0.44 1.02 1.53 2.32
Spring 0.67 1.05 1.32 1.62 2.03
Summer 0.64 1.09 1.35 1.63 2.03
Autumn 0.62 1.04 1.33 1.62 2.07
Table 6. Predicted Precipitation Change (in percent) from a Suite of GCMs for the 5th, 25th, 50th, 75th, and 95th Percentiles for the B1 Scenario for Mid-21st
Century, Centered on 2050 Relative to GCM-Derived 1980–1999 Means
5th 25th 50th 75th 95th
Winter –9.77 –4.37 –0.52 3.36 9.51
Spring –16.94 –7.96 –2.94 2.41 11.38
Summer –27.06 –14.16 –3.36 7.43 24.19
Autumn –7.83 –0.06 5.63 11.13 19.40
574 KEIM ET AL.
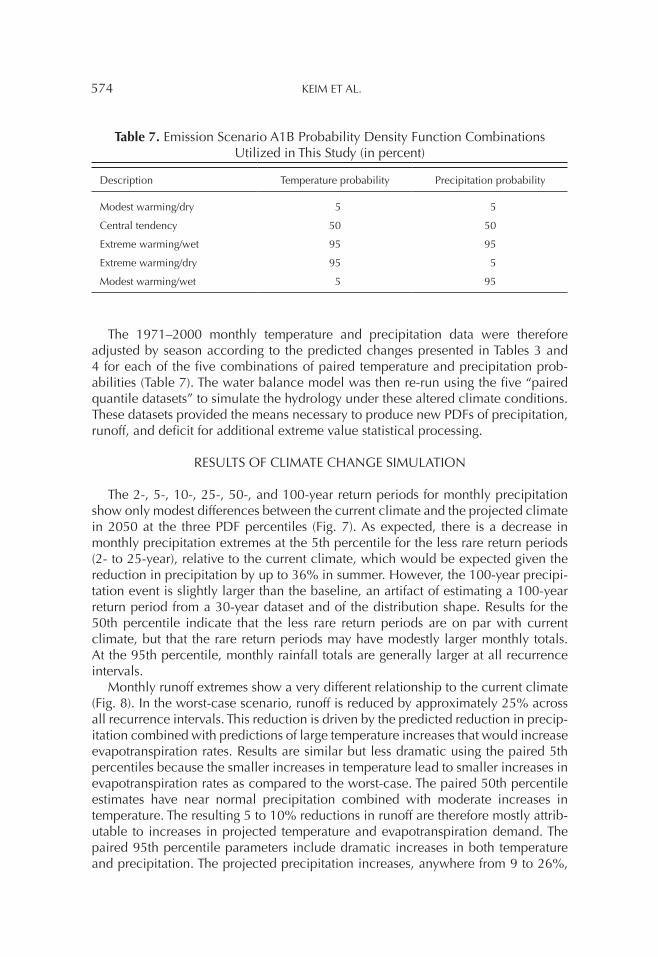
The 1971–2000 monthly temperature and precipitation data were therefore adjusted by season according to the predicted changes presented in Tables 3 and 4 for each of the five combinations of paired temperature and precipitation prob-abilities (Table 7). The water balance model was then re-run using the five “paired quantile datasets” to simulate the hydrology under these altered climate conditions. These datasets provided the means necessary to produce new PDFs of precipitation, runoff, and deficit for additional extreme value statistical processing.
RESULTS OF CLIMATE CHANGE SIMULATION
The 2-, 5-, 10-, 25-, 50-, and 100-year return periods for monthly precipitation show only modest differences between the current climate and the projected climate in 2050 at the three PDF percentiles (Fig. 7). As expected, there is a decrease in monthly precipitation extremes at the 5th percentile for the less rare return periods (2- to 25-year), relative to the current climate, which would be expected given the reduction in precipitation by up to 36% in summer. However, the 100-year precipi-tation event is slightly larger than the baseline, an artifact of estimating a 100-year return period from a 30-year dataset and of the distribution shape. Results for the 50th percentile indicate that the less rare return periods are on par with current climate, but that the rare return periods may have modestly larger monthly totals. At the 95th percentile, monthly rainfall totals are generally larger at all recurrence intervals.
Monthly runoff extremes show a very different relationship to the current climate (Fig. 8). In the worst-case scenario, runoff is reduced by approximately 25% across all recurrence intervals. This reduction is driven by the predicted reduction in precip-itation combined with predictions of large temperature increases that would increase evapotranspiration rates. Results are similar but less dramatic using the paired 5th percentiles because the smaller increases in temperature lead to smaller increases in evapotranspiration rates as compared to the worst-case. The paired 50th percentile estimates have near normal precipitation combined with moderate increases in temperature. The resulting 5 to 10% reductions in runoff are therefore mostly attrib-utable to increases in projected temperature and evapotranspiration demand. The paired 95th percentile parameters include dramatic increases in both temperature and precipitation. The projected precipitation increases, anywhere from 9 to 26%,
Table 7. Emission Scenario A1B Probability Density Function Combinations Utilized in This Study (in percent)
Description Temperature probability Precipitation probability
Modest warming/dry 5 5
Central tendency 50 50
Extreme warming/wet 95 95
Extreme warming/dry 95 5
Modest warming/wet 5 95

GULF COAST HYDROCLIMATOLOGY 575
depending on season, neutralize the impact of the higher temperatures and lead to little or no overall change in the extreme runoff regime. The best-case scenario rep-resents the same precipitation regime, but with less dramatic increases in tempera-ture, leading to only modest increases in runoff over the baseline, although these increases are somewhat more pronounced at the 2- and 5-year return periods.
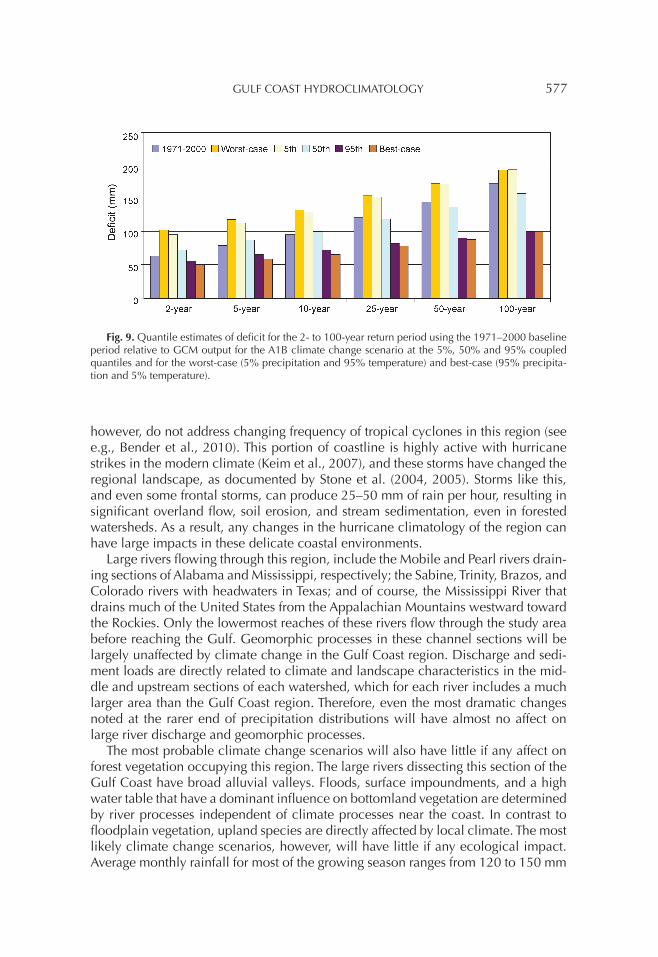
Extremes in monthly deficit show a more complex pattern between the quantiles and over the various return periods (Fig. 9). Note that deficit represents an atmo-spheric demand for moisture that is not met by the environment. Therefore, deficit represents environmental stress due to a lack of available water and can be used as an index for drought potential. The worst-case scenario shows a 60% increase in moisture deficit in 2050 at the 2-year return period over the 1971–2000 base-line, due obviously to extreme reductions in precipitation combined with dramatic increases in temperature. However, the gap narrows between the projections and the baseline at more rare recurrence intervals. The paired 5th percentile parameters show a similar, though muted pattern as compared to the worst-case because of the less dramatic increases in projected temperature. Negligible reductions in precipita-tion at the 50th percentile do not appear to have dramatic impacts on deficit, even despite the temperature increases, as values remain similar to the baseline, espe-cially at less rare return periods (2- to 25-year). With the paired 95th percentiles, increases in temperature are more than offset by the dramatic increases in precipita-tion. Because deficits are generally produced in summer and autumn, and the pro-jected 95th percentile increases in precipitation during these seasons is dramatic at 26.2% and 21.5%, respectively, deficits are substantially reduced in their intensity. In fact, at the 100-year recurrence interval, the projected 2050 (mid-century) deficit is only about half the magnitude of the current climate. Results and interpretation are similar for the best-case scenario. In this latter case, results suggest that extreme drought impacts would not be the problem that they are today—e.g., a 100-year event in the future may only be as intense as a modern-day 10-year event, assuming
Fig. 7. Quantile estimates of precipitation for the 2- to 100-year return period using the 1971–2000 baseline period relative to GCM output for the A1B climate change scenario at the 5%, 50%, and 95% quartiles.

576 KEIM ET AL.
these scenarios (the combined 95th percentiles or the best case) were to play out into the future.
GEOMORPHOLOGICAL AND ECOLOGICAL IMPLICATIONS
The most likely climate change scenarios of some warming and less rainfall in coming decades may have only modest impacts on earth surface and ecological pro-cesses, which could be overshadowed by land use changes as reported by Cruise et al. (2010). Erosion and sediment transport in small and middle-size drainage basins are directly related to overland flow and stream discharge. In a humid region like this one, vegetation cover also plays an important role in geomorphic processes. Most erosion and deposition occur during extreme high rainfall and discharge events. In this region, high annual average precipitation supports luxuriant forests, underlain by a thick organic ground cover that largely stabilizes hill slopes. Also, this is a region of low relief and, except during extreme rainfall events, runoff and sediment transport are minimal. Projected changes in precipitation, especially near the 50th percentile, are unlikely to affect forest cover or lead to changes in runoff that would ultimately affect small stream sedimentation. Even toward the rarer (or drier) end of rainfall distributions, soil moisture should be adequate to support forest vegetation, though moisture stresses in summer could become more acute if the worst-case scenario, as defined in this study, were to play out. This hot and dry scenario dur-ing the growing season could adversely affect agricultural endeavors in the region, as well as have negative impacts in wetland environments, e.g., encouraging an affliction called brown marsh that is believed to be related to protracted drought, increased salinity levels, low input of fresh water, excessive heat and evaporation, etc. (Subudhi et al., 2008.) Further, moderate precipitation and low flow conditions generally have little effect on fluvial landforms. Another large unknown is how tropi-cal storms and hurricanes might be affected. The models used in this investigation,
Fig. 8. Quantile estimates of runoff for the 2- to 100-year return period using the 1971–2000 baseline period relative to GCM output for the A1B climate change scenario at the 5%, 50% and 95% coupled quartiles and for the worst-case (5% precipitation and 95% temperature) and best-case (95% precipitation and 5% temperature).
GULF COAST HYDROCLIMATOLOGY 577
however, do not address changing frequency of tropical cyclones in this region (see e.g., Bender et al., 2010). This portion of coastline is highly active with hurricane strikes in the modern climate (Keim et al., 2007), and these storms have changed the regional landscape, as documented by Stone et al. (2004, 2005). Storms like this, and even some frontal storms, can produce 25–50 mm of rain per hour, resulting in significant overland flow, soil erosion, and stream sedimentation, even in forested watersheds. As a result, any changes in the hurricane climatology of the region can have large impacts in these delicate coastal environments.
Large rivers flowing through this region, include the Mobile and Pearl rivers drain-ing sections of Alabama and Mississippi, respectively; the Sabine, Trinity, Brazos, and Colorado rivers with headwaters in Texas; and of course, the Mississippi River that drains much of the United States from the Appalachian Mountains westward toward the Rockies. Only the lowermost reaches of these rivers flow through the study area before reaching the Gulf. Geomorphic processes in these channel sections will be largely unaffected by climate change in the Gulf Coast region. Discharge and sedi-ment loads are directly related to climate and landscape characteristics in the mid-dle and upstream sections of each watershed, which for each river includes a much larger area than the Gulf Coast region. Therefore, even the most dramatic changes noted at the rarer end of precipitation distributions will have almost no affect on large river discharge and geomorphic processes.
The most probable climate change scenarios will also have little if any affect on forest vegetation occupying this region. The large rivers dissecting this section of the Gulf Coast have broad alluvial valleys. Floods, surface impoundments, and a high water table that have a dominant influence on bottomland vegetation are determined by river processes independent of climate processes near the coast. In contrast to floodplain vegetation, upland species are directly affected by local climate. The most likely climate change scenarios, however, will have little if any ecological impact. Average monthly rainfall for most of the growing season ranges from 120 to 150 mm
Fig. 9. Quantile estimates of deficit for the 2- to 100-year return period using the 1971–2000 baseline period relative to GCM output for the A1B climate change scenario at the 5%, 50% and 95% coupled quantiles and for the worst-case (5% precipitation and 95% temperature) and best-case (95% precipita-tion and 5% temperature).

578 KEIM ET AL.
(NOAA, 2002). A moderate decrease in growing season precipitation will have no effect on trees because these sites still have an annual soil moisture surplus. Most tree species will only be affected by a dramatic decrease in annual average precipi-tation, which is unlikely to occur.
Average conditions may not always be the major determinant of vegetation pat-terns. Regeneration for many trees is highly episodic, and regeneration may be dependent on extreme conditions. For some species, those with a narrow range of conditions necessary for regeneration, unusually favorable conditions such as above average rainfall, may be necessary for regeneration. Conversely, harsh conditions could lead to high mortality rates, particularly among young individuals that are not well established. However, the frequency of extreme events in coming decades is largely unknown.
SUMMARY AND CONCLUSIONS
The historical climate record of the past century, in addition to climate change scenarios, were examined to assess the past and future hydrology of the north-central Gulf Coast of the United States. The historical record of the region shows an annual temperature pattern with high values in the 1920s to 1940s, and a drop in annual temperatures in the late 1950s persisting through the 1970s. Annual temperatures then increased over the past two-plus decades, but still have mostly not reached the highs of previous decades. Annual precipitation depicts a pattern toward increasing annual values, with significant long-term trends in coastal Mississippi and Alabama. There is also a long-term trend of increasing modeled runoff regionwide. To assess future extremes in regional hydroclimatology, the A1B and B1 scenarios were exam-ined for the region. An ensemble of 21 models for each scenario indicates a wide range of possible climates during the mid-21st Century. The models agree to a warmer Gulf Coast region of about 1.5°C ± 1°C. Precipitation projections are mixed, which is common to many mid-latitude regions of the world (Meehl et al., 2007b), with indications of increases or decreases, but the models lean slightly toward reducing annual rainfall in the Gulf Coast. Analysis of hydrological extremes using extreme value statistics suggests that under the global climate change scenarios, monthly precipitation extremes should only change modestly. However, by compounding changing precipitation with increasing temperatures, regional runoff is likely to remain the same or decrease, while deficits (or droughts) are more likely to become less severe due primarily to increases in summer and autumn rainfall. Hence, the historical record shows this region as cooling and getting wetter, whereby the model results suggest warming with less rainfall. Nevertheless, impacts to the natural land-scape in this specific region do not appear great, especially if the future regional climate plays out more toward the consensus of GCM guidance. It is likely that more severe impacts from climate change would come with changes in extremes through changes in tropical cyclone frequency and/or intensity, rather than changes in the mean climatology of this region, and we stress that our analysis does not address this area of change, nor that of relative sea level rise. Very high subsidence rates over the past 50 years in parts of this region (Morton et al., 2005), combined with eustatic sea level rise, and land-loss issues would likely be more complicating to the
GULF COAST HYDROCLIMATOLOGY 579
transportation sector and the built infrastructure than regional change in the hydro-climatology under this global climate change scenario. We are also limiting our analysis to mid-term changes, while longer-term changes might intensify the effects of uncurbed greenhouse gas emissions.
REFERENCES
Allard, J., Keim, B. D., Chassereau, J. E., and Sathiaraj, D. (2009) Spuriously induced precipitation trends in the Southeast United States. Theoretical and Applied Climatology, doi:10.1007/s00704-008-0021-9.
Bender, M. A., Knutson, T. R., Tuleya, R. E., Sirutis, J. J., Vecchi, G. A., Garner, S. T., and Held, I. M. (2010) Modeled impact of anthropogenic warming on the frequency of intense Atlantic hurricanes. Science, Vol. 327, 454–458.
Broccoli, A. J. and Manabe, S. (1990) Can existing climate models be used to study anthropogenic changes in tropical cyclone climate. Geophysical Research Letters, Vol. 17, 1917–1920.
Christensen, J. H., Hewitson, B., Busuioc, A., Chen, A., Gao, X., Held, I., Jones, R., et al. (2007) Regional climate projections. In S. D. Solomon, M. Qin, Z. Manning, M. Chen, M. Marquis, K. B. Averyt, M. Tignor, and H. L. Miller, eds., Climate Change 2007: The Physical Science Basis. Contribution of Working Group I to the Fourth Assessment Report of the Intergovernmental Panel on Climate Change. Cambridge, UK: Cambridge University Press.
Cruise, J. F., Laymon, C. A., and Al-Hamdan, O. Z. (2010) Impact of 20 years of land cover change on the hydrology of streams in the southeastern United States. Jour-nal of the American Water Resources Association, Vol. 46, 1159–1170.
Dingman, S. L. (2002) Physical Hydrology, 2nd ed: Upper Saddle River, NJ: Prentice Hall.
Dunne, T. and Leopold, L. B. (1978) Water in Environmental Planning. San Francisco, CA: W. H. Freeman and Company.
Easterling, D. R., Karl, T. R., Mason, E. H., Hughes, P. Y., Bowman, D. P., Daniels, R. C., and Boden, T. A., eds. (1996) United States Historical Climatology Network (U.S. HCN) Monthly Temperature and Precipitation Data. Oak Ridge, TN: Car-bon Dioxide Information Analysis Center, Oak Ridge National Laboratory, ORNL/CDIAC-87, NDP- 019/R3.
Faiers, G. E and Keim, B. D. (2008) Variability in three-hour and twenty-four hour rainstorm ratios from coast to coast across the Southern United States. Journal of Hydrological Engineering, Vol. 13, 101–104.
Fontenot, R. (2004) An Evaluation of Reference Evapotranspiration Models in Loui-siana. Unpubl. M.N.S. thesis, Department of Geography and Anthropology, Loui-siana State University.
Gleick, P. H. (1986a) Methods for evaluating the regional hydrologic impacts of global climate changes. Journal of Hydrology, Vol. 88, 97–116.
Gleick, P. H. (1986b) Regional hydrologic consequences of increases in atmospheric CO2 and other trace gases. Climatic Change, Vol. 10, 137–161.

580 KEIM ET AL.
Groves, D. G., Yates, D., and Tebaldi, C. (2008) Developing and applying uncer-tain global climate change projections for regional water management planning. Water Resources Research, Vol. 44, W12413, doi:10.1029/2008WR006964.
Grundstein, A. (2009) Evaluation of climate change over the continental United States using a moisture index. Climatic Change, Vol. 93, 103–115.
Guttman, N. B. and Quayle, R. G. (1996) A historical perspective of U.S. climate divisions. Bulletin of the American Meteorological Society, Vol. 77, 293–303.
Henderson-Sellers, A., Zhang, H., Berz, G., Emanuel, K., Gray, W., Landsea, C., Holland, G., et al. (1998) Tropical cyclones and global climate change: A post-IPCC assessment. Bulletin of the American Meteorological Society, Vol. 79, 19–38.
Intergovernmental Panel on Climate Change (IPCC) (2007) Climate Change 2007—Synthesis Report. Cambridge, UK: Cambridge University Press.
Jensen, D. T., Hargreaves, G. H., Temesgen, B., and Allen, R. G. (1997) Computation of ETo under nonideal conditions. Journal of Irrigation and Drainage Engineering, Vol. 123, 394–400.
Karl, T. R., Diaz, H. F., and Kukla, G. (1988) Urbanization: Its detection and effect in the United States climate record. Journal of Climate, Vol. 1, 1099–1123.
Karl, T. R., Knight, R. W., Easterling, D. E., and Quayle, R. G. (1996) Indicies of climate change for the United States. Bulletin of the American Meteorological Society, Vol. 77, 279–292.
Karl, T. R. and Williams, C. W., Jr. (1987) An approach to adjusting climatological time series for discontinuous inhomogeneities. Journal of Climate and Applied Meteorology, Vol. 26, 1744–1763.
Karl, T. R., Williams, C. N., Jr., and Quinlan, F. T. (1990) United States Historical Climatology Network (HCN) Serial Temperature and Precipitation Data. Oak Ridge, TN: Carbon Dioxide Information and Analysis Center, Oak Ridge National Laboratory, ORNL/CDIAC-30, NDP-019/R1.
Karl, T. R., Williams, C. N., Jr., Young, P. J., and Wendland, W. M. (1986) A model to estimate the time of observation bias with monthly mean maximum, minimum, and mean temperatures for the United States. Journal of Climate and Applied Meteorology, Vol. 25, 145–160.
Keim, B. D. (1997) Preliminary analysis of the temporal patterns of heavy rainfall in the Southeastern United States. The Professional Geographer, Vol. 49, 94–104.
Keim, B. D (1998) Record precipitation totals from the coastal New England rain-storm of October 20–21, 1996. Bulletin of the American Meteorological Society, Vol. 79, 1061–1067.
Keim, B. D. (2010) The lasting scientific impact of the Thornthwaite water balance model. Geographical Review, Vol. 100, 295–300.
Keim, B. D., Faiers, G. E., Muller, R. A., Grymes, J. M., III, and Rohli, R. V. (1995) Long-term trends of precipitation and runoff in Louisiana, U.S.A. International Journal of Climatology, Vol. 15, 531–541.
Keim, B. D., Fisher, M. R., and Wilson, A. M. (2005) Are there spurious precipita-tion trends in the United States Climate Division database? Geophysical Research Letters, Vol. 32, L04702, doi:10.1029/2004GL021985, 2005.

GULF COAST HYDROCLIMATOLOGY 581
Keim, B. D., Muller, R. A., and Stone, G. W. (2004) Spatial and temporal variability of coastal storms in the North Atlantic Basin. Marine Geology, Vol. 20, 7–14.
Keim, B. D., Muller, R. A., and Stone, G. W. (2007) Spatiotemporal patterns and return periods of tropical storm and hurricane strikes from Texas to Maine. Journal of Climate, Vol. 20, 3498–3509.
Keim, B. D., Wilson, A. M., Wake, P., and Huntington, T. G. (2003) Are there spuri-ous temperature trends in the United States Climate Division database? Geophysi-cal Research Letters, Vol. 30, 1404, doi:10.1029/2002GL016295.
Knutti, R., Furrer, R., Tebaldi, C., Cermak, J., and Meehl, G. (2010) Challenges in combining projections from multiple climate models. Journal of Climate, Vol. 23, 2739–2758.
Mather, J. R. (1969) Factors of the climatic water balance over the Delmarva Penin-sula. Publications in Climatology, Vol. 22 (3), 1–129.
Mather, J. R. (1978) The Climatic Water Budget in Environmental Analysis. Lexington, MA: D. C. Heath and Company.
Meehl, G. A., Covey, C., Delworth, T., Latif, M., McAvaney, B., Mitchell, J., Stouffer, R., and Taylor, K. (2007a) The WCRP CMIP3 multimodel dataset. Bulletin of the American Meteorological Society, Vol. 88, 1383–1394.
Meehl, G. A., Stocker, T. F., Collins, W. D., Friedlingstein, P., Gaye, A. T., Gregory, J. M., Kitoh, A., et al. (2007b) Global climate projections. In S. D. Solomon, M. Qin, Z. Manning, M. Chen, M. Marquis, K. B. Averyt, M. Tignor, and H. L. Miller, eds., Climate Change 2007: The Physical Science Basis. Contribution of Work-ing Group I to the Fourth Assessment Report of the Intergovernmental Panel on Climate Change. Cambridge, UK and New York, NY: Cambridge University Press, 747–846.
Morton, R. A., Bernier, J. C., Barras, J. A., and Ferina, N. F (2005) Historical subsid-ence and wetland loss in the Mississippi Delta Plain. Gulf Coast Association of Geological Societies Transactions, Vol. 55, 555–571.
Nakicenovic, N., Alcamo, J., Davis, G., et al. (2000) IPCC Special Report on Emis-sions Scenario. Cambridge, UK and New York, NY: Cambridge University Press.
National Oceanographic and Atmospheric Administration (NOAA) (2002) Cli-matography of the United States No. 85. Asheville, NC: National Climatic Data Center.
Penman, H. L. (1948) Natural evaporation from open water, bare soil, and grass. Proceedings of the Royal Society of London. Series A, Mathematical and Physical Sciences, Vol. 193, 120–146.
Quayle, R. G., Easterling, D. R., Karl, T. R., and Hughes, P. Y. (1991) Effects of recent thermometer changes in the cooperative station network. Bulletin of the American Meteorological Society, Vol. 72, 1718–1724.
Rohli, R. V. and Grymes, J. M., III (1995) Differences between modeled surplus and USGS-measured discharge in lake Pontchartrain Basin, Louisiana. Journal of the American Water Resources Association, Vol. 31, 97–107.
Smith, R. L., Tebaldi, C., Nychka, D., and Mearns, L. O. (2009) Bayesian modeling of uncertainty in ensembles of climate models. Journal of the American Statistical Association, Vol. 102(485), 97–116.

582 KEIM ET AL.
Stone, G. W, Liu, B., Pepper, D. A., and Wang, P. (2004) The importance of extrat-ropical and tropical cyclones on the short-term evolution of barrier islands along the northern Gulf of Mexico, USA. Marine Geology, Vol. 210, 63–78.
Stone, G. W., Walker, N. D., Hsu, S. A., Babin, A., Liu, B., Keim, B. D., Teague, W., Mitchell, D., and Leben, R. (2005) Hurricane Ivan’s impacts along the northern Gulf of Mexico. EOS (Transactions, American Geophysical Union), Vol. 86(48), 497, 500–501.
Subudhi, P. K., Parami, N. P., Materne, M. D., and Harrison S. A. (2008) Genetic diversity in smooth cordgrass from brown marsh areas of Louisiana. Journal of Aquatic Plant Management, Vol. 46, 60–67.
Svoma, B. M. And Balling, R. C., Jr. (2010) United States’ interannual precipitation variability over the past century: Is variability increasing as predicted by models? Physical Geography, Vol. 31, 307–318.
Tebaldi, C., Hayhoe, K., Arblaster, J. M., and Meehl, G. A. (2006) Going to the extremes. Climatic Change, Vol. 79(3–4), 185–211.
Tebaldi, C. and Knutti, R. (2007) The use of the multi-model ensemble in prob-abilistic climate projections. Philosophical Transactions of the Royal Society— Mathematical Physical and Engineering Sciences, Vol. 365(1857), 2053–2075.
Tebaldi, C., Mearns, L. O., Nychka, D., and Smith, R. L. (2004) Regional probabili-ties of precipitation change: A Bayesian analysis of multimodel simulations. Geo-physical Research Letters, Vol. 31, L24213, doi:10.1029/2004GL021276.
Tebaldi, C., Smith, R. L., Nychka, D., and Mearns, L. O. (2005) Quantifying uncer-tainty in projections of regional climate change: A Bayesian approach to the analy sis of multimodel ensembles. Journal of Climate, Vol. 18, 1524–1540.
Thornthwaite, C. W. (1948) An approach toward a rational classification of climate. Geographical Review, Vol. 38, 55–94.
Turc, L. (1961) Evaluation des besoins en eau d’irrigation, evapotranspiration poten-tielle, formule climatique simplifee et mise a jour (An assessment of irrigation water needs, evapotranspiration potential, and a simple updated climate formula). Annales Agronomiques, Vol. 12, 13–49.
Wilks, D. S. (1993) Comparison of three-parameter probability distributions for representing annual and partial duration precipitation series. Water Resources Research, Vol. 29, 3543–3549.
Wilks, D. S. and Cember, R. P. (1993) Atlas of Precipitation Extremes for the North-eastern United States and Southeastern Canada. Ithaca, NY: Northeast Regional Climate Center, Publication No. RR 93-5.
Related Documents