RESEARCH ARTICLE 10.1002/2014WR015519 Hydroclimatic variables and acute gastro-intestinal illness in British Columbia, Canada: A time series analysis L. P. Galway 1 , D. M. Allen 2 , M. W. Parkes 3 , L. Li 4 , and T. K. Takaro 1 1 Faculty of Health Sciences, Simon Fraser University, Burnaby, British Columbia, Canada, 2 Department of Earth Sciences, Simon Fraser University, Burnaby, British Columbia, Canada, 3 School of Health Sciences, University of Northern British Columbia, Prince George, British Columbia, Canada, 4 Department of Medicine, University of Western Ontario, London, Ontario, Canada Abstract Using epidemiologic time series analysis, we examine associations between three hydrocli- matic variables (temperature, precipitation, and streamflow) and waterborne acute gastro-intestinal illness (AGI) in two communities in the province of British Columbia (BC), Canada. The communities were selected to represent the major hydroclimatic regimes that characterize BC: rainfall-dominated and snowfall domi- nated. Our results show that the number of monthly cases of AGI increased with increasing temperature, precipitation, and streamflow in the same month in the context of a rainfall-dominated regime, and with increasing streamflow in the previous month in the context of a snowfall-dominated regime. These results suggest that hydroclimatology plays a role in driving the occurrence and variability of AGI in these settings. Further, this study highlights that the nature and magnitude of the effects of hydroclimatic variability on AGI are different in the context of a snowfall-dominated regime versus a rainfall-dominated regimes. We conclude by proposing that the watershed may be an appropriate context for enhancing our understanding of the complex linkages between hydroclimatic variability and waterborne illness in the context of a chang- ing climate. 1. Introduction Our knowledge of the links among climate change, water, and human health is particularly limited. This knowledge gap is disconcerting given that water is a primary medium through which climate change will impact ecosystem function and ultimately human health and well being. Examining historical relationships between hydroclimatic variables and water-related health endpoints is an essential first step toward advancing our knowledge of the potential future impacts of climate change on health [Rose and Grimes, 2001; Charron et al., 2004; Harper et al., 2011]. This can be achieved using epidemiological research and study designs such as time series analyses, which identify associations between current and past hydrocli- matic variation and population level patterns of disease [McMichael, 2003]. Like many other infectious diseases that are considered sensitive to climate change, sporadic waterborne acute gastro-intestinal illness (AGI) exhibits seasonality, suggesting that hydroclimatic factors may play a role in driving illness occurrence, trends, and risk [McMichael, 2004; World Health Organization, 2004; Lal et al., 2012]. Research suggests that distinct seasonal patterns documented across different settings of the world may be attributable in part to the heterogeneity of regional and local hydroclimatology [Lal et al., 2012]. Interestingly, research in settings where hydroclimatic variability is limited, both within and across years, has documented limited variation in AGI rates over time, lending further support to the hypothesis that hydroclimatic variability plays a part in driving AGI occurrence [Araj et al., 1996]. Rising global tempera- tures and the resulting shifts in regional hydroclimatic conditions and extremes are likely to influence the distribution, transmission, and risk of waterborne illness [Charron et al., 2004; McMichael, 2004; IPCC, 2007]. More specifically, increasing temperatures and shifts in the timing, intensity, and frequency of precipitation, streamflow, and runoff are likely to influence pathogen survival and transport, ultimately influencing water quality, the transmission of pathogens, and the epidemiology of waterborne disease at the population level. Targeted ecological studies are needed to enhance our understanding of the complex relationships between hydroclimatic variability and waterborne illness [Lal et al., 2012]. Also, given the interconnected and complex nature of the links between hydroclimatic variability and waterborne illness, an Special Section: Hydroepidemiology: A path- way to link hydrology and cli- mate with human health Key Points: Hydroclimatic variables are associated with the occurrence of AGI Associations differ across different hydroclimatic regimes Watersheds may provide a useful context for future hydroepidemiology research Correspondence to: L. P. Galway, [email protected] Citation: Galway, L. P., D. M. Allen, M. W. Parkes, L. Li, and T. K. Takaro (2015), Hydroclimatic variables and acute gastro-intestinal illness in British Columbia, Canada: A time series analysis, Water Resour. Res., 51, doi:10.1002/2014WR015519. Received 27 FEB 2014 Accepted 11 DEC 2014 Accepted article online 20 DEC 2014 GALWAY ET AL. V C 2014. American Geophysical Union. All Rights Reserved. 1 Water Resources Research PUBLICATIONS

Welcome message from author
This document is posted to help you gain knowledge. Please leave a comment to let me know what you think about it! Share it to your friends and learn new things together.
Transcript
RESEARCH ARTICLE10.1002/2014WR015519
Hydroclimatic variables and acute gastro-intestinal illness inBritish Columbia, Canada: A time series analysisL. P. Galway1, D. M. Allen2, M. W. Parkes3, L. Li4, and T. K. Takaro1
1Faculty of Health Sciences, Simon Fraser University, Burnaby, British Columbia, Canada, 2Department of Earth Sciences,Simon Fraser University, Burnaby, British Columbia, Canada, 3School of Health Sciences, University of Northern BritishColumbia, Prince George, British Columbia, Canada, 4Department of Medicine, University of Western Ontario, London,Ontario, Canada
Abstract Using epidemiologic time series analysis, we examine associations between three hydrocli-matic variables (temperature, precipitation, and streamflow) and waterborne acute gastro-intestinal illness(AGI) in two communities in the province of British Columbia (BC), Canada. The communities were selectedto represent the major hydroclimatic regimes that characterize BC: rainfall-dominated and snowfall domi-nated. Our results show that the number of monthly cases of AGI increased with increasing temperature,precipitation, and streamflow in the same month in the context of a rainfall-dominated regime, and withincreasing streamflow in the previous month in the context of a snowfall-dominated regime. These resultssuggest that hydroclimatology plays a role in driving the occurrence and variability of AGI in these settings.Further, this study highlights that the nature and magnitude of the effects of hydroclimatic variability onAGI are different in the context of a snowfall-dominated regime versus a rainfall-dominated regimes. Weconclude by proposing that the watershed may be an appropriate context for enhancing our understandingof the complex linkages between hydroclimatic variability and waterborne illness in the context of a chang-ing climate.
1. Introduction
Our knowledge of the links among climate change, water, and human health is particularly limited. Thisknowledge gap is disconcerting given that water is a primary medium through which climate change willimpact ecosystem function and ultimately human health and well being. Examining historical relationshipsbetween hydroclimatic variables and water-related health endpoints is an essential first step towardadvancing our knowledge of the potential future impacts of climate change on health [Rose and Grimes,2001; Charron et al., 2004; Harper et al., 2011]. This can be achieved using epidemiological research andstudy designs such as time series analyses, which identify associations between current and past hydrocli-matic variation and population level patterns of disease [McMichael, 2003].
Like many other infectious diseases that are considered sensitive to climate change, sporadic waterborneacute gastro-intestinal illness (AGI) exhibits seasonality, suggesting that hydroclimatic factors may play arole in driving illness occurrence, trends, and risk [McMichael, 2004; World Health Organization, 2004; Lalet al., 2012]. Research suggests that distinct seasonal patterns documented across different settings of theworld may be attributable in part to the heterogeneity of regional and local hydroclimatology [Lal et al.,2012]. Interestingly, research in settings where hydroclimatic variability is limited, both within and acrossyears, has documented limited variation in AGI rates over time, lending further support to the hypothesisthat hydroclimatic variability plays a part in driving AGI occurrence [Araj et al., 1996]. Rising global tempera-tures and the resulting shifts in regional hydroclimatic conditions and extremes are likely to influence thedistribution, transmission, and risk of waterborne illness [Charron et al., 2004; McMichael, 2004; IPCC, 2007].More specifically, increasing temperatures and shifts in the timing, intensity, and frequency of precipitation,streamflow, and runoff are likely to influence pathogen survival and transport, ultimately influencing waterquality, the transmission of pathogens, and the epidemiology of waterborne disease at the population level.Targeted ecological studies are needed to enhance our understanding of the complex relationshipsbetween hydroclimatic variability and waterborne illness [Lal et al., 2012]. Also, given the interconnectedand complex nature of the links between hydroclimatic variability and waterborne illness, an
Special Section:Hydroepidemiology: A path-way to link hydrology and cli-mate with human health
Key Points:� Hydroclimatic variables are
associated with the occurrence ofAGI� Associations differ across different
hydroclimatic regimes� Watersheds may provide a useful
context for futurehydroepidemiology research
Correspondence to:L. P. Galway,[email protected]
Citation:Galway, L. P., D. M. Allen, M. W. Parkes,L. Li, and T. K. Takaro (2015),Hydroclimatic variables and acutegastro-intestinal illness in BritishColumbia, Canada: A time seriesanalysis, Water Resour. Res., 51,doi:10.1002/2014WR015519.
Received 27 FEB 2014
Accepted 11 DEC 2014
Accepted article online 20 DEC 2014
GALWAY ET AL. VC 2014. American Geophysical Union. All Rights Reserved. 1
Water Resources Research
PUBLICATIONS
interdisciplinary approach drawing on the skills and expertise of epidemiologists, hydrologists, and publichealth and water management practitioners is called for.
The aim of this study was to determine the associations between three hydroclimatic variables (tempera-ture, precipitation, and streamflow) and the occurrence of AGI in two communities in the province of BritishColumbia (BC), Canada. The first community is located in a rainfall-dominated watershed, while the secondis located in a snowmelt-dominated watershed, enabling a comparison of results across these distinct set-tings; this is a novel approach. BC, Canada was selected as the study site for this work because it offers arich diversity of hydroclimatology for exploring associations between these hydroclimatic variables and AGI,and for comparing results across hydroclimatic regimes within the same jurisdictional unit. Also, we wereable to take advantage of a unique data set of laboratory-confirmed AGI cases. Finally, there is a dearth ofresearch examining the ecological determinants of AGI in BC despite the fact that waterborne illness is animportant public health issue as evidenced by the 1766 active boil-water advisories in the province andhigher rates of AGI illness than other regions of Canada [Davies and Mazumder, 2003; Eggertson, 2008]. Thisstudy was motivated by the outlined knowledge gaps and by our previous research in this same geographicarea [Galway et al., 2014], which found that the incidence of AGI varied seasonally and that seasonal dynam-ics differed across those cases located in snowmelt-dominated versus rainfall-dominated watersheds. In sec-tions 4 and 5, we summarize the practical, methodological, and conceptual implications of this study.
2. Methods
A retrospective, population-based epidemiological study was conducted to examine the associationsbetween AGI and hydroclimatic variables in two communities in BC, Canada, from January 1999 to January2010. BC is characterized by two dominant hydroclimatic regimes: rainfall-dominated and snowmelt-domi-nated [Allen et al., 2010]. The two study communities, herein referred to as community A and B, wereselected to represent these two hydroclimatic regimes, respectively (communities are not referred to byname as requested by the BC Center for Disease Control). Rainfall-dominated regimes are found primarily intemperate coastal lowlands, and snowmelt-dominated regimes occur in the interior plateau and mountain-ous regions. Rainfall-dominated regimes are characterized by seasonal changes in precipitation (mostly asrainfall), with peak streamflow and groundwater recharge occurring during the rainy winter months(November to February), while the lowest monthly streamflow and groundwater levels occur in the latesummer and early fall (July to September) [Allen et al., 2010; Eaton and Moore, 2010]. Hydrological processesin snowmelt-dominated regimes are controlled primarily by melting snowpack and, in some areas, glaciers.Snowmelt runoff contributes between 50% and 80% of total streamflow in snowmelt-dominated water-sheds. The hydrology of snowmelt-dominated regimes is characterized by high streamflows in the springand early summer, with low flows in the late summer and throughout the winter [Allen et al., 2010; Eatonand Moore, 2010].
Both communities are characterized by mixed land use including residential, commercial, and agriculture;more than 50% of the land is designated as agricultural land reserve (ALR) in both communities. Addition-ally, both communities have several municipal drinking water systems that use groundwater, surface water,or a mix of the two as the source of drinking water. In community A, the majority of drinking water is pro-vided by mixed surface and groundwater, while community B relies most heavily on surface water as asource of municipal drinking water. There are also private and small community water systems in bothcommunities.
2.1. Health and Hydroclimatic DataThe primary outcome for the study was the total number of monthly AGI cases. Laboratory-confirmed AGIcases were obtained from the BC Center for Disease Control (BCCDC) extracted from the Integrated PublicHealth Information System (iPHIS) for the study period. Waterborne AGI is a notifiable disease in the prov-ince. Age at onset of illness, sex, disease type, episode date, and a unique identifier were also extractedfrom the iPHIS system. The iPHIS cannot distinguish between foodborne and waterborne transmission ofcases. Because this work concerned waterborne AGI specifically, we used pathogen type as a proxy for iden-tifying those cases deemed more likely waterborne. We removed cases caused by E. coli and Salmonellapathogens which are most commonly foodborne [Percival, 2013]. The data set analyzed included casescaused by Campylobacter, Giardia, and Cryptosporidium. Although Campylobacter, a bacterial pathogen, can
Water Resources Research 10.1002/2014WR015519
GALWAY ET AL. VC 2014. American Geophysical Union. All Rights Reserved. 2
also be foodborne, recent evidence increasingly suggests that the waterborne route plays an important rolein transmission [Freidman et al., 2000; Louis et al., 2005; Schuster et al., 2005]. Therefore, we consider the AGIcases analyzed to be more likely waterborne. Exposure to waterborne AGI can occur through contaminateddrinking water or contaminated recreational water sources. Although analyses disaggregated by pathogentype would have been preferred, low case counts did not permit this approach.
Hydroclimatic data were gathered from various government sources. Daily temperature and precipitationdata were downloaded from the National Climate Data and Information Archive [Environment Canada,2012]. Data from a single weather station located closest to the center of the study community were used.These daily data were aggregated to the monthly time scale. Streamflow data were extracted from Environ-ment Canada’s HYDAT system [Environment Canada, 2013]. Monthly streamflow data were extracted fromthe nonregulated hydrometric station situated closest to each study community.
2.2. AnalysisA daily time series of AGI cases using the variable ‘‘episode date’’ (defined as the date of symptom onset)was first prepared, and then a monthly time series of total case counts for each community was generated.Monthly time series of the outcome and explanatory variables were plotted and visually inspected fortrends. Also, monthly aggregated counts of illness were presented with monthly temperature, streamflow,and precipitation, along with descriptive statistics of these explanatory variables.
Semiparametric generalized additive models (GAMs) were used to examine the association between thenumber of AGI cases per month and the three hydroclimatic variables of interest: mean monthly tempera-ture, total monthly precipitation, and mean monthly streamflow. These explanatory variables were selecteda priori based on a literature review and knowledge of the systems. GAMs extend traditional generalized lin-ear models (GLMs) by allowing inclusion of nonparametric smoothing functions of one or more explanatoryvariables [Hastie and Tibshirani, 1990; Tob�ıas and S�aez Zafra, 2004]. GAMs are commonly employed in envi-ronmental epidemiology and climate change and health research [e.g., Schwartz, 1994; Diaz et al., 2005;Fleury et al., 2006; Mireku et al., 2009; Mrema et al., 2012; Åstr€om et al., 2012]. The inclusion of both of non-parametric smoothing functions and unsmoothed variables leads to the description of this model assemiparametric.
As is typical with time series count data, the distribution of monthly AGI counts was assumed to follow aPoisson distribution; the models therefore used a log link function [Kale et al., 2004]. We began the modelbuilding process by constructing base models for each community to control for temporal trends notadequately captured by the hydroclimatic variables. This reduces the possibility of confounding effects byother environmental and behavioral factors or reporting, and removes autocorrelation in the model resid-uals [Fisman, 2007; White et al., 2009]. Because time series analysis was used, only those variables that varyover time are possibly confounding factors.
Initially, the performance of simple models, including a GLM model with categorical variables for year and sea-son and a sinusoidal approach (where sinusoidal terms are included in the statistical model), was used to con-trol for temporal trends [Fisman, 2007; White et al., 2009; Greer et al., 2010]. Preliminary analyses showed thatthese models did not adequately capture the structure in the data and that autocorrelation remained; there-fore, these models were not selected. Subsequently, thin-plate spline smoothing was explored and selectedas the most appropriate approach for these data [Wood, 2006]. The degree of smoothing is controlled by thenumber of degrees of freedom and is an important aspect of time series modeling. We selected the numberof degrees of freedom by minimizing the Generalized Cross-Validation (GCV) score [Wahba, 1990]. Indicatorvariables for the years of the study were also included to allow for long-term trends between years.
Subsequently, the explanatory variables were screened using univariable models. Crude univariable associa-tions between each of the explanatory hydroclimatic variables and monthly AGI counts were assessedincluding the lagged effects of each variable (up to 3 months) to account for delays in the effects of theexplanatory variables. Three months was selected based on a review of the literature and biological plausi-bility. All explanatory variables illustrating associations at P< 0.20 [Budtz-Jørgensen et al., 2007] in the uni-variable models were selected for inclusion in multivariable models.
Multicollinearity was assessed using Spearman correlation analyses and a cut-point value of r> 80%[Meyers et al., 2012; Tabachnick and Fidell, 2012]. Because temperature in a given month was highly
Water Resources Research 10.1002/2014WR015519
GALWAY ET AL. VC 2014. American Geophysical Union. All Rights Reserved. 3
correlated with lagged temperatures in both com-munities (r> 0.80), we selected a single temperaturevariable, the lag with the greatest effect for the finalmodels. Finally, due to high correlation betweenprecipitation and streamflow for community A(r 5 0.860), and because streamflow may be on thecausal pathway between precipitation and illnessoccurrence [Hashizume et al., 2008] separate multi-variable models were built for precipitation andstreamflow.
The semiparametric GAM models took the followingform:
Basic function:
log½EðYÞ�5 b01f month seriesð Þ1year1b1X (1)
Final community A models:
log½EðYÞ� 5 b01f month seriesð Þ1year1b1ðtemperatureÞ1b2ðrainfallÞ (2)
log½EðYÞ�5 b01f month seriesð Þ1year1b1ðtemperatureÞ1b2ðstreamflowÞ (3)
Final community B model:
log½EðYÞ�5 b01f month seriesð Þ1year1b1ðtemperatureÞ1b2ðstreamflowÞ (4)
where E(Y) denotes expected monthly count of AGI cases, f(month series) represents a smoothing spline ofthe month series, b1 denotes the log relative risk of AGI cases associated with a one-unit increase in temper-ature, and b2 denotes the log relative risk of AGI cases associated with a one-unit increase in streamflow orprecipitation.
The fit of the final models was assessed using several diagnostic plots including: the normal Q-Q plots ofthe residuals, autocorrelation plots of residuals, and observed versus model predicted monthly AGI counts.Finally, several sensitivity analyses were conducted. To investigate whether or not the main results weresensitive to the level of seasonal control, multivariable models were run using different degrees of smooth-ing. We also assessed the impact of using hydroclimatic data from a different data station. To fit the modelswe used the statistical software, R version. 2.2.0.
3. Results
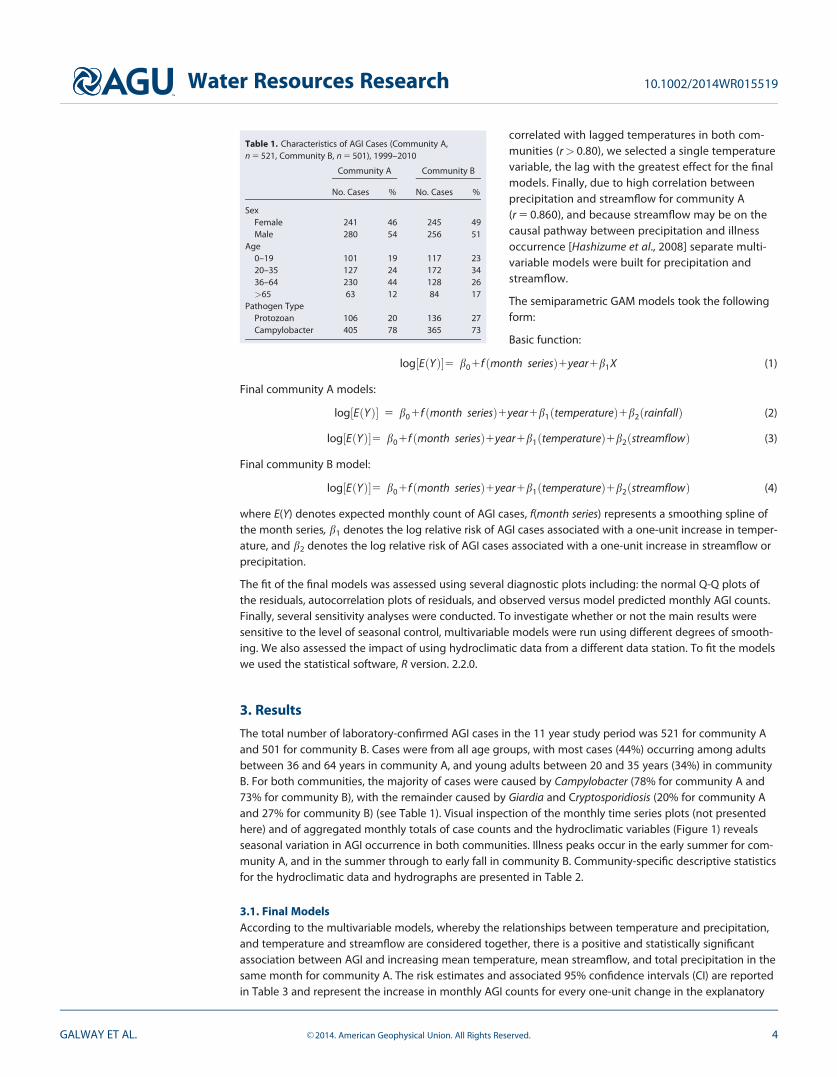
The total number of laboratory-confirmed AGI cases in the 11 year study period was 521 for community Aand 501 for community B. Cases were from all age groups, with most cases (44%) occurring among adultsbetween 36 and 64 years in community A, and young adults between 20 and 35 years (34%) in communityB. For both communities, the majority of cases were caused by Campylobacter (78% for community A and73% for community B), with the remainder caused by Giardia and Cryptosporidiosis (20% for community Aand 27% for community B) (see Table 1). Visual inspection of the monthly time series plots (not presentedhere) and of aggregated monthly totals of case counts and the hydroclimatic variables (Figure 1) revealsseasonal variation in AGI occurrence in both communities. Illness peaks occur in the early summer for com-munity A, and in the summer through to early fall in community B. Community-specific descriptive statisticsfor the hydroclimatic data and hydrographs are presented in Table 2.
3.1. Final ModelsAccording to the multivariable models, whereby the relationships between temperature and precipitation,and temperature and streamflow are considered together, there is a positive and statistically significantassociation between AGI and increasing mean temperature, mean streamflow, and total precipitation in thesame month for community A. The risk estimates and associated 95% confidence intervals (CI) are reportedin Table 3 and represent the increase in monthly AGI counts for every one-unit change in the explanatory
Table 1. Characteristics of AGI Cases (Community A,n 5 521, Community B, n 5 501), 1999–2010
Community A Community B
No. Cases % No. Cases %
SexFemale 241 46 245 49Male 280 54 256 51
Age0–19 101 19 117 2320–35 127 24 172 3436–64 230 44 128 26>65 63 12 84 17
Pathogen TypeProtozoan 106 20 136 27Campylobacter 405 78 365 73
Water Resources Research 10.1002/2014WR015519
GALWAY ET AL. VC 2014. American Geophysical Union. All Rights Reserved. 4
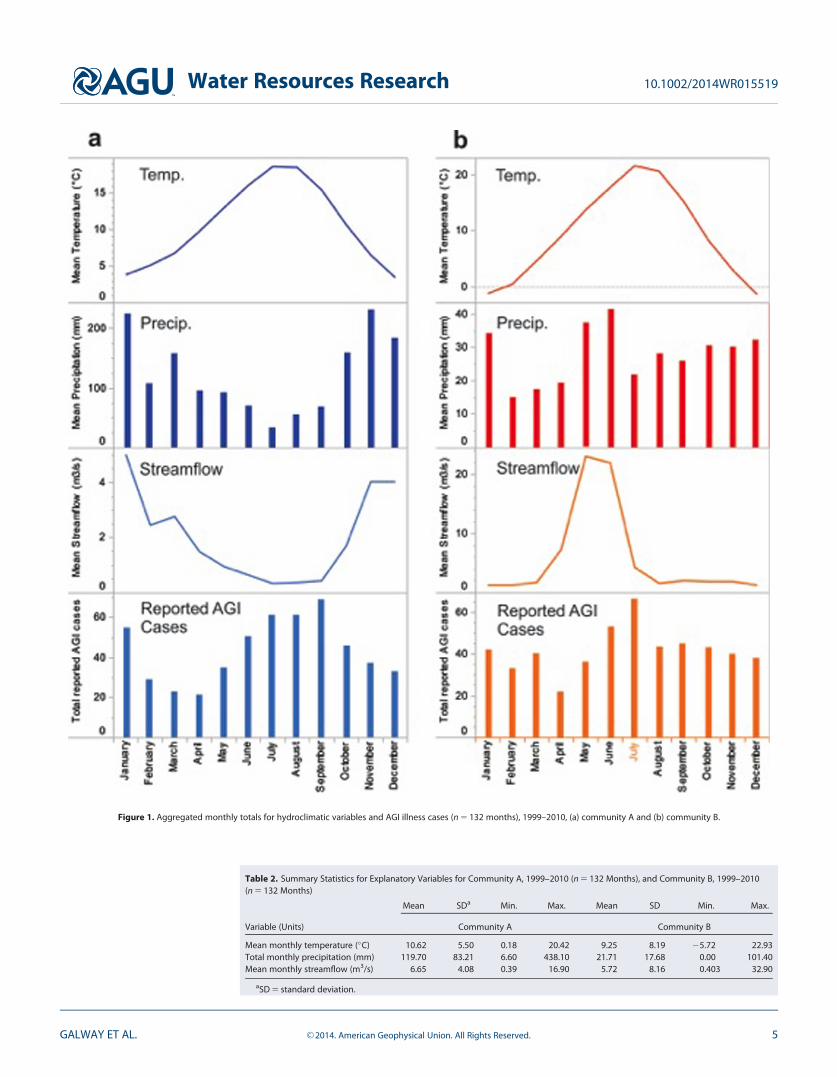
Figure 1. Aggregated monthly totals for hydroclimatic variables and AGI illness cases (n 5 132 months), 1999–2010, (a) community A and (b) community B.
Table 2. Summary Statistics for Explanatory Variables for Community A, 1999–2010 (n 5 132 Months), and Community B, 1999–2010(n 5 132 Months)
Variable (Units)
Mean SDa Min. Max. Mean SD Min. Max.
Community A Community B
Mean monthly temperature (�C) 10.62 5.50 0.18 20.42 9.25 8.19 25.72 22.93Total monthly precipitation (mm) 119.70 83.21 6.60 438.10 21.71 17.68 0.00 101.40Mean monthly streamflow (m3/s) 6.65 4.08 0.39 16.90 5.72 8.16 0.403 32.90
aSD 5 standard deviation.
Water Resources Research 10.1002/2014WR015519
GALWAY ET AL. VC 2014. American Geophysical Union. All Rights Reserved. 5
hydroclimatic variable. Conse-quently, for a 1�C increase in meanmonthly temperature in the samemonth, the number of AGI casesincreased by 11.5% (95% CI: 4.5%–18.6%). For a 10 mm increase in totalmonthly precipitation, there was a1% (95% CI: 0%–3%) increase in AGIcases in the same month. Whenmean monthly streamflow increasedby 1 m3/s, there was a 15% (95% CI:6.4%–27%) increase in AGI cases inthe same month. In contrast, precipi-tation in the same month or whenlagged by 1 or 2 months was notassociated with AGI in univariable
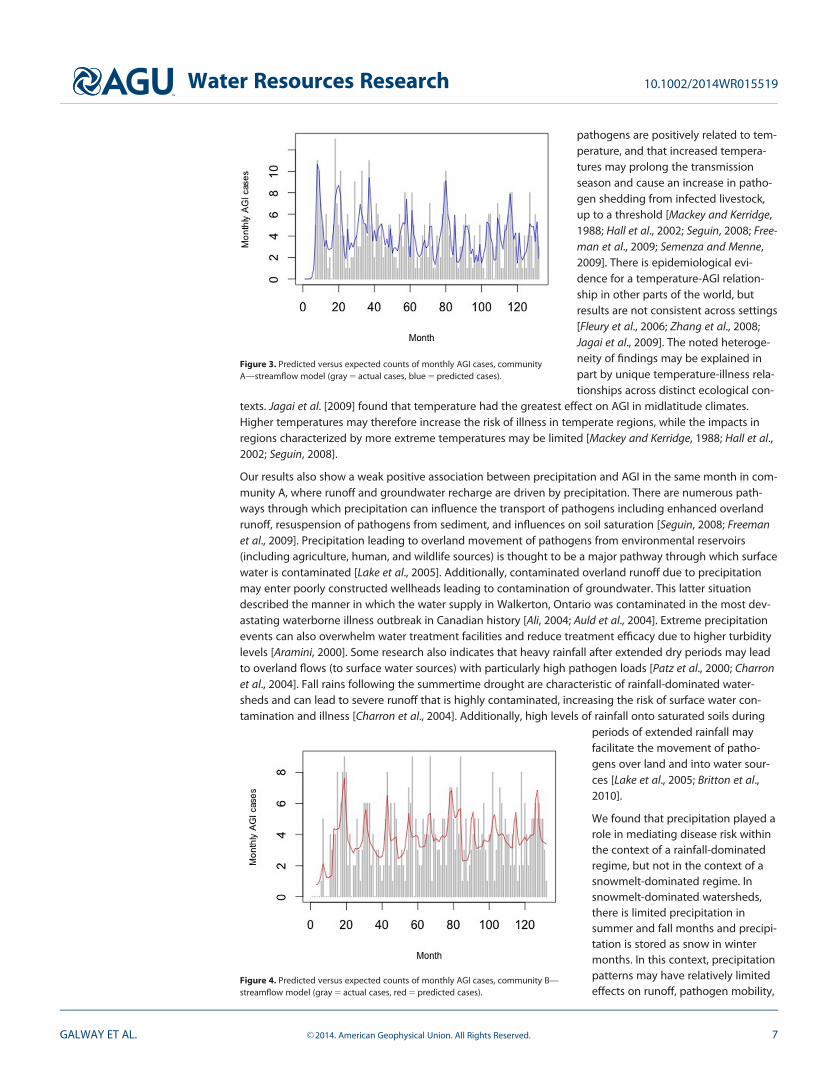
analyses for community B. Consequently, we only generated a final streamflow model for community B, inwhich we found a positive and statistically significant association between AGI and monthly streamflow inthe previous month. For every 1 m3/s increase in mean monthly streamflow, there was a 1.9% (95% CI:0.5%–3.2%) increase in monthly AGI cases 1 month later. Temperature was not significantly associated withAGI in community B.
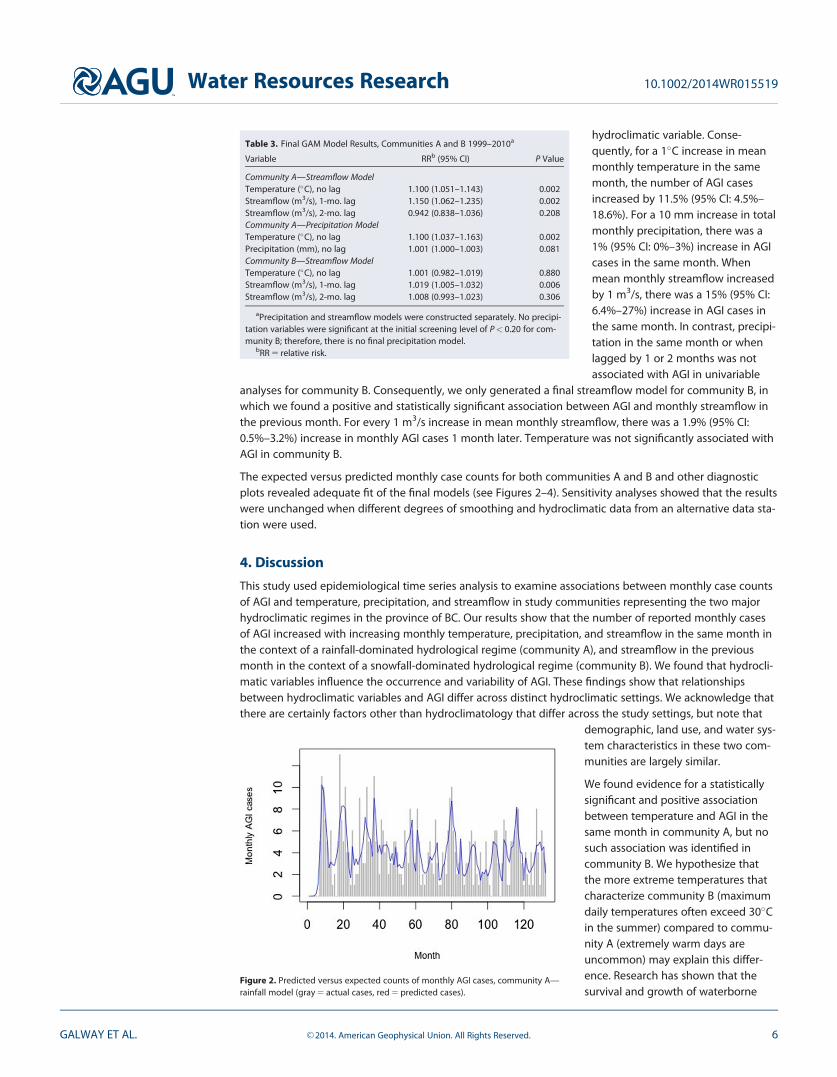
The expected versus predicted monthly case counts for both communities A and B and other diagnosticplots revealed adequate fit of the final models (see Figures 2–4). Sensitivity analyses showed that the resultswere unchanged when different degrees of smoothing and hydroclimatic data from an alternative data sta-tion were used.
4. Discussion
This study used epidemiological time series analysis to examine associations between monthly case countsof AGI and temperature, precipitation, and streamflow in study communities representing the two majorhydroclimatic regimes in the province of BC. Our results show that the number of reported monthly casesof AGI increased with increasing monthly temperature, precipitation, and streamflow in the same month inthe context of a rainfall-dominated hydrological regime (community A), and streamflow in the previousmonth in the context of a snowfall-dominated hydrological regime (community B). We found that hydrocli-matic variables influence the occurrence and variability of AGI. These findings show that relationshipsbetween hydroclimatic variables and AGI differ across distinct hydroclimatic settings. We acknowledge thatthere are certainly factors other than hydroclimatology that differ across the study settings, but note that
demographic, land use, and water sys-tem characteristics in these two com-munities are largely similar.
We found evidence for a statisticallysignificant and positive associationbetween temperature and AGI in thesame month in community A, but nosuch association was identified incommunity B. We hypothesize thatthe more extreme temperatures thatcharacterize community B (maximumdaily temperatures often exceed 30�Cin the summer) compared to commu-nity A (extremely warm days areuncommon) may explain this differ-ence. Research has shown that thesurvival and growth of waterborne
Table 3. Final GAM Model Results, Communities A and B 1999–2010a
Variable RRb (95% CI) P Value
Community A—Streamflow ModelTemperature (�C), no lag 1.100 (1.051–1.143) 0.002Streamflow (m3/s), 1-mo. lag 1.150 (1.062–1.235) 0.002Streamflow (m3/s), 2-mo. lag 0.942 (0.838–1.036) 0.208Community A—Precipitation ModelTemperature (�C), no lag 1.100 (1.037–1.163) 0.002Precipitation (mm), no lag 1.001 (1.000–1.003) 0.081Community B—Streamflow ModelTemperature (�C), no lag 1.001 (0.982–1.019) 0.880Streamflow (m3/s), 1-mo. lag 1.019 (1.005–1.032) 0.006Streamflow (m3/s), 2-mo. lag 1.008 (0.993–1.023) 0.306
aPrecipitation and streamflow models were constructed separately. No precipi-tation variables were significant at the initial screening level of P< 0.20 for com-munity B; therefore, there is no final precipitation model.
bRR 5 relative risk.
Figure 2. Predicted versus expected counts of monthly AGI cases, community A—rainfall model (gray 5 actual cases, red 5 predicted cases).
Water Resources Research 10.1002/2014WR015519
GALWAY ET AL. VC 2014. American Geophysical Union. All Rights Reserved. 6
pathogens are positively related to tem-perature, and that increased tempera-tures may prolong the transmissionseason and cause an increase in patho-gen shedding from infected livestock,up to a threshold [Mackey and Kerridge,1988; Hall et al., 2002; Seguin, 2008; Free-man et al., 2009; Semenza and Menne,2009]. There is epidemiological evi-dence for a temperature-AGI relation-ship in other parts of the world, butresults are not consistent across settings[Fleury et al., 2006; Zhang et al., 2008;Jagai et al., 2009]. The noted heteroge-neity of findings may be explained inpart by unique temperature-illness rela-tionships across distinct ecological con-
texts. Jagai et al. [2009] found that temperature had the greatest effect on AGI in midlatitude climates.Higher temperatures may therefore increase the risk of illness in temperate regions, while the impacts inregions characterized by more extreme temperatures may be limited [Mackey and Kerridge, 1988; Hall et al.,2002; Seguin, 2008].
Our results also show a weak positive association between precipitation and AGI in the same month in com-munity A, where runoff and groundwater recharge are driven by precipitation. There are numerous path-ways through which precipitation can influence the transport of pathogens including enhanced overlandrunoff, resuspension of pathogens from sediment, and influences on soil saturation [Seguin, 2008; Freemanet al., 2009]. Precipitation leading to overland movement of pathogens from environmental reservoirs(including agriculture, human, and wildlife sources) is thought to be a major pathway through which surfacewater is contaminated [Lake et al., 2005]. Additionally, contaminated overland runoff due to precipitationmay enter poorly constructed wellheads leading to contamination of groundwater. This latter situationdescribed the manner in which the water supply in Walkerton, Ontario was contaminated in the most dev-astating waterborne illness outbreak in Canadian history [Ali, 2004; Auld et al., 2004]. Extreme precipitationevents can also overwhelm water treatment facilities and reduce treatment efficacy due to higher turbiditylevels [Aramini, 2000]. Some research also indicates that heavy rainfall after extended dry periods may leadto overland flows (to surface water sources) with particularly high pathogen loads [Patz et al., 2000; Charronet al., 2004]. Fall rains following the summertime drought are characteristic of rainfall-dominated water-sheds and can lead to severe runoff that is highly contaminated, increasing the risk of surface water con-tamination and illness [Charron et al., 2004]. Additionally, high levels of rainfall onto saturated soils during
periods of extended rainfall mayfacilitate the movement of patho-gens over land and into water sour-ces [Lake et al., 2005; Britton et al.,2010].
We found that precipitation played arole in mediating disease risk withinthe context of a rainfall-dominatedregime, but not in the context of asnowmelt-dominated regime. Insnowmelt-dominated watersheds,there is limited precipitation insummer and fall months and precipi-tation is stored as snow in wintermonths. In this context, precipitationpatterns may have relatively limitedeffects on runoff, pathogen mobility,
Figure 3. Predicted versus expected counts of monthly AGI cases, communityA—streamflow model (gray 5 actual cases, blue 5 predicted cases).
Figure 4. Predicted versus expected counts of monthly AGI cases, community B—streamflow model (gray 5 actual cases, red 5 predicted cases).
Water Resources Research 10.1002/2014WR015519
GALWAY ET AL. VC 2014. American Geophysical Union. All Rights Reserved. 7
and turbidity, and therefore, limited effects on the risk of waterborne illness, whereas streamflow effectsmay play a more dominant role.
Streamflow is associated with AGI in both study communities. In community A, the effect of streamflow onAGI was seen in the same month. In community B, a 1 month lagged positive effect of streamflow wasobserved. Although there is a dearth of research on this subject, a study in the UK found that monthly inci-dence of AGI caused by Cryptosporidium was positively related to streamflow [Lake et al., 2005]. Because var-iations in streamflow are determined by the cumulative effects of climate, hydrology, and watershedcharacteristics (i.e., geology, soil conditions, and land cover), streamflow may act as an indicator for theinteractions between upstream factors that influence pathogen abundance, mobility, and source waterquality [European Environment Agency, 2012].
Informed by the findings of this study, we hypothesize that snowmelt events may contribute to the June toJuly peak in illness occurrence seen in community B. Because streamflow in a snowmelt-dominated regimeis fed primarily by the annual spring thaw of snowpack that accumulated over the winter months, stream-flow data capture snowmelt events in a watershed. During the spring freshet, runoff is enhanced, rivers runhigh, and groundwater levels reach their maximum. Flooding is also a common occurrence at this time ofyear. Although there has been limited research looking at the association between snowmelt and water-borne illness, snowmelt can lead to dramatic runoff and overland flows with the potential to contaminatewater sources and overwhelm treatment facilities [Charron et al., 2004]. Moreover, since changes areexpected in snowpack accumulation and the timing of spring freshets in snowmelt-dominated watershedsdue to climate change, this may be an important risk factor for waterborne illness in a changing climate.Snowmelt has been correlated with pathogenic contamination of source waters and elevated turbidity[Atherholt et al., 1998; Jagai et al., 2012]. Although there has been little epidemiological research on the sub-ject, anecdotal evidence lends some supports to this hypothesis. In fact, ‘‘rapid snowmelt, resultant runoff,and filtration system failure at the overloaded drinking water treatment plant were implicated with the larg-est known waterborne outbreak of cryptosporidiosis, which occurred in Milwaukee, Wisconsin, in 1993’’[Naumova, 2006]. More research is needed to look explicitly at the impact of snowmelt on water quality andits possible role in mediating AGI occurrence in the context of a changing climate, specifically in those com-munities located in snowmelt-mediated watersheds.
Monitoring of streamflow data and the magnitude and timing of spring freshets may be an effective tool toprovide early warning to communities when the risk of illness is elevated or even signal when preventativeboil water advisories should be implemented. One caveat is that adequate understanding of local hydrologyand the biophysical and ecological context is critical to ensure hydrological data are interpreted and usedappropriately. More research in a variety of ecological settings accounting for watershed characteristics isneeded to explore the potential utility of hydrological data as an indicator for periods of elevated risk ofwaterborne AGI, and highlights the need for continued collaboration and knowledge exchange betweenhydrologists and epidemiologists and between public health officials and water managers.
4.1. Implications for Future Work at the Climate Change-Water-Health NexusThis work has highlighted that the nature and magnitude of the effects of temperature, precipitation, andstreamflow on AGI vary across different hydroclimatic regimes, or ecological contexts. Ecologically informedanalyses are needed to better understand the complex interconnections between hydroclimatology, waterquality, and waterborne illness. This may be particularly relevant in the context of a changing climate. Todate, most research has examined climate change-water-health linkages within spatial units defined byjurisdictional boundaries (e.g., the province or the nation) and has largely ignored the regional contextwithin which hydroclimatic factors influence health. This is true in the environmental epidemiology litera-ture more broadly where our understanding of human health is often ‘‘organized spatially around humanconstructs’’ [Bunch et al., 2011] rather than ecologically relevant units. This has the effect of disconnectinghealth outcomes from distal (or ‘‘upstream’’) risk factors and the biophysical and ecological context withinwhich health and disease manifests. We argue that watersheds, defined here as spatially bounded biogeo-physical units and their associated social actors and institutions [Glaser, 2012], can provide an appropriatesocial-ecological context for research at the climate change-water-health nexus. With boundaries definedby biogeophysical features and the flow of water through a landscape, watersheds [Bunch et al., 2011] (alsoknown as catchments or river basins) offer meaningful spatial units for understanding and interpreting
Water Resources Research 10.1002/2014WR015519
GALWAY ET AL. VC 2014. American Geophysical Union. All Rights Reserved. 8
complex relationships among hydroclimatic factors, water quality, and health. Moreover, when watershedsare understood as social-ecological systems [Parkes et al., 2008; Glaser, 2012], organizing our researcharound watersheds can facilitate much needed interdisciplinary collaboration across the natural, social, andhealth sciences. We propose, therefore, that watersheds should be recognized as appropriate social-ecological settings for enhancing our currently limited understanding of the complex linkages betweenhydroclimatic variability and waterborne illness in the context of a changing climate. Hydroepidemiologicalresearch [Kay and Falconer, 2008], which is aimed at understanding connections between hydrology andhuman health and building bridges across epidemiology and hydrology, certainly lends support for concep-tualizing watersheds as a useful context and spatial unit for interdisciplinary research pertaining to water-related determinants of health.
5. Limitations and Conclusion
We conclude that hydroclimatic variables, specifically temperature, precipitation, and streamflow, play arole in driving the occurrence and variability of AGI in British Columbia, Canada. Further, this study has high-lighted that the nature and magnitude of the effects of hydroclimatic variability on AGI differ in the twohydroclimatic regimes studied. Based on expected hydrologic responses to climate change, it is likely thatfuture climate change will consequently have distinct impacts on the burden of AGI illness across regionsand contexts. Examining the role of hydroclimatology as an underlying driver of the epidemiology of water-borne disease is key to advancing our understanding of the possible ecosystem-mediated impacts of cli-mate change on infectious illness and the links among climate change, water, and health more broadly.
There are limitations of this study that must be considered when interpreting these findings and consider-ing their relevance more broadly. First, due to the study design used, associations between hydroclimaticvariables and illness do not imply causation and must be interpreted with caution. Second, we have ana-lyzed AGI illness caused by different pathogens together due to low case counts. Some cases may havebeen transmitted via the foodborne pathway rather than the waterborne pathway, which may havedecreased the magnitude of effect for precipitation and streamflow in particular. Whenever data permit,researchers should model AGI caused by different pathogens separately to address this issue. Third, weused public health surveillance data, which are known to underreport the true burden of illness in a popula-tion. Underreporting of cases would bias our results if hydroclimatic variation influenced the likelihood ofreporting, which is unlikely. Finally, monthly aggregation of data may have masked relationships at weeklyor daily time scales.
Despite these limitations, this study has generated new knowledge and made several important contribu-tions with practical, methodological, and conceptual relevance. We have addressed a widely acknowledgedgap regarding the associations between hydrological variables and AGI, and identified several hypothesesand questions warranting further research. Further, we have considered these relationships in two distincthydroclimatic regimes contributing to our understanding of these complex relationships within very differ-ent ecological contexts in BC. This was a novel and productive approach that should be considered forfuture hydroepidemiology studies and for research at the climate change-water-health nexus. Finally, wepropose a shift toward watershed-based research, governance, and action as a basis for enhancing under-standing of complex relationships and integrating climate change adaptation, health promotion, andresource management initiatives in a relevant social-ecological context.
ReferencesAli, S. H. (2004), A socio-ecological autopsy of the E. coli O157:H7 outbreak in Walkerton, Ontario, Canada, Soc. Sci. Med., 58(12), 2601–2612,
doi:10.1016/j.socscimed.2003.09.013.Allen, D. M., P. H. Whitfield, and A. Werner (2010), Groundwater level responses in temperate mountainous terrain: Regime classification,
and linkages to climate and streamflow, Hydrol. Processes, 24(23), 3392–3412.Araj, G. F., N. Y. Abdul-Baki, M. M. Hamze, S. Y. Alami, R. E. Nassif, and M. S. Naboulsi (1996), Prevalence and etiology of intestinal parasites
in Lebanon, Lebanese Med. J., 44(3), 129–133.Aramini, J. (2000), Drinking water quality and health care utilization for gastrointestinal illness in Greater Vancouver, Can. Commun. Disease
Rep., 26(24), 211–214.Åstr€om, C., J. Rockl€ov, S. Hales, A. B�eguin, V. Louis, and R. Sauerborn (2012), Potential distribution of dengue fever under scenarios of cli-
mate change and economic development, EcoHealth, 9(4), 448–454, doi:10.1007/s10393-012-0808-0.Atherholt, T. B., M. W. LeChevallier, W. D. Norton, and J. S. Rosen (1998), Effect of rainfall on Giardia and Cryptosporidium, J. Am. Water Works
Assoc., 90(9), 66–88.
AcknowledgmentsThe AGI data for this study wereaccessed through the BC Center forDisease Control. In accordance withthe data sharing agreement theauthors signed with the BC Center forDisease Control (which states that theauthors must not redistribute orpublish the illness data used in this),the data used to support this articlecannot be released. This work wassupported by a training award fromthe Canadian Institute for HealthResearch and the Simon FraserUniversity, Community TrustEndowment Fund.
Water Resources Research 10.1002/2014WR015519
GALWAY ET AL. VC 2014. American Geophysical Union. All Rights Reserved. 9
Auld, H., D. MacIver, and J. Klaassen (2004), Heavy rainfall and waterborne disease outbreaks: The Walkerton example, J. Toxicol. Environ.Health A, 67(20–22), 1879–1887, doi:10.1080/15287390490493475.
Britton, E., S. Hales, K. Venugopal, and M. G. Baker (2010), The impact of climate variability and change on cryptosporidiosis and giardiasisrates in New Zealand, J. Water Health, 8(3), 561–571.
Budtz-Jørgensen, E., N. Keiding, P. Grandjean, and P. Weihe (2007), Confounder selection in environmental epidemiology: Assessment ofhealth effects of prenatal mercury exposure, Ann. Epidemiol., 17(1), 27–35.
Bunch, M. J., K. E. Morrison, M. W. Parkes, and H. D. Venema (2011), Promoting health and well-being by managing for social-ecologicalresilience: The potential of integrating ecohealth and water resources management approaches, Ecol. Soc., 16(1), pp. 1–18.
Charron, D. F., M. K. Thomas, D. Waltner-Toews, J. J. Aramini, T. Edge, R. A. Kent, A. R. Maarouf, and J. Wilson (2004), Vulnerability of water-borne diseases to climate change in Canada: A review, J. Toxicol. Environ. Health A, 67(20), 1667–1677.
Davies, J.-M., and A. Mazumder (2003), Health and environmental policy issues in Canada: The role of watershed management in sustain-ing clean drinking water quality at surface sources, J. Environ. Manage., 68(3), 273–286, doi:10.1016/S0301-4797(03)00070-7.
Diaz, J., R. Garcia, C. Lopez, C. Linares, A. Tobias, and L. Prieto (2005), Mortality impact of extreme winter temperatures, Int. J. Biometeorol.,49(3), 179–183, doi:10.1007/s00484-004-0224-4.
Eaton, B. C., and R. D. Moore (2010), Regional hydrology, in Compendium of Forest Hydrology and Geomorphology in British Columbia, editedby R. G. Pike, G. Ice, and M. R. Moore, pp. 85–110, B.C. Min. of For. and Range Res. Branch, Victoria, Canada.
Eggertson, L. (2008), Investigative report: 1766 boil-water advisories now in place across Canada, Can. Med. Assoc. J., 178(10), 1261–1263,Ottawa, Canada, doi:10.1503/cmaj.080525.
Environment Canada (2012), Canadian Climate. [Available at http://climate.weatheroffice.gc.ca/climateData/canada_e.html.]Environment Canada (2013), Environment Canada—Water—HYDAT Database, Ottawa, Canada. [Available at http://ec.gc.ca/rhc-wsc/
default.asp?lang5En&n59018B5EC-1.]European Environment Agency (2012), River Flow—Assessments. [Available at http://www.eea.europa.eu/data-and-maps/indicators/river-
flow-1.]Fisman, D. N. (2007), Seasonality of infectious diseases, Annu. Rev. Public Health, 28, 127–143.Fleury, M., D. F. Charron, J. D. Holt, O. B. Allen, and A. R. Maarouf (2006), A time series analysis of the relationship of ambient temperature
and common bacterial enteric infections in two Canadian provinces, Int. J. Biometeorol., 50(6), 385–391, doi:10.1007/s00484-006-0028-9.Freeman, J. T., D. J. Anderson, and D. J. Sexton (2009), Seasonal peaks in Escherichia coli infections: Possible explanations and implications,
Clin. Microbiol. Infection, 15(10), 951–953, doi:10.1111/j.1469-0691.2009.02866.x.Freidman, C. R., J. Neimann, H. C. Wegener, and R. V. Tauxe (2000), Epidemiology of Campylobacter jejuni infections in the United States and
other industrialized nations, 1995–9, in Campylobacter, edited by I. Nachamkin and M. J. Blaser, pp. 121–138, ASM Press, Washington, D. C.Galway, L. P., D. M. Allen, M. W. Parkes, and T. K. Takaro (2014), Seasonal variation of acute gastro-intestinal illness by hydroclimatic regime
and drinking water source: A retrospective population-based study, J. Water Health, 12(1), 122–135, doi:10.2166/wh.2013.105.Glaser, M. (2012), Human–Nature Interactions in the Anthropocene: Potentials of Social-Ecological Systems Analysis, Routledge, Ky.Greer, A. L., S. J. Drews, and D. N. Fisman (2010), Why ‘‘winter’’ vomiting disease? Seasonality, hydrology, and norovirus epidemiology in
Toronto, Canada, EcoHealth, 6(2), 192–199, doi:10.1007/s10393-009-0247-8.Hall, G. V., et al. (2002), Foodborne disease in the new millennium: Out of the frying pan and into the fire?, Med. J. Aust., 177(11/12), 614–619.Harper, S. L., V. L. Edge, C. J. Schuster-Wallace, O. Berke, and S. A. McEwen (2011), Weather, water quality and infectious gastrointestinal ill-
ness in two Inuit communities in Nunatsiavut, Canada: Potential implications for climate change, EcoHealth, 8(1), 93–108, doi:10.1007/s10393-011-0690-1.
Hashizume, M., B. Armstrong, S. Hajat, Y. Wagatsuma, A. S. G. Faruque, T. Hayashi, and D. A. Sack (2008), The effect of rainfall on the inci-dence of cholera in Bangladesh, Epidemiology, 19(1), 103–110.
Hastie, T. J., and R. J. Tibshirani (1990), Generalized Additive Models, CRC Press, N. Y.IPCC (2007), Climate Change and Water, N. Y.Jagai, J., D. A. Castronovo, J. Monchak, and E. N. Naumova (2009), Seasonality of cryptosporidiosis: A meta-analysis approach, Environ. Res.,
109(4), 465–478.Jagai, J. S., J. K. Griffiths, P. K. Kirshen, P. Webb, and E. N. Naumova (2012), Seasonal patterns of gastrointestinal illness and streamflow
along the Ohio river, Int. J. Environ. Res. Public Health, 9(5), 1771–1790, doi:10.3390/ijerph9051771.Kale, P. L., J. P. Hinde, and F. F. Nobre (2004), Modeling diarrhea disease in children less than 5 years old, Ann. Epidemiol., 14(6), 371–377,
doi:10.1016/j.annepidem.2003.08.001.Kay, D., and R. Falconer (2008), Hydro-epidemiology: The emergence of a research agenda, Environ. Fluid Mech., 8(5–6), 451–459, doi:
10.1007/s10652-008-9096-1.Lake, I. R., G. Bentham, R. S. Kovats, and G. L. Nichols (2005), Effects of weather and river flow on cryptosporidiosis, J. Water Health, 3(4),
469–474.Lal, A., S. Hales, N. French, and M. G. Baker (2012), Seasonality in human zoonotic enteric diseases: A systematic review, PLoS One, 7(4), e31883.Louis, V. R., I. A. Gillespie, S. J. O’Brien, E. Russek-Cohen, A. D. Pearson, and R. R. Colwell (2005), Temperature-driven campylobacter season-
ality in England and Wales, Appl. Environ. Microbiol., 71(1), 85–92, doi:10.1128/AEM.71.1.85-92.2005.Mackey, B. M., and A. L. Kerridge (1988), The effect of incubation temperature and inoculum size on growth of salmonellae in minced beef,
Int. J. Food Microbiol., 6(1), 57–65.McMichael, A. J. (2003), Climate Change and Human Health: Risks and Responses, World Health Organ., Geneva, Switzerland.McMichael, A. J. (2004), Global climate change, in Comparative Quantification of Health Risks: Global and Regional Burden of Disease Attribut-
able to Selected Major Risk Factors, edited by D. Ezzati et al., pp. 1543–1650, World Health Organ., Geneva, Switzerland.Meyers, L. S., G. C. Gamst, and A. J. Guarino (2012), Applied Multivariate Research: Design and Interpretation, 2nd ed., SAGE Publ., Los
Angeles, Calif.Mireku, N., Y. Wang, J. Ager, R. C. Reddy, and A. P. Baptist (2009), Changes in weather and the effects on pediatric asthma exacerbations,
Ann. Allergy Asthma Immunol., 103(3), 220–224, doi:10.1016/S1081-1206(10)60185-8.Mrema, S., A. Shamte, M. Selemani, and H. Masanja (2012), The influence of weather on mortality in rural Tanzania: A time-series analysis
1999–2010, Global Health Action, 5, pp. 33–43, doi:10.3402/gha.v5i0.19068.Naumova, E. (2006), Mystery of seasonality: Getting the rhythm of nature, J. Public Health Policy, 27(1), 2–12, doi:10.1057/
palgrave.jphp.3200061.Parkes, M. W., International Institute for Sustainable Development, and Network for Ecosystem Sustainability & Health (2008), Ecohealth
and Watersheds: Ecosystem Approaches to Re-Integrate Water Resources Management With Health and Well-Being, Int. Inst. for SustainableDev., Winnipeg, Canada.
Water Resources Research 10.1002/2014WR015519
GALWAY ET AL. VC 2014. American Geophysical Union. All Rights Reserved. 10
Patz, J. A., et al. (2000), The potential health impacts of climate variability and change for the United States: Executive summary of thereport of the health sector of the U.S. National Assessment, Environ. Health Perspect., 108(4), 367–376.
Percival, S. L. (2013), Microbiology of Waterborne Diseases, 2nd ed., Elsevier, London, U. K.Rose, J. B., and D. J. Grimes (2001), Reevaluation of Microbial Water Quality: Powerful New Tools for Detection and Risk Assessment, Am. Soc.
for Microbiol., Washington, D. C.Schuster, C. J., A. G. Ellis, W. J. Robertson, D. F. Charron, J. J. Aramini, B. J. Marshall, and D. T. Medeiros (2005), Infectious disease outbreaks
related to drinking water in Canada, 1974–2001, Can. J. Public Health Rev. Can. Sante Publique, 96(4), 254–258.Schwartz, J. (1994), Generalized additive models in epidemiology, in 17th International Biometric Conference, vol. 8, 12 pp., Int. Biometric
Soc., Chennai, India.Seguin, J. (2008), Human Health in a Changing Climate: A Canadian Assessment of Vulnerabilities and Adaptive Capacity, Health Can., Ottawa.Semenza, J. C., and B. Menne (2009), Climate change and infectious diseases in Europe, Lancet Infectious Diseases, 9(6), 365–375.Tabachnick, B. G., and L. S. Fidell (2012), Using Multivariate Statistics, 6th ed., Pearson, Boston, Fla.Tob�ıas, A., and M. S�aez Zafra (2004), Time-Series Regression Models to Study the Short-Term Effects of Environmental Factors on Health.,
Department of Economics, University of Girona, Girona, Spain.Wahba, G. (1990), Spline Models for Observational Data, vol. 59, SIAM, Philadelphia, Pa.White, A. N., V. Ng, C. V. Spain, C. C. Johnson, L. M. Kinlin, and D. N. Fisman (2009), Let the sun shine in: Effects of ultraviolet radiation on
invasive pneumococcal disease risk in Philadelphia, Pennsylvania, BMC Infectious Diseases, 9(1), 196, doi:10.1186/1471-2334-9-196.Wood, S. (2006), Generalized Additive Models: An Introduction With R, Chapman and Hall, Boca Raton, Fla.World Health Organization (2004), Using Climate to Predict Disease Outbreaks: A Review, Geneva, Switzerland.Zhang, Y., P. Bi, and J. Hiller (2008), Climate variations and salmonellosis transmission in Adelaide, South Australia: A comparison between
regression models, Int. J. Biometeorol., 52(3), 179–187.
Water Resources Research 10.1002/2014WR015519
GALWAY ET AL. VC 2014. American Geophysical Union. All Rights Reserved. 11
Related Documents