1 23 Applied Water Science ISSN 2190-5487 Volume 3 Number 1 Appl Water Sci (2013) 3:145-159 DOI 10.1007/s13201-012-0068-8 Hydrochemical characteristics and GIS-based assessment of groundwater quality in the coastal aquifers of Tuticorin corporation, Tamilnadu, India S. Selvam, G. Manimaran & P. Sivasubramanian

Welcome message from author
This document is posted to help you gain knowledge. Please leave a comment to let me know what you think about it! Share it to your friends and learn new things together.
Transcript
1 23
Applied Water Science ISSN 2190-5487Volume 3Number 1 Appl Water Sci (2013) 3:145-159DOI 10.1007/s13201-012-0068-8
Hydrochemical characteristics andGIS-based assessment of groundwaterquality in the coastal aquifers of Tuticorincorporation, Tamilnadu, India
S. Selvam, G. Manimaran &P. Sivasubramanian
1 23
Your article is published under the Creative
Commons Attribution license which allows
users to read, copy, distribute and make
derivative works, as long as the author of
the original work is cited. You may self-
archive this article on your own website, an
institutional repository or funder’s repository
and make it publicly available immediately.
ORIGINAL ARTICLE
Hydrochemical characteristics and GIS-based assessmentof groundwater quality in the coastal aquifers of Tuticorincorporation, Tamilnadu, India
S. Selvam • G. Manimaran • P. Sivasubramanian
Received: 23 May 2012 / Accepted: 19 November 2012 / Published online: 8 December 2012
� The Author(s) 2012. This article is published with open access at Springerlink.com
Abstract Tuticorin corporation stretches geographically
from 8�430–8�510N latitude and 78�50–78�100E longitude,
positioned in the East–West International sea routes on the
South–East coast of India. The rapid urban developments
in the past two decades of Tuticorin have caused depletion
of groundwater quantity, and deterioration of quality
through excessive consumption and influx of pollutants
from natural and anthropogenic activities. The water
samples collected in the field were analyzed for electrical
conductivity, pH, total dissolved solids, major cations like
calcium, magnesium, sodium, potassium, and anions
SUCH AS bicarbonate, carbonate, chloride, nitrate and
sulfate, in the laboratory using the standard methods given
by the American Public Health Association. In order to
assess the groundwater quality, 36 groundwater samples
had been collected in year 2011. The geographic infor-
mation system-based spatial distribution map of different
major elements has been prepared using ArcGIS 9.2. The
Piper plot shows that most of the groundwater samples fall
in the field of Ca2?-Mg2?–Cl--SO42- and Na?-K?–Cl-
-HCO3- by projecting the position on the plots in the tri-
angular field. The cation concentration indicate that 83, 39
and 22 % of the K?, Na?, Ca2? concentrations exceed the
WHO limit. As per Wilcox’s diagram and US Salinity
laboratory classification, most of the groundwater samples
are not suitable for irrigation due to the presence of high
salinity and medium sodium hazard. Irrigation waters
classified based on sodium absorption ratio, have revealed
that 52 % groundwater are in general safe for irrigation,
which needs treatment before use. permeability index also
indicates that the groundwater samples are suitable for
irrigation purpose.
Keywords Groundwater quality � Geographic
information system � Wilcox’s diagram � Permeability
index � Tuticorin corporation � WHO
Introduction
Water is the most important natural resource, which forms
the core of ecological system. Recently there has been
overall development in various fields such as agriculture,
industry and urbanization in India. This has lead to increase
in the demand of water supply which is met mostly from
exploitation of groundwater resources. Hydrochemical
study is a useful tool to identify the suitability of the
groundwater. The physical parameters taken into consid-
eration in the present study are color, odor, turbidity and
temperature. The chemical parameters taken into consid-
eration are hydrogen ion concentration (pH), specific
conductance (EC), total dissolved solids (TDS), total
hardness (TH) and all major cations and anions. Various
workers in our country had carried out extensive studies on
water quality have studied groundwater chemistry of
shallow aquifers in the coastal zones of have concluded
that groundwater present in the shallow aquifers are poor in
quality and beyond potable limit as per the standard set by
WHO (Amer 1995; Chidambaram et al. 2009; Dar et al.
2010). In many coastal towns or cities, groundwater seems
to be the only source of fresh water to meet domestic,
agricultural and industrial needs. But groundwater is under
constant threat of saline water incursion, which seems to
have become a worldwide concern (Rajmohan et al. 1997;
Dar et al. 2011). The rapid growth in population in India
S. Selvam (&) � G. Manimaran � P. Sivasubramanian
Department of Geology, V.O.Chidambaram College,
Thoothukudi 628008, Tamilnadu, India
e-mail: [email protected]
123
Appl Water Sci (2013) 3:145–159
DOI 10.1007/s13201-012-0068-8
enhanced the groundwater salinity through excessive con-
sumption of groundwater for agricultural, domestic and
industrial purposes due to the lack in surface water sources
and high water demand. Moreover, high evaporation and
low and erratic rainfall depleted the groundwater level and
available groundwater quantity, especially in the coastal
areas, and resulted in seawater intrusion (Adepelumi et al.
2009; Rajmohan et al. 2003; Todd 1959). Consequently,
several agriculture farms near to the coast are abandoned
due to groundwater salinity. Further, many inland farms
have also been abandoned and groundwater in most of the
farms is even not supporting date palms though date palms
are very tolerant to salinity (Rajmohan et al. 2003; Selvam
and Sivasubramanian 2012). Hence, it is apparent that
recent studies firmly argue the effect of natural and
anthropogenic contamination sources on groundwater
composition, especially in coastal aquifer, and also imply
the necessity of groundwater contamination studies in
coastal aquifer. In the present study, a detailed investiga-
tion was carried out to evaluate the geochemical processes
regulating groundwater quality in coastal aquifers of
Tuticorin region since the groundwater has been impaired
by natural as well as anthropogenic activities. Anthropo-
genic activities can alter the relative contributions of the
natural causes of variations and also introduce the effects
of pollution (Whittemore et al. 1989).
Geographic information system (GIS) has emerged as a
powerful tool for storing, analyzing and displaying spatial
data, and using these data for decision making in several
areas including engineering and environmental fields
(Goodchild 1993). The purpose of the study is to understand
the groundwater quality in the coastal area and prepare the
spatial distribution map of the various physico-chemical
parameters using the GIS. In this study, GIS is utilized to
locate groundwater quality zones suitable for different
usages such as irrigation and domestic.
Study area
Tuticorin is located on the southeast coat of Tamilnadu,
India. Historically, Tuticorin is famous for its maritime
activity and pearl culture. It was the seaport of the Pandyan
kingdom; it was later taken over by the Portuguese in 1548,
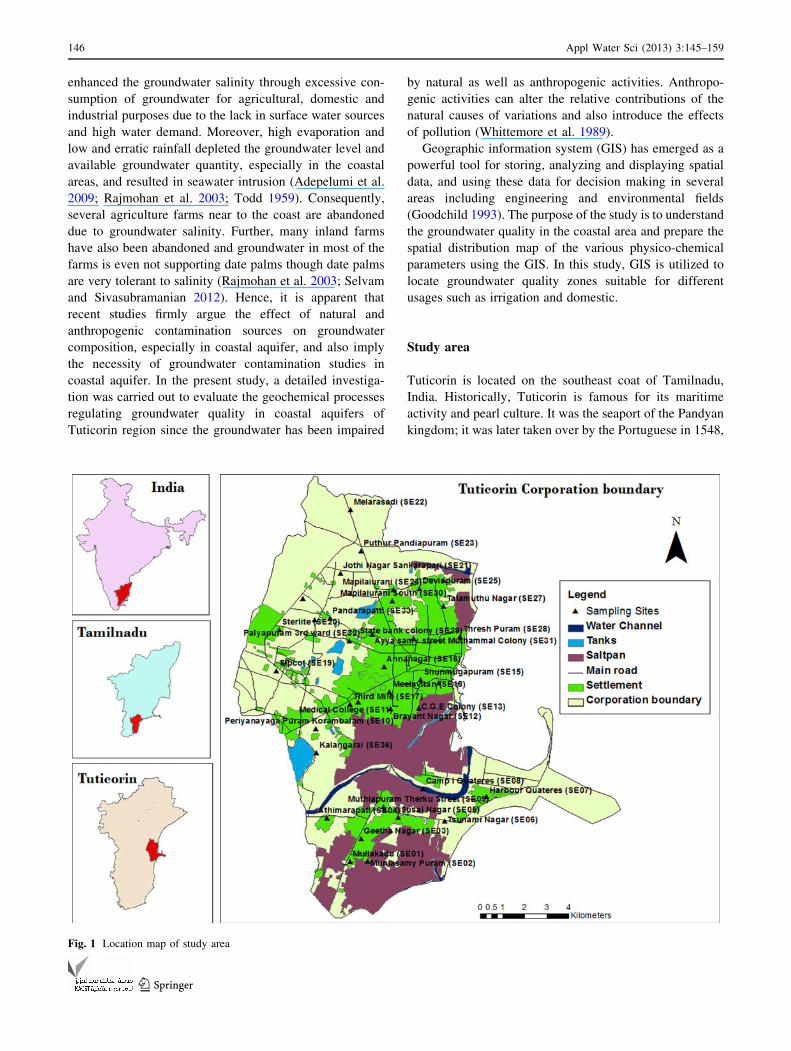
Fig. 1 Location map of study area
146 Appl Water Sci (2013) 3:145–159
123
captured by the Dutch in 1658, and ceded to the British in
1825. The lighthouse built in 1842 marked the beginning of
the history of harbor development in the city. Tuticorin was
established as a Municipality in 1866. It attained the status
of Corporation on 5th August 2008 after 142 years. The
city was industrially developed after the port construction
and became district head quarters in the year 1986. After
the formation of the district head quarters, the economic
development was boosted and began to develop rapidly.
Therefore, the urban expansion takes place in the different
parts of the city during the study period. The study area
covers geographical area of 154 sq km and lies between
8�430–8�510N latitude and 78�50–78�100E longitude
(Fig. 1). Topographic elevation varies from few meters
(near the coastline) to 27 m (amsl) in western part of the
study area. The slope is gentle in the western and the
central part, and nearly flat in the eastern part. Rainfall data
from seven stations over the period of 1901–2008 were
utilized and a perusal of the data shows that the normal
annual rainfall over the district varies from about
570–740 mm. It is minimum around Arasadi (577.4 mm)
and Tuticorin (582.8 mm) in the central eastern part of the
district. The district is covered by Black Cotton soil in the
west, with isolated red soil patches in high ground. The
sandy soil is present in the coastal tract. Alluvial soil is
restricted to river flood plain and coastal part. Alkaline and
saline soils are also noticed at places. Tuticorin is covered
by long and extensive sandy beach. It trends in north–south
direction. Well-developed sandy beach is identified below
south harbor breakwater. This beach is dominated by an
admixture of quartz, feldspars and mica minerals.
Geology and hydrology
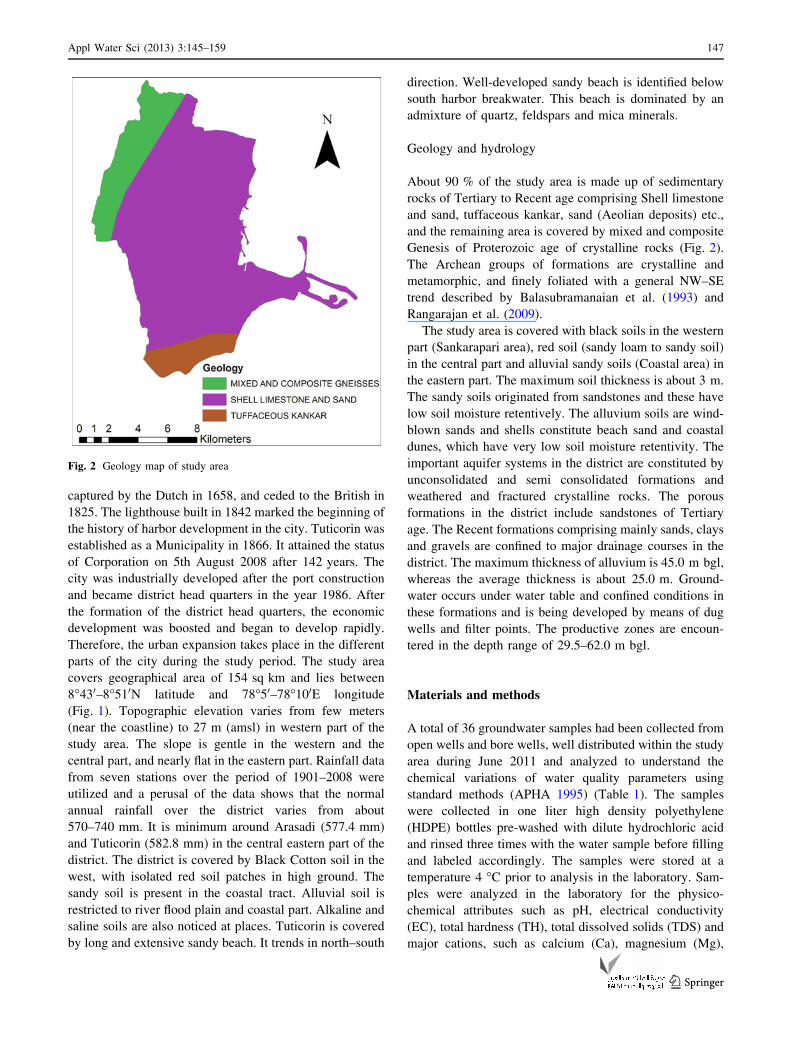
About 90 % of the study area is made up of sedimentary
rocks of Tertiary to Recent age comprising Shell limestone
and sand, tuffaceous kankar, sand (Aeolian deposits) etc.,
and the remaining area is covered by mixed and composite
Genesis of Proterozoic age of crystalline rocks (Fig. 2).
The Archean groups of formations are crystalline and
metamorphic, and finely foliated with a general NW–SE
trend described by Balasubramanaian et al. (1993) and
Rangarajan et al. (2009).
The study area is covered with black soils in the western
part (Sankarapari area), red soil (sandy loam to sandy soil)
in the central part and alluvial sandy soils (Coastal area) in
the eastern part. The maximum soil thickness is about 3 m.
The sandy soils originated from sandstones and these have
low soil moisture retentively. The alluvium soils are wind-
blown sands and shells constitute beach sand and coastal
dunes, which have very low soil moisture retentivity. The
important aquifer systems in the district are constituted by
unconsolidated and semi consolidated formations and
weathered and fractured crystalline rocks. The porous
formations in the district include sandstones of Tertiary
age. The Recent formations comprising mainly sands, clays
and gravels are confined to major drainage courses in the
district. The maximum thickness of alluvium is 45.0 m bgl,
whereas the average thickness is about 25.0 m. Ground-
water occurs under water table and confined conditions in
these formations and is being developed by means of dug
wells and filter points. The productive zones are encoun-
tered in the depth range of 29.5–62.0 m bgl.
Materials and methods
A total of 36 groundwater samples had been collected from
open wells and bore wells, well distributed within the study
area during June 2011 and analyzed to understand the
chemical variations of water quality parameters using
standard methods (APHA 1995) (Table 1). The samples
were collected in one liter high density polyethylene
(HDPE) bottles pre-washed with dilute hydrochloric acid
and rinsed three times with the water sample before filling
and labeled accordingly. The samples were stored at a
temperature 4 �C prior to analysis in the laboratory. Sam-
ples were analyzed in the laboratory for the physico-
chemical attributes such as pH, electrical conductivity
(EC), total hardness (TH), total dissolved solids (TDS) and
major cations, such as calcium (Ca), magnesium (Mg),
Fig. 2 Geology map of study area
Appl Water Sci (2013) 3:145–159 147
123
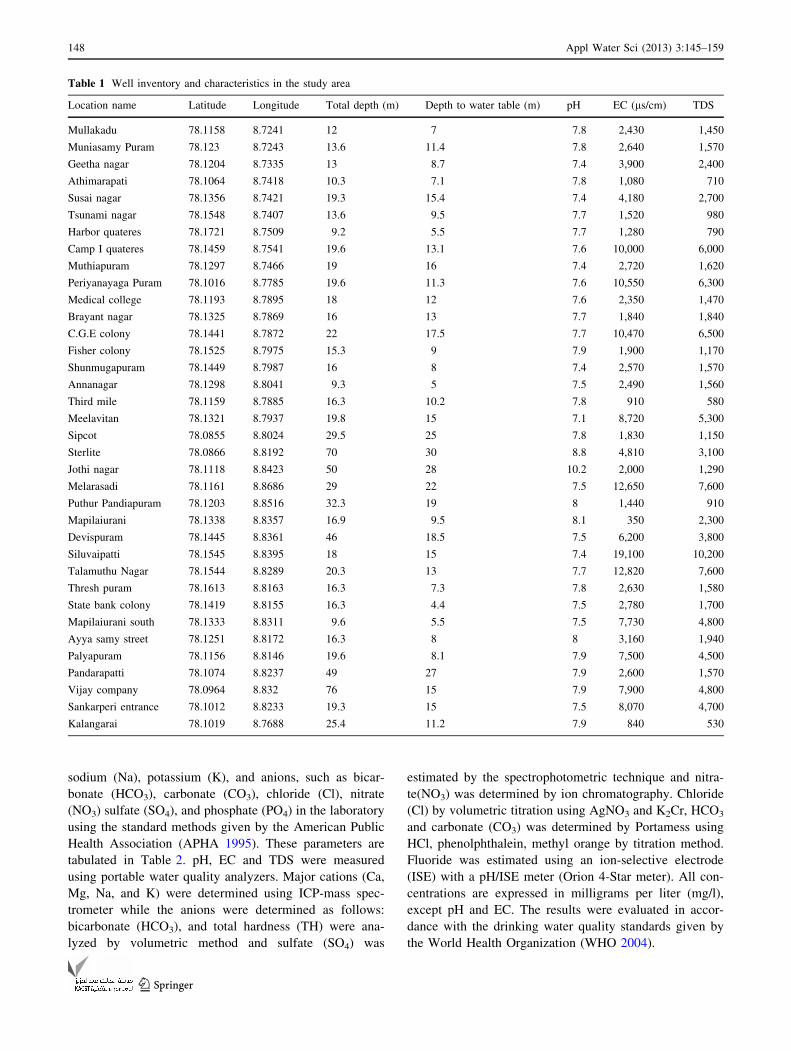
sodium (Na), potassium (K), and anions, such as bicar-
bonate (HCO3), carbonate (CO3), chloride (Cl), nitrate
(NO3) sulfate (SO4), and phosphate (PO4) in the laboratory
using the standard methods given by the American Public
Health Association (APHA 1995). These parameters are
tabulated in Table 2. pH, EC and TDS were measured
using portable water quality analyzers. Major cations (Ca,
Mg, Na, and K) were determined using ICP-mass spec-
trometer while the anions were determined as follows:
bicarbonate (HCO3), and total hardness (TH) were ana-
lyzed by volumetric method and sulfate (SO4) was
estimated by the spectrophotometric technique and nitra-
te(NO3) was determined by ion chromatography. Chloride
(Cl) by volumetric titration using AgNO3 and K2Cr, HCO3
and carbonate (CO3) was determined by Portamess using
HCl, phenolphthalein, methyl orange by titration method.
Fluoride was estimated using an ion-selective electrode
(ISE) with a pH/ISE meter (Orion 4-Star meter). All con-
centrations are expressed in milligrams per liter (mg/l),
except pH and EC. The results were evaluated in accor-
dance with the drinking water quality standards given by
the World Health Organization (WHO 2004).
Table 1 Well inventory and characteristics in the study area
Location name Latitude Longitude Total depth (m) Depth to water table (m) pH EC (ls/cm) TDS
Mullakadu 78.1158 8.7241 12 7 7.8 2,430 1,450
Muniasamy Puram 78.123 8.7243 13.6 11.4 7.8 2,640 1,570
Geetha nagar 78.1204 8.7335 13 8.7 7.4 3,900 2,400
Athimarapati 78.1064 8.7418 10.3 7.1 7.8 1,080 710
Susai nagar 78.1356 8.7421 19.3 15.4 7.4 4,180 2,700
Tsunami nagar 78.1548 8.7407 13.6 9.5 7.7 1,520 980
Harbor quateres 78.1721 8.7509 9.2 5.5 7.7 1,280 790
Camp I quateres 78.1459 8.7541 19.6 13.1 7.6 10,000 6,000
Muthiapuram 78.1297 8.7466 19 16 7.4 2,720 1,620
Periyanayaga Puram 78.1016 8.7785 19.6 11.3 7.6 10,550 6,300
Medical college 78.1193 8.7895 18 12 7.6 2,350 1,470
Brayant nagar 78.1325 8.7869 16 13 7.7 1,840 1,840
C.G.E colony 78.1441 8.7872 22 17.5 7.7 10,470 6,500
Fisher colony 78.1525 8.7975 15.3 9 7.9 1,900 1,170
Shunmugapuram 78.1449 8.7987 16 8 7.4 2,570 1,570
Annanagar 78.1298 8.8041 9.3 5 7.5 2,490 1,560
Third mile 78.1159 8.7885 16.3 10.2 7.8 910 580
Meelavitan 78.1321 8.7937 19.8 15 7.1 8,720 5,300
Sipcot 78.0855 8.8024 29.5 25 7.8 1,830 1,150
Sterlite 78.0866 8.8192 70 30 8.8 4,810 3,100
Jothi nagar 78.1118 8.8423 50 28 10.2 2,000 1,290
Melarasadi 78.1161 8.8686 29 22 7.5 12,650 7,600
Puthur Pandiapuram 78.1203 8.8516 32.3 19 8 1,440 910
Mapilaiurani 78.1338 8.8357 16.9 9.5 8.1 350 2,300
Devispuram 78.1445 8.8361 46 18.5 7.5 6,200 3,800
Siluvaipatti 78.1545 8.8395 18 15 7.4 19,100 10,200
Talamuthu Nagar 78.1544 8.8289 20.3 13 7.7 12,820 7,600
Thresh puram 78.1613 8.8163 16.3 7.3 7.8 2,630 1,580
State bank colony 78.1419 8.8155 16.3 4.4 7.5 2,780 1,700
Mapilaiurani south 78.1333 8.8311 9.6 5.5 7.5 7,730 4,800
Ayya samy street 78.1251 8.8172 16.3 8 8 3,160 1,940
Palyapuram 78.1156 8.8146 19.6 8.1 7.9 7,500 4,500
Pandarapatti 78.1074 8.8237 49 27 7.9 2,600 1,570
Vijay company 78.0964 8.832 76 15 7.9 7,900 4,800
Sankarperi entrance 78.1012 8.8233 19.3 15 7.5 8,070 4,700
Kalangarai 78.1019 8.7688 25.4 11.2 7.9 840 530
148 Appl Water Sci (2013) 3:145–159
123
GIS analysis
The base map of Tuticorin coastal area was digitized from
survey of India toposheet no 58L/1&2 and 58L/5 using
ArcGIS 9.2 software. The precise locations of sampling
points were determined in the field GARMIN 12 Channel
GPS and the exact longitudes and latitudes of sampling
points and imported in GIS platform. The spatial distri-
bution for groundwater quality parameters such as hard-
ness, pH, TDS, HCO3, SO4, NO3, Ca, Mg, Cl and F were
done with the help of spatial analyst modules in ArcGIS 9.2
software.
Result and discussion
Hydrochemistry
Understanding the groundwater quality is important as it is
the main factor determining its suitability for drinking,
agricultural and industrial purposes (Subramani et al.
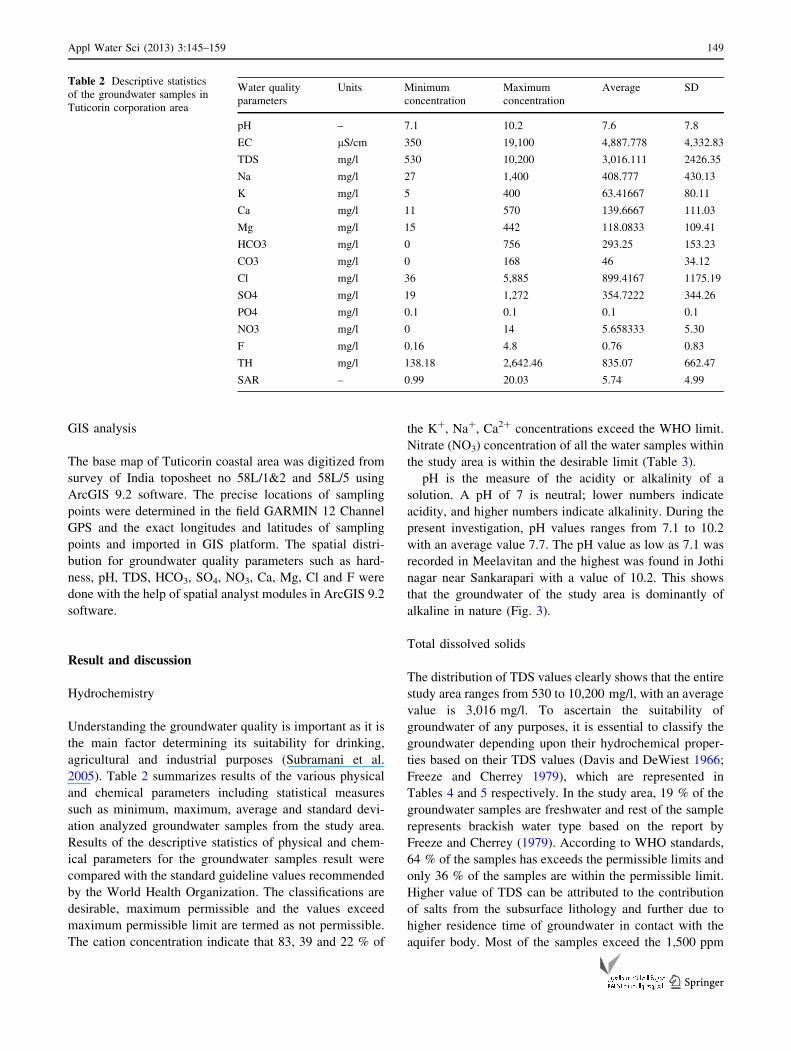
2005). Table 2 summarizes results of the various physical
and chemical parameters including statistical measures
such as minimum, maximum, average and standard devi-
ation analyzed groundwater samples from the study area.
Results of the descriptive statistics of physical and chem-
ical parameters for the groundwater samples result were
compared with the standard guideline values recommended
by the World Health Organization. The classifications are
desirable, maximum permissible and the values exceed
maximum permissible limit are termed as not permissible.
The cation concentration indicate that 83, 39 and 22 % of
the K?, Na?, Ca2? concentrations exceed the WHO limit.
Nitrate (NO3) concentration of all the water samples within
the study area is within the desirable limit (Table 3).
pH is the measure of the acidity or alkalinity of a
solution. A pH of 7 is neutral; lower numbers indicate
acidity, and higher numbers indicate alkalinity. During the
present investigation, pH values ranges from 7.1 to 10.2
with an average value 7.7. The pH value as low as 7.1 was
recorded in Meelavitan and the highest was found in Jothi
nagar near Sankarapari with a value of 10.2. This shows
that the groundwater of the study area is dominantly of
alkaline in nature (Fig. 3).
Total dissolved solids
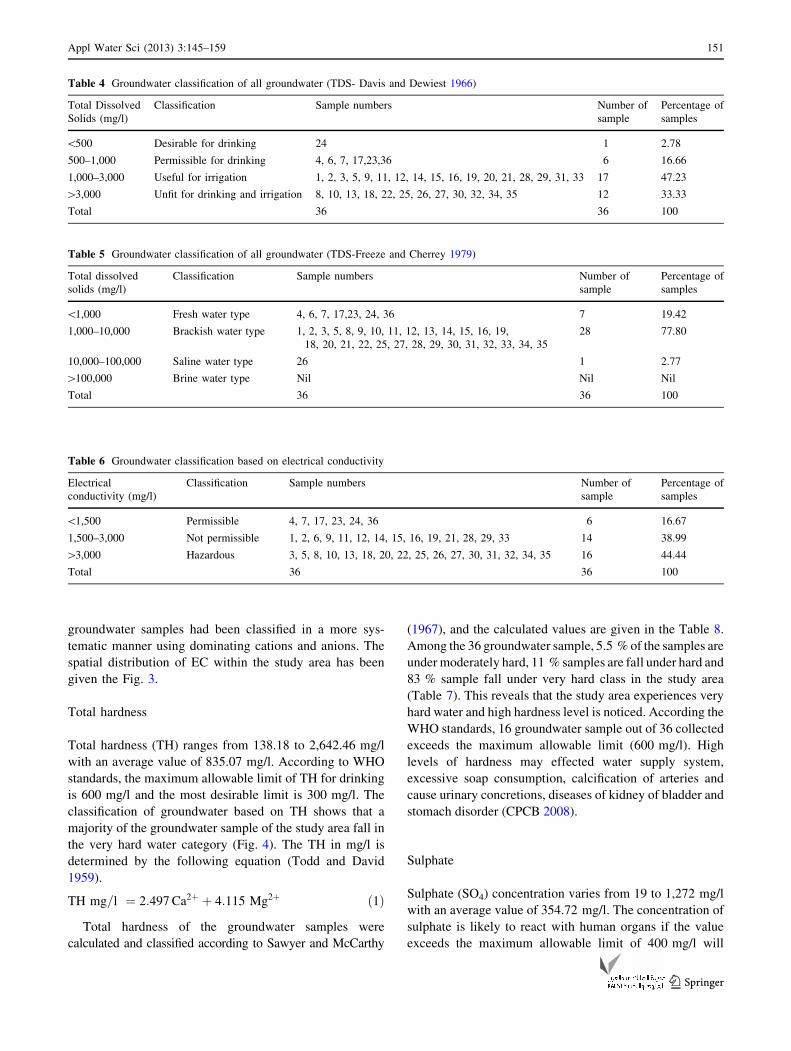
The distribution of TDS values clearly shows that the entire
study area ranges from 530 to 10,200 mg/l, with an average
value is 3,016 mg/l. To ascertain the suitability of
groundwater of any purposes, it is essential to classify the
groundwater depending upon their hydrochemical proper-
ties based on their TDS values (Davis and DeWiest 1966;
Freeze and Cherrey 1979), which are represented in
Tables 4 and 5 respectively. In the study area, 19 % of the
groundwater samples are freshwater and rest of the sample
represents brackish water type based on the report by
Freeze and Cherrey (1979). According to WHO standards,
64 % of the samples has exceeds the permissible limits and
only 36 % of the samples are within the permissible limit.
Higher value of TDS can be attributed to the contribution
of salts from the subsurface lithology and further due to
higher residence time of groundwater in contact with the
aquifer body. Most of the samples exceed the 1,500 ppm
Table 2 Descriptive statistics
of the groundwater samples in
Tuticorin corporation area
Water quality
parameters
Units Minimum
concentration
Maximum
concentration
Average SD
pH – 7.1 10.2 7.6 7.8
EC lS/cm 350 19,100 4,887.778 4,332.83
TDS mg/l 530 10,200 3,016.111 2426.35
Na mg/l 27 1,400 408.777 430.13
K mg/l 5 400 63.41667 80.11
Ca mg/l 11 570 139.6667 111.03
Mg mg/l 15 442 118.0833 109.41
HCO3 mg/l 0 756 293.25 153.23
CO3 mg/l 0 168 46 34.12
Cl mg/l 36 5,885 899.4167 1175.19
SO4 mg/l 19 1,272 354.7222 344.26
PO4 mg/l 0.1 0.1 0.1 0.1
NO3 mg/l 0 14 5.658333 5.30
F mg/l 0.16 4.8 0.76 0.83
TH mg/l 138.18 2,642.46 835.07 662.47
SAR – 0.99 20.03 5.74 4.99
Appl Water Sci (2013) 3:145–159 149
123
indicates may be attributed to infiltration from the sewage
canals unprotected drainages and industrial wastes. The
groundwater samples collected from Mappilaiurani,
Kalangarai and Thirdmile are within the desirable limit and
suitable for drinking purpose without any risk.
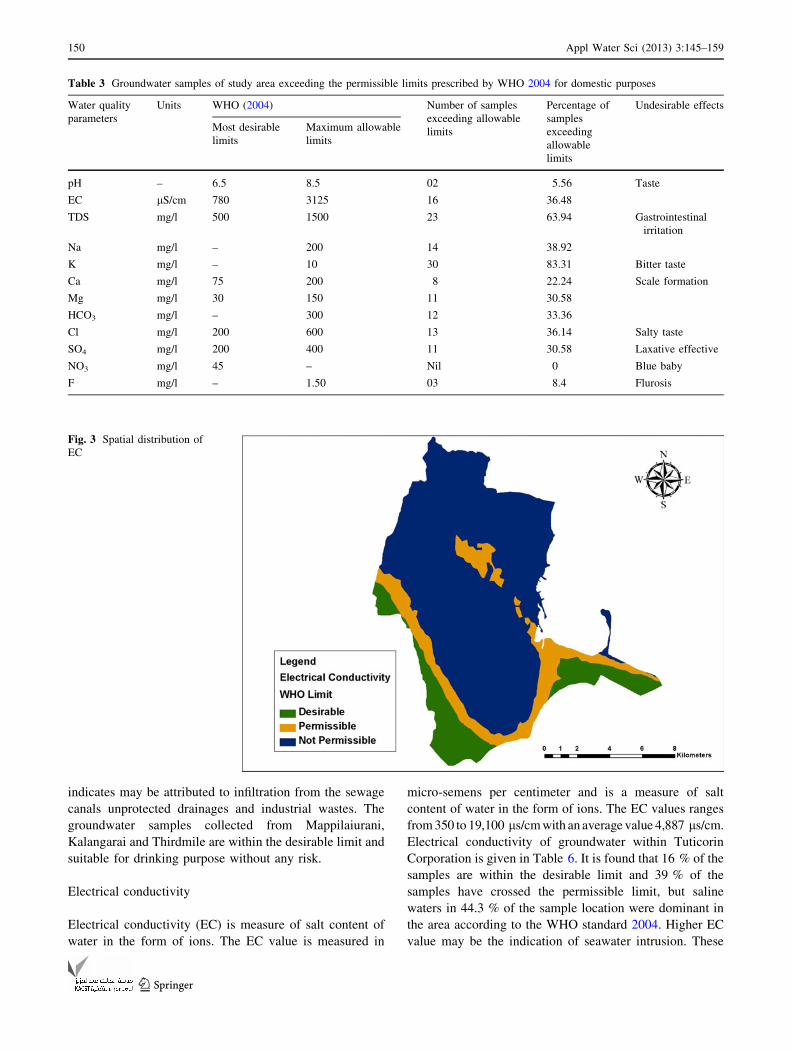
Electrical conductivity
Electrical conductivity (EC) is measure of salt content of
water in the form of ions. The EC value is measured in
micro-semens per centimeter and is a measure of salt
content of water in the form of ions. The EC values ranges
from 350 to 19,100 ls/cm with an average value 4,887 ls/cm.
Electrical conductivity of groundwater within Tuticorin
Corporation is given in Table 6. It is found that 16 % of the
samples are within the desirable limit and 39 % of the
samples have crossed the permissible limit, but saline
waters in 44.3 % of the sample location were dominant in
the area according to the WHO standard 2004. Higher EC
value may be the indication of seawater intrusion. These
Table 3 Groundwater samples of study area exceeding the permissible limits prescribed by WHO 2004 for domestic purposes
Water quality
parameters
Units WHO (2004) Number of samples
exceeding allowable
limits
Percentage of
samples
exceeding
allowable
limits
Undesirable effects
Most desirable
limits
Maximum allowable
limits
pH – 6.5 8.5 02 5.56 Taste
EC lS/cm 780 3125 16 36.48
TDS mg/l 500 1500 23 63.94 Gastrointestinal
irritation
Na mg/l – 200 14 38.92
K mg/l – 10 30 83.31 Bitter taste
Ca mg/l 75 200 8 22.24 Scale formation
Mg mg/l 30 150 11 30.58
HCO3 mg/l – 300 12 33.36
Cl mg/l 200 600 13 36.14 Salty taste
SO4 mg/l 200 400 11 30.58 Laxative effective
NO3 mg/l 45 – Nil 0 Blue baby
F mg/l – 1.50 03 8.4 Flurosis
Fig. 3 Spatial distribution of
EC
150 Appl Water Sci (2013) 3:145–159
123
groundwater samples had been classified in a more sys-
tematic manner using dominating cations and anions. The
spatial distribution of EC within the study area has been
given the Fig. 3.
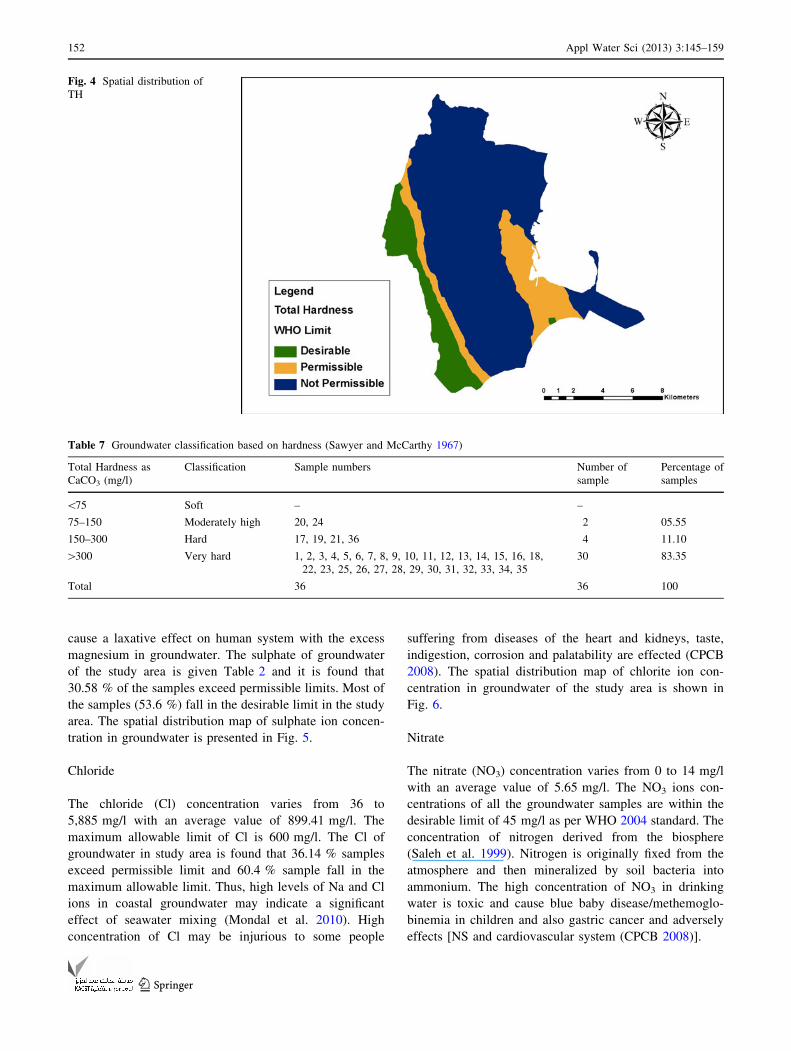
Total hardness
Total hardness (TH) ranges from 138.18 to 2,642.46 mg/l
with an average value of 835.07 mg/l. According to WHO
standards, the maximum allowable limit of TH for drinking
is 600 mg/l and the most desirable limit is 300 mg/l. The
classification of groundwater based on TH shows that a
majority of the groundwater sample of the study area fall in
the very hard water category (Fig. 4). The TH in mg/l is
determined by the following equation (Todd and David
1959).
TH mg=l ¼ 2:497 Ca2þ þ 4:115 Mg2þ ð1Þ
Total hardness of the groundwater samples were
calculated and classified according to Sawyer and McCarthy
(1967), and the calculated values are given in the Table 8.
Among the 36 groundwater sample, 5.5 % of the samples are
under moderately hard, 11 % samples are fall under hard and
83 % sample fall under very hard class in the study area
(Table 7). This reveals that the study area experiences very
hard water and high hardness level is noticed. According the
WHO standards, 16 groundwater sample out of 36 collected
exceeds the maximum allowable limit (600 mg/l). High
levels of hardness may effected water supply system,
excessive soap consumption, calcification of arteries and
cause urinary concretions, diseases of kidney of bladder and
stomach disorder (CPCB 2008).
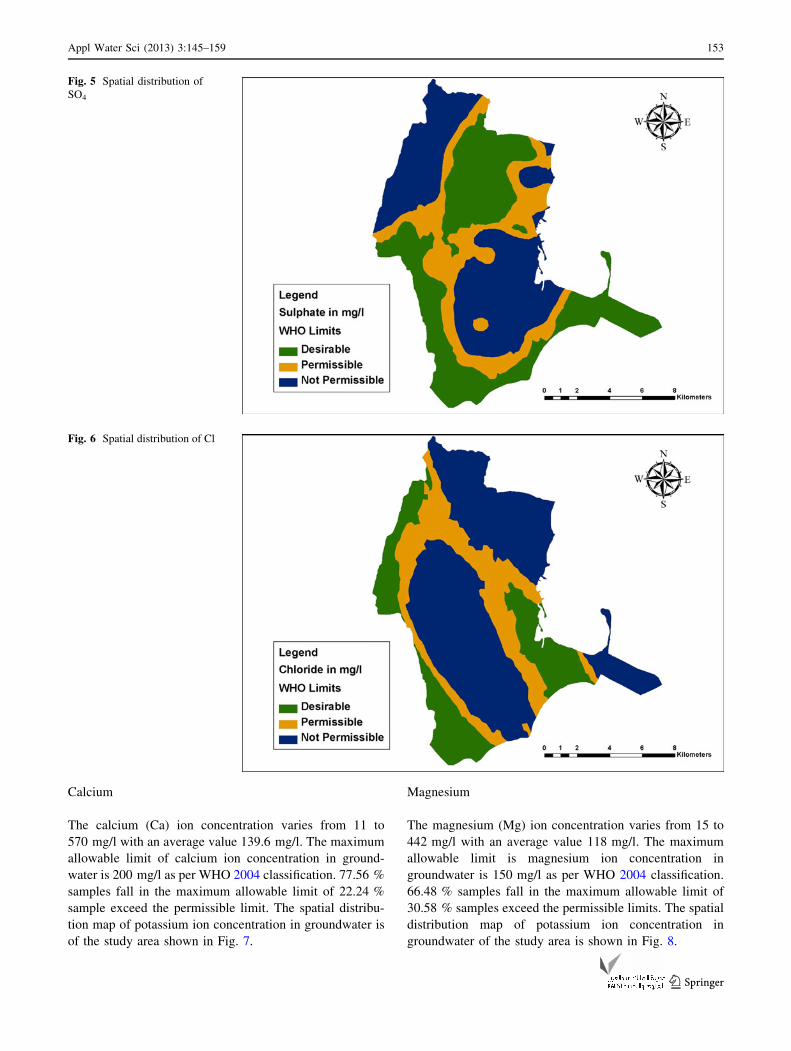
Sulphate
Sulphate (SO4) concentration varies from 19 to 1,272 mg/l
with an average value of 354.72 mg/l. The concentration of
sulphate is likely to react with human organs if the value
exceeds the maximum allowable limit of 400 mg/l will
Table 4 Groundwater classification of all groundwater (TDS- Davis and Dewiest 1966)
Total Dissolved
Solids (mg/l)
Classification Sample numbers Number of
sample
Percentage of
samples
\500 Desirable for drinking 24 1 2.78
500–1,000 Permissible for drinking 4, 6, 7, 17,23,36 6 16.66
1,000–3,000 Useful for irrigation 1, 2, 3, 5, 9, 11, 12, 14, 15, 16, 19, 20, 21, 28, 29, 31, 33 17 47.23
[3,000 Unfit for drinking and irrigation 8, 10, 13, 18, 22, 25, 26, 27, 30, 32, 34, 35 12 33.33
Total 36 36 100
Table 5 Groundwater classification of all groundwater (TDS-Freeze and Cherrey 1979)
Total dissolved
solids (mg/l)
Classification Sample numbers Number of
sample
Percentage of
samples
\1,000 Fresh water type 4, 6, 7, 17,23, 24, 36 7 19.42
1,000–10,000 Brackish water type 1, 2, 3, 5, 8, 9, 10, 11, 12, 13, 14, 15, 16, 19,
18, 20, 21, 22, 25, 27, 28, 29, 30, 31, 32, 33, 34, 35
28 77.80
10,000–100,000 Saline water type 26 1 2.77
[100,000 Brine water type Nil Nil Nil
Total 36 36 100
Table 6 Groundwater classification based on electrical conductivity
Electrical
conductivity (mg/l)
Classification Sample numbers Number of
sample
Percentage of
samples
\1,500 Permissible 4, 7, 17, 23, 24, 36 6 16.67
1,500–3,000 Not permissible 1, 2, 6, 9, 11, 12, 14, 15, 16, 19, 21, 28, 29, 33 14 38.99
[3,000 Hazardous 3, 5, 8, 10, 13, 18, 20, 22, 25, 26, 27, 30, 31, 32, 34, 35 16 44.44
Total 36 36 100
Appl Water Sci (2013) 3:145–159 151
123
cause a laxative effect on human system with the excess
magnesium in groundwater. The sulphate of groundwater
of the study area is given Table 2 and it is found that
30.58 % of the samples exceed permissible limits. Most of
the samples (53.6 %) fall in the desirable limit in the study
area. The spatial distribution map of sulphate ion concen-
tration in groundwater is presented in Fig. 5.
Chloride
The chloride (Cl) concentration varies from 36 to
5,885 mg/l with an average value of 899.41 mg/l. The
maximum allowable limit of Cl is 600 mg/l. The Cl of
groundwater in study area is found that 36.14 % samples
exceed permissible limit and 60.4 % sample fall in the
maximum allowable limit. Thus, high levels of Na and Cl
ions in coastal groundwater may indicate a significant
effect of seawater mixing (Mondal et al. 2010). High
concentration of Cl may be injurious to some people
suffering from diseases of the heart and kidneys, taste,
indigestion, corrosion and palatability are effected (CPCB
2008). The spatial distribution map of chlorite ion con-
centration in groundwater of the study area is shown in
Fig. 6.
Nitrate
The nitrate (NO3) concentration varies from 0 to 14 mg/l
with an average value of 5.65 mg/l. The NO3 ions con-
centrations of all the groundwater samples are within the
desirable limit of 45 mg/l as per WHO 2004 standard. The
concentration of nitrogen derived from the biosphere
(Saleh et al. 1999). Nitrogen is originally fixed from the
atmosphere and then mineralized by soil bacteria into
ammonium. The high concentration of NO3 in drinking
water is toxic and cause blue baby disease/methemoglo-
binemia in children and also gastric cancer and adversely
effects [NS and cardiovascular system (CPCB 2008)].
Fig. 4 Spatial distribution of
TH
Table 7 Groundwater classification based on hardness (Sawyer and McCarthy 1967)
Total Hardness as
CaCO3 (mg/l)
Classification Sample numbers Number of
sample
Percentage of
samples
\75 Soft – –
75–150 Moderately high 20, 24 2 05.55
150–300 Hard 17, 19, 21, 36 4 11.10
[300 Very hard 1, 2, 3, 4, 5, 6, 7, 8, 9, 10, 11, 12, 13, 14, 15, 16, 18,
22, 23, 25, 26, 27, 28, 29, 30, 31, 32, 33, 34, 35
30 83.35
Total 36 36 100
152 Appl Water Sci (2013) 3:145–159
123
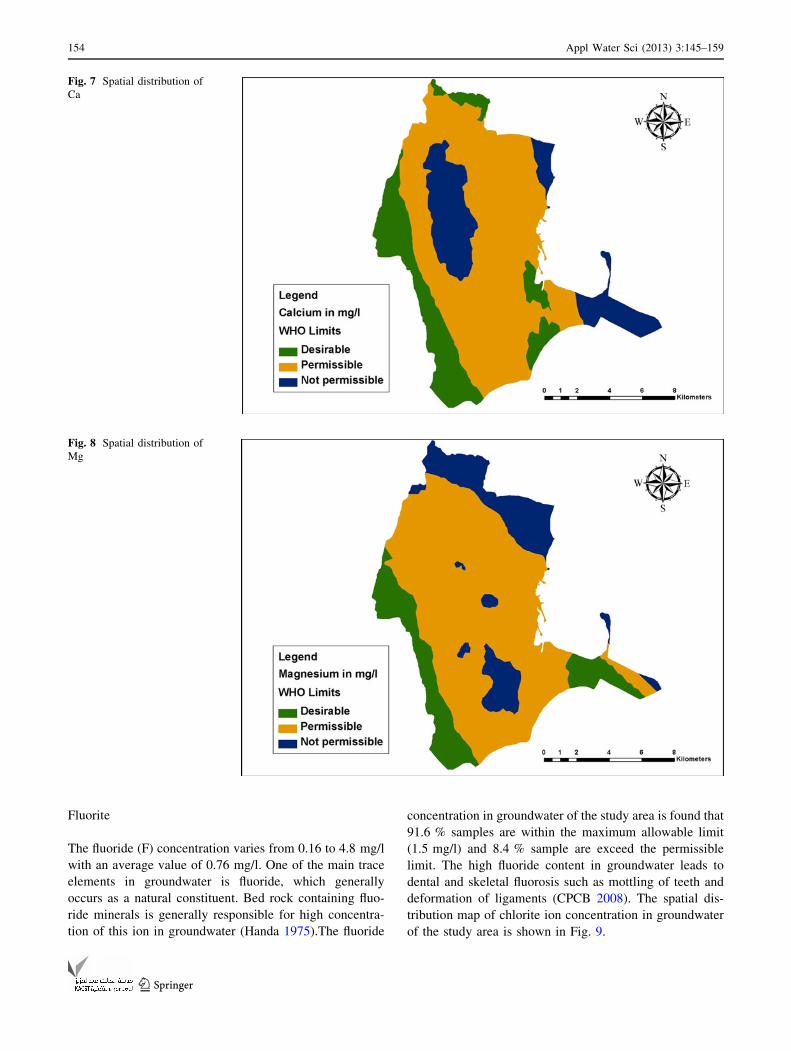
Calcium
The calcium (Ca) ion concentration varies from 11 to
570 mg/l with an average value 139.6 mg/l. The maximum
allowable limit of calcium ion concentration in ground-
water is 200 mg/l as per WHO 2004 classification. 77.56 %
samples fall in the maximum allowable limit of 22.24 %
sample exceed the permissible limit. The spatial distribu-
tion map of potassium ion concentration in groundwater is
of the study area shown in Fig. 7.
Magnesium
The magnesium (Mg) ion concentration varies from 15 to
442 mg/l with an average value 118 mg/l. The maximum
allowable limit is magnesium ion concentration in
groundwater is 150 mg/l as per WHO 2004 classification.
66.48 % samples fall in the maximum allowable limit of
30.58 % samples exceed the permissible limits. The spatial
distribution map of potassium ion concentration in
groundwater of the study area is shown in Fig. 8.
Fig. 5 Spatial distribution of
SO4
Fig. 6 Spatial distribution of Cl
Appl Water Sci (2013) 3:145–159 153
123
Fluorite
The fluoride (F) concentration varies from 0.16 to 4.8 mg/l
with an average value of 0.76 mg/l. One of the main trace
elements in groundwater is fluoride, which generally
occurs as a natural constituent. Bed rock containing fluo-
ride minerals is generally responsible for high concentra-
tion of this ion in groundwater (Handa 1975).The fluoride
concentration in groundwater of the study area is found that
91.6 % samples are within the maximum allowable limit
(1.5 mg/l) and 8.4 % sample are exceed the permissible
limit. The high fluoride content in groundwater leads to
dental and skeletal fluorosis such as mottling of teeth and
deformation of ligaments (CPCB 2008). The spatial dis-
tribution map of chlorite ion concentration in groundwater
of the study area is shown in Fig. 9.
Fig. 7 Spatial distribution of
Ca
Fig. 8 Spatial distribution of
Mg
154 Appl Water Sci (2013) 3:145–159
123
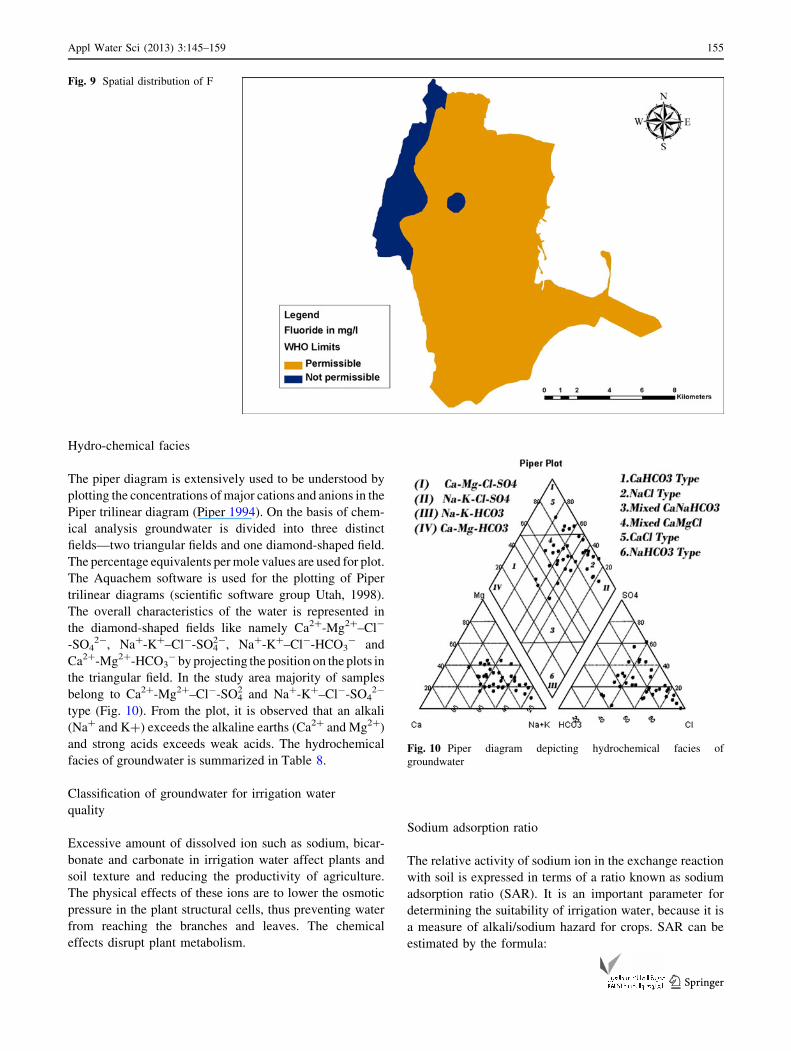
Hydro-chemical facies
The piper diagram is extensively used to be understood by
plotting the concentrations of major cations and anions in the
Piper trilinear diagram (Piper 1994). On the basis of chem-
ical analysis groundwater is divided into three distinct
fields—two triangular fields and one diamond-shaped field.
The percentage equivalents per mole values are used for plot.
The Aquachem software is used for the plotting of Piper
trilinear diagrams (scientific software group Utah, 1998).
The overall characteristics of the water is represented in
the diamond-shaped fields like namely Ca2?-Mg2?–Cl-
-SO42-, Na?-K?–Cl--SO4
2-, Na?-K?–Cl--HCO3- and
Ca2?-Mg2?-HCO3- by projecting the position on the plots in
the triangular field. In the study area majority of samples
belong to Ca2?-Mg2?–Cl--SO42 and Na?-K?–Cl--SO4
2-
type (Fig. 10). From the plot, it is observed that an alkali
(Na? and K?) exceeds the alkaline earths (Ca2? and Mg2?)
and strong acids exceeds weak acids. The hydrochemical
facies of groundwater is summarized in Table 8.
Classification of groundwater for irrigation water
quality
Excessive amount of dissolved ion such as sodium, bicar-
bonate and carbonate in irrigation water affect plants and
soil texture and reducing the productivity of agriculture.
The physical effects of these ions are to lower the osmotic
pressure in the plant structural cells, thus preventing water
from reaching the branches and leaves. The chemical
effects disrupt plant metabolism.
Sodium adsorption ratio
The relative activity of sodium ion in the exchange reaction
with soil is expressed in terms of a ratio known as sodium
adsorption ratio (SAR). It is an important parameter for
determining the suitability of irrigation water, because it is
a measure of alkali/sodium hazard for crops. SAR can be
estimated by the formula:
Fig. 9 Spatial distribution of F
Fig. 10 Piper diagram depicting hydrochemical facies of
groundwater
Appl Water Sci (2013) 3:145–159 155
123
SAR ¼ Naþffiffiffiffiffiffiffiffiffiffiffiffiffiffiffiffiffiffiffiffiffi
ðCa2þþMg2þÞ2
q ð2Þ
There is a significant relationship between sodium
adsorption ratio of irrigation water and the extent to
which sodium is absorbed by the soils. If water used for
irrigation is high in sodium and low in calcium content,
then exchangeable calcium in soil may replace sodium by
base exchange reaction in water. This can destroy the soil
structure owing to dispersion of the clay particles. The
SAR values in the study area range from 0.99 to 20.03 with
an average of 5.74 (Table 2). None of the water samples
exceeds the SAR value of 12. So the groundwaters within
the study area are suitable for irrigation purpose (Table 9).
Based on the Herman Bower classification (1978), all
groundwater samples fall under no problem category of
irrigation water quality (SAR \ 6). If the SAR value
ranges from 6 to 9, the irrigation water will cause
permeability problems in shrinking and swelling types of
clayey soils (Saleh et al. 1999).
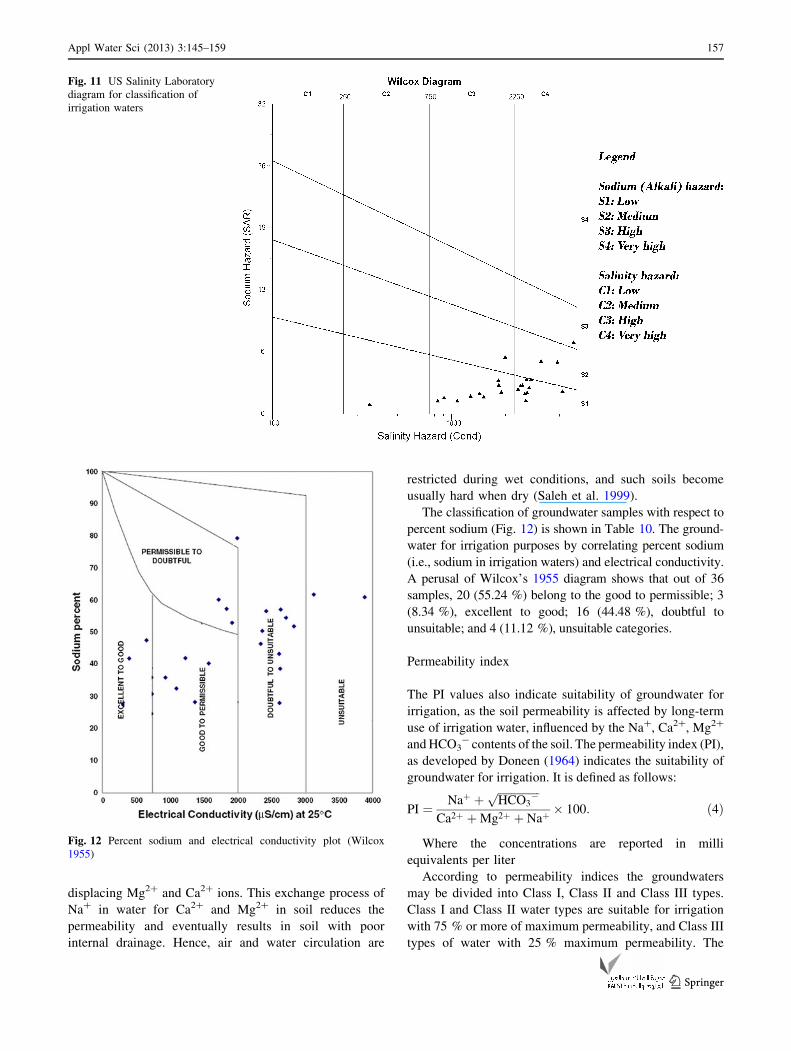
The analytical data plotted on the US Salinity Laboratory
Diagram (Richards 1954) illustrates that most of the
groundwater samples (52.63 % samples) fall in the field of
C3S1 and C4S1 (high to very high salinity with low sodium)
waters, indicating very high salinity and low sodium water
type, which can be used for irrigation on almost all types of
soil with little danger of exchangeable sodium (Fig. 11).
Among the water samples collected, 5.56 % of the ground-
water fall in the field of C4S2 indicating very high salinity
and medium sodium hazard. This can be suitable for plants
having good salt tolerance, and restricts their suitability
for irrigation, especially in soils with restricted drainage
(Karanth 1989; Mohan et al. 2000). 2.78 % of the sample fall
in the field of C2S1 indicating medium salinity and low
sodium, C3S2, indicating high salinity and medium sodium,
and C4S3 falls indicating very high salinity and high sodium
hazard in the classification.
Percent sodium
Sodium concentration is important in classifying irrigation
water, because sodium reacts with soil to reduce its perme-
ability. Excess sodium in waters produces undesirable effects
of changing soil properties and reducing soil permeability
(Kelly 1951). Hence, the assessment of sodium concentration
is of utmost importance while considering the suitability of
irrigation water. In all natural waters percent of sodium con-
tent is a parameter to evaluate its suitability for agricultural
purposes sodium combining with carbonate can lead to the
formation of alkaline soils, whereas sodium combining with
chloride form saline soils (Wilcox 1955). Both these soils do
not help for the growth of plants. The sodium percentage
(Na %) is calculated using the formula given below
Naþ% ¼ Naþ þ Kþ
Ca2þ þMg2þ þ Naþ þ Kþ� 100 ð3Þ
When the concentration of sodium is high in irrigation
water, sodium ions tend to be absorbed by clay particles,
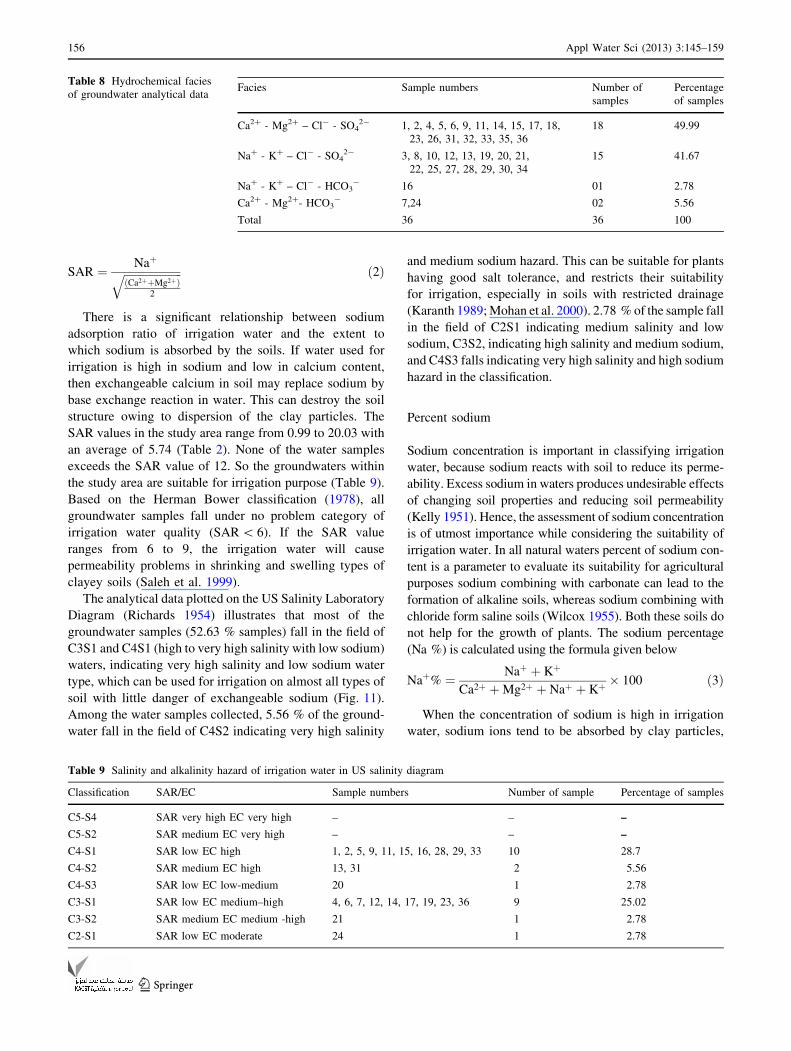
Table 8 Hydrochemical facies
of groundwater analytical dataFacies Sample numbers Number of
samples
Percentage
of samples
Ca2? - Mg2? – Cl- - SO42- 1, 2, 4, 5, 6, 9, 11, 14, 15, 17, 18,
23, 26, 31, 32, 33, 35, 36
18 49.99
Na? - K? – Cl- - SO42- 3, 8, 10, 12, 13, 19, 20, 21,
22, 25, 27, 28, 29, 30, 34
15 41.67
Na? - K? – Cl- - HCO3- 16 01 2.78
Ca2? - Mg2?- HCO3- 7,24 02 5.56
Total 36 36 100
Table 9 Salinity and alkalinity hazard of irrigation water in US salinity diagram
Classification SAR/EC Sample numbers Number of sample Percentage of samples
C5-S4 SAR very high EC very high – – –
C5-S2 SAR medium EC very high – – –
C4-S1 SAR low EC high 1, 2, 5, 9, 11, 15, 16, 28, 29, 33 10 28.7
C4-S2 SAR medium EC high 13, 31 2 5.56
C4-S3 SAR low EC low-medium 20 1 2.78
C3-S1 SAR low EC medium–high 4, 6, 7, 12, 14, 17, 19, 23, 36 9 25.02
C3-S2 SAR medium EC medium -high 21 1 2.78
C2-S1 SAR low EC moderate 24 1 2.78
156 Appl Water Sci (2013) 3:145–159
123
displacing Mg2? and Ca2? ions. This exchange process of
Na? in water for Ca2? and Mg2? in soil reduces the
permeability and eventually results in soil with poor
internal drainage. Hence, air and water circulation are
restricted during wet conditions, and such soils become
usually hard when dry (Saleh et al. 1999).
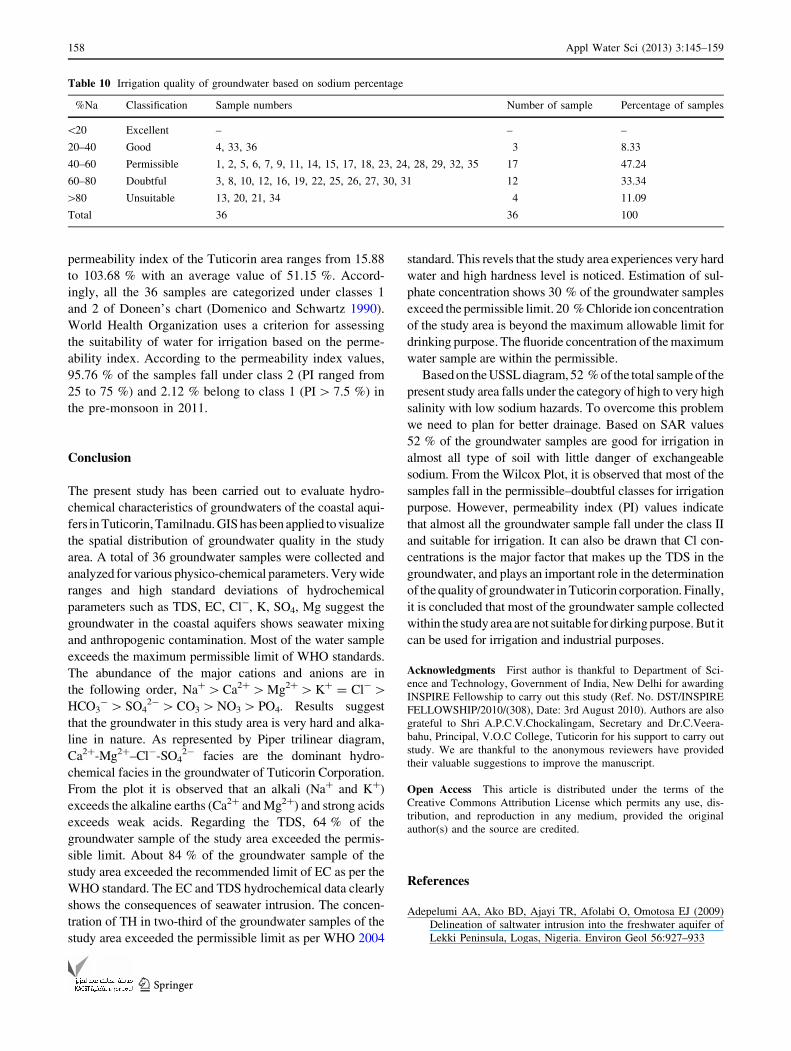
The classification of groundwater samples with respect to
percent sodium (Fig. 12) is shown in Table 10. The ground-
water for irrigation purposes by correlating percent sodium
(i.e., sodium in irrigation waters) and electrical conductivity.
A perusal of Wilcox’s 1955 diagram shows that out of 36
samples, 20 (55.24 %) belong to the good to permissible; 3
(8.34 %), excellent to good; 16 (44.48 %), doubtful to
unsuitable; and 4 (11.12 %), unsuitable categories.
Permeability index
The PI values also indicate suitability of groundwater for
irrigation, as the soil permeability is affected by long-term
use of irrigation water, influenced by the Na?, Ca2?, Mg2?
and HCO3- contents of the soil. The permeability index (PI),
as developed by Doneen (1964) indicates the suitability of
groundwater for irrigation. It is defined as follows:
PI ¼ Naþ þffiffiffiffiffiffiffiffiffiffiffiffiffiffiffi
HCO3�p
Ca2þ þMg2þ þ Naþ� 100: ð4Þ
Where the concentrations are reported in milli
equivalents per liter
According to permeability indices the groundwaters
may be divided into Class I, Class II and Class III types.
Class I and Class II water types are suitable for irrigation
with 75 % or more of maximum permeability, and Class III
types of water with 25 % maximum permeability. The
Fig. 11 US Salinity Laboratory
diagram for classification of
irrigation waters
Fig. 12 Percent sodium and electrical conductivity plot (Wilcox
1955)
Appl Water Sci (2013) 3:145–159 157
123
permeability index of the Tuticorin area ranges from 15.88
to 103.68 % with an average value of 51.15 %. Accord-
ingly, all the 36 samples are categorized under classes 1
and 2 of Doneen’s chart (Domenico and Schwartz 1990).
World Health Organization uses a criterion for assessing
the suitability of water for irrigation based on the perme-
ability index. According to the permeability index values,
95.76 % of the samples fall under class 2 (PI ranged from
25 to 75 %) and 2.12 % belong to class 1 (PI [ 7.5 %) in
the pre-monsoon in 2011.
Conclusion
The present study has been carried out to evaluate hydro-
chemical characteristics of groundwaters of the coastal aqui-
fers in Tuticorin, Tamilnadu. GIS has been applied to visualize
the spatial distribution of groundwater quality in the study
area. A total of 36 groundwater samples were collected and
analyzed for various physico-chemical parameters. Very wide
ranges and high standard deviations of hydrochemical
parameters such as TDS, EC, Cl-, K, SO4, Mg suggest the
groundwater in the coastal aquifers shows seawater mixing
and anthropogenic contamination. Most of the water sample
exceeds the maximum permissible limit of WHO standards.
The abundance of the major cations and anions are in
the following order, Na? [ Ca2? [ Mg2? [ K? = Cl- [HCO3
- [ SO42- [ CO3 [ NO3 [ PO4. Results suggest
that the groundwater in this study area is very hard and alka-
line in nature. As represented by Piper trilinear diagram,
Ca2?-Mg2?–Cl--SO42- facies are the dominant hydro-
chemical facies in the groundwater of Tuticorin Corporation.
From the plot it is observed that an alkali (Na? and K?)
exceeds the alkaline earths (Ca2? and Mg2?) and strong acids
exceeds weak acids. Regarding the TDS, 64 % of the
groundwater sample of the study area exceeded the permis-
sible limit. About 84 % of the groundwater sample of the
study area exceeded the recommended limit of EC as per the
WHO standard. The EC and TDS hydrochemical data clearly
shows the consequences of seawater intrusion. The concen-
tration of TH in two-third of the groundwater samples of the
study area exceeded the permissible limit as per WHO 2004
standard. This revels that the study area experiences very hard
water and high hardness level is noticed. Estimation of sul-
phate concentration shows 30 % of the groundwater samples
exceed the permissible limit. 20 % Chloride ion concentration
of the study area is beyond the maximum allowable limit for
drinking purpose. The fluoride concentration of the maximum
water sample are within the permissible.
Based on the USSL diagram, 52 % of the total sample of the
present study area falls under the category of high to very high
salinity with low sodium hazards. To overcome this problem
we need to plan for better drainage. Based on SAR values
52 % of the groundwater samples are good for irrigation in
almost all type of soil with little danger of exchangeable
sodium. From the Wilcox Plot, it is observed that most of the
samples fall in the permissible–doubtful classes for irrigation
purpose. However, permeability index (PI) values indicate
that almost all the groundwater sample fall under the class II
and suitable for irrigation. It can also be drawn that Cl con-
centrations is the major factor that makes up the TDS in the
groundwater, and plays an important role in the determination
of the quality of groundwater in Tuticorin corporation. Finally,
it is concluded that most of the groundwater sample collected
within the study area are not suitable for dirking purpose. But it
can be used for irrigation and industrial purposes.
Acknowledgments First author is thankful to Department of Sci-
ence and Technology, Government of India, New Delhi for awarding
INSPIRE Fellowship to carry out this study (Ref. No. DST/INSPIRE
FELLOWSHIP/2010/(308), Date: 3rd August 2010). Authors are also
grateful to Shri A.P.C.V.Chockalingam, Secretary and Dr.C.Veera-
bahu, Principal, V.O.C College, Tuticorin for his support to carry out
study. We are thankful to the anonymous reviewers have provided
their valuable suggestions to improve the manuscript.
Open Access This article is distributed under the terms of the
Creative Commons Attribution License which permits any use, dis-
tribution, and reproduction in any medium, provided the original
author(s) and the source are credited.
References
Adepelumi AA, Ako BD, Ajayi TR, Afolabi O, Omotosa EJ (2009)
Delineation of saltwater intrusion into the freshwater aquifer of
Lekki Peninsula, Logas, Nigeria. Environ Geol 56:927–933
Table 10 Irrigation quality of groundwater based on sodium percentage
%Na Classification Sample numbers Number of sample Percentage of samples
\20 Excellent – – –
20–40 Good 4, 33, 36 3 8.33
40–60 Permissible 1, 2, 5, 6, 7, 9, 11, 14, 15, 17, 18, 23, 24, 28, 29, 32, 35 17 47.24
60–80 Doubtful 3, 8, 10, 12, 16, 19, 22, 25, 26, 27, 30, 31 12 33.34
[80 Unsuitable 13, 20, 21, 34 4 11.09
Total 36 36 100
158 Appl Water Sci (2013) 3:145–159
123
Amer AM (1995) Saltwater intrusion in coastal aquifers. In:
Proceedings of the international conference on water resources
management in arid countries, Muscat, Sultanate of Oman,
12–16 March 1995, 2, pp 521–529
American Public Health Association (APHA), American Water
Works Association (AWWA), Water Pollution Control Federa-
tion (1995) Standard methods for the examination of water and
wastewater, 16th edn. Washington, DC, p 1268
Balasubramanaian AR, Thirugnana S, Chellaswamy R, Radhakrish-
nan V (1993) Numerical modeling for prediction and control of
saltwater enchroment in the coastal aquifers of Tuticorin, Tamil
Nadu (21). Tech, Report
Chidambaram S, Senthil Kumar G, Prasanna MV, John Peter A,
Ramanathan AL, Srinivasamoorthy K (2009) A study on the
hydrogeology and hydrogeochemistry of groundwater from
different depths in a coastal aquifer: annamalai Nagar, Tamiln-
adu, India. Environ Geol 57:59–73
CPCB (2008) Guideline for water quality management. Central
Pollution Control Board, Parivesh Bhawan, East Arjun Nagar,
Delhi
Dar MA, Sankar K, Dar IA (2010) Fluorine contamination in ground
water: a major challenge. Environ Monit Assess 173(1–4):955–968
Dar IA, Sankar K, Dar MA (2011) Spatial assessments of ground-
water quality in Mamundiyar Basin, India. Environ Monit Assess
178(1–4):437–447
Davis SN, DeWiest RJ (1966) Hydrogeology. Wiley, Newyork
Domenico PA, Schwartz FW (1990) Physical and Chemical hydro-
geology. Wiley, New York, pp 410–420
Doneen LD (1964) Notes on water quality in agriculture. Water
Science and Engineering, University of California, Davis
Freeze and Cherrey (1979) Groundwater. Prentice-Hall, New Jersey
Goodchild MF (1993) The state of GIS for environmental problem-
solving. In: Goodchild MF, Parks BO, Steyart LT (eds)
Environmental modeling with GIS. Oxford University Press,
New York, pp 8–15
Handa BK (1975) Geochmistry and genesis of fluoride containing
groundwater in India. Groundwater 13(3):275–281
Herman Bower. (1978) Groundwater Hydrology, International Stu-
dent Edition
Karanth KR (1989) Quality of ground water. In: Karanth KR (ed)
Ground water assessment development and management. Tata
McGrawHill, New Delhi, pp 217–275
Kelly WP (1951) Alkali soils—their formation, properties and
reclamation. Reinhold, New York
Mohan R, Singh AK, Tripathi J, Chowdhary GC (2000) Hydrochem-
istry and quality assessment of ground water in Naini industrial
area, Allahabad District, Uttar Pradesh. J Geol Soc India 55:
77–89
Mondal NC, Singh VP, Singh VS, Saxena VK (2010) Determining the
interaction between groundwater and saline water through
groundwater major ions chemistry. J Hydrol 388(1–2):100–111
Piper AM (1994) A graphical procedure in the geochemical
interpretation of water analysis. Am Geophys Union Trans
25:914–923
Rajmohan N, Elango L, Elampoornam T (1997) Groundwater quality
in Nagai Quaid-Eu Milleth district and Karaikal, South India.
Indian Water Resour Soc 17(3):25–30
Rajmohan N, Elango L, Ramachandaran S, Natarajan M (2003) Major
ion correlation in groundwater of Kancheepuram Region, South
India. Indian J Environ Health 45(1):5–10
Rangarajan R, Mondal NC, Singh VS Singh SV (2009) Estimation of
natural recharge and its relation with aquifer parameters in and
around Tuticorin town, Tamil Nadu. India Curr Sci
97(2):217–226
Richards LA, Salinity Laboratory US (1954) Diagnosis and improve-
ment of saline and alkaline soils. US Department of Agriculture
hand book, Washington, DC p 60
Saleh A, Al-Ruwaih F, Shehata M (1999) Hydrogeochemical
processes operating within the main aquifers of Kuwait. J Arid
Environ 42:195–209
Sawyer C, McCarthy P (1967) Chemical and sanitary engineering,
2nd edn. McGraw-Hill, New York
Selvam S, Sivasubramanian P (2012) Groundwater potential zone
identification using geoelectrical survey: a case study from
Medak district, Andhra Pradesh, India. International J Geomatics
Geosci 3(1):55–62
Subramani T, Elango L, Damodarasamy SR (2005) Groundwater
quality and its suitability for drinking and agricultural use
Chithar River Basin, Tamilnadu, India. Environ Geol
47:1099–1110
Todd DK (1959) Groundwater Hydrology. Wiley, New York, p 336
Whittemore DO, Greggor KMM, Marotz GA (1989) Efeects of
variations in recharge on groundwater quality. J Hydrol
106:131–145
WHO (2004) Guidelines for drinking water quality, vol 1. Recom-
mendations, 3rd edn. WHO, Geneva, p 515
Wilcox LV (1955) Classification and use of irrigation water. US
Department of Agriculture, Washington 969
Appl Water Sci (2013) 3:145–159 159
123
Related Documents