J. Water Resource and Protection, 2010, 2, 199-208 doi:10.4236/jwarp.2010.23022 Published Online March 2010 (http://www.scirp.org/journal/jwarp) Copyright © 2010 SciRes. JWARP Hydrochemical and Isotopic Characterisation of Groundwaters in the Eastern Region of Ghana Samuel Y. Ganyaglo 1 , Bruce Banoeng-Yakubo 2 , Shiloh Osae 1 , Samuel B. Dampare 1,3 , Joseph R. Fianko 1 , Mohammad A. H. Bhuiyan 3 1 National Nuclear Research Institute, Ghana Atomic Energy Commission, Legon-Accra, Ghana 2 Department of Geology, University of Ghana, Legon-Accra, Ghana 3 Department of Earth Sciences, Okayama University, Okayama, Japan E-mail: [email protected] Received December 27, 2009; revised January 20, 2010; accepted January 23, 2010 Abstract Major ions and stable isotopes of groundwater in the Cape Coast granitoid complex (G1) and Lower Birimian (LB) formations in the Eastern Region of Ghana were evaluated to establish the source of recharge to the groundwater system. Five major hydrochemical facies were identified in the various rocks in the study area. They are calcium-magnesium-bicarbonate, sodium bicarbonate, sodium chloride and calcium chloride waters and mixed or non dominant water type. Sodium chloride and calcium chloride waters dominate aqui- fers of the Cape Coast granitoid complex whereas calcium-magnesium-bicarbonate is the dominant hydro- chemical facies in the Lower Birimian aquifers. The most probable geochemical process responsible for the evolution of these hydrochemical facies is dissolution of minerals in the various rock types. Stable isotope composition of the groundwaters established that the recharge to the groundwater system is derived from rainfall. Keywords: Hydrochemistry, Isotopes, Groundwater, Ghana 1. Introduction Over the years groundwater has been one of the major sources of water supply to the rural communities in the Eastern Region of Ghana. This is partially due to drying out of most streams during the dry season and to a lesser extent, pollution of the streams and rivers, which require high cost of treatment before supply. The exploitation of this vital resource dates as far back as the pre-colonial era through the construction of hand-dug wells. These wells were dug through the overburden and weathered rock material. The hand-dug wells did not yield suffi- cient water during the dry season and their shallow na- ture rendered them vulnerable to contamination from runoff and anthropogenic activities. As a result, a more effective and hygienic system of water supply in the form of boreholes as the cheapest and most reliable means of meeting the water supply needs of the people was initiated [1,2]. The region has therefore witnessed numerous borehole-drilling programmes including the 3000-borehole programme, which covered five other regions in southern Ghana. A large amount of hydrogeological and hydrochemical data have been generated through drilling activities in this region. However, as a result of unreliability of the data generated and the lack of a database, not much has been done in understanding the hydrochemical properties of the aquifers as a means of establishing the recharge regimes for the better management of the aquifer systems. The hydrochemical nature of the groundwaters has also not been thoroughly established. It is therefore difficult to predict the chemistry of groundwater and recharge areas. The chemical composition of groundwater is con- trolled by many factors including composition of pre- cipitation, mineralogy of the watershed and aquifer ma- terials, aquifer characteristics, climate and topography [3]. These factors combine to create diverse water types that change spatially and temporally. These spatial changes in the water types can be evaluated and used to trace the recharge source(s) to the groundwater system. The main focus of this study is to establish the re- charge regime through groundwater sampling, looking at major ions and stable isotopes of the groundwaters. Spe- cific objectives include identification of hydrochemical

Welcome message from author
This document is posted to help you gain knowledge. Please leave a comment to let me know what you think about it! Share it to your friends and learn new things together.
Transcript
J. Water Resource and Protection, 2010, 2, 199-208 doi:10.4236/jwarp.2010.23022 Published Online March 2010 (http://www.scirp.org/journal/jwarp)
Copyright © 2010 SciRes. JWARP
Hydrochemical and Isotopic Characterisation of Groundwaters in the Eastern Region of Ghana
Samuel Y. Ganyaglo1, Bruce Banoeng-Yakubo2, Shiloh Osae1, Samuel B. Dampare1,3, Joseph R. Fianko1, Mohammad A. H. Bhuiyan3
1National Nuclear Research Institute, Ghana Atomic Energy Commission, Legon-Accra, Ghana 2Department of Geology, University of Ghana, Legon-Accra, Ghana
3Department of Earth Sciences, Okayama University, Okayama, Japan E-mail: [email protected]
Received December 27, 2009; revised January 20, 2010; accepted January 23, 2010
Abstract Major ions and stable isotopes of groundwater in the Cape Coast granitoid complex (G1) and Lower Birimian (LB) formations in the Eastern Region of Ghana were evaluated to establish the source of recharge to the groundwater system. Five major hydrochemical facies were identified in the various rocks in the study area. They are calcium-magnesium-bicarbonate, sodium bicarbonate, sodium chloride and calcium chloride waters and mixed or non dominant water type. Sodium chloride and calcium chloride waters dominate aqui-fers of the Cape Coast granitoid complex whereas calcium-magnesium-bicarbonate is the dominant hydro-chemical facies in the Lower Birimian aquifers. The most probable geochemical process responsible for the evolution of these hydrochemical facies is dissolution of minerals in the various rock types. Stable isotope composition of the groundwaters established that the recharge to the groundwater system is derived from rainfall. Keywords: Hydrochemistry, Isotopes, Groundwater, Ghana
1. Introduction Over the years groundwater has been one of the major sources of water supply to the rural communities in the Eastern Region of Ghana. This is partially due to drying out of most streams during the dry season and to a lesser extent, pollution of the streams and rivers, which require high cost of treatment before supply. The exploitation of this vital resource dates as far back as the pre-colonial era through the construction of hand-dug wells. These wells were dug through the overburden and weathered rock material. The hand-dug wells did not yield suffi-cient water during the dry season and their shallow na-ture rendered them vulnerable to contamination from runoff and anthropogenic activities. As a result, a more effective and hygienic system of water supply in the form of boreholes as the cheapest and most reliable means of meeting the water supply needs of the people was initiated [1,2]. The region has therefore witnessed numerous borehole-drilling programmes including the 3000-borehole programme, which covered five other regions in southern Ghana.
A large amount of hydrogeological and hydrochemical data have been generated through drilling activities in this region. However, as a result of unreliability of the data generated and the lack of a database, not much has been done in understanding the hydrochemical properties of the aquifers as a means of establishing the recharge regimes for the better management of the aquifer systems. The hydrochemical nature of the groundwaters has also not been thoroughly established. It is therefore difficult to predict the chemistry of groundwater and recharge areas.
The chemical composition of groundwater is con-trolled by many factors including composition of pre-cipitation, mineralogy of the watershed and aquifer ma-terials, aquifer characteristics, climate and topography [3]. These factors combine to create diverse water types that change spatially and temporally. These spatial changes in the water types can be evaluated and used to trace the recharge source(s) to the groundwater system.
The main focus of this study is to establish the re-charge regime through groundwater sampling, looking at major ions and stable isotopes of the groundwaters. Spe-cific objectives include identification of hydrochemical
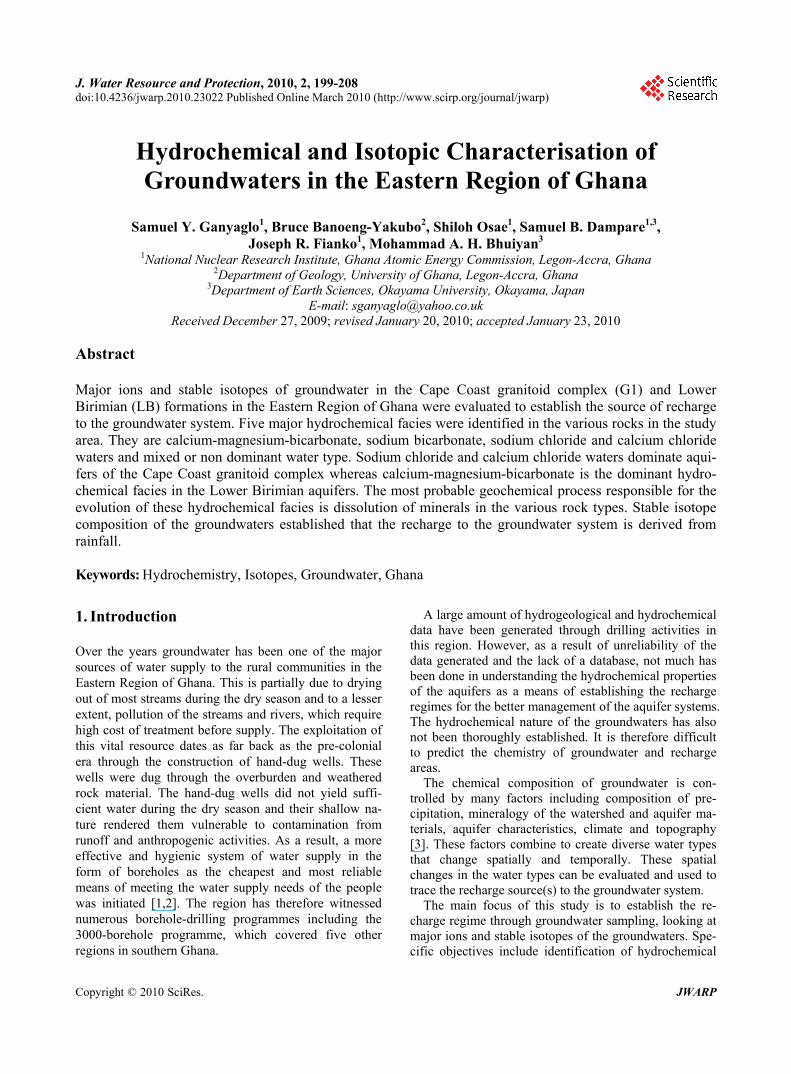
S. Y. GANYAGLO ET AL. 200 facies of the groundwaters and geochemical processes responsible for the various hydrochemical facies. It is intended to provide a database for sharing with stake-holders in the water sector, and to monitor and check land use practices in the recharge areas to ensure the safety of groundwater usage in the area. 2. Study Area 2.1. Location The study area lies within latitudes 5 45 N to 6 30 N and longitudes 0 00 to 1 00 W. It covers an area of about 7414 km2. It is bounded on the north by Brong Ahafo region, south by Central region, west by Ashanti region, and east by Volta region and southeast by Greater Accra region. It consists of Akwapim North and South, New Juabeng, Suhum Kraboa Coaltar, Kwabibirem and East Akim districts (Figure 1). 2.2. Climate The study area lies within the wet semi-equatorial climatic
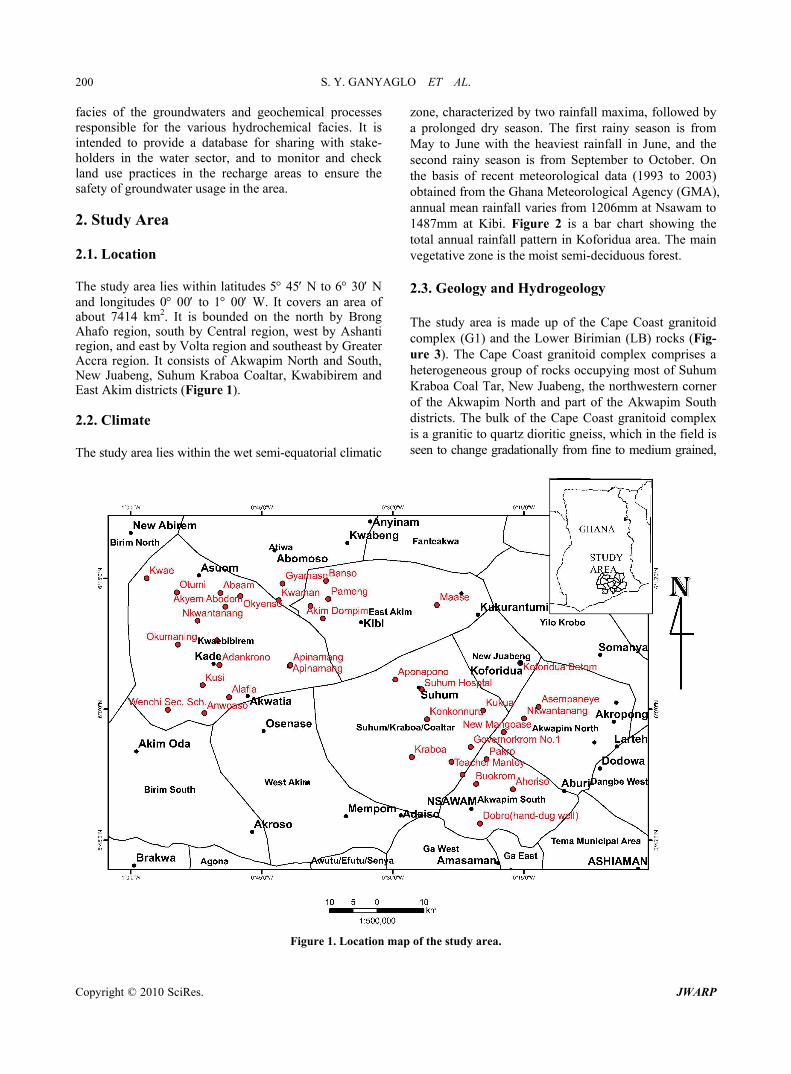
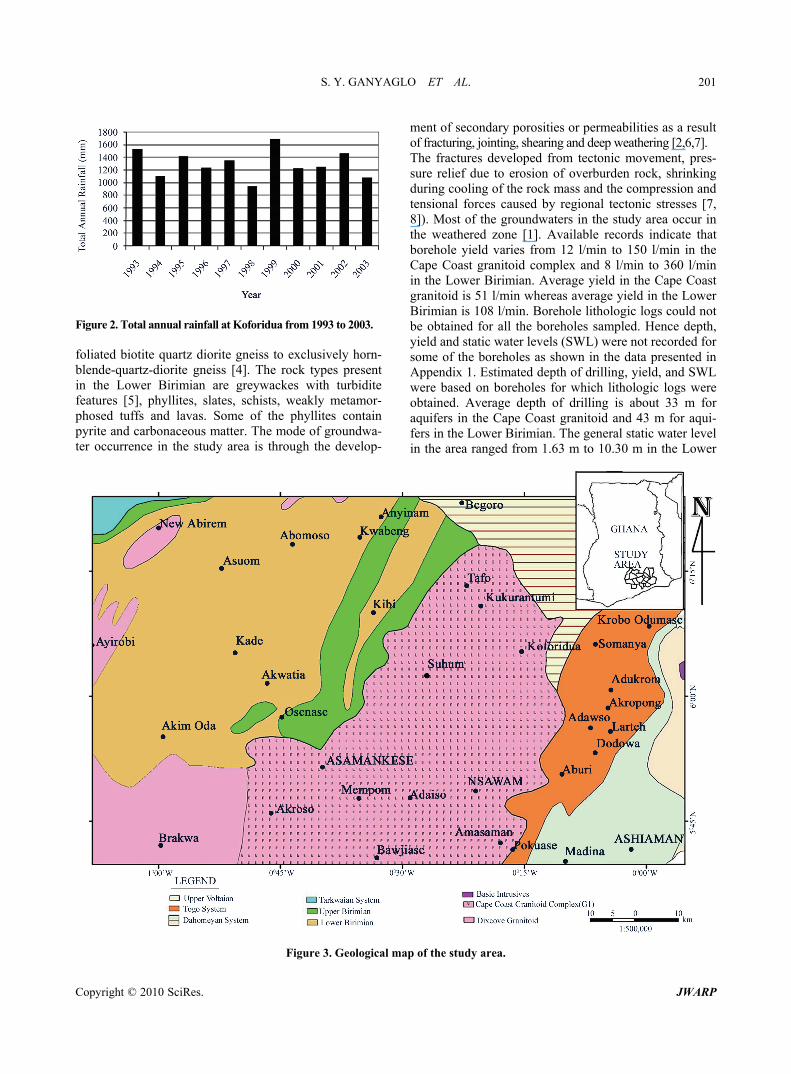
zone, characterized by two rainfall maxima, followed by a prolonged dry season. The first rainy season is from May to June with the heaviest rainfall in June, and the second rainy season is from September to October. On the basis of recent meteorological data (1993 to 2003) obtained from the Ghana Meteorological Agency (GMA), annual mean rainfall varies from 1206mm at Nsawam to 1487mm at Kibi. Figure 2 is a bar chart showing the total annual rainfall pattern in Koforidua area. The main vegetative zone is the moist semi-deciduous forest. 2.3. Geology and Hydrogeology The study area is made up of the Cape Coast granitoid complex (G1) and the Lower Birimian (LB) rocks (Fig-ure 3). The Cape Coast granitoid complex comprises a heterogeneous group of rocks occupying most of Suhum Kraboa Coal Tar, New Juabeng, the northwestern corner of the Akwapim North and part of the Akwapim South districts. The bulk of the Cape Coast granitoid complex is a granitic to quartz dioritic gneiss, which in the field is seen to change gradationally from fine to medium grained,
Figure 1. Location map of the study area.
Copyright © 2010 SciRes. JWARP
S. Y. GANYAGLO ET AL. 201
Figure 2. Total annual rainfall at Koforidua from 1993 to 2003. foliated biotite quartz diorite gneiss to exclusively horn-blende-quartz-diorite gneiss [4]. The rock types present in the Lower Birimian are greywackes with turbidite features [5], phyllites, slates, schists, weakly metamor-phosed tuffs and lavas. Some of the phyllites contain pyrite and carbonaceous matter. The mode of groundwa-ter occurrence in the study area is through the develop-
ment of secondary porosities or permeabilities as a result of fracturing, jointing, shearing and deep weathering [2,6,7]. The fractures developed from tectonic movement, pres-sure relief due to erosion of overburden rock, shrinking during cooling of the rock mass and the compression and tensional forces caused by regional tectonic stresses [7, 8]). Most of the groundwaters in the study area occur in the weathered zone [1]. Available records indicate that borehole yield varies from 12 l/min to 150 l/min in the Cape Coast granitoid complex and 8 l/min to 360 l/min in the Lower Birimian. Average yield in the Cape Coast granitoid is 51 l/min whereas average yield in the Lower Birimian is 108 l/min. Borehole lithologic logs could not be obtained for all the boreholes sampled. Hence depth, yield and static water levels (SWL) were not recorded for some of the boreholes as shown in the data presented in Appendix 1. Estimated depth of drilling, yield, and SWL were based on boreholes for which lithologic logs were obtained. Average depth of drilling is about 33 m for aquifers in the Cape Coast granitoid and 43 m for aqui-fers in the Lower Birimian. The general static water level in the area ranged from 1.63 m to 10.30 m in the Lower
Figure 3. Geological map of the study area.
Copyright © 2010 SciRes. JWARP
S. Y. GANYAGLO ET AL. 202
Birimian aquifers. The mean static water level is 6.15±3.0 m. The static water levels in the Cape Coast granitoid ranged from 0 to 5.14 m with the mean value of 2.35±1.54 m. 3. Methodology A total of 38 boreholes were sampled. The sampling points are shown in Figure 1. Eighteen (18) samples were taken from rocks of the Cape Coast granitoid com-plex whereas 20 samples were from Lower Birimian rocks.
All water samples were collected in 50 ml pre-condi-tioned high-density polyethylene bottles. They were conditioned by washing initially with detergent, then with 10 % percent nitric acid, and finally rinsing several times with distilled water. This was carried out to ensure that the sample bottles were free from contaminants.
At the sampling point, the boreholes ware pumped for about 5 minutes to purge the aquifer of stagnant water to acquire fresh aquifer samples for analysis. 5 minutes pumping was allowed, because in most of the communi-ties visited, pumping was already in progress. The pH and temperature were stabilised within the five minutes of pumping. Samples were initially collected in a steril-ised bucket immediately after purging the aquifer and quickly transferred into sampling bottles. Samples were taken in duplicate for major ion and stable isotope analyses. Prior to this, field parameters were measured. Basic parameters measured in the field were temperature, pH, and electrical conductivity. Samples earmarked for major ion analyses were filtered on site through 0.45- micron meter cellulose filters with the aid of hand oper-ated vacuum pump.
The samples were preserved in a refrigerator until they were transported to the laboratory for chemical analysis. The major ions were analyzed at the Ecological labora-tory, University of Ghana, Legon with Dionex-120 ion chromatograph. The accuracy of the analyses was esti-mated from the charge balance error (CBE) [9], which is within ± 5% for all samples.
The analysis of oxygen isotope ratio of 14 samples from the study area was determined using a VG Sira 10 mass spectrometer with automatic inlet at the Geological Institute, University of Copenhagen. The measurements of deuterium in the water samples were carried out using Euro Vector elemental analyzer (EA; EuroPyrOH-3100) at the Institute of Physics and Astronomy, University of Aarhus, Denmark. The results for both isotopes were expressed in per mil (‰) deviation from the Vienna Standard Mean Ocean Water (VSMOW) using the delta (δ) – scale. Reproducibility was better than 0.1 ‰ for δ18O and about 1 ‰ for δ2H.
The Piper 1944 Trilinear diagram was employed to define the various chemical evolution of groundwater in
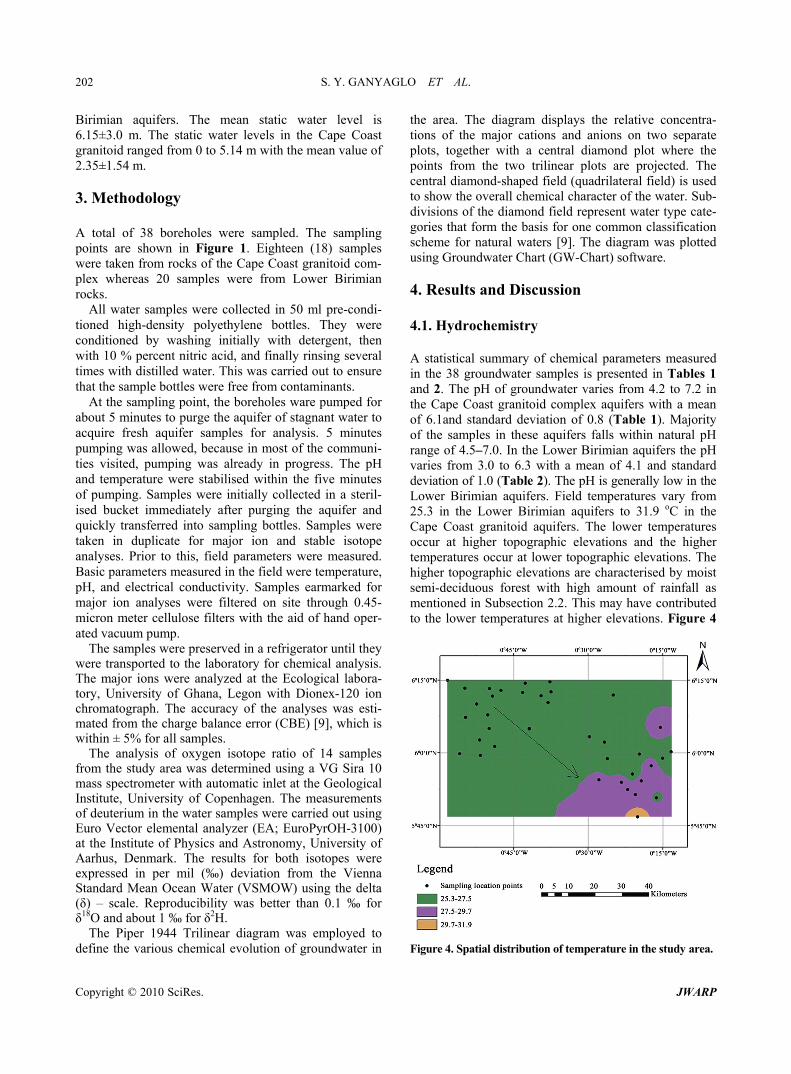
the area. The diagram displays the relative concentra-tions of the major cations and anions on two separate plots, together with a central diamond plot where the points from the two trilinear plots are projected. The central diamond-shaped field (quadrilateral field) is used to show the overall chemical character of the water. Sub-divisions of the diamond field represent water type cate-gories that form the basis for one common classification scheme for natural waters [9]. The diagram was plotted using Groundwater Chart (GW-Chart) software. 4. Results and Discussion 4.1. Hydrochemistry A statistical summary of chemical parameters measured in the 38 groundwater samples is presented in Tables 1 and 2. The pH of groundwater varies from 4.2 to 7.2 in the Cape Coast granitoid complex aquifers with a mean of 6.1and standard deviation of 0.8 (Table 1). Majority of the samples in these aquifers falls within natural pH range of 4.5–7.0. In the Lower Birimian aquifers the pH varies from 3.0 to 6.3 with a mean of 4.1 and standard deviation of 1.0 (Table 2). The pH is generally low in the Lower Birimian aquifers. Field temperatures vary from 25.3 in the Lower Birimian aquifers to 31.9 oC in the Cape Coast granitoid aquifers. The lower temperatures occur at higher topographic elevations and the higher temperatures occur at lower topographic elevations. The higher topographic elevations are characterised by moist semi-deciduous forest with high amount of rainfall as mentioned in Subsection 2.2. This may have contributed to the lower temperatures at higher elevations. Figure 4
Figure 4. Spatial distribution of temperature in the study area.
Copyright © 2010 SciRes. JWARP
S. Y. GANYAGLO ET AL. 203 shows the temperature distribution pattern in the area. The arrow points to the region of higher temperature where aquifers of the Cape Coast granitoid occur. In this region the climatic condition changes slightly to the sa-vanna grassland with drier conditions. This may have led to the higher temperatures in the lower topographic ele-vation. Temperature influences dissolved mineral con-stituents in groundwater.
At higher temperatures groundwater dissolve more minerals resulting in elevated TDS and consequently conductivity. The higher topographic elevations which correspond to lower temperatures also correspond to lower TDS and conductivities thus describing a recharge area. The lower topographic areas of higher temperatures also correspond to higher TDS and conductivities de-scribing a discharge area. The flow path is thus indicated in Figure 4. Temperature and pH influence dissolution and precipitation of minerals in groundwater. In general water with low pH (<6.5) could be acidic and corrosive. Acidic waters could leach metal ions such as: iron, man-ganese, copper, lead, and zinc from the aquifer. The pH of the groundwater in the lower Birimian rocks are gen-erally lower than 6.5. It ranges from 3.0 to 6.3, showing strongly acidic to slightly acidic conditions. The acidic nature of the waters could trigger various chemical reac-tions in the groundwater.
Conductivity values from 55 to 1999 µS/cm were also recorded while TDS ranged from 31.9 to 968.3 mg/l.
Detail hydrochemical data is presented in Appendices 1a and 1b.
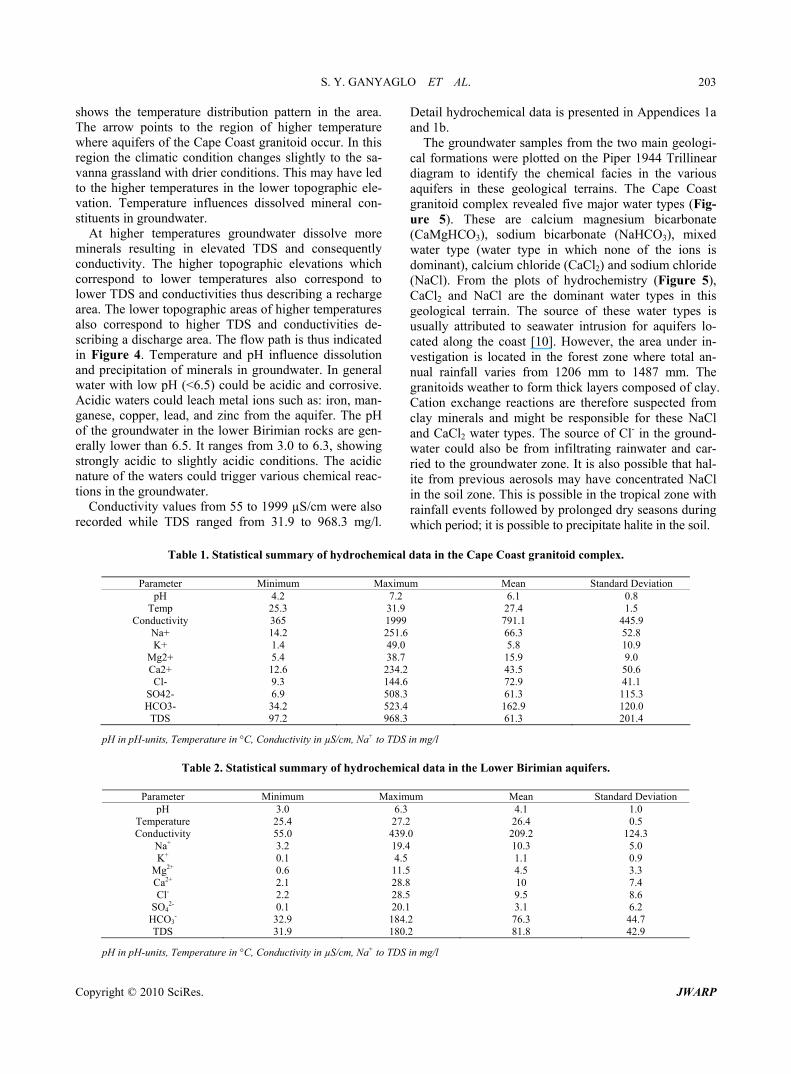
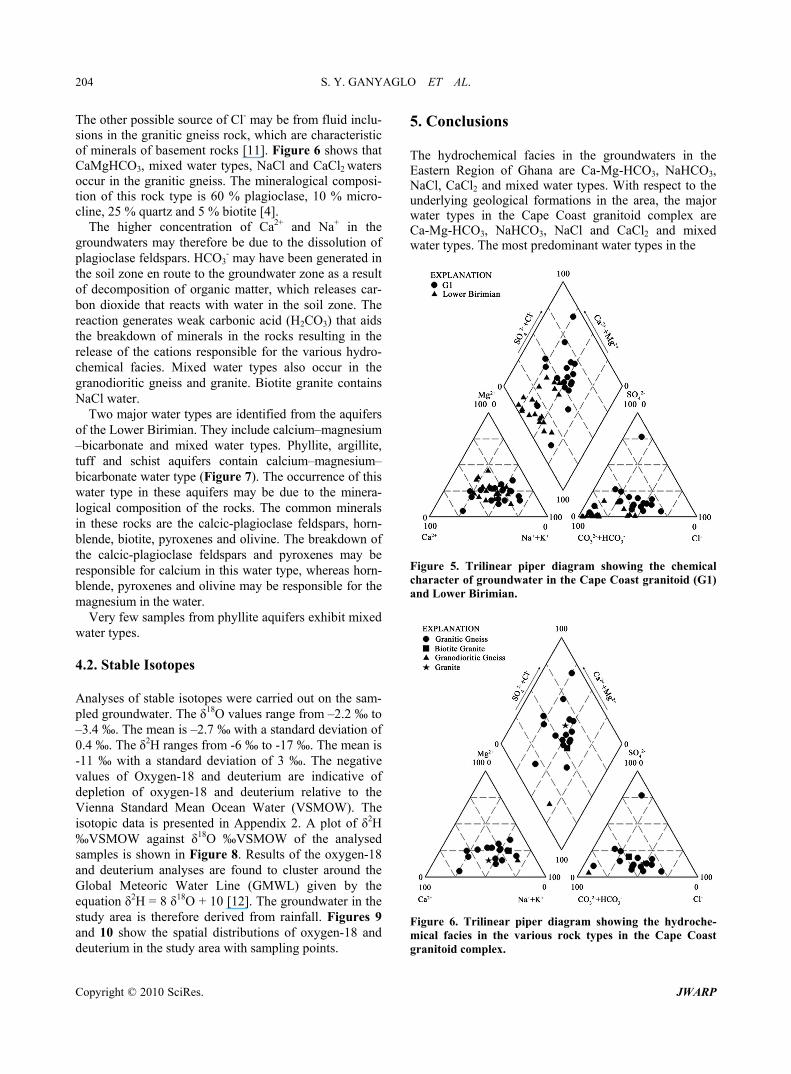
The groundwater samples from the two main geologi-cal formations were plotted on the Piper 1944 Trillinear diagram to identify the chemical facies in the various aquifers in these geological terrains. The Cape Coast granitoid complex revealed five major water types (Fig-ure 5). These are calcium magnesium bicarbonate (CaMgHCO3), sodium bicarbonate (NaHCO3), mixed water type (water type in which none of the ions is dominant), calcium chloride (CaCl2) and sodium chloride (NaCl). From the plots of hydrochemistry (Figure 5), CaCl2 and NaCl are the dominant water types in this geological terrain. The source of these water types is usually attributed to seawater intrusion for aquifers lo-cated along the coast [10]. However, the area under in-vestigation is located in the forest zone where total an-nual rainfall varies from 1206 mm to 1487 mm. The granitoids weather to form thick layers composed of clay. Cation exchange reactions are therefore suspected from clay minerals and might be responsible for these NaCl and CaCl2 water types. The source of Cl- in the ground-water could also be from infiltrating rainwater and car-ried to the groundwater zone. It is also possible that hal-ite from previous aerosols may have concentrated NaCl in the soil zone. This is possible in the tropical zone with rainfall events followed by prolonged dry seasons during which period; it is possible to precipitate halite in the soil.
Table 1. Statistical summary of hydrochemical data in the Cape Coast granitoid complex.
Parameter Minimum Maximum Mean Standard Deviation pH 4.2 7.2 6.1 0.8
Temp 25.3 31.9 27.4 1.5 Conductivity 365 1999 791.1 445.9
Na+ 14.2 251.6 66.3 52.8 K+ 1.4 49.0 5.8 10.9
Mg2+ 5.4 38.7 15.9 9.0 Ca2+ 12.6 234.2 43.5 50.6 Cl- 9.3 144.6 72.9 41.1
SO42- 6.9 508.3 61.3 115.3 HCO3- 34.2 523.4 162.9 120.0
TDS 97.2 968.3 61.3 201.4
pH in pH-units, Temperature in °C, Conductivity in µS/cm, Na+ to TDS in mg/l
Table 2. Statistical summary of hydrochemical data in the Lower Birimian aquifers.
Parameter Minimum Maximum Mean Standard Deviation pH 3.0 6.3 4.1 1.0
Temperature 25.4 27.2 26.4 0.5 Conductivity 55.0 439.0 209.2 124.3
Na+ 3.2 19.4 10.3 5.0 K+ 0.1 4.5 1.1 0.9
Mg2+ 0.6 11.5 4.5 3.3 Ca2+ 2.1 28.8 10 7.4 Cl- 2.2 28.5 9.5 8.6
SO42- 0.1 20.1 3.1 6.2
HCO3- 32.9 184.2 76.3 44.7
TDS 31.9 180.2 81.8 42.9
pH in pH-units, Temperature in °C, Conductivity in µS/cm, Na+ to TDS in mg/l
Copyright © 2010 SciRes. JWARP
S. Y. GANYAGLO ET AL. 204
The other possible source of Cl- may be from fluid inclu-sions in the granitic gneiss rock, which are characteristic of minerals of basement rocks [11]. Figure 6 shows that CaMgHCO3, mixed water types, NaCl and CaCl2 waters occur in the granitic gneiss. The mineralogical composi-tion of this rock type is 60 % plagioclase, 10 % micro-cline, 25 % quartz and 5 % biotite [4].
The higher concentration of Ca2+ and Na+ in the groundwaters may therefore be due to the dissolution of plagioclase feldspars. HCO3
- may have been generated in the soil zone en route to the groundwater zone as a result of decomposition of organic matter, which releases car-bon dioxide that reacts with water in the soil zone. The reaction generates weak carbonic acid (H2CO3) that aids the breakdown of minerals in the rocks resulting in the release of the cations responsible for the various hydro-chemical facies. Mixed water types also occur in the granodioritic gneiss and granite. Biotite granite contains NaCl water.
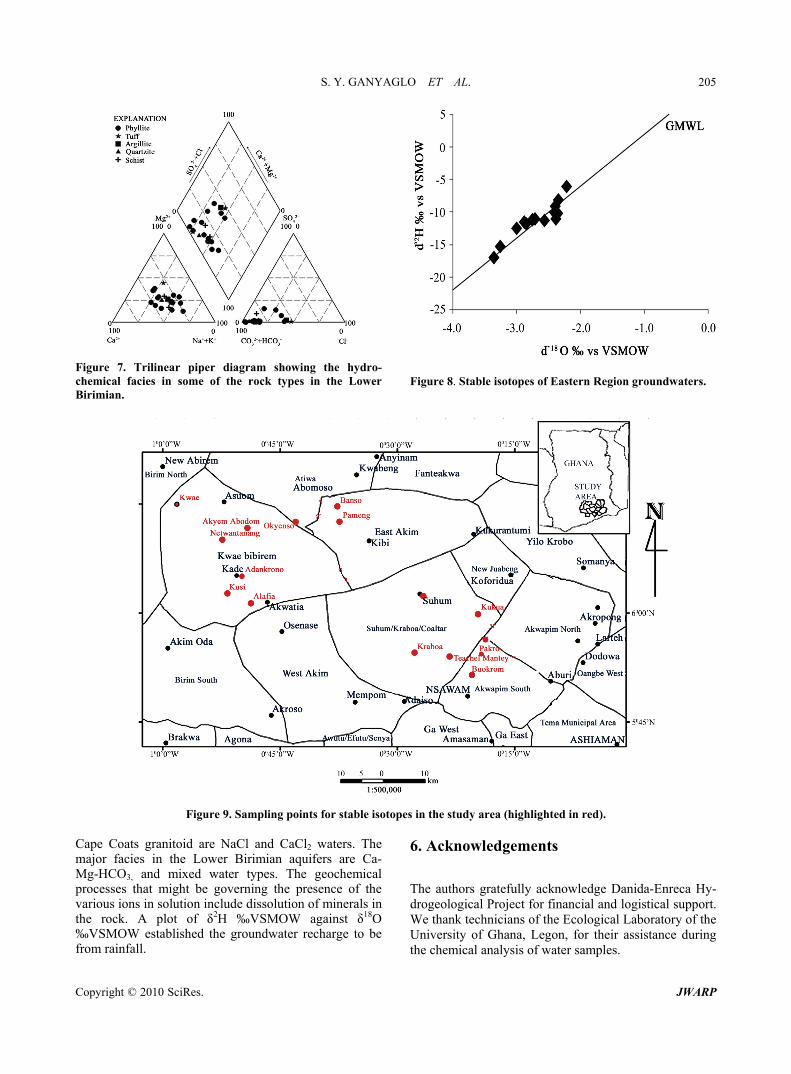
Two major water types are identified from the aquifers of the Lower Birimian. They include calcium–magnesium –bicarbonate and mixed water types. Phyllite, argillite, tuff and schist aquifers contain calcium–magnesium– bicarbonate water type (Figure 7). The occurrence of this water type in these aquifers may be due to the minera-logical composition of the rocks. The common minerals in these rocks are the calcic-plagioclase feldspars, horn-blende, biotite, pyroxenes and olivine. The breakdown of the calcic-plagioclase feldspars and pyroxenes may be responsible for calcium in this water type, whereas horn-blende, pyroxenes and olivine may be responsible for the magnesium in the water.
Very few samples from phyllite aquifers exhibit mixed water types.
4.2. Stable Isotopes Analyses of stable isotopes were carried out on the sam-pled groundwater. The δ18O values range from –2.2 ‰ to –3.4 ‰. The mean is –2.7 ‰ with a standard deviation of 0.4 ‰. The δ2H ranges from -6 ‰ to -17 ‰. The mean is -11 ‰ with a standard deviation of 3 ‰. The negative values of Oxygen-18 and deuterium are indicative of depletion of oxygen-18 and deuterium relative to the Vienna Standard Mean Ocean Water (VSMOW). The isotopic data is presented in Appendix 2. A plot of δ2H ‰VSMOW against δ18O ‰VSMOW of the analysed samples is shown in Figure 8. Results of the oxygen-18 and deuterium analyses are found to cluster around the Global Meteoric Water Line (GMWL) given by the equation δ2H = 8 δ18O + 10 [12]. The groundwater in the study area is therefore derived from rainfall. Figures 9 and 10 show the spatial distributions of oxygen-18 and deuterium in the study area with sampling points.
5. Conclusions The hydrochemical facies in the groundwaters in the Eastern Region of Ghana are Ca-Mg-HCO3, NaHCO3, NaCl, CaCl2 and mixed water types. With respect to the underlying geological formations in the area, the major water types in the Cape Coast granitoid complex are Ca-Mg-HCO3, NaHCO3, NaCl and CaCl2 and mixed water types. The most predominant water types in the
Figure 5. Trilinear piper diagram showing the chemical character of groundwater in the Cape Coast granitoid (G1) and Lower Birimian.
Figure 6. Trilinear piper diagram showing the hydroche- mical facies in the various rock types in the Cape Coast granitoid complex.
Copyright © 2010 SciRes. JWARP
S. Y. GANYAGLO ET AL. 205
Figure 7. Trilinear piper diagram showing the hydro-chemical facies in some of the rock types in the Lower Birimian.
Figure 8. Stable isotopes of Eastern Region groundwaters.
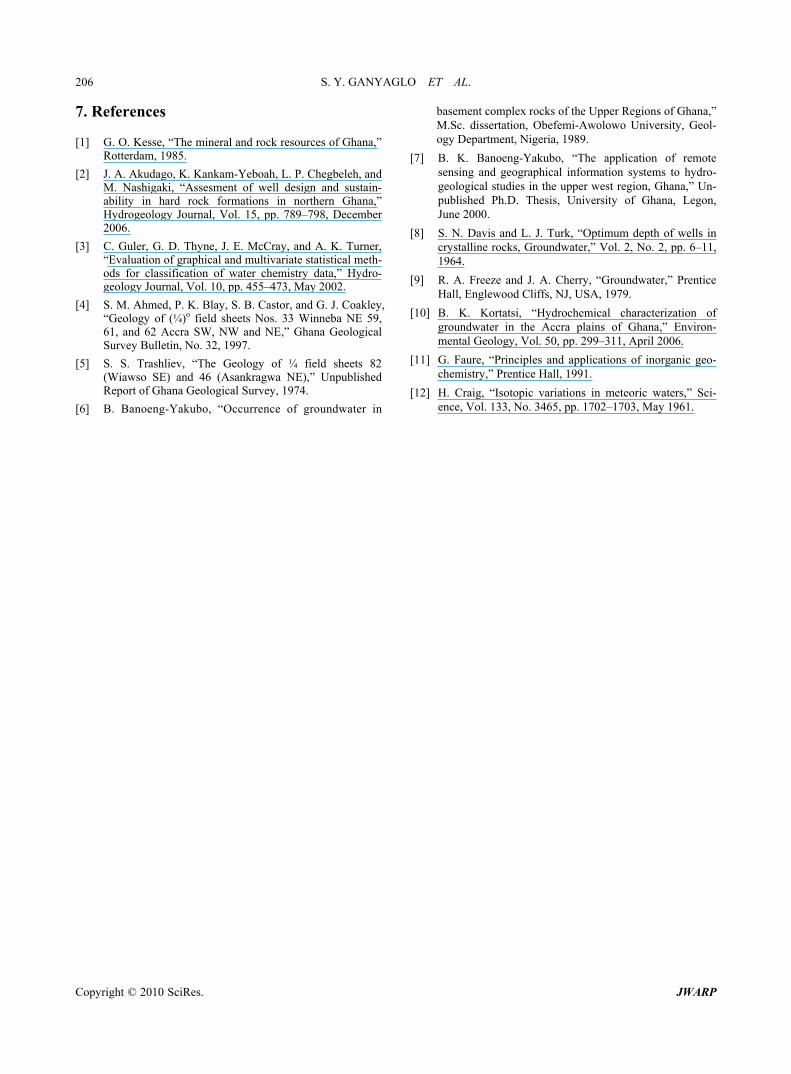
Figure 9. Sampling points for stable isotopes in the study area (highlighted in red). Cape Coats granitoid are NaCl and CaCl2 waters. The major facies in the Lower Birimian aquifers are Ca- Mg-HCO3, and mixed water types. The geochemical processes that might be governing the presence of the various ions in solution include dissolution of minerals in the rock. A plot of δ2H ‰VSMOW against δ18O ‰VSMOW established the groundwater recharge to be from rainfall.
6. Acknowledgements
The authors gratefully acknowledge Danida-Enreca Hy-drogeological Project for financial and logistical support. We thank technicians of the Ecological Laboratory of the University of Ghana, Legon, for their assistance during the chemical analysis of water samples.
Copyright © 2010 SciRes. JWARP
S. Y. GANYAGLO ET AL. 206 7
. References
[1] G. O. Kesse, “The mineral and rock resources of Ghana,” Rotterdam, 1985.
[2] J. A. Akudago, K. Kankam-Yeboah, L. P. Chegbeleh, and M. Nashigaki, “Assesment of well design and sustain-ability in hard rock formations in northern Ghana,” Hydrogeology Journal, Vol. 15, pp. 789–798, December 2006.
[3] C. Guler, G. D. Thyne, J. E. McCray, and A. K. Turner, “Evaluation of graphical and multivariate statistical meth-ods for classification of water chemistry data,” Hydro-geology Journal, Vol. 10, pp. 455–473, May 2002.
[4] S. M. Ahmed, P. K. Blay, S. B. Castor, and G. J. Coakley, “Geology of (¼)o field sheets Nos. 33 Winneba NE 59, 61, and 62 Accra SW, NW and NE,” Ghana Geological Survey Bulletin, No. 32, 1997.
[5] S. S. Trashliev, “The Geology of ¼ field sheets 82 (Wiawso SE) and 46 (Asankragwa NE),” Unpublished Report of Ghana Geological Survey, 1974.
[6] B. Banoeng-Yakubo, “Occurrence of groundwater in
basement complex rocks of the Upper Regions of Ghana,” M.Sc. dissertation, Obefemi-Awolowo University, Geol-ogy Department, Nigeria, 1989.
[7] B. K. Banoeng-Yakubo, “The application of remote sensing and geographical information systems to hydro-geological studies in the upper west region, Ghana,” Un-published Ph.D. Thesis, University of Ghana, Legon, June 2000.
[8] S. N. Davis and L. J. Turk, “Optimum depth of wells in crystalline rocks, Groundwater,” Vol. 2, No. 2, pp. 6–11, 1964.
[9] R. A. Freeze and J. A. Cherry, “Groundwater,” Prentice Hall, Englewood Cliffs, NJ, USA, 1979.
[10] B. K. Kortatsi, “Hydrochemical characterization of groundwater in the Accra plains of Ghana,” Environ-mental Geology, Vol. 50, pp. 299–311, April 2006.
[11] G. Faure, “Principles and applications of inorganic geo-chemistry,” Prentice Hall, 1991.
[12] H. Craig, “Isotopic variations in meteoric waters,” Sci-ence, Vol. 133, No. 3465, pp. 1702–1703, May 1961.
Copyright © 2010 SciRes. JWARP
S. Y. GANYAGLO ET AL. 207
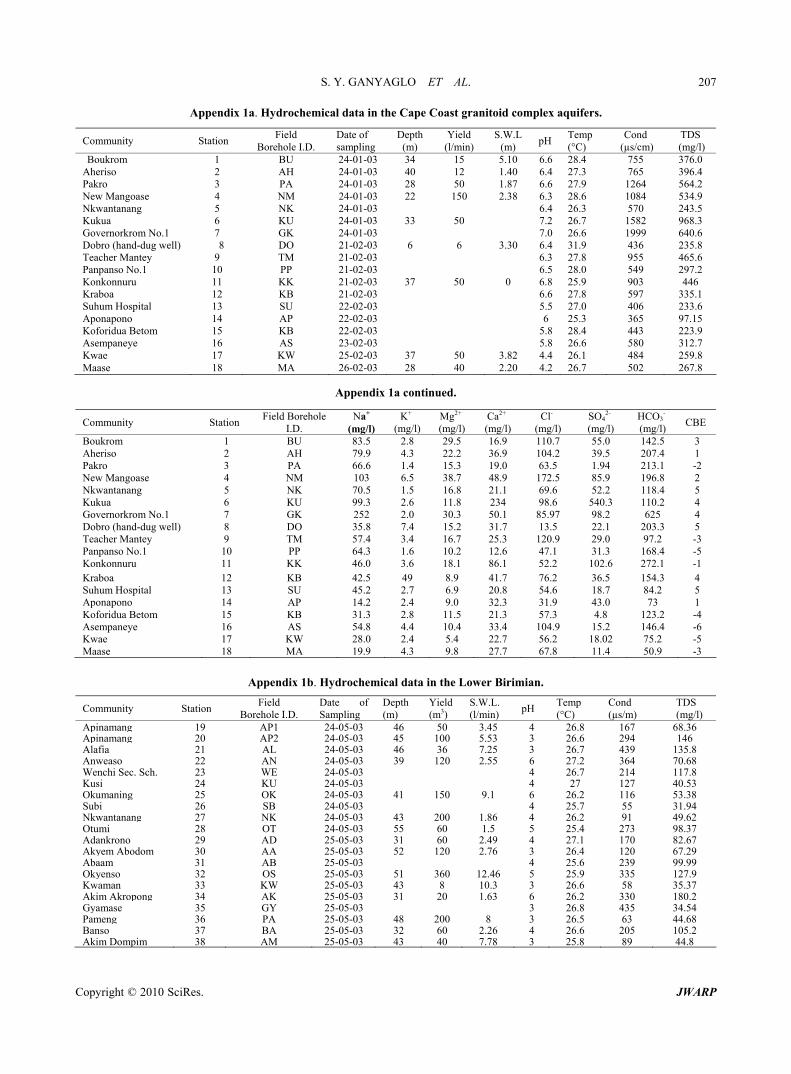
Appendix 1a. Hydrochemical data in the Cape Coast granitoid complex aquifers.
Community Station Field
Borehole I.D. Date of sampling
Depth(m)
Yield (l/min)
S.W.L (m)
pH Temp (°C)
Cond (µs/cm)
TDS (mg/l)
Boukrom 1 BU 24-01-03 34 15 5.10 6.6 28.4 755 376.0 Aheriso 2 AH 24-01-03 40 12 1.40 6.4 27.3 765 396.4 Pakro 3 PA 24-01-03 28 50 1.87 6.6 27.9 1264 564.2 New Mangoase 4 NM 24-01-03 22 150 2.38 6.3 28.6 1084 534.9 Nkwantanang 5 NK 24-01-03 6.4 26.3 570 243.5 Kukua 6 KU 24-01-03 33 50 7.2 26.7 1582 968.3 Governorkrom No.1 7 GK 24-01-03 7.0 26.6 1999 640.6 Dobro (hand-dug well) 8 DO 21-02-03 6 6 3.30 6.4 31.9 436 235.8 Teacher Mantey 9 TM 21-02-03 6.3 27.8 955 465.6 Panpanso No.1 10 PP 21-02-03 6.5 28.0 549 297.2 Konkonnuru 11 KK 21-02-03 37 50 0 6.8 25.9 903 446 Kraboa 12 KB 21-02-03 6.6 27.8 597 335.1 Suhum Hospital 13 SU 22-02-03 5.5 27.0 406 233.6 Aponapono 14 AP 22-02-03 6 25.3 365 97.15 Koforidua Betom 15 KB 22-02-03 5.8 28.4 443 223.9 Asempaneye 16 AS 23-02-03 5.8 26.6 580 312.7 Kwae 17 KW 25-02-03 37 50 3.82 4.4 26.1 484 259.8 Maase 18 MA 26-02-03 28 40 2.20 4.2 26.7 502 267.8
Appendix 1a continued.
Community Station Field Borehole
I.D. Na+
(mg/l)K+
(mg/l)Mg2+ (mg/l)
Ca2+ (mg/l)
Cl- (mg/l)
SO42-
(mg/l) HCO3
- (mg/l)
CBE
Boukrom 1 BU 83.5 2.8 29.5 16.9 110.7 55.0 142.5 3 Aheriso 2 AH 79.9 4.3 22.2 36.9 104.2 39.5 207.4 1 Pakro 3 PA 66.6 1.4 15.3 19.0 63.5 1.94 213.1 -2 New Mangoase 4 NM 103 6.5 38.7 48.9 172.5 85.9 196.8 2 Nkwantanang 5 NK 70.5 1.5 16.8 21.1 69.6 52.2 118.4 5 Kukua 6 KU 99.3 2.6 11.8 234 98.6 540.3 110.2 4 Governorkrom No.1 7 GK 252 2.0 30.3 50.1 85.97 98.2 625 4 Dobro (hand-dug well) 8 DO 35.8 7.4 15.2 31.7 13.5 22.1 203.3 5 Teacher Mantey 9 TM 57.4 3.4 16.7 25.3 120.9 29.0 97.2 -3 Panpanso No.1 10 PP 64.3 1.6 10.2 12.6 47.1 31.3 168.4 -5 Konkonnuru 11 KK 46.0 3.6 18.1 86.1 52.2 102.6 272.1 -1 Kraboa 12 KB 42.5 49 8.9 41.7 76.2 36.5 154.3 4 Suhum Hospital 13 SU 45.2 2.7 6.9 20.8 54.6 18.7 84.2 5 Aponapono 14 AP 14.2 2.4 9.0 32.3 31.9 43.0 73 1 Koforidua Betom 15 KB 31.3 2.8 11.5 21.3 57.3 4.8 123.2 -4 Asempaneye 16 AS 54.8 4.4 10.4 33.4 104.9 15.2 146.4 -6 Kwae 17 KW 28.0 2.4 5.4 22.7 56.2 18.02 75.2 -5 Maase 18 MA 19.9 4.3 9.8 27.7 67.8 11.4 50.9 -3
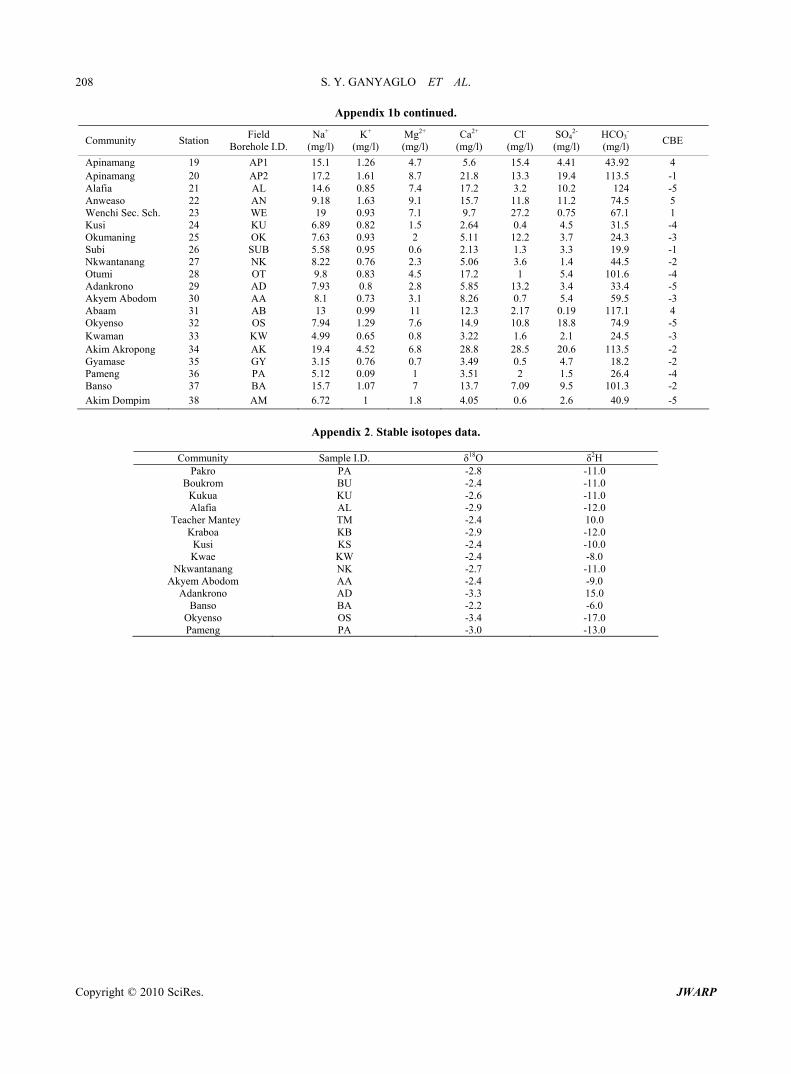
Appendix 1b. Hydrochemical data in the Lower Birimian.
Community Station Field
Borehole I.D. Date of Sampling
Depth (m)
Yield(m3)
S.W.L. (l/min)
pH Temp (°C)
Cond (µs/m)
TDS (mg/l)
Apinamang 19 AP1 24-05-03 46 50 3.45 4 26.8 167 68.36Apinamang 20 AP2 24-05-03 45 100 5.53 3 26.6 294 146Alafia 21 AL 24-05-03 46 36 7.25 3 26.7 439 135.8Anweaso 22 AN 24-05-03 39 120 2.55 6 27.2 364 70.68Wenchi Sec. Sch. 23 WE 24-05-03 4 26.7 214 117.8Kusi 24 KU 24-05-03 4 27 127 40.53Okumaning 25 OK 24-05-03 41 150 9.1 6 26.2 116 53.38Subi 26 SB 24-05-03 4 25.7 55 31.94Nkwantanang 27 NK 24-05-03 43 200 1.86 4 26.2 91 49.62Otumi 28 OT 24-05-03 55 60 1.5 5 25.4 273 98.37Adankrono 29 AD 25-05-03 31 60 2.49 4 27.1 170 82.67Akyem Abodom 30 AA 25-05-03 52 120 2.76 3 26.4 120 67.29Abaam 31 AB 25-05-03 4 25.6 239 99.99Okyenso 32 OS 25-05-03 51 360 12.46 5 25.9 335 127.9Kwaman 33 KW 25-05-03 43 8 10.3 3 26.6 58 35.37Akim Akropong 34 AK 25-05-03 31 20 1.63 6 26.2 330 180.2Gyamase 35 GY 25-05-03 3 26.8 435 34.54Pameng 36 PA 25-05-03 48 200 8 3 26.5 63 44.68Banso 37 BA 25-05-03 32 60 2.26 4 26.6 205 105.2Akim Dompim 38 AM 25-05-03 43 40 7.78 3 25.8 89 44.8
Copyright © 2010 SciRes. JWARP
S. Y. GANYAGLO ET AL.
Copyright © 2010 SciRes. JWARP
208
Appendix 1b continued.
Community Station Field
Borehole I.D. Na+
(mg/l)K+
(mg/l)Mg2+
(mg/l) Ca2+
(mg/l) Cl-
(mg/l)SO4
2-
(mg/l) HCO3
-
(mg/l) CBE
Apinamang 19 AP1 15.1 1.26 4.7 5.6 15.4 4.41 43.92 4 Apinamang 20 AP2 17.2 1.61 8.7 21.8 13.3 19.4 113.5 -1 Alafia 21 AL 14.6 0.85 7.4 17.2 3.2 10.2 124 -5 Anweaso 22 AN 9.18 1.63 9.1 15.7 11.8 11.2 74.5 5 Wenchi Sec. Sch. 23 WE 19 0.93 7.1 9.7 27.2 0.75 67.1 1 Kusi 24 KU 6.89 0.82 1.5 2.64 0.4 4.5 31.5 -4 Okumaning 25 OK 7.63 0.93 2 5.11 12.2 3.7 24.3 -3 Subi 26 SUB 5.58 0.95 0.6 2.13 1.3 3.3 19.9 -1 Nkwantanang 27 NK 8.22 0.76 2.3 5.06 3.6 1.4 44.5 -2 Otumi 28 OT 9.8 0.83 4.5 17.2 1 5.4 101.6 -4 Adankrono 29 AD 7.93 0.8 2.8 5.85 13.2 3.4 33.4 -5 Akyem Abodom 30 AA 8.1 0.73 3.1 8.26 0.7 5.4 59.5 -3 Abaam 31 AB 13 0.99 11 12.3 2.17 0.19 117.1 4 Okyenso 32 OS 7.94 1.29 7.6 14.9 10.8 18.8 74.9 -5 Kwaman 33 KW 4.99 0.65 0.8 3.22 1.6 2.1 24.5 -3 Akim Akropong 34 AK 19.4 4.52 6.8 28.8 28.5 20.6 113.5 -2 Gyamase 35 GY 3.15 0.76 0.7 3.49 0.5 4.7 18.2 -2 Pameng 36 PA 5.12 0.09 1 3.51 2 1.5 26.4 -4 Banso 37 BA 15.7 1.07 7 13.7 7.09 9.5 101.3 -2 Akim Dompim 38 AM 6.72 1 1.8 4.05 0.6 2.6 40.9 -5
Appendix 2. Stable isotopes data.
Community Sample I.D. δ18O δ2H Pakro PA -2.8 -11.0
Boukrom BU -2.4 -11.0 Kukua KU -2.6 -11.0 Alafia AL -2.9 -12.0
Teacher Mantey TM -2.4 10.0 Kraboa KB -2.9 -12.0
Kusi KS -2.4 -10.0 Kwae KW -2.4 -8.0
Nkwantanang NK -2.7 -11.0 Akyem Abodom AA -2.4 -9.0
Adankrono AD -3.3 15.0 Banso BA -2.2 -6.0
Okyenso OS -3.4 -17.0 Pameng PA -3.0 -13.0
Related Documents