Hydraulic Characteristics of, and Ground-Water Flow in, Coal- Bearing Rocks of Southwestern Virginia United States Geological Survey Water-Supply Paper 2388 Prepared in cooperation with the Virginia Department of Mines, Minerals, and Energy, Division of Mined Land Reclamation, and the Powell River Project

Welcome message from author
This document is posted to help you gain knowledge. Please leave a comment to let me know what you think about it! Share it to your friends and learn new things together.
Transcript
Hydraulic Characteristics of, and Ground-Water Flow in, Coal-Bearing Rocks of Southwestern Virginia
United States Geological Survey Water-Supply Paper 2388
Prepared in cooperation with the Virginia Department of Mines, Minerals, and Energy, Division of Mined Land Reclamation, and the Powell River Project
njestes
Text Box
Click here to return to USGS publications
Hydraulic Characteristics of, and Ground-Water Flow in, Coal-Bearing Rocks of Southwestern Virginia
By GEORGE E. HARLOW, Jr ., and GARY D. LECAIN
Prepared in cooperation with the Virginia Department of Mines, Minerals, and Energy, Division of Mined Land Reclamation, and the Powell River Project
U .S . GEOLOGICAL SURVEY WATER-SUPPLY PAPER 2388
�
U .S . DEPARTMENT OF THE INTERIOR
BRUCE BABBITT, Secretary
U.S. GEOLOGICAL SURVEY
Dallas L . Peck, Director
Any use of trade, product, or firm names in this publication is for descriptive purposes only and does not imply endorsement by the U.S . Government
UNITED STATES GOVERNMENT PRINTING OFFICE : 1993
For sale by U.S . Geological Survey, Map Distribution Box 25286, Bldg . 810, Federal Center Denver, CO 80225
Library of Congress Cataloging in Publication Data
Harlow, George E ., Jr . Hydraulic characteristics of, and ground-water flow in, coal-bearing rocks of
southwestern Virginia / by George E . Harlow, Jr ., and Gary D . LeCain . p . cm.-(U.S . Geological Survey water-supply paper ; 2388) "Prepared in cooperation with the Virginia Department of Mines, Minerals,
and Energy, Division of Mined Land Reclamation, and the Powell River Project ."
Includes bibliographical references . Supt . of Docs . no . : 1 :19 :13 :2388 1 . Groundwater flow-Virginia . 2 . Coal-Geology-Virginia . 1 . LeCain, Gary
D . II . Virginia . Division of Mined Land Reclamation . III . Powell River Project . IV . Title . V. Series .
GB1197.7.H36 1993 551 .49'09755-dc20 91-44955
CIP

��������������������������
CONTENTS
Abstract 1Introduction 1
Purpose and Scope 2Location of Study Area 2Climate 2Physiography 2Acknowledgments 3
Geologic Setting 3Lee Formation 4Pocahontas Formation 4New River Formation 4Norton Formation 4Gladeville Sandstone 5Wise Formation 5
Study Methods 5Borehole Geophysical Logging 5Water-Quality Sampling 8Hydraulic Testing 8
Constant-Head Injection Test 8Standard Slug Test 10Modified Slug Test 12
Hydraulic Characteristics of Aquifers 13Transmissivity 13Potentiometric Heads 13
Ground-Water Flow 15Summary and Conclusions 20References Cited 21
PLATE
1 . Location of study area, selected coal-exploration coreholes, and major structural features in the coal fields of southwestern Virginia In pocket
FIGURES
1 . Schematic diagram of the pneumatic straddle-packer assembly and support trailer used to conduct hydraulic testing in coreholes 6
2. Driller's log and geophysical logs for a selected interval of corehole 27 73-5 . Graphs showing:
3 . A, Typical pressure response of water level in a coal seam during packer inflation and equilibration and during two constant-head injection tests at different flow rates, and B, typical pressure response of water level in a sandstone during a standard slug test 9
4. Type-curve match of an aquifer response from a standard slug test 11
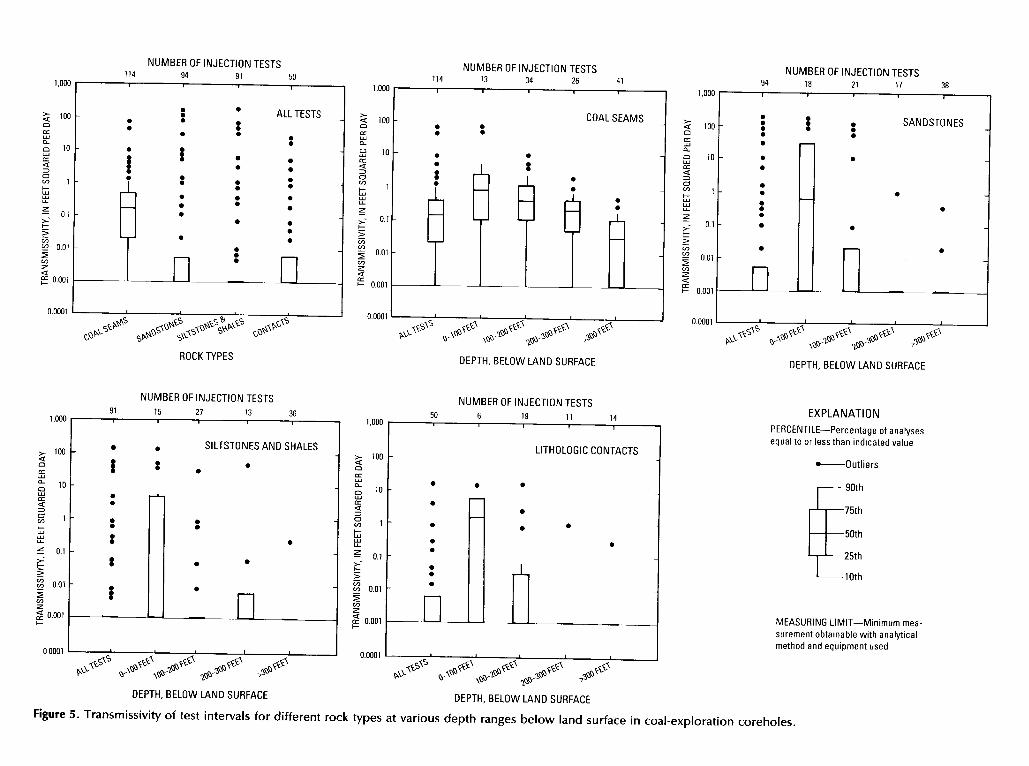
5 . Transmissivity of test intervals for different rock types at various depth ranges below land surface in coal-exploration coreholes 14
Contents III

������
6-8. Potentiometric head as a function of depth below land surface for test intervals in :
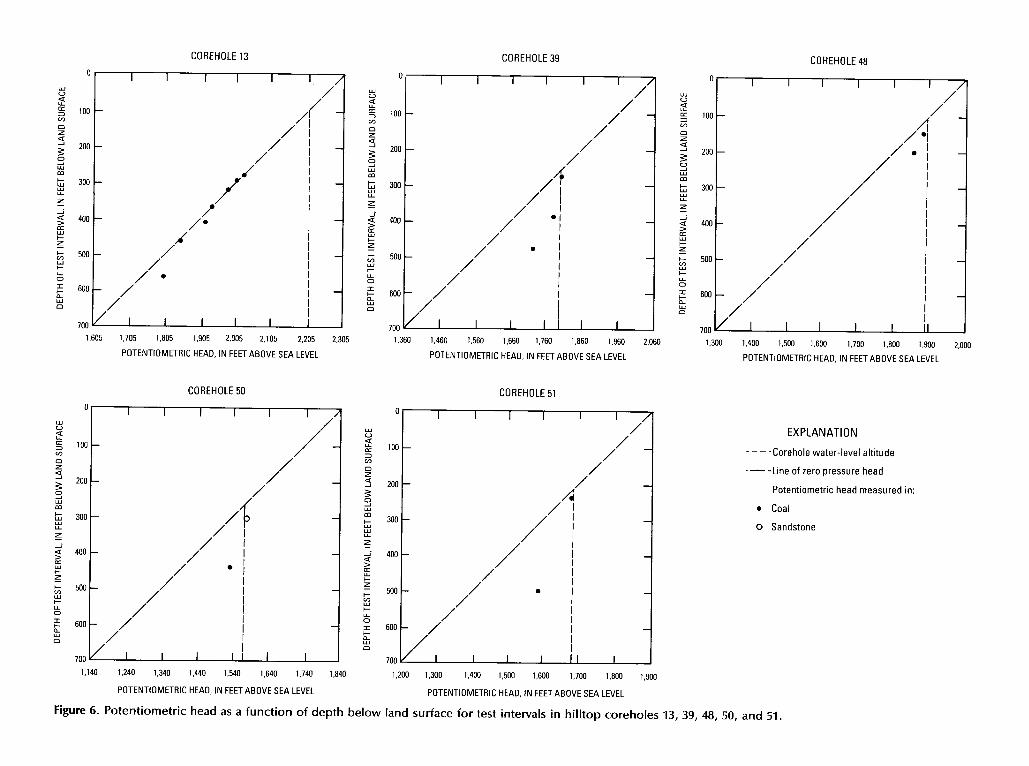
6. Hilltop coreholes 13, 39, 48, 50, and 51 16
7. Hillslope coreholes 10, 28, 36, 42, and 44 17
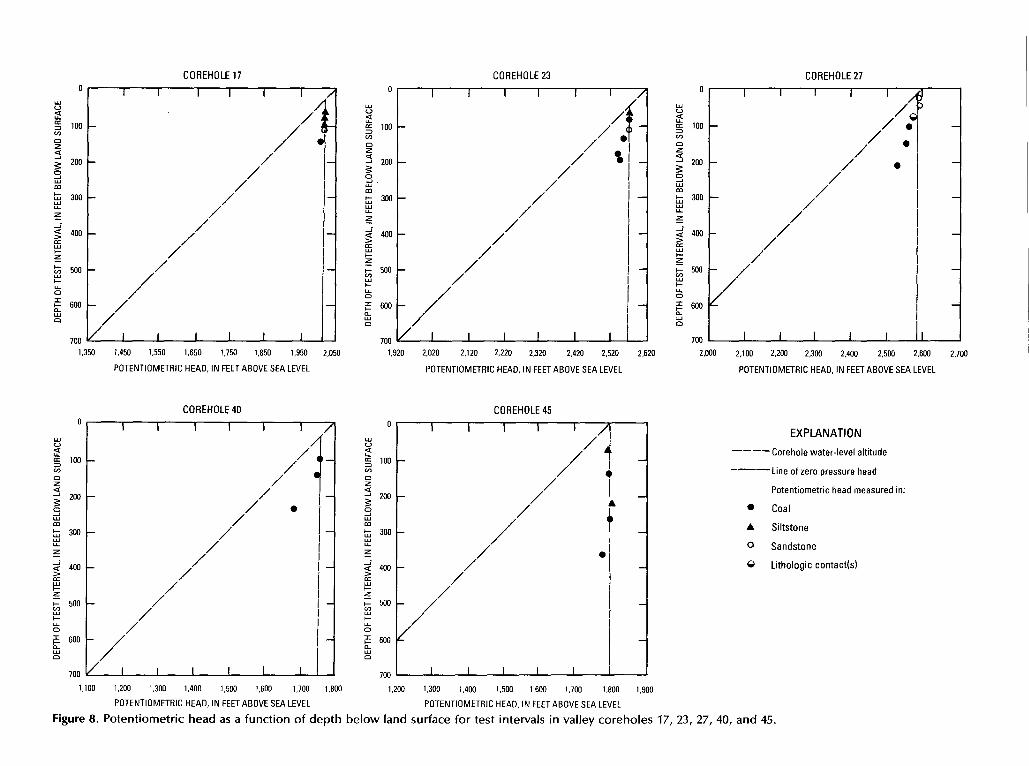
8. Valley coreholes 17, 23, 27, 40, and 45 189. Conceptualized ground-water-flow system in the coal fields of southwestern
Virginia 19
TABLES
1 . Effect of varying the ratio of horizontal-to-vertical hydraulic conductivity on the calculation of horizontal hydraulic conductivity for a test interval 10
2 . Effect of varying the type-curve match on the calculation of transmissivity and storage coefficient from one standard slug test 12
3 . Lithologic descriptions, potentiometric heads, and transmissivities for test intervals in coal-exploration coreholes in the coal fields of southwestern Virginia 25
Contents IV
�����������������������
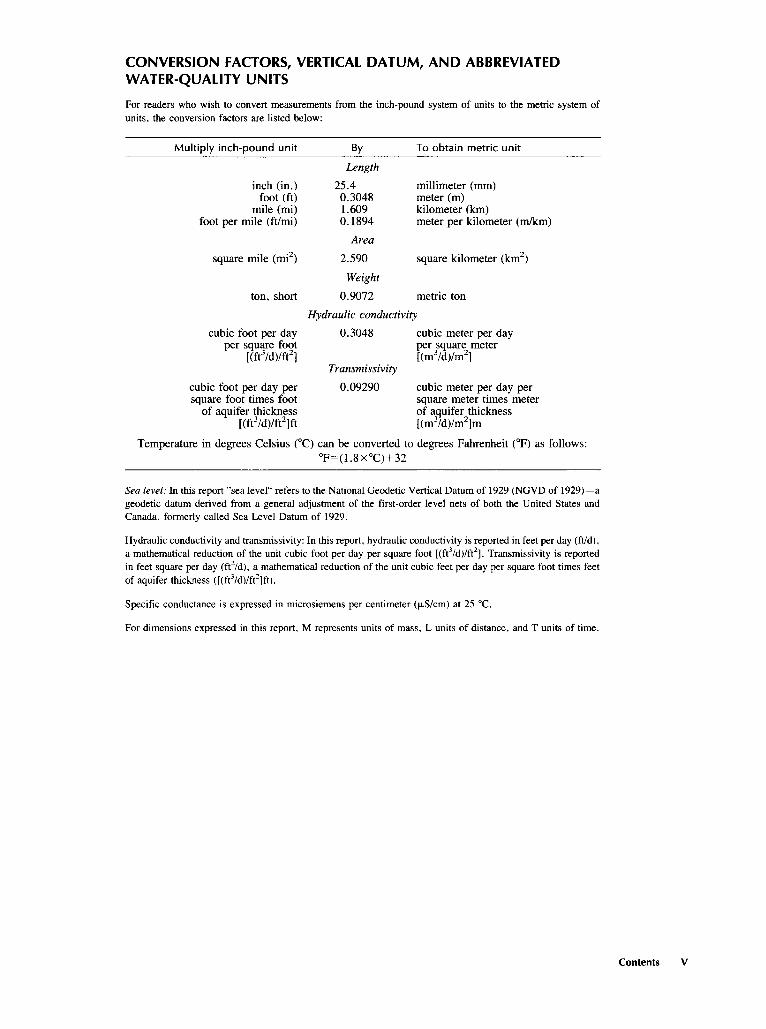
CONVERSION FACTORS, VERTICAL DATUM, AND ABBREVIATED WATER-QUALITY UNITS
For readers who wish to convert measurements from the inch-pound system of units to the metric system of units, the conversion factors are listed below:
Multiply inch-pound unit By To obtain metric unit
Length
inch (in .) 25 .4 millimeter (mm) foot (ft) 0 .3048 meter (m)
mile (mi) 1 .609 kilometer (km) foot per mile (ft/mi) 0 .1894 meter per kilometer (m/km)
Area
square mile (mi) 2 .590 square kilometer (km2)
Weight
ton, short 0 .9072 metric ton
Hydraulic conductivity
cubic foot per day 0 .3048 cubic meter per day per square foot per square meter
[(ft3/d)/ft2] [(m3/d)/m2] Transmissivity
cubic foot per day per 0 .09290 cubic meter per day per square foot times foot square meter times meter of aquifer thickness of aquifer thickness
[(ft 3 /d)/ft2 ]ft [(m3/d)/m2]m
Temperature in degrees Celsius (°C) can be converted to degrees Fahrenheit ( ° F) as follows : °F= (1 .8 x°C)+32
Sea level : In this report "sea level" refers to the National Geodetic Vertical Datum of 1929 (NGVD of 1929)-a geodetic datum derived from a general adjustment of the first-order level nets of both the United States and Canada, formerly called Sea Level Datum of 1929 .
Hydraulic conductivity and transmissivity : In this report, hydraulic conductivity is reported in feet per day (ft/d), a mathematical reduction of the unit cubic foot per day per square foot [(ft3/d)/ft2] . Transmissivity is reported in feet square per day M2/d), a mathematical reduction of the unit cubic feet per day per square foot times feet of aquifer thickness ([(ft'/d)/ft2]ft) .
Specific conductance is expressed in microsiemens per centimeter (wS/cm) at 25 °C .
For dimensions expressed in this report, M represents units of mass, L units of distance, and T units of time .
Contents V
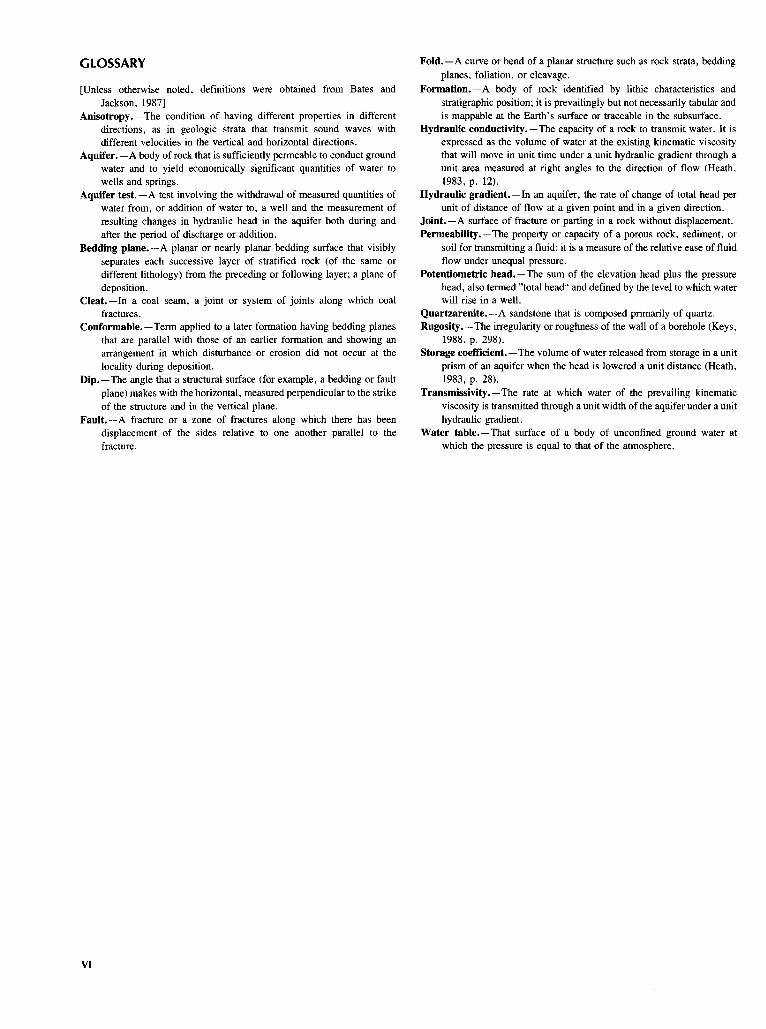
GLOSSARY
[Unless otherwise noted, definitions were obtained from Bates and Jackson, 1987]
Anisotropy.-The condition of having different properties in different directions, as in geologic strata that transmit sound waves with different velocities in the vertical and horizontal directions .
Aquifer. -A body ofrock that is sufficiently permeable to conduct ground water and to yield economically significant quantities of water to wells and springs.
Aquifer test . -A test involving the withdrawal of measured quantities of water from, or addition of water to, a well and the measurement of resulting changes in hydraulic head in the aquifer both during and after the period of discharge or addition .
Bedding plane.-A planar or nearly planar bedding surface that visibly separates each successive layer of stratified rock (of the same or different lithology) from the preceding or following layer; a plane of deposition .
Cleat.-In a coal seam, a joint or system of joints along which coal fractures .
Conformable.-Term applied to a later formation having bedding planes that are parallel with those of an earlier formation and showing an arrangement in which disturbance or erosion did not occur at the locality during deposition .
Dip.-The angle that a structural surface (for example, a bedding or fault plane) makes with the horizontal, measured perpendicular to the strike of the structure and in the vertical plane .
Fault.-A fracture or a zone of fractures along which there has been displacement of the sides relative to one another parallel to the fracture .
Fold .-A curve or bend of a planar structure such as rock strata, bedding planes, foliation, or cleavage.
Formation.-A body of rock identified by lithic characteristics and stratigraphic position ; it is prevailingly but not necessarily tabular and is mappable at the Earth's surface or traceable in the subsurface.
Hydraulic conductivity .-The capacity of a rock to transmit water . It is expressed as the volume of water at the existing kinematic viscosity that will move in unit time under a unit hydraulic gradient through a unit area measured at right angles to the direction of flow (Heath, 1983, p . 12) .
Hydraulic gradient .-In an aquifer, the rate of change of total head per unit of distance of flow at a given point and in a given direction .
Joint.-A surface of fracture or parting in a rock without displacement . Permeability .-The property or capacity of a porous rock, sediment, or
soil for transmitting a fluid; it is a measure of the relative ease of fluid flow under unequal pressure .
Potentiometric head.-The sum of the elevation head plus the pressure head, also termed "total head" and defined by the level to which water will rise in a well .
Quartzarenite.-A sandstone that is composed primarily of quartz . Rugosity .-The irregularity or roughness of the wall of a borehole (Keys,
1988, p. 298) . Storage coefficient.-The volume of waterreleased from storage in a unit
prism of an aquifer when the head is lowered a unit distance (Heath, 1983, p . 28) .
Transmissivity.-The rate at which water of the prevailing kinematic viscosity is transmitted through a unit width of the aquifer under aunit hydraulic gradient .
Water table.-That surface of a body of unconfined ground water at which the pressure is equal to that of the atmosphere .
Hydraulic Characteristics of, and Ground-Water Flow in, Coal-Bearing Rocks of Southwestern Virginia By George E. Harlow, Jr ., and Gary D . LeCain
Abstract
This report presents the results of a study by the U .S . Geological Survey, in cooperation with the Virginia Department of Mines, Minerals, and Energy, Division of Mined Land Reclamation, and the Powell River Project, to describe the hydraulic characteristics of major water-bearing zones in the coal-bearing rocks of southwestern Virginia and to develop a conceptual model of the ground-water-flow system. Aquifer testing in 1987 and 1988 of 9-ft intervals in coal-exploration coreholes indicates that transmissivity decreases with increasing depth. Most rock types are permeable to a depth of approximately 100 ft ; however, only coal seams are consistently permeable (transmissivity greater than 0.001 ft/d) at depths greater than 200 ft . Constant-head injection testing of rock intervals adjacent to coal seams usually indicated lower values of transmissivity than those values obtained when coal seams were isolated within the test interval ; thus, large values of horizontal hydraulic conductivity at depth are associated with coal seams.
Potentiometric-head measurements indicate that high topographic areas (ridges) function as recharge areas; water infiltrates through the surface, percolates into regolith, and flows downward and laterally through fractures in the shallow bedrock. Hydraulic conductivity decreases with increasing depth, and ground water flows primarily in the lateral direction along fractures or bedding planes or through coal seams . If vertical hydraulic conductivity is negligible, ground water continues to flow laterally, discharging as springs or seeps on hillslopes . Where vertical hydraulic conductivity is appreciable, ground water follows a stairstep path through the regolith, fractures, bedding planes, and coal seams, discharging to streams and (or) recharging coal seams at depth.
Permeable coal seams probably underlie valleys in the region ; however, aquifer-test data indicate that the horizontal hydraulic conductivity of coal is a function of depth and probably decreases under ridges because of increased overburden pressures . Ground water beneath valleys that does not discharge to streams probably flows downgradient as underflow beneath the streams. Topographic relief in the area provides large hydraulic-head differences (greater than 300 ft in some instances) for the ground-water-flow system . Transmissivity data from the range of depths tested during this study indicate that most
ground-water flow takes place at moderate depths (less than 300 ft) and that little deep regional ground-water flow occurs .
INTRODUCTION
The coal fields of southwestern Virginia produced 42 million short tons of bituminous coal in 1986 . The average annual coal production for the period 1981-86 was 41 million short tons, which amounts to about 4.5 percent of the annual coal production in the United States . The estimated coal reserves of the study area are 9.5 billion short tons, approximately 1 .3 percent of the total bituminous coal reserves of the United States (Hessley and others, 1986) . Coal-mining operations in the area include underground mining (81 percent) and surface mining (19 percent).
The U.S . Census Bureau (U.S . Department of Commerce, 1980) estimates that 34 percent of the population in the study area (106,415) depend on the coal-mining indus try for income . Coal mining is a high-paying industry, accounting for 41 percent of personal income in the study area .
As of 1990, little quantitative information is available to document the effects of coal mining on the ground-water-flow system of the coal fields . Mining can alter flow patterns, increase the flow between and (or) within aquifers', and affect spring discharges and stream base flows . Mining can also change the natural chemistry of the ground water.
The Surface Mining Control and Reclamation Act (PL95-87), enacted by the U.S . Congress in 1977, requires coal-mine operators to quantify and, if necessary, monitor ground water in mined areas. Ground-water information is commonly unavailable because the expense and technical requirements of ground-water monitoring and testing programs limit the collection of baseline data for mine planning and reclamation programs .
'Terms in bold type are defined in glossary .
Introduction 1
Most ground-water testing programs in the past have consisted of open-hole aquifer tests and composite water-quality sampling . Data from these types of aquifer tests and chemical analyses represent the composite influence of all rock types and aquifers penetrated by the borehole . These data do not allow an evaluation of the effects of individual rock types or water-bearing zones on the hydrology and water quality of the ground-water system . The absence of aquifer-specific data limits the ability to regulate present mine operations and hinders planning for future mining and for domestic and industrial growth.
Larson and Powell (1986) estimated the hydraulic characteristics and water quality of individual aquifers in Buchanan and Dickenson Counties, Va., by isolating selected test intervals with controlled drilling and grouting procedures . This method was successful but expensive and impractical on a regional scale. Wright (1985) showed that straddle packers could be used to isolate and test specific intervals in coal-exploration coreholes .
In 1985, a cooperative program among the Virginia Department of Mines, Minerals, and Energy, Division of MinedLand Reclamation; the Powell River Project; and the U.S . Geological Survey (USGS) was organized to (1) study the ground water of the coal fields of southwestern Virginia, (2) to provide adata base for use in determining the possible effects of coal mining and land reclamation on the ground-water-flow system, and (3) to aid State or local water-resources officials or managers in planning for industrial and domestic water use . The USGS was designated the principal investigator; and the Virginia Department of Mines, Minerals, and Energy, Division of Mined Land Reclamation provided geological and mine-operations information . Coal-mine operators, many of whom are cooperators with the Powell River Project, allowed the USGS to conduct hydraulic tests and collect water samples for analysis from their coal-exploration coreholes.
Purpose and Scope
This report describes the hydraulic characteristics of major water-bearing zones in the coal-bearing rocks of southwestern Virginia and presents a conceptual model of the ground-water-flow system. The results of hydraulic testing conducted in 349 test intervals in 43 coal-exploration coreholes located in the coal fields of southwestern Virginia are presented . Hydraulic testing with a pneumatic straddle-packer assembly provided a means for determining poten-tiometric head and transmissivity . During 1987 and 1988, testing was conducted in exploration coreholes drilled by area coal-mining companies. An average of 10 test intervals was selected for hydraulic analysis in each corehole after evaluating core samples and borehole geophysical logs . Analysis of hydraulic data from these test intervals produced 367 values of transmissivity and 134 values of
potentiometric head that were used to develop a conceptual model of the ground-water-flow system .
Location of Study Area
The study area is located in southwestern Virginia (pl . 1), encompassing approximately 1,500 miz. Approxi-mately one-third of the study area lies within the Jefferson National Forest . The study area includes all of Wise, Dickenson, and Buchanan Counties, and parts of Lee, Scott, Russell, and Tazewell Counties . The area is bounded by the State ofKentucky on the northwest, the State of West Virginia on the northeast, and the Clinch River Valley on the southeast. The southwestern boundary is the southwestern extent of the Virginia Appalachian Plateau physiographic province .
Climate
The climate of the study area is central temperate. Temperatures normally range from -10 to 94°F and average 54°F annually (National Oceanic and Atmospheric Administration, 1986) . Monthly average temperatures range from aminimum of 33°F in January to a maximum of 72°F in July . The number of frost-free days varies with elevation; but on the average, the first freeze of the season occurs in late October and the last freeze occurs in early May. Precipitation varies with location and elevation but averages 41 in . annually in Wise County, including 15-30 in . of snow . Precipitation is distributed evenly throughout the year, having a maximum of 3-4 in/mo in the spring and early summer and a minimum of 2-3 in/mo during the fall .
Physiography
The study area lies within the southern Appalachian Plateau physiographic province . Elevations range from 845 ft above sea level, where the Levisa Fork River flows into Kentucky, to 4,223 ft above sea level on High Knob Mountain (pl . 1) . The area supports extensive, dense deciduous forests and some evergreens . The generally flat-lying rock strata have been heavily dissected by rivers, resulting in a rugged topography of narrow valleys and steep hillslopes with little or no bottomland . Ridge tops are 600-1,000 ft above the stream bottoms . The southern part of the study area is drained by the Powell and Clinch Rivers, which are part of the Tennessee River Basin . The northern part is drained by the Levisa Fork, Cranes Nest, McClure, Pound, and Russell Fork Rivers, which are part of the Big Sandy River Basin. Two large reservoirs, the John W. Flannagan Reservoir and the North Fork Pound River Lake, supply water for industrial and domestic purposes .
Hydraulic Characteristics of, and Ground-Water Flow in, Coal-Bearing Rocks of Southwestern Virginia 2
�
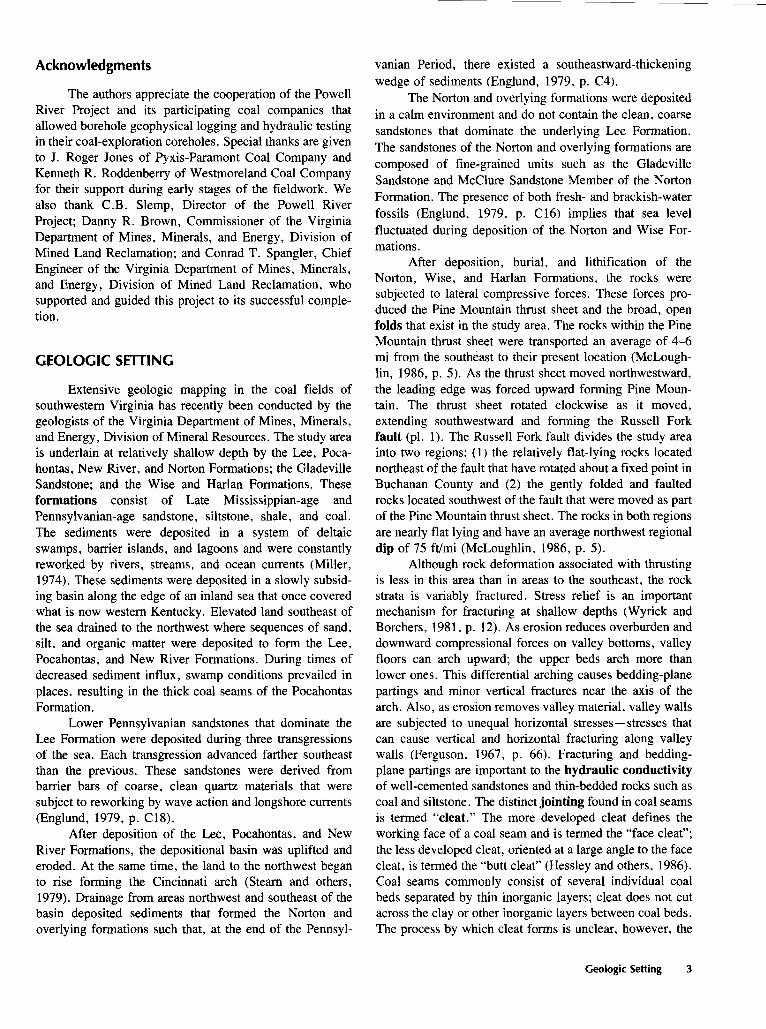
Acknowledgments
The authors appreciate the cooperation of the Powell River Project and its participating coal companies that allowed borehole geophysical logging and hydraulic testing in their coal-exploration coreholes . Special thanks are given to J. Roger Jones of Pyxis-Paramont Coal Company and Kenneth R. Roddenberry of Westmoreland Coal Company for their support during early stages of the fieldwork. We also thank C.B . Slemp, Director of the Powell River Project; Danny R. Brown, Commissioner of the Virginia Department of Mines, Minerals, and Energy, Division of Mined Land Reclamation; and Conrad T . Spangler, Chief Engineer of the Virginia Department of Mines, Minerals, and Energy, Division of Mined Land Reclamation, who supported and guided this project to its successful completion .
GEOLOGIC SETTING
Extensive geologic mapping in the coal fields of southwestern Virginia has recently been conducted by the geologists of the Virginia Department of Mines, Minerals, and Energy, Division of Mineral Resources . The study area is underlain at relatively shallow depth by the Lee, Pocahontas, New River, and Norton Formations ; the Gladeville Sandstone; and the Wise and Harlan Formations . These formations consist of Late Mississippian-age and Pennsylvanian-age sandstone, siltstone, shale, and coal . The sediments were deposited in a system of deltaic swamps, barrier islands, and lagoons and were constantly reworked by rivers, streams, and ocean currents (Miller, 1974). These sediments were deposited in a slowly subsiding basin along the edge of an inland sea that once covered what is now western Kentucky . Elevated land southeast of the sea drained to the northwest where sequences of sand, silt, and organic matter were deposited to form the Lee, Pocahontas, and New River Formations . During times of decreased sediment influx, swamp conditions prevailed in places, resulting in the thick coal seams of the Pocahontas Formation .
Lower Pennsylvanian sandstones that dominate the Lee Formation were deposited during three transgressions of the sea. Each transgression advanced farther southeast than the previous . These sandstones were derived from barrier bars of coarse, clean quartz materials that were subject to reworking by wave action and longshore currents (Englund, 1979, p. C18) .
After deposition of the Lee, Pocahontas, and New River Formations, the depositional basin was uplifted and eroded. At the same time, the land to the northwest began to rise forming the Cincinnati arch (Steam and others, 1979) . Drainage from areas northwest and southeast of the basin deposited sediments that formed the Norton and overlying formations such that, at the end of the Pennsyl
vanian Period, there existed a southeastward-thickening wedge of sediments (Englund, 1979, p. C4).
The Norton and overlying formations were deposited in a calm environment and do not contain the clean, coarse sandstones that dominate the underlying Lee Formation. The sandstones of the Norton and overlying formations are composed of fine-grained units such as the Gladeville Sandstone and McClure Sandstone Member of the Norton Formation. The presence of both fresh- and brackish-water fossils (Englund, 1979, p. C16) implies that sea level fluctuated during deposition of the Norton and Wise Formations .
After deposition, burial, and lithification of the Norton, Wise, and Harlan Formations, the rocks were subjected to lateral compressive forces . These forces pro duced the Pine Mountain thrust sheet and the broad, open folds that exist in the study area . The rocks within the Pine Mountain thrust sheet were transported an average of 4-6 mi from the southeast to their present location (McLoughlin, 1986, p. 5) . As the thrust sheet moved northwestward, the leading edge was forced upward forming Pine Mountain . The thrust sheet rotated clockwise as it moved, extending southwestward and forming the Russell Fork fault (pl . 1) . The Russell Fork fault divides the study area into two regions: (1) the relatively flat-lying rocks located northeast of the fault that have rotated about a fixed point in Buchanan County and (2) the gently folded and faulted rocks located southwest of the fault that were moved as part of the Pine Mountain thrust sheet. The rocks in both regions are nearly flat lying and have an average northwest regional dip of 75 ft/mi (McLoughlin, 1986, p. 5) .
Although rock deformation associated with thrusting is less in this area than in areas to the southeast, the rock strata is variably fractured . Stress relief is an important mechanism for fracturing at shallow depths (Wyrick and Borchers, 1981, p. 12). As erosion reduces overburden and downward compressional forces on valley bottoms, valley floors can arch upward ; the upper beds arch more than lower ones . This differential arching causes bedding-plane partings and minor vertical fractures near the axis of the arch . Also, as erosion removes valley material, valley walls are subjected to unequal horizontal stresses-stresses that can cause vertical and horizontal fracturing along valley walls (Ferguson, 1967, p. 66). Fracturing and bedding-plane partings are important to the hydraulic conductivity of well-cemented sandstones and thin-bedded rocks such as coal and siltstone . The distinct jointing found in coal seams is termed "cleat ." The more developed cleat defines the working face of a coal seam and is termed the "face cleat" ; the less developed cleat, oriented at a large angle to the face cleat, is termed the "butt cleat" (Hessley and others, 1986) . Coal seams commonly consist of several individual coal beds separated by thin inorganic layers ; cleat does not cut across the clay or other inorganic layers between coal beds . The process by which cleat forms is unclear, however, the
Geologic Setting 3
orientation of cleat is usually related to regional tectonic forces in an area . Cleat generally shows two preferred orientations-face cleat oriented perpendicular to axial trends of folds and butt cleat oriented parallel to axial trend of folds (Schubert, 1980, p . 66) .
Lee Formation
The Lee Formation (Campbell, 1893) of Late Mississippian and Early Pennsylvanian age is dominated by three quartz-rich sandstone members (Miller, 1974) that form steep cliffs and ridges . Campbell (1894) described these sandstones as massive and conglomeratic having interbedded shales and two to six coal seams. The Lee Formation contains four Lower Pennsylvanian members: the Middlesboro, Hensley, Bee Rock Sandstone, and Naese Sandstone Members (Diffenbach, 1988) . The Middlesboro Member, which is the most prominent and areally extensive member of the Lee Formation, disconformably overlies the Upper Mississippian Bluestone Formation. The Middlesboro Member is composed of two tongues of clean, light-gray, quartzose sandstone that thin and pinch out to the southeast. The lower tongue extends across most of the study area and has amaximum thickness of 350-400 ft in the southwestern counties . The upper tongue, located approximately 450 ft above the lower tongue, has an average thickness of 100-150 ft and is not as areally extensive. The Middlesboro Member is replaced laterally by light-to-medium gray, feldspathic sandstone, siltstone, and coal of the Pocahontas and New River Formations (Nolde and Mitchell, 1984, P . 3) .
The Hensley Member of the Lee Formation contains an alternating sequence of sandstone, siltstone, shale, coal, and underclay. In areas where the overlying Bee Rock Sandstone Member, the upper member of the Lee Formation, is absent, strata equivalent to the Hensley Member are included in the Norton Formation (Englund, 1979, p . C14; J.E . Nolde, Virginia Department of Mines, Minerals, and Energy, Division of Mineral Resources, written commun ., 1988, 1990) .
The Bee Rock Sandstone Member of the Lee Formation is a 100-ft-thick unit of quartzose, conglomeratic sandstone. Northeast, this member grades into the feld spathic McClure Sandstone Member of the Norton Formation . In the southwestern part of the study area, the Bee Rock Sandstone Member is overlain by the Naese Sandstone Member, which marks the upper boundary of the Lee Formation (Diffenbach, 1988). The coal seams evaluated during hydraulic testing in the Lee Formation include the Tiller, Jawbone, and Raven.
Pocahontas Formation
The Pocahontas Formation (Campbell, 1896) of Early Pennsylvanian age is a northwestward-thinning,
wedge-shaped rock unit of light-gray, fine- to medium-grained, micaceous, feldspathic sandstone interbedded with medium-to-dark gray siltstone and coal (Miller, 1974) . The Pocahontas Formation conformably overlies the Bluestone Formation of Late Mississippian age (Englund, 1979). The deep coal seams of the Pocahontas Formation are generally thicker than the coal seams of the younger Norton and Wise Formations . Because the coal seams of the Pocahontas Formation were not penetrated by any coal-exploration coreholes, their hydraulic properties were not evaluated.
New River Formation
The New River Formation (Fontaine, 1874) of Early Pennsylvanian age is a coal-bearing sequence of sandstone, siltstone, and shale . This formation is lithologically similar to the Pocahontas Formation except for the presence of light-gray, fine- to coarse-grained quartzarenite and conglomeratic sandstone that grades laterally into the Middlesboro Member of the Lee Formation (Englund, 1979, p. C15) . The New River Formation conformably overlies the Pocahontas Formation, and both are known for their numerous thick, low-sulfur coal seams . These coal seams are absent, or are much thinner, where the Pocahontas and New River Formations intertongue with the Lee Formation to the northwest. The coal seams evaluated during hydraulic testing in the New River Formation include the Lower Seaboard, Upper Seaboard, Castle, Tiller, and Jawbone.
Norton Formation
The Norton Formation (Campbell, 1893) ofEarly and Middle Pennsylvanian age consists of siltstone and shale and some sandstone, coal, and underclay (Miller, 1974). The siltstone and shale are gray to dark gray, locally carbonaceous, sideritic, and thinly laminated. The sandstone is gray to light gray, fine to medium grained, clayey, silty, micaceous, and weakly cemented with silica . In the northwestern part of the study area, the Norton Formation has an average thickness of 750-800 ft, and the top of the Naese Sandstone Member is the lower boundary . In the southeastern part of the study area, the Norton Formation is up to 1,300 ft thick and contains sandstone and coal seams, which are included in the Lee Formation to the northwest. The base of the Norton Formation is defined as the top of the uppermost quartzarenite of the Lee Formation. From northwest to southeast this boundary is displaced downward as the quartzarenite bodies pinch out, such that the boundary may be the top of the Naese Sandstone Member, the Bee Rock Sandstone Member, the upper part of the Middlesboro Member, or the lower part of the Middlesboro Member . In extreme southeastern Buchanan County and in small areas of Russell and Tazewell Counties, the lower part of the
Hydraulic Characteristics of, and Ground-Water Flow in, Coal-Bearing Rocks of Southwestern Virginia
�
Norton Formation is laterally equivalent to much of the NewRiver Formation. The Norton Formation contains nine minable coal seams (Campbell, 1896). The coal seams evaluated during hydraulic testing in the Norton Formation include the Kennedy, Bearwallow, Big Fork, Lower Banner, Upper Banner, Splashdam, Hagy, and Norton .
Gladeville Sandstone
The Gladeville Sandstone (Campbell, 1893) of Middle Pennsylvanian age is a gray, medium- to coarse-grained, massive, quartzose sandstone that may be locally conglomeratic . In the southern sections of Wise and Dickenson Counties, the resistant Gladeville forms numerous ridges and low plateaus . In the northern areas, the Gladeville thins and is absent in most of Dickenson and Buchanan Counties . The Gladeville conformably overlies the Norton Formation.
Wise Formation
The Wise Formation (Campbell, 1893) of Middle Pennsylvanian age is composed of siltstone, sandstone, shale, coal, and underclay, including two distinctive cal careous marine-shale units. The siltstone and shale are medium-to-dark gray, and the carbonaceous shale is commonly black. The sandstone is light gray, fine to medium grained, micaceous, and feldspathic . The Wise Formation contains several thick sandstone units, including the Clover Fork, Marcum Hollow, and Reynolds Sandstone Members . The two marine zones, equivalent to the Kendrick Shale of Jillson (1919) and the Magoffin beds of Morse (1931), are composed of fossiliferous limestone and calcareous siltstone. The Wise Formation conformably overlies the Gladeville Sandstone and reaches a thickness of 2,300 ft in the northwest, where the Wise is capped by the Harlan Formation (Campbell, 1893). To the southeast, erosion has removed most or all of the formation. Campbell (1893) noted that the Wise Formation contains up to 18 coal seams. The coal seams evaluated during hydraulic testing of the Wise Formation include the Dorchester, Lyons, Blair, Clintwood, Imboden, Kelly, Upper St. Charles, Wilson, Taggart Marker, Taggart, and Low Splint . The Harlan Formation was not tested .
STUDY METHODS
Hydraulic characteristics and ground-water flow in the coal fields of southwestern Virginia were investigated using data collected in existing coreholes. These coreholes were not purged or swabbed, and water was used as a
drilling fluid. Corehole geophysical properties were logged; hydraulic tests were conducted using a straddle-packer assembly designed for small-diameter coreholes (fig . 1) ; and corehole water samples were obtained using an air-operated, reciprocating piston pump incorporated in the straddle-packer assembly .
Borehole Geophysical Logging
Borehole geophysical logging of the coal-exploration coreholes was conducted to (1) determine borehole rugosity and locate fractures, cavities, and clay pinchouts, (2) determine corehole water levels, and (3) select intervals for water-quality sampling and hydraulic testing with the straddle-packer assembly .
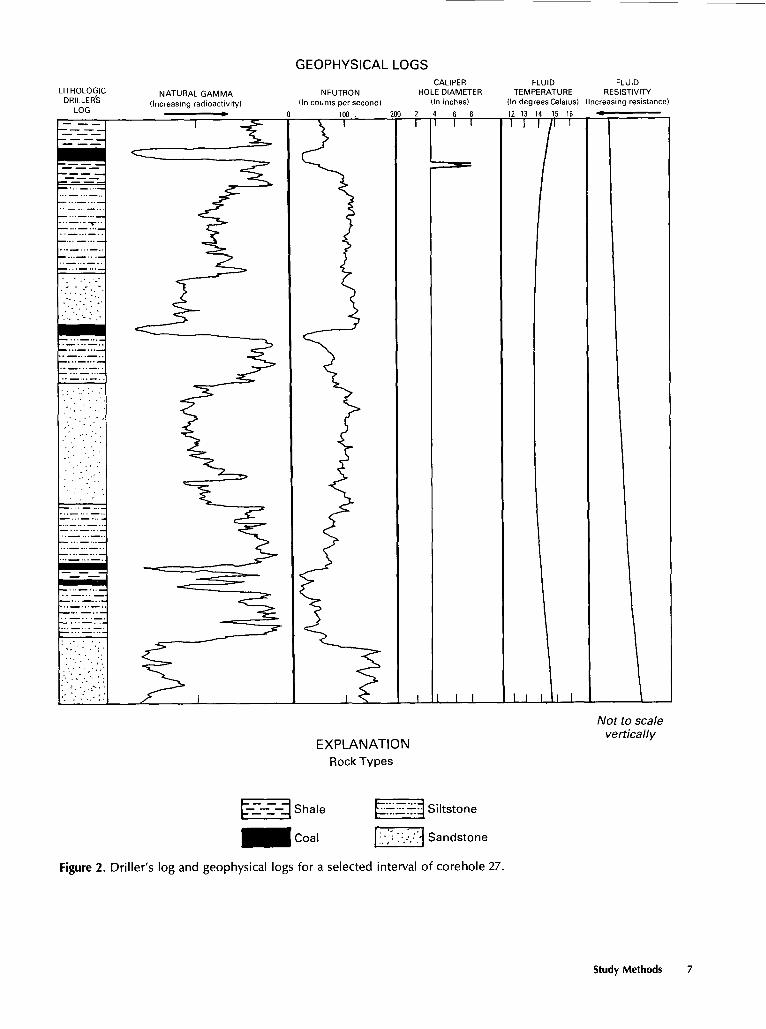
Caliper, natural-gamma, neutron, and fluid (temperature and resistivity) logs were obtained in the coreholes. This information was commonly supplemented by drillers' logs and core samples provided by the coal operators. Access to the coreholes, the drillers' logs, and core samples was provided by the operators with the understanding that information concerning the thicknesses and grades of coal seams would remain confidential . The driller's and geophysical logs from a selected interval of a typical test hole (corehole 27) are shown in figure 2. The driller's log indicates the rock types penetrated by the corehole, and the geophysical logs indicate typical probe responses to the various rock types.
Caliper logs were used to determine borehole rugosity. As shown in figure 2, deviations in the caliper log sometimes occurred over coal seams. Fractures, cavities, and clay pinchouts can cause a rough, irregular borehole wall that can obstruct passage of the packer assembly . Inflation of the pneumatic packers over a rough section of a borehole probably will not isolate the zone because of leakage around the packers and could result in rupturing of the packers and loss of the entire assembly . Thus, caliper logs were helpful in deciding where to set the straddle-packer assembly in the coreholes .
The combinations of natural-gamma and neutron logs provided adequate lithologic profiles of coreholes and were particularly helpful where drillers' logs were unavailable . Sandstone and siltstone generally produce mirrored deflections on natural-gamma and neutron logs (for example, sandstone has a low natural-gamma count and a high neutron count), whereas coal produces similar deflections on both logs (fig . 2) .
Fluid-resistivity logs were used to determine water levels in the coreholes . Deviations in fluid logs can indicate intervals where water is entering or leaving coreholes; however, few deviations were observed in the fluid logs, and flow intervals were usually not detected .
Study Methods 5

�
Steel cable
Nitrogen tank
Water tank
Hoses
Gasoline-powered generator
Control panel
Not to scale
Hoses to surface
Upper balloon packer
Test interval m
Lower balloon packer -, , * Siltstone
Figure 1 . Schematic diagram of the pneumatic straddle-packer assembly and support trailer used to conduct hydraulic testing in coreholes .
Hydraulic Characteristics of, and Ground-Water Flow in, Coal-Bearing Rocks of Southwestern Virginia 6
�������������������
GEOPHYSICAL LOGS CALIPER FLUID FLUID
LITHOLOGIC NATURAL GAMMA NEUTRON HOLE DIAMETER TEMPERATURE RESISTIVITY DRILLERS LOG
(Increasing radioactivity) ~y 0
(In counts persecond)
100 . 200 2
(In inches)
4 6 8
(In degrees Celsius)
12 13 14 15 16
(Increasing resistance)
- -
1_LI
Not to scale
EXPLANATION vertically
Rock Types
Shale C---~ Siltstone
Coal Sandstone
Figure 2. Driller's log and geophysical logs for a selected interval of corehole 27 .
Study Methods 7

��
Water-Quality Sampling ity of these methods depends on the characteristics of the aquifer and of the corehole .
it was difficult to collect a water sample from a test interval that accurately represented the quality of water in that interval alone. The high water pressure required to remove rock cuttings during core drilling forces drilling water into the permeable intervals of rock penetrated by the corehole . This drilling water may remain in the rocks for some time . After the drilling was completed, the open corehole allowed water to move from zones of high head to zones of lower head . Where water flowed between zones, the quality of the sample obtained from an interval into which water flowed was not representative of the water quality in the test interval but was instead a composite of the quality of drilling water, water from zones of higher head, and local-formation water.
The time between drilling and water-quality sampling ranged from 1 week to more than 9 months . It was originally speculated that, given enough time, the effects of drilling on water quality would be minimized so that representative samples of water in the isolated formation could be obtained . However, because of flow between permeable test intervals in the coreholes, it was nearly impossible to collect samples representative of the formation water in the test intervals, even after the effects of drilling had diminished .
After a review of the water-quality data obtained early in the study and recognition of the complex head relations, the water-quality samples obtained from the isolated zones were determined to be unrepresentative . In most instances, a static water level was established in the coreholes that was greater than the potentiometric heads measured for most of the test intervals, indicating flow into the intervals . Consequently, the chemical composition of water samples from most intervals within a single corehole was virtually identical. The water-quality sampling program was discontinued after a few experimental attempts at collecting representative water samples from various depth intervals .
Hydraulic Testing
Field methods for evaluating the hydraulic characteristics of aquifers differ, but nearly all rely on the concept of creating hydraulic stress on an aquifer. The response of an aquifer to the artificial stress is used to quantify the aquifer's hydraulic characteristics . Four methods are used to induce stress in and measure the response of aquifers : (1) removing water for an extended period of time and monitoring the subsequent decrease in hydraulic head, (2) removing water for a short period of time and monitoring the subsequent recovery, (3) adding water for an extended period of time and monitoring the subsequent increase in hydraulic head, and (4) adding water for a short period of time and monitoring the subsequent recovery . The suitabil-
Results given in this report are based on tests conducted in 349 intervals in 43 uncased coal-exploration coreholes using a pneumatic straddle-packer assembly (fig . 1) . The straddle-packer assembly was lowered to a selected test interval, and the pneumatic packers were inflated with compressed nitrogen . The inflated pneumatic packers isolated a fixed 9-ft-long interval . The equipment was designed so that constant-head, standard-slug, and modified-slug testing could be conducted. By using a system of valves and hoses, water was injected into or withdrawn from the test interval, and the associated response measured . The test results represent aquifer characteristics of the interval isolated by the packers.
Constant-Head Injection Test
Hvorslev (1951, p . 31, fig. 12, case 8) developed an equation for analyzing steady-state, constant-head injection tests in saturated, homogeneous, isotropic soils that also has applications in rock formations :
K= Qln [(L/2r)+ -\/1+(L/2r)`] (1) 2arH L
where K=hydraulic conductivity (L/T); Q=injection rate (L3/T); H=injection head (L); L =length of test interval (L); r =radius of the corehole (L); and In =natural logarithm, base e .
The method is based on the assumption that no leakage or frictional loss in the test apparatus occurs and that changes in injection rates are caused solely by flow through the aquifer without being affected by hydraulic boundaries . Although designed for saturated zones, the method has applications in unsaturated zones.
If L is greater than 5r, as is the case in all testing reported here, the equation simplifies to
K_Qln (L/r)
2,rHL ' The method is based on the assumption that the
injection head-to-flow ratio (H:Q) is constant . The injection head and flow rates were varied using the pneumatic straddle-packer assembly, and H:Q was constant .
Water was injected into various isolated sections of a corehole under a constant hydraulic head while the injection flow rate was monitored. Testing conducted in both satu rated and unsaturated zones allowed the compilation of a hydraulic-conductivity profile of the corehole . The testing can be conducted rapidly; however, because the test response is dominated by the hydraulic conductivity of rock
Hydraulic Characteristics of, and Ground-Water Flow in, Coal-Bearing Rocks of Southwestern Virginia 8

��������������
A 400
Equilibration period Test 1 ~ : -Test 2 :
www 300 z COREHOLE c water-level w J~ head x U J Injection
Packer pressure200 inflation reduced
0 TESTINTERVAL x -------- Potentiometric
Packer head Injection begun Injection ended deflation
100 I 0
i
10 i
20 i
30 I
40 i
50 60 TIME, IN MINUTES
B 250
Ho=Instantaneous head change upon pressurization H=Head at any time during recovery
Hww 200 z 0 II wx U J ¢ 150x i TESTINTERVAL0 - Potentiometric x head
100
TIME, IN MINUTES
Figure 3. A, Typical pressure response of water level in a coal seam during packer inflation and equilibration and during two constant-head injection tests at different flow rates, and B, typical pressure response of water level in a sandstone during a standard slug test .
immediately surrounding the corehole, only a small part of flow into the isolated interval was subject to a transient the formation is tested . stage in which the injection rate was steadily decreasing .
Each water-bearing unit in an open corehole has an The flow rate was continuously monitored until steady-state associated potentiometric head . The water level in the flow was established . corehole is a composite of the potentiometric heads of all This method is limited in that it does not account for water-bearing units penetrated by the corehole . Packer anisotropy . Consolidated sedimentary rocks, like those in inflation created an initial surge of pressure in the test the study area, are anisotropic because of partings along interval as a result of the compression of the corehole water bedding planes, grain orientation, grain-size variations, the isolated between the inflating packers (fig . 3A). After presence of fractures, and cleating in coal seams. Schubert inflation, the test interval was allowed to equilibrate to its (1980, table 2, p. 62), using laboratory-determined air potentiometric head . After equilibration, water was injected permeabilities corrected for the Klinkenberg effect (the into the test interval at a constant head while the flow rate value is equivalent to permeability of the core to a was monitored. During the early stages of the test period, nonreactive, homogeneous, single-phase liquid), showed
Study Methods 9
���
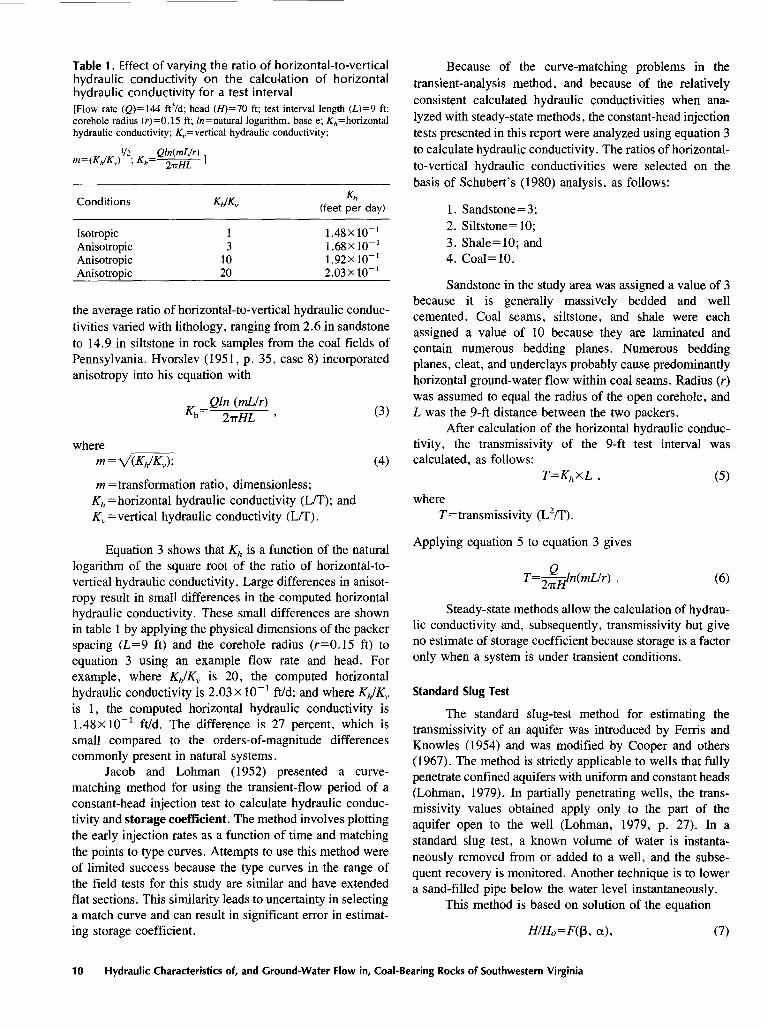
Table 1 . Effect of varying the ratio of horizontal-to-vertical hydraulic conductivity on the calculation of horizontal hydraulic conductivity for a test interval [Flow rate (Q)=144 ft3/d ; head (H)=70 ft ; test interval length (L)=9 ft corehole radius (r)=0 .15 ft; ln=natural logarithm, base e ; K,,=horizontal hydraulic conductivity ; K,,=vertical hydraulic conductivity ;
rn=(K,fK~) 1/2 gh=Qln(mL/r); 2,RHL
KhConditions KKK� (feet per day)
Isotropic 1 1 .48 x 10- ' Anisotropic 3 1 .68x 10- ' Anisotropic 10 1 .92X 10- ' Anisotropic 20 2.03 x 10- '
the average ratio of horizontal-to-vertical hydraulic conductivities varied with lithology, ranging from 2.6 in sandstone to 14.9 in siltstone in rock samples from the coal fields of Pennsylvania . Hvorslev (1951, p . 35, case 8) incorporated anisotropy into his equation with
Qln (mL/r)Kh= 2,rrHL ' (3)
where rn ='\l(Kh1K�) ; (4)
m=transformation ratio, dimensionless ; Kh =horizontal hydraulic conductivity (L/T) ; and K� =vertical hydraulic conductivity (L/T) .
Equation 3 shows that Kh is a function of the natural logarithm of the square root of the ratio of horizontal-to-vertical hydraulic conductivity . Large differences in anisot ropy result in small differences in the computed horizontal hydraulic conductivity . These small differences are shown in table 1 by applying the physical dimensions of the packer spacing (L=9 ft) and the corehole radius (r=0 .15 ft) to equation 3 using an example flow rate and head . For example, where Kh/K,, is 20, the computed horizontal hydraulic conductivity is 2.03x 10⁻¹ ft/d ; and where Kh/K� is 1, the computed horizontal hydraulic conductivity is 1.48X10-' ft/d . The difference is 27 percent, which is small compared to the orders-of-magnitude differences commonly present in natural systems .
Jacob and Lohman (1952) presented a curve-matching method for using the transient-flow period of a constant-head injection test to calculate hydraulic conduc tivity and storage coefficient . Themethod involves plotting the early injection rates as a function of time and matching the points to type curves . Attempts to use this method were of limited success because the type curves in the range of the field tests for this study are similar and have extended flat sections . This similarity leads to uncertainty in selecting a match curve and can result in significant error in estimating storage coefficient .
Because of the curve-matching problems in the transient-analysis method, and because of the relatively consistent calculated hydraulic conductivities when ana lyzed with steady-state methods, the constant-head injection tests presented in this report were analyzed using equation 3 to calculate hydraulic conductivity . The ratios of horizontal-to-vertical hydraulic conductivities were selected on the basis of Schubert's (1980) analysis, as follows:
1 . Sandstone=3 ; 2. Siltstone=10 ; 3 . Shale=10 ; and 4. Coal= 10 .
Sandstone in the study area was assigned a value of 3 because it is generally massively bedded and well cemented . Coal seams, siltstone, and shale were each assigned a value of 10 because they are laminated and contain numerous bedding planes . Numerous bedding planes, cleat, and underclays probably cause predominantly horizontal ground-water flow within coal seams . Radius (r) was assumed to equal the radius of the open corehole, and L was the 9-ft distance between the two packers.
After calculation of the horizontal hydraulic conductivity, the transmissivity of the 9-ft test interval was calculated, as follows:
T=KhXL, (5)
where T=transmissivity (L2/T).
Applying equation 5 to equation 3 gives
T=QHln(rnLlr) . (6)2Steady-state methods allow the calculation ofhydrau-
lic conductivity and, subsequently, transmissivity but give no estimate of storage coefficient because storage is a factor only when a system is under transient conditions .
Standard Slug Test
The standard slug-test method for estimating the transmissivity of an aquifer was introduced by Ferris and Knowles (1954) and was modified by Cooper and others (1967) . The method is strictly applicable to wells that fully penetrate confined aquifers with uniform and constant heads (Lohman, 1979). In partially penetrating wells, the transmissivity values obtained apply only to the part of the aquifer open to the well (Lohman, 1979, p. 27). In a standard slug test, a known volume of water is instantaneously removed from or added to a well, and the subsequent recovery is monitored. Another technique is to lower a sand-filled pipe below the water level instantaneously.
This method is based on solution of the equation
HlHo=F(R, ac), (7)
1 0 Hydraulic Characteristics of, and Ground-Water Flow in, Coal-Bearing Rocks of Southwestern Virginia
���
wJZO F/5Zw
O =O
TIME, IN MINUTES
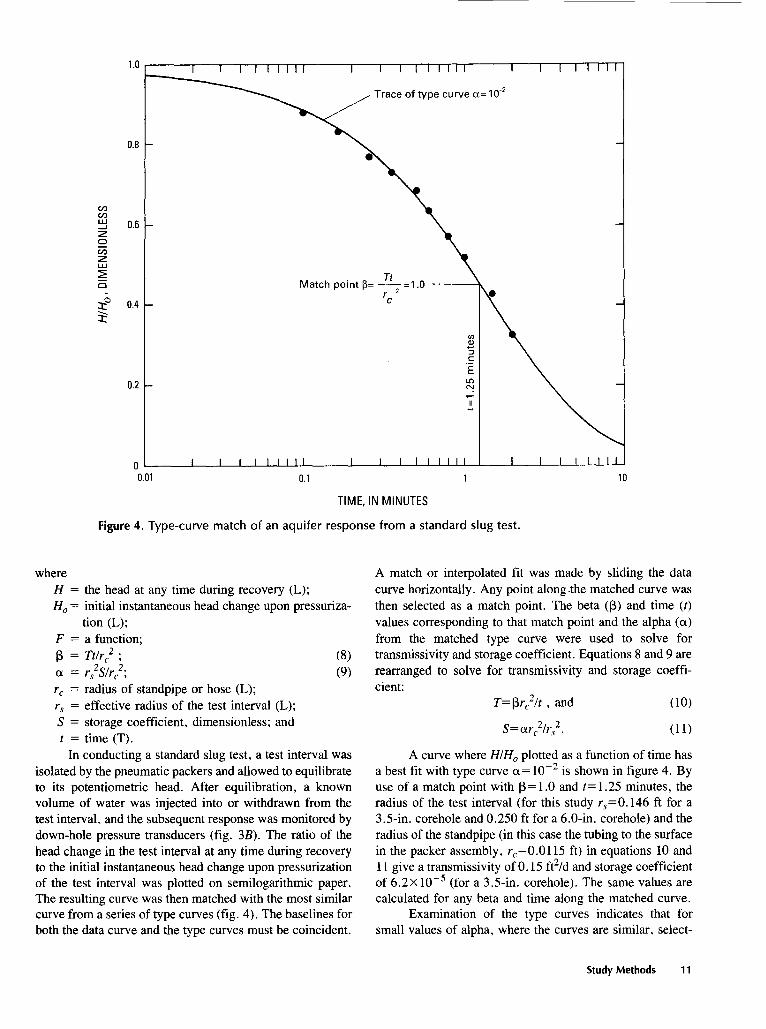
Figure 4. Type-curve match of an aquifer response from a standard slug test .
where H = the head at any time during recovery (L); Ho= initial instantaneous head change upon pressuriza
tion (L) ; F = a function ; (3 = Ttlr'2 ; (8) oc = rS2Slr,2 ; (9) rc = radius of standpipe or hose (L); r, = effective radius of the test interval (L); S = storage coefficient, dimensionless; and t = time (T) . In conducting a standard slug test, a test interval was
isolated by the pneumatic packers and allowed to equilibrate to its potentiometric head . After equilibration, a known volume of water was injected into or withdrawn from the test interval, and the subsequent response was monitored by down-hole pressure transducers (fig . 3B) . The ratio of the head change in the test interval at any time during recovery to the initial instantaneous head change upon pressurization of the test interval was plotted on semilogarithmic paper. The resulting curve was then matched with the most similar curve from a series of type curves (fig . 4) . The baselines for both the data curve and the type curves must be coincident .
A match or interpolated fit was made by sliding the data curve horizontally . Any point along .the matched curve was then selected as a match point. The beta (R) and time (t) values corresponding to that match point and the alpha (a) from the matched type curve were used to solve for transmissivity and storage coefficient . Equations 8 and 9 are rearranged to solve for transmissivity and storage coefficient:
T=(3r,21t , and (10)
.S= otr,2/rS2
A curve where H/Ho plotted as a function of time has a best fit with type curve cx=10-2 is shown in figure 4. By use of a match point with R=1.0 and t=1 .25 minutes, the radius of the test interval (for this study r,=0.146 ft for a 3 .5-in . corehole and 0 .250 ft for a6.0-in . corehole) and the radius of the standpipe (in this case the tubing to the surface in the packer assembly, r,=0 .0115 ft) in equations 10 and 11 give a transmissivity of 0.15 ft2/d and storage coefficient of 6.2x 10⁻⁵ (for a 3 .5-in. corehole). The same values are calculated for any beta and time along the matched curve.
Examination of the type curves indicates that for small values of alpha, where the curves are similar, select-
Study Methods 1 1
�
--
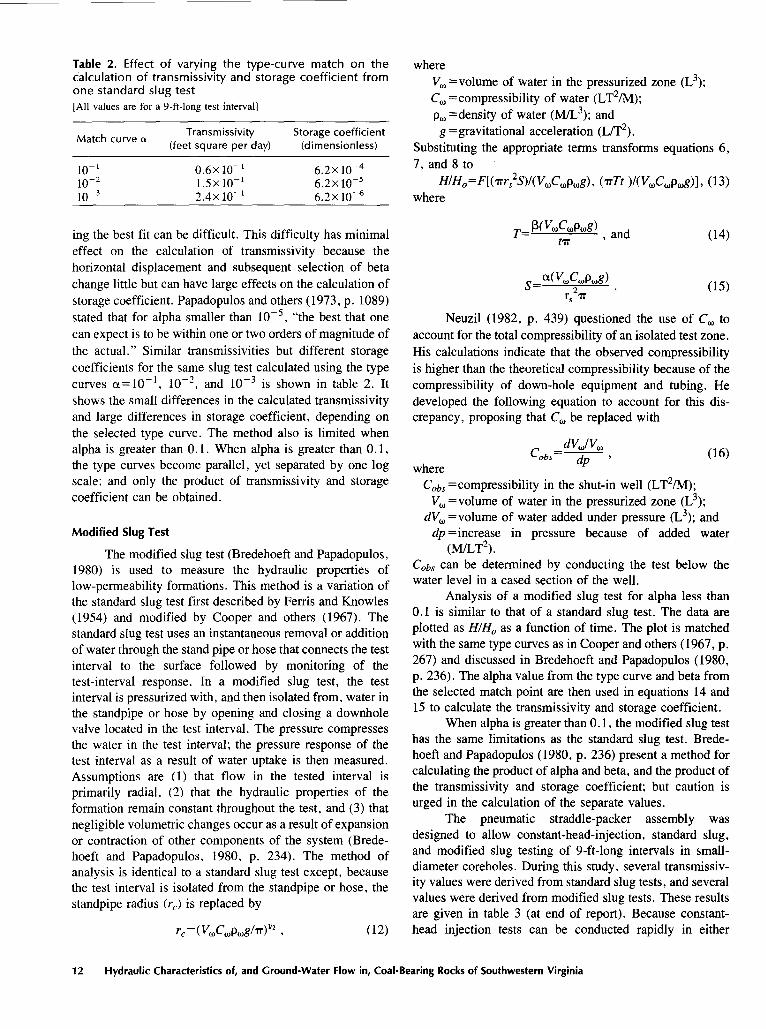
Table 2 . Effect of varying the type-curve match on the calculation of transmissivity and storage coefficient from one standard slug test [All values are for a 9-ft-long test interval]
Match curve a Transmissivity
(feet square per day) Storage coefficient (dimensionless)
10-' 0 .6x 10-' 6.2x 10⁻⁴ 10 1 .5 x 10 -' 6.2x 10⁻⁵ 10-3 2.4x 10-' 6.2x 10⁻⁶
ing the best fit can be difficult. This difficulty has minimal effect on the calculation of transmissivity because the horizontal displacement and subsequent selection of beta change little but can have large effects on the calculation of storage coefficient . Papadopulos and others (1973, p. 1089) stated that for alpha smaller than 10 -5 , "the best that one can expect is to be within one or two orders of magnitude of the actual." Similar transmissivities but different storage coefficients for the same slug test calculated using the type curves ot=10-1 , 10 -2 , and 10-3 is shown in table 2. It shows the small differences in the calculated transmissivity and large differences in storage coefficient, depending on the selected type curve . The method also is limited when alpha is greater than 0 .1 . When alpha is greater than 0.1, the type curves become parallel, yet separated by one log scale; and only the product of transmissivity and storage coefficient can be obtained .
Modified Slug Test
The modified slug test (Bredehoeft and Papadopulos, 1980) is used to measure the hydraulic properties of low-permeability formations . This method is a variation of the standard slug test first described by Ferris and Knowles (1954) and modified by Cooper and others (1967) . The standard slug test uses an instantaneous removal or addition of water through the stand pipe or hose that connects the test interval to the surface followed by monitoring of the test-interval response . In a modified slug test, the test interval is pressurized with, and then isolated from, water in the standpipe or hose by opening and closing a downhole valve located in the test interval . The pressure compresses the water in the test interval ; the pressure response of the test interval as a result of water uptake is then measured . Assumptions are (1) that flow in the tested interval is primarily radial, (2) that the hydraulic properties of the formation remain constant throughout the test, and (3) that negligible volumetric changes occur as a result of expansion or contraction of other components of the system (Bredehoeft and Papadopulos, 1980, p. 234) . The method of analysis is identical to a standard slug test except, because the test interval is isolated from the standpipe or hose, the standpipe radius (r,) is replaced by
r,=(V.CWP.g/,Tr)u2 , (12)
where Vu, =volume of water in the pressurized zone (L3); C=compressibility of water (LT2/M)(, ;
p(,, =density of water (M/L3); and g=gravitational acceleration (L/T2).
Substituting the appropriate terms transforms equations 6, 7, and 8 to
H1Ho =F[(arrs2S)l(VWC.P.g), (arTt )/(VWCWPwg)], (13) where
T- R(VWC.PWg) and (14)tar
S=a(V.CWPwg) . (15)z rs ar
Neuzil (1982, p. 439) questioned the use of C6, to account for the total compressibility of an isolated test zone . His calculations indicate that the observed compressibility is higher than the theoretical compressibility because of the compressibility of down-hole equipment and tubing . He developed the following equation to account for this discrepancy, proposing that CW be replaced with
dVu,IVW Cobs= dp , (16)
where Cob s =compressibility in the shut-in well (LT2/M) ;
VW =volume of water in the pressurized zone (L3); dVW =volume of water added under pressure (L 3 ); and dp =increase in pressure because of added water
(M/LT2) . Cobs can be determined by conducting the test below the water level in a cased section of the well .
Analysis of a modified slug test for alpha less than 0 .1 is similar to that of a standard slug test . The data are plotted as H/Ho as a function of time . The plot is matched with the same type curves as in Cooper and others (1967, p. 267) and discussed in Bredehoeft and Papadopulos (1980, p . 236) . The alpha value from the type curve and beta from the selected match point are then used in equations 14 and 15 to calculate the transmissivity and storage coefficient .
When alpha is greater than 0.1, the modified slug test has the same limitations as the standard slug test . Brede-hoeft and Papadopulos (1980, p. 236) present a method for calculating the product of alpha and beta, and the product of the transmissivity and storage coefficient ; but caution is urged in the calculation of the separate values .
The pneumatic straddle-packer assembly was designed to allow constant-head-injection, standard slug, and modified slug testing of 9-ft-long intervals in small diameter coreholes. During this study, several transmissivity values were derived from standard slug tests, and several values were derived from modified slug tests . These results are given in table 3 (at end of report). Because constant-head injection tests can be conducted rapidly in either
1 2 Hydraulic Characteristics of, and Ground-Water Flow in, Coal-Bearing Rocks of Southwestern Virginia
�
saturated or unsaturated intervals, and because the focus for this study was toward water availability, the constant-head injection test was the predominant method used . The results of the constant-head injection method constituted a larger and more uniformly derived set of values than the other results . Thus, subsequent analyses from the constant-head results are presented in the remainder of this report .
HYDRAULIC CHARACTERISTICS OF AQUIFERS
Geophysical logging, hydraulic testing, and examination of core samples indicate that permeability in the clastic rocks is predominantly secondary-the result of fracturing and bedding-plane separations . Well-cemented sandstone is common in the area, and the presence of iron-stained fractures in the sandstone and along some bedding planes in the siltstone indicates the importance of secondary permeability to the movement of ground water. Cleats, bedding-plane separations, and fractures are visible in most roadcuts and highwalls throughout the area . The pervasiveness and number of cleats, bedding-plane separa-tions, and fractures observed are variable and may account for transmissivity differences of three or four orders of magnitude in coal seams of approximately equal thickness and at approximately equal depth . Coal-seam thickness ranged from less than 1 ft to a maximum of 5 .5 ft.
Transmissivity
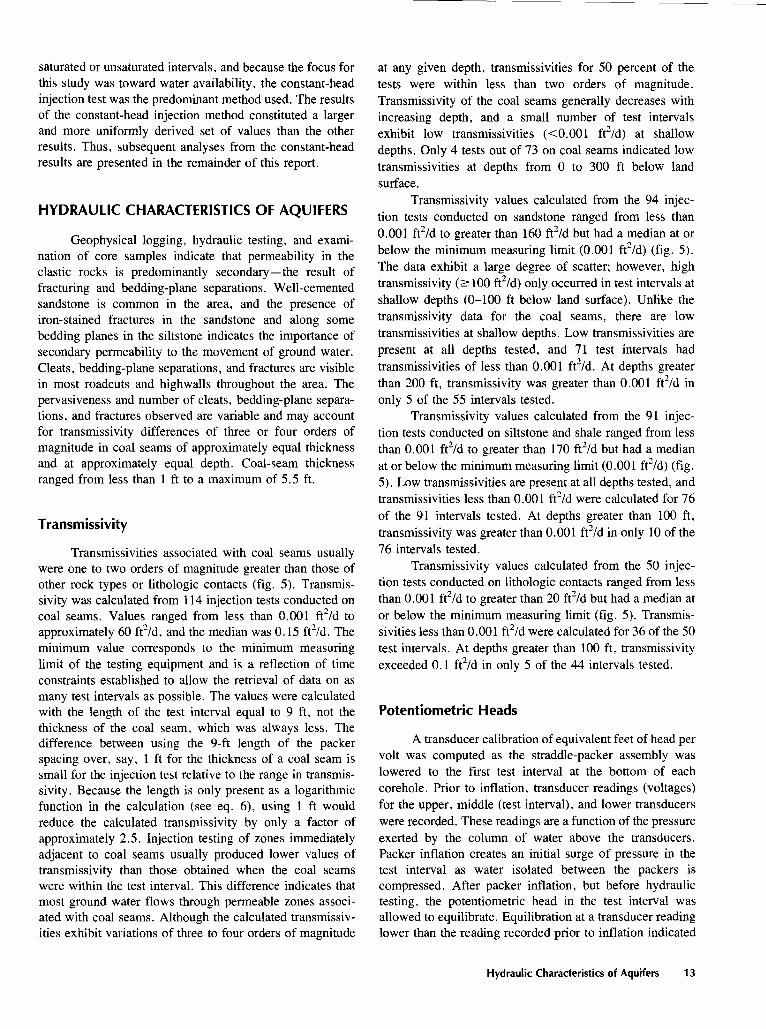
Transmissivities associated with coal seams usually were one to two orders of magnitude greater than those of other rock types or lithologic contacts (fig . 5) . Transmis sivity was calculated from 114 injection tests conducted on coal seams. Values ranged from less than 0.001 ft2/d to approximately 60 ft2/d, and the median was 0.15 ft`/d . The minimum value corresponds to the minimum measuring limit of the testing equipment and is a reflection of time constraints established to allow the retrieval of data on as many test intervals as possible . The values were calculated with the length of the test interval equal to 9 ft, not the thickness of the coal seam, which was always less . The difference between using the 9-ft length of the packer spacing over, say, 1 ft for the thickness of a coal seam is small for the injection test relative to the range in transmissivity . Because the length is only present as a logarithmic function in the calculation (see eq . 6), using 1 ft would reduce the calculated transmissivity by only a factor of approximately 2 .5 . Injection testing of zones immediately adjacent to coal seams usually produced lower values of transmissivity than those obtained when the coal seams were within the test interval . This difference indicates that most ground water flows through permeable zones associated with coal seams. Although the calculated transmissivities exhibit variations of three to four orders of magnitude
at any given depth, transmissivities for 50 percent of the tests were within less than two orders of magnitude. Transmissivity of the coal seams generally decreases with increasing depth, and a small number of test intervals exhibit low transmissivities (<0.001 ft 2/d) at shallow depths . Only 4 tests out of 73 on coal seams indicated low transmissivities at depths from 0 to 300 ft below land surface.
Transmissivity values calculated from the 94 injection tests conducted on sandstone ranged from less than 0 .001 ft2/d to greater than 160 ft'/d but had a median at or below the minimum measuring limit (0.001 ft2/d) (fig . 5) . The data exhibit a large degree of scatter; however, high transmissivity (? 100 ft2/d) only occurred in test intervals at shallow depths (0-100 ft below land surface) . Unlike the transmissivity data for the coal seams, there are low transmissivities at shallow depths . Low transmissivities are present at all depths tested, and 71 test intervals had transmissivities of less than 0.001 ft2/d . At depths greater than 200 ft, transmissivity was greater than 0.001 ft2/d in only 5 of the 55 intervals tested .
Transmissivity values calculated from the 91 injection tests conducted on siltstone and shale ranged from less than 0.001 ft 2/d to greater than 170 ft`/d but had a median at or below the minimum measuring limit (0.001 ft2/d) (fig . 5) . Lowtransmissivities are present at all depths tested, and transmissivities less than 0.001 ft2/d were calculated for 76 of the 91 intervals tested . At depths greater than 100 ft, transmissivity was greater than 0.001 ft2/d in only 10 of the 76 intervals tested .
Transmissivity values calculated from the 50 injection tests conducted on lithologic contacts ranged from less than 0 .001 ft2/d to greater than 20 ft2/d but had a median at or below the minimum measuring limit (fig . 5) . Transmis-sivities less than 0.001 ft2/d were calculated for 36 of the 50 test intervals. At depths greater than 100 ft, transmissivity exceeded 0.1 ft2/d in only 5 of the 44 intervals tested .
Potentiometric Heads
A transducer calibration of equivalent feet of head per volt was computed as the straddle-packer assembly was lowered to the first test interval at the bottom of each corehole . Prior to inflation, transducer readings (voltages) for the upper, middle (test interval), and lower transducers were recorded . These readings are a function of the pressure exerted by the column of water above the transducers . Packer inflation creates an initial surge of pressure in the test interval as water isolated between the packers is compressed . After packer inflation, but before hydraulic testing, the potentiometric head in the test interval was allowed to equilibrate . Equilibration at a transducer reading lower than the reading recorded prior to inflation indicated
Hydraulic Characteristics of Aquifers 13
�������������������
1,000 114
NUMBER OF 94
INJECTION 91
TESTS 50
1,000 114
NUMBER OF INJECTION TESTS 13 34 26 41
1,000 94
NUMBER 113
OF INJECTION 21
TESTS 17 38
" " a too
w0 10
i " " i
ALLTESTS
i
'¢ w
100 i t " " " SANDSTONES
10 "
d d re " "
" " " Z 01
U.1 " "
0.01 " " i" 0 .01
a 0.001
z
0-001
0.0001 GOP~SEPMS SPNOS'(ONES ~SjONE SNP ES
GONZ PGS 0 .0001
P~~TESZS o',ooFEEt FEES FEE'( FEO'(
ROCK TYPES DEPTH, BELOW LAND SURFACE DEPTH, BELOW LAND SURFACE
91 NUMBER OF INJECTION TESTS
15 27 13 36 50
NUMBER OF INJECTION TESTS 6 19 11 14 EXPLANATION
PERCENTILE-Percentage of analysesequal to or less than indicated value
" Outliers
90th
75th
50th
25th
10th
MEASURING LIMIT-Minimum measurement obtainable with analyticalmethod and equipment used
30oFF,E'(
DEPTH, BELOW LAND SURFACE DEPTH, BELOW LAND SURFACE Figure 5 . Transmissivity of test intervals for different rock types at various depth ranges below land surface in coal-exploration coreholes .

�
that the potentiometric head for the test interval was lower than the pressure head exerted by the column of water in the open corehole . Equilibration at a transducer reading higher than the reading recorded prior to inflation indicated that the potentiometric head for the test interval was higher than the pressure head exerted by the column of water in the open corehole . The transducer reading prior to inflation was subtracted from the equilibrated reading after inflation, and this value was multiplied by the transducer calibration . The resulting value (with sign) was added to the altitude of the water level in the corehole to derive the potentiometric head of the test interval . Values for all the test intervals in a corehole provided a vertical profile of potentiometric heads that was referenced to the composite water level in the open corehole .
Potentiometric-head measurements were generally obtained for only permeable test intervals . In tight test intervals the transducer readings indicated the inflation surge and usually stayed high . Because of time constraints and the goal of acquiring data on as many test intervals as possible, the packers were deflated after a few minutes and moved to a new test interval . Thus, some permeable test intervals with high potentiometric heads may have been overlooked ; however, most of these test intervals probably were tight .
A total of 52 coal-exploration coreholes were visited during this investigation . Hydraulic testing was conducted in 43 coreholes, and potentiometric-head measurements were made in 34 . Representative plots of potentiometric head as a function of depth of the tested intervals for coreholes located on hilltops, on hillslopes, and in valleys are shown in figures 6, 7, and 8, respectively . The water level in each corehole is indicated along with the predominant lithology present in each interval tested in the core-hole . The diagonal line in each graph represents the line of zero pressure head . All points that plot to the right of this line represent artesian test intervals, and all points that plot on this line represent test intervals with heads that are equal to their altitude .
Corehole water levels do not necessarily correspond to water tables . In an open corehole, a water level is a composite water level that represents the combined effect of the heads in each water-bearing interval intersected by the corehole . In coreholes where the potentiometric gradients are downward, the water table should be higher than the corehole water level; thus, water will drain into the core-hole-cascading or dripping . In addition, if transmissivity is low, the water table could be nearly drained, and water leaking in could run down the corehole wall and not be audible . Cascading water was heard in coreholes 15 and 16, both of which were located on hillslopes .
The potentiometric heads of test intervals in hilltop coreholes generally were less than the corehole water levels (fig . 6) . The depth to water for the eight coreholes on hilltops ranged from 100 to 376 ft below land surface,
having a mean depth of 221 ft . In addition, two coreholes of 150- and 200-ft depth were dry . Potentiometric heads only were measured for a few test intervals in most hilltop coreholes because a large percentage of corehole depths were through unsaturated rock . The heads that were measured indicate a decrease in potentiometric head with increasing depth . A downward gradient also was indicated by the potentiometric-head data for coal seams in corehole 13 ; however, this hole was different from the other hilltop holes in that many of the test intervals indicate water-table conditions . The potentiometric heads of these coal seams coupled with the presence of lower transmissivity intervals between them indicate that some of the coal seams could be partially saturated, confined, or semiconfined and that water is probably perched in these coal seams. The steep hydraulic gradient probably indicates a partially unsaturated drain horizon at depth.
The potentiometric heads of test intervals in hillslope coreholes generally were less than the corehole water levels (fig . 7) . The depth to water for the 30 coreholes on hillslopes ranged from 1 to 447 ft below land surface, having a mean depth of 109 ft . The potentiometric gradient generally was downward . Exceptions to the downward gradient were observed in coreholes 10, 28, and 36 . Corehole 10 exhibited a split gradient-heads in a lithologic contact and a coal-seam test interval approximately 300 ft deep were higher than heads in adjacent test intervals . In addition, potentiometric head in a sandstone approximately 500 ft deep was 80-100 ft higher than heads in coal seams above and below it . Corehole 28 also exhibited a split gradient-head in a shale test interval approximately 200 ft deep was higher than that in the sandstone and coal-seam test intervals above and below it, respectively . Finally, in corehole 36, which intersected a coal seam at a depth of approximately 460 ft, head was substantially higher than those of the intervals tested above and below it . These split gradients were probably the result of a rapid drop in the corehole water level, the effects of drilling, or the effect of other nearby uncased coreholes that connected test intervals at depth with high head test intervals above. In either instance, some potentiometric heads in these test intervals probably had not equilibrated .
The potentiometric heads of test intervals in valley coreholes generally were similar to or less than the corehole water levels (fig . 8) . The depth to water for the seven coreholes in valleys ranged from 10 to 76 ft below land surface with a mean depth of 39 ft . The potentiometric gradient generally was downward, but several test intervals at shallow depths usually exhibited equivalent heads that were often equal to the water level in the corehole .
GROUND-WATER FLOW
A conceptual ground-water-flow model of the coal fields of southwestern Virginia is presented in figure 9 .
Ground-Water Flow 1 5
��������
COREHOLE 13 COREHOLE 39 COREHOLE 48 0 0 0
a a Uw 100 100
NO Z ZQ Q
200 200 Q 200
0 0 0 m m
300 m w w 300 w 300 z z z a 400 400 w
z 500 500
w w
0 0x 600 600 600 0 O w
O
700 700 700 1,605 1,705 1,805 1,905 2,005 2,105 2,205 2,305 1,360 1,460 1,560 1,660 1,760 1,860 1,960 2,060 1,300 1,400 1,500 1,600 1,700 1,800 1,900 2,000
POTENTIOMETRIC HEAD, IN FEET ABOVE SEA LEVEL POTENTIOMETRIC HEAD, IN FEET ABOVE SEA LEVEL POTENTIOMETRIC HEAD, IN FEET ABOVE SEA LEVEL
COREHOLE 50 COREHOLE 51
w a EXPLANATION
----Corehole water-level altitude z a ---Line of zero pressure head
0 Potentiometric head measured in : m " Coal
o Sandstone z
mw
HNwH wO
W0
1,140 1,240 1,340 1,440 1,540 1,640 1,740 1,840 1,200 1,300 1,400 1,500 1,600 1,700 1,800 1,900
POTENTIOMETRIC HEAD, IN FEET ABOVE SEA LEVEL POTENTIOMETRIC HEAD, IN FEETABOVE SEA LEVEL
Figure 6. Potentionnetric head as a function of depth below land surface for test intervals in hilltop coreholes 13, 39, 48, 50, and 51 .

�
COREHOLE 10 COREHOLE 28 COREHOLE 36 0 - I 00
wU a a i N
/100 100 100
N N 0Z Z I Z
l 0 200J 200 0200
Q
0 0 I
m m w 300w 300 IG w 300 / I-I
z / z z
/ 400 /a 400 400 m
w w w Z zz
500 500 ti 500 w w w
0 0 /x 600 J 600 J 600
I 0 00 I I I I I II I I I I I I 700 /~ I I I I I V/
700 700
1,809 1,909 2,009 2,109 2,209 2,309 2,409 2,509 1,200 1,300 1,400 1,500 1,600 1,700 1,800 1,900 1,260 1,360 1,460 1,560 1,660 1,760 1,860 1,960
POTENTIOMETRIC HEAD, IN FEETABOVE SEA LEVEL POTENTIOMETRIC HEAD, IN FEET ABOVE SEA LEVEL POTENTIOMETRIC HEAD, IN FEET ABOVE SEA LEVEL
COREHOLE 42 COREHOLE 44
0 I 0 EXPLANATION
w /U a -----Corehole water-level altitude
100 100
0 I O --- Line of zero pressure head zz g Potentiometric head measured in :J 200 200
0 i " Coal
ww Im Siltstone w 300 w 300
o SandstoneZ
I J 400 > 400 O Shale
I m w G Lithologic contact(s)w
zz F- 500 I 500
Iw I
0 a x 600 - / I r 600 a 0 I 0
I
700 f I t I I I I 700 V I I I I I I I
1,220 1,320 1,420 1,520 1,620 1,720 1,820 1,920 1,720 1,820 1,920 2,020 2,120 2,220 2,320 2,420
POTENTIOMETRIC HEAD, IN FEET ABOVE SEALEVEL POTENTIOMETRIC HEAD, IN FEET ABOVE SEA LEVEL
Figure 7. Potentiometric head as a function of depth below land surface for test intervals in hillslope coreholes 10, 28, 36, 42, and 44 .
���������������������������
COREHOLE 17 COREHOLE 23 COREHOLE 27 0 0
UW W
U LLaCC LL
100 a
100 N
Z Z Z g 200 g 200 200
0 O 0
m m m w 300 300 w 300W w WwZ Z I Z
J 400> 400 400 a W Z Z
500 500 500 W
0
a 600 600 - / 600 jII0 0
I 0
700 700 V/ I I I I I I I 700 I I I I I I I
1,350 1,450 1,550 1,650 1,750 1,850 1,950 2,050 1,920 2,020 2,120 2,220 2,320 2,420 2,520 2,620 2,000 2,100 2,200 2,300 2,400 2,500 2,600 2,700
POTENTIOMETRIC HEAD, IN FEETABOVE SEA LEVEL POTENTIOMETRIC HEAD, IN FEETABOVE SEA LEVEL POTENTIOMETRIC HEAD, IN FEET ABOVE SEA LEVEL
COREHOLE40 COREHOLE45 0 0
EXPLANATIONW W U U
---- Corehole water-level altitude s 100 CC 100
---Line of zero pressure head ca 0 Z Za Potentiometric head measured in :
0200
0 200
o CoalJ WG7 Cn Siltstone w 300
o Sandstonez J
400 400 G Lithologic contact(s) I
W z z
500 ti
500 r I w
wO O
I a 600 600
O O I i
1 I t700 700 -A
1,100 1,200 1,300 1,400 1,500 1,600 1,700 1,800 1,200 1,300 1,400 1,500 1,600 1,700 1,800 1,900
POTENTIOMETRIC HEAD, IN FEETABOVE SEA LEVEL POTENTIOMETRIC HEAD, IN FEET ABOVE SEA LEVEL
Figure 8 . Potentiometric head as a function of depth below land surface for test intervals in valley coreholes 17, 23, 27, 40, and 45 .

�
Notto scale
EXPLANATION
Colluvium and alluviumEl Weathered bedrock
Unweathered bedrockEl Coal seam
Fractures
General ground-water
Enlargement flow direction
Possible ground-water flow paths
Figure 9. Conceptualized ground-water-flow system in the coal fields of southwestern Virginia .
Ground water generally flows through fractures, cleats, and of Wyrick and Borchers (1981, fig . 5 .1 .5-2) and Trainer
bedding-plane partings . Permeability of coal seams is gen- (1983, p. 112) . However, even at shallow depths, fracture
erally larger than that of other rock types or lithologic intensity is areally diverse as indicated by the low transmis
contacts . Fracturing is more intense in the shallow part of sivity intervals at shallow depths in some coreholes. This
the system than in deeper parts, which supports the findings areal diversity in fracturing could be a reflection of struc-
Ground-Water Flow 1 9

tural features or other local conditions . The transmissivity of all rock types generally decreases with depth (fig . 5) as fracture size and number decrease . The transmissivities generally are similar for coal seams, sandstone, and lithologic contacts at depths less than 100 ft . However, siltstone and shale generally have the lowest transmissivities . Because of the high topographic relief in the area, ground-water-flow systems are limited in areal extent . Ground water beneath ridges and hills probably discharges to local springs and streams or flows downgradient as underflow in valleys .
The water level in the uncased coreholes (which may or may not be the water table) is influenced by topography . The average depth to water beneath hilltops was 221 ft ; beneath hillslopes, 109 ft ; and beneath valleys, 39 ft . Regardless of whether these water levels equate to the water table, the water-table aquifer generally is thin because of the interbedding of low-permeability and high-permeability rocks . Although a thick interval of strata at shallow depths can be saturated and have zones with similar heads, the interval does not necessarily represent one water-table aquifer. In many instances, the zones of high permeability that exhibit equal heads are separated by zones of much lower permeability . Thus, such a zone is a thin water-table aquifer, underlain by semiconfined and confined water-bearing zones.
Potentiometric-head measurements provide clues to the general ground-water-flow system in the area . A vertical profile of head measurements for a corehole situated on a hilltop usually indicated a sharp downward gradient (see fig . 6, corehole 39) . A downward gradient is also observed in hillslope wells, although shallow zones commonly exhibited intervals of equal head (as previously discussed; see fig . 7, corehole 28) . Finally, valley wells in the area usually exhibited shallow intervals of equal head below which head measurements indicated a downward gradient (see fig. 8, corehole 23) . These head relations indicate that the high-relief areas function as recharge areas ; water infiltrates the surface, percolates into the regolith, and flows downward and laterally through fractures in the shallow bedrock . Hydraulic conductivity decreases with increasing depth, and ground water flows primarily in the lateral direction along fractures or through coal seams. If vertical hydraulic conductivity is negligible, ground water continues to flow laterally, discharging as springs or seeps on hillslopes . Valleys function as discharge areas for the flow system, although upward gradients were usually not observed in wells located in this topographic setting . However, the few wells tested that indicated an upward gradient were adjacent to streams, possibly indicating that upward gradients are associated with the streams and will probably only be detected in close proximity to them . In general, water probably follows a stairstep flow path (Kipp and others, 1983), discharging to streams and (or) flowing downward into coal seams and old mine workings .
Permeable coal seams probably underlie valleys in the region ; however, aquifer-test data indicate that the horizontal hydraulic conductivity of coal is a function of depth and probably decreases under ridges because of increased overburden pressures. Wahler and Associates (1979), in their studies of mine-dewatering problems, concluded that with increasing depth, soft rocks, such as shale, may seal deep fractures . Topographic relief in the area creates high heads for the ground-water-flow system . However, transmissivity data from the range of depths tested indicate that ground water primarily flows at moderate depths (<300 ft, see fig. 5), and deep regional groundwater flow is probably minimal. Trainer (1983, p . 112) stated that the depth and intensity of fracturing, lithology, and topographic relief influence the depth of active circulation of fresh ground water in horizontally bedded sedimentary rocks . He also concluded that, in this type of setting, ground-water circulation is typically restricted to modest depths .
SUMMARY AND CONCLUSIONS
Borehole geophysical logging, water-quality sampling, and hydraulic testing with a pneumatic straddle-packer assembly were used in coal-exploration coreholes to evaluate the aquifers in the coal fields of southwestern Virginia . Potentiometric-head relations in the coreholes were more complex than originally thought. Flow between test intervals in the coreholes made collection of samples representative of water quality in the tested intervals unfeasible . In addition, time constraints established to allow the retrieval of data on as many test intervals as possible made constant-head injection testing the predominant method of analysis used . Standard and modified slug-test methods are applicable to ground-water studies in terranes similar to the study area, particularly when resolution is needed for low values of transmissivity and (or) hydraulic conductivity . For such studies, the modified slug test, which is designed for tight formations, is a valid aquifer-test method .
Results from straddle-packer testing of 9-ft-long intervals in the predominantly clastic rocks of the coal fields indicate that transmissivity decreases with depth. Transmis sivity values calculated from constant-head injection testing ranged from less than 0.001 to 60 ft`/d in coal seams, from less than 0.001 to greater than 160 ft2/d in sandstone, from less than 0.001 to greater than 170 ft 2/d in siltstone and shale, and from less than 0.001 to greater than 20 ft`/d at lithologic contacts . Coal seams had a median transmissivity of 0 .15 ft2/d, whereas other rock types and lithologic contacts had median transmissivities less than or equal to 0.001 ft 2/d . All rock types tested usually were permeable to a depth of approximately 100 ft ; however, at depths greater than 200 ft only coal seams consistently had measurable permeability (transmissivity greater than 0 .001 ft'`/d) . Injec
20 Hydraulic Characteristics of, and Ground-Water Flow in, Coal-Bearing Rocks of Southwestern Virginia
�
tion testing of intervals immediately adjacent to coal seams usually indicated lower transmissivity than that obtained when the coal seams were isolated within the test interval, indicating that most lateral ground-water flow is associated with the coal seams. Potentiometric-head measurements for these coal seams coupled with the presence of low-transmissivity intervals between the seams indicate that some of the coal seams could be partly saturated, confined, or semiconfined and, in some instances, that water could be perched above these coal seams .
The mean depth to standing water below land surface was 221 ft in coreholes located on hilltops, 109 ft in coreholes located on hillslopes, and 39 ft in coreholes located in valleys. Potentiometric-head measurements indicate downward flow on hilltops, lateral and downward flow on hillslopes, and upward, lateral, and downward flow in valleys . Because of the high topographic relief (600-1,000 ft) in the area, ground-water-flow systems are of small areal extent . Head relations indicate that high topographic areas function as recharge areas; water infiltrates through the surface, percolates into the regolith, and moves downward and laterally through the fractures in the shallow bedrock. Permeability decreases with increasing depth, and most water may move laterally along fractures or bedding planes or through coal seams until encountering more permeable rock through which to move downward . If more permeable rocks are not encountered, water continues to move later-ally, discharging as a spring or seep on the hillslope. Where vertical permeability is appreciable, water follows a stairstep path through the regolith, fractures and bedding planes, and coal seams, discharging to streams and (or) recharging permeable coal seams at depth. Although permeable coal seams may underlie valleys in the region, data from this study indicate that the permeability of coal is a function of depth and may decrease under adjacent hills because of increased overburden pressures. Therefore, ground water beneath valleys that does not discharge to streams probably flows downgradient as underflow beneath the streams .
REFERENCES CITED
Bates, R.L ., and Jackson, J.A ., eds., 1987, Glossary of geology (3d ed .) : Falls Church, Va., American Geological Institute, 788 p.
Bredehoeft, J.D ., and Papadopulos, S.S ., 1980, A method for determining the hydraulic properties of tight formations: Water Resources Research, v. 16, no . 1, p. 233-238 .
Campbell, M.R ., 1893, Geology of the Big Stone Gap coal field of Virginia and Kentucky : U.S . Geological Survey Bulletin 111, 106 p.
1894, Description of the Estillville quadrangle [Kentucky-Virginia-Tennessee] : U.S . Geological Survey Geologic Atlas, Folio 12, 7 p.
1896, Description of the Pocahontas quadrangle [Virginia-West Virginia] : U.S . Geological Survey Geologic Atlas, Folio 26, 7 p.
Cooper, H.H., Bredehoeft, J.D ., and Papadopulos, I.S ., 1967, Response of a finite-diameter well to an instantaneous charge of water: Water Resources Research, v. 3, no . 1, p. 263-269.
Diffenbach, R.N ., 1988, Geology of the Virginia portion of the Clintwood and Jenkins East quadrangles : Virginia Division of Mineral Resources, Publication 86, scale 1:24,000 .
Englund, K.J ., 1979, The Mississippian and Pennsylvanian (Car-boniferous) systems in the United States-Virginia : U .S . Geological Survey Professional Paper 1110-C, p. C1-C21 .
Ferguson, H.F ., 1967, Valley stress relief in the Allegheny Plateau : Association of Engineering Geologists Bulletin, v . 4, p . 63-68 .
Ferris, J.G ., and Knowles, D.B ., 1954, The slug test for estimat-ing transmissibility : U.S . Geological Survey Ground Water Note 26, p. 1-7.
Fontaine, W.M., 1874, The "great conglomerate" on New River, West Virginia : American Journal of Science (3d ed .), v. 7, p. 459-465,573-579.
Heath, R.C ., 1983, Basic ground-water hydrology: U.S . Geolog-ical Survey Water-Supply Paper 2220, 84 p.
Hessley, R.K ., Reasoner, J.W., and Riley, J.T ., 1986, Coal science: New York, Wiley, 269 p.
Hvorslev, M.J ., 1951, Time lag and soil permeability in ground water observations : U.S . Army Corps of Engineers, Waterways Experiment Station, Bulletin 36, 50 p.
Jacob, C .E ., and Lohman, S .W., 1952, Nonsteady flow to a well of constant drawdown in an extensive aquifer: American Geophysical Union Transactions, v . 33, no . 4, p. 559-569.
Jillson, W.R ., 1919, The Kendrick shale ; a new calcareous fossil horizon in the coal measures of eastern Kentucky : Kentucky Department of Geology and Forestry, ser . 5, v . 1, no. 2, p. 96-104 .
Keys, W.S ., 1988, Borehole geophysics applied to ground-water investigations : U.S . Geological Survey Open-File Report 87-539, 305 p.
Kipp, J.A ., Lawrence, F.W., and Dinger, J.S ., 1983, A concep-tual model of ground-water flow in the eastern Kentucky coal field : 1983 Symposium on Surface Mining, Hydrology, Sedimentology, and Reclamation, University of Kentucky, Lexington, Kentucky [Proceedings], p. 543-549.
Larson, J.D ., and Powell, J.D ., 1986, Hydrology and effects of mining in the upper Russell Fork Basin, Buchanan and Dickenson Counties, Virginia : U.S . Geological Survey Water-Resources Investigations Report 85-4238, 63 p.
Lohman, S.W., 1979, Ground-water hydraulics : U.S . Geological Survey Professional Paper 708, 70 p.
McLoughlin, T.F ., 1986, Explanation of the regional tectonic map of the southwestern coal field of Virginia : U.S . Department of Labor, Mine Safety and Health Administration, Informational Report IR 1177, 17 p.
Miller, M.S ., 1974, Stratigraphy and coal beds of upper Missis-sippian and lower Pennsylvanian rocks in southwest Virginia : Virginia Division of Mineral Resources, Bulletin 84, 211 p.
Morse, W.C ., 1931, Pennsylvanian invertebrate fauna: Kentucky Geological Survey, ser. 6, v. 36, p. 293-348 .
National Oceanic and Atmospheric Administration (NOAA), 1986, Climatological data annual summary-Virginia: National Climatic Data Center, Asheville, North Carolina, v. 96, no . 13, 27 p.
References Cited 2 1
Neuzil, C.E ., 1982, On conducting the modified "slug" test in tight formations : Water Resources Research, v. 18, no . 2, p. 439-441.
Nolde, J.E ., and Mitchell, M.L ., 1984, Geology of the Prater and Vansant quadrangles, Virginia: Virginia Division of Mineral Resources, Publication 52, 28 p.
Papadopulos, S.S ., Bredehoeft, J .D ., and Cooper, H.H., Jr ., 1973, On the analysis of "slug test" data : Water Resources Research, v. 9, no . 4, p. 1087-1089.
Schubert, J.P ., 1980, Fracture flow of groundwater in coal-bearing strata-1980 Symposium on Surface Mining Hydrol-ogy, University ofKentucky, Lexington, Kentucky [Proceedings], p. 61-73.
Steam, C.W., Carroll, R.L ., and Clark, T.H ., 1979, Geological evolution of North America: New York, Wiley, 566 p.
Trainer, F.W., 1983, Some perspectives on near-surface fractured-rock aquifers-Proceedings of the 14th Biannual Conference on Ground Water, Sacramento, Calif., Septem
ber 19-20, 1983 ; California Water Research Center, University of California-Davis . Report no . 56, p. 104-122.
U.S . Department of Commerce, 1980, Bureau of the Census, 1980 census of population and housing: PHC80-U-48, Virginia, 17 p.
Wahler, W.A., and Associates, 1979, Dewatering active under-ground coal mines-Technical aspects and cost-effec-tiveness : Cincinnati, Office of Research and Development, Industrial Environmental Research Laboratory, U.S . Envi-ronmental Protection Agency, EPA-600/7-79-124, 124 p.
Wright, W.G ., 1985, Effects of fracturing on well yields in the coalfield areas of Wise and Dickenson Counties, southwestern Virginia: U.S . Geological Survey Water-Resources Investigations Report 85-4061, 21 p .
Wyrick, G.G ., and Borchers, J.W., 1981, Hydrologic effects of stress-relief fracturing in an Appalachian Valley : U.S . Geological Survey Water-Supply Paper 2177, 51 p.
22 Hydraulic Characteristics of, and Ground-Water Flow in, Coal-Bearing Rocks of Southwestern Virginia

TABLE 3
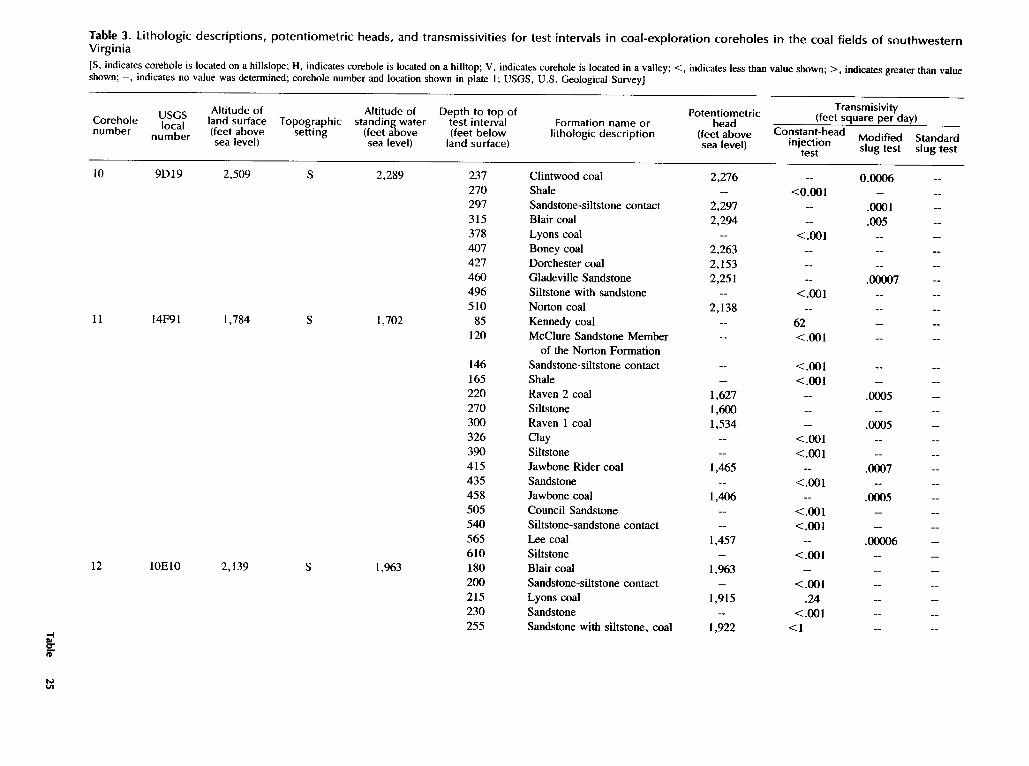
---- --
----
-- ---- ---- ----
-- ---- --
-- ----
-- ---- --
---- ----
-- ---- --
---- --
---- ---- --
---- --
-- ---- --
---- --
--
Table 3. Lithologic descriptions, potentiometric heads, and transmissivities for test intervals in coal-exploration coreholes in the coal fields of southwesternVirginia [S, indicates corehole is located on a hillslope ; H, indicates corehole is located on a hilltop; V, indicates corehole is located in a valley ; <, indicates less than value shown; >, indicates greater than valueshown; --, indicates no value was determined; corehole number and location shown in plate 1 ; USGS, U.S . Geological Survey]
Corehole number
USGS local
number
Altitude of land surface (feet above sea level)
Topographicsetting
Altitude of standing water
(feet above sea level)
Depth to top of test interval (feet below land surface)
Formation name or lithologic description
Potentiometric head
(feet above sea level) Standard
slug test
(feetTransmisivity square per day)
Constant-head injection Modified
test slug test
10 91319 2,509 S 2,289 237 Clintwood coal 2,276 0,0006 270 Shale <0.001 297 Sandstone-siltstone contact 2,297 .0001 315 Blair coal 2,294 .005 378 Lyons coal <.001 407 Boney coal 2,263 427 Dorchester coal 2,153 460 Gladeville Sandstone 2,251 .00007 496 Siltstone with sandstone <.001 510 Norton coal 2,138
11 141F91 1,784 S 1,702 85 Kennedy coal 62 120 McClure Sandstone Member <.001
of the Norton Formation 146 Sandstone-siltstone contact < .001 165 Shale < .001 220 Raven 2 coal 1,627 .0005 270 Siltstone 1,600 300 Raven 1 coal 1,534 .0005 326 Clay <.001 390 Siltstone < .001 415 Jawbone Rider coal 1,465 .0007 435 Sandstone <.001 458 Jawbone coal 1,406 .0005 505 Council Sandstone <.001 540 Siltstone-sandstone contact <.001 565 Lee coal 1,457 .00006 610 Siltstone <.001
12 10E10 2,139 S 1,963 180 Blaircoal 1,963 200 Sandstone-siltstone contact <.001 215 Lyons coal 1,915 .24 230 Sandstone < .001 255 Sandstone with siltstone, coal 1,922 <1
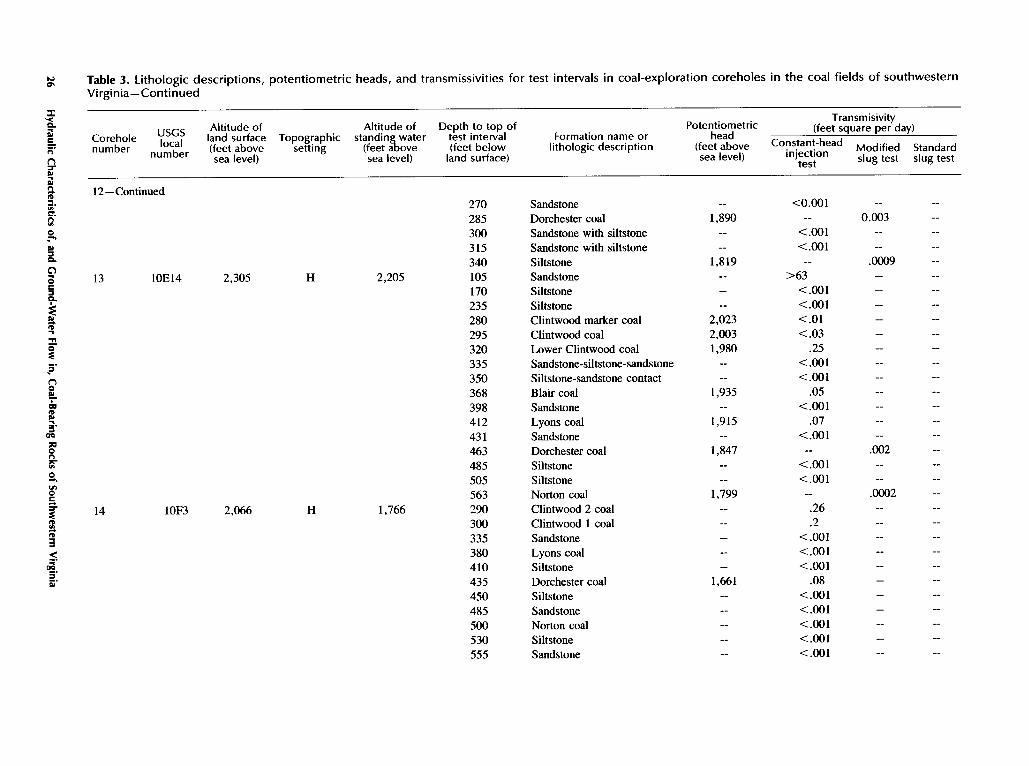
�����������������������������������������������������������������������������������
Table 3. Lithologic descriptions, potentiometric heads, and transmissivities for test intervals in coal-exploration coreholes in the coal fields of southwestern Virginia-Continued
x Transmisivityn Altitude of Altitude of Depth to top of heada+ Corehole USGS land surface Topographic standin water test interval Formation name or
Potentiometric (feet square per day) localn' number number (feet above setting (feet move (feet below lithologic description (feet above Constant-head modified Standard
n sea level) sea level) land surface) sea level) injection slug test slug test z test a a
12-Continued y. 270 Sandstone -- <0.001 -H 285 Dorchester coal 1,890 -- 0.003 o , 300 Sandstone with siltstone -- <.001 -
315 Sandstone with siltstone -- <.001 --°- 340 Siltstone 1,819 -- .0009 n '0 13 10E14 2,305 H 2,205 105 Sandstone -- >63 -
170 Siltstone -- <.001 -a
235 Siltstone -- <.001 -a 280 Clintwood marker coal 2,023 <.O1 -
295 Clintwood coal 2,003 <.03 -320 Lower Clintwood coal 1,980 .25
F 335 Sandstone-siltstone-sandstone -- <.001
n 350 Siltstone-sandstone contact -- <.001 w 368 Blair coal 1,935 .05 00 398 Sandstone -- <.001 °' 412 Lyons coal 1,915 .07
431 Sandstone -- <.001 -e 463 Dorchester coal 1,847 -- .002
485 Siltstone -- <.001 -°" 505 Siltstone -- <.001 -
563 Norton coal 1,799 -- .0002
F 14 IOF3 2,066 H 1,766 290 Clintwood 2 coal -- .26 -300 Clintwood 1 coal -- .2 -335 Sandstone -- <.001 -380 Lyons coal -- <.001 -
ao 410 Siltstone -- < .001 -.a 435 Dorchester coal 1,661 .08 -
450 Siltstone -- <.001 -485 Sandstone -- <.001 -500 Norton coal -- <.001 -530 Siltstone -- <.001 -555 Sandstone -- <.001 -

--
--
--
--
--
----
--
----------------
Table 3 . Lithologic descriptions, potentiometric heads, and transmissivities for test intervals in coal-exploration coreholes in the coal fields of southwestern Virginia-Continued
Corehole number local
number
IJSGS land surface (feet above sea level)
Altitude of Topographic
setting standing water
(feet above sea level)
Altitude of test interval (feet below land surface)
Depth to top of Formation name or litholo ic descriptiong
head (feet above sea level)
Potentiometric
tandard lug test
Constant-head injection Modified
Stestslug test
Transmisivity(feet square per day)
8D6 2,354 S 2,314 45 Sandstone 2,325 7.5 s15 65 Taggart marker coal 2,319 <4.9 80 Clover Fork Sandstone Member < .001
of the Wise Formation 90 Clover Fork Sandstone Member 2,314 >96
of the Wise Formation 105 Clover Fork Sandstone Member < .001
of the Wise Formation 136 Clover Fork Sandstone Member < .005
of the Wise Formation 155 Siltstone < .001 170 Wilson coal 2,264 1 .8 185 Siltstone-sandstone-siltstone 2,264 < .003 198 Upper St . Charles coal 2,250 .9
16 1OD20 2,076 S 2,018 55 Shale >172 75 Kennedy coal 2,018 45 123 Aily coal 2,014 .15 160 Siltstone 2,016 1 .1 205 Siltstone <.006 245 Sandstone <.001 272 Raven coal 2,004 .4 300 Siltstone <.007
17 1OD21 2,050 V 2,015 70 Siltstone 2,015 6.2 92 Siltstone 2,015 <.001 103 Sandstone-shale contact 2,015 .06 117 Sandstone 2,015 10.3 148 Raven coal 2,005 .65 172 Sandstone <.001 191 Sandstone with shale <.001
21 14G 9 1,360 S 1,308 45 Siltstone, sandy .35 64 Raven coal split <.001 95 Sandstone-siltstone contact <.001 135 Siltstone <.001 157 Jawbone coal <.001 180 Council Sandstone <.001
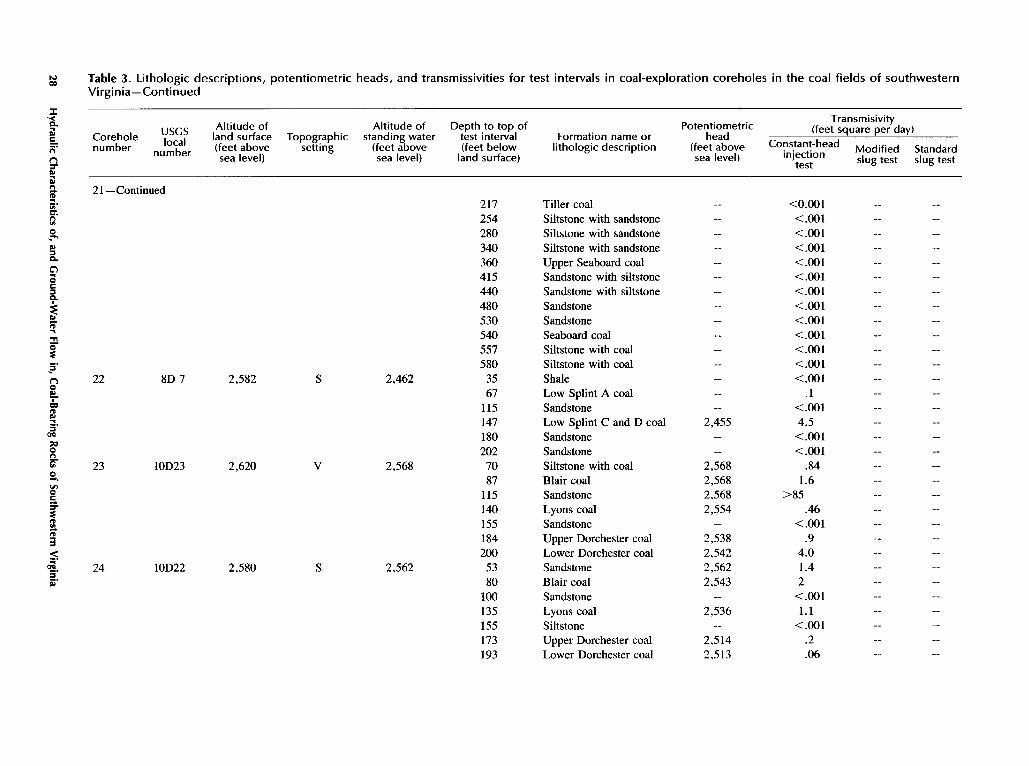
������������������������������������������������������������������������������������������������������
N Table 3. Lithologic descriptions, potentiometric heads, and transmissivities for test intervals in coal-exploration coreholes in the coal fields of southwestern Virginia-Continued
x Transmisivitya Altitude of Altitude of Depth to top of (feet square per day) c Corehole USGS land surface Topographic standing water test interval Formation name or
Potentiometric m head ;; local (feet above setting (feet above (feet below lithologic description (feet above Constant-head Modified Standard n
number number sea level) sea level) land surface) sea level) injection slug test slug testT test
21-Continued 217 Tiller coal -- <0.001 254 Siltstone with sandstone -- <.001 280 Siltstone with sandstone -- <.001 340 Siltstone with sandstone -- <.001
°' 360 Upper Seaboard coal -- <.001n 415 Sandstone with siltstone -- <.001e
a 440 Sandstone with siltstone -- <.001 480 Sandstone -- <.001
°' 530 Sandstone -- <.001 540 Seaboard coal -- <.001 557 Siltstone with coal -- <.001f
9' 580 Siltstone with coal -- <.001 n 22 8D 7 2,582 S 2,462 35 Shale -- <.001 a° 67 Low Splint A coal -- .1 °° 115 Sandstone -- <.001A °' 147 Low Splint C and D coal 2,455 4.53 °° 180 Sandstone -- <.001
202 Sandstone -- <.001 23 1OD23 2,620 V 2,568 70 Siltstone with coal 2,568 .84
87 Blair coal 2,568 1 .6 $ 115 Sandstone 2,568 >85
F 140 Lyons coal 2,554 .46 155 Sandstone -- <.001 184 Upper Dorchester coal 2,538 .9
< 200 Lower Dorchester coal 2,542 4.0 a9 " 24 1OD22 2,580 S 2,562 53 Sandstone 2,562 1 .4 a' 80 Blair coal 2,543 2
100 Sandstone -- <.001 135 Lyons coal 2,536 1 .1 155 Siltstone -- <.001 173 Upper Dorchester coal 2,514 .2 193 Lower Dorchester coal 2,513 .06
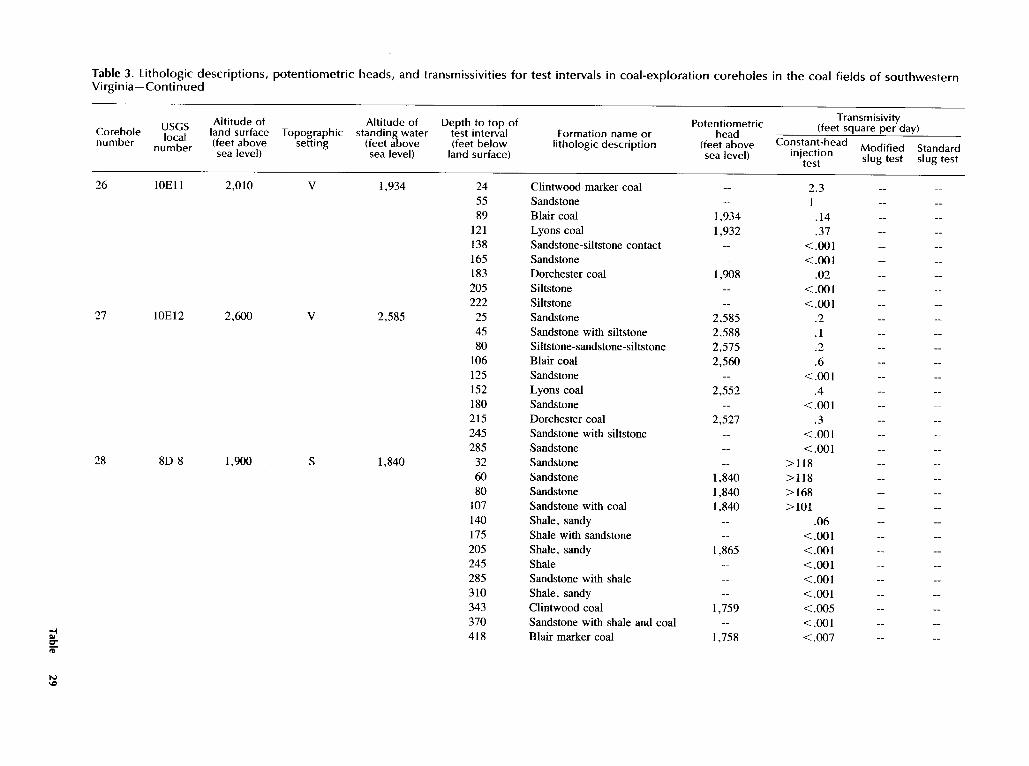
----
----
----
--
--
------
----
------
--
Table 3 . Lithologic descriptions, potentiometric heads, and transmissivities for test intervals in coal-exploration coreholes in the coal fields of southwestern Virginia-Continued
Transmisivity Corehole number
USGS local
number
Altitude ofland surface (feet above sea level)
Topographicsetting
Altitude of water
(feetstanding
above sea level)
Depth to top of test interval (feet below land surface)
Formation name orlithologic description
Potentiometric head
(feet above sea level)
Standard slug test
(feet square per day) Constant-head
injection Modified test slug test
26 10E11 2,010 V 1,934 24 Clintwood marker coal 2.3 55 Sandstone 1 89 Blair coal 1,934 .14
121 Lyons coal 1,932 .37 138 Sandstone-siltstone contact <.001 165 Sandstone <.001 183 Dorchester coal 1,908 .02 205 Siltstone <.001 222 Siltstone <.001
27 10E12 2,600 V 2,585 25 Sandstone 2,585 .2 45 Sandstone with siltstone 2,588 .1 80 Siltstone-sandstone-siltstone 2,575 .2 106 Blair coal 2,560 .6 125 Sandstone <.001 152 Lyons coal 2,552 .4 180 Sandstone <.001 215 Dorchester coal 2,527 .3 245 Sandstone with siltstone <.001 285 Sandstone <.001
28 8D 8 1,900 S 1,840 32 Sandstone >118 60 Sandstone 1,840 >118 80 Sandstone 1,840 >168 107 Sandstone with coal 1,840 >101 140 175
Shale, sandy Shale with sandstone
.06 <.001
205 Shale, sandy 1,865 <.001 245 Shale <.001 285 Sandstone with shale <.001 310 Shale, sandy <.001 343 Clintwood coal 1,759 <.005 370 Sandstone with shale and coal <.001 418 Blair marker coal 1,758 <.007
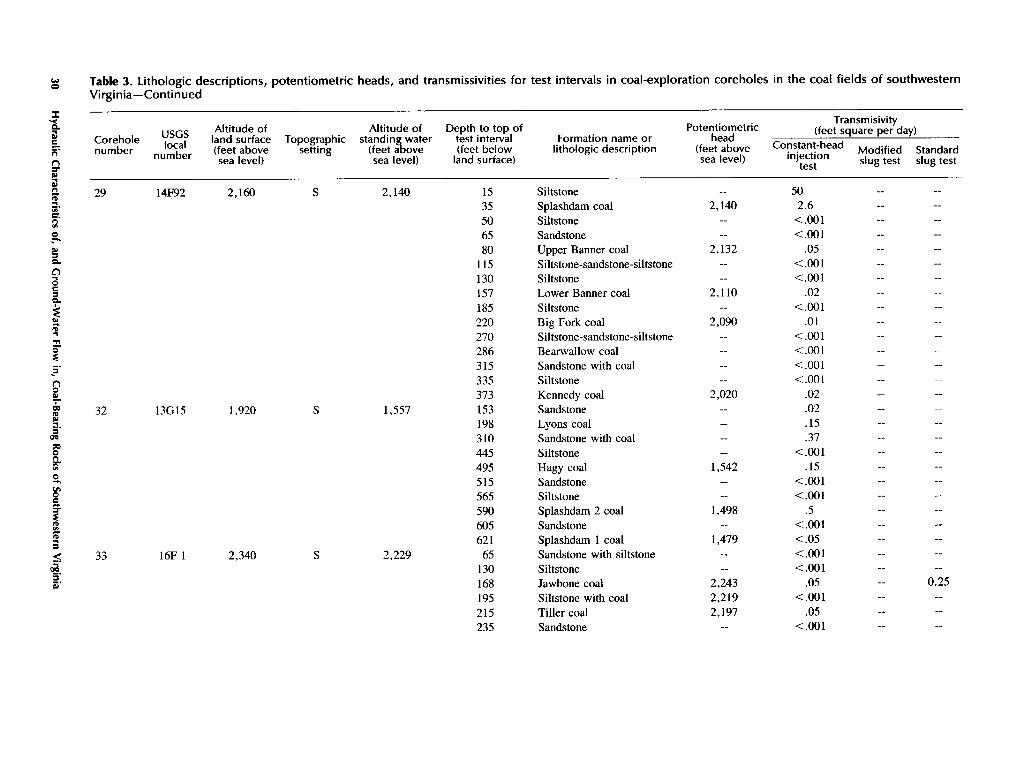
w0 Table 3 . Lithologic descriptions, potentiometric heads, and transmissivities for test intervals in coal-exploration coreholes in the coal fields of southwestern Virginia-Continued
Transmisivityc Altitude of Altitude of Depth to top of Potentiometric (feet square per day)dc Corehole USGS land surface Topographic standing water test interval Formation name or headlocal (feet above setting (feet above (feet below lithologis description (feet above Constant-head Modified Standardnumbernumber number sea level) sea level) land surface) sea level) injection slug test slug testc1 testTa a
29 14F92 2,160 S 2,140 15 Siltstone -- 50 H 35 Splashdam coal 2,140 2 .6
50 Siltstone -- < .001 65 Sandstone -- < .001 80 Upper Banner coal 2,132 .05
°- 115 Siltstone-sandstone-Siltstone -- < .001 n c 130 Siltstone -- < .001 3 157 Lower Banner coal 2,110 .02 a
185 Siltstone -- < .001 °.: 220 Big Fork coal 2,090 .01
270 Siltstone-sandstone-Siltstone -- < .001 286 Bearwallow coal -- < .001 315 Sandstone with coal -- < .001
n 335 Siltstone -- < .001 °a 373 Kennedy coal 2,020 .02 °° 32 13G15 1,920 S 1,557 153 Sandstone -- .02
198 Lyons coal -- .15 310 Sandstone with coal -- .37
c 445 Siltstone -- < .001 495 Hagy coal 1,542 .15 515 Sandstone <.001
c 565 Siltstone -- <.001 590 Splashdam 2 coal 1,498 .5F 605 Sandstone -- <.001 621 Splashdam 1 coal 1,479 <.05 -- -
< 33 16F 1 2,340 S 2,229 65 Sandstone with Siltstone -- <.001 -- --a'a 130 Siltstone -- <.001 -- -a. 168 Jawbone coal 2,243 .05 -- 0.25
195 Siltstone with coal 2,219 <.001 -- -215 Tiller coal 2,197 .05 -- -235 Sandstone -- <.001 -- -
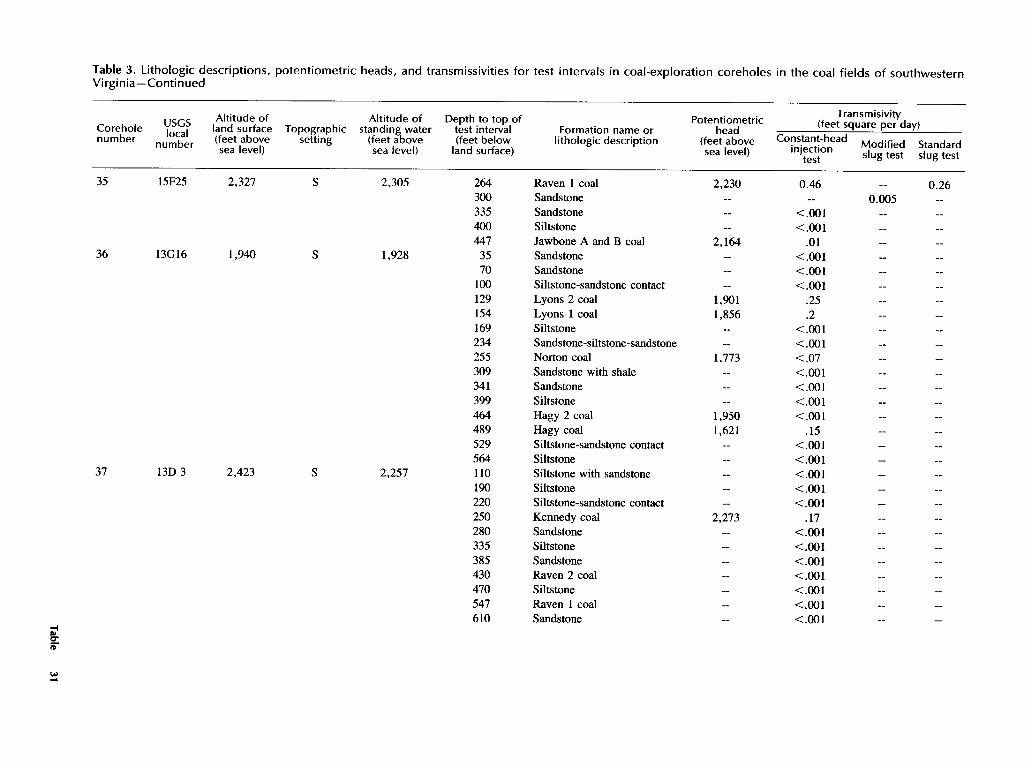
---- -- ---- -- ---- -- --
-- ---- -- ---- -- ---- -- --
-- ---- --
-- -- ---- -- --
-- ---- -- ---- -- ---- -- --
-- ---- --
-- -- ---- -- ---- -- ---- -- ---- -- --
-- ---- -- ---- -- ---- -- ---- -- ---- -- ---- -- ---- -- --
Table 3. Lithologic descriptions, potentiometric heads, and transmissivities for test intervals in coal-exploration coreholes in the coal fields of southwesternVirginia-Continued
Corehole number
USGS local
number
Altitude of land surface (feet above sea level)
Topographicsetting
Altitude of standing water (feet above sea level)
Depth to top of test interval (feet below land surface)
Formation name orlithologic description
Potentiometric head
(feet above sea level)
(feet Constant-head
injectiontest
Transmisivitysquare per day)
Modified slug test
Standard slug test
35 15F25 2,327 S 2,305 264 Raven 1 coal 2,230 0.46 0.26 300 Sandstone 0.005 335 Sandstone <.001 400 Siltstone <.001
36 13G16 1,940 S 1,928 447 35
Jawbone A and B coal Sandstone
2,164 .01 <.001
70 Sandstone <.001 100 Siltstone-sandstone contact <.001 129 Lyons 2 coal 1,901 .25 154 Lyons 1 coal 1,856 .2 169 Siltstone <.001 234 Sandstone-siltstone-sandstone <.001 255 Norton coal 1,773 <.07 309 Sandstone with shale <.001 341 Sandstone <.001 399 Siltstone <.001 464 Hagy 2 coal 1,950 <.001 489 Hagy coal 1,621 .15 529 Siltstone-sandstone contact <.001 564 Siltstone <.001
37 13D 3 2,423 S 2,257 110 Siltstone with sandstone <.001 190 Siltstone <.001 220 Siltstone-sandstone contact <.001 250 Kennedy coal 2,273 .17 280 Sandstone <.001 335 Siltstone <.001 385 Sandstone <.001 430 Raven 2 coal <.001 470 Siltstone <.001 547 Raven 1 coal <.001 610 Sandstone <.001

w Table 3. Lithologic descriptions, potentiometric heads, and transmissivities for test intervals in coal-exploration coreholes in the coal fields of southwestern N Virginia-Continued
s Transmisivitya Altitude of Altitude of Depth to top of
headCorehole USGS land surface Topographic standing water test interval Formation name or Potentiometric (feet square per day)
localnumber number (feet above setting (feet above (feet below lithologic description (feet above Constant-head Modified Standard A sea level) sea level) land surface) sea level) injection slug test slug testtestz
-- <0.00138 13D 4 2,415 S 2,326 100 Siltstone 160 Siltstone -- <.001
n 200 Sandstone-siltstone-sandstone 2,314 <.0p1 245 Kennedy coal 2,293 .22
a 280 Sandstone -- < .0013
312 Sandstone-siltstone contact -- < .001 n 330 Siltstone -- <.001 c 3 380 coal -- <.001 -- _
c 427 Raven 2 coal -- <.001 -- -460 coal -- <.001 -- -
'` 505 Siltstone-sandstone contact -- <.001 -- -530 Sandstone -- <.001 -- -F 555 Raven 1 coal -- <.001 -- -
n 600 Sandstone -- <.001 -- -
39 IOF 4 2,060 H 1,795 277 Clintwood coal 1,801 .2 -- 0.06 305 Siltstone -- <.001 330 Lyons coal -- <.001 388 Dorchester coal 1,779 <.001
0 410 Siltstone -- < .001 450 Sandstone -- < .001 -- -
°. 477 Norton coal 1,721 .42 -- .27
40 IOF 5 1,800 V 1,759 65 Sandstone -- <5.7 -- -s 100 Lyons coal 1,759 <4.7
120 Siltstone 148 Dorchester coal 1,752 .04
< 165 Siltstone -- <.001 oro 185 Siltstone-shale-siltstone -- <.001
210 Sandstone-siltstone contact -- <.001 237 Norton coal 1,689 1 .8
41 11F 7 1,980 H 1,604 120 Clintwood coal -- .16 185 Sandstone -- <.001 230 Sandstone-siltstone contact -- <.001 255 Lyons coal -- .15 310 Siltstone -- .28
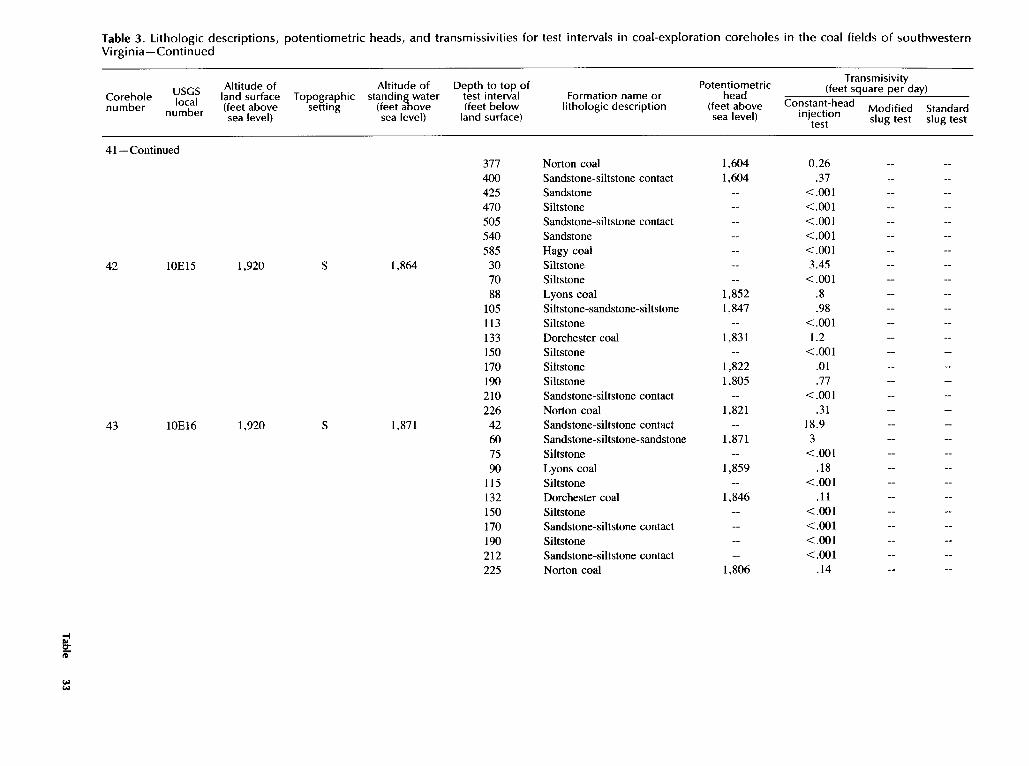
��������������������������������������������������������������������������������
--------------
--
--
--
--
--
--
--------
Table 3. Lithologic descriptions, potentiometric heads, and transmissivities for test intervals in coal-exploration coreholes in the coal fields of southwestern Virginia-Continued
Corehole number
USGS local
number
Altitude of land surface (feet above sea level)
Topographicsetting
Altitude of standing water
(feet above sea level)
Depth to top of test interval (feet below land surface)
Formation name or lithologic description
Potentiometric head
(feet above sea level)
Transmisivity(feet square per day)
Constant-head Modified Standardinjectiontest slug test slug test
41-Continued 377 Norton coal 1,604 0.26 400 Sandstone-siltstone contact 1,604 .37 425 Sandstone <.001 470 Siltstone <.001 505 Sandstone-siltstone contact <.001 540 Sandstone <.001
42 10E15 1,920 S 1,864 585 30
Hagy coal Siltstone
<.001 3.45
70 Siltstone <.001 88 Lyons coal 1,852 .8 105 Siltstone-sandstone-siltstone 1,847 .98 113 Siltstone <.001 133 Dorchester coal 1,831 1.2 150 Siltstone <.001 170 Siltstone 1,822 .01 190 Siltstone 1,805 .77 210 Sandstone-siltstone contact <.001 226 Norton coal 1,821 .31
43 10E16 1,920 S 1,871 42 Sandstone-siltstone contact 18 .9 60 Sandstone-siltstone-sandstone 1,871 3 75 Siltstone <.001 90 Lyons coal 1,859 .18 115 Siltstone <.001 132 Dorchester coal 1,846 .11 150 Siltstone <.001 170 Sandstone-siltstone contact <.001 190 Siltstone <.001 212 Sandstone-siltstone contact <.001 225 Norton coal 1,806 .14
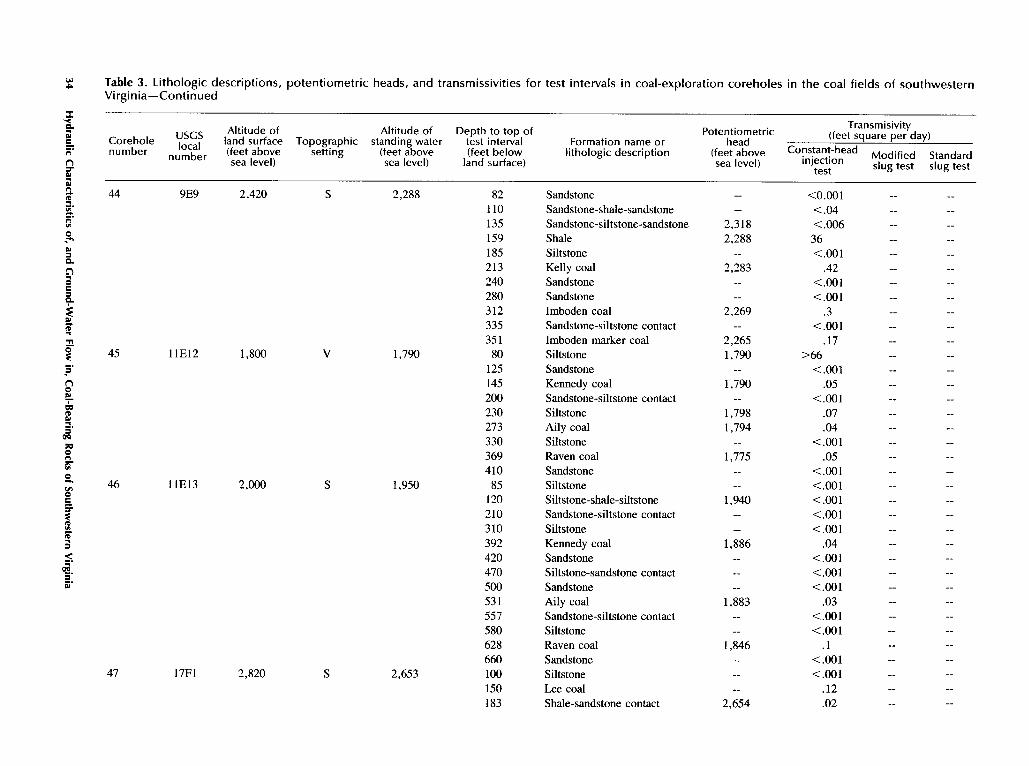
w Table 3 . Lithologic descriptions, potentiometric heads, and transmissivities for test intervals in coal-exploration coreholes in the coal fields of southwesternA
Virginia-Continued
Transmisivitya Altitude of Altitude of Depth to top ofd Corehole USGS land surface Topographic standing water test interval Formation name or Potentiometric (feet square per day)
local headnumber number (feet above setting (feet above (feet below lithologic description (feet above Constant-head Modified Standard n sea level) sea level) land surface) sea level) injection slug test slug testT a test
an A 44 9E9 2,420 S 2,288 82 Sandstone -- <0.001 V1 " 110 Sandstone-shale-sandstone -- <.04 y 135 Sandstone-siltstone-sandstone 2,318 <.0060 159 Shale 2,288 36 ar 185 Siltstone -- < .001a n 213 Kelly coal 2,283 .42 0 240 Sandstone -- < .001c0 c 280 Sandstone -- < .001
312 Imboden coal 2,269 .3 aA 335 Sandstone-siltstone contact -- <001 T 351 Imboden marker coal 2,265 .170 45 11E12 1,800 V 1,790 80 Siltstone 1,790 >66F
125 Sandstone -- <001 n 145 Kennedy coal 1,790 .050 w 200 Sandstone-siltstone contact -- <.00100 230 Siltstone 1,798 .07w
273 Aily coal 1,794 .04 oa 330 Siltstone -- <0010a n 369 Raven coal 1,775 .05 H 410 Sandstone -- <.0010 y 46 11E13 2,000 S 1,950 85 Siltstone -- <.0010c 120 Siltstone-shale-siltstone 1,940 <.001s F 210 Sandstone-siltstone contact -- <.001
310 Siltstone -- <.001 3 392 Kennedy coal 1,886 .04
420 Sandstone -- <.001 as 470 Siltstone-sandstone contact -- <.001
500 Sandstone -- <.001 531 Aily coal 1,883 .03 557 Sandstone-siltstone contact -- <.001 580 Siltstone -- <.001 628 Raven coal 1,846 .1 660 Sandstone -- < .001
47 17F1 2,820 S 2,653 100 Siltstone -- < .001 150 Lee coal -- .12 183 Shale-sandstone contact 2,654 .02
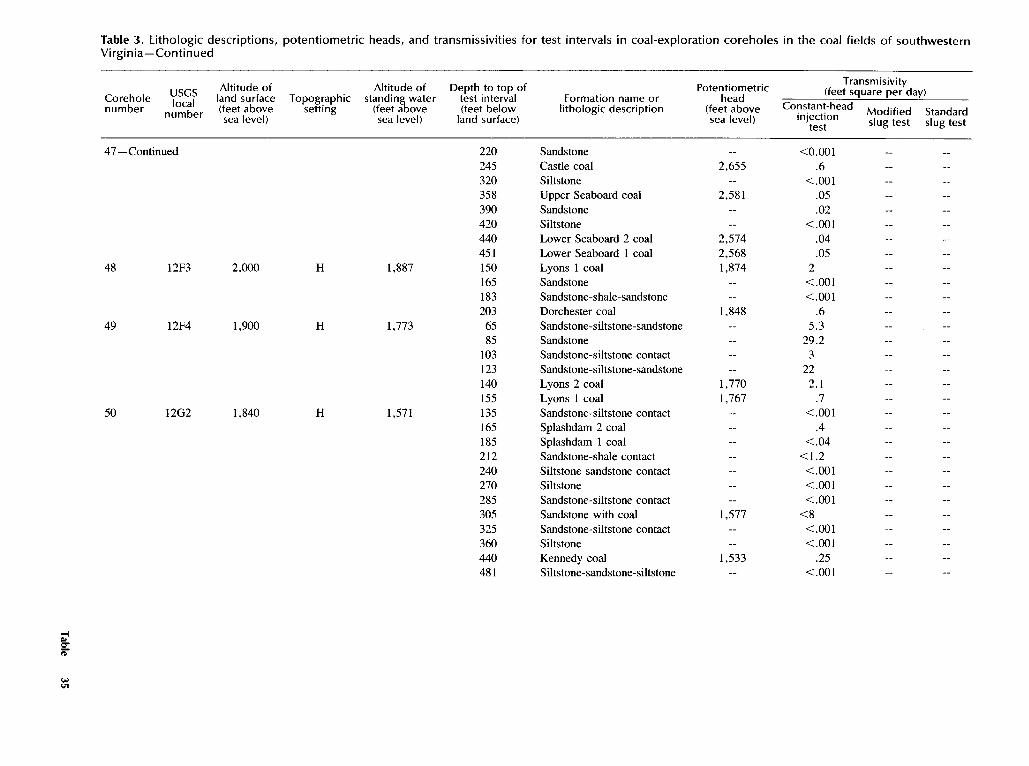
--
--
----
----
--------
--------------
----
--
Table 3. Lithologic descriptions, potentiometric heads, and transmissivities for test intervals in coal-exploration coreholes in the coal fields of southwestern Virginia-Continued
Corehole number
USGS local
number
Altitude of land surface (feet above sea level)
Topographicsetting
Altitude of standing water (feet above sea level)
Depth to top of test interval (feet below land surface)
Formation name or lithologic description
Potentiometric head
(feet above sea level)
Standard slug test
(feetTransmisivity square per day)
Constant-headinjection Modified
test slug test
47-Continued 220 Sandstone <0.001 245 Castle coal 2,655 .6 320 Siltstone <.001 358 Upper Seaboard coal 2,581 .05 390 Sandstone .02 420 Siltstone < .001 440 Lower Seaboard 2 coal 2,574 .04 451 Lower Seaboard 1 coal 2,568 .05
48 12F3 2,000 H 1,887 150 Lyons 1 coal 1,874 2 165 Sandstone <.001 183 Sandstone-shale-sandstone <.001 203 Dorchester coal 1,848 .6
49 12F4 1,900 H 1,773 65 Sandstone-siltstone-sandstone 5 .3 85 Sandstone 29.2 103 Sandstone-siltstone contact 3 123 Sandstone-siltstone-sandstone 22 140 Lyons 2 coal 1,770 2.1
50 12G2 1,840 H 1,571 155 135
Lyons 1 coal Sandstone-siltstone contact
1,767 .7 <.001
165 Splashdam 2 coal .4 185 212
Splashdam 1 coal Sandstone-shale contact
<.04 <1 .2
240 Siltstone-sandstone contact <.001 270 Siltstone <.001 285 Sandstone-siltstone contact < .001 305 Sandstone with coal 1,577 <8 325 Sandstone-siltstone contact <.001 360 Siltstone < .001 440 481
Kennedy coal Siltstone-sandstone-siltstone
1,533 .25 <.001
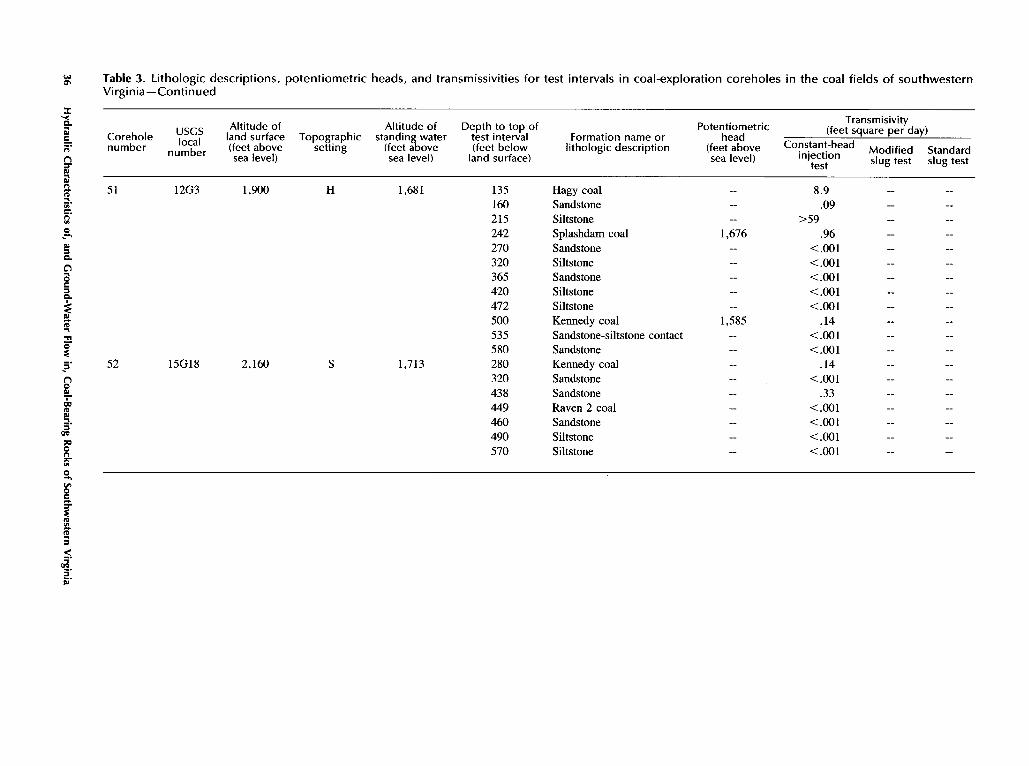
------
----------
------------------
w Table 3. Lithologic descriptions, potentiometric heads, and transmissivities for test intervals in coal-exploration coreholes in the coal fields of southwestern Virginia-Continued
a w c n nSfUtN
Corehole number
USGS local
number
Altitude of land surface (feet above sea level)
Topographic setting
Altitude of standing water
(feet above sea level)
Depth to top of test interval (feet below land surface)
Formation name or lithologic description
Potentiometric head
(feet above sea level)
Standard slug test
(feet Transmisivity square per day)
Constant-head injection Modified
test slug test
51 12G3 1,900 H 1,681 135 Ha9y coal 8 .9 160 Sandstone .09 215 Siltstone >59
°. 242 Splashdam coal 1,676 .96 270 Sandstone <.001
°' n 320 Siltstone <.001 0 365 Sandstone <.001 0 a 420 Siltstone <.001
472 Siltstone <.001 500 Kennedy coal 1,585 .14
;, 535 Sandstone-siltstone contact <.001
F 580 Sandstone <.001 52 15G18 2,160 S 1,713 280 Kennedy coal .14
n 320 Sandstone <.001 438 Sandstone .33
a+ 449 Raven 2 coal <.001 460 Sandstone <.001
°° a 490 Siltstone <.001 ° n 570 Siltstone <.001 Vl
HMA
C Z 03.
Related Documents