Natural Resources, 2013, 4, 220-228 http://dx.doi.org/10.4236/nr.2013.42028 Published Online June 2013 (http://www.scirp.org/journal/nr) Hydraulic Characteristics and Suspended Sediment Loads during Spring Breakup in Several Streams Located on the National Petroleum Reserve in Alaska, USA Horacio Toniolo 1* , Dragos Vas 2 , Peter Prokein 3 , Richard Kenmitz 4 , Erica Lamb 2 , Dave Brailey 5 1 Civil and Environmental Engineering Department, University of Alaska Fairbanks, Fairbanks, USA; 2 Water and Environmental Research Center, University of Alaska Fairbanks, Fairbanks, USA; 3 Institute of Northern Engineering, University of Alaska Fair- banks, Fairbanks, USA; 4 Bureau of Land Management, Arctic Field Office, Fairbanks, USA; 5 Brailey Hydrologic Consultants, An- chorage, USA. Email: * [email protected] Received January 12 th , 2013; revised April 6 th , 2013; accepted April 27 th , 2013 Copyright © 2013 Horacio Toniolo et al. This is an open access article distributed under the Creative Commons Attribution License, which permits unrestricted use, distribution, and reproduction in any medium, provided the original work is properly cited. ABSTRACT This article presents results from a broad field campaign involving discharge and surface-water slope measurements, water sampling, and longitudinal river-bed profile surveys. During the spring breakup of 2011, fieldwork was carried out in several pristine streams located in the National Petroleum Reserve in Alaska; the studied streams cover two main regions: 1) foothills (Ikpikpuk River, Seabee Creek, Prince Creek, and Otuk Creek); 2) coastal plain (Fish Creek, Judy Creek, and Ublutuoch River). Reported data includes basic geometric and hydraulic characteristics such as channel width and depth, cross-sectional area, average velocity, friction factor, shear stress, suspended sediment concentrations from autosamplers and grab samples, and dune dimensions and steepness ratios. The measured discharge in different streams ranged from 2 to 853 m 3 /s, which corresponded to post-breakup and near peak conditions, respectively. The temporal variation of Manning’s n was in phase with measured discharge, with high values of n associated with the presence of floating ice during the measurements. Calculations indicate that sediment particle sizes ≤ 2 mm moved dur- ing the measurements. In general, variations in discharge were accompanied by changes in suspended sediment concen- trations. Keywords: Suspended Sediment Concentration; Bedforms; Resistance Coefficient; Spring Breakup; Arctic Hydrology 1. Introduction The While the existing literature describing basic hy- draulic and sedimentological characteristics in major rivers and tributaries in temperate regions is vast (see for instance, case studies presented in books [1-5] and re- search articles [6-9], among many others), the existing published data on streams located in extreme cold-we- ather settings is somewhat limited [5,10-13]. The meth- odologies used in studies performed in moderate env- ironments ranged from simple to complex techniques involving single to multiple measurements. Studies in cold regions were, in general, characterized by simple methods and single measurements. Furthermore, only partial literature is available in Arctic Alaska [14-16] and Ettema and Kempema (2012) [17] indicate that “detailed information addressing river-ice effects on alluvial ch- annels is quite sparse”. Compounding this lack of data are indications in current research of reductions in field data collection efforts in high-latitude regions [18]. The main reasons for the scarcity of literature in cold regions are the adverse climatic conditions, short timeline of hy- drologic events, and fieldwork logistics. Thus, any new published data will directly or indirectly benefit the re- search community. The North Slope of Alaska, like most Arctic environ- ments, maintains its pristine condition. However, as an increase in planning activities for infrastructure related to oil and gas exploration and production occurs, the need for basic hydro-sedimentologic data for streams in this region becomes evident. This information is crucial for designing new infrastructure, such as river crossings and permitting processes. This article presents results from an extensive field- work campaign carried out during the 2011 spring * Corresponding author. Copyright © 2013 SciRes. NR

Welcome message from author
This document is posted to help you gain knowledge. Please leave a comment to let me know what you think about it! Share it to your friends and learn new things together.
Transcript
Natural Resources, 2013, 4, 220-228 http://dx.doi.org/10.4236/nr.2013.42028 Published Online June 2013 (http://www.scirp.org/journal/nr)
Hydraulic Characteristics and Suspended Sediment Loads during Spring Breakup in Several Streams Located on the National Petroleum Reserve in Alaska, USA
Horacio Toniolo1*, Dragos Vas2, Peter Prokein3, Richard Kenmitz4, Erica Lamb2, Dave Brailey5
1Civil and Environmental Engineering Department, University of Alaska Fairbanks, Fairbanks, USA; 2Water and Environmental Research Center, University of Alaska Fairbanks, Fairbanks, USA; 3Institute of Northern Engineering, University of Alaska Fair-banks, Fairbanks, USA; 4Bureau of Land Management, Arctic Field Office, Fairbanks, USA; 5Brailey Hydrologic Consultants, An-chorage, USA. Email: *[email protected] Received January 12th, 2013; revised April 6th, 2013; accepted April 27th, 2013 Copyright © 2013 Horacio Toniolo et al. This is an open access article distributed under the Creative Commons Attribution License, which permits unrestricted use, distribution, and reproduction in any medium, provided the original work is properly cited.
ABSTRACT
This article presents results from a broad field campaign involving discharge and surface-water slope measurements, water sampling, and longitudinal river-bed profile surveys. During the spring breakup of 2011, fieldwork was carried out in several pristine streams located in the National Petroleum Reserve in Alaska; the studied streams cover two main regions: 1) foothills (Ikpikpuk River, Seabee Creek, Prince Creek, and Otuk Creek); 2) coastal plain (Fish Creek, Judy Creek, and Ublutuoch River). Reported data includes basic geometric and hydraulic characteristics such as channel width and depth, cross-sectional area, average velocity, friction factor, shear stress, suspended sediment concentrations from autosamplers and grab samples, and dune dimensions and steepness ratios. The measured discharge in different streams ranged from 2 to 853 m3/s, which corresponded to post-breakup and near peak conditions, respectively. The temporal variation of Manning’s n was in phase with measured discharge, with high values of n associated with the presence of floating ice during the measurements. Calculations indicate that sediment particle sizes ≤ 2 mm moved dur- ing the measurements. In general, variations in discharge were accompanied by changes in suspended sediment concen- trations. Keywords: Suspended Sediment Concentration; Bedforms; Resistance Coefficient; Spring Breakup; Arctic Hydrology
1. Introduction
The While the existing literature describing basic hy- draulic and sedimentological characteristics in major rivers and tributaries in temperate regions is vast (see for instance, case studies presented in books [1-5] and re- search articles [6-9], among many others), the existing published data on streams located in extreme cold-we- ather settings is somewhat limited [5,10-13]. The meth- odologies used in studies performed in moderate env- ironments ranged from simple to complex techniques involving single to multiple measurements. Studies in cold regions were, in general, characterized by simple methods and single measurements. Furthermore, only partial literature is available in Arctic Alaska [14-16] and Ettema and Kempema (2012) [17] indicate that “detailed information addressing river-ice effects on alluvial ch-
annels is quite sparse”. Compounding this lack of data are indications in current research of reductions in field data collection efforts in high-latitude regions [18]. The main reasons for the scarcity of literature in cold regions are the adverse climatic conditions, short timeline of hy- drologic events, and fieldwork logistics. Thus, any new published data will directly or indirectly benefit the re- search community.
The North Slope of Alaska, like most Arctic environ- ments, maintains its pristine condition. However, as an increase in planning activities for infrastructure related to oil and gas exploration and production occurs, the need for basic hydro-sedimentologic data for streams in this region becomes evident. This information is crucial for designing new infrastructure, such as river crossings and permitting processes.
This article presents results from an extensive field- work campaign carried out during the 2011 spring *Corresponding author.
Copyright © 2013 SciRes. NR
Hydraulic Characteristics and Suspended Sediment Loads during Spring Breakup in Several Streams Located on the National Petroleum Reserve in Alaska, USA
221
breakup, which is typically the largest hydrologic event of the year [14], in several streams located on the Na- tional Petroleum Reserve in Alaska (NPR-A). Specifi- cally, field activities consisted of discharge measure- ments, surveying longitudinal riverbed profiles, sur- face-water slope measurements, and water sampling to estimate suspended sediment concentration. In addition, cross-sectional roughness coefficients, bed shear stress, and suspended sediment loads are reported.
2. Study Sites
The study sites are located in the NPR-A, an area estab- lished as a petroleum reserve in 1923; currently the NPR-A is under the jurisdiction of the Bureau of Land Management (BLM). The total surface of this extensive region is approximately 92,000 km2, which is divided into three main planning areas: the Northeast with 19,000 km2, the Northwest with 36,000 km2, and the South with 37,000 km2 of public land [19].
Field measurements were carried out on seven pristine streams distributed in two main topographic regions: the foothills and coastal plain. Streams located in the foot-hills areas are: Ikpikpuk River, Seabee Creek, Prince Creek, and Otuk Creek; while streams sited on the coastal plain are: Fish Creek, Judy Creek, and Ublutuoch River. These sites were established by BLM approxi-mately ten years ago. Water level data is collected at all
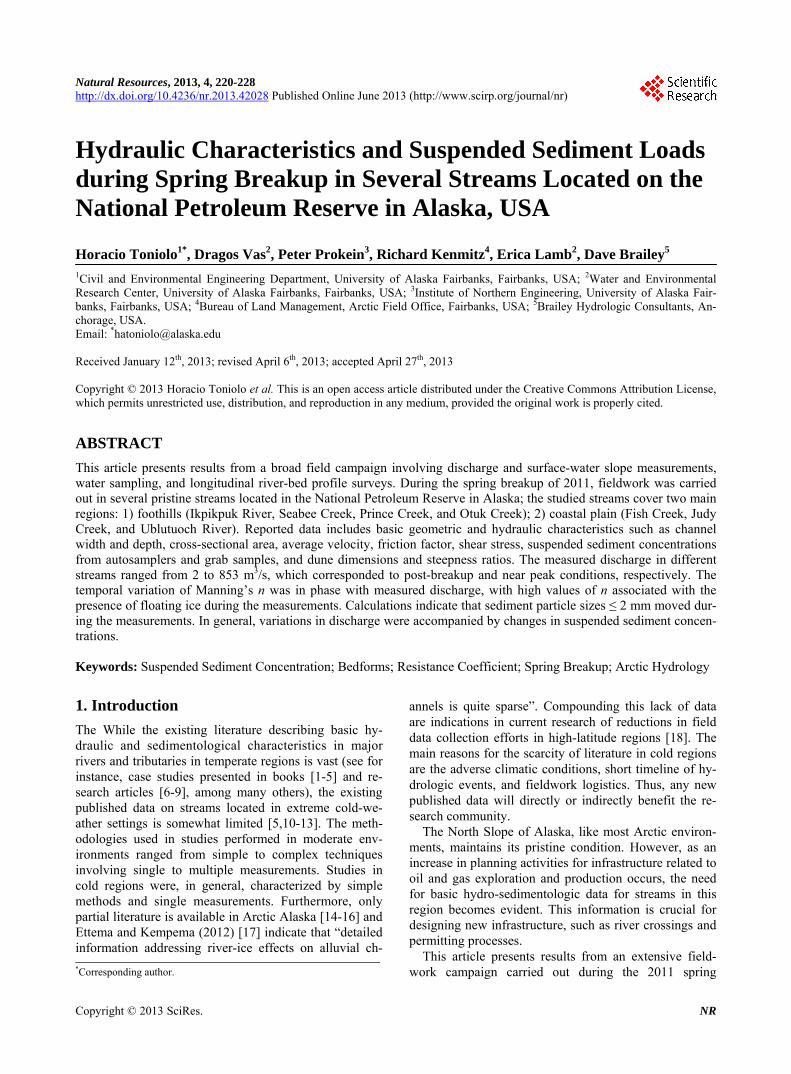
the stations, while basic weather data (i.e., air tempera-ture, precipitation, wind speed and wind direction) is also collected at some stations. Current conditions are avail-able online at http://ine.uaf.edu/werc/projects/npra-hydr- ology. It is important to mention that all sites are only accessible by helicopter, which generally poses a serious limitation to fieldwork activities due to unreliable we- ather conditions in the area. Figure 1 shows the general location and watershed configuration of study sites. Ad- ditionally, Table 1 provides the coordinates of river gauging stations as well as the contributing watershed areas. These watersheds have snowmelt-dominated hy- drographs. However, it was indicated that summer rain- storms could produce higher peak flows in watersheds located in the foothills region [20]; watersheds in the coastal plain seldom respond to summer precipitation with high peak flows [21].
3. Methods
The goal of field activities was to collect basic data in order to characterize the hydrosedimentological condi- tions in each stream (i.e., discharge, channel dimensions, longitudinal bed profiles, water-surface slope, and sus-pended sediment concentration). Restrictions such as weather and logistics, however, limited the activities that could be performed at each site. As a result the collected data sets differ from stream to stream.
Figure 1. Study site locations and watershed delineations inside NPR-A.
Copyright © 2013 SciRes. NR

Hydraulic Characteristics and Suspended Sediment Loads during Spring Breakup in Several Streams Located on the National Petroleum Reserve in Alaska, USA
222
Table 1. Site gauge locations and contributing watershed areas.
Site Latitude (N) Longitude (W) Area (km2)
Fish Creek 70.27 151.869 2088
Ikpikpuk River 69.767 154.663 4391
Judy Creek 70.22 151.835 1605
Otuk Creek 68.486 155.717 146
Prince Creek 69.322 152.515 574
Seabee Creek 69.373 152.158 59
Ublutuoch River 70.243 151.298 331
Discharge measurements were completed using a
Teledyne RDI Rio Grande 1200 KHz and a StreamPro 2000 KHz Acoustic Doppler Current Profiler (ADCP). One of the ADCP units, the Rio Grande, was deployed from a motorized inflatable raft; the other unit, the StreamPro, was installed on a 3 m Aire inflatable kayak. The boats were also equipped with a radio and a NovAtel GPS rover station, while a second NovAtel GPS was used as an onshore base station. This GPS system pro- vided Real-Time Kinematic (RTK) positioning to the ADCP. The communication between the field computer, ADCP, and GPS was established via a Parani Bluetooth system coupled with directional and omni-directional antennas. The measurements in all streams were per- formed following guidelines established by the United States Geological Service [22] for measurements using an ADCP (i.e., compass calibration, four river transects, and a 5% coefficient of variation between individual discharge measurements and average discharge value, Q). Water level readings were taken on local staff gauges installed on the rivers’ banks. The staff gauges were ref- erenced to arbitrary datums established on each site.
Daily suspended-sediment samples were taken with an Isco 3700 and a Sigma 900 Portable Autosamplers on the Prince and Seabee Creeks respectively; grab samples were taken on the other streams (10 samples). The auto- mated samplers were programmed to collect a single sample per day, with the water intake located approxi- mately 15 cm above the riverbed. Grab samples were gathered in the center of the stream, approximately 50 cm below the water surface. Water samples were filtered through Whatman GF/C glass microfiber filters with par- ticle retention of 1.2 μm. The suspended sediment con- centrations (SSC) were calculated following the ASTM standard D 3977 - 97, Method B [23].
The percentage of organic matter in each sample was then determined using ASTM Standard 2974, Method C [24], in which samples are placed in a muffle furnace at 440˚C for twelve hours. The analyses were conducted at
the University of Alaska Fairbanks Water and Environ- mental Research Center. Suspended sediment load, Qs, is defined as
sQ SSC Q (1)
it should be noted that Qs in Equation (1) would be accu- rate if SSC represents the sediment concentration of the entire river cross-section, which would be obtained from a single or multiple samples integrated through the water depth. In this article, however, SSC values used in Equa- tion (1) were calculated from point samples. Thus, the values reported in Results should be considered as rough approximations. Nevertheless, it is argued that these val- ues still provide valuable information for the studied streams. Relationships between point samples collected with automated samplers and integrated samples are be- ing investigated as part of ongoing research efforts and are outside the scope of this manuscript.
A Zeiss level and a graduated rod were used to meas- ure the water-surface slope in some of the streams, fol- lowing traditional surveying methodologies. Measure- ments were carried out on the Ikpikpuk, Fish, Judy, and Ublutuoch streams concurrently with some of the dis- charge measurements. These values were used to esti- mate the streams’ roughness coefficient, following a me- thodology previously reported [16], which is described in the following paragraphs.
The ADCP-generated measurements of channel area, width, and velocity were used along with the water- sur-face slope measurements to back-calculate the Manning’s roughness coefficient, n, given by
2 3 1 21n H S
U (2)
where U denotes the cross-sectional average velocity; H denotes the average depth, and S denotes the water-sur- face slope. The average cross-sectional depth is obtained as
AH
B (3)
where A denotes the cross-sectional area and B denotes the channel width. Bed shear stress, τb, is calculated us-ing the following relation
b g HS (4)
where g denotes gravity, and ρ denotes water density. In addition, the Froude number, Fr, was calculated by the following equation:
r
UF
Hg (5)
the dimensionless Shield’s parameter [5], θ, is defined as
Copyright © 2013 SciRes. NR

Hydraulic Characteristics and Suspended Sediment Loads during Spring Breakup in Several Streams Located on the National Petroleum Reserve in Alaska, USA
223
w
b
s sS d
(6)
where γw denotes specific weight of water; Ss denotes the submerged specific gravity, which is approximately 1.65 for natural sands; ds denotes the representative sediment grain size. This parameter indicates if a given sediment size would move or remain at rest based on the shear stress acting on the particle.
It should be noted that Equations (2)-(6) assume nor-mal flow conditions, whereas the prevailing conditions during the fieldwork somewhat deviated from this prin-ciple. Thus, these equations provide a first approxima-tion to describe the streams’ hydraulic characteristics at the study sites. Similar equations were used by other re- searchers [14,16,25-28] to characterize flow para- meters in conditions that were markedly different from those assumed in Equations (2)-(6). Specifically, these equations were used in floods and flood modeling analyses.
Longitudinal river-bed profiles were surveyed along the thalweg on the Ikpikpuk, Prince, Judy, and Ublutuoch Streams. In addition, a longitudinal profile was gathered for comparison purposes on the Colville River near Umiat. Major bedforms (dunes) were identified in the profiles and basic geometric dimensions (i.e., wavelength, λ, and height, Δ) were measured. Then the steepness ratio, which is defined as Δ/λ of each dune was calculated. Due to the natural variability of dunes in rivers the minimum, average, and maximum steepness ratios were computed. In general, the steepness ratio provides information on the river’s hydraulic adjustment to varying discharge. Specifically, bedforms are the main contributors of form resistance [5].
4. Results
While the manuscript is focused on hydro-sedimentol- ogic conditions in the studied streams, preliminary work was done to establish basic weather conditions in the area during the 2010-2011 winter season. Specifically the ac- cumulated freezing degree days were calculated for two stations located at the opposite ends of an imaginary north-south line (i.e., Fish and Otuk Creeks). Computed values, from 15 September 2010 to 15 June 2011, were 4311 and 3662˚C-days for Fish and Otuk Creeks, respec-tively. These values show colder temperatures in the northern part of the study area. A detailed analysis of meteorological variables such as air temperature, pre-cipitation, wind speed, and wind direction for all stations in the region is outside the scope of this work, and would in fact constitute a standalone article.
The primary source of water during breakup in streams located in NPR-A is runoff due to snowmelt, while rain-
fall events during this period constitute the secondary source of water. Spatially distributed values of end-of- winter snow water equivalent (SWE) would provide in-sights on the amount of water available for runoff on the watershed. Unfortunately, no ground measurements of SWE were available for the study area. Measured rainfall was insignificant during the 2011 breakup period.
Table 2 shows the ice conditions during the measure-ments and data collected in the field, such as discharge, channel width, cross-sectional area, local staff gauge reading, and water slope from Fish, Ikpikpuk, Judy and Ublutuoch streams. Subsequent columns in the table represent parameters computed using field data. For in-stance, Equations (2)-(5) were used to populate columns 10, 9, 11, and 12 respectively. The dimensionless Shield’s parameter is included in column 13. A sediment size of 2 mm, which is the limit of coarse sand, was used in the calculation of θ. The Shield’s parameter, also known as dimensionless bed shear stress, values were above the critical value during the field campaign. Thus, one could expect that sediment particle sizes ≤ 2 mm moved during the measurements. Manning’s n (column 10) modifica-tions were directly related with discharge variations. The flow regime in all measurements was subcritical (i.e., Fr < 1).
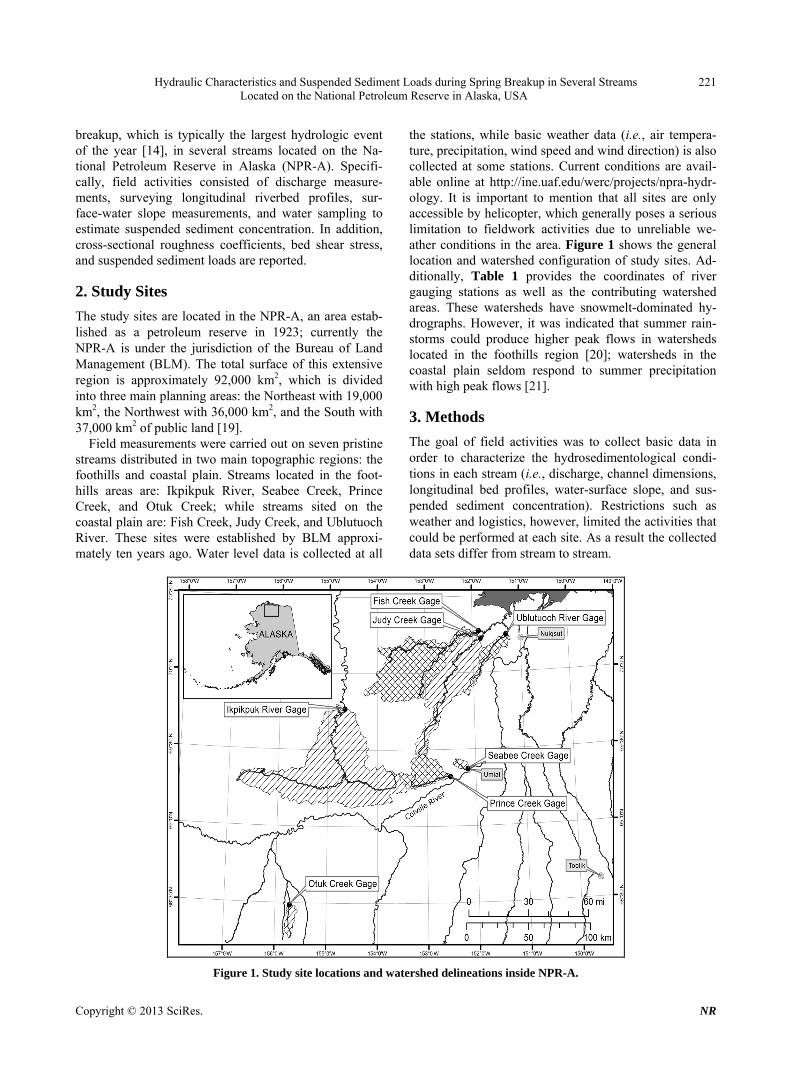
Daily suspended sediment concentrations (from sam- ples collected with the autosamplers) are shown in Fig- ures 2 and 3 for Seabee and Prince Creeks, respectively. In addition, daily discharge and suspended sediment loads are shown in these figures.
Discharge values were estimated from pressure trans- ducer data and rating curves developed for the sites. A comparison between SSC in both figures indicates that suspended sediment concentrations in Prince Creek were, in general, smaller than concentrations in Seabee Creek. As evidenced by these figures, the variations in sus- pended sediment concentration in both streams partially matched the temporal variation of discharge. Addition- ally, these figures indicate that sediment could be un- available (frozen) during the early stages of breakup.
Table 3 shows the suspended sediment concentrations from grab samples collected in the Fish, Ikpikpuk, Judy, Otuk, and Ublutuoch streams. In addition, measured dis- charge and calculated suspended sediment load are in- cluded in the table. Data indicates that sediment concen- trations in Fish Creek increased nearly 450% in a 5-day period, while discharge only increased 20%. The changes in SSC and discharge were around 60% in Judy Creek. Sediment concentrations remained constant in Ublutuoch River.
Basic dune dimensions (i.e., wavelength and height) and steepness ratios in the vicinity of the gauging sites for Prince, Ikpikpuk, Judy, and Ublutuoch streams are
Copyright © 2013 SciRes. NR
Hydraulic Characteristics and Suspended Sediment Loads during Spring Breakup in Several Streams Located on the National Petroleum Reserve in Alaska, USA
Copyright © 2013 SciRes. NR
224
Table 2. Geometric and hydraulic characteristics.
Stream Date Q
(m3/s) B
(m) A
(m2) Staff gauge
(ft) S
U= Q/A(m/s)
H = A/B (m)
n Tao
(N/m2) Fr
Shield’sParameter
Ikpikpuk 29 May 2011[A]
31 May 2011[A] 3 June 2011[B]
801.7 852.7 230.2
164.3 118.9 89.9
710.5 431.5 168.5
36.88 36.92 29.41
0.000190.0007410.00022
1.1 2.0 1.4
4.32 3.63 1.87
0.032 0.033 0.017
8.06 26.39 4.05
0.17 0.33 0.32
0.25 0.82 0.12
Fish 2 June 2011[A] 7 June 2011[A]
59.1 69.2
75.1 65.8
139.3 122.0
22.8 21.47
0.000090.00032
0.4 0.6
1.85 1.85
0.034 0.048
1.64 5.82
0.10 0.13
0.05 0.18
Judy 2 June 2011[A] 7 June 2011[B]
126.3 74.6
77.7 46.6
151.3 98.4
26.96 24.86
0.000520.00031
0.8 0.8
1.95 2.11
0.043 0.038
9.93 6.42
0.19 0.17
0.31 0.20
Ublutuoch 2 June 2011[A] 7 June 2011[B]
48.1 33.4
31.4 25.3
42.4 32.4
18.5 14.84
0.001080.00083
1.1 1.0
1.35 1.28
0.035 0.033
14.30 10.44
0.31 0.29
0.44 0.32
[A]Floating ice. [B]Ice free conditions.
Table 3. Suspended sediment concentration and suspended sediment loads.
Stream Date SSC (mg/l) Q (m3/s) Qss (g/s)
Fish 2 June 2011 5 June 2011 7 June 2011
19.61 33.39 88.49
57.7 56.6 69.2
1130.8 1891.1 6121.2
Ikpikpuk 3 June 2011 72.66 230.2 16724.6
Judy 2 June 2011 5 June 2011 7 June 2011
152.22 186.55 115.27
126.3 79.8 74.6
19225.8 14886.7 8599.4
Otuk 4 June 2011 0.51 2.1 1.1
Ublutuoch 5 June 2011 7 June 2011
10.84 10.93
46.5 33.2
504.2 363.4
Figure 2. Suspended sediment concentration, discharge, and suspended sediment load. Seabee creek.
Figure 3. Suspended sediment concentration, discharge, and suspended sediment load. Prince creek.
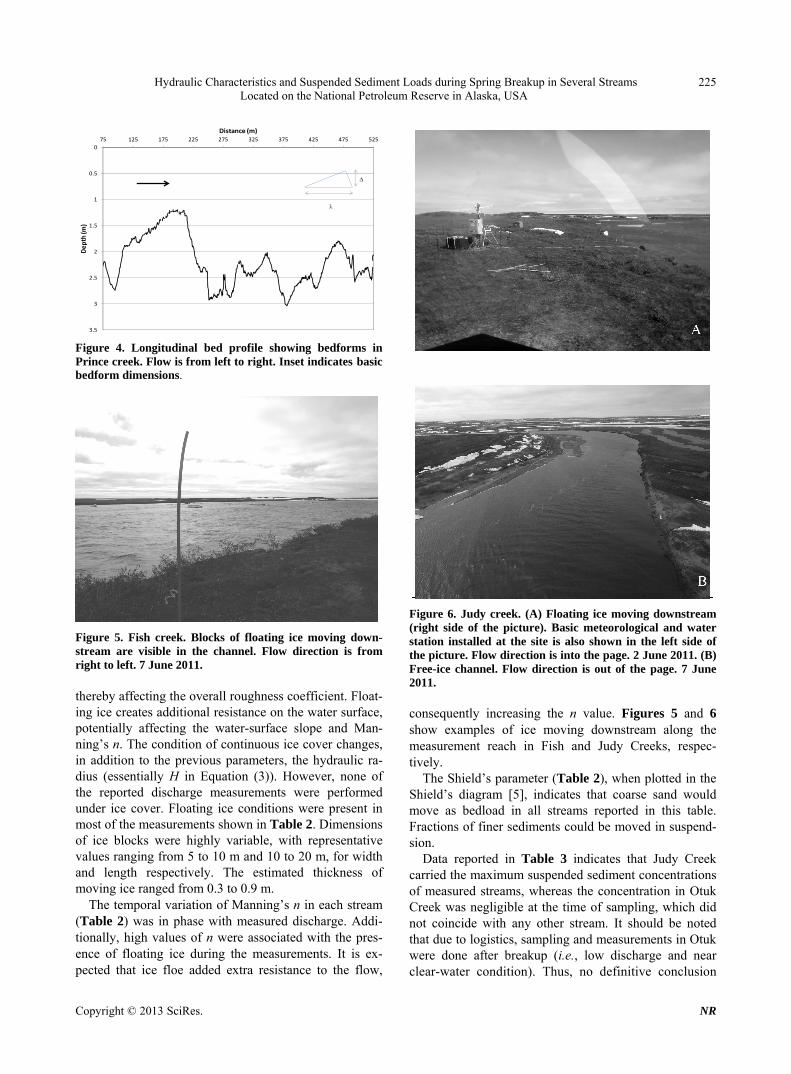
presented in Table 4. For comparison purposes, data from the Colville River, near Umiat is also included the table. Minimum, average, and maximum values are re- ported to represent the natural variability of dunes in riv- ers. Average wavelengths and heights in NPR-A streams ranged from 17 to 123 m, and 0.3 to 1.1 m, respectively, while similar parameters for the Colville River were 270 and 0.7 m. Steepness ratios were consistently higher in NPR-A streams than in the Colville River. Figure 4 shows the longitudinal bed profile along the thalweg on Prince Cree; in this figure, several dunes can be identi-
fied. In addition, superimposed ripples (smaller bedforms) can be seen on top the dunes, especially on the left side of the figure. These smaller bedforms were not visible in all longitudinal profiles. Thus, no geometric details are presented.
5. Discussion
The presence of static and floating ice certainly modifies the stream flow conditions. For instance, anchor ice alters the available flow area and the bed roughness,
Hydraulic Characteristics and Suspended Sediment Loads during Spring Breakup in Several Streams Located on the National Petroleum Reserve in Alaska, USA
225
0
0.5
1
1.5
2
2.5
3
3.5
75 125 175 225 275 325 375 425 475 525
Dep
th (m
)
Distance (m)
Figure 4. Longitudinal bed profile showing bedforms in Prince creek. Flow is from left to right. Inset indicates basic bedform dimensions.
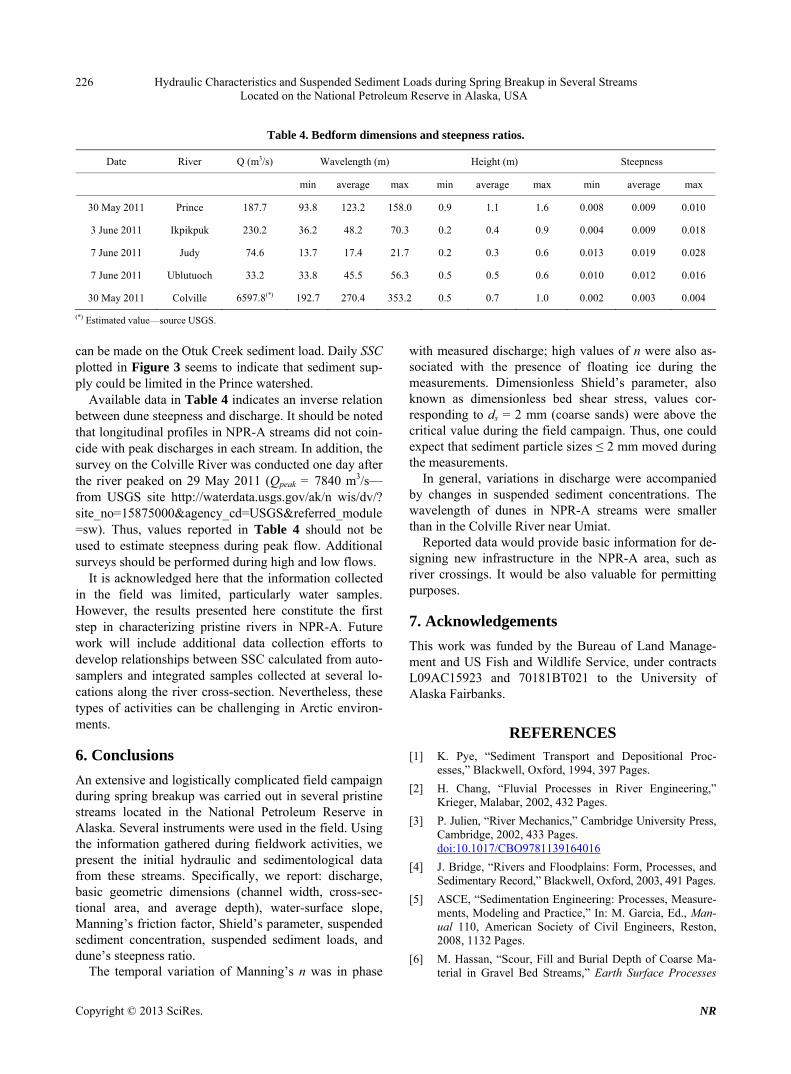
Figure 5. Fish creek. Blocks of floating ice moving down-stream are visible in the channel. Flow direction is from right to left. 7 June 2011. thereby affecting the overall roughness coefficient. Float- ing ice creates additional resistance on the water surface, potentially affecting the water-surface slope and Man- ning’s n. The condition of continuous ice cover changes, in addition to the previous parameters, the hydraulic ra- dius (essentially H in Equation (3)). However, none of the reported discharge measurements were performed under ice cover. Floating ice conditions were present in most of the measurements shown in Table 2. Dimensions of ice blocks were highly variable, with representative values ranging from 5 to 10 m and 10 to 20 m, for width and length respectively. The estimated thickness of moving ice ranged from 0.3 to 0.9 m.
The temporal variation of Manning’s n in each stream (Table 2) was in phase with measured discharge. Addi- tionally, high values of n were associated with the pres- ence of floating ice during the measurements. It is ex- pected that ice floe added extra resistance to the flow,
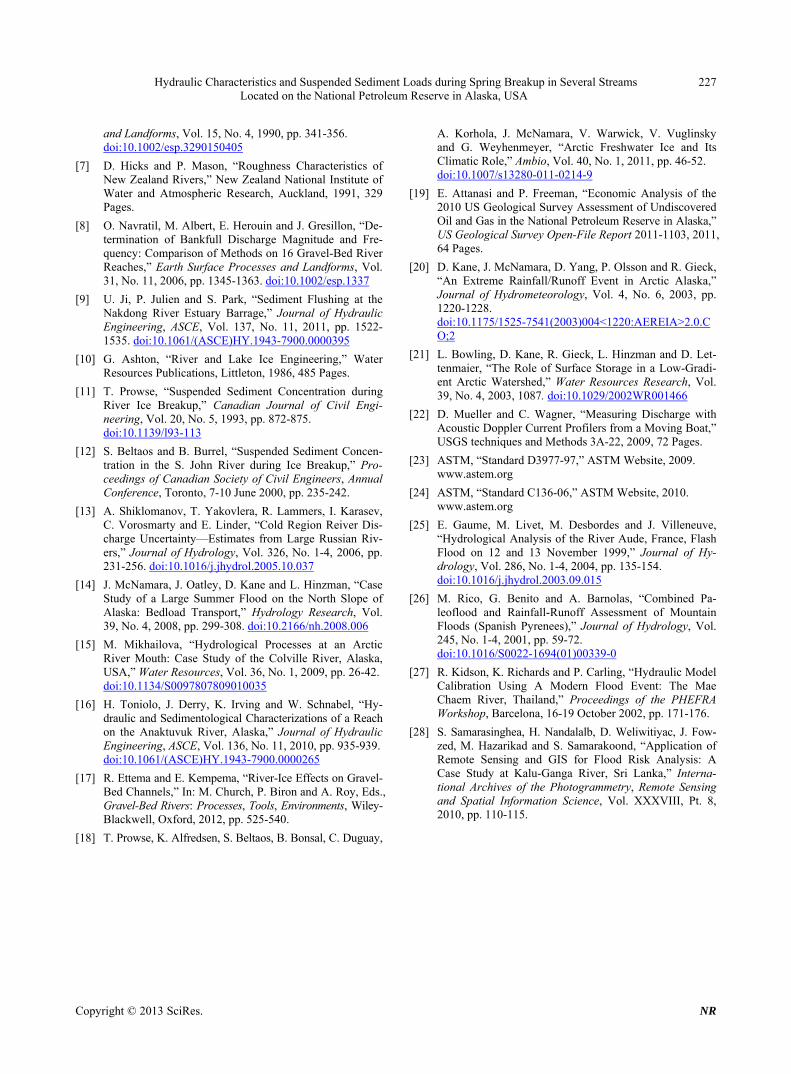
Figure 6. Judy creek. (A) Floating ice moving downstream (right side of the picture). Basic meteorological and water station installed at the site is also shown in the left side of the picture. Flow direction is into the page. 2 June 2011. (B) Free-ice channel. Flow direction is out of the page. 7 June 2011. consequently increasing the n value. Figures 5 and 6 show examples of ice moving downstream along the measurement reach in Fish and Judy Creeks, respec- tively.
The Shield’s parameter (Table 2), when plotted in the Shield’s diagram [5], indicates that coarse sand would move as bedload in all streams reported in this table. Fractions of finer sediments could be moved in suspend- sion.
Data reported in Table 3 indicates that Judy Creek carried the maximum suspended sediment concentrations of measured streams, whereas the concentration in Otuk Creek was negligible at the time of sampling, which did not coincide with any other stream. It should be noted that due to logistics, sampling and measurements in Otuk were done after breakup (i.e., low discharge and near clear-water condition). Thus, no definitive conclusion
Copyright © 2013 SciRes. NR
Hydraulic Characteristics and Suspended Sediment Loads during Spring Breakup in Several Streams Located on the National Petroleum Reserve in Alaska, USA
Copyright © 2013 SciRes. NR
226
Table 4. Bedform dimensions and steepness ratios.
Date River Q (m3/s) Wavelength (m) Height (m) Steepness
min average max min average max min average max
30 May 2011 Prince 187.7 93.8 123.2 158.0 0.9 1.1 1.6 0.008 0.009 0.010
3 June 2011 Ikpikpuk 230.2 36.2 48.2 70.3 0.2 0.4 0.9 0.004 0.009 0.018
7 June 2011 Judy 74.6 13.7 17.4 21.7 0.2 0.3 0.6 0.013 0.019 0.028
7 June 2011 Ublutuoch 33.2 33.8 45.5 56.3 0.5 0.5 0.6 0.010 0.012 0.016
30 May 2011 Colville 6597.8(*) 192.7 270.4 353.2 0.5 0.7 1.0 0.002 0.003 0.004
(*) Estimated value—source USGS.
can be made on the Otuk Creek sediment load. Daily SSC plotted in Figure 3 seems to indicate that sediment sup- ply could be limited in the Prince watershed.
Available data in Table 4 indicates an inverse relation between dune steepness and discharge. It should be noted that longitudinal profiles in NPR-A streams did not coin-cide with peak discharges in each stream. In addition, the survey on the Colville River was conducted one day after the river peaked on 29 May 2011 (Qpeak = 7840 m3/s— from USGS site http://waterdata.usgs.gov/ak/n wis/dv/? site_no=15875000&agency_cd=USGS&referred_module=sw). Thus, values reported in Table 4 should not be used to estimate steepness during peak flow. Additional surveys should be performed during high and low flows.
It is acknowledged here that the information collected in the field was limited, particularly water samples. However, the results presented here constitute the first step in characterizing pristine rivers in NPR-A. Future work will include additional data collection efforts to develop relationships between SSC calculated from auto- samplers and integrated samples collected at several lo-cations along the river cross-section. Nevertheless, these types of activities can be challenging in Arctic environ-ments.
6. Conclusions
An extensive and logistically complicated field campaign during spring breakup was carried out in several pristine streams located in the National Petroleum Reserve in Alaska. Several instruments were used in the field. Using the information gathered during fieldwork activities, we present the initial hydraulic and sedimentological data from these streams. Specifically, we report: discharge, basic geometric dimensions (channel width, cross-sec- tional area, and average depth), water-surface slope, Manning’s friction factor, Shield’s parameter, suspended sediment concentration, suspended sediment loads, and dune’s steepness ratio.
The temporal variation of Manning’s n was in phase
with measured discharge; high values of n were also as- sociated with the presence of floating ice during the measurements. Dimensionless Shield’s parameter, also known as dimensionless bed shear stress, values cor- responding to ds = 2 mm (coarse sands) were above the critical value during the field campaign. Thus, one could expect that sediment particle sizes ≤ 2 mm moved during the measurements.
In general, variations in discharge were accompanied by changes in suspended sediment concentrations. The wavelength of dunes in NPR-A streams were smaller than in the Colville River near Umiat.
Reported data would provide basic information for de-signing new infrastructure in the NPR-A area, such as river crossings. It would be also valuable for permitting purposes.
7. Acknowledgements
This work was funded by the Bureau of Land Manage- ment and US Fish and Wildlife Service, under contracts L09AC15923 and 70181BT021 to the University of Alaska Fairbanks.
REFERENCES [1] K. Pye, “Sediment Transport and Depositional Proc-
esses,” Blackwell, Oxford, 1994, 397 Pages.
[2] H. Chang, “Fluvial Processes in River Engineering,” Krieger, Malabar, 2002, 432 Pages.
[3] P. Julien, “River Mechanics,” Cambridge University Press, Cambridge, 2002, 433 Pages. doi:10.1017/CBO9781139164016
[4] J. Bridge, “Rivers and Floodplains: Form, Processes, and Sedimentary Record,” Blackwell, Oxford, 2003, 491 Pages.
[5] ASCE, “Sedimentation Engineering: Processes, Measure- ments, Modeling and Practice,” In: M. Garcia, Ed., Man-ual 110, American Society of Civil Engineers, Reston, 2008, 1132 Pages.
[6] M. Hassan, “Scour, Fill and Burial Depth of Coarse Ma- terial in Gravel Bed Streams,” Earth Surface Processes
Hydraulic Characteristics and Suspended Sediment Loads during Spring Breakup in Several Streams Located on the National Petroleum Reserve in Alaska, USA
227
and Landforms, Vol. 15, No. 4, 1990, pp. 341-356. doi:10.1002/esp.3290150405
[7] D. Hicks and P. Mason, “Roughness Characteristics of New Zealand Rivers,” New Zealand National Institute of Water and Atmospheric Research, Auckland, 1991, 329 Pages.
[8] O. Navratil, M. Albert, E. Herouin and J. Gresillon, “De- termination of Bankfull Discharge Magnitude and Fre- quency: Comparison of Methods on 16 Gravel-Bed River Reaches,” Earth Surface Processes and Landforms, Vol. 31, No. 11, 2006, pp. 1345-1363. doi:10.1002/esp.1337
[9] U. Ji, P. Julien and S. Park, “Sediment Flushing at the Nakdong River Estuary Barrage,” Journal of Hydraulic Engineering, ASCE, Vol. 137, No. 11, 2011, pp. 1522- 1535. doi:10.1061/(ASCE)HY.1943-7900.0000395
[10] G. Ashton, “River and Lake Ice Engineering,” Water Resources Publications, Littleton, 1986, 485 Pages.
[11] T. Prowse, “Suspended Sediment Concentration during River Ice Breakup,” Canadian Journal of Civil Engi- neering, Vol. 20, No. 5, 1993, pp. 872-875. doi:10.1139/l93-113
[12] S. Beltaos and B. Burrel, “Suspended Sediment Concen- tration in the S. John River during Ice Breakup,” Pro- ceedings of Canadian Society of Civil Engineers, Annual Conference, Toronto, 7-10 June 2000, pp. 235-242.
[13] A. Shiklomanov, T. Yakovlera, R. Lammers, I. Karasev, C. Vorosmarty and E. Linder, “Cold Region Reiver Dis- charge Uncertainty—Estimates from Large Russian Riv- ers,” Journal of Hydrology, Vol. 326, No. 1-4, 2006, pp. 231-256. doi:10.1016/j.jhydrol.2005.10.037
[14] J. McNamara, J. Oatley, D. Kane and L. Hinzman, “Case Study of a Large Summer Flood on the North Slope of Alaska: Bedload Transport,” Hydrology Research, Vol. 39, No. 4, 2008, pp. 299-308. doi:10.2166/nh.2008.006
[15] M. Mikhailova, “Hydrological Processes at an Arctic River Mouth: Case Study of the Colville River, Alaska, USA,” Water Resources, Vol. 36, No. 1, 2009, pp. 26-42. doi:10.1134/S0097807809010035
[16] H. Toniolo, J. Derry, K. Irving and W. Schnabel, “Hy- draulic and Sedimentological Characterizations of a Reach on the Anaktuvuk River, Alaska,” Journal of Hydraulic Engineering, ASCE, Vol. 136, No. 11, 2010, pp. 935-939. doi:10.1061/(ASCE)HY.1943-7900.0000265
[17] R. Ettema and E. Kempema, “River-Ice Effects on Gravel- Bed Channels,” In: M. Church, P. Biron and A. Roy, Eds., Gravel-Bed Rivers: Processes, Tools, Environments, Wiley- Blackwell, Oxford, 2012, pp. 525-540.
[18] T. Prowse, K. Alfredsen, S. Beltaos, B. Bonsal, C. Duguay,
A. Korhola, J. McNamara, V. Warwick, V. Vuglinsky and G. Weyhenmeyer, “Arctic Freshwater Ice and Its Climatic Role,” Ambio, Vol. 40, No. 1, 2011, pp. 46-52. doi:10.1007/s13280-011-0214-9
[19] E. Attanasi and P. Freeman, “Economic Analysis of the 2010 US Geological Survey Assessment of Undiscovered Oil and Gas in the National Petroleum Reserve in Alaska,” US Geological Survey Open-File Report 2011-1103, 2011, 64 Pages.
[20] D. Kane, J. McNamara, D. Yang, P. Olsson and R. Gieck, “An Extreme Rainfall/Runoff Event in Arctic Alaska,” Journal of Hydrometeorology, Vol. 4, No. 6, 2003, pp. 1220-1228. doi:10.1175/1525-7541(2003)004<1220:AEREIA>2.0.CO;2
[21] L. Bowling, D. Kane, R. Gieck, L. Hinzman and D. Let- tenmaier, “The Role of Surface Storage in a Low-Gradi- ent Arctic Watershed,” Water Resources Research, Vol. 39, No. 4, 2003, 1087. doi:10.1029/2002WR001466
[22] D. Mueller and C. Wagner, “Measuring Discharge with Acoustic Doppler Current Profilers from a Moving Boat,” USGS techniques and Methods 3A-22, 2009, 72 Pages.
[23] ASTM, “Standard D3977-97,” ASTM Website, 2009. www.astem.org
[24] ASTM, “Standard C136-06,” ASTM Website, 2010. www.astem.org
[25] E. Gaume, M. Livet, M. Desbordes and J. Villeneuve, “Hydrological Analysis of the River Aude, France, Flash Flood on 12 and 13 November 1999,” Journal of Hy- drology, Vol. 286, No. 1-4, 2004, pp. 135-154. doi:10.1016/j.jhydrol.2003.09.015
[26] M. Rico, G. Benito and A. Barnolas, “Combined Pa- leoflood and Rainfall-Runoff Assessment of Mountain Floods (Spanish Pyrenees),” Journal of Hydrology, Vol. 245, No. 1-4, 2001, pp. 59-72. doi:10.1016/S0022-1694(01)00339-0
[27] R. Kidson, K. Richards and P. Carling, “Hydraulic Model Calibration Using A Modern Flood Event: The Mae Chaem River, Thailand,” Proceedings of the PHEFRA Workshop, Barcelona, 16-19 October 2002, pp. 171-176.
[28] S. Samarasinghea, H. Nandalalb, D. Weliwitiyac, J. Fow- zed, M. Hazarikad and S. Samarakoond, “Application of Remote Sensing and GIS for Flood Risk Analysis: A Case Study at Kalu-Ganga River, Sri Lanka,” Interna- tional Archives of the Photogrammetry, Remote Sensing and Spatial Information Science, Vol. XXXVIII, Pt. 8, 2010, pp. 110-115.
Copyright © 2013 SciRes. NR
Hydraulic Characteristics and Suspended Sediment Loads during Spring Breakup in Several Streams Located on the National Petroleum Reserve in Alaska, USA
228
Abbreviations
Notation
The following symbols were used in this technical note: A cross-sectional area B channel width Fr Froude number H cross-sectionaly averaged channel depth Q discharge Qs suspended sediment load S water-surface slope Ss submerged specific gravity SSC suspended sediment concentration
U cross-sectionaly averaged velocity ds sediment grain size g gravity n Manning’s roughness coefficient Δ dune height λ dune wavelength γw specific weight of water ν kinematic viscosity of water ρ density of water τb bed shear stress θ Shield’s dimensionless parameter
Copyright © 2013 SciRes. NR
Related Documents