Hydration of polysaccharides by the use of hyaluronan as a model system Dissertation Zur Erlangung des akademischen Grades eines Doktors der Naturwissenschaften Fachbereich 7: Natur- und Umweltwissenschaften Universität Koblenz-Landau vorgelegt von Dipl.-Ing. Alena Průšová 1. Gutachter: PD. Dr. Jiri Kučerík (Universität Koblenz-Landau, Germany) 2. Gutachterin: Prof. Dr. Gabriele Schaumann (Universität Koblenz-Landau, Germany) Landau, Februar 2013

Welcome message from author
This document is posted to help you gain knowledge. Please leave a comment to let me know what you think about it! Share it to your friends and learn new things together.
Transcript
Hydration of polysaccharides by the use of hyaluronan as a model system
Dissertation
Zur Erlangung des akademischen Grades eines
Doktors der Naturwissenschaften
Fachbereich 7: Natur- und Umweltwissenschaften
Universität Koblenz-Landau
vorgelegt von
Dipl.-Ing.
Alena Průšová
1. Gutachter: PD. Dr. Jiri Kučerík (Universität Koblenz-Landau, Germany)
2. Gutachterin: Prof. Dr. Gabriele Schaumann (Universität Koblenz-Landau, Germany)
Landau, Februar 2013

To my father Jaromír Průša
iii
Declaration
I herewith declare that I autonomously carried out the PhD thesis entitled “Hydration of
polysaccharides by the use of hyaluronan as a model system”. All used assistances are declared
and parts of involved contributors and other authors are clearly indicated. This or another thesis
has never been submitted elsewhere for an exam, as thesis or for evaluation in a similar context;
neither to any department of this university nor to any other scientific institution.
______________________________________________________________________
Place, date signature
The following parts of this thesis are published or submitted for publication:
Appendix 1 is published: Průšová, A., Šmejkalová, D., Chytil, M., Velebný, M., Kučerík, J.
(2010). An alternative DSC approach to study hydration of hyaluronan. Carbohydrate Polymers
82: 498–503. My own contribution to this work consists of ~75% which includes sample
preparation, conducting of all measurements, data elaboration and writing of the manuscript.
Appendix 2 is published: Kučerík, J., Průšová, A., Rotaru, A., Flimel, K., Janeček, J., Conte, P.
(2011). DSC study on hyaluronan hydration and dehydration. Thermochimica acta 523: 245–249.
My own contribution to this work consists of ~ 50% which includes sample preparation,
conducting of all measurements, data elaboration and participation on writing of the manuscript.
Appendix 3 is published: Šmejkalová, D., Hermannová, M., Šulánková, R., Průšová, A.,
Kučerík, J., Velebný, M. (2012) Structural and conformation differences of acylated hyaluronan
modified in protic and aprotic solvent system. Carbohydrate Polymers 87: 1460–1466. My own
contribution to this work consists of ~ 40% which includes preparation of samples for DSC,
conducting of all DSC measurements and related data elaboration and participation on writing of
the manuscript.
Appendix 4 is published: Kučerík, J., Bursáková, P., Průšová, A., Grebíková, L., Schaumann,
G. E. (2012) Hydration of humic and fulvic acids studied by DSC. Journal of thermal analysis and
calorimetry 110: 451–459. My own contribution to this work consists of ~ 30%, which includes
conducting of some DSC measurements and some data elaboration and participation on writing of
the manuscript. This work is a part of PhD thesis of Dr. Bursáková as well, in present thesis

iv
represents only a minor part and it is included in order to clarify better the approaches applied in
other appendixes.
Appendix 5 is published: Průšová, A., Conte, P., Kučerík, J., Alonzo, G. (2010) Dynamics of
hyaluronan aqueous solutions as assessed by fast field cycling NMR relaxometry. Analytical and
Bioanalytical Chemistry 397: 3023–3028. My own contribution to this work consists of ~ 75%
which includes sample preparation, conducting of all measurements, data elaboration and
participation on writing of the manuscript.
Appendix 6 is submitted to the journal “Carbohydrate Polymers” as: Průšová, A., Vergeldt, J.
F., Kučerík, J. Influence of water content and drying on the physical structure of native
hyaluronan. My own contribution to this work consists of ~ 80% which includes sample
preparation, conducting of all DSC, SEM and NMR measurements, all data elaboration and
writing of the manuscript.
Part of the published work has been conducted at Brno University of Technology, Czech
Republic, thus my affiliation on these scientific papers is to Brno University of Technology.
Additionally, this thesis benefited from the supervision by Assoc. Prof. Dr. Jiří Kučerík as well
as by supervision by Prof. Dr. Gabrielle E. Schaumann who helped me by suggestions, advices
and ideas which cannot be enumerated. Measurements on FFC NMR were conducted under
supervision of prof. Pellegrino Conte.
v
Acknowledgements
First of all I wish to thank to my supervisor Assoc. Prof. Dr. Jiří Kučerík for his enormous help
and support. Without his guidance, encouragement, enthusiasm, and unselfish help I would not
had been able to finish my doctoral work. I wish to thank to Prof. Dr. Gabriele E. Schaumann for
her warm attitude and help. I wish to thank to Assoc. Prof. Dr. Pellegrino Conte for his help,
support, and for showing me the beauty of NMR. I wish to thank to Dr. Anne E. Berns and to
Dr. Dörte Diehl for their help. I wish to thank also to Assoc. prof. Vladimír Velebný for providing
of hyaluronan samples. Last but not least I wish to thank to some former colleagues from Brno
University of Technology in the Czech Republic.
Table of contents
vi
TABLE OF CONTENTS
1 GENERAL INTRODUCTION 1
1.1 Polysaccharides 1
1.2 Classification of polysaccharides 1
1.2.1 Proteoglycans 1
1.2.2 Glycoproteins 3
1.2.3 Glycolipids 4
1.3 Polysaccharides structure 4
1.4 Important polysaccharides 5
1.4.1 Cellulose 5
1.4.2 Hemicellulose 6
1.4.3 Pectins 7
1.4.4 Starch 8
1.4.5 Glycogen 10
1.4.6 Dextran 10
1.4.7 Chitin 10
1.4.8 Hyaluronan 11
1.4.9 Heparin and Heparan sulfate 13
1.5 Intermolecular and intramolecular weak interactions in polysaccharides 15
1.5.1 Electrostatic weak interactions 16
1.5.2 Van der Walls forces 16
1.5.3 Dispersion (London) forces 17
1.5.4 Hydrogen bond 18
1.5.5 Hydrophobic interaction 20

Table of contents
vii
2 STATE OF THE ART 22
2.1 Hydration of polysaccharides 22
2.1.1 Thermal analysis 22
2.1.2 Nuclear magnetic resonance techniques 26
3 MAIN RESEARCH QUESTIONS 30
4 OVERVIEW OF RESULTS AND DISSCUSION 31
5 REFERENCES 38
6 LIST OF ABBREVIATION 49
APPENDIX 1 50
APPENDIX 2 57
APPENDIX 3 63
APPENDIX 4 71
APPENDIX 5 81
APPENDIX 6 88
7 PUBLICATIONS 108
8 CURRICULUM VITAE 110
Summary
viii
SUMMARY
The polysaccharide hydration phenomenon is nowadays the subject of intense research. The
interaction of native and modified polysaccharides and polysaccharides-based bioconjugates with
water has an important influence on their functional behaviour. Notwithstanding that the hydration
phenomenon has been studied for decades, there is still a lack of awareness about the influence of
hydration water on the polysaccharide´s structure and consequences for industrial or medicinal
applications.
The hydration of polysaccharides is often described by the existence of water layers differing in
their physical properties depending on the distance from the polysaccharide. Using the differential
scanning calorimetry (DSC) such water layers were categorized according their properties upon
cooling in hyaluronan (HYA, sodium salt of -1,4-linked units of -1,3-linked D-glucuronic acid
and N-acetyl-D-glucosamine), a model polysaccharide in the present work. The amount of
non-freezing water, i.e. water in close proximity of HYA chain which does not freeze et all, was
determined around 0.74gH2O/gHYA for HYA with molecular weight from 100 to 740kDa and
0.84gH2O/gHYA for molecular weight of 1390kDa. The amount of freezing-bound water, the water
pool which is affected by presence of HYA but freezes, was determined in the range from 0.74 to
2gH2O/gHYA. Above this value only non-freezing and bulk water are present since melting enthalpy
measured above this concentration reached the same value as for pure water. Since this approach
suffers from several experimental problems, a new approach, based on the evaporation enthalpy
determination, was suggested. The analysis of the evaporation enthalpies revealed an additional
process associated with apparent energy release taking part below the water content of
0.34gH2O/gHYA. Existence of this phenomenon was observed also for protonated form of HYA. The
existence of energy compensating process was confirmed with the Kissinger-Akahira-Sunose
method which allowed determination of actual water evaporation/desorption enthalpies in all
stages of the evaporation process. In fact, the apparent evaporation enthalpy value increased until
water content of 0.34gH2O/gHYA, and then dropped down to lower values which were, still higher
than the value of the pure water evaporation enthalpy. By the use of time domain nuclear magnetic
resonance (TD-NMR) technique it was revealed that this phenomenon is the plasticisation of
HYA. Further, it was revealed that the non-freezing water determined by the use of DSC consists
of two water fractions, i.e. 15% of water structurally integrated, interacting directly with polar
sites, and 85% of water structurally restricted, embedded in-between the HYA chains. The

Summary
ix
occurrence of plasticisation concentration close to equilibrium moisture content provided the
possibility to influence the HYA physical structure during the drying. In this way three samples of
native HYA, dried under various conditions were prepared and their physical properties were
analyzed. The samples differed in kinetics of rehydration, plasticisation concentration, glass
transitions, and morphology. The properties of water pool were studied in solutions of 10–25mg
HYA/mL as well. The fast filed cycling (FFC) NMR relaxometry showed the existence of three
water fractions which correlation times spanned from 10–6
to 10–10
seconds, progressively
decreasing in dependency on its distance from HYA chain. The formation of a weak and transient
intramolecular water bridge between HYA chains was observed.
It was shown that, unlike the inorganic electrolytes, polyelectrolytes hydration is a dynamic
process which reflects not only the technique used for the analysis, experimental conditions but
also the conformation of the polysaccharide and its “thermal” and “hydration” history. It was
demonstrated that some native polysaccharide structures can be easily modified by manipulation
of preparation conditions, giving fractions with specific physicochemical properties without
necessity of any chemical modification.

Zusammenfassung
x
ZUSAMMENFASSUNG
Die Wasseraufnahme von Polysacchariden wird derzeit intensiv erforscht. Wechselwirkungen
zwischen Wasser und herkömmlichen oder modifizierten Polysacchariden und Polysaccharid-
basierten Biokonjugaten bestimmen maßgeblich deren Funktionalität. Trotz intensiver Forschung
gibt es weiterhin eine Reihe offener Fragen darüber, wie Wasser die Struktur der Polysaccharide
beeinflusst und welche Konsequenzen das für ihre industrielle und medizinische Anwendung hat.
Die Wechselwirkungen zwischen Wasser und Polysacchariden werden oft durch
übereinanderliegende „Schichten“ von Wasser verbildlicht, dessen physikalische Eigenschaften
sich in Abhängigkeit vom Abstand zur Polysaccharid-Moleküloberfläche verändern. In der
vorliegenden Arbeit wurden solche „Wasserschichten“ in dem Modell–Polysaccharid Hyaluronan
(HYA), einem Natriumsalzsalz bestehend aus -1,4-Verknüpfungen der -1,3-verknüpften
D-Glucuronsäure und des N-Acetyl-D-Glucosamins, untersucht. Mithilfe der Dynamischen
Differenzkalorimetrie (engl.: Differential Scanning Calorimetry, DSC) können diese
Wasserschichten hinsichtlich ihres Gefrierverhaltens unterschieden werden. Bei HYA-
Molekülgewichten von 100 bis 740kDa betrug die Menge “nicht gefrierbaren” Wassers, d.h. von
Wasser in unmittelbarer Nähe der HYA Molekülketten, 0.74gH2O/gHYA und bei einem
Molekülgewicht von 139kDa betrug sie 0.84gH2O/gHYA. Die Menge von “gefrierbar gebundenem”
Wasser, also des Anteiles, der zwar noch vom HYA Molekül beeinflusst wird, aber trotzdem
gefrierbar ist, betrug zwischen 0.74 und 2gH2O/gHYA. Oberhalb dieses Wassergehaltes liegt nur
„nicht gefrierbares“ und „freies“ Wasser vor, da die Schmelzenthalpie bei höheren Wassergehalten
der von reinem Wasser entspricht. Die Charakterisierung der Wasserbindung durch die
Bestimmung von Schmelzenthalpien unterliegt experimentellen Einschränkungen. Daher wurde
ein neuer Ansatz basierend auf der Bestimmung von Verdampfungsenthalpien vorgeschlagen.
Verdampfungsenthalpien von HYA unterhalb eines Wassergehaltes von 0.34gH2O/gHYA wiesen auf
einen zusätzlichen möglicherweise exothermen Prozess hin, der auch in der protonierten Form des
HYA beobachtet werden konnte. Dieser Prozess wurde durch die Kissinger-Akahira-Sunose
Methode bestätigt, die Bestimmung der tatsächlichen Verdampfungs- und Desorptionsenthalpien
des Wassers in allen Stadien des Verdampfungsprozesses erlaubt. Tatsächlich nahm die scheinbare
Verdampfungsenthalpie bis zu einem Wassergehalt von 0.34gH2O/gHYA zu und sank dann wieder
zu niedrigeren Werten ab, die allerdings immer noch deutlich über der Verdampfungsenthalpie
von reinem Wasser lagen. Mithilfe von zeitlich aufgelöster Kernspinresonanz Technik (engl.:
Zusammenfassung
xi
Time Domain Nuclear Magnetic Resonance, TD-NMR) wurde gezeigt, dass es sich bei besagtem
Prozess um die Plastifizierung von HYA handelt. Außerdem konnte das mithilfe der DSC
bestimmte „nicht gefrierbare“ Wasser in zwei weitere Fraktionen unterteilt werden. Ein Anteil von
15% dieses Wassers tritt direkt in Wechselwirkung mit den polaren funktionellen Gruppen und
wird als „strukturell integriertes“ Wasser bezeichnet und ein Anteil von 85% ist zwischen HYA
Molekülketten eingebettet und wird als „strukturell eingeschränktes“ Wasser bezeichnet. Da der
Erweichungspunkt in der Nähe des Gleichgewichtswassergehalts liegt, bietet die er die
Möglichkeit, die physikalische Struktur von HYA durch Trocknung zu beeinflussen. Dafür
wurden drei Proben des ursprünglichen HYA unter unterschiedlichen Bedingungen getrocknet und
ihre physikalischen Eigenschaften untersucht. Die Proben unterschieden sich in der Kinetik der
erneuten Wasseraufnahme, im Glasübergangsverhalten und in ihrer Morphologie. Die
Eigenschaften der Wasserfraktionen wurden in Lösungen mit 10–25 mg HYA/mL bestimmt.
Feldzyklus-NMR (eng.: Fast-field-cycling FFC-NMR) Messungen zeigten drei Wasserfraktionen
die mit dem Abstand zur HYA Moleküloberfläche abnehmende Korrelationszeiten zwischen 10–6
bis 10–10
s aufwiesen. Außerdem wurde die Bildung schwacher relativ kurzlebiger Wasserbrücken
zwischen den HYA Molekülketten beobachtet.
Anders als für anorganische Elektrolyte, ist die Wasseraufnahme durch organische
Polyelektrolyte ein dynamischer Prozess, der nicht nur die Analysetechnik und die
experimentellen Bedingungen sondern auch die Konformation der Polyelektrolyte und deren
thermische und Wassergehalts-Vorgeschichte widerspiegelt. Dadurch können einige
Polysaccharidstrukturen nur durch Veränderung der Probenvorbereitung und ohne chemische
Modifikationen verändert und Produkte mit spezifischen physiko-chemischen Eigenschaften
gewonnen werden.
General introduction
1
1 GENERAL INTRODUCTION
1.1 Polysaccharides
Polysaccharides belong among the most important biopolymers present in living systems.
Therefore, the knowledge of their interaction with water and other (bio)molecules is of a great
importance. Despite water’s relatively simple molecular structure, liquid water exhibits unusual
thermodynamic behavior and some anomalous properties that differentiate it from other liquids.
For that reason the nature of liquid water, the water molecules organization and interactions have
attracted the interest of chemists for many years. It is well known that due to mutual affinity of
water molecules, they form specific structures which composition and physical properties are
affected by the presence of macromolecules e.g. polysaccharides which are hydrated (Dei and
Grassi, 2006). Hydration is also a crucial factor influencing the secondary structure and
consequently the mutual interactions of polysaccharides. In this way, the function of molecules
present in the living systems is controlled and regulated. Thus, the detailed knowledge on
hydration of polysaccharides might be helpful in their technological and pharmaceutical
applications such as hydrogels, drug delivery systems, and the tissue scaffolds research and design.
Polysaccharides have been proposed as the first biopolymers to have formed on the Earth
(Tolstoguzov, 2004). The majority of carbohydrates found in nature occur as polysaccharides.
Polysaccharides are large, high-molecular weight molecules containing more than 100
monosaccharide units, some have thousands of units. These macromolecules consist of
monosaccharide units linked together by the glycosidic bonds. Polysaccharides act mainly as the
food storage or structural materials. Polysaccharides differ from each other in the character of their
repeating monosaccharide units, in the length of their chains, in the types of glycosidic bonds
linking the units, and in the degree of branching. Besides the structural and storage
homopolysaccharides discussed below, in living systems there also exist the informational
carbohydrates. Those are covalently joined to a protein or a lipid to form a glycoconjugates which
are the biologically active supramolecules.
1.2 Classification of polysaccharides
1.2.1 Proteoglycans
Proteoglycans are macromolecules of the cell surface or the extracellular matrix in which one or
more glycosaminoglycan chains are joined covalently to a core protein. The glycosaminoglycan
General introduction
2
moiety commonly forms the greater fraction (by mass) of the proteoglycan molecule, dominates
the structure, and often it is the main site of biological activity. The biological activity of
proteoglycans is caused by the presence of the multiple binding sites. Further reason is the huge
amount opportunities for hydrogen bonding and electrostatic interactions with other proteins of the
cell surface or the extracellular matrix. Proteoglycans are major components of connective tissue
such as cartilage, in which they non-covalently interact with other proteoglycans, proteins, and
glycosaminoglycans (Iozzo and Murdoch, 1996; Nelson and Cox, 2004).
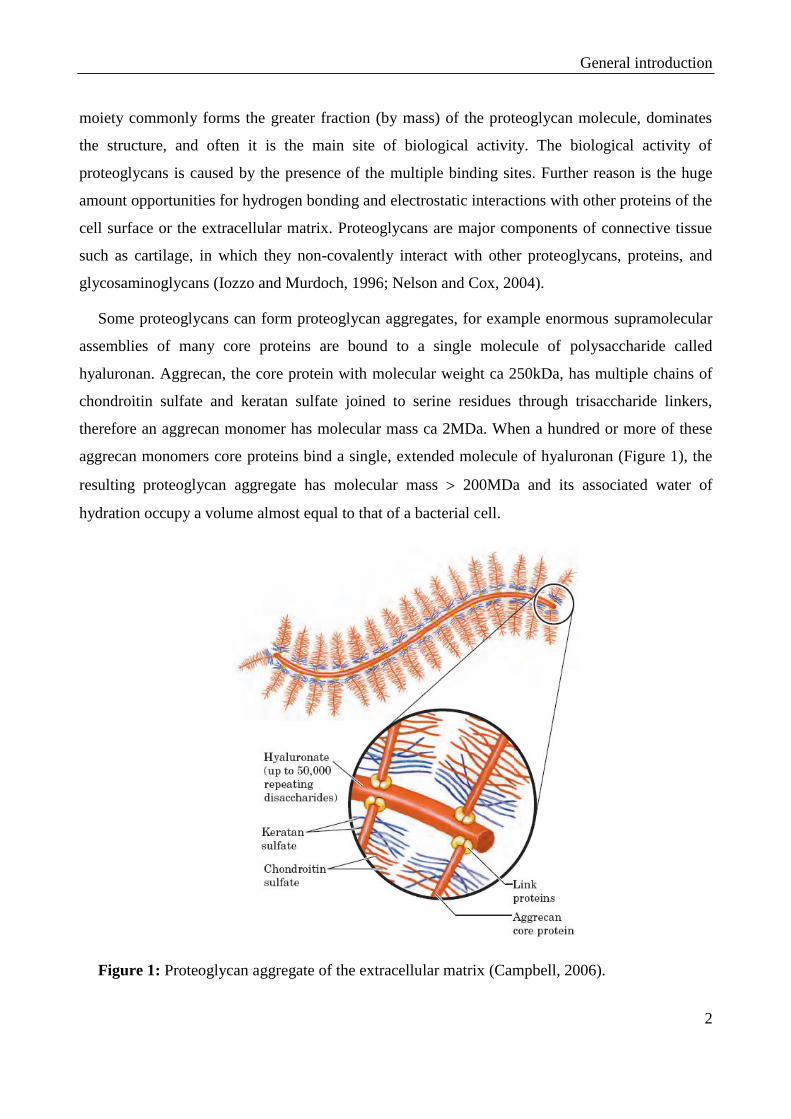
Some proteoglycans can form proteoglycan aggregates, for example enormous supramolecular
assemblies of many core proteins are bound to a single molecule of polysaccharide called
hyaluronan. Aggrecan, the core protein with molecular weight ca 250kDa, has multiple chains of
chondroitin sulfate and keratan sulfate joined to serine residues through trisaccharide linkers,
therefore an aggrecan monomer has molecular mass ca 2MDa. When a hundred or more of these
aggrecan monomers core proteins bind a single, extended molecule of hyaluronan (Figure 1), the
resulting proteoglycan aggregate has molecular mass 200MDa and its associated water of
hydration occupy a volume almost equal to that of a bacterial cell.
Figure 1: Proteoglycan aggregate of the extracellular matrix (Campbell, 2006).

General introduction
3
Table 1: Main repeating structures in the glycosaminoglycans (Mulloy and Forster, 2000).
Glycosaminoglycan Structure of main repeating dicaccharide
Hylauronan -4)--D-GlcA-(13)--D-GlcNAc-(1-
Chondroitin-4-sulfate -4)--D-GlcA-(13)--D-GalNAc4( )-(1-
Chondroitin-6-sulfate -4)--D-GlcA-(13)--D-GalNAc6( )-(1-
Dermatan sulfate -4)--L-IdoA-(13)--D-GalNAc4( )-(1-
Heparin -4)--L-IdoA2( )-(14)--D-GlcN
,6( )-(1-
Heparin sulfate -4)--D-GlcA-(14)--D-GlcNAc-(1-
Keratan sulfate -3)--D-Gal-(14)--D-GlcNAc6( )-(1-
Glycosaminoglycans (mucopolysaccharides) are linear polysaccharides with alternating uronic
acid and hexosamine residues, in which a limited set of monosaccharide units gives rise to a
number of complex sequences by variable substitution with O-sulfate, N-sulfate, and N-acetyl
groups. Glycosaminoglycans usually exist as the O-linked side-chains of proteoglycans and tend to
be negatively charged, because of the prevalence of acidic groups. The most common
glycosaminoglycans are reported in the Table 1 (Mulloy and Forster, 2000).
1.2.2 Glycoproteins
These macromolecules are complexes where carbohydrates are attached covalently to
asparagine or serine/threonine residues of peptides. In these carbohydrate-protein conjugates the
carbohydrate moieties are smaller and more structurally diverse than the glycosaminoglycans of
proteoglycans. One or several of these oligosaccharides, of varying complexity, are joined
covalently to a protein. Glycoproteins are found on the outer face of the plasma membrane, in the
extracellular matrix, and in the blood. One of the best-characterized membrane glycoproteins is
glycophorin A of the erythrocyte membrane which contains 60% of carbohydrates by mass, in the
form of 16 oligosaccharide chains covalently attached to amino acid residues located near the
amino terminus of the polypeptide chain. Inside cells they are found in specific organelles such as
Golgi complexes, secretory granules, and lysosomes. Oligosaccharide portions of glycoproteins
are rich in information, forming highly specific sites for recognition. With this respect, to the
group of glycoproteins belong the imunoglobulins (Nelson and Cox, 2004).
General introduction
4
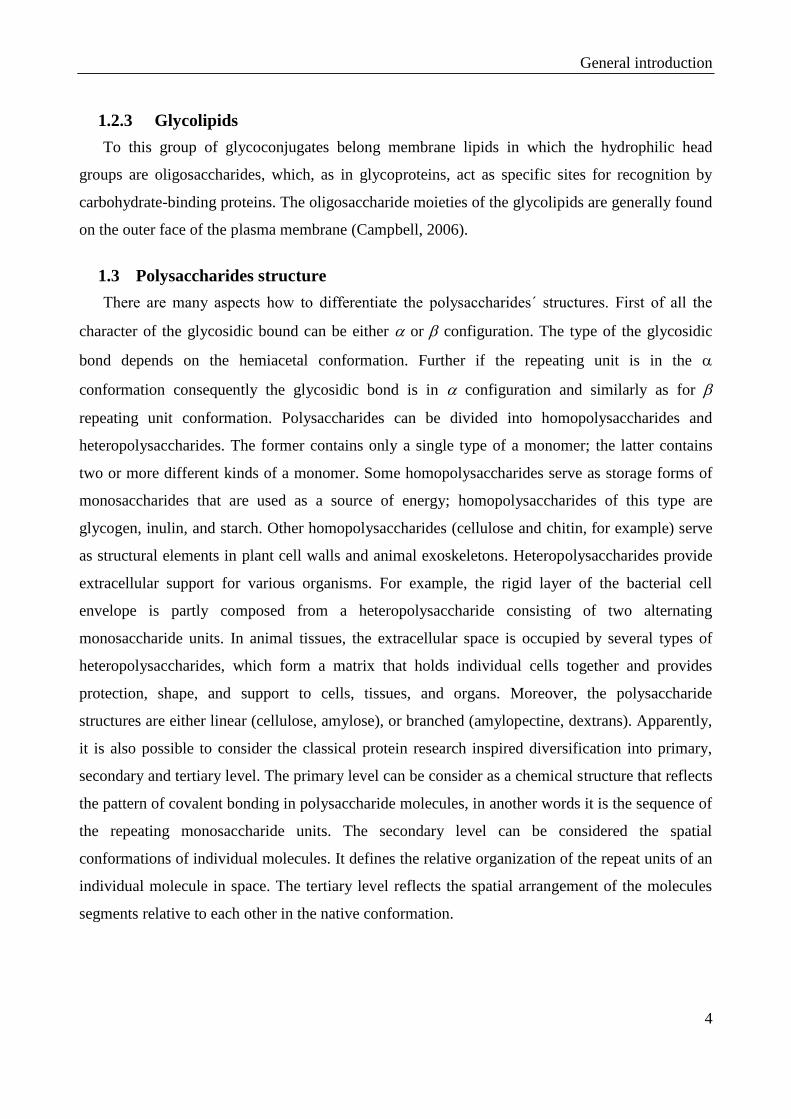
1.2.3 Glycolipids
To this group of glycoconjugates belong membrane lipids in which the hydrophilic head
groups are oligosaccharides, which, as in glycoproteins, act as specific sites for recognition by
carbohydrate-binding proteins. The oligosaccharide moieties of the glycolipids are generally found
on the outer face of the plasma membrane (Campbell, 2006).
1.3 Polysaccharides structure
There are many aspects how to differentiate the polysaccharides´ structures. First of all the
character of the glycosidic bound can be either or configuration. The type of the glycosidic
bond depends on the hemiacetal conformation. Further if the repeating unit is in the
conformation consequently the glycosidic bond is in configuration and similarly as for
repeating unit conformation. Polysaccharides can be divided into homopolysaccharides and
heteropolysaccharides. The former contains only a single type of a monomer; the latter contains
two or more different kinds of a monomer. Some homopolysaccharides serve as storage forms of
monosaccharides that are used as a source of energy; homopolysaccharides of this type are
glycogen, inulin, and starch. Other homopolysaccharides (cellulose and chitin, for example) serve
as structural elements in plant cell walls and animal exoskeletons. Heteropolysaccharides provide
extracellular support for various organisms. For example, the rigid layer of the bacterial cell
envelope is partly composed from a heteropolysaccharide consisting of two alternating
monosaccharide units. In animal tissues, the extracellular space is occupied by several types of
heteropolysaccharides, which form a matrix that holds individual cells together and provides
protection, shape, and support to cells, tissues, and organs. Moreover, the polysaccharide
structures are either linear (cellulose, amylose), or branched (amylopectine, dextrans). Apparently,
it is also possible to consider the classical protein research inspired diversification into primary,
secondary and tertiary level. The primary level can be consider as a chemical structure that reflects
the pattern of covalent bonding in polysaccharide molecules, in another words it is the sequence of
the repeating monosaccharide units. The secondary level can be considered the spatial
conformations of individual molecules. It defines the relative organization of the repeat units of an
individual molecule in space. The tertiary level reflects the spatial arrangement of the molecules
segments relative to each other in the native conformation.
General introduction
5
1.4 Important polysaccharides
Polysaccharides have wide range of roles, their function in living organisms is either storage- or
structure-related, the most important storage polysaccharides in plant cells are starch and inulin;
glycogen in the animal cells. Further the most important structural polysaccharides in plant are
cellulose, hemicellulose, pectins and chitin; in the vertebrates’ cells which are proteoglycans
where form the extracellular matrix, even the cartilages (i.e. special type of the connective tissue).
Polysaccharides are also information carriers: they serve as destination labels for some proteins
and as mediators of specific cell-cell interactions and interactions between cells and the
extracellular matrix. Specific carbohydrate-containing molecules act in cell-cell recognition and
adhesion, cell migration during development, blood clotting, the immune response, and wound
healing.
1.4.1 Cellulose
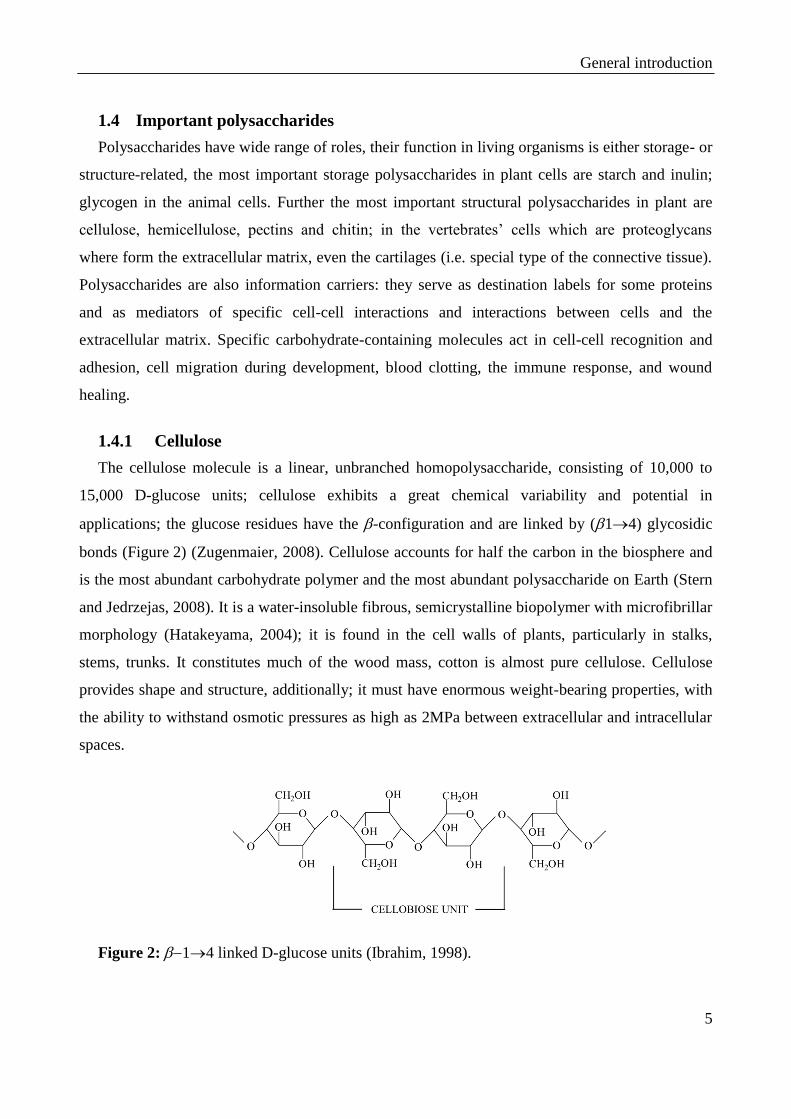
The cellulose molecule is a linear, unbranched homopolysaccharide, consisting of 10,000 to
15,000 D-glucose units; cellulose exhibits a great chemical variability and potential in
applications; the glucose residues have the -configuration and are linked by (14) glycosidic
bonds (Figure 2) (Zugenmaier, 2008). Cellulose accounts for half the carbon in the biosphere and
is the most abundant carbohydrate polymer and the most abundant polysaccharide on Earth (Stern
and Jedrzejas, 2008). It is a water-insoluble fibrous, semicrystalline biopolymer with microfibrillar
morphology (Hatakeyama, 2004); it is found in the cell walls of plants, particularly in stalks,
stems, trunks. It constitutes much of the wood mass, cotton is almost pure cellulose. Cellulose
provides shape and structure, additionally; it must have enormous weight-bearing properties, with
the ability to withstand osmotic pressures as high as 2MPa between extracellular and intracellular
spaces.
Figure 2: 14 linked D-glucose units (Ibrahim, 1998).
General introduction
6
The parallel chains of cellulose, lying in alternating perpendicular patterns (Voet, 2004), are
stabilized by the intermolecular hydrogen bonds between glucose units of the neighbouring chains.
Cellulose is present in the small, crystalline microfibrils that are arranged in the multilayer
structures. Although the cellulose molecules associate into crystals - the crystalline regions where
the water is excluded almost completely (Zhao et al., 2005) - a certain fraction of cellulose is
considered amorphous (Lewin, 2007). In the plant cell wall, the cellulose fibers are cross-linked by
a number of polysaccharides containing glucose and other saccharides (Stern and Jedrzejas, 2008).
Cellulose has four polymorphs: cellulose I, II, III, and IV. Cellulose I is the crystal form of the
native cellulose and has high degree of polymerization. Cellulose II is generally formed in the
regenerated cellulose or the mercerized cellulose. Cellulose III is prepared by the chemical
treatment. Cellulose IVI is prepared only from cellulose IIII. Cellulose IVII is obtained from both,
cellulose II and IIIII by the thermal treatment (Isogai et al., 1989). Recent crystallographic studies
of cellulose suggest that cellulose I consists of two kinds of crystals, Iα (triclinic) and Iβ
(monoclinic); α-cellulose is more abundant in nature than β-cellulose (Hatakeyama, 2004; Zhao et
al., 2005; Leppanen et al., 2009).
Cellulose is the major constituent of paper, paperboard, and card stock and of textiles made
from cotton, linen, and other plant fibers (Wakelyn, 2007). Because of its linear (14)-β-glucan
structure with three reactive hydroxyl groups per anhydroglucopyranose unit, cellulose has broad
potential in the design of advanced polymeric materials (Ifuku and Kadla, 2008). The purified
cellulose (about one third of the world`s production) is used as a base material for water-soluble
derivatives. Such cellulose derivatives can be designed with a wide range of properties depending
on functional groups involved in the derivation reaction (Clasen and Kulicke, 2001). Ester and
ether cellulose derivates are recently the most important commercial materials. Cellulose nitrate
and cellulose acetate are important derivatives for solid-state applications. In principle cellulosic
polymers are renewable resources (Clasen and Kulicke, 2001).
1.4.2 Hemicellulose
It is an extensive group of heteropolymers (matrix polysaccharides), which are embedded in the
cell walls of plants, sometimes in chains that form a ground matrix. They bind with pectin to
cellulose to form a network of cross-linked fibers. Hemicelluloses have a random, amorphous
structure which contains many different sugar monomers. They can be divided into four general
classes: xylans, mannans, -glucans with mixed linkages and xyloglucans (Sun et al., 1998). Xylan
General introduction
7
is a generic term used to describe a wide variety of highly complex polysaccharides that are found
in the plant cell walls and some algae. Xylans are heteropolymers possessing a (14)-D-
xylopyranoses backbone, which is branched by the short carbohydrate chains. They comprised
D-glucuronic acid or its 4-O-methyl ether, L-arabinose and/or various oligosaccharide, composed
of D-xyloses, L-arabinoses, D- or L-galactose and D-glucose. The xylan-type polysaccharides can
be divided into homoxylans and heterosylans, which include glucuronasylans,
(arabino)glucuronasylans, (glucurono)arabioxylans, arabionoxylans, and complex heteroxylans
(Heinze, 2005). Mannans are generally found in plants, bacteria and yeast. Mannans can be
divided into galactomannans and glucomannans. Whereas the backbone of the galactomannans is
made up exclusively of (14) linked D-mannopyranose residues in linear chains, the
glucomannans has both (14)-linked D-mannopyranose and (14)-linked
D-glucopyranose residues in the main chain. As single side chains, D-galactopyranose residues
tend to be 6-linked to the mannan backbone of both mannan-type polymers in different
proportions. The resulting polymers are named galactomannans and galactoglucomannans
(Heinze, 2005). -glucans occur most commonly in plants, in the bran of cereal grains, the cell
wall of bakers' yeast, certain fungi, mushrooms and bacteria. -glucans with mixed linkages are
composed of βD(13) and βD(14)-linked glucosyl residues. Typically there are regions of
25 βD(14)-linked residues separated by βD(13)-linkages. The βD(14)-linked residues
form rigid regions of the structure while the βD(13)-links are flexible (Sun et al., 1998).
Xyloglucan is the most abundant hemicellulose in the primary cell wall of many dicotyledonous
plants, and occurs in the primary cell walls of all vascular plants (Fry, 1989). Xyloglucan binds to
the surface of cellulose microfibrils and may link them together. Xyloglucan has a backbone of
β(14)-linked glucose residues most of which are substituted with 16 linked xylose sidechains.
The specific structure of xyloglucan varies among plant families (Heinze, 2005).
1.4.3 Pectins
Pectins are heterogeneous group of plant polysaccharides with a complex structure depending
on their source. Pectins are found in fruit and vegetables, and mainly prepared from “waste” citrus
peel and apple pomace. It makes up between about 2% and 35% of plant cell walls (Ovodov,
2009). Among all of plant cell polymers, pectins have the greatest number of functions. They
make up part of the cell wall, but they also make up a layer between adjacent cell walls, that is, the
middle lamella that binds cells together. Pectins also form complexes with many globular proteins
General introduction
8
(Tolstoguzov, 2004). Generally, pectins do not possess exact structures. The majority of the
structure consists of homopolymers of partially methylated poly-R-1,4-D-galacturonic acid
residues, but there are substantial non-gelling areas of alternating R-1,2- L rhamnosyl-R-1,4-D-
galacturonosyl sections containing branch points with mostly neutral side chains containing from 1
to 20 residues of mainly L-arabinose and D-galactose (Perez et al., 2000). Pectins are mainly used
as gelling agents, but can also act as thickener, water binder and stabilizer. Low methoxyl pectins
(< 50% esterified) form thermoreversible gels in the presence of calcium ions and at low pH,
whereas high methoxyl pectins rapidly form thermally irreversible gels in the presence of sucrose
and at low pH. Highly (2-O- and/or 3-O-galacturonic acid backbone) acetylated pectin from sugar
beet is reported to gel poorly but have considerable emulsification ability due to its more
hydrophobic nature (Dickinson, 2003).
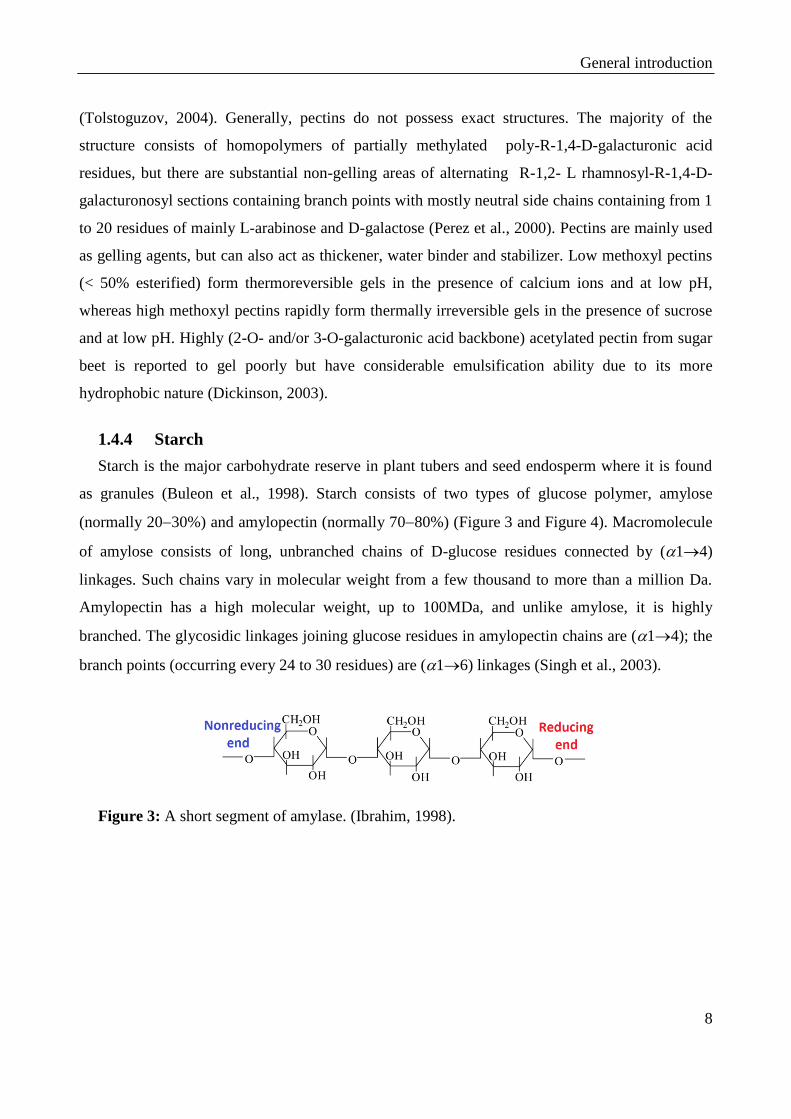
1.4.4 Starch
Starch is the major carbohydrate reserve in plant tubers and seed endosperm where it is found
as granules (Buleon et al., 1998). Starch consists of two types of glucose polymer, amylose
(normally 2030%) and amylopectin (normally 7080%) (Figure 3 and Figure 4). Macromolecule
of amylose consists of long, unbranched chains of D-glucose residues connected by (14)
linkages. Such chains vary in molecular weight from a few thousand to more than a million Da.
Amylopectin has a high molecular weight, up to 100MDa, and unlike amylose, it is highly
branched. The glycosidic linkages joining glucose residues in amylopectin chains are (14); the
branch points (occurring every 24 to 30 residues) are (16) linkages (Singh et al., 2003).
Figure 3: A short segment of amylase. (Ibrahim, 1998).

General introduction
9
Figure 4: Branched point (16) of amylopectine (Ibrahim, 1998).
Starch is an insoluble storage polysaccharide for plant cells and the main source of dietary
carbohydrates. It is deposited in the cytoplasm of plant cells in the form of insoluble starch
granules. Figure 5 represents the cluster of amylose and amylopectin as they are believed to occur
in the starch granules. Fibers of amylopectin form double helical structures with each other or with
amylose fibers (Nelson and Cox, 2004). Each granule typically containing several million
amylopectin molecules accompanied by a much larger number of smaller amylose molecules. By
far the largest source of starch is maize with other commonly used sources being wheat, potato,
tapioca and rice. (Jobling, 2004).
Figure 5: Cluster of amylose and amylopectine in the starch granules (Ibrahim, 1998).
General introduction
10
Starch is a versatile and cheap, and has many uses as thickener, water binder, emulsion
stabilizer and gelling agent. Many functional derivatives of starch are marketed including cross-
linked, oxidized, acetylated, hydroxypropylated and partially hydrolyzed material (Copeland et al.,
2009).
1.4.5 Glycogen
Glycogen is the energy storage in animal and fungi cells (Saladin, 2007). Similarly as
amylopectin, glycogen is a polymer of (14)-linked subunits of glucose, with (16)-linked
branches, but glycogen is more extensively branched (on average, every 8 to 12 residues) and
more compact than starch. Glycogen is especially abundant in the liver, where it may constitute as
much as 7% of the wet weight (Campbell, 2006); it is also present in skeletal muscle (Stern and
Jedrzejas, 2008). In hepatocytes, glycogen is found in large granules, created by the clusters from
smaller granules which are composed of single, highly branched glycogen molecules with an
average molecular weight of several million Da (Nelson and Cox, 2004).
1.4.6 Dextran
It is a group of bacterial and yeast complex branched polysaccharides made up of (16)-
linked poly-D-glucose; all have (13) branches, and some also have (12) or (14)
branches. The molecular weight is ranging from 10 to 150kDa. Dental plaque, formed by bacteria
growing on the surface of teeth, is rich in dextrans (Stern and Jedrzejas, 2008). Dextrans are used
medicinally as an antithrombotic, to reduce blood viscosity, and as a volume expander in anemia.
Synthetic dextrans are used in several commercial products that serve in the fractionation of
proteins by size exclusion chromatography. Dextrans in these products are chemically cross linked
to form insoluble materials of various porosities, admitting macromolecules of various sizes
(Lewis and 2008).
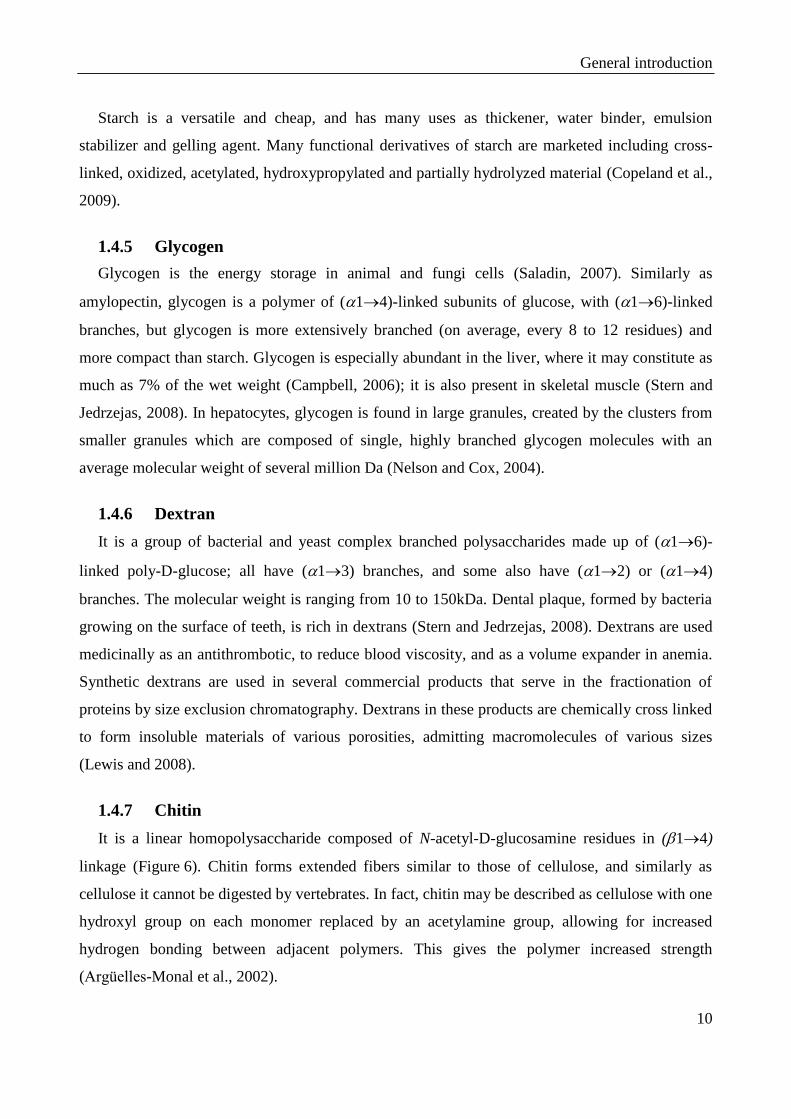
1.4.7 Chitin
It is a linear homopolysaccharide composed of N-acetyl-D-glucosamine residues in (14)
linkage (Figure 6). Chitin forms extended fibers similar to those of cellulose, and similarly as
cellulose it cannot be digested by vertebrates. In fact, chitin may be described as cellulose with one
hydroxyl group on each monomer replaced by an acetylamine group, allowing for increased
hydrogen bonding between adjacent polymers. This gives the polymer increased strength
(Argüelles-Monal et al., 2002).
General introduction
11
Figure 6: A short segment of chitin, a homopolymer of N-acetyl-D-glucosamine units in
(14) linkage (Ibrahim, 1998).
Chitin is the principal component of the hard exoskeletons of nearly a million species of
arthropods (e.g. insects, lobsters, and crabs) as well as being present in the cell walls of fungi and
many algae. In nature, it is probably the second most abundant polysaccharide, next to cellulose
(Campbell, 2006). Chitin is used industrially in many processes. It is used in water purification, as
an additive to thicken and stabilize foods, and in pharmaceuticals. It also acts as a binder in dyes,
fabrics, and adhesives. Industrial separation membranes and ion-exchange resins can be made
from chitin. Chitin's properties as a flexible and strong material make it favorable as surgical
thread. Its biodegradibility means it wears away with time as the wound heals. Moreover, chitin
has some unusual properties that accelerate healing of wounds in humans (Gupta et al., 2009). One
of the most known and rich in the application chitin´s derivate is chitosan; which is produced
commercially by deacetylation of the chitin. The degree of deacetylation in commercial chitosans
is in the range 60100%. In agriculture, chitosan is used primarily as a natural seed treatment and
plant growth enhancer, and as an ecologically friendly biopesticide substance that boosts the innate
ability of plants to defend themselves against fungal infections (Linden et al., 2000). Recently
chitosan was used in bandages and other haemostatic agents because of its properties rapidly clot
blood (Pusateri et al., 2003).
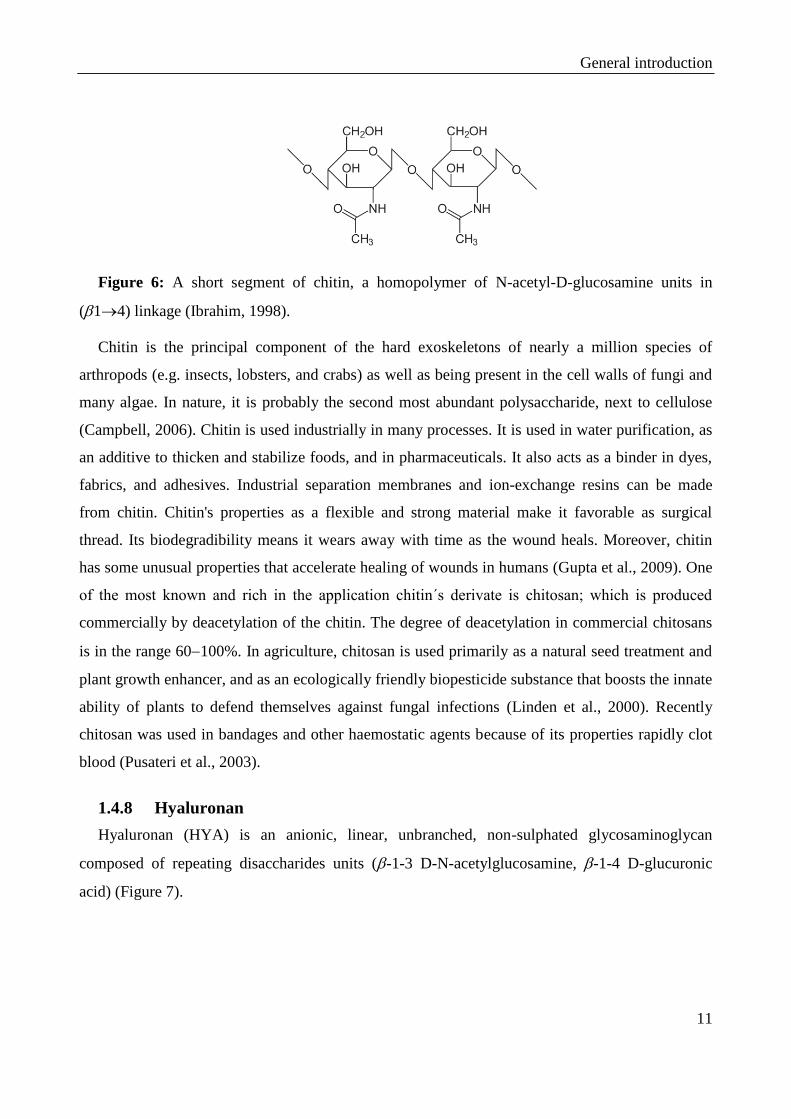
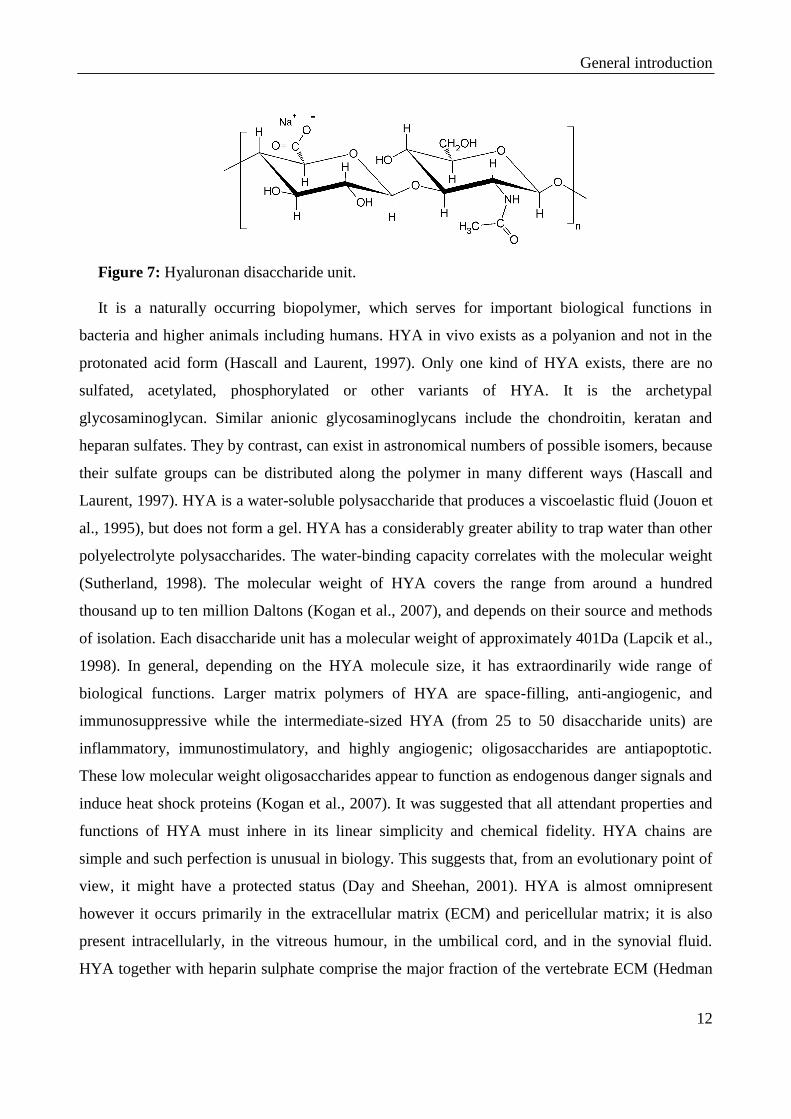
1.4.8 Hyaluronan
Hyaluronan (HYA) is an anionic, linear, unbranched, non-sulphated glycosaminoglycan
composed of repeating disaccharides units (-1-3 D-N-acetylglucosamine, -1-4 D-glucuronic
acid) (Figure 7).
General introduction
12
Figure 7: Hyaluronan disaccharide unit.
It is a naturally occurring biopolymer, which serves for important biological functions in
bacteria and higher animals including humans. HYA in vivo exists as a polyanion and not in the
protonated acid form (Hascall and Laurent, 1997). Only one kind of HYA exists, there are no
sulfated, acetylated, phosphorylated or other variants of HYA. It is the archetypal
glycosaminoglycan. Similar anionic glycosaminoglycans include the chondroitin, keratan and
heparan sulfates. They by contrast, can exist in astronomical numbers of possible isomers, because
their sulfate groups can be distributed along the polymer in many different ways (Hascall and
Laurent, 1997). HYA is a water-soluble polysaccharide that produces a viscoelastic fluid (Jouon et
al., 1995), but does not form a gel. HYA has a considerably greater ability to trap water than other
polyelectrolyte polysaccharides. The water-binding capacity correlates with the molecular weight
(Sutherland, 1998). The molecular weight of HYA covers the range from around a hundred
thousand up to ten million Daltons (Kogan et al., 2007), and depends on their source and methods
of isolation. Each disaccharide unit has a molecular weight of approximately 401Da (Lapcik et al.,
1998). In general, depending on the HYA molecule size, it has extraordinarily wide range of
biological functions. Larger matrix polymers of HYA are space-filling, anti-angiogenic, and
immunosuppressive while the intermediate-sized HYA (from 25 to 50 disaccharide units) are
inflammatory, immunostimulatory, and highly angiogenic; oligosaccharides are antiapoptotic.
These low molecular weight oligosaccharides appear to function as endogenous danger signals and
induce heat shock proteins (Kogan et al., 2007). It was suggested that all attendant properties and
functions of HYA must inhere in its linear simplicity and chemical fidelity. HYA chains are
simple and such perfection is unusual in biology. This suggests that, from an evolutionary point of
view, it might have a protected status (Day and Sheehan, 2001). HYA is almost omnipresent
however it occurs primarily in the extracellular matrix (ECM) and pericellular matrix; it is also
present intracellularly, in the vitreous humour, in the umbilical cord, and in the synovial fluid.
HYA together with heparin sulphate comprise the major fraction of the vertebrate ECM (Hedman
General introduction
13
et al., 1979). Nuclear magnetic resonance confirmed the presence of extensive hydrogen-bonded
structure in solution, in which each disaccharide unit is twisted through 180 degrees compared
with those ahead and behind it in the chain. Two twists bring back the original orientation; thus
this structure is a two-fold helix. The computer simulation study suggested that water played an
important role in the structure stabilization (Scott et al., 1991). HYA is used in pharmacy,
cosmetics and plastic surgery. HYA plays an important role in wound healing; it regulates the rate
of epidermal proliferation and differentiation, both during the normal homeostasis in the skin as
well as after cutaneous injury (Maytin et al., 2004). It is involved in tumor progression - in some
cancers HYA’s level correlate well with malignancy - thus it is often used as a tumor marker. It
may also be used to monitor the progression of the disease. In clinical medicine HYA is used as a
marker for other diseases as rheumatoid arthritis or liver pathologies (Kogan et al., 2007). Because
of the HYA biocompatibility and biodegradability it is used as the biomaterial scaffold in the
tissue engineering. There are other medical applications of HYA for example in ophthalmology,
orthopedic surgery and rheumatology, otolaryngology, dermatology, cataract surgery, and
pharmacology (Garg and Hales, 2004). HYA is also an information-rich system, its specific size
fragments are informational because of the ability to interact with other cellular components (Stern
et al., 2006; Stern and Jedrzejas, 2008).
1.4.9 Heparin and Heparan sulfate
The glycosaminoglycans heparin and heparan sulfate contain similar structural units in varying
proportions providing considerable diversity in sequence and biological function. Both compounds
are alternating copolymers of glucosamine with both iduronate- and glucoronate-containing
sequences bearing N-sulfate, N-acetyl, and O-sulfate substitution (Mulloy and Forster, 2000;
Nelson and Cox, 2004; Stern and Jedrzejas, 2008) (see Table 2).
Heparin is highly-sulfated glycosaminoglycan, with an average of 2.5 sulfates per disaccharide
unit; it has the highest negative charge density of any known biological molecule (Cox and
Nelson, 2004). Native heparin has molecular weight ranging from 3kDa to 50kDa (Mulloy and
Forster, 2000). The main repeat unit of heparin structurally resembles the protein binding
sequences in heparan sulfate, but contains higher percentage of sulfated residues. Unlike all other
glycosaminoglycans, heparin is not associated with connective tissues or the ECM but is found in
granules of mast cells in the mammalian tissues. When released into the blood, it inhibits clot
formation by interacting with the protein antithrombin. Hence this glycosamonoglycan is also
General introduction
14
utilized therapeutically as an anticoagulatiant. Heparin has an extended helical conformation.
Charge repulsion by many negatively charged groups may contribute to this conformation. The
glycosidic linkages in heparin appear relatively stiff. Heparin serves as a useful model for heparan
sulfate (Humphries et al., 1999). Heparin sulfate has exactly the same component disaccharides as
heparin but in different and very much more variable proportions. The unsulfated GlcA-GlcNAc
sequence is the most common, with shorter IdoA-containing, sulfated S-regions (Lyon and
Gallagher, 1998) of two to nine disaccharides separated on average by sixteen to eighteen mixed
or N-acetylated disaccharides. It is often found embedded in cell membranes and, despite its name,
is less sulfated than heparin. Further the heparin sulfate family of proteoglycans includes the
syndecans (Carey, 1997), perlecans (Iozzo, 1998), glypicans (Filmus, 2001), and betaglycans
(Cheifetz and Massague, 1989).

General introduction
15
Table 2: The most common heparin and heparan sulfate disaccharides.
GlcA-GlcNAc IdoA(2S)-GlcNS
IdoA-GlcNS IdoA(2S)- GlcNS(6S)
GlcA-GlcNS IdoA-GlcNS(6S)
1.5 Intermolecular and intramolecular weak interactions in polysaccharides
Intermolecular interactions are as important in physics as in chemistry and the molecular
biology. Weak interactions are responsible for the existence of liquids and solids in nature;
determine the physical and chemical properties of gases, liquids and crystals, the stability of the
chemical complexes, and the biological compounds. In the absence of intermolecular interactions
our world would be a uniform ideal gas (Moore and Spencer, 2001). Certain structural
characteristics such as chain conformation and intermolecular associations will influence the
General introduction
16
physicochemical properties of polysaccharides. The native folding of polysaccharides in three
dimensions follows the same principles as that governing polypeptide structure. The subunits with
a more-or-less rigid structure form three-dimensional macromolecular structures that are stabilized
by the weak interactions within or between the molecules. Common weak interactions are
hydrogen bond, hydrophobic, and van der Waals interactions, and, for polymers with charged
subunits, electrostatic interactions (Israelachvili, 1997). Because the polysaccharides have many
hydroxyl groups, extensive hydrogen bonding has an especially important influence on their
structure (Scott et al., 1991). Weak interactions are indistinctly classified and different authors use
different subdivision. Here the most important weak interactions playing role in the polysaccharide
stabilization and hydration are mentioned.
1.5.1 Electrostatic weak interactions
Electrostatic forces are in principle the classical Coulombic interactions between two charges.
These interactions are the strongest of the physical forces - stronger even than some chemical
binding forces (Israelachvili, 1997). Electrostatic interactions are strictly pair wise additive, highly
anisotropic, and can be either repulsive or attractive (Moore and Spencer, 2001).
1.5.2 Van der Walls forces
The distortions of a molecule’s charge distribution induced by the electric field of all the other
molecules leads to induction forces that are always attractive and highly non-additive. These
forces occur between the molecules of nonpolar covalent substances such as H2, Cl2, and noble
gases. These forces are generally believed to be caused by a temporary dipole, or unequal charge
distribution, as electrons constantly move about in an atom, ion, or molecule. At a given instant,
more electrons may be in one region than in another region. The temporary dipole induces a
similar temporary dipole on a nearby atom, ion, or molecule. Every instant, billions of these
temporary dipoles form, break apart, and reform to act as weak electrostatic attractive van der
Waals forces. It is important to note that van der Waals forces exist between all kinds of
molecules. They are non-directional and hence posses only limited scope in the design of specific
hosts for selective complexation of particular guests. Some molecules may have these forces, as
well as other intermolecular forces. Van der Waals forces, however, are the only intermolecular
bonds between nonpolar covalent molecules such as H2, Cl2, noble gases, and CH4. The number of
electrons in a substance increases as molecular mass (grams per mole of compound) increases.
Therefore, the strength of the van der Waals forces between substances increases with increasing
General introduction
17
molecular mass (Israelachvili, 1997; Brutschy and Hobza, 2000; Steed and Atwood, 2000; Moore
and Spencer, 2001).
1.5.3 Dispersion (London) forces
The origin of this name i.e. dispersion forces, has to do with their relation to the dispersion of
light in the visible and UV regions of the spectrum (Israelachvili, 1997). Dispersion interactions
are always present, even between S-state atoms such as neon and krypton, carbon dioxide, and
hydrocarbons. Although there are no electrostatic or induction interaction terms since all the
multipole moments of both species are zero. Therefore the dispersion forces are the attractive
component that results from the interactions between fluctuating multipoles (quadrupole, octupole
etc.) in adjacent molecules. Dispersion forces play a role in a lot of important phenomena such as
adhesion, surface tension, physical adsorption, wetting, the properties of gases, liquids, and thin
films, the strengths of solids, the flocculation of particles in liquids, and the structures of
condensed macromolecules such as proteins and polymers (Steed and Atwood, 2000). Dispersion
forces are quantum mechanical in origin and can be described by quantum electrodynamics. Their
origin may be understood intuitively as follows: consider the electronic charge cloud of an atom to
be the time average of the motion of its electrons around the nucleus. The average cloud is
spherically symmetric with respect to the nucleus, but at any instant of time there may be a
polarization of charge giving rise to an instantaneous dipole moment. This instantaneous dipole
induces a corresponding instantaneous dipole in the other atom and there is an interaction between
the instantaneous dipoles. The dipole of either atom averages to zero over time, but the interaction
energy does not because the instantaneous and induced dipoles are correlated and they stay in
phase. Higher-order instantaneous multipole moments are also involved, giving rise to higher
order dispersion terms. Dispersion forces are always present (Israelachvili, 1997). They are long-
range forces and, depending on the situation, can be effective from large distances (greater than
10nm) down to interatomic spacing (about 0.2nm). Dispersion forces may be repulsive or
attractive, and in general the dispersion force between two molecules or large particles does not
follow a simple power law. Dispersion forces not only bring molecules together but also tend to
mutually align or orient them. Further the dispersion forces are not additive; that is the force
between two bodies is affected by the presence of other bodies nearby (Moore and Spencer, 2001).
General introduction
18
1.5.4 Hydrogen bond
The hydrogen bond (Pauling, 1931) fundamental importance lies in its role in molecular
associations. Its functional importance stems from both thermodynamic and kinetic reasons. The
hydrogen bond is able to control and direct the structures of molecular assemblies because it is
sufficiently strong and sufficiently directional (Desiraju and Steiner, 1999). The hydrogen bond
plays a key role in chemistry, physics, and biology and its consequences are enormous. Hydrogen
bonds are responsible for the structure and properties of water, an essential compound for life, as a
solvent and in its various phases. Further, hydrogen bonds also play a key role in determining the
shapes, properties, and functions of biomolecules (Scheiner, 1997; Desiraju and Steiner, 1999;
Jeffrey, 2007).
The hydrogen bond is a non-covalent bond (attractive interaction) between the electron-
deficient hydrogen and a region of high electron density (Hobza and Havlas, 2002). Most
frequently, the hydrogen bond is of the X–H...Y type, where X is the electronegative element and
Y is the place with the excess of electrons (e.g. lone electron pairs or electrons). Hydrogen bonds
having X,Y = F, O, and N are the most frequent and best studied (Scheiner, 1997; Desiraju and
Steiner, 1999; Jeffrey, 2007). The X–H... hydrogen bonds (for X = O and C) were also detected
(Pribble et al., 1995; Djafari et al., 1997). The X–H...Y hydrogen bond stretches and correlates
with the strength of the hydrogen bond. In the course of the X–H...Y type hydrogen bond
formation the small amount of electron density (0.01–0.03e) is transferred from the proton-
acceptor (Y) to the proton-donor molecule (X–H) (Hobza and Havlas, 2002). There are also
hydrogen bonding interactions involving hydrogen atoms attached to carbon, rather than
electronegative atoms such as N and O while these interactions are at the weaker end of the energy
scale of hydrogen bonds, the presence of electronegative atoms near the carbon can enhance
significantly the acidity of the C–H proton, resulting in a significant dipole. An elegant example of
C–H…N and C–H…O hydrogen bonds is the interaction of the methyl group of nitromethane with
the pyridyl crown ether (Steed and Atwood, 2000). The presence of the hydrogen bonds influences
for example the Fourier transform infra-red spectra; this phenomenon is known as the red shift, the
significance of this phenomenon correlates with the hydrogen bond strength (Hobza and Havlas,
2002). Hydrogen bond may be regarded as a particular kind of dipole-dipole interactions in which
a hydrogen atom attached to an electronegative atom is attracted to a neighboring dipole on an
adjacent molecule or functional group (Steed and Atwood, 2000). Hydrogen bonds come in an
amazing range of lengths, strengths and geometries. The length of hydrogen bonds depends on
General introduction
19
bond strength, temperature, and pressure. The bond strength itself is dependent on temperature,
pressure, bond angle, and environment (usually characterized by local relative permittivity). The
typical length of a hydrogen bond in water is 197pm (Legon and Millen, 1987).
Besides the intermolecular interactions of carbohydrates are dominated by extensive and
cooperative O–HO hydrogen bond networks and C–HO hydrogen bonds are also formed in
large numbers. The basic units of polysaccharides (i.e. monosaccharide) are well suited for
hydrogen bonding. For example half the atoms of -D-glucose can form strong hydrogen bonds
(five –OH groups and the ring O atom) and the rest are moderately activated C–H groups. Such a
molecular constitution leads to the formation of extended O–HO hydrogen bond networks,
which in general is a characteristic of all polysaccharides (Jeffrey and Saenger, 1991). In modified
saccharides, hydrogen bonding groups are introduced or removed, altering the overall hydrogen
bond properties. The simplest modification is a deletion of –OH groups leading to the
deoxysaccharides, such as in the 2-deoxyribose of DNA. In deoxysaccharides, the O/C ratio is
smaller than in the origin molecules and the average degree of C–H activation is lower. Some C–H
groups may even become more or less unactivated. In the aminosaccharides, one or more –OH
groups are replaced by amino or acetylamino groups. An important example is
N-acetylglucosamine, which is the monomer building block of chitin and it is also part of
hyaluronic acid disaccharide unit. Other common substituents are carboxylic acid functionalities,
which are often deprotonated in the organism so that the saccharide becomes an anion. All these
alterations to the strong hydrogen bonding groups also modify the characteristics of weak
hydrogen bonds occurring in the system.
Using the neutron diffraction studies (Jeffrey, 2007) (Jeffrey and Saenger, 1991) the geometries
of C–HO hydrogen bonds in polysaccharides have been described. Based on 395 different C–H
bonds in 30 crystal structures, it was found that about 34% of all C–H groups form intermolecular
contact to O atoms with d < 2.7Å and >90°. This high fraction is certainly associated with the
high density of acceptor atoms in the system. The shortest contact occurs in sucrose, with
d =2.27Å and =166°, and the bulk of distances d are longer than 2.4Å. This is clearly longer than
the typical distances d observed with more activated C–H groups, but still it is clear that
carbohydrates are rich in C–HO hydrogen bonds. These C–HO interactions, whatever their
precise roles may be, are restricted to exist in a dense network of much stronger O–HO
hydrogen bonds and their directionality is too weak to compete successfully. Most of the

General introduction
20
intermolecular C–HO geometries, though, are well within the bonding regime. Because there are
so many of these distorted but weakly bonding C–HO interaction, the sum of their enthalpic
contributions will be considerable and their omission is misleading (Desiraju and Steiner, 1999).
C–HO hydrogen bonds in polysaccharides can be assumed to have dominant functions if
there is a local lack of strong O–HO competitors. An important example is the hydrophobic
internal cavities of cycloamyloses. These cavities lack O–H donors and consequently, C–HO
hydrogen bonds often play significant roles in structure stabilization. Apart from weak host-guest
interactions, cycloamylose also form intramolecular C–HO hydrogen bonds. In native
cycloamyloses, the orientation of neighboring glucose units is systematically stabilized by the
interglucose hydrogen bond which is typical example of supportive C–HO hydrogen bond
(Desiraju and Steiner, 1999). Further in the case of cellulose where all the ring substituents are
equatorial it is roughly ruler shaped, with the hydroxyl groups at the edges. The faces are formed
by the axial ring H atoms and the O atoms O(4) and O(5) and are rather lipophilic in nature.
Cellulose is polymorphic, but a feature common to all the polymorphs is O–HO hydrogen
bonding between the edges of the molecules and stacking of the faces. This leads to layered
structures. In cellotetraose hemihydrate, a small molecule model for cellulose II, the molecules are
stacked in such a way that systematic hydrogen bonds C(3) –HO(4) and C(5) –HO(4) are
formed between the faces of molecules in adjacent layers (Gessler et al., 1995). The geometries of
these hydrogen bonds are close to ideal, with the parameters d, D and in the ranges 2.30–2.71Å,
3.38–3.73Å and 158–180°, respectively. The C–HO(4) hydrogen bonds are presumably
important in the fine-tuning of the stacking arrangement and it can be assumed that related
interactions are formed in polymeric cellulose II (Desiraju and Steiner, 1999).
1.5.5 Hydrophobic interaction
Hydrophobic interaction is closely related to the hydrophobic effect (Steed and Atwood, 2000).
In fact, it describes the unusually strong attraction between hydrophobic molecules or hydrophobic
molecular moieties in water. The hydrophobic interaction is an entropic phenomenon, which arises
primarily from the rearrangements of H-bonds configurations in the overlapping hydration zones
as two hydrophobic species approach (Israelachvili, 1997). These interactions have also significant
importance in the hydration of some polysaccharides or their parts because of the so called
hydrophobic hydration, which is related to the interactions of apolar sites and water. Due to the
small size of water molecules and flexibility of their spatial arrangement, an increase in the
General introduction
21
chemical potential of the solute is achieved. Additionally, strong temperature dependence in the
enthalpy of the system from exothermic at low temperatures to endothermic at high temperatures
is also attained. Further, larger negative entropy of mixing as compared to the formation of a
hypothetical ideal solution is obtained. The additional the decrease in the partial molar volume is
achieved because the hydrophobic molecules fit into cavities in the water network (Mikheev et al.,
2007). Due to the multiple van der Waals interactions between water and the hydrophobic species,
the hydrophobic hydration is accompanied by reduction in density and negative enthalpy change
which causes positive heat capacity change. Further, due to the increased order in the surrounding
water of the hydrophobic species the negative entropy change is achieved (Gutmann, 1991).

State of the art
22
2 STATE OF THE ART
2.1 Hydration of polysaccharides
It is generally taken as granted that water is essential for life. It is the simplest compound of the
two most common reactive elements, consisting of just two hydrogen atoms attached to a single
oxygen atom. Liquid water, however, is the most extraordinary substance. For example there are
sixteen polymorphic forms of ice and three amorphous (non-crystalline) phases of water
(Zheligovskaya and Malenkov, 2006). Even if water is that simple molecule, it is the most studied
material on Earth. Understanding the behavior of water molecules interacting with the
polysaccharides, or complex biological macromolecules in general, in aqueous solution has been a
subject of intense research for a long time (Sherman, 1983; Fringant et al., 1996; Liu and Yao,
2001; Chaplin, 2006; Hatakeyama et al., 2010). Nevertheless, there are plenty of questions to be
answered concerning this issue. In fact, the internal structure, phase transitions, and generally the
physico-chemical properties of polysaccharides are affected by water molecules present in their
structure. Hydration is a general term concerning the amount of water molecules affected by the
polysaccharide presence, those water molecules are known as the hydration shell(s). In these water
hydration shells the hydrogen bond network is locally disrupted and differs more or less
significantly from those in the bulk water. There are number of approaches to describe and
quantify hydration shells and affected water molecules, but in this work only some of them are
mentioned. Therefore the bibliographic research is not comprehensive, but the main goal is to
summarize the most important facts and studies which have been published regarding the
polysaccharide hydration. Most of the analytical techniques applied to study hydration of
polysaccharides have either intrinsic or practical limitations. Therefore, a combination of
techniques is necessary. For this reason, in this work, the attempt is paid to combine and discuss
the application of two apparently different methods such as thermal analysis and nuclear magnetic
resonance (NMR) relaxometry, and bring more complex view on aspects of the polysaccharide
hydration.
2.1.1 Thermal analysis
One of the simplest thermoanalytical approaches to study the polysaccharide hydration defines
the hydration shells water as “non-bulk” water. Non-bulk water can be divided into “bound water”,
subcategorized as being capable of freezing or not (Wolfe et al., 2002). “Unbound water” freezes
at the same temperature as normal water (less than 0°C depends on the cooling rate). However

State of the art
23
some water may take up to 24 hours to freeze since crystallization is a kinetic phenomenon.
“Bound freezable water” freezes at lower temperature than normal water, being easily
supercooled. It also exhibits a reduced enthalpy of fusion (melting). The inability to freeze is often
used to determine the amount of bound water. Although freezing may not be a good measure of
hydration as it concerns also the water content which upon cooling occurs in the glassy state. In
the glassy state the conformational changes are severely inhibited and the material is metastably
trapped in a solid, but microscopically disordered state (amorphous phase). The segmental motion
of macromolecules occurs when the temperature increases through the glass transition
temperature. The glass transition temperature value depends fairly on the method of its
determination. The glass transition, unlike phase changes, occurs over a range of a few Kelvin.
The non-freezing water trapped in a glassy state lowers diffusion by several orders of magnitude
and hinders the crystal formation. In practical experience, the effects of water on polysaccharide
and polysaccharide on water are complex and become even more complex in the presence of other
materials, such as for example salts. Water competes for hydrogen bonding sites with
intramolecular and intermolecular hydrogen bonding and determines the polysaccharide’s
flexibility and the carbohydrate's preferred conformation(s) (Kirschner and Woods, 2001).
The most common thermoanalytical technique used in the hydration shells characterization is
Differential Scanning Calorimetry (DSC); it is a technique in which the temperature or heat
capacity of the sample is monitored as a function of the chosen temperature regime (Brown, 2001;
Haines, 2002; Wunderlich, 2005). The DSC approach has been used by many research groups. In
general, all authors are using similar nomenclature and differentiation - the first order phase
transition of water fraction closely associated with the polymer matrix cannot be observed. Thus,
this fraction is called “non-freezing water”. Water associated with non-freezing water - which
exhibits melting/crystallization, shows considerable supercooling, and significantly smaller
enthalpy than the bulk water - is referred to as “freezing-bound water”. The sum of the freezing-
bound and non-freezing water fractions is the “bound water content”. It has been demonstrated that
the bound water content depends on the chemical and high-order structure of each biopolymer.
Water, which melting/crystallization temperature and enthalpy are not significantly different from
those of normal (bulk) water, is called “free water”. This approach was used for example to
investigate the interaction of hydrophilic polysaccharides with water by Hatakeyama and
Hatakeyama (1998) (Hatakeyama and Hatakeyama, 1998); further in the case of ionic and neutral
polysaccharides such as alginate (Fringant et al., 1996) (Nakamura et al., 1991); arabic gum
State of the art
24
(Phillips et al., 1996); and mono-, di-, and trivalent cations in polyelectrolytes alginic acid
(Hatakeyama et al., 1995); chitosan (Ostrowska-Czubenko and Gierszewska-Druzynska, 2009);
cellulose (Hatakeyama et al., 1987; Berthold et al., 1994; Takahashi et al., 2000; Hatakeyama et
al., 2007); lingo-cellulose (Berthold et al., 1996); polysaccharide gellan gum (Quinn et al., 1993);
hyaluronan (Joshi and Topp, 1992; Yoshida et al., 1992; Yoshida et al., 1992; Takigami et al.,
1993; Hatakeyama and Hatakeyama, 1998); hyaluronan derivative hylan (Takigami et al., 1993;
Takigami et al., 1995); starch (Yuryev et al., 1995); xanthan hydrogels (Quinn et al., 1994). All
above mentioned studies are using the same approach - simply after the melting peak integration in
the DSC record, the melting enthalpy of freezable water is obtained. This obtained enthalpy of
melting is normalized to the mass of the dry sample. Then the normalized enthalpy of melting is
plotted as a function of the respective water content. In this way, the linear dependency is obtained
and the x-intercept is equal to the non-freezing water content in the polysaccharide water system.
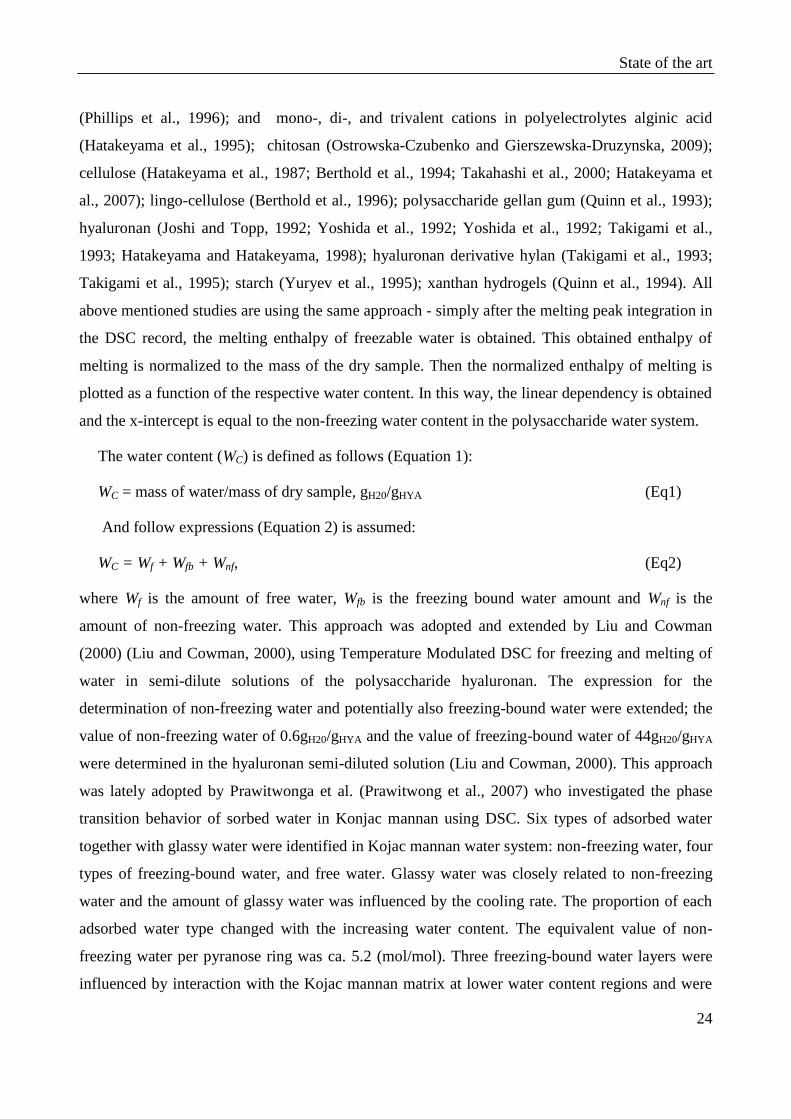
The water content (WC) is defined as follows (Equation 1):
WC = mass of water/mass of dry sample, gH20/gHYA (Eq1)
And follow expressions (Equation 2) is assumed:
WC = Wf + Wfb + Wnf, (Eq2)
where Wf is the amount of free water, Wfb is the freezing bound water amount and Wnf is the
amount of non-freezing water. This approach was adopted and extended by Liu and Cowman
(2000) (Liu and Cowman, 2000), using Temperature Modulated DSC for freezing and melting of
water in semi-dilute solutions of the polysaccharide hyaluronan. The expression for the
determination of non-freezing water and potentially also freezing-bound water were extended; the
value of non-freezing water of 0.6gH20/gHYA and the value of freezing-bound water of 44gH20/gHYA
were determined in the hyaluronan semi-diluted solution (Liu and Cowman, 2000). This approach
was lately adopted by Prawitwonga et al. (Prawitwong et al., 2007) who investigated the phase
transition behavior of sorbed water in Konjac mannan using DSC. Six types of adsorbed water
together with glassy water were identified in Kojac mannan water system: non-freezing water, four
types of freezing-bound water, and free water. Glassy water was closely related to non-freezing
water and the amount of glassy water was influenced by the cooling rate. The proportion of each
adsorbed water type changed with the increasing water content. The equivalent value of non-
freezing water per pyranose ring was ca. 5.2 (mol/mol). Three freezing-bound water layers were
influenced by interaction with the Kojac mannan matrix at lower water content regions and were
State of the art
25
transferred to free water in the high water content regions. The last freezing-bound water was
strongly bound water, maintaining interaction with Kojac mannan chains even in the high water
content region; the equivalent value of this freezing-bound water per pyranose ring was ca.
1.4 (mol/mol). Most of the adsorbed water in the system with high water content was held as free-
water-like behaviour.
The structure of the water molecules absorbed in different hydrophilic polymers was studied by
the means of DSC and Fourier transformed infra-red (FTIR) spectroscopy (Ping et al., 2001). In
that study Ping et al concluded that the average number of non-freezing water molecules per site
depends on the chemical nature of the polar site - ca. 1 water molecule for a hydroxyl, and 4.2
water molecules for an amide group. For a polymer with carboxylic site, the number of the water
molecules increase with increasing size of the counter-ion. It was concluded that the absorbed
water in hydrophilic polymer develops two types of hydrogen bounds. One of them corresponds to
water molecules directly attached to the active site of the polymer to form the first hydration layer
(non-freezing water). The second one corresponds to the water molecules in the second hydration
layer. It was observed that this second hydration layer is present in the polymer/water system even
at low water content. Meaning that the second hydration layer can be formed on certain sites
before all the polar sites are saturated with water molecules. Therefore Ping et al concluded that
non-freezing water did not consist exclusively of water molecules from the first hydration layer
(Ping et al., 2001).
Recently Hatakeyama et al. (Hatakeyama et al., 2010) concluded that the freezing bound water,
detected as cold crystallization in DSC heating curve, plays a crucial role in blood compatibility
and suggested that the presence of freezing bound water can be utilized as an index of
biocompatibility for polymers. Further, after comparing the data of equilibrium water content for
different biopolymers it was suggested that the amount of non-freezing water can be used as an
index of the hydrophilicity (Hatakeyama et al., 2010).
Lately, the cooling/thawing DSC approach was criticized by Gemmei-Ide et al.; the criticism
was mostly based on difference between the DSC and FTIR spectroscopy results. In this case
poly(n-butylacrylate) was used and hydrated by exposing to air with a constant relative humidity.
Authors stated that same part of water in hydrated sample cannot be in principle observed and
called it thermally latent water. The authors concluded that this water condensates and sublimates

State of the art
26
during the cooling and heating cycle respectively and the actual non-freezing water content is
much smaller, than estimated from traditional DSC approach (Gemmei-Ide et al., 2010).
Another thermoanalytical approach is based on the water vaporization. The advantage of this
approach is outflow of the phase transition temperature limitation. Vaporization of bound water
associated with cellulose fibres of natural (cellulose I) and regenerated cellulose (cellulose II) was
investigated using DSC in both dynamic and static conditions by Hatakeyama et al. It was found
that vaporization peak is split into two peaks; one occurs around 60°C and the other around 120°C.
The high temperature vaporization peak is related to the structural change of the cellulose
amorphous chains in the course of the bound water desorption (Hatakeyama et al., 2000). Lately,
the heat of water evaporation associated with cellulose fibers was studied using the traditional
(Park et al., 2007) and modulated DSC (Park et al., 2006). The samples were the wood cellulose
fibers at different moisture ratios. It was observed that the non-freezing bound water content was
constant for moisture ratios greater than 0.3 g/g and decreased with decreasing moisture ratio
below this value. This phenomenon demonstrates that freezing bound water is removed first during
the drying of cellulose fibers followed by non-freezing bound water. Analysis of the pore size
distribution confirms that below 0.3gH20/gCellulose moisture ratio only the non-freezing bound water
exists (with no freezing bound water remaining). Further by the use of temperature modulated
DSC, for wood cellulose fibers in the moisture ratio of 0.0–0.3gH20/gCellulose the steep increase in
the heat of vaporization was observed. This indicates that additional energy is required to
evaporate the water directly interacting with the cellulose fibres (non-freezing water). This
additional energy may be attributed to energy which is required to break the mono/multilayer
sorption of water molecules and also energy to overcome capillary forces in the porous geometry
of the cellulose fibers (Park et al., 2007).
2.1.2 Nuclear magnetic resonance techniques
NMR spectroscopy is an analytical technique based on the phenomenon of nuclear resonance,
which occurs when the nuclei are embedded in a static magnetic field and exposed to a second
oscillating magnetic field (i.e. radiofrequency pulses). The interaction between the magnetic fields
and matter produces spectra from which the structure and the conformation of organic and
inorganic materials can be achieved (Rabenstein and Guo, 1988). Although NMR spectroscopy is
very versatile for structural evaluation of organic compounds, it is not suitable for the study of the
hydration water in vicinity of polysaccharides. In fact, traditional NMR requires use of diluted

State of the art
27
solutions with deuterated solvents which prevent observation of water hydration shell.
Nevertheless, such information can be acquired from the relaxation character of the observed
system. In fact, if the sample is allowed to be undisturbed for a long time in the magnetic field, it
reaches a state of thermal equilibrium. It means that the spins populations are given by the
Boltzmann distribution at a given temperature. Obviously, radiofrequency pulses disturb the
equilibrium of the spin system. Spin populations after a pulse deviate from their thermal
equilibrium values and, in many cases, single-quantum coherences are created. Relaxation is the
process by which equilibrium is regained, through interaction of the spin system with the
molecular environment. There are two types of relaxation processes occurring simultaneously.
First, spin-lattice relaxation (longitudinal relaxation) is concerned with the movement of spin
populations back to their Boltzmann distribution values which in the case of spins ½ system
(nuclei as 1H,
13C,
15N etc) is characterized by spin-lattice relaxation time constant T1 and this
process has an enthalpic character. Second, spin–spin relaxation (transverse relaxation) is
concerned with the decay of single-quantum coherences which in spins ½ system is characterized
by transversal relaxation time constant T2 and on the other hand this process has an entropic
character (Levitt, 2007). To gain such knowledge about the observed system, essentially two types
of the NMR techniques can be applied. Rather long time known time domain (TD) NMR and, an
innovative NMR technique developed in the last decades, fast field cycling (FFC) NMR
relaxometry. Both techniques are using relatively low magnetic fields B0 (up to 1T) as compared
to the traditional NMR spectroscopy (up to approximately 23.5T). It is important to point out the
increasing of NMR signal sensitivity with increasing of applied magnetic field B0 and vice versa.
But notwithstanding the resolution-less of FFC-NMR relaxometry and TD-NMR, these techniques
do not require sample dilution and deuterated solvents, thereby allowing direct observation of
water hydration shells in water/polysaccharide solutions.
The TD-NMR has been used to study the proton transverse relaxation time T2 in water systems
with several polysaccharides such as dextran, schleroglucan, sodium -carrageenan, maltoheptose,
hydrolyzed starch, and amylase (Hills et al., 1991), sucrose and xylose (Hills et al., 2001), starch
(Le Botlan et al., 1998; Ritota et al., 2008) dextran sulfate, chondroitin sulfate, heparin, and
xanthan (Lusse and Arnold, 1998), hyaluronan (Barbucci et al., 2006), proten-polysacharide
(Ducel et al., 2008), starch (Hansen et al., 2009), methyl cellulose (Rachocki et al., 2006),
hydroxyehylcellulose and carboxymethylcellulose sodim salt (Capitani et al., 2003).
State of the art
28
While TD-NMR is operating at one proton Larmor frequency L, the FFC-NMR relaxometry
operates at extent range of frequencies from 10kHz up to 40MHz. As a result, dependence of T1
longitudinal relaxation time constants (or equivalently of relaxation rates R1=1/T1) as a function of
L is obtained which is also referred to as nuclear magnetic relaxation dispersion (NMRD)
(Redfield, 1957). Both techniques appear to be very sensitive to water molecules, because when
solute interacts with the solvent (water), mainly due to dipolar interactions, translation and
rotational motion of water molecules become slower and proportionally their relaxation time
constants decrease. And thus the information about the structure and dynamics of solvents in
proximity to solutes can be obtained (Kimmich and Anoardo, 2004).
In comparison to TD-NMR the advantage of FFC-NMR relaxometry is the possibility of
isolating typical relaxation features associated with molecular processes characterized by very long
correlation time c. In a liquid, the correlation time c corresponds to the rotational correlation time
of the molecules r (Levitt, 2007). The rotational correlation time is given by the average time
taken for the molecules to rotate by 1rad, thus depends on the molecule size. Generally, small
molecules have short rotational correlation times, whereas large molecules have long rotational
correlation times.
Majority of the FFC-NMR relaxometry studies have been done on protein-water system,
therefore also the nomenclature and derived theories are influenced by this fact. Indeed, in aqueous
biopolymer solutions there are at least four pools of protons to be considered: (i) protons of bulk or
weakly bound water molecules which is described by rotational correlation time c values of the
order of 10ps or less, (ii) “translationally-hindered water” characterized by c, in the nanosecond
time scale, (iii) irrotationally bound water with the c value comparable to that of the biopolymer
(from about 10μs to 10ns or less), and (iv) internal water buried inside the biopolymer with
residence times in the range 1ns–0.1ms (Dobies et al., 2009). Furthermore, other two pools of
proton can be define - exchangeable biopolymer protons and non exchangeable biopolymer
protons (Hills, 1992). However, recently, more general nomenclature for hydration water layers
was used - network water (NW) which is the water fractions closely associated with the polymer
matrix, further the intermediate water (IW) representing the water molecules which are not directly
interacting with the polymer and multimer water (MW) which resemble dynamics of pure water
(Matteini et al., 2009). Nevertheless, FFC-NMR relaxometry and TD-NMR are techniques that, in
general, do not allow easily distinguish between the different pools of protons, because each of

State of the art
29
them is contributing to the overall decay of the signal according to its relative intensity and
relaxation properties.
For NMRD profile evaluation, where the water proton relaxation is dominated by homonuclear
dipole-dipole interaction, multi-Lorentzian function can be used (Equation 3):
(Eq3)
Where L is proton-Larmor frequency [MHz], c is the correlation time [s] and A is relative
amplitude. The number of terms N that can be included in eq. 3 is determined by a Merit function
analysis, usually a sum of three Lorentzians is sufficient (Halle et al., 1998). On the other hand,
when TD-NMR decay curves are evaluated, simple multi-exponential decay function is used
(Equation 4).
(Eq4)
Where A is amplitude, t [s] is time and T2 [ms] is spin-spin relaxation time. Number of
components depends on statistical parameters like 2, standard error and R
2.
FFC-NMR relaxometry has been also used to extract the value of the hydration water
correlation times in systems such as bovine serum albumin (Zhou and Bryant, 1994; Calucci and
Forte, 2009), casein (Godefroy et al., 2003), bovine proteins (Van-Quynh et al., 2003) proteons
(Bertini et al., 2000; Luchinat and Parigi, 2008), protein bacteriorhodopsin (Gottschalk et al.,
2001), cyclic protein oxytocin and the globular protein BPTI (basic pancreatic trypsin inhibitor)
(Modig et al., 2003). Further this approach has been also used to extract the value of hydration
water correlation times in systems such as polysaccharide-protein conjugate vaccines (Berti et al.,
2004), agarose gel (Chavez et al., 2006) and human protein HC (Dobies et al., 2009).
Main research questions
30
3 MAIN RESEARCH QUESTIONS
Principal purpose of this work is to reveal the relationship between the hydration of
polysaccharides (by chosen representative hyaluronan) and their conformation, and possibly shed
more light on the mechanisms of their hydration and dehydration with respect to dynamics and
nature of their supramolecular arrangement. Thus the work in this thesis is centred on two main
tasks.
The first one is the hydration characteristics in terms of hydration shells quantification
and characterization in semi-diluted and diluted systems. The main question is how the
hydration influences the physical structure of the polysaccharide and what are the
properties of the water hydration shells in hyaluronan. The most widely applied
technique is DSC which has several limits associated for example with non-equlibrium
experimental conditions. The open question still is if those issues are crucial in
understanding of polysaccharide hydration and if results obtained with DSC are
comparable with other techniques using different principles and working under
equilibrium experimental conditions.
The second task is to understand and briefly test the hypothesis which comes out from
knowledge about the processes associated with dehydration (drying) of the semi-diluted
polysaccharide system. It is matter of fact that the supramolecular structures of
polysaccharides are significantly different in solid and liquid state. We assume that the
understanding of processes occurring in semi-solid or highly concentrated solutions
representing a border between solid and liquid state are crucial for designing of
“intelligent” structures in solid state. Those structures might be for example systems
with slower kinetics of hydration and dissolution which are traditionally accomplished
with a chemical modification of native polysaccharides.
Overview of results and disscusion
31
4 OVERVIEW OF RESULTS AND DISSCUSION
In this part an effort is paid to summarize and comment the data which have been either already
published or submitted in form of the scientific paper. The data are mostly dealing with the
hydration of hyaluronan which was chosen as a model polysaccharide because of its popularity,
importance, and unique physical properties. We assume that the obtained results and developed
approaches can help to understand the behaviour of other polysaccharides. In the first part, we
focused our attention on the DSC traditional approach (Liu and Cowman, 2000; Hatakeyama,
2004) useful for the study of hydration of (bio)polymers or small organic molecules. This
approach allows the categorization of hydrating and non-hydrating water into different classes
according to its physical properties. As it has already been mentioned, the first water fraction,
which is in intimate contact with HYA and does not freeze, is called “non-freezing water" (NFW).
Hypothetical next hydration layer is a water fraction associated with non-freezing water, this
hydration shell exhibits melting/crystallization, shows considerable supercooling, and significantly
smaller enthalpy than the bulk water and it is referred to as “freezing-bound water”. The third
fraction is free water which has properties resembling the bulk water. Last two water fractions can
be detected as ice crystallization or melting peaks on DSC record. (See part 2.1.1) After the
integration of the melting peak, the water melting enthalpy is obtained. That is first normalized
dividing by the mass of the dry HYA and then plotted against the respective water content -
WC (gH20/gHYA). In this way, the NFW content is determined from the x-intercept of the linear
dependency. It is worth mentioning that this approach is the only way how to compare all data,
obtained for different water contents. Other approaches of enthalpy normalization suggested by
other authors (Pekar, 2012), such as normalization to the water content would bring errors into the
calculations since the amount of freezable water is not known. Similar problem would appear if
obtained melting enthalpy would not be normalized; then the data would be biased by the fact that
the dry mass of HYA at different water contents is not constant and it is changing irregularly.
Using above-mentioned approach the amount of NFW, 0.8gH20/gHYA, was obtained (Appendix 1).
However, it is worth to mention that there are several factors that complicate the analysis and
interpretation of data obtained with the DSC cooling/thawing traditional approach, namely the
character of water which is the substance forming polymorphic and polyamorphic structures (Bai
and Zeng, 2012). Therefore the resulting structure of the ice formed during DSC experiment
depends on the way of the HYA solution and perhaps also on dry HYA preparation, water content
and experimental conditions such as cooling/heating programme. Those problems can be partially

Overview of results and disscusion
32
solved by the application of extremely slow cooling rate accompanied with very long isotherm
conducted at subambient conditions. However, as suggested by other authors (Wolfe et al., 2002),
such isothermal period can last for several days which is unsustainable from the experimental
point of view.
Therefore, in order to avoid problems with ice heterogeneity; we extended the traditional
approach by determination of the enthalpy of water evaporation from highly concentrated HYA
solutions. This approach has the only limitation caused by the high evaporation enthalpy of water
(2250Jg–1
). In other words, in the case of higher water content the amount of heat necessary for
water elimination can exceed the limits of the DSC instrument and give an experimental artefact.
However, in the present work this limit was out of the concentration area of interest. It was shown
(Appendix 1) that in the course of water evaporation from a HYA solution a linear dependency of
evaporation enthalpy normalized by dry mass was abruptly interrupted at WC=0.34gH20/gHYA. This
revealed that at this particular water content the evaporation from HYA is compensated by another
processes associated with heat release, which we assumed being the enthalpy associated with
formation of weak interactions in HYA supramolecular structure. Put simply, during the drying the
entropy of the system decreases, at the same time new interactions - resembling processes of
crystallization - were hypothesized being formed (for details see Appendix 1). In order to
understand the influence of the Na+ ions present in the hyaluronan structure on this process, the H
+
form of hyaluronan was tested as well and showed significant influence on its value, i.e. it was
detected at 0.84gH20/gHYA. The second factor influencing slightly the value of the linear
dependency interruption was the molecular weight of hyaluronan - approximately above 1MDa the
value slightly increased. The existence and value of the linear dependency interruption was
confirmed in other work (Appendix 2) when the enthalpy of evaporation/desorption was
determined at selected degrees of conversion for water evaporated from hyaluronan semi-diluted
solutions. For this purpose the Kissinger-Akahira-Sunose integral linear isoconversional method
was used. The subtraction of the baseline which was the enthalpy of evaporation of pure water
showed that such a compensation process is not strong enough to overbalance the enthalpy of
evaporation. This indicated that interaction between water and hyaluronan is stronger than between
two water molecules which explains the good solubility of hyaluronan in water but still does not
perfectly explain the character of presumed interactions. This issue was later investigated in
Appendix 6. The dynamic character of molecular motion observed during the drying let us to
conclusions that the way of HYA drying is crucial for the resulting HYA physical structure and
Overview of results and disscusion
33
physical-chemical properties such as for example stability, water holding capacity, and solubility.
Those assumptions are also tested in Appendix 6.
Further, the knowledge of the NFW content was used to determine the content of “freezable
water” (FW) in each sample by simple subtracting of NFW from total water content in the sample.
Than the enthalpy measured by DSC was divided by freezable water content. Finally the
dependence of freezable water melting enthalpy on the WC was obtained. It was observed that at
low WC, the melting enthalpy was significantly lower than the enthalpy of the ice (hexagonal)
formed by pure water (334Jg−1
). The value of pure water melting enthalpy was reached around
WC=2gH20/gHYA, for higher values of WC the value of water melting enthalpy stayed constant at
around 334 Jg−1
. The value of 334Jg−1
would indicate that from the point of view of DSC
measurement, in solutions with WC>2, there exist only two kinds of water structures; non-freezing
water (NFW) and freezable water (FW). This observation is in contrast to the results published by
Liu and Cowman (Liu and Cowman, 2000) who assumed the existence of the third water fraction -
“freezing-bound water” (FBW) as high as 44gH20/gHYA. Based on the results in Appendix 1 and 2,
we have suggested that instead of conventional one hydration number a range of hydration
numbers reflecting structural changes and dynamic conformational states of polysaccharides
should be used. The reason for the lower melting enthalpy of water in semi-diluted systems
(reported by some authors as freezing-bound water) can be explained by several factors. First, the
surface of HYA is rich in polar functionalities which influences the water mobility and thereby
hinder the formation of the “perfct” hexagonal ice crystals. Second, the presence of cavities and
pores in the hyaluronan dry structure can be the reason for the water restriction (see microscopy
Figures in Appendix 6). It is well known that the water structure in cavities changes its character
with respect to the cavity size, geometry, and wettability of its surface (Chaplin, 2010). Thus,
water distributed in different either separated or connected or both pores is assumed. The amount
of water in the pore is not always high enough to form nuclei for non-disturbed water
crystallization. When the critical mass of water in the sample is reached, the collapse of the pores
occurs, and the water from the pores is mixed with the bulk water as reported in Appendix 2. Thus
only two types of water (non-freezing water and bulk water) can be seen on the DSC record.
The hypothesis about the influence of pores and cavities on water properties was tested in the
study dealing with the hydration of acylated HYA derivatives (Appendix 3). The derivative was
prepared from the sodium salt HYA by acylation with the hexanoic anhydride in the dimethyl
sulfoxide/water mixture. Indeed, one of the HYA derivatives showed a second ice melting peak
Overview of results and disscusion
34
occurring at unusually high temperature range from 0 to 25°C. This observation was explained as
the presence of two types of domains (pores) in the acylated hyaluronan derivative, i.e. with either
hydrophilic or hydrophobic surfaces. In principle, the pore size, and wettability, influences the
physical properties of the encapsulated water which in turn causes anomaly high melting
temperature of the formed ice. It was reported that there exist two principally different ways of
water binding in HYA hydrophobicized derivative reflected by two different
crystallization/melting mechanisms. The first type of water binding resembles the ordinary
hydration of polar sites of HYA. Second type of water binding is probably associated with the
presence of confined water (Appendix 3). Nevertheless, the linear dependency of melting enthalpy
(obtained from the first melting peak) normalized by dry mass was observed again similarly as in
the case of native hyaluronan.
The cooling/thawing approach of hydration study was tested also on the other system which
completely differed from the polysaccharide/water system, i.e. on humic, and fulvic acids/water
systems (Appendix 4). Unlike other tested biopolymers, linear dependency of melting enthalpy on
water content was observed only in the case of hydrophilic fulvic acids while some of humic acids,
which are more hydrophobic, showed non-linear behaviour and other anomalies. In the latter case,
the step-like way increase of melting enthalpy with increasing water content was observed. Such
behaviour implied a preservation of original hydrophobic scaffold during the wetting and
consequent swelling, and hydration of the structure. However due to existence of one broad
melting peak it can be stated that the cavities are connected and not separated (unlike in the case of
hydrophobicized hyaluronan, Appendix 3). The progressive decrease in the ice melting enthalpy
revealed that the hydration of humic, and fulvic acids takes 21 days which is in contrast to
hyaluronan which took only several hours (Appendix 4).
The results obtained by methods of thermal analysis provided data obtained under non-
isothermal conditions. Depending on the experimental conditions, the hydration is a parameter
which reflects the adsorption of water on the surface of a biopolymer or its condensation in the
pores formed by a biopolymer. It is a matter of fact that during the hydration of HYA some
conformation changes occur and these changes are altering the HYA sorption capacity. Thus the
obtained hydration number cannot be related to the adsorption isotherm known from classical
experiments in which the stable surface, not changing during the sorption, is assumed. It should be
understood as a number reflecting the dynamic character of the conformation changes occurring in
the temperature range of the experiment. Therefore the use of a technique operating at ambient and

Overview of results and disscusion
35
isothermal conditions, such as nuclear magnetic resonance (NMR), was an appropriate choice.
Such a technique does not require extrapolation of observations made at temperatures far from the
point of interest as is often done in the case of methods of thermal analysis. Besides, it is well
known that the nuclear spin relaxation times - the spin-lattice relaxation time (T1) and the spin-spin
relaxation time (T2) - of hydrogen nuclei within water molecules are determined by the detailed
dynamics and chemical and physical environment of the water (Shapiro, 2011). Consequently, the
measurement of proton nuclear spin relaxation times provides information on polymer-water
interactions and water dynamics in such a system. Therefore, the time domain (TD-NMR) and fast
field cycling (FFC-NMR) techniques were used. TD-NMR was used to measure transversal (T2)
relaxation time in semi-diluted HYA/water system (Appendix 6) and FFC-NMR relaxometry
technique was used to study water dynamics and consequently the conformational properties of
HYA in diluted aqueous solutions (Appendix 5). The results reported in Appendix 5 revealed that,
irrespective of the solution concentration (i.e. 10–25mg L–1
), three different water proton pools
(hydration layers) surround HYA. Based on the determination of correlation times, the inner layer
consists of water molecules strongly retained in the proximity of the HYA surface. Due to their
strong interactions with HYA, water molecules in this inner hydration layer are subject to very
slow dynamics and have the largest correlation times. The other two hydration layers are made of
water molecules which are located progressively further from the HYA surface. As a result,
decreasing correlation times caused by faster molecular motion were measured. The NMR
dispersion (NMRD) profiles obtained by FFC-NMR relaxometry also showed peaks attributable to
1H-
14N quadrupole interactions. Changes in intensity and position of the quadrupolar peaks in the
NMRD profiles suggested that with increasing concentration the amido group is progressively
involved in the formation of weak and transient intramolecular water bridging adjacent HYA
chains (Appendix 5).
The aim of the last paper (Appendix 6) reported in this thesis was to test hypothesis developed
in previous papers and to test the consistency between TD-NMR and DSC results. First, it was
shown that DSC and TD-NMR provide comparable data. Further, by the use of TD-NMR, it was
find out that NFW content determined with DSC consists of two water pools which are distinct in
terms of relaxation rate. Second, the appearance of a new proton fraction indicated that this is the
water content corresponding to the plasticisation point of HYA and clarified the process observed
and discussed in Appendix 1 and Appendix 2. In fact, during the drying the glass transition
temperature shifts into the lower values because water acts as plasticizer in hydrophilic polymers.
Overview of results and disscusion
36
When the plasticisation point is reached the heat capacity of the system suddenly decreases which
causes the break in the dependence of evaporation enthalpy. As tested in other study, using other
polysaccharides, this is the only case of hyaluronan. Other polysaccharides such as chitosan,
schizophyllan, cellulose, and carboxymethyl cellulose do not show the plasticisation point in the
same concentration range as hyaluronan (Mlčoch and Kučerík, 2013).
Last, the hypothesis of the possibility to influence the physical structure of native hyaluronan
during drying in order to obtain unique structure of native polysaccharide suggested in Appendixes
1 and 2 was tested as well (Appendix 6). The motivation is to avoid any chemical modification of
native HYA in order to prepare a modified structure having adjustable properties such as wetting,
hydration kinetics, and dissolution using only native biopolymers. This might be achievable by
manipulation of weak interactions stabilizing the flexible and unique supramolecular structure of
HYA. In this study, HYA samples were prepared under three different drying conditions yielding
the original, the freeze-dried, and the oven-dried HYA sample. It was demonstrated that the
oven-dried sample has the fastest hydration kinetics whereas the HYA precipitated using
isopropylalcohol has the slowest hydration kinetics. Based on the glass transition temperature, it
was observed that the sample prepared by freeze-drying was the most rigid while the oven-dried
sample had the lowest amorphous fraction. Hence it was demonstrated that the supramolecular
structure of native HYA is easily modifiable by drying conditions. It was also found out that
non-freezing water fraction determined with DSC can be determined also using TD-NMR. Last
but not least, by using TD-NMR it is possible to determine the hydration kinetics of HYA and also
to determine the water content of an HYA sample that corresponds to the glass-to-rubbery-state
transition which is a measure of the rigidity of a system.
The biocompatible and biodegradable character of polysaccharides, associated with the
presence of specific interaction sites in their structure, make them very attractive for modification,
especially for the use in the pharmaceutical industry. Nevertheless, past efforts to develop
techniques to reprocess polysaccharides have addressed mainly the hydration problem and gave
little attention to how much the native structure is compromised or physically changed.
Understanding how polysaccharides interact with themselves, each other, and with water in semi-
diluted systems is of great importance as it determines its final structure and physical properties. In
this thesis, it was demonstrated that DSC, FFC-NMR, and TD-NMR are complementary and
highly suitable techniques in terms of gaining such knowledge.
Overview of results and disscusion
37
It is worth mentioning that the terminology as “hydration shell” or “hydration layer” might be
misleading. As emerged from this thesis, hydration of polysaccharides cannot be understood as
water absorption layer by layer. Instead it should be seen more as water sorption on
polysaccharide-specific sites (e.g. hydroxyl or amido functionalities) mainly in pores (according to
Kelvin and Young-Laplace equations). In the second step the water is clustering around the sorbed
water molecules as suggested also by other researchers (Despond et al., 2005).
References
38
5 REFERENCES
Argüelles-Monal, W., F. M. Goycoolea, J. Lizardi, C. Peniche and I. Higuera-Ciapara (2002).
Chitin and Chitosan in Gel Network Systems. Polymer Gels 7: 102 - 121.
Bai, J. and X. C. Zeng (2012). Polymorphism and polyamorphism in bilayer water confined to slit
nanopore under high pressure. Proceedings of the National Academy of Sciences of the United
States of America 109: 21240-5.
Barbucci, R., G. Leone, A. Chiumiento, M. E. Di Cocco, G. D'Orazio, R. Gianferri and M. Delfini
(2006). Low- and high-resolution nuclear magnetic resonance (NMR) characterisation of
hyaluronan-based native and sulfated hydrogels. Carbohydrate Research 341: 1848-1858.
Berthold, J., J. Desbrieres, M. Rinaudo and L. Salmen (1994). Types of adsorbed water in relation
to the ionic groups and their counterions for some cellulose derivatives. Polymer 35: 5729-5736.
Berthold, J., M. Rinaudo and L. Salmeń (1996). Association of water to polar groups; estimations
by an adsorption model for ligno-cellulosic materials. Colloids and Surfaces A: Physicochemical
and Engineering Aspects 112: 117-129.
Berti, F., P. Costantino, M. Fragai and C. Luchinat (2004). Water accessibility, aggregation, and
motional features of polysaccharide-protein conjugate vaccines. Biophysical Journal 86: 3-9.
Bertini, I., M. Fragai, C. Luchinat and G. Parigi (2000). H-1 NMRD profiles of diamagnetic
proteins: a model-free analysis. Magnetic Resonance in Chemistry 38: 543-550.
Brown, M. E. (2001). Introduction to Thermal Analysis: Techniques and Applications, Springer.
Brutschy, B. and P. Hobza (2000). van der Waals molecules III: Introduction. Chemical Reviews
100: 3861-3862.
Buleon, A., P. Colonna, V. Planchot and S. Ball (1998). Starch granules: structure and
biosynthesis. International Journal of Biological Macromolecules 23: 85-112.
Calucci, L. and C. Forte (2009). Proton longitudinal relaxation coupling in dynamically
heterogeneous soft systems. Progress in Nuclear Magnetic Resonance Spectroscopy 55: 296-323.
Campbell, N. A. B. W. R. J. H. (2006). Biology: Exploring Life. Boston, Massachusetts, Pearson
Prentice Hall.

References
39
Capitani, D., G. Mensitieri, F. Porro, N. Proietti and A. L. Segre (2003). NMR and calorimetric
investigation of water in a superabsorbing crosslinked network based on cellulose derivatives.
Polymer 44: 6589-6598.
Carey, D. J. (1997). Syndecans: Multifunctional cell-surface co-receptors. Biochemical Journal
327: 1-16.
Clasen, C. and W. M. Kulicke (2001). Determination of viscoelastic and rheo-optical material
functions of water-soluble cellulose derivatives. Progress in Polymer Science 26: 1839-1919.
Copeland, L., J. Blazek, H. Salman and M. C. M. Tang (2009). Form and functionality of starch.
Food Hydrocolloids 23: 1527-1534.
Cox, M. and D. Nelson (2004). Principles of Biochemistry, Lehninger Freeman.
Day, A. J. and J. K. Sheehan (2001). Hyaluronan: polysaccharide chaos to protein organisation.
Current Opinion in Structural Biology 11: 617-622.
Dei, L. and S. Grassi (2006). Peculiar properties of water as solute. Journal of Physical Chemistry
B 110: 12191-12197.
Desiraju, G. R. and T. Steiner (1999). The weak hydrogen bond. Oxford, Oxford University Press.
Despond, S., E. Espuche, N. Cartier and A. Domard (2005). Hydration mechanism of
polysaccharides: A comparative study. Journal of Polymer Science: Part B: Polymer physics 43:
48-58.
Dickinson, E. (2003). Hydrocolloids at interfaces and the influence on the properties of dispersed
systems. Food Hydrocolloids 17: 25-39.
Djafari, S., H. D. Barth, K. Buchhold and B. Brutschy (1997). Infrared-depletion spectroscopy
study on hydrogen-bonded fluorobenzene-methanol clusters. Journal of Chemical Physics 107:
10573-10581.
Dobies, M., M. Kozak, S. Jurga and A. Grubb (2009). The Dispersion of Water Proton Spin-
Lattice Relaxation Rates in Aqueous Human Protein HC (alpha(1)-Microglobulin) Solutions.
Protein and Peptide Letters 16: 1496-1503.
Ducel, V., D. Pouliquen, J. Richard and F. Boury (2008). 1H NMR relaxation studies of protein–
polysaccharide mixtures. International Journal of Biological Macromolecules 43: 359-366.
References
40
Filmus, J. (2001). Glypicans in growth control and cancer. Glycobiology 11: 19R-23R.
Fringant, C., J. Desbrieres, M. Milas, M. Rinaudo, C. Joly and M. Escoubes (1996).
Characterisation of sorbed water molecules on neutral and ionic polysaccharides. International
Journal of Biological Macromolecules 18: 281-286.
Fry, S. C. (1989). The Structure and Functions of Xyloglucan. Journal of Experimental Botany 40:
1-11.
Garg, H. G. and C. A. Hales (2004). Chemistry and Biology of Hyaluronan.
Gemmei-Ide, M., A. Ohya and H. Kitano (2010). Thermally Latent Water in a Polymer Matrix.
Journal of Physical Chemistry B 114: 4310-4312.
Gessler, K., N. Krauss, T. Steiner, C. Betzel, A. Sarko and W. Saenger (1995). Beta-D-
cellotetraose hemihydrate as a strucural model for cellulose. 2. An X-ray diffraction study Journal
of the American Chemical Society 117: 11397-11406.
Godefroy, S., J. P. Korb, L. K. Creamer, P. J. Watkinson and P. T. Callaghan (2003). Probing
protein hydration and aging of food materials by the magnetic field dependence of proton spin-
lattice relaxation times. Journal of Colloid and Interface Science 267: 337-342.
Gottschalk, M., N. A. Dencher and B. Halle (2001). Microsecond exchange of internal water
molecules in bacteriorhodopsin. Journal of Molecular Biology 311: 605-621.
Gupta, B., A. Arora, S. Saxena and M. S. Alam (2009). Preparation of chitosan–polyethylene
glycol coated cotton membranes for wound dressings: preparation and characterization. Polymers
for Advanced Technologies 20: 58-65.
Gutmann, V. (1991). Fundamental considerations about liquid water. Pure and Applied Chemistry
63: 1715-1724.
Haines, P. J. (2002). Principles of Thermal Analysis and Calorimetry, Royal Society of Chemistry.
Halle, B., H. Jóhannesson and K. Venu (1998). Model-Free Analysis of Stretched Relaxation
Dispersions. Journal of Magnetic Resonance 135: 1-13.
Hansen, M. R., A. Blennow, I. Farhat, L. Norgaard, S. Pedersen and S. B. Engelsen (2009).
Comparative NMR relaxometry of gels of amylomaltase-modified starch and gelatin. Food
Hydrocolloids 23: 2038-2048.
References
41
Hascall, V. and T. Laurent (1997). "Hyaluronan: structure and physical properties."
Glycoforum/Science of Hyaluronan Review Series. from:
http://www.glycoforum.gr.jp/science/hyaluronan/HA01/HA01E.html1997.
Hatakeyama, H. and T. Hatakeyama (1998). Interaction between water and hydrophilic polymers.
Thermochimica Acta 308: 3-22.
Hatakeyama, H., T. Onishi, T. Endo and T. Hatakeyama (2007). Gelation of chemically cross-
linked methylcellulose studied by DSC and AFM. Carbohydrate Polymers 69: 792-798.
Hatakeyama, T., H. Hatakeyama and K. Nakamura (1995). Non-freezing water content of mono-
and divalent cation salts of polyelectrolyte-water systems studied by DSC. Thermochimica Acta
253: 137-148.
Hatakeyama, T., Hatakeyama, H. (2004). Thermal Properties of Green Polymers and
Biocomposites.
Hatakeyama, T., K. Nakamura and H. Hatakeyama (2000). Vaporization of bound water
associated with cellulose fibres. Thermochimica Acta 352: 233-239.
Hatakeyama, T., M. Tanaka and H. Hatakeyama (2010). Studies on bound water restrained by
poly(2-methacryloyloxyethyl phosphorylcholine): Comparison with polysaccharide–water
systems. Acta Biomaterialia 6: 2077-2082.
Hatakeyama, T., H. Yoshida and H. Hatakeyama (1987). A differential scanning calorimetry study
of the phase transition of the water-sodium cellulose sulphate system. Polymer 28: 1282-1286.
Hedman, K., M. Kurkinen, K. Alitalo, A. Vaheri, S. Johansson and M. Hook (1979). Isolation of
the pericellular matrix of human fibroblast cultures. Journal of Cell Biology 81: 83-91.
Heinze, T. (2005). Polysaccharides I, Springer.
Hills, B. P. (1992). The proton-exchange corss-relaxation model of water relaxation in
biopolymers systems. Molecular Physics 76: 489-508.
Hills, B. P., C. Cano and P. S. Belton (1991). Proton NMR relaxation studies of aqueous
polysaccharide systems. Macromolecules 24: 2944-2950.
Hills, B. P., Y. L. Wang and H. R. Tang (2001). Molecular dynamics in concentrated sugar
solutions and glasses: an NMR field cycling study. Molecular Physics 99: 1679-1687.

References
42
Hobza, P. and Z. Havlas (2002). Improper, blue-shifting hydrogen bond. Theoretical Chemistry
Accounts 108: 325-334.
Humphries, D. E., G. W. Wong, D. S. Friend, M. F. Gurish, W. T. Qiu, C. F. Huang, A. H. Sharpe
and R. L. Stevens (1999). Heparin is essential for the storage of specific granule proteases in mast
cells. Nature 400: 769-772.
Chaplin, M. (2006). Water structuring at colloidal surfaces. Dordrecht, Springer.
Chaplin, M. F. (2010). Structuring and Behaviour of Water in Nanochannels and Confined Spaces
Adsorption and Phase Behaviour in Nanochannels and Nanotubes. L. J. Dunne and G. Manos,
Springer Netherlands: 241-255.
Chavez, F. V., E. Persson and B. Halle (2006). Internal water molecules and magnetic relaxation
in agarose gels. Journal of the American Chemical Society 128: 4902-4910.
Cheifetz, S. and J. Massague (1989). Transforming growth factor-beta (TGF-BETA) receptor
proteoglucan-cell-surface expression and ligand-binding in the absence of glycosaminoglycan
chains. Journal of Biological Chemistry 264: 12025-12028.
Ibrahim, M. (1998). Clean fractionation of biomass-steam explosion and extraction. Blacksburg,
Virginia Polytechnic Institute and State University.
Ifuku, S. and J. F. Kadla (2008). Preparation of a Thermosensitive Highly Regioselective
Cellulose/N-Isopropylacrylamide Copolymer through Atom Transfer Radical Polymerization.
Biomacromolecules 9: 3308-3313.
Iozzo, R. V. (1998). MATRIX PROTEOGLYCANS: From Molecular Design to Cellular
Function. Annual Review of Biochemistry 67: 609-652.
Iozzo, R. V. and A. D. Murdoch (1996). Proteoglycans of the extracellular environment: Clues
from the gene and protein side offer novel perspectives in molecular diversity and function. Faseb
Journal 10: 598-614.
Isogai, A., M. Usuda, T. Kato, T. Uryu and R. H. Atalla (1989). Solid-state CP MAS C-13 NMR-
study of cellulose polymorphs. Macromolecules 22: 3168-3172.
Israelachvili, J. N. (1997). Intermolecular and Surface Forces, London: Academic Press Ltd.
Jeffrey, G. A. (2007). An introduction to hydrogen bonding. New York, Oxford University Press.

References
43
Jeffrey, G. A. and W. Saenger (1991). Hydrogen bonding in biological strucutres. Berlin Springer-
Verlag.
Jobling, S. (2004). Improving starch for food and industrial applications. Current Opinion in Plant
Biology 7: 210-218.
Joshi, H. N. and E. M. Topp (1992). Hydration in hyaluronic-acid and its esters using differential
scanning calorimetry. International Journal of Pharmaceutics 80: 213-225.
Jouon, N., M. Rinaudo, M. Milas and J. Desbrières (1995). Hydration of hyaluronic acid as a
function of the counterion type and relative humidity. Carbohydrate Polymers 26: 69-73.
Kimmich, R. and E. Anoardo (2004). Field-cycling NMR relaxometry. Progress in Nuclear
Magnetic Resonance Spectroscopy 44: 257-320.
Kirschner, K. N. and R. J. Woods (2001). Solvent interactions determine carbohydrate
conformation. Proceedings of the National Academy of Sciences of the United States of America
98: 10541-10545.
Kogan, G., L. Soltes, R. Stern and P. Gemeiner (2007). Hyaluronic acid: a natural biopolymer with
a broad range of biomedical and industrial applications. Biotechnology Letters 29: 17-25.
Lapcik, L., S. De Smedt, J. Demeester and P. Chabrecek (1998). Hyaluronan: Preparation,
structure, properties, and applications. Chemical Reviews 98: 2663-2684.
Le Botlan, D., Y. Rugraff, C. Martin and P. Colonna (1998). Quantitative determination of bound
water in wheat starch by time domain NMR spectroscopy. Carbohydrate Research 308: 29-36.
Legon, A. C. and D. J. Millen (1987). Angular geometries and other properties of hydrogen-
bonded dimers - A simple electrostatic interpretation of the success of the electron-pair model.
Chemical Society Reviews 16: 467-498.
Leppanen, K., S. Andersson, M. Torkkeli, M. Knaapila, N. Kotelnikova and R. Serimaa (2009).
Structure of cellulose and microcrystalline cellulose from various wood species, cotton and flax
studied by X-ray scattering. Cellulose 16: 999-1015.
Levitt, M. H. (2007). Spin Dynamics. Chichester, John Wiley and Sons, Ltd.
Lewin, M. (2007). Handbook of Fiber Chemistry, Taylor & Francis Group.
Lewis, S. L. and (2008). Medical Surgical Nursing, Mosby.
References
44
Linden, J., R. Stoner, K. Knutson and C. Gardner-Hughes (2000). Organic Disease Control
Elicitors. Agro Food Industry Hi-Te.: 12–15.
Liu, J. and M. K. Cowman (2000). Thermal analysis of semi-dilute hyaluronan solutions. Journal
of Thermal Analysis and Calorimetry 59: 547-557.
Liu, W. G. and K. D. Yao (2001). What causes the unfrozen water in polymers: hydrogen bonds
between water and polymer chains? Polymer 42: 3943-3947.
Luchinat, C. and G. Parigi (2008). Nuclear relaxometry helps designing systems for solution DNP
on proteins. Applied Magnetic Resonance 34: 379-392.
Lusse, S. and K. Arnold (1998). Water binding of Polysaccharides-NMR and ESR studies.
Macromolecules 31: 6891-6897.
Lyon, M. and J. T. Gallagher (1998). Bio-specific sequences and domains in heparan sulphate and
the regulation of cell growth and adhesion. Matrix Biology 17: 485-493.
Matteini, P., L. Dei, E. Carretti, N. Volp, A. Goti and R. Pini (2009). Structural Behavior of
Highly Concentrated Hyaluronan. Biomacromolecules 10: 1516-1522.
Maytin, E. V., H. H. Chung and V. M. Seetharaman (2004). Hyaluronan participates in the
epidermal response to disruption of the permeability barrier in vivo. American Journal of
Pathology 165: 1331-1341.
Mikheev, Y. A., L. N. Guseva, E. Y. Davydov and Y. A. Ershov (2007). The hydration of
hydrophobic substances. Russian Journal of Physical Chemistry A 81: 1897-1913.
Mlčoch, T. and J. Kučerík (2013). Hydration and drying of various polysaccharides studied using
DSC. Journal of Thermal Analysis and Calorimetry.
Modig, K., E. Liepinsh, G. Otting and B. Halle (2003). Dynamics of Protein and Peptide
Hydration. Journal of the American Chemical Society 126: 102-114.
Moore, J. H. and N. D. Spencer (2001). Encyclopedia of Chemical Physics and Physical
Chemistry, Taylor & Francis.
Mulloy, B. and M. J. Forster (2000). Conformation and dynamics of heparin and heparan sulfate.
Glycobiology 10: 1147-1156.

References
45
Nakamura, K., T. Hatakeyama and H. Hatakeyama (1991). Formation of the glassy state and
mesophase in the water-sodium alginate system. Polymer Journal 23: 253-258.
Nelson, D. L. and M. M. Cox (2004). Principles of biochemistry.
Ostrowska-Czubenko, J. and M. Gierszewska-Druzynska (2009). Effect of ionic crosslinking on
the water state in hydrogel chitosan membranes. Carbohydrate Polymers 77: 590-598.
Ovodov, Y. S. (2009). Current views on pectin substances. Russian Journal of Bioorganic
Chemistry 35: 269-284.
Park, S., R. A. Venditti, H. Jameel and J. J. Pawlak (2006). Changes in pore size distribution
during the drying of cellulose fibers as measured by differential scanning calorimetry.
Carbohydrate Polymers 66: 97-103.
Park, S., R. A. Venditti, H. Jameel and J. J. Pawlak (2007). Studies of the heat of vaporization of
water associated with cellulose fibers characterized by thermal analysis. Cellulose 14: 195-204.
Pauling, L. (1931). The nature of the chemical bond. II. The one-electron bond and the three-
electron bond. Journal of the American Chemical Society 53: 3225-3237.
Pekar, M. (2012). A note on an alternative DSC approach to study hydration of hyaluronan.
Carbohydrate Polymers 89: 1009-1011.
Perez, S., K. Mazeau and C. H. du Penhoat (2000). The three-dimensional structures of the pectic
polysaccharides. Plant Physiology and Biochemistry 38: 37-55.
Phillips, G. O., S. Takigami and M. Takigami (1996). Hydration characteristics of the gum
exudate from Acacia senegal. Food Hydrocolloids 10: 11-19.
Ping, Z. H., Q. T. Nguyen, S. M. Chen, J. Q. Zhou and Y. D. Ding (2001). States of water in
different hydrophilic polymers - DSC and FTIR studies. Polymer 42: 8461-8467.
Prawitwong, P., S. Takigami and G. O. Phillips (2007). Phase transition behaviour of sorbed water
in Konjac mannan. Food Hydrocolloids 21: 1368-1373.
Pribble, R. N., A. W. Garrett, K. Haber and T. S. Zwier (1995). Resonant ion-dip infrared-
spectroscopy of benzene-H2O and benzene HOD. Journal of Chemical Physics 103: 531-544.
Pusateri, A. E., S. J. McCarthy, K. W. Gregory, R. A. Harris, L. Cardenas, A. T. McManus and C.
W. J. Goodwin (2003). Effect of a Chitosan-Based Hemostatic Dressing on Blood Loss and

References
46
Survival in a Model of Severe Venous Hemorrhage and Hepatic Injury in Swine. The Journal of
Trauma 54: 177-182.
Quinn, E. X., T. Hatakeyama, H. Yoshida, M. Takahashi and H. Hatakeyama (1993). The
conformational properties of gellan gum hydrogels. Polymer Gels and Networks 1: 93–114.
Quinn, F. X., T. Hatakeyama, M. Takahashi and H. Hatakeyama (1994). The effect of annealing
on the conformational properties of xanthan hydrogels. Polymer 35: 1248-1252.
Rabenstein, D. L. and W. Guo (1988). Nuclear Magnetic Resonance Spectroscopy. Analytical
Chemistry 60: 1R-28R.
Rachocki, A., J. Kowalczuk and J. Tritt-Goc (2006). How we can interpret the T-1 dispersion of
MC, HPMC and HPC polymers above glass temperature? Solid State Nuclear Magnetic
Resonance 30: 192-197.
Redfield, A. G. (1957). On the theory of relaxation processes. Ibm Journal of Research and
Development 1: 19-31.
Ritota, M., R. Gianferri, R. Bucci and E. Brosio (2008). Proton NMR relaxation study of swelling
and gelatinisation process in rice starch-water samples. Food Chemistry 110: 14-22.
Saladin, K. S. (2007). Anatomy and Physiology, McGraw-Hill Education.
Scott, J. E., C. Cummings, A. Brass and Y. Chen (1991). Secondary and tertiary structures of
hyaluronan in aqueous solution, investigated by rotary shadowing electron-microscopy and
computer-simulation - Hyaluronan is a very efficient network-forming polymer. Biochemical
Journal 274: 699-705.
Shapiro, Y. E. (2011). Structure and dynamics of hydrogels and organogels: An NMR
spectroscopy approach. Progress in Polymer Science 36: 1184-1253.
Sherman, F. (1983). Microdetermination of the degree of hydration of polysaccharides and
glycoproteins. Talanta 30: 705-707.
Scheiner, S. (1997). Hydrogen Bonding. New York, Oxford University Press.
Singh, N., J. Singh, L. Kaur, N. S. Sodhi and B. S. Gill (2003). Morphological, thermal and
rheological properties of starches from different botanical sources. Food Chemistry 81: 219-231.

References
47
Steed, J. W. and J. L. Atwood (2000). Supramolecular Chemistry, Chichester: John Wiley and
Sons Ltd.
Stern, R., A. A. Asari and K. N. Sugahara (2006). Hyaluronan fragments: An information-rich
system. European Journal of Cell Biology 85: 699-715.
Stern, R. and M. J. Jedrzejas (2008). Carbohydrate Polymers at the Center of Life's Origins: The
Importance of Molecular Processivity. Chemical Reviews 108: 5061-5085.
Sun, R. C., J. M. Fang, P. Rowlands and J. Bolton (1998). Physicochemical and thermal
characterization of wheat straw hemicelluloses and cellulose. Journal of Agricultural and Food
Chemistry 46: 2804-2809.
Sutherland, I. W. (1998). Novel and established applications of microbial polysaccharides. Trends
in Biotechnology 16: 41-46.
Takahashi, M., T. Hatakeyama and H. Hatakeyama (2000). Phenomenological theory describing
the behaviour of non-freezing water in structure formation process of polysaccharide aqueous
solutions. Carbohydrate Polymers 41: 91-95.
Takigami, S., M. Takigami and G. O. Phillips (1993). Hydration characteristics of the cross-linked
hyaluronan derivative hylan. Carbohydrate Polymers 22: 153-160.
Takigami, S., M. Takigami and G. O. Phillips (1995). Effect of preparation method on the
hydration characteristics of hylan and comparison with another highly cross-linked polysaccharide,
gum-arabic. Carbohydrate Polymers 26: 11-18.
Tolstoguzov, V. (2004). Why are polysaccharides necessary? Food Hydrocolloids 18: 873-877.
Tolstoguzov, V. (2004). Why were polysaccharides necessary? Origins of Life and Evolution of
Biospheres 34: 571-597.
Van-Quynh, A., S. Willson and R. G. Bryant (2003). Protein reorientation and bound water
molecules measured by H-1 magnetic spin-lattice relaxation. Biophysical Journal 84: 558-563.
Voet, D. V., J. G. ( 2004). Biochemistry. New York.
Wakelyn, P. J. (2007). Cotton fiber chemistry and technolog, Taylor&Francis Group.
Wolfe, J., G. Bryant and K. L. Koster (2002). What is 'unfreezable water', how unfreezable is it
and how much is there? Cryoletters 23: 157-166.

References
48
Wunderlich, B. (2005). Thermal analysis of Polymeric Materials. Berlin, Springer-Verlag.
Yoshida, H., T. Hatakeyama and H. Hatakeyama (1992). Effect of water on the main chain motion
of polysaccharide hydrogels. Acs Symposium Series 489: 217-230.
Yoshida, H., T. Hatakeyama, H. Hatakeyama, N. Maeno and T. Hondah (1992). Physics and
Chemistry of Ice. Hokkaido University Press: 282.
Yuryev, V. P., I. E. Nemirovskaya and T. D. Maslova (1995). Phase state of starch gels at different
water contents. Carbohydrate Polymers 26: 43-46.
Zhao, H., J. H. Kwak, Y. Wang, J. A. Franz, J. M. White and J. E. Holladay (2005). Effects of
crystallinity on dilute acid hydrolysis of cellulose by cellulose ball-milling. Energy&Fuels 20:
807–811.
Zheligovskaya, E. A. and G. G. Malenkov (2006). Crystalline water ices. Uspekhi Khimii 75: 64-
85.
Zhou, D. and R. G. Bryant (1994). Magnetization-transfer, cross-relaxation, and chemical-
exchange in rotationally immobilized protein gels. Magnetic Resonance in Medicine 32: 725-732.
Zugenmaier, P. (2008). Crystalline cellulose and Cellulose Derivatives: Characterization and
Structures.

List of abbreviation
49
6 LIST OF ABBREVIATION
DSC Differential scanning calorimetry
Da Dalton
EMC Extracellular matrix
FTIR Fourier transformed infrared spectroscopy
FFC-NMR Fast field cycling nuclear magnetic resonance
GlcA β-L-glucuronic acid
GlcNAc 2-deoxy-2-acetamido-α-D-glucopyranosyl
GlcNS 2-deoxy-2-sulfamido-α-D-glucopyranosyl
GlcNS(6S) 2-deoxy-2-sulfamido-α-D-glucopyranosyl-6-O-sulfate
HYA Hyaluronan
IdoA α-L-iduronic acid
IdoA(2S) 2-O-sulfo-α-L-iduronic acid
MDSC Temperature modulated differential scanning calorimetry
NMR Nuclear magnetic resonance
NMRD Nuclear magnetic resonance dispersion
TD NMR Time domain nuclear magnetic resonance
L Proton Larmor frequency
50
Appendix 1
Průšová, A., Šmejkalová, D., Chytil, M., Velebný, M., Kučerík, J. (2010). An alternative
DSC approach to study hydration of hyaluronan. Carbohydrate Polymers 82: 498–503.

Carbohydrate Polymers 82 (2010) 498–503
Contents lists available at ScienceDirect
Carbohydrate Polymers
journa l homepage: www.e lsev ier .com/ locate /carbpol
An alternative DSC approach to study hydration of hyaluronan
A. Prusováa, D. Smejkalováb, M. Chytil a, V. Velebnyb, J. Kuceríka,∗
a Brno University of Technology, Faculty of Chemistry, Purkynova 118, Brno CZ-612 00, Czech Republicb Contipro C, Dolní Dobrouc 401, 56102 Dolní Dobrouc, Czech Republic
a r t i c l e i n f o
Article history:Received 7 April 2010Received in revised form 5 May 2010Accepted 7 May 2010Available online 21 May 2010
Keywords:HyaluronanHydrationDSCWater evaporation
a b s t r a c t
Differential scanning calorimetry (DSC) was used to determine the number of water molecules in thehydration shell of hyaluronan of different molecular weights and counterions. First, traditional exper-iments including freezing/thawing of free water in semi-diluted solutions were carried out leading tothe determination of melting enthalpy of freezable water. Non-freezing water was determined usingextrapolation to zero enthalpy. For sodium hyaluronan within the molecular weight range between 100and 740 kDa the hydration shell was determined as 0.74 g g−1 HYA. A larger hydration shell containing0.84 and 0.82 g g−1 HYA was determined for hyaluronan of 1390 kDa in its sodium and protonized form,respectively. Second, melting enthalpy of freezing water was further studied applying water evaporationexperiments. Resulted plot of enthalpy vs concentration indicated an additional heat evolution processwhich occurs at specific concentration and decreases the measured evaporation enthalpy. The heat evolu-tion was attributed to the mutual approaching of hyaluronan molecular chains, their mutual interactionsand formation of the ordered hyaluronan structure which starts immediately when the hydration wateris desorbed from the hyaluronan surface. The concentration at which the process occurred was related to“non-evaporable water” which was determined as 0.31–0.38 g g−1 for sodium hyaluronan and 0.84 g g−1
for its protonized form. The second approach provides additional information enabling a deeper insightinto the problem of hyaluronan hydration.
© 2010 Elsevier Ltd. All rights reserved.
1. Introduction
Hyaluronan (HYA) is a linear, unbranched, high molecularweight extracellular matrix polar polysaccharide belonging to theglycosaminoglycans class. HYA is composed of repeating polyan-ionic disaccharide units which consist of N-acetyl-d-glucosamineand d-glucuronic acid linked by a � 1–4 glycosidic bond. The disac-charides are linked by � 1–3 bonds to form HYA chains (Fig. 1). Invivo, it occurs exceptionally in the form of Na+ salt. HYA polymershave extraordinarily wide range of use and often different biologi-cal functions depending on the molecular mass which can reach upto 10 MDa. Larger matrix polymers of HYA show space-filling, anti-angiogenic, immunosuppressive effects and play an important rolein tissue hydration (Kogan, Soltéz, Stern, & Gemener, 2007). In con-trast, the HYA segments of lower molecular weight are well knownto have pronounced biological activities playing role for examplein tumour diagnose.
Hydration and/or water holding capacity is probably one ofthe most important aspects of the HYA function. A perusal of lit-erature shows a lot of works dealing with the determination ofhydration shells and enumeration of water molecules surrounding
∗ Corresponding author. Tel.: +420 777 633 675; fax: +420 541 211 697.E-mail address: [email protected] (J. Kucerík).
HYA molecules in diluted and semi-diluted HYA/water solutions(Haxaire, Marechal, Milas, & Rinaudo, 2003a, 2003b; Joun, Rinaudo,Miles, & Desbrieres, 1995; Marechal, Milas, & Rinaudo, 2003;Yoshida, Hatakeyama, & Hatakeyama, 1992) and swelling of HYAin water (Mrácek, Benesová, Minarík, Urban, & Lapcík, 2007) or insalt solutions (Mrácek et al., 2008). There are several techniquesand approaches, both experimental and theoretical, to shed lighton water behaviour in the presence of HYA molecules. In this paperwe focus on the differential scanning calorimetry (DSC), a methodbelonging to the family of thermo-analytical techniques.
The traditional and probably the only way of differentiationof water molecules in hydration shells using DSC is based onfreezing/thawing experiments in which the difference in physicalproperties between freezable water in form of ice and non-freezable water that is tightly bound on the HYA surface isinvestigated. Accordingly, the water shells are categorized intothree groups, i.e. non-freezing water (NFW), freezing-bound water(FBW) and free water (FW). NFW is strongly fixed to the HYA surfacethrough the electrostatic interactions. The motion of NFW is lim-ited and therefore such water cannot crystallize when cooled down(Wolfe, Bryant, & Koster, 2002) or crystallizes in time period whichis far beyond the time framework of the experiment. It was statedthat such water molecules are directly attached especially to thehydroxyl groups of HYA (Hatakeyama, Nakamura, & Hatakeyama,2000). FBW is located in larger distance from a HYA molecule. It is
0144-8617/$ – see front matter © 2010 Elsevier Ltd. All rights reserved.doi:10.1016/j.carbpol.2010.05.022
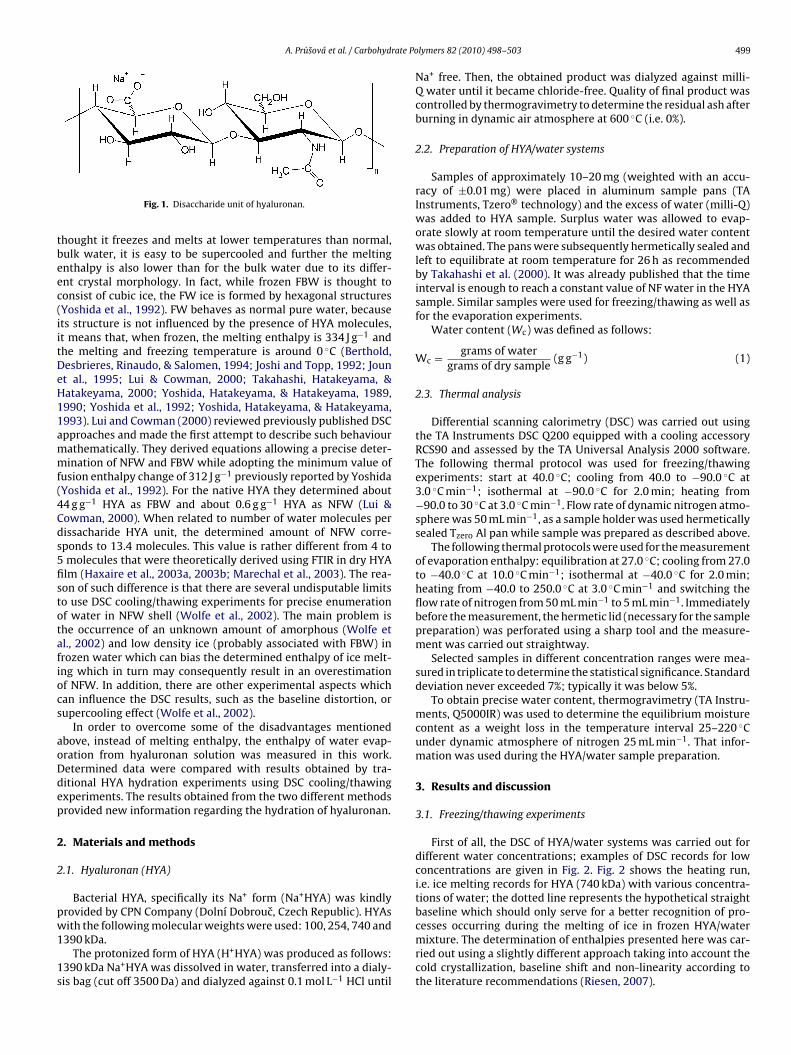
A. Prusová et al. / Carbohydrate Polymers 82 (2010) 498–503 499
Fig. 1. Disaccharide unit of hyaluronan.
thought it freezes and melts at lower temperatures than normal,bulk water, it is easy to be supercooled and further the meltingenthalpy is also lower than for the bulk water due to its differ-ent crystal morphology. In fact, while frozen FBW is thought toconsist of cubic ice, the FW ice is formed by hexagonal structures(Yoshida et al., 1992). FW behaves as normal pure water, becauseits structure is not influenced by the presence of HYA molecules,it means that, when frozen, the melting enthalpy is 334 J g−1 andthe melting and freezing temperature is around 0 ◦C (Berthold,Desbrieres, Rinaudo, & Salomen, 1994; Joshi and Topp, 1992; Jounet al., 1995; Lui & Cowman, 2000; Takahashi, Hatakeyama, &Hatakeyama, 2000; Yoshida, Hatakeyama, & Hatakeyama, 1989,1990; Yoshida et al., 1992; Yoshida, Hatakeyama, & Hatakeyama,1993). Lui and Cowman (2000) reviewed previously published DSCapproaches and made the first attempt to describe such behaviourmathematically. They derived equations allowing a precise deter-mination of NFW and FBW while adopting the minimum value offusion enthalpy change of 312 J g−1 previously reported by Yoshida(Yoshida et al., 1992). For the native HYA they determined about44 g g−1 HYA as FBW and about 0.6 g g−1 HYA as NFW (Lui &Cowman, 2000). When related to number of water molecules perdissacharide HYA unit, the determined amount of NFW corre-sponds to 13.4 molecules. This value is rather different from 4 to5 molecules that were theoretically derived using FTIR in dry HYAfilm (Haxaire et al., 2003a, 2003b; Marechal et al., 2003). The rea-son of such difference is that there are several undisputable limitsto use DSC cooling/thawing experiments for precise enumerationof water in NFW shell (Wolfe et al., 2002). The main problem isthe occurrence of an unknown amount of amorphous (Wolfe etal., 2002) and low density ice (probably associated with FBW) infrozen water which can bias the determined enthalpy of ice melt-ing which in turn may consequently result in an overestimationof NFW. In addition, there are other experimental aspects whichcan influence the DSC results, such as the baseline distortion, orsupercooling effect (Wolfe et al., 2002).
In order to overcome some of the disadvantages mentionedabove, instead of melting enthalpy, the enthalpy of water evap-oration from hyaluronan solution was measured in this work.Determined data were compared with results obtained by tra-ditional HYA hydration experiments using DSC cooling/thawingexperiments. The results obtained from the two different methodsprovided new information regarding the hydration of hyaluronan.
2. Materials and methods
2.1. Hyaluronan (HYA)
Bacterial HYA, specifically its Na+ form (Na+HYA) was kindlyprovided by CPN Company (Dolní Dobrouc, Czech Republic). HYAswith the following molecular weights were used: 100, 254, 740 and1390 kDa.
The protonized form of HYA (H+HYA) was produced as follows:1390 kDa Na+HYA was dissolved in water, transferred into a dialy-sis bag (cut off 3500 Da) and dialyzed against 0.1 mol L−1 HCl until
Na+ free. Then, the obtained product was dialyzed against milli-Q water until it became chloride-free. Quality of final product wascontrolled by thermogravimetry to determine the residual ash afterburning in dynamic air atmosphere at 600 ◦C (i.e. 0%).
2.2. Preparation of HYA/water systems
Samples of approximately 10–20 mg (weighted with an accu-racy of ±0.01 mg) were placed in aluminum sample pans (TAInstruments, Tzero® technology) and the excess of water (milli-Q)was added to HYA sample. Surplus water was allowed to evap-orate slowly at room temperature until the desired water contentwas obtained. The pans were subsequently hermetically sealed andleft to equilibrate at room temperature for 26 h as recommendedby Takahashi et al. (2000). It was already published that the timeinterval is enough to reach a constant value of NF water in the HYAsample. Similar samples were used for freezing/thawing as well asfor the evaporation experiments.
Water content (Wc) was defined as follows:
Wc = grams of watergrams of dry sample
(g g−1) (1)
2.3. Thermal analysis
Differential scanning calorimetry (DSC) was carried out usingthe TA Instruments DSC Q200 equipped with a cooling accessoryRCS90 and assessed by the TA Universal Analysis 2000 software.The following thermal protocol was used for freezing/thawingexperiments: start at 40.0 ◦C; cooling from 40.0 to −90.0 ◦C at3.0 ◦C min−1; isothermal at −90.0 ◦C for 2.0 min; heating from−90.0 to 30 ◦C at 3.0 ◦C min−1. Flow rate of dynamic nitrogen atmo-sphere was 50 mL min−1, as a sample holder was used hermeticallysealed Tzero Al pan while sample was prepared as described above.
The following thermal protocols were used for the measurementof evaporation enthalpy: equilibration at 27.0 ◦C; cooling from 27.0to −40.0 ◦C at 10.0 ◦C min−1; isothermal at −40.0 ◦C for 2.0 min;heating from −40.0 to 250.0 ◦C at 3.0 ◦C min−1 and switching theflow rate of nitrogen from 50 mL min−1 to 5 mL min−1. Immediatelybefore the measurement, the hermetic lid (necessary for the samplepreparation) was perforated using a sharp tool and the measure-ment was carried out straightway.
Selected samples in different concentration ranges were mea-sured in triplicate to determine the statistical significance. Standarddeviation never exceeded 7%; typically it was below 5%.
To obtain precise water content, thermogravimetry (TA Instru-ments, Q5000IR) was used to determine the equilibrium moisturecontent as a weight loss in the temperature interval 25–220 ◦Cunder dynamic atmosphere of nitrogen 25 mL min−1. That infor-mation was used during the HYA/water sample preparation.
3. Results and discussion
3.1. Freezing/thawing experiments
First of all, the DSC of HYA/water systems was carried out fordifferent water concentrations; examples of DSC records for lowconcentrations are given in Fig. 2. Fig. 2 shows the heating run,i.e. ice melting records for HYA (740 kDa) with various concentra-tions of water; the dotted line represents the hypothetical straightbaseline which should only serve for a better recognition of pro-cesses occurring during the melting of ice in frozen HYA/watermixture. The determination of enthalpies presented here was car-ried out using a slightly different approach taking into account thecold crystallization, baseline shift and non-linearity according tothe literature recommendations (Riesen, 2007).

500 A. Prusová et al. / Carbohydrate Polymers 82 (2010) 498–503
Fig. 2. DSC melting records for HYA (740 kDa).
It can be seen that around Wc = 0.5 no peak occurred on the heat-ing curves. It seems that all the water molecules occurred in NFWshell. Since at this concentration the number of water moleculesper HYA disaccharide unit (400 g mol−1) is approximately 11, itis likely that the water molecules are strongly bound to the HYAskeleton and low temperature does not affect their mutual inter-actions. It means that low temperature did not cause the waterdesorption from HYA molecule, water molecules were not sepa-rated to form ice crystals which melt when heated up. Increase inconcentration of water in HYA sample brought about the appear-ance of events associated with the presence of freezable water.There is a weak exothermal event that occurs at Wc = 0.84 andcan be attributed to cold crystallization of supercooled water start-ing around −48 ◦C followed by melting around −22 ◦C. Increase in
Fig. 3. Dependency of the enthalpy change associated with the melting endothermin the HYA (740 kDa) solutions, normalized to the HYA weight, as a function of watercontent in HYA.
water content to Wc = 0.99 showed the enlargement of crystalliza-tion peak before the ice melting. Then two separate endothermsappeared at Wc = 1.53; first one starting at −32 ◦C and the otherone starting at −20 ◦C. Those are not any longer separated atWc = 2.52 and above that concentration, where again the crystal-lization appeared followed by a single melting peak with the onsetaround −30 ◦C. From Fig. 2 it can be further observed that there isa general tendency for the onset temperature of melting peak toslightly increase with increasing water content in the sample. Suchfinding is quite typical and is in accordance with the observationsreported in the earlier papers (Hatakeyama & Hatakeyama, 1998);Yoshida et al., 1992). The HYA samples of molecular weight 100,253 and 1396 kDa gave similar records and are not reported here.
As previously suggested by Liu and Cowman, the observedenthalpy of melting was first normalized dividing by the weightof the dry HYA mass and then plotted against the respective Wc
(Fig. 3). In this way, the NFW content was determined from thex-intercept (Lui & Cowman, 2000). Obtained values of NFW andparameters of linearization are listed for all samples in Table 1. Itcan be seen that the NFW content was constant for HYA of molec-ular weight from 100 to 740 kDa and was always determined as0.74 g of water per gram of HYA. A larger hydration shell consistingof 0.84 g g−1 NFW was found for 1390 kDA HYA.
The same experiments were carried out using H+ form of HYA(H+HYA). The protonized form showed different behaviour in com-parison with Na+ form. In fact, it can be easily identified in Fig. 4 thatice around H+ HYA form melts at significantly higher temperaturethan that in Na+HYA form. Although the onset of the melting is notexactly at 0 ◦C as for pure water, the temperature is significantlyshifted to higher temperatures. Determination of NFW was carriedout in the same way as suggested in Fig. 3 and brought result ofabout 0.82 g g−1.
Table 1Content of hydration water for HYA of different molecular weight and counterionfrom cooling/thawing experiments. nNFW is the number of water molecules per dis-accharide unit, NFW stands for non-freezing water (in g of water per 1 g of HYA)determined using the approach reported in Lui and Cowman (2000).
Sample aNFW anNFW Parameters a; b Confidencecoefficient R2
100 0.74 16.5 312; −230 0.9984254 0.74 16.5 315; −234 0.9988740 0.74 16.5 314; −232 0.99741390 0.84 18.7 302; −255 0.9976H+ 0.82 17.2 329; −270 0.9979
a Recalculated to the molecular weight of Na+ and H+ form.

A. Prusová et al. / Carbohydrate Polymers 82 (2010) 498–503 501
Fig. 4. DSC melting records for H+HYA.
3.2. Evaporation experiments
Samples with the same water content as used in thefreezing/thawing experiments were measured to determine theenthalpy of evaporation of water from the mixture with HYA. Sim-ply, before the experiment was carried out, the lid was carefullyperforated by a sharp pin; the sample was then cooled down andheated up to 220 ◦C. The reason to apply the freezing segmentbefore the evaporation was due to easier identification of the onsetof evaporation (Fig. 5).
The heating rate was chosen reasonably slow to evaporate asmuch as possible of the water present in the sample before its boil-ing. Again, the enthalpy of processes was assessed and elaborated
Fig. 5. DSC record for the determination of evaporation enthalpy for HYA (740 kDa),Wc = 1.94.
as described above. In Fig. 5 there is given a representative DSCevaporation record for HYA 740 kDa. The cooling curve, depicted inthe upper part of the figure, shows an event corresponding to thefreezable water crystallization. Conversely, heating curve shown atthe bottom part of Fig. 5 reveals two endothermic peaks, where thefirst one corresponds to the melting of water in the sample whilethe other broad endothermic peak can be attributed to the waterevaporation. Fig. 6 shows the comparison of water/HYA sampleswith various Wc. As expected, the peak temperature and peak areais shifted with increasing water content in the samples.
Fig. 7 shows typical dependency of evaporation enthalpy nor-malized to the mass of dry Na+ forms of HYA or H+HYA withmolecular weights 101, 740 and 1390 kDa. There can be seen a lin-ear decrease of the enthalpy with decreasing Wc; a break occursaround the value Wc = 0.35. Since at this concentration the watermolecules are supposed to be bound more tightly to the HYAmolecule, it is natural to assume that the energy necessary for itsevaporation should be higher than that for bulk water. As a result,the enthalpy should be higher and the slope of the dependencyshould be in reverse direction to that shown in Fig. 7, i.e. moresteeply decreasing. Therefore, it seems that at this concentrationthe consumption of energy necessary for evaporation is compen-sated by a process or processes in which the energy is evolved.
Fig. 6. Comparison of evaporation profiles of water/HYA (740 kDa) samples of dif-ferent concentrations.
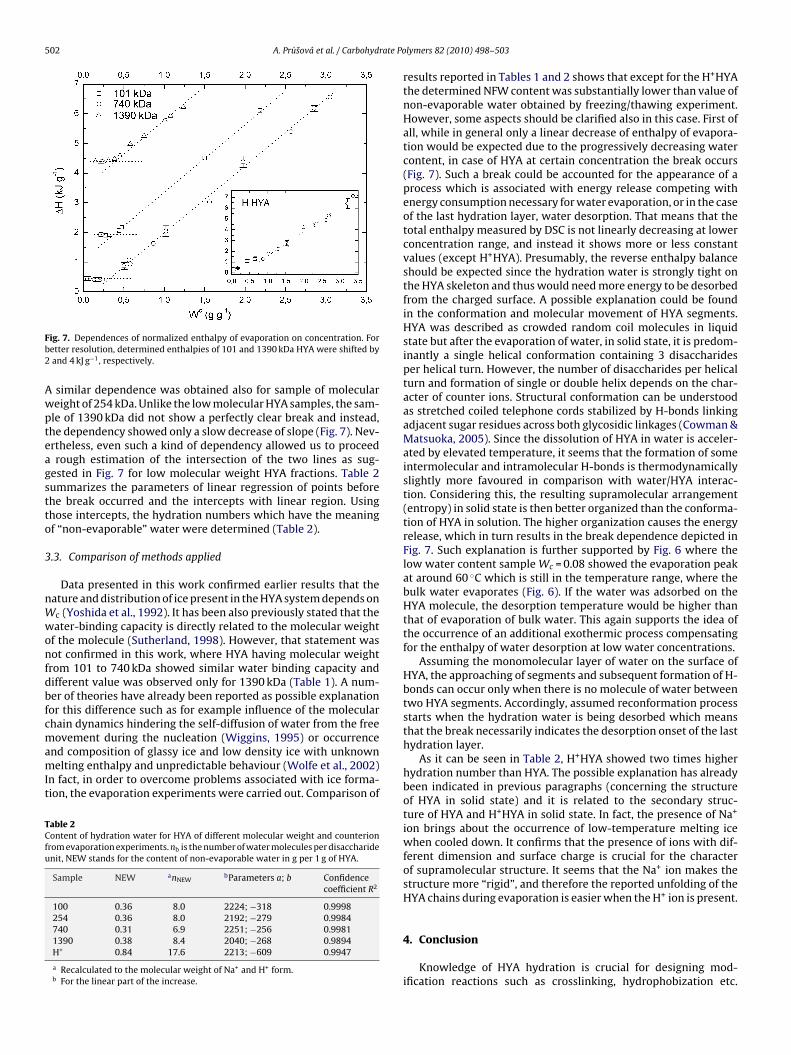
502 A. Prusová et al. / Carbohydrate Polymers 82 (2010) 498–503
Fig. 7. Dependences of normalized enthalpy of evaporation on concentration. Forbetter resolution, determined enthalpies of 101 and 1390 kDa HYA were shifted by2 and 4 kJ g−1, respectively.
A similar dependence was obtained also for sample of molecularweight of 254 kDa. Unlike the low molecular HYA samples, the sam-ple of 1390 kDa did not show a perfectly clear break and instead,the dependency showed only a slow decrease of slope (Fig. 7). Nev-ertheless, even such a kind of dependency allowed us to proceeda rough estimation of the intersection of the two lines as sug-gested in Fig. 7 for low molecular weight HYA fractions. Table 2summarizes the parameters of linear regression of points beforethe break occurred and the intercepts with linear region. Usingthose intercepts, the hydration numbers which have the meaningof “non-evaporable” water were determined (Table 2).
3.3. Comparison of methods applied
Data presented in this work confirmed earlier results that thenature and distribution of ice present in the HYA system depends onWc (Yoshida et al., 1992). It has been also previously stated that thewater-binding capacity is directly related to the molecular weightof the molecule (Sutherland, 1998). However, that statement wasnot confirmed in this work, where HYA having molecular weightfrom 101 to 740 kDa showed similar water binding capacity anddifferent value was observed only for 1390 kDa (Table 1). A num-ber of theories have already been reported as possible explanationfor this difference such as for example influence of the molecularchain dynamics hindering the self-diffusion of water from the freemovement during the nucleation (Wiggins, 1995) or occurrenceand composition of glassy ice and low density ice with unknownmelting enthalpy and unpredictable behaviour (Wolfe et al., 2002)In fact, in order to overcome problems associated with ice forma-tion, the evaporation experiments were carried out. Comparison of
Table 2Content of hydration water for HYA of different molecular weight and counterionfrom evaporation experiments. nb is the number of water molecules per disaccharideunit, NEW stands for the content of non-evaporable water in g per 1 g of HYA.
Sample NEW anNEWbParameters a; b Confidence
coefficient R2
100 0.36 8.0 2224; −318 0.9998254 0.36 8.0 2192; −279 0.9984740 0.31 6.9 2251; −256 0.99811390 0.38 8.4 2040; −268 0.9894H+ 0.84 17.6 2213; −609 0.9947
a Recalculated to the molecular weight of Na+ and H+ form.b For the linear part of the increase.
results reported in Tables 1 and 2 shows that except for the H+HYAthe determined NFW content was substantially lower than value ofnon-evaporable water obtained by freezing/thawing experiment.However, some aspects should be clarified also in this case. First ofall, while in general only a linear decrease of enthalpy of evapora-tion would be expected due to the progressively decreasing watercontent, in case of HYA at certain concentration the break occurs(Fig. 7). Such a break could be accounted for the appearance of aprocess which is associated with energy release competing withenergy consumption necessary for water evaporation, or in the caseof the last hydration layer, water desorption. That means that thetotal enthalpy measured by DSC is not linearly decreasing at lowerconcentration range, and instead it shows more or less constantvalues (except H+HYA). Presumably, the reverse enthalpy balanceshould be expected since the hydration water is strongly tight onthe HYA skeleton and thus would need more energy to be desorbedfrom the charged surface. A possible explanation could be foundin the conformation and molecular movement of HYA segments.HYA was described as crowded random coil molecules in liquidstate but after the evaporation of water, in solid state, it is predom-inantly a single helical conformation containing 3 disaccharidesper helical turn. However, the number of disaccharides per helicalturn and formation of single or double helix depends on the char-acter of counter ions. Structural conformation can be understoodas stretched coiled telephone cords stabilized by H-bonds linkingadjacent sugar residues across both glycosidic linkages (Cowman &Matsuoka, 2005). Since the dissolution of HYA in water is acceler-ated by elevated temperature, it seems that the formation of someintermolecular and intramolecular H-bonds is thermodynamicallyslightly more favoured in comparison with water/HYA interac-tion. Considering this, the resulting supramolecular arrangement(entropy) in solid state is then better organized than the conforma-tion of HYA in solution. The higher organization causes the energyrelease, which in turn results in the break dependence depicted inFig. 7. Such explanation is further supported by Fig. 6 where thelow water content sample Wc = 0.08 showed the evaporation peakat around 60 ◦C which is still in the temperature range, where thebulk water evaporates (Fig. 6). If the water was adsorbed on theHYA molecule, the desorption temperature would be higher thanthat of evaporation of bulk water. This again supports the idea ofthe occurrence of an additional exothermic process compensatingfor the enthalpy of water desorption at low water concentrations.
Assuming the monomolecular layer of water on the surface ofHYA, the approaching of segments and subsequent formation of H-bonds can occur only when there is no molecule of water betweentwo HYA segments. Accordingly, assumed reconformation processstarts when the hydration water is being desorbed which meansthat the break necessarily indicates the desorption onset of the lasthydration layer.
As it can be seen in Table 2, H+HYA showed two times higherhydration number than HYA. The possible explanation has alreadybeen indicated in previous paragraphs (concerning the structureof HYA in solid state) and it is related to the secondary struc-ture of HYA and H+HYA in solid state. In fact, the presence of Na+
ion brings about the occurrence of low-temperature melting icewhen cooled down. It confirms that the presence of ions with dif-ferent dimension and surface charge is crucial for the characterof supramolecular structure. It seems that the Na+ ion makes thestructure more “rigid”, and therefore the reported unfolding of theHYA chains during evaporation is easier when the H+ ion is present.
4. Conclusion
Knowledge of HYA hydration is crucial for designing mod-ification reactions such as crosslinking, hydrophobization etc.
A. Prusová et al. / Carbohydrate Polymers 82 (2010) 498–503 503
In accordance with previous findings about hydration of ions(Zavitsas, 2001), the number of hydration water determined forHYA depends on the method and approach used. Nevertheless, asshown in this study, there exists an alternative approach whichprovides additional information enabling a deeper insight into theproblem of HYA hydration when DSC technique is used. It is neces-sary to point out that the content of both NFW and non-evaporablewater depends on the temperature since the origin of both is in thestrong temperature-dependent water adsorption and therefore thecontent of both is different.
The evaporation approach seems to be a suitable option for thedetermination of hydration water in HYA or possibly also in other(bio)polymers. In our opinion, it provides more reliable resultswhich are less biased by the unknown factors. Moreover, resultspublished here revealed very important phenomena with interest-ing and exploitable consequences. In fact, during the evaporation,the concentration of water around 0.3–0.4 g g−1 seems to be veryimportant for the character of HYA in dry state. In other words,this is the moment in which the HYA supramolecular structurecan be simply influenced by the external factors (such as tempera-ture, mechanical stress etc.) in order to obtain dry, non-modified or“native” HYA with specific properties. This is in accordance with therecent comment of Hargittai and Hargittai (2008) on the work ofLaurent (1957) about importance of conditions under which HYAis prepared. In addition they also stressed out the observation ofScott (1998) who put in question the randomness of HYA coiling.The influencing of HYA structure in solid state by an external factoris a similar approach as frequently used in “crystal engineering”.Such issue, however, is beyond the scope of this work and it will besolved in a special study.
Acknowledgement
This work was financially supported by the Ministry of Edu-cation, Youth and Sport of the Czech Republic project No.0021630501.
References
Berthold, J., Desbrieres, J., Rinaudo, M., & Salomen, L. (1994). Types of adsorbedwater in relation to the ionic groups and their counter-ions for some cellulosederivatives. Polymer, 35, 5729–5736.
Cowman, M. K., & Matsuoka, S. (2005). Experimental approaches to hyaluronanstructure. Carbohydrate Research, 340, 791–809.
Hargittai, I., & Hargittai, M. (2008). Molecular strcuture of hylauronan: an introduc-tion. Structural Chemistry, 19, 697–717.
Hatakeyama, H., & Hatakeyama, T. (1998). Interaction between water andhydrophilic polymers. Termochimica Acta, 308, 3–22.
Hatakeyama, T., Nakamura, K., & Hatakeyama, H. (2000). Vaporation of boundwater associated with cellulose fibres. Termochimica Acta, 352–353, 233–239.
Haxaire, K., Marechal, Y., Milas, M., & Rinaudo, M. (2003a). Hydration of polysaccha-ride hyaluronan observed by IR spectrometry. I. Preliminary experiments andband assignments. Biopolymers, 72, 10–20.
Haxaire, K., Marechal, Y., Milas, M., & Rinaudo, M. (2003b). Hydration of hyaluro-nan polysaccharide observed by IR spectrometry. II. Definition and quantitativeanalysis of elementary hydration spectra and water uptake. Biopolymers, 72,149–161.
Joun, N., Rinaudo, M., Miles, M., & Desbrieres, J. (1995). Hydration of hyaluronicacid as a function of the counterion type and relative humidity. CarbohydratePolymers, 26, 69–73.
Joshi, H. N., & Topp, E. M. (1992). Hydration in hyaluronic acid and its estersusing differential scanning calorimetry. International Journal of Pharmaceutics,80, 213–225.
Kogan, G., Soltéz, L., Stern, R., & Gemener, P. (2007). Hyaluronic acid: a natu-ral biopolymer with a broad range of biomedical and industrial applications.Biotechnology Letters, 29, 17–25.
Laurent, T. C. (1957). The amorphous X-ray diffractogram of hylauronic acid. Arkivfor Kemi, 11, 513–518.
Lui, J., & Cowman, M. K. (2000). Thermal analysis of semi-diluted hyaluronan solu-tions. Journal of Thermal Analysis and Calorimetry, 59, 547–557.
Marechal, Y., Milas, M., & Rinaudo, M. (2003). Hydration of haluronan polysaccha-ride observed by IR spectrometry. III. Structure and mechanism of hydration.Biopolymers, 72, 162–173.
Mrácek, A., Benesová, K., Minarík, A., Urban, P., & Lapcík, L. (2007). The diffu-sion process of sodium hyaluronate (Na-HA) and Na-HA-n-alkyl derivativesfilms swelling. Journal of Biomedical Materials Research Part A, 83A, 184–190.
Mrácek, A., Varhaníková, J., Lehocky, M., Grundelová, L., Pokopcová, A., & Velebny,V. (2008). The influence of Hofmeister series ions on hyaluronan swelling andviscosity. Molecules, 13, 1025–1034.
Riesen, R. (2007). Choosing the right baseline. User Com, 25, 1–6.Scott, J. E. (1998). Chemical morphology of hyaluronan. In T. C. Laurent (Ed.), The
chemistry and medical applications of hyaluronan and its derivatives, Wenner–Greninternational series (pp. 7–15). London: Portland Press.
Sutherland, W. (1998). Novel and established applications of microbial polysaccha-rides. In Institute of cell and molecular biology. Edinburgh University., p. 16.
Takahashi, M., Hatakeyama, T., & Hatakeyama, H. (2000). Phenomenological theorydescribing the behaviour of non-freezing water in structure formation processof polysaccharide aqueous solutions. Carbohydrate Polymers, 41, 91–95.
Wiggins, P. M. (1995). High and low density water in gels. Progress in Polymer Science,20, 1121–1163.
Wolfe, J., Bryant, G., & Koster, K. L. (2002). What is “unfreezeable water”, howunfreezable is it and how much is there. CryoLetters, 23, 157–166.
Yoshida, H., Hatakeyama, T., & Hatakeyama, H. (1989). Glass transition of hyaluronicacid hydrogel. Kobunshi Ronbunshu, 46, 597–602.
Yoshida, H., Hatakeyama, T., & Hatakeyama, H. (1990). In J. F. Kennedy, G. O. Phillips,& P. A. Williams (Eds.), Cellulose (pp. 305–310). Chichester, UK: Horwood.
Yoshida, H., Hatakeyama, T., & Hatakeyama, H. (1992). Polymer preprints, Japan , p.3026.
Yoshida, H., Hatakeyama, T., & Hatakeyama, H. (1993). Characterization of water inpolysaccharide hydrogels by DSC. Journal of Thermal Analysis, 40, 483–489.
Zavitsas, A. A. (2001). Properties of water solutions of electrolytes and nonelec-trolytes. Journal of Physical Chemistry B, 105, 7805–7815.

57
Appendix 2
Kučerík, J., Průšová, A., Rotaru, A., Flimel, K., Janeček, J., Conte, P. (2011). DSC study
on hyaluronan hydration and dehydration. Thermochimica acta 523: 245–249.
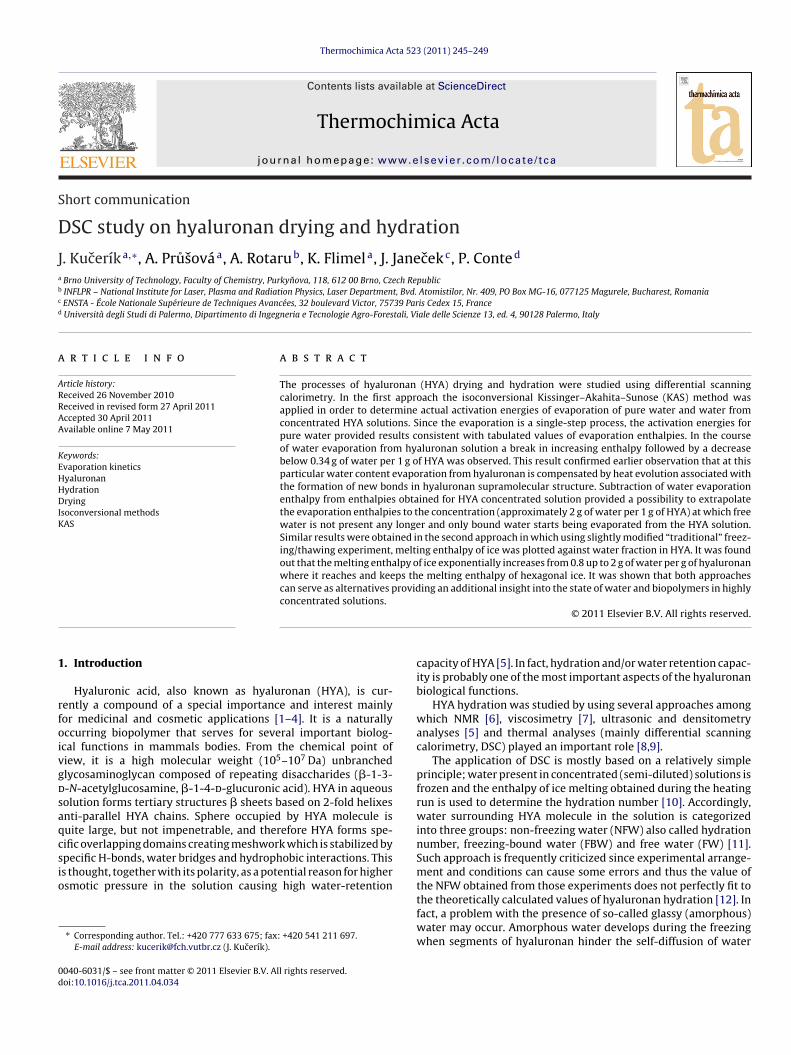
Thermochimica Acta 523 (2011) 245– 249
Contents lists available at ScienceDirect
Thermochimica Acta
jo ur n al homepage: www.elsev ier .com/ locate / tca
Short communication
DSC study on hyaluronan drying and hydration
J. Kuceríka,∗, A. Prusováa, A. Rotarub, K. Flimela, J. Janecekc, P. Conted
a Brno University of Technology, Faculty of Chemistry, Purkynova, 118, 612 00 Brno, Czech Republicb INFLPR – National Institute for Laser, Plasma and Radiation Physics, Laser Department, Bvd. Atomistilor, Nr. 409, PO Box MG-16, 077125 Magurele, Bucharest, Romaniac ENSTA - École Nationale Supérieure de Techniques Avancées, 32 boulevard Victor, 75739 Paris Cedex 15, Franced Università degli Studi di Palermo, Dipartimento di Ingegneria e Tecnologie Agro-Forestali, Viale delle Scienze 13, ed. 4, 90128 Palermo, Italy
a r t i c l e i n f o
Article history:Received 26 November 2010Received in revised form 27 April 2011Accepted 30 April 2011Available online 7 May 2011
Keywords:Evaporation kineticsHyaluronanHydrationDryingIsoconversional methodsKAS
a b s t r a c t
The processes of hyaluronan (HYA) drying and hydration were studied using differential scanningcalorimetry. In the first approach the isoconversional Kissinger–Akahita–Sunose (KAS) method wasapplied in order to determine actual activation energies of evaporation of pure water and water fromconcentrated HYA solutions. Since the evaporation is a single-step process, the activation energies forpure water provided results consistent with tabulated values of evaporation enthalpies. In the courseof water evaporation from hyaluronan solution a break in increasing enthalpy followed by a decreasebelow 0.34 g of water per 1 g of HYA was observed. This result confirmed earlier observation that at thisparticular water content evaporation from hyaluronan is compensated by heat evolution associated withthe formation of new bonds in hyaluronan supramolecular structure. Subtraction of water evaporationenthalpy from enthalpies obtained for HYA concentrated solution provided a possibility to extrapolatethe evaporation enthalpies to the concentration (approximately 2 g of water per 1 g of HYA) at which freewater is not present any longer and only bound water starts being evaporated from the HYA solution.Similar results were obtained in the second approach in which using slightly modified “traditional” freez-ing/thawing experiment, melting enthalpy of ice was plotted against water fraction in HYA. It was foundout that the melting enthalpy of ice exponentially increases from 0.8 up to 2 g of water per g of hyaluronanwhere it reaches and keeps the melting enthalpy of hexagonal ice. It was shown that both approachescan serve as alternatives providing an additional insight into the state of water and biopolymers in highlyconcentrated solutions.
© 2011 Elsevier B.V. All rights reserved.
1. Introduction
Hyaluronic acid, also known as hyaluronan (HYA), is cur-rently a compound of a special importance and interest mainlyfor medicinal and cosmetic applications [1–4]. It is a naturallyoccurring biopolymer that serves for several important biolog-ical functions in mammals bodies. From the chemical point ofview, it is a high molecular weight (105–107 Da) unbranchedglycosaminoglycan composed of repeating disaccharides (�-1-3-d-N-acetylglucosamine, �-1-4-d-glucuronic acid). HYA in aqueoussolution forms tertiary structures � sheets based on 2-fold helixesanti-parallel HYA chains. Sphere occupied by HYA molecule isquite large, but not impenetrable, and therefore HYA forms spe-cific overlapping domains creating meshwork which is stabilized byspecific H-bonds, water bridges and hydrophobic interactions. Thisis thought, together with its polarity, as a potential reason for higherosmotic pressure in the solution causing high water-retention
∗ Corresponding author. Tel.: +420 777 633 675; fax: +420 541 211 697.E-mail address: [email protected] (J. Kucerík).
capacity of HYA [5]. In fact, hydration and/or water retention capac-ity is probably one of the most important aspects of the hyaluronanbiological functions.
HYA hydration was studied by using several approaches amongwhich NMR [6], viscosimetry [7], ultrasonic and densitometryanalyses [5] and thermal analyses (mainly differential scanningcalorimetry, DSC) played an important role [8,9].
The application of DSC is mostly based on a relatively simpleprinciple; water present in concentrated (semi-diluted) solutions isfrozen and the enthalpy of ice melting obtained during the heatingrun is used to determine the hydration number [10]. Accordingly,water surrounding HYA molecule in the solution is categorizedinto three groups: non-freezing water (NFW) also called hydrationnumber, freezing-bound water (FBW) and free water (FW) [11].Such approach is frequently criticized since experimental arrange-ment and conditions can cause some errors and thus the value ofthe NFW obtained from those experiments does not perfectly fit tothe theoretically calculated values of hyaluronan hydration [12]. Infact, a problem with the presence of so-called glassy (amorphous)water may occur. Amorphous water develops during the freezingwhen segments of hyaluronan hinder the self-diffusion of water
0040-6031/$ – see front matter © 2011 Elsevier B.V. All rights reserved.doi:10.1016/j.tca.2011.04.034
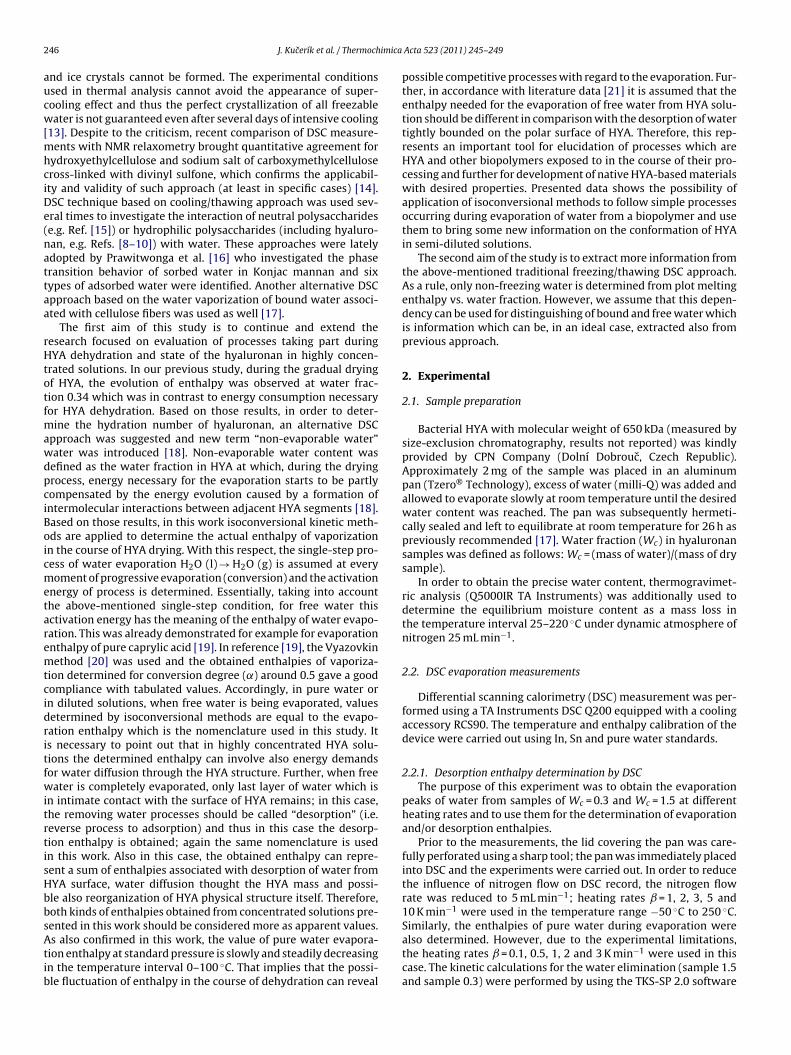
246 J. Kucerík et al. / Thermochimica Acta 523 (2011) 245– 249
and ice crystals cannot be formed. The experimental conditionsused in thermal analysis cannot avoid the appearance of super-cooling effect and thus the perfect crystallization of all freezablewater is not guaranteed even after several days of intensive cooling[13]. Despite to the criticism, recent comparison of DSC measure-ments with NMR relaxometry brought quantitative agreement forhydroxyethylcellulose and sodium salt of carboxymethylcellulosecross-linked with divinyl sulfone, which confirms the applicabil-ity and validity of such approach (at least in specific cases) [14].DSC technique based on cooling/thawing approach was used sev-eral times to investigate the interaction of neutral polysaccharides(e.g. Ref. [15]) or hydrophilic polysaccharides (including hyaluro-nan, e.g. Refs. [8–10]) with water. These approaches were latelyadopted by Prawitwonga et al. [16] who investigated the phasetransition behavior of sorbed water in Konjac mannan and sixtypes of adsorbed water were identified. Another alternative DSCapproach based on the water vaporization of bound water associ-ated with cellulose fibers was used as well [17].
The first aim of this study is to continue and extend theresearch focused on evaluation of processes taking part duringHYA dehydration and state of the hyaluronan in highly concen-trated solutions. In our previous study, during the gradual dryingof HYA, the evolution of enthalpy was observed at water frac-tion 0.34 which was in contrast to energy consumption necessaryfor HYA dehydration. Based on those results, in order to deter-mine the hydration number of hyaluronan, an alternative DSCapproach was suggested and new term “non-evaporable water”water was introduced [18]. Non-evaporable water content wasdefined as the water fraction in HYA at which, during the dryingprocess, energy necessary for the evaporation starts to be partlycompensated by the energy evolution caused by a formation ofintermolecular interactions between adjacent HYA segments [18].Based on those results, in this work isoconversional kinetic meth-ods are applied to determine the actual enthalpy of vaporizationin the course of HYA drying. With this respect, the single-step pro-cess of water evaporation H2O (l) → H2O (g) is assumed at everymoment of progressive evaporation (conversion) and the activationenergy of process is determined. Essentially, taking into accountthe above-mentioned single-step condition, for free water thisactivation energy has the meaning of the enthalpy of water evapo-ration. This was already demonstrated for example for evaporationenthalpy of pure caprylic acid [19]. In reference [19], the Vyazovkinmethod [20] was used and the obtained enthalpies of vaporiza-tion determined for conversion degree (˛) around 0.5 gave a goodcompliance with tabulated values. Accordingly, in pure water orin diluted solutions, when free water is being evaporated, valuesdetermined by isoconversional methods are equal to the evapo-ration enthalpy which is the nomenclature used in this study. Itis necessary to point out that in highly concentrated HYA solu-tions the determined enthalpy can involve also energy demandsfor water diffusion through the HYA structure. Further, when freewater is completely evaporated, only last layer of water which isin intimate contact with the surface of HYA remains; in this case,the removing water processes should be called “desorption” (i.e.reverse process to adsorption) and thus in this case the desorp-tion enthalpy is obtained; again the same nomenclature is usedin this work. Also in this case, the obtained enthalpy can repre-sent a sum of enthalpies associated with desorption of water fromHYA surface, water diffusion thought the HYA mass and possi-ble also reorganization of HYA physical structure itself. Therefore,both kinds of enthalpies obtained from concentrated solutions pre-sented in this work should be considered more as apparent values.As also confirmed in this work, the value of pure water evapora-tion enthalpy at standard pressure is slowly and steadily decreasingin the temperature interval 0–100 ◦C. That implies that the possi-ble fluctuation of enthalpy in the course of dehydration can reveal
possible competitive processes with regard to the evaporation. Fur-ther, in accordance with literature data [21] it is assumed that theenthalpy needed for the evaporation of free water from HYA solu-tion should be different in comparison with the desorption of watertightly bounded on the polar surface of HYA. Therefore, this rep-resents an important tool for elucidation of processes which areHYA and other biopolymers exposed to in the course of their pro-cessing and further for development of native HYA-based materialswith desired properties. Presented data shows the possibility ofapplication of isoconversional methods to follow simple processesoccurring during evaporation of water from a biopolymer and usethem to bring some new information on the conformation of HYAin semi-diluted solutions.
The second aim of the study is to extract more information fromthe above-mentioned traditional freezing/thawing DSC approach.As a rule, only non-freezing water is determined from plot meltingenthalpy vs. water fraction. However, we assume that this depen-dency can be used for distinguishing of bound and free water whichis information which can be, in an ideal case, extracted also fromprevious approach.
2. Experimental
2.1. Sample preparation
Bacterial HYA with molecular weight of 650 kDa (measured bysize-exclusion chromatography, results not reported) was kindlyprovided by CPN Company (Dolní Dobrouc, Czech Republic).Approximately 2 mg of the sample was placed in an aluminumpan (Tzero® Technology), excess of water (milli-Q) was added andallowed to evaporate slowly at room temperature until the desiredwater content was reached. The pan was subsequently hermeti-cally sealed and left to equilibrate at room temperature for 26 h aspreviously recommended [17]. Water fraction (Wc) in hyaluronansamples was defined as follows: Wc = (mass of water)/(mass of drysample).
In order to obtain the precise water content, thermogravimet-ric analysis (Q5000IR TA Instruments) was additionally used todetermine the equilibrium moisture content as a mass loss inthe temperature interval 25–220 ◦C under dynamic atmosphere ofnitrogen 25 mL min−1.
2.2. DSC evaporation measurements
Differential scanning calorimetry (DSC) measurement was per-formed using a TA Instruments DSC Q200 equipped with a coolingaccessory RCS90. The temperature and enthalpy calibration of thedevice were carried out using In, Sn and pure water standards.
2.2.1. Desorption enthalpy determination by DSCThe purpose of this experiment was to obtain the evaporation
peaks of water from samples of Wc = 0.3 and Wc = 1.5 at differentheating rates and to use them for the determination of evaporationand/or desorption enthalpies.
Prior to the measurements, the lid covering the pan was care-fully perforated using a sharp tool; the pan was immediately placedinto DSC and the experiments were carried out. In order to reducethe influence of nitrogen flow on DSC record, the nitrogen flowrate was reduced to 5 mL min−1; heating rates = 1, 2, 3, 5 and10 K min−1 were used in the temperature range −50 ◦C to 250 ◦C.Similarly, the enthalpies of pure water during evaporation werealso determined. However, due to the experimental limitations,the heating rates = 0.1, 0.5, 1, 2 and 3 K min−1 were used in thiscase. The kinetic calculations for the water elimination (sample 1.5and sample 0.3) were performed by using the TKS-SP 2.0 software
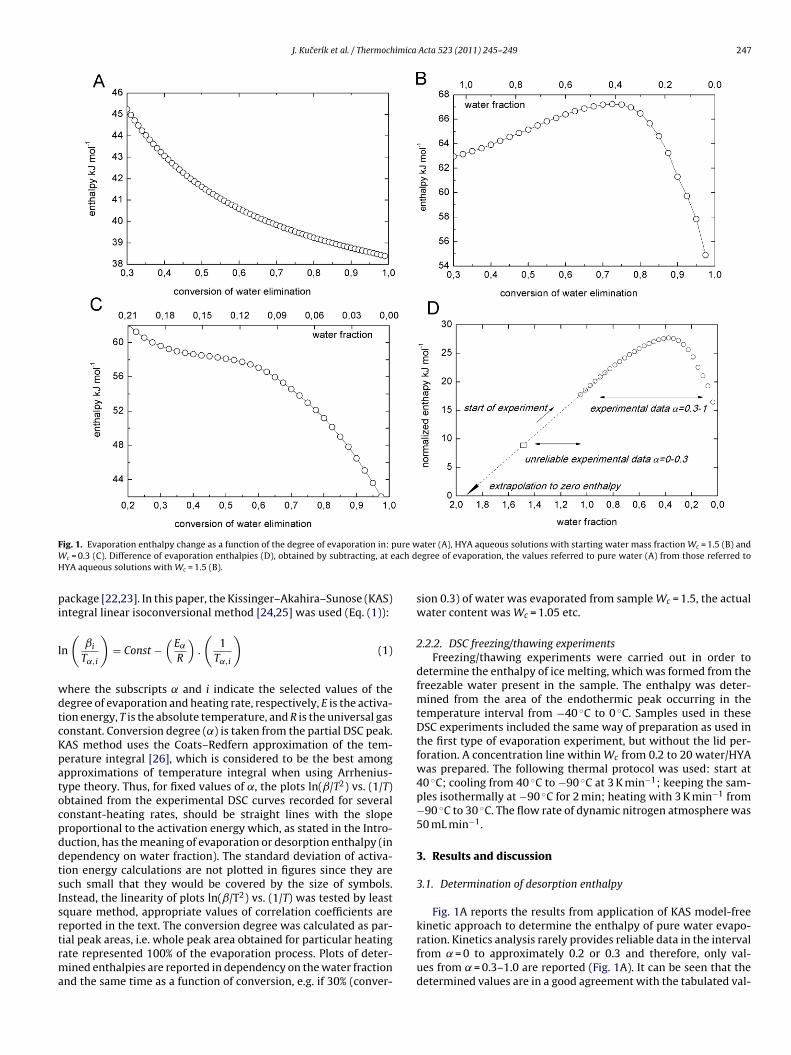
J. Kucerík et al. / Thermochimica Acta 523 (2011) 245– 249 247
Fig. 1. Evaporation enthalpy change as a function of the degree of evaporation in: pure water (A), HYA aqueous solutions with starting water mass fraction Wc = 1.5 (B) andWc = 0.3 (C). Difference of evaporation enthalpies (D), obtained by subtracting, at each degree of evaporation, the values referred to pure water (A) from those referred toHYA aqueous solutions with Wc = 1.5 (B).
package [22,23]. In this paper, the Kissinger–Akahira–Sunose (KAS)integral linear isoconversional method [24,25] was used (Eq. (1)):
ln
(ˇi
T˛,i
)= Const −
(E˛
R
).
(1
T˛,i
)(1)
where the subscripts and i indicate the selected values of thedegree of evaporation and heating rate, respectively, E is the activa-tion energy, T is the absolute temperature, and R is the universal gasconstant. Conversion degree (˛) is taken from the partial DSC peak.KAS method uses the Coats–Redfern approximation of the tem-perature integral [26], which is considered to be the best amongapproximations of temperature integral when using Arrhenius-type theory. Thus, for fixed values of ˛, the plots ln(ˇ/T2) vs. (1/T)obtained from the experimental DSC curves recorded for severalconstant-heating rates, should be straight lines with the slopeproportional to the activation energy which, as stated in the Intro-duction, has the meaning of evaporation or desorption enthalpy (independency on water fraction). The standard deviation of activa-tion energy calculations are not plotted in figures since they aresuch small that they would be covered by the size of symbols.Instead, the linearity of plots ln(ˇ/T2) vs. (1/T) was tested by leastsquare method, appropriate values of correlation coefficients arereported in the text. The conversion degree was calculated as par-tial peak areas, i.e. whole peak area obtained for particular heatingrate represented 100% of the evaporation process. Plots of deter-mined enthalpies are reported in dependency on the water fractionand the same time as a function of conversion, e.g. if 30% (conver-
sion 0.3) of water was evaporated from sample Wc = 1.5, the actualwater content was Wc = 1.05 etc.
2.2.2. DSC freezing/thawing experimentsFreezing/thawing experiments were carried out in order to
determine the enthalpy of ice melting, which was formed from thefreezable water present in the sample. The enthalpy was deter-mined from the area of the endothermic peak occurring in thetemperature interval from −40 ◦C to 0 ◦C. Samples used in theseDSC experiments included the same way of preparation as used inthe first type of evaporation experiment, but without the lid per-foration. A concentration line within Wc from 0.2 to 20 water/HYAwas prepared. The following thermal protocol was used: start at40 ◦C; cooling from 40 ◦C to −90 ◦C at 3 K min−1; keeping the sam-ples isothermally at −90 ◦C for 2 min; heating with 3 K min−1 from−90 ◦C to 30 ◦C. The flow rate of dynamic nitrogen atmosphere was50 mL min−1.
3. Results and discussion
3.1. Determination of desorption enthalpy
Fig. 1A reports the results from application of KAS model-freekinetic approach to determine the enthalpy of pure water evapo-ration. Kinetics analysis rarely provides reliable data in the intervalfrom = 0 to approximately 0.2 or 0.3 and therefore, only val-ues from = 0.3–1.0 are reported (Fig. 1A). It can be seen that thedetermined values are in a good agreement with the tabulated val-
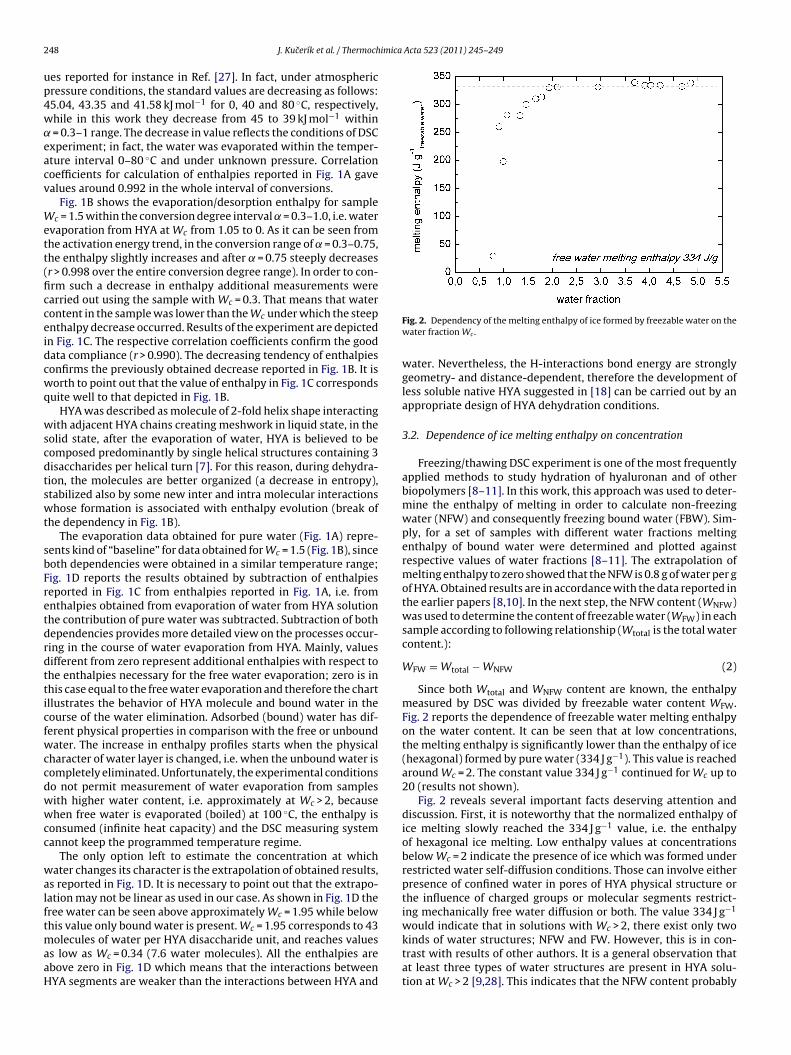
248 J. Kucerík et al. / Thermochimica Acta 523 (2011) 245– 249
ues reported for instance in Ref. [27]. In fact, under atmosphericpressure conditions, the standard values are decreasing as follows:45.04, 43.35 and 41.58 kJ mol−1 for 0, 40 and 80 ◦C, respectively,while in this work they decrease from 45 to 39 kJ mol−1 within
= 0.3–1 range. The decrease in value reflects the conditions of DSCexperiment; in fact, the water was evaporated within the temper-ature interval 0–80 ◦C and under unknown pressure. Correlationcoefficients for calculation of enthalpies reported in Fig. 1A gavevalues around 0.992 in the whole interval of conversions.
Fig. 1B shows the evaporation/desorption enthalpy for sampleWc = 1.5 within the conversion degree interval = 0.3–1.0, i.e. waterevaporation from HYA at Wc from 1.05 to 0. As it can be seen fromthe activation energy trend, in the conversion range of = 0.3–0.75,the enthalpy slightly increases and after = 0.75 steeply decreases(r > 0.998 over the entire conversion degree range). In order to con-firm such a decrease in enthalpy additional measurements werecarried out using the sample with Wc = 0.3. That means that watercontent in the sample was lower than the Wc under which the steepenthalpy decrease occurred. Results of the experiment are depictedin Fig. 1C. The respective correlation coefficients confirm the gooddata compliance (r > 0.990). The decreasing tendency of enthalpiesconfirms the previously obtained decrease reported in Fig. 1B. It isworth to point out that the value of enthalpy in Fig. 1C correspondsquite well to that depicted in Fig. 1B.
HYA was described as molecule of 2-fold helix shape interactingwith adjacent HYA chains creating meshwork in liquid state, in thesolid state, after the evaporation of water, HYA is believed to becomposed predominantly by single helical structures containing 3disaccharides per helical turn [7]. For this reason, during dehydra-tion, the molecules are better organized (a decrease in entropy),stabilized also by some new inter and intra molecular interactionswhose formation is associated with enthalpy evolution (break ofthe dependency in Fig. 1B).
The evaporation data obtained for pure water (Fig. 1A) repre-sents kind of “baseline” for data obtained for Wc = 1.5 (Fig. 1B), sinceboth dependencies were obtained in a similar temperature range;Fig. 1D reports the results obtained by subtraction of enthalpiesreported in Fig. 1C from enthalpies reported in Fig. 1A, i.e. fromenthalpies obtained from evaporation of water from HYA solutionthe contribution of pure water was subtracted. Subtraction of bothdependencies provides more detailed view on the processes occur-ring in the course of water evaporation from HYA. Mainly, valuesdifferent from zero represent additional enthalpies with respect tothe enthalpies necessary for the free water evaporation; zero is inthis case equal to the free water evaporation and therefore the chartillustrates the behavior of HYA molecule and bound water in thecourse of the water elimination. Adsorbed (bound) water has dif-ferent physical properties in comparison with the free or unboundwater. The increase in enthalpy profiles starts when the physicalcharacter of water layer is changed, i.e. when the unbound water iscompletely eliminated. Unfortunately, the experimental conditionsdo not permit measurement of water evaporation from sampleswith higher water content, i.e. approximately at Wc > 2, becausewhen free water is evaporated (boiled) at 100 ◦C, the enthalpy isconsumed (infinite heat capacity) and the DSC measuring systemcannot keep the programmed temperature regime.
The only option left to estimate the concentration at whichwater changes its character is the extrapolation of obtained results,as reported in Fig. 1D. It is necessary to point out that the extrapo-lation may not be linear as used in our case. As shown in Fig. 1D thefree water can be seen above approximately Wc = 1.95 while belowthis value only bound water is present. Wc = 1.95 corresponds to 43molecules of water per HYA disaccharide unit, and reaches valuesas low as Wc = 0.34 (7.6 water molecules). All the enthalpies areabove zero in Fig. 1D which means that the interactions betweenHYA segments are weaker than the interactions between HYA and
Fig. 2. Dependency of the melting enthalpy of ice formed by freezable water on thewater fraction Wc .
water. Nevertheless, the H-interactions bond energy are stronglygeometry- and distance-dependent, therefore the development ofless soluble native HYA suggested in [18] can be carried out by anappropriate design of HYA dehydration conditions.
3.2. Dependence of ice melting enthalpy on concentration
Freezing/thawing DSC experiment is one of the most frequentlyapplied methods to study hydration of hyaluronan and of otherbiopolymers [8–11]. In this work, this approach was used to deter-mine the enthalpy of melting in order to calculate non-freezingwater (NFW) and consequently freezing bound water (FBW). Sim-ply, for a set of samples with different water fractions meltingenthalpy of bound water were determined and plotted againstrespective values of water fractions [8–11]. The extrapolation ofmelting enthalpy to zero showed that the NFW is 0.8 g of water per gof HYA. Obtained results are in accordance with the data reported inthe earlier papers [8,10]. In the next step, the NFW content (WNFW)was used to determine the content of freezable water (WFW) in eachsample according to following relationship (Wtotal is the total watercontent.):
WFW = Wtotal − WNFW (2)
Since both Wtotal and WNFW content are known, the enthalpymeasured by DSC was divided by freezable water content WFW.Fig. 2 reports the dependence of freezable water melting enthalpyon the water content. It can be seen that at low concentrations,the melting enthalpy is significantly lower than the enthalpy of ice(hexagonal) formed by pure water (334 J g−1). This value is reachedaround Wc = 2. The constant value 334 J g−1 continued for Wc up to20 (results not shown).
Fig. 2 reveals several important facts deserving attention anddiscussion. First, it is noteworthy that the normalized enthalpy ofice melting slowly reached the 334 J g−1 value, i.e. the enthalpyof hexagonal ice melting. Low enthalpy values at concentrationsbelow Wc = 2 indicate the presence of ice which was formed underrestricted water self-diffusion conditions. Those can involve eitherpresence of confined water in pores of HYA physical structure orthe influence of charged groups or molecular segments restrict-ing mechanically free water diffusion or both. The value 334 J g−1
would indicate that in solutions with Wc > 2, there exist only twokinds of water structures; NFW and FW. However, this is in con-trast with results of other authors. It is a general observation thatat least three types of water structures are present in HYA solu-tion at Wc > 2 [9,28]. This indicates that the NFW content probably

J. Kucerík et al. / Thermochimica Acta 523 (2011) 245– 249 249
increases with increasing water content in the HYA sample in orderto compensate the total enthalpy measured by DSC to reach thevalues of 334 J g−1. This can be explained by processes of HYA disso-lution and progressive dilution, increasing content of water causesthe solvation of HYA molecular segments, swelling [4] (physicalstructure of HYA is slightly corrupted, water is still confined in atemporary pore system) and liberated (segments are free); possi-bly also some changes in conformation occur [29]. Similar increasein melting enthalpy was also observed for molecules of ibuprofenpacked in mesoporous silicon microparticles in dependency on thepore diameter [30]. Unlike silicon, hyauluronan is a water solublebiopolymer and increasing water content is supposed to destructthe metastable pores and vacancies formed during the drying. Itappears that also in this kind of experiment, Wc around 2 representsthe border concentration at which the water content is high enoughto allow to the hyaluronan segments to be perfectly separated. Itindicates that in the concentration Wc interval between 0.34 andapproximately 2 (depending on external conditions such as forexample temperature), the hyaluronan physical structure is stillcompact but progressively weakening with water content increase.As a result water molecules cannot freely move and hyaluronanchains are stabilized by mutual intermolecular interactions. AtWc > 2, the restriction of self-diffusion of water molecules is muchlower (appearance of free water). Interestingly enough Wc around2 is similar for both evaporation/desorption and freezing/thawingapproaches, which implies the mutual complementarity of bothtechniques.
4. Conclusions
In this work, the new approach useful for study of hyaluronanhydration based on the determination of evaporation/desorptionenthalpy was introduced. It was shown that this approach hasa potential to study structural changes of selected materials inthe course of their drying and possibly also reversibility of theirrehydration. Obtained results were comparable with calculationsfrom a slightly modified “classical” approach. The obtained resultssuggest that the hydration number of HYA and possibly of otherbiopolymers as well, should not be reported simply as one value;rather it should be reported as a concentration range in which thehydration number varies when a biopolymer is being dissolved andchange in a physical structure caused by water content should betaken into account as well. In fact, such value range would coverthe distribution of wettable and available surface charge on thebiopolymer surface, which can significantly differ in dry and wetstate of a biopolymer and can be drying-method-dependent. Thatapproach should be also more useful for further considerations con-cerning the designing of the HYA applications. For example, theexperiments published in this work support the possibility to influ-ence the structure of native HYA with respect to conditions duringthe drying. If an additional factor is introduced, either physicalor chemical (or both), the resulting native HYA structures wouldsignificantly differ in their supramolecular arrangement, provid-ing a relatively wide range of physical properties. This idea is notcompletely new; it just reflects the notion which was firstly pub-lished and probably forgotten almost five decades earlier [31]. Lastbut not least, results in Fig. 2 directly show the occurrence of icewith lower melting enthalpy in biopolymers which was frequentlyreported only for water confined in solid porous materials such asfor example silica [32].
Acknowledgements
This work was financially supported by the Ministry of Educa-tion, Youth and Sport of the Czech Republic project no. 0021630501.
Authors would like to thank Dr. Vladimír Velebny from CPN Com-pany, Dolní Dobrouc, Czech Republic for providing of HYA samples.
References
[1] P. Mlcochová, V. Hájková, B. Steiner, S. Bystricky, M. Koós, M. Medová, V.Velebny, Preparation and characterization of biodegradace alkylether deriva-tives of hyaluron, Carbohyd. Polym. 69 (2007) 344–353.
[2] Z. Bezáková, M. Hermannová, E. Drímalová, A. Malovíková, A. Ebringerová,V. Velebny, Effect of microwave irradiation on the molecular and structuralproperties of hyaluronan, Carbohyd. Polym. 73 (2008) 640–646.
[3] E. Drímalová, V. Velebny, V. Sasinková, Z. Hromádková, A. Ebringerová, Degra-dation of hyaluronan by ultrasonication in comparison to microwave andconventional heating, Carbohyd. Polym. 61 (2005) 420–426.
[4] A. Mrácek, K. Benesová, A. Minarík, P. Urban, L. Lapcík, The diffusion process ofsodium hyaluronate (Na-HA) and Na-HA-n-alkyl derivatives films swelling, J.Biomed. Mater. Res. A 83 (2007) 184–190.
[5] A. Davies, J. Gormally, E. Wyn-Jones, A study of hydration of sodium hyaluronatefrom compressibility and high precision densitometric measurements, Int. J.Biol. Macromol. 4 (1982) 436–438.
[6] S.G. Harding, O. Wick, A. Helander, N.-O. Ahnfelt, L. Kenne, NMR velocity imag-ing of the flow behaviour of hyaluronan solutions, Carbohyd. Polym. 47 (2002)109–119.
[7] M.K. Cowman, S. Matsuoka, Experimental approaches to hyaluronan structure,Carbohyd. Res. 340 (2005) 791–809.
[8] H. Hatakeyama, T. Hatakeyama, Interaction between water and hydrophilicpolymers, Thermochim. Acta 308 (1998) 3–22.
[9] J. Lui, M.K. Cowman, Thermal analysis of semi-dilute hyaluronan solutions, J.Therm. Anal. Calorim. 59 (2000) 547–557.
[10] H. Yoshida, T. Hatakeyama, H. Hatakeyama, Characterization of water inpolysaccharide hydrogels by DSC, J. Therm. Anal. 40 (1993), 483- 439.
[11] T. Hatakeyama, H. Hatakeyama, K. Nakamura, Non-freezing water content ofmono- and divalent cation salts of polyelectrolyte–water systems studied byDSC, Thermochim. Acta 253 (1995) 137–148.
[12] K. Haxaire, Y. Marechal, M. Milas, M. Rinaudo, Hydration of polysaccharidehyaluronan observed by IR spectrometry. I. Preliminary experiments and bandassignments, Biopolymers 72 (2003) 10–20.
[13] J. Wolfe, G. Bryant, K.L. Koster, What is unfreezable water, how unfreezable isit and how much is there? Cry Lett. 23 (2002) 157–166.
[14] D. Capitani, G. Mesitieri, F. Porro, N. Proietti, A.L. Segre, NMR and calorimet-ric investigation of water in a superabsorbing crosslinked network based oncellulose derivatives, Polymer 44 (2003) 6589–6598.
[15] C. Fringant, J. Desbrieres, M. Milas, M. Rinaudo, C. Joly, M. Escoubes, Character-isation of sorbed water molecules on neutral and ionnic polysaccharides, Int. J.Biol. Macromol. 18 (1996) 281–286.
[16] P. Prawitwonga, S. Takigamia, G.O. Phillipsb, Phase transition behavior of sorbetwater in Konjac mannan, Food Hydrocolloids 21 (2007) 1368–1373.
[17] M. Takahashi, T. Hatakeyama, H. Hatakeyama, Phenomenological theorydescribing the behaviour of non-freezing water in structure formation processof polysaccharide aqueous solutions, Carbohyd. Polym. 41 (2000) 91–95.
[18] A. Prusová, D. Smejkalová, M. Chytil, V. Velebny, J. Kucerík, An alternativeDSC approach to study hydration of hyaluronan, Carbohyd. Polym. 82 (2010)498–503.
[19] S. Arias, M.M. Prieto, B. Ramajo, A. Espina, J.R. Garcia, Model-free kineticsapplied to the vaporization of caprylic acid, J. Therm. Anal. Calorim. 98 (2009)457–462.
[20] S. Vyazovkin, N. Sbirrazzuoli, Confidence intervals for the activation energyestimated by few experiments, Anal. Chim. Acta 355 (1997) 175–180.
[21] T. Hatakeyama, K. Nakamura, H. Hatakeyama, Vaporization of bound waterassociated with cellulose fibres, Thermochim. Acta 352–353 (2000) 233– 239.
[22] A. Rotaru, M. Gosa, P. Rotaru, Computational thermal and kinetic analysissoftware for non-isothermal kinetics by standard procedure, J. Therm. Anal.Calorim. 94 (2008) 367–371.
[23] A. Rotaru, M. Gosa, Computational thermal and kinetic analysis, J. Therm. Anal.Calorim. 97 (2009) 421–426.
[24] H.E. Kissinger, Reaction kinetics in differential thermal analysis, Anal. Chem.29 (1957) 1702–1706.
[25] T. Akahira, T. Sunose, Trans 1969 joint convention of four electrical institutes,Res. Rep. Chiba Inst. Technol. 16 (1971) 22–31.
[26] A.W. Coats, J.P. Redfern, Kinetic parameters from thermogravimetric data,Nature 201 (1964) 68–69.
[27] K.N. Marsh (Ed.), Recommended Reference Materials for the Realization ofPhysicochemical Properties, Blackwell, Oxford, 1987.
[28] A. Prusová, P. Conte, J. Kucerík, G. Alonzo, Dynamics of hyaluronan aqueoussolutions as assessed by fast field cycling NMR relaxometry, Anal. Bioanal.Chem. 397 (2010) 3023–3028.
[29] P. Matteini, L. Dei, E. Carretti, N. Volpi, A. Goti, R. Pini, Structural behavior ofhighly concentrated hyaluronan, Biomacromolecules 10 (2009) 1516–1522.
[30] J. Riikonen, E. Mäkilä, J. Salonen, V.P. Lehto, Determination of the physical stateof drug molecules in mesoporous silicon with different surface chemistries,Langmuir 25 (2009) 6137–6142.
[31] T.C. Laurent, The amorphous X-ray diffractogram of hyaluronic acid, Ark Kemi11 (1957) 513–518.
[32] K. Morishide, H. Yasunaga, Y. Matsutani, Effect of pore shape on freezing andmelting temperatures of water, J. Phys. Chem. C 114 (2010) 4028–4035.
63
Appendix 3
Šmejkalová, D., Hermannová, M., Šulánková, R., Průšová, A., Kučerík, J., Velebný, M.
(2012) Structural and conformation differences of acylated hyaluronan modified in protic
and aprotic solvent system. Carbohydrate Polymers 87: 1460–1466.

Carbohydrate Polymers 87 (2012) 1460– 1466
Contents lists available at SciVerse ScienceDirect
Carbohydrate Polymers
j ourna l ho me pag e: www.elsev ier .com/ locate /carbpol
Structural and conformational differences of acylated hyaluronan modified inprotic and aprotic solvent system
Daniela Smejkalováa,∗, Martina Hermannováa, Romana Sulákováa, Alena Prusováb,Jirí Kuceríkb, Vladimír Velebnya
a Contipro C, Dolní Dobrouc 401, 561 02 Dolní Dobrouc, Czech Republicb Brno University of Technology, Faculty of Chemistry, Purkynova 118, 612 00 Brno, Czech Republic
a r t i c l e i n f o
Article history:Received 7 July 2011Received in revised form 2 September 2011Accepted 12 September 2011Available online 29 September 2011
Keywords:HyaluronanAcylationNMRDSCUV–visMass spectrometry
a b s t r a c t
Acylated hyaluronan (HA) in aqueous (DMSO/H2O) and nonaqueous (DMSO) solutions was studied bymeans of nuclear magnetic resonance, differential scanning calorimetry (DSC), mass spectrometry andUV/vis spectroscopy. It has been demonstrated that structural and conformational properties of the acy-lated hyaluronan derivates are strongly dependent on the nature of reaction solvent. Acylation in DMSOwas more selective than that carried out in DMSO/H2O, though in both cases in average a maximum ofone acyl chain was detected per HA dimer. The hydrophobic functionalization of hyaluronan inducedits interaction with hydrophobic dye as a consequence of acyl chain aggregation. The higher the degreeof acylation the more hydrophobic dye was interacting with HA. For concentrated samples, aggregationwas more evident in case of acylated HA in aqueous solution. This phenomenon was explained by itsdifferent conformational arrangement in solution which was further supported by DSC data indicatingan existence of hydrophobic cavities. The formation of self-aggregated assemblies indicates potentialapplications of this type of HA derivate as drug delivery system.
© 2011 Elsevier Ltd. All rights reserved.
1. Introduction
Carbohydrate fatty acid esters are an important class ofbiodegradable and non-toxic surfactants with broad applicationsin food, cosmetics and pharmaceutical industries as detergents,oral care products and medical supplies (Hill & LeHen-Ferrenbach,2008). They were also reported to be applicable as antibioticsand antitumorals (Deleu & Paquot, 2004). In addition, non-toxicand biodegradable polysaccharide surfactants are considered tobe attractive drug delivery systems. Among polysaccharides, agreat attention is focused on esterification of hyaluronan (HA)(Kawaguchi, Matsukawa, & Ishigami, 1993; Kong, Chen, & Park,2011; Taglienti, Valentini, Sequi, & Crescenzi, 2005).
HA is a linear polysaccharide consisting of alternating�-1,4-linked units of �-1,3-linked glucuronic acid and N-acetyl-d-glucosamine (Laurent, 1998; Scott, 1998). HA is a main componentof the extracellular matrix in connective, epithelial, and neural tis-sues and is known to play an important role in organ development,cell proliferation and migration. Additionally, HA contributes to thelubrication and maintenance of cartilage, where it is a major com-ponent of synovial fluid and forms a coating around chondrocytes(Collis et al., 1998; Entwistle, Hall, & Turley, 1996; Laurent, 1998).
∗ Corresponding author. Tel.: +420 465519569; fax: +420 465543793.E-mail address: [email protected] (D. Smejkalová).
Except for being biodegradable and non-toxic, HA is biocompatibleand renewable, which is important on industrial scale productionof HA derivates.
The major advantage of modified HA over the native HA isthe higher resistance against enzymatic degradation (Abatangelo,Barbucci, Brun, & Lamponi, 1997; Prestwitch, Marecak, Marecek,Vercuysse, & Ziebell, 1998; Soltés et al., 2006). In addition, besidesretaining its inherently superior properties, HA derivates acquireadditional physicochemical characteristics that can be tailoredaccording to the desired requirements. For example, HA hav-ing desired amount of hydrophobic functional groups may beachieved varying the degree of substitution. In case of esteri-fication, the degree of substitution and the length of attachedcarbon chain are directly related to conformational behavior ofthe substituted molecule in solution and the possibility of formingsupramolecular assemblies (Akiyoshi & Sunamoto, 1996). Forma-tion of supramolecular assemblies is than in turn related to thepossibility of carbohydrate interaction with non-polar compoundsand therefore directly affects its pharmaceutical and industrialapplications. Modified HA is therefore also considered to have agreat potential as a novel drug carrier in form of conjugates. Despiteits excellent biocompatible and biodegradable properties, HA baseddrug delivery systems have been reported to work as an efficientdepot for sustained release of protein drugs without denaturation(Oh et al., 2010; Prestwitch & Vercruysse, 1998). Moreover, theabsence of positive charge on HA surface alleviate the problems
0144-8617/$ – see front matter © 2011 Elsevier Ltd. All rights reserved.doi:10.1016/j.carbpol.2011.09.057
D. Smejkalová et al. / Carbohydrate Polymers 87 (2012) 1460– 1466 1461
with severe cytotoxicity and aggregations with serum proteins inthe body found for cationic liposomes and polymers investigatedas drug carriers (Oh et al., 2010).
In this study, we followed the structural and conformationalchanges of HA induced after acylation with hexanoic anhydride inDMSO and DMSO/H2O solvent. The main attention was focused onthe comparison of reaction selectivity and conformational changesof HA followed after acylation. The structural changes were studiedby NMR, ESI-MS/MS and DSC. Formation of hydrophobic domainswas examined by comparing the ability of acyl derivates to dissolvea hydrophobic dye.
2. Experimental
2.1. Materials
Hyaluronic acid sodium salt (200 kDa, 155 kDa and 34 kDa) wasprovided by CPN Dolní Dobrouc, Czech Republic. Hexanoic anhy-drides, triethylamine, dimethylsulfoxide, dimethylaminopyridine(DMAP), Oil Red O (Solvent Red 27, Sudan Red 5B, C.I. 26125,C26H24N4O), and deuterated water were of analytical grade andpurchased from Sigma–Aldrich.
2.2. Preparation of hyaluronan acid form and hyaluronan sodiumsalt
Hyaluronan (Mw = 200 kDa, 15 g) was dissolved in 600 mL ofdemineralized water and then Amberlite IR 120 Na exchange resin(wet state, 100 g) was added to the mixture. The mixture waskept at room temperature with occasional stirring. Cation exchangeresin was removed by centrifugation at 5000 rpm for 5 min and theresulting solution was lyophilized. About 13 g of hyaluronan acidform Mw = 50 kDa was obtained.
Since each transformation of hyaluronan into its acid formcauses HA degradation, it was necessary to have a comparable start-ing Mw of both HA sodium salt and HA acid form as both materialswere used as substrates for acylation reaction. For this reason, theobtained hyaluronan acid form was divided into two parts. One partof the material was used for acylation reaction in its acid form. Thesecond half of hyaluronan acid form was returned into its initialsodium salt state in a following way. Hyaluronan acid form wasdiluted in water, neutralized to pH 6.5 and precipitated off withabsolute 2-propanol. The precipitate was washed three times with80% 2-propanol, twice with absolute 2-propanol and dried at 40 ◦C.
2.3. Acylation of hyaluronan sodium salt (Ac-HA-Na)
HA sodium salt (5 g) was first dissolved in 50 mL of deminer-alized water and then diluted with 50 mL of DMSO. Hexanoicanhydride (2.5 equiv./HA dimer), triethylamine (2.5 equiv./HAdimer) and DMAP (0.05 equiv./HA dimer) were added into the mix-ture and the mixture was stirred at room temperature for 2 h. Atthe end of reaction, the mixture was diluted with 100 mL of waterfollowed by the addition of 15 mL of saturated NaCl solution. Theproduct Ac-HA-Na (acylated HA-Na+ in its Na+ form) was precipi-tated with another 200 mL of absolute 2-propanol. The precipitatewas first washed three times with 80% 2-propanol in water andthen with absolute 2-propanol. The solid was filtered and dried inoven at 40 ◦C. The yield of final product was 5.4 g. The degree ofsubstitution (DS) calculated from NMR spectra was 70%.
2.4. Acylation of hyaluronan acid form (Ac-HA-H)
Hyaluronan acid form (5 g) was dissolved in 100 mL of DMSO.Hexanoic anhydride (1.5–3.0 equiv./HA dimer), triethylamine (1.5,2.5 and 3.0 equiv./HA dimer) and DMAP (0.05 equiv./HA dimer)
were added into the mixture and the mixture was stirred at roomtemperature for 2 h. At the end of reaction, the reaction wasquenched with 100 mL of water and the pH was adjusted with 0.1 MNaOH to pH 6, followed by the addition of 15 mL of saturated NaClsolution. The product Ac-HA-H (acylated HA-H+ in its Na+ form)was precipitated with 200 mL of absolute 2-propanol. The precip-itate was washed three times with 80% 2-propanol in water andthen absolute 2-propanol. The solid was filtered and dried in ovenat 40 ◦C. The yield of final product was between 4.5 and 4.8 g. Thedegree of substitution (DS) calculated from NMR spectra was 33%,60% and 70% for 1.5, 2.5 and 3.0 equiv. of triethylamine/HA dimer,respectively.
2.5. NMR analyses
HA acyl derivates (10 mg) were solubilized in 750 �L of D2O,transferred into NMR tubes and directly analyzed.
The NMR analyses were performed on Bruker AvanceTM
500 MHz equipped with BBFO plus probe. The 1H and 13C chemi-cal shift were referenced to 3-trimethylsilylpropanoic acid sodiumsalt (TSPA) used as an internal standard. 1H–1H TOCSY spectra wererecorded with 2048 data points, 80 scans per increment and 128increments. TOCSY mixing time was set at 80 ms. 1H–13C HSQCspectra were acquired using gradient pulse sequences and 2048data points, 80 scans per increment, 256 increments, and heteronu-clear scalar coupling C–H set at 145 Hz. DOSY (diffusion orderedspectra) were obtained using a stimulated echo pulse sequencewith bipolar gradients (STEBPGP). Scans (32) were collected using2.5 ms sine-shaped pulses (5 ms bipolar pulse pair) ranging from0.674 to 32.030 G cm−1 in 24 increments with a diffusion time of200–600 ms, and 8192 time domain data points. Apodization wasmade by multiplying the data with a line broadening of 1.0 Hz, spikesuppression factor of 4.0, maximum interactions number set to 100,noise sensitivity factor of 2, and number of components set to 1.
1H NMR spectra were used for the calculation of the degree ofsubstitution (DS) of acylated HA. DS (in %) was determined as rela-tive integral of signal at 2.4 ppm, when the integration of signal at2.0 ppm was normalized to 150. Explanation of resonating signalsis given in the text.
2.6. MS analyses
Powdered hyaluronan (100 mg) was first dissolved in 10 mLof 0.1 M sodium acetate with 0.15 M NaCl (pH 5.3, adjustedwith glacial acetic acid), and then incubated with 2000 IU ofhyaluronidase (Finepharm) at 37 ◦C for 2 days. The enzyme wasremoved by short boiling of the solution at the end of incuba-tion. The sample was filtered through 0.2 �m Nylon syringe filter.Filtered solution (2 mL) was transferred into the Vivaspin 15R con-centrator (2000 MWCO Hydrosart, Sartorius) and centrifuged at9000 rpm for 15 min. After preconcentration of the sample, the con-centrator was filled with 10 mL of deionized water and centrifugedat 9000 rpm for 30 min. 4 wash cycles were used to remove theinitial salt content. The sample was recovered from the bottomof the concentrator, diluted with 0.1% HCOOH:methanol = 1:1 toa final concentration of 1 mg mL−1 and directly injected into massspectrometer.
Mass spectroscopic analyses of digested and desalted derivateswere performed using a Synapt HDMS mass spectrometer (Waters),equipped with an electrospray ionization source operating in neg-ative ion mode. The effluent was introduced into an electrospraysource with a syringe pump at a flow rate of 10 �L min−1. Nitrogenwas used as cone gas (100 L h−1) and desolvation gas (800 L h−1).Capillary voltage was set at 3 kV. Sampling cone was set at 100 V.Extraction cone was set at 5 V. The source block temperature wasset at 100 ◦C, while the desolvation temperature was 250 ◦C. For

1462 D. Smejkalová et al. / Carbohydrate Polymers 87 (2012) 1460– 1466
each sample full MS and MS/MS scans from m/z 50 to 2000 wereacquired for 2 min. For MS/MS measurements, argon was used asa collision gas. The collision energy was optimized to fragment theion of interest, typically 55 eV for the ions with higher m/z and 25 eVfor the ions with lower m/z. Data were collected at 1 scan s−1 andelaborated using MassLynx software.
2.7. UV–vis analyses
Powdered HA (10–200 mg) HA 34 kDa, HA 155 kDa, Ac-HA-Hand Ac-HA-Na was first soaked with 750 �L of H2O and then leftdissolving overnight under constant stirring. Then 200 �L of Oil RedO solution (20 mg mL−1 in hexane) was added to the dissolved HAsamples, the mixtures were heated up to 50 ◦C and shaken for 2 h at50 ◦C, and for 2 days at room temperature. The experiments wererepeated in two independent series, each consisting of replicatesamples. Absorbances (522 nm) of the water phase were measuredwith UV-Vis Carry 100 (Varian).
2.8. Thermal analyses
HA samples of approximately 2 mg (weighted with an accuracyof ±0.01 mg) were placed in aluminum sample pans (TA Instru-ments, Tzero® Technology) and the excess of water (milli-Q) wasadded. Surplus of water was allowed to slowly evaporate at roomtemperature until the desired water content (Wc = mass of water(g)/mass of dry sample (g); [Wc] = g g−1) was obtained. Several sam-ples having Wc between 0.1 and 3 g g−1 were prepared for each HAmaterial. The pans were subsequently hermetically sealed and leftto equilibrate at room temperature for 72 h. Similar way of sam-ples preparation was used for freezing/thawing as well as for theevaporation experiments.
Differential scanning calorimetry (DSC) was carried out usingthe TA Instruments DSC Q-200 equipped with a cooling accessoryRCS-90 and assessed by the TA-Universal Analysis 2000 software.
The following thermal protocol was used for freezing/thawingexperiments: start at 40.0 ◦C; cooling from 40.0 to −70.0 ◦C at3.0 ◦C min−1; isothermal at −70.0 ◦C for 1.0 min; heating from−70.0 to 40 ◦C at 5.0 ◦C min−1. Flow rate of dynamic nitrogen atmo-sphere was 50 mL min−1.
The following thermal protocol was used for the measurementof evaporation enthalpy: equilibration at 27.0 ◦C; cooling from 27.0to −50.0 ◦C at 10.0 ◦C min−1; isothermal at −50.0 ◦C for 1.0 min;heating from −50.0 to 200.0 ◦C at 5.0 ◦C min−1 and switching theflow rate of nitrogen from 50 mL min−1 to 5 mL min−1. Immedi-ately before the measurement, the hermetic lid (necessary for thesample preparation) was perforated using a sharp tool and the mea-surement was carried out straightway (Prusová, Smejkalová, Chytil,Velebny, & Kucerík, 2010).
To obtain precise water content, thermogravimetry (TA Instru-ments, Q500 IR) was used to determine the equilibrium moisturecontent as a mass loss in the temperature interval 25–220 ◦C underdynamic atmosphere of nitrogen 25 mL min−1.
2.9. Size exclusion chromatography coupled to multi-angle lightscattering (SEC-MALS)
SEC was performed using an Agilent 1100 series liquidchromatograph equipped with a degasser (Model G1379A), anisocratic HPLC pump (Model G1310A), an automatic injector(Model G1313A), a column thermostat (Model G1316A), a DAWNEOS multi-angle light scattering photometer followed by anOptilab rEX differential refractometer (both from Wyatt Tech-nology Corporation, USA). The injection volume was 100 �L of0.1–1.0% (w/v) solutions. The separation was carried out using PLaquagel-OH 40 (300 mm × 7.5 mm; 8 �m) and PL aquagel-OH 20
(300 mm × 7.5 mm; 5 �m) columns connected in series. Columnswere thermostated at 40 ◦C. The mobile phase was 0.1 M sodiumphosphate buffer (pH adjusted to 7.5) + 0.05% NaN3 at a flow rate0.8 mL min−1. Data acquisition and molecular weights calculationswere performed using the ASTRA V software (Wyatt TechnologyCorporation, USA). The specific refractive index increment dn/dcwas determined at 690 nm using the Optilab rEX refractome-ter for all samples according to procedure described elsewhere(Podzimek, Hermannová, Bílerová, Bezáková, & Velebny, 2010). Themean value of 9 dn/dc measurements was 0.155 ± 0.003 mL g−1.
Each sample was filtered through Acrodisc Syringe Filter0.45 �m 25 mm diameter with the Supor membrane (Pall). Allreagents for SEC were HPLC grade and the mobile phase was filteredthrough Nylaflo Nylon Membrane Filter 0.2 �m (Pall).
3. Results and discussion
3.1. Acylation of hyaluronan
One of the main problems related to chemical modification ofhyaluronan is its insolubility in organic solvents. For this reason,hyaluronan is mostly transformed prior modification into its acidform which is soluble in polar organic solvents such as DMSO(Oudshoorn, Rissmann, Bouwstra, & Hennink, 2007). However, themajor disadvantage of this procedure is the contemporary degra-dation of HA during cation exchange step. For example, in this worka starting HA material was having Mw = 200 kDa, while after trans-formation into its acid form the Mw was reduced to about 50 kDa.For this reason, we tried to overcome this disadvantage by a directacylation of hyaluronan as sodium salt in DMSO/H2O solution. Theacylation reactions are shown in Fig. 1. Regardless of the startingmaterial and solvent choice, sodium salt of acylated HA was formedin both cases (Fig. 1). However, since the choice of reaction solventmay affect substitution position on HA chain, modified HA prod-ucts received after acylation in DMSO (Ac-HA-H) and DMSO/H2O(Ac-HA-Na) were further analyzed and compared by NMR, LC–MS,UV–vis and thermal analysis.
3.2. NMR analyses
1H NMR spectra of HA, Ac-HA-H and Ac-HA-Na are shown inFig. 2. All of the spectra show typical proton chemical shifts of HAinvolving signal at 2.0 ppm belonging to COCH3 group, skeletal sig-nals at 3.4–3.9 and anomeric resonances at 4.4–4.6 ppm. Remainingsignals detected in modified HA at 0.8, 1.2, 1.5 and 2.4 ppm wereattributed to the CH2 in acyl chain as shown in Fig. 2. Relativeintegration of signals at 2.0 and 2.4 ppm were used for the determi-nation of degree of substitution (DS). A comparable DS = 70% wasdetermined for both acylated products shown in Fig. 2. A downfieldchemical shift of one of the HA skeletal signals is evident in Ac-HA-Na at 3.1 ppm. Less significant is the appearance of a new signal at3.3 ppm in Ac-HA-H. The new signals detected after HA modifica-tion are different for Ac-HA-Na and Ac-HA-H, and thus suggest thatacylation reaction in DMSO yielded structurally different reactionoutcome as compared to DMSO/H2O reaction.
The linkage between hexyl chain and HA was established in bothderivates by DOSY experiment (data not shown). Because of themarked difference between the diffusion coefficients of hexanoicacid and HA, the DOSY map can easily establish the presence of non-attached hexanoic acid to HA, which obviously is much faster thanthe diffusion of the bound acyl chain. In both cases, DOSY exper-iments showed similar diffusion behavior for all signals between0.8 and 4.6 ppm (except for isopropanol and HDO signal) and thusindicated that all of the proton resonances in this region belongedto one structural complex.
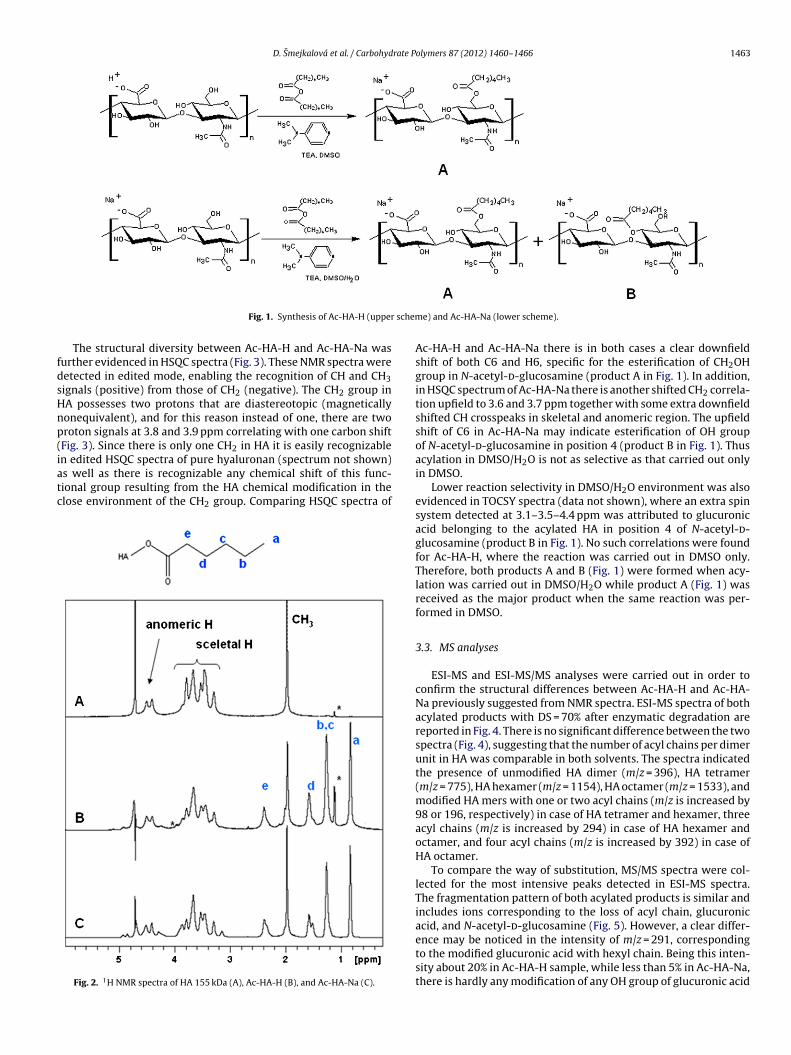
D. Smejkalová et al. / Carbohydrate Polymers 87 (2012) 1460– 1466 1463
Fig. 1. Synthesis of Ac-HA-H (upper scheme) and Ac-HA-Na (lower scheme).
The structural diversity between Ac-HA-H and Ac-HA-Na wasfurther evidenced in HSQC spectra (Fig. 3). These NMR spectra weredetected in edited mode, enabling the recognition of CH and CH3signals (positive) from those of CH2 (negative). The CH2 group inHA possesses two protons that are diastereotopic (magneticallynonequivalent), and for this reason instead of one, there are twoproton signals at 3.8 and 3.9 ppm correlating with one carbon shift(Fig. 3). Since there is only one CH2 in HA it is easily recognizablein edited HSQC spectra of pure hyaluronan (spectrum not shown)as well as there is recognizable any chemical shift of this func-tional group resulting from the HA chemical modification in theclose environment of the CH2 group. Comparing HSQC spectra of
Fig. 2. 1H NMR spectra of HA 155 kDa (A), Ac-HA-H (B), and Ac-HA-Na (C).
Ac-HA-H and Ac-HA-Na there is in both cases a clear downfieldshift of both C6 and H6, specific for the esterification of CH2OHgroup in N-acetyl-d-glucosamine (product A in Fig. 1). In addition,in HSQC spectrum of Ac-HA-Na there is another shifted CH2 correla-tion upfield to 3.6 and 3.7 ppm together with some extra downfieldshifted CH crosspeaks in skeletal and anomeric region. The upfieldshift of C6 in Ac-HA-Na may indicate esterification of OH groupof N-acetyl-d-glucosamine in position 4 (product B in Fig. 1). Thusacylation in DMSO/H2O is not as selective as that carried out onlyin DMSO.
Lower reaction selectivity in DMSO/H2O environment was alsoevidenced in TOCSY spectra (data not shown), where an extra spinsystem detected at 3.1–3.5–4.4 ppm was attributed to glucuronicacid belonging to the acylated HA in position 4 of N-acetyl-d-glucosamine (product B in Fig. 1). No such correlations were foundfor Ac-HA-H, where the reaction was carried out in DMSO only.Therefore, both products A and B (Fig. 1) were formed when acy-lation was carried out in DMSO/H2O while product A (Fig. 1) wasreceived as the major product when the same reaction was per-formed in DMSO.
3.3. MS analyses
ESI-MS and ESI-MS/MS analyses were carried out in order toconfirm the structural differences between Ac-HA-H and Ac-HA-Na previously suggested from NMR spectra. ESI-MS spectra of bothacylated products with DS = 70% after enzymatic degradation arereported in Fig. 4. There is no significant difference between the twospectra (Fig. 4), suggesting that the number of acyl chains per dimerunit in HA was comparable in both solvents. The spectra indicatedthe presence of unmodified HA dimer (m/z = 396), HA tetramer(m/z = 775), HA hexamer (m/z = 1154), HA octamer (m/z = 1533), andmodified HA mers with one or two acyl chains (m/z is increased by98 or 196, respectively) in case of HA tetramer and hexamer, threeacyl chains (m/z is increased by 294) in case of HA hexamer andoctamer, and four acyl chains (m/z is increased by 392) in case ofHA octamer.
To compare the way of substitution, MS/MS spectra were col-lected for the most intensive peaks detected in ESI-MS spectra.The fragmentation pattern of both acylated products is similar andincludes ions corresponding to the loss of acyl chain, glucuronicacid, and N-acetyl-d-glucosamine (Fig. 5). However, a clear differ-ence may be noticed in the intensity of m/z = 291, correspondingto the modified glucuronic acid with hexyl chain. Being this inten-sity about 20% in Ac-HA-H sample, while less than 5% in Ac-HA-Na,there is hardly any modification of any OH group of glucuronic acid

1464 D. Smejkalová et al. / Carbohydrate Polymers 87 (2012) 1460– 1466
Fig. 3. 2D HSQC NMR spectra of Ac-HA-H and Ac-HA-Na. Structural differences are indicated by circles.
in Ac-HA-Na. This finding which was observed in all other MS/MSspectra (not shown), confirms the previous interpretation of NMRdata, where the mixture of products A and B (Fig. 1) substituted withacyl chain in different positions on N-acetyl-d-glucosamine weresuggested as the major products in DMSO/H2O. Although product Awas suggested as the major product in the case of Ac-HA-H, accord-ing to the results from MS spectra, acyl substitution of glucuronicacid cannot be excluded.
3.4. UV–vis analyses
In order to determine a possible hydrophobic aggregation of acylchains in HA derivates, Ac-HA-H (DS from 33 to 70%) and Ac-HA-Na(DS = 70%) were mixed with Oil Red O which is a hydropho-bic dye commonly used for staining of neutral triglycerides andlipids on froze sections and some lipoproteins on paraffin sec-tions. Therefore, it is expected that Oil Red O will dissolve onlyin hydrophobic domains of HA. The results of Oil Red O absorp-tion by two different HA concentrations are reported in Fig. 6. Thelowest absorbance A = 0.06–0.08 of hydrophobic dye at hyaluronanconcentration c = 10 mg mL−1 was observed for unmodified 34 kDaand acylated Ac-HA-H with DS = 33%, followed by unmodified HA155 kDa (A = 0.1). Thus low degree of acylation did not induceany significant formation of hydrophobic domains. This situationchanges for acylation degree of 60 and 70%, where the presence ofhydrophobic domains is indicated by a 3.5 times higher absorbance(A = 0.5) as compared to control unmodified samples. In fact, in thiscase it seems that higher DS indicates larger amounts of hydropho-bic domains in HA samples and for this reason also higher affinitytowards hydrophobic compounds.
However, a completely different absorption behavior wasobserved at hyaluronan concentration c = 15 mg mL−1. Here, againthe lowest absorbances (A = 0.1–0.2) were measured for HA 34 kDaand Ac-HA-H (DS = 33%). But then unlike the previous case, HA155 kDa showed a two fold absorbance increase to A = 0.4, whichwas comparable to A = 0.4 and 0.5 observed for acylated samplesAc-HA-H with DS of 60 and 70%. The detected absorbance increasein 155 kDa HA is in agreement with the observation of hydrophobicpatches in aggregated HA (Scott, Cummings, Brass, & Chen, 1991;Scott et al., 1990). No such observation was made in case of 34 kDaHA probably due to its lower molecular size. A significant changewas found for Ac-HA-Na (DS = 70%) sample whose absorbance isa double from that of Ac-HA-H (DS = 70%). Since DS of the acy-lated HA in this last case is comparable, the amount of acyl chainsattached to HA is not the only driving force influencing the amountof bound hydrophobic dye. The data suggest that except for DS, it isalso important which OH group in HA is substituted. In Ac-HA-Naacylation mainly occurred either at position 4 or 6 of N-acetyl-d-glucosamine, while in Ac-HA-H in position 6. The absorption datasuggest a more significant aggregation of acyl chains in Ac-HA-Na,which could have resulted from the vicinity of acyl chains withinAc-HA-Na secondary structure and easier formation of ‘micelle-like’ conformation as compared to Ac-HA-H. True micelles are notof course expected to form. Such conformation, however, seems tobe concentration dependent.
3.5. Thermal analysis
Recent study has shown that methods of thermal analysisare useful in the determination of hyaluronan conformation by
Fig. 4. ESI-MS spectra of Ac-HA-H and Ac-HA-Na after enzymatic degradation. HA2–HA8 stands for dimer–octamer of HA, GA for glucuronic acid and hex for hexyl chain.
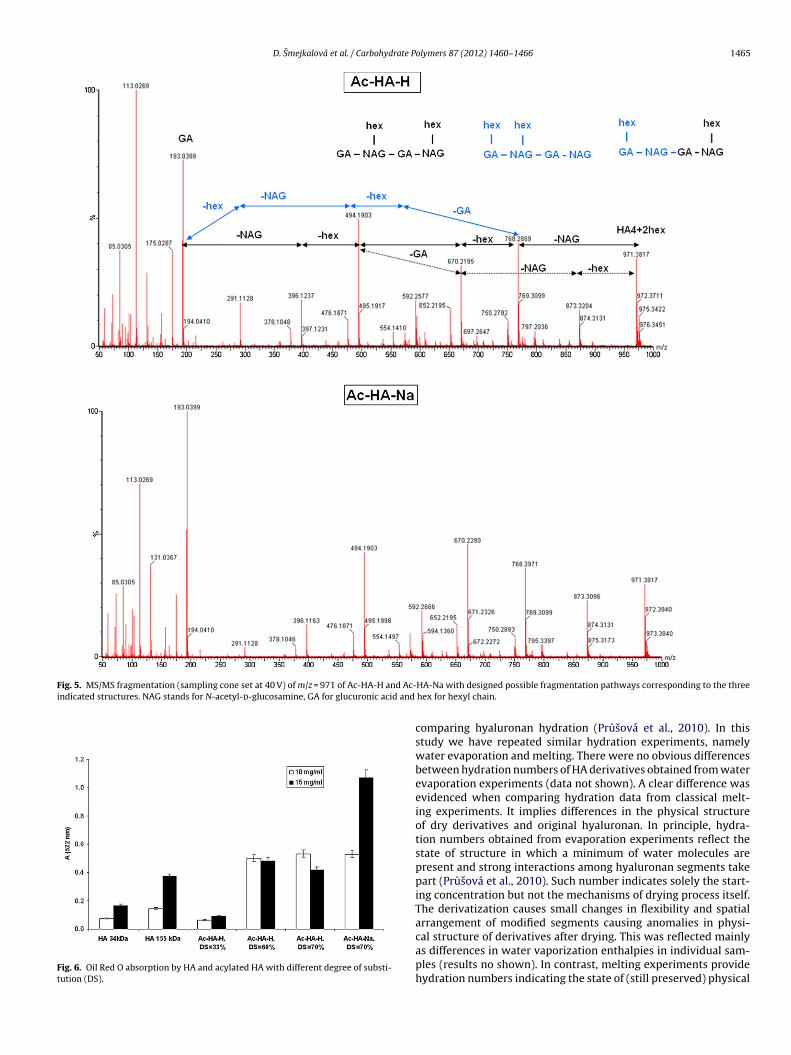
D. Smejkalová et al. / Carbohydrate Polymers 87 (2012) 1460– 1466 1465
Fig. 5. MS/MS fragmentation (sampling cone set at 40 V) of m/z = 971 of Ac-HA-H and Ac-HA-Na with designed possible fragmentation pathways corresponding to the threeindicated structures. NAG stands for N-acetyl-d-glucosamine, GA for glucuronic acid and hex for hexyl chain.
Fig. 6. Oil Red O absorption by HA and acylated HA with different degree of substi-tution (DS).
comparing hyaluronan hydration (Prusová et al., 2010). In thisstudy we have repeated similar hydration experiments, namelywater evaporation and melting. There were no obvious differencesbetween hydration numbers of HA derivatives obtained from waterevaporation experiments (data not shown). A clear difference wasevidenced when comparing hydration data from classical melt-ing experiments. It implies differences in the physical structureof dry derivatives and original hyaluronan. In principle, hydra-tion numbers obtained from evaporation experiments reflect thestate of structure in which a minimum of water molecules arepresent and strong interactions among hyaluronan segments takepart (Prusová et al., 2010). Such number indicates solely the start-ing concentration but not the mechanisms of drying process itself.The derivatization causes small changes in flexibility and spatialarrangement of modified segments causing anomalies in physi-cal structure of derivatives after drying. This was reflected mainlyas differences in water vaporization enthalpies in individual sam-ples (results no shown). In contrast, melting experiments providehydration numbers indicating the state of (still preserved) physical
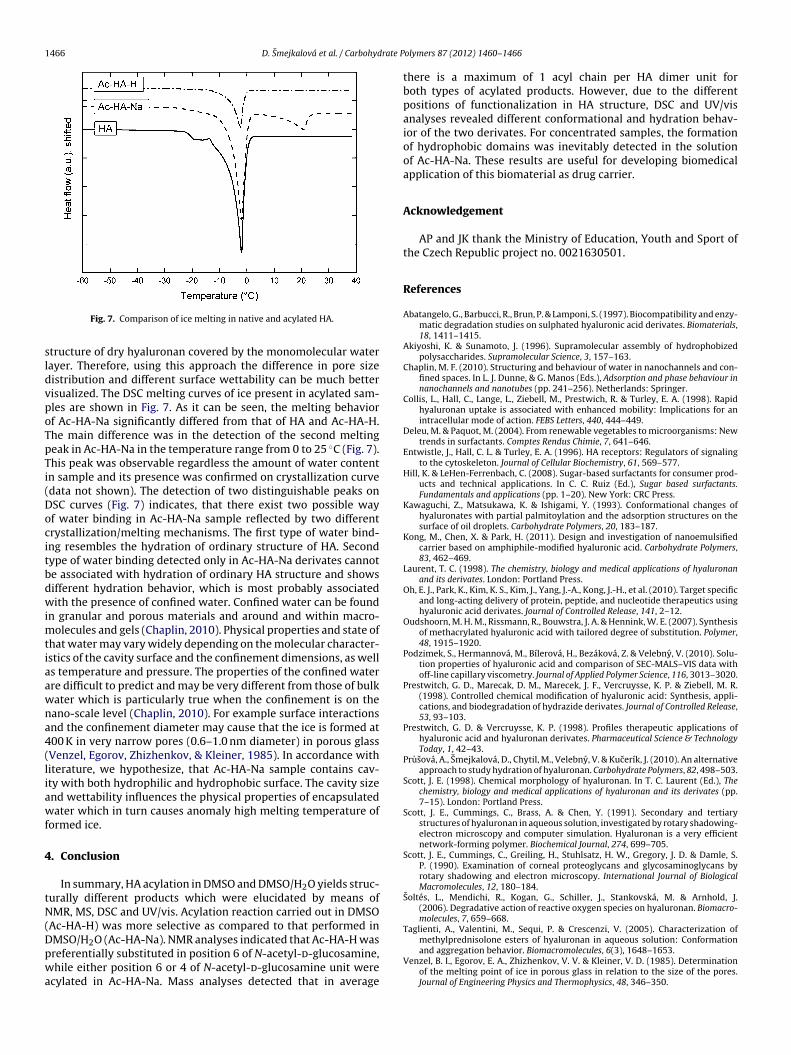
1466 D. Smejkalová et al. / Carbohydrate Polymers 87 (2012) 1460– 1466
Fig. 7. Comparison of ice melting in native and acylated HA.
structure of dry hyaluronan covered by the monomolecular waterlayer. Therefore, using this approach the difference in pore sizedistribution and different surface wettability can be much bettervisualized. The DSC melting curves of ice present in acylated sam-ples are shown in Fig. 7. As it can be seen, the melting behaviorof Ac-HA-Na significantly differed from that of HA and Ac-HA-H.The main difference was in the detection of the second meltingpeak in Ac-HA-Na in the temperature range from 0 to 25 ◦C (Fig. 7).This peak was observable regardless the amount of water contentin sample and its presence was confirmed on crystallization curve(data not shown). The detection of two distinguishable peaks onDSC curves (Fig. 7) indicates, that there exist two possible wayof water binding in Ac-HA-Na sample reflected by two differentcrystallization/melting mechanisms. The first type of water bind-ing resembles the hydration of ordinary structure of HA. Secondtype of water binding detected only in Ac-HA-Na derivates cannotbe associated with hydration of ordinary HA structure and showsdifferent hydration behavior, which is most probably associatedwith the presence of confined water. Confined water can be foundin granular and porous materials and around and within macro-molecules and gels (Chaplin, 2010). Physical properties and state ofthat water may vary widely depending on the molecular character-istics of the cavity surface and the confinement dimensions, as wellas temperature and pressure. The properties of the confined waterare difficult to predict and may be very different from those of bulkwater which is particularly true when the confinement is on thenano-scale level (Chaplin, 2010). For example surface interactionsand the confinement diameter may cause that the ice is formed at400 K in very narrow pores (0.6–1.0 nm diameter) in porous glass(Venzel, Egorov, Zhizhenkov, & Kleiner, 1985). In accordance withliterature, we hypothesize, that Ac-HA-Na sample contains cav-ity with both hydrophilic and hydrophobic surface. The cavity sizeand wettability influences the physical properties of encapsulatedwater which in turn causes anomaly high melting temperature offormed ice.
4. Conclusion
In summary, HA acylation in DMSO and DMSO/H2O yields struc-turally different products which were elucidated by means ofNMR, MS, DSC and UV/vis. Acylation reaction carried out in DMSO(Ac-HA-H) was more selective as compared to that performed inDMSO/H2O (Ac-HA-Na). NMR analyses indicated that Ac-HA-H waspreferentially substituted in position 6 of N-acetyl-d-glucosamine,while either position 6 or 4 of N-acetyl-d-glucosamine unit wereacylated in Ac-HA-Na. Mass analyses detected that in average
there is a maximum of 1 acyl chain per HA dimer unit forboth types of acylated products. However, due to the differentpositions of functionalization in HA structure, DSC and UV/visanalyses revealed different conformational and hydration behav-ior of the two derivates. For concentrated samples, the formationof hydrophobic domains was inevitably detected in the solutionof Ac-HA-Na. These results are useful for developing biomedicalapplication of this biomaterial as drug carrier.
Acknowledgement
AP and JK thank the Ministry of Education, Youth and Sport ofthe Czech Republic project no. 0021630501.
References
Abatangelo, G., Barbucci, R., Brun, P. & Lamponi, S. (1997). Biocompatibility and enzy-matic degradation studies on sulphated hyaluronic acid derivates. Biomaterials,18, 1411–1415.
Akiyoshi, K. & Sunamoto, J. (1996). Supramolecular assembly of hydrophobizedpolysaccharides. Supramolecular Science, 3, 157–163.
Chaplin, M. F. (2010). Structuring and behaviour of water in nanochannels and con-fined spaces. In L. J. Dunne, & G. Manos (Eds.), Adsorption and phase behaviour innanochannels and nanotubes (pp. 241–256). Netherlands: Springer.
Collis, L., Hall, C., Lange, L., Ziebell, M., Prestwich, R. & Turley, E. A. (1998). Rapidhyaluronan uptake is associated with enhanced mobility: Implications for anintracellular mode of action. FEBS Letters, 440, 444–449.
Deleu, M. & Paquot, M. (2004). From renewable vegetables to microorganisms: Newtrends in surfactants. Comptes Rendus Chimie, 7, 641–646.
Entwistle, J., Hall, C. L. & Turley, E. A. (1996). HA receptors: Regulators of signalingto the cytoskeleton. Journal of Cellular Biochemistry, 61, 569–577.
Hill, K. & LeHen-Ferrenbach, C. (2008). Sugar-based surfactants for consumer prod-ucts and technical applications. In C. C. Ruiz (Ed.), Sugar based surfactants.Fundamentals and applications (pp. 1–20). New York: CRC Press.
Kawaguchi, Z., Matsukawa, K. & Ishigami, Y. (1993). Conformational changes ofhyaluronates with partial palmitoylation and the adsorption structures on thesurface of oil droplets. Carbohydrate Polymers, 20, 183–187.
Kong, M., Chen, X. & Park, H. (2011). Design and investigation of nanoemulsifiedcarrier based on amphiphile-modified hyaluronic acid. Carbohydrate Polymers,83, 462–469.
Laurent, T. C. (1998). The chemistry, biology and medical applications of hyaluronanand its derivates. London: Portland Press.
Oh, E. J., Park, K., Kim, K. S., Kim, J., Yang, J.-A., Kong, J.-H., et al. (2010). Target specificand long-acting delivery of protein, peptide, and nucleotide therapeutics usinghyaluronic acid derivates. Journal of Controlled Release, 141, 2–12.
Oudshoorn, M. H. M., Rissmann, R., Bouwstra, J. A. & Hennink, W. E. (2007). Synthesisof methacrylated hyaluronic acid with tailored degree of substitution. Polymer,48, 1915–1920.
Podzimek, S., Hermannová, M., Bílerová, H., Bezáková, Z. & Velebny, V. (2010). Solu-tion properties of hyaluronic acid and comparison of SEC-MALS–VIS data withoff-line capillary viscometry. Journal of Applied Polymer Science, 116, 3013–3020.
Prestwitch, G. D., Marecak, D. M., Marecek, J. F., Vercruysse, K. P. & Ziebell, M. R.(1998). Controlled chemical modification of hyaluronic acid: Synthesis, appli-cations, and biodegradation of hydrazide derivates. Journal of Controlled Release,53, 93–103.
Prestwitch, G. D. & Vercruysse, K. P. (1998). Profiles therapeutic applications ofhyaluronic acid and hyaluronan derivates. Pharmaceutical Science & TechnologyToday, 1, 42–43.
Prusová, A., Smejkalová, D., Chytil, M., Velebny, V. & Kucerík, J. (2010). An alternativeapproach to study hydration of hyaluronan. Carbohydrate Polymers, 82, 498–503.
Scott, J. E. (1998). Chemical morphology of hyaluronan. In T. C. Laurent (Ed.), Thechemistry, biology and medical applications of hyaluronan and its derivates (pp.7–15). London: Portland Press.
Scott, J. E., Cummings, C., Brass, A. & Chen, Y. (1991). Secondary and tertiarystructures of hyaluronan in aqueous solution, investigated by rotary shadowing-electron microscopy and computer simulation. Hyaluronan is a very efficientnetwork-forming polymer. Biochemical Journal, 274, 699–705.
Scott, J. E., Cummings, C., Greiling, H., Stuhlsatz, H. W., Gregory, J. D. & Damle, S.P. (1990). Examination of corneal proteoglycans and glycosaminoglycans byrotary shadowing and electron microscopy. International Journal of BiologicalMacromolecules, 12, 180–184.
Soltés, L., Mendichi, R., Kogan, G., Schiller, J., Stankovská, M. & Arnhold, J.(2006). Degradative action of reactive oxygen species on hyaluronan. Biomacro-molecules, 7, 659–668.
Taglienti, A., Valentini, M., Sequi, P. & Crescenzi, V. (2005). Characterization ofmethylprednisolone esters of hyaluronan in aqueous solution: Conformationand aggregation behavior. Biomacromolecules, 6(3), 1648–1653.
Venzel, B. I., Egorov, E. A., Zhizhenkov, V. V. & Kleiner, V. D. (1985). Determinationof the melting point of ice in porous glass in relation to the size of the pores.Journal of Engineering Physics and Thermophysics, 48, 346–350.

71
Appendix 4
Kučerík, J., Bursáková, P., Průšová, A., Grebíková, L., Schaumann, G. E. (2012)
Hydration of humic and fulvic acids studied by DSC. Journal of thermal analysis and
calorimetry 110: 451–459.


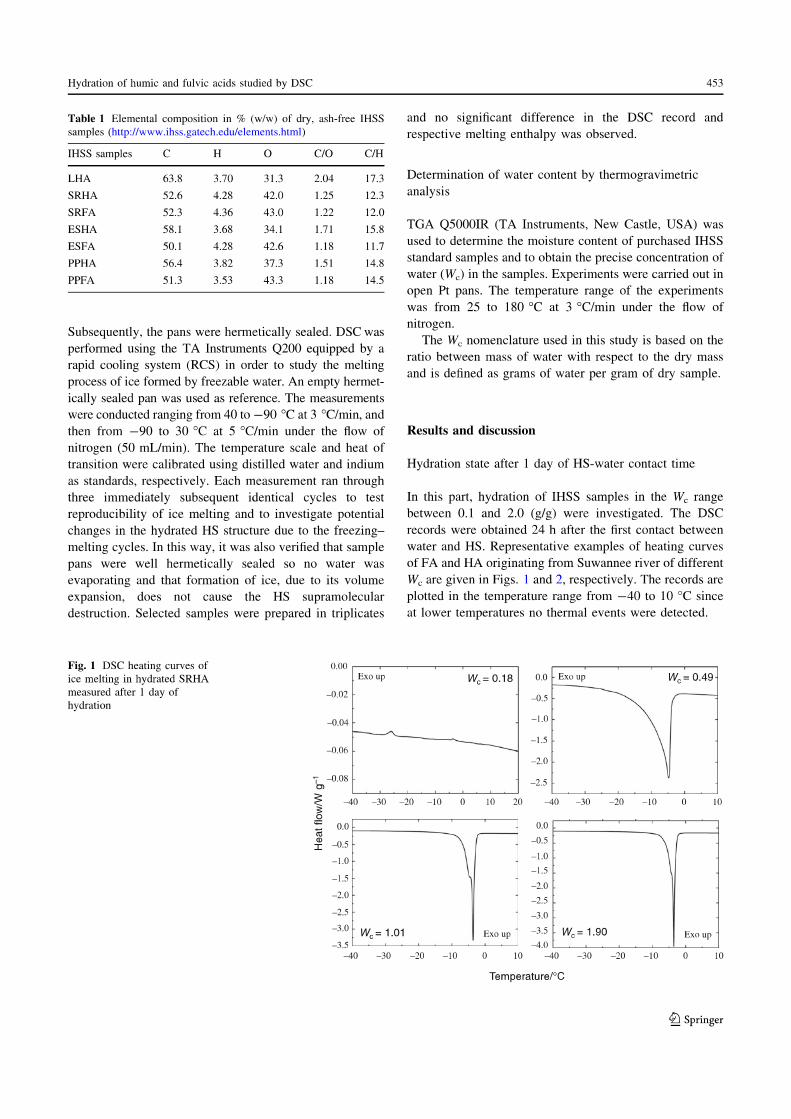

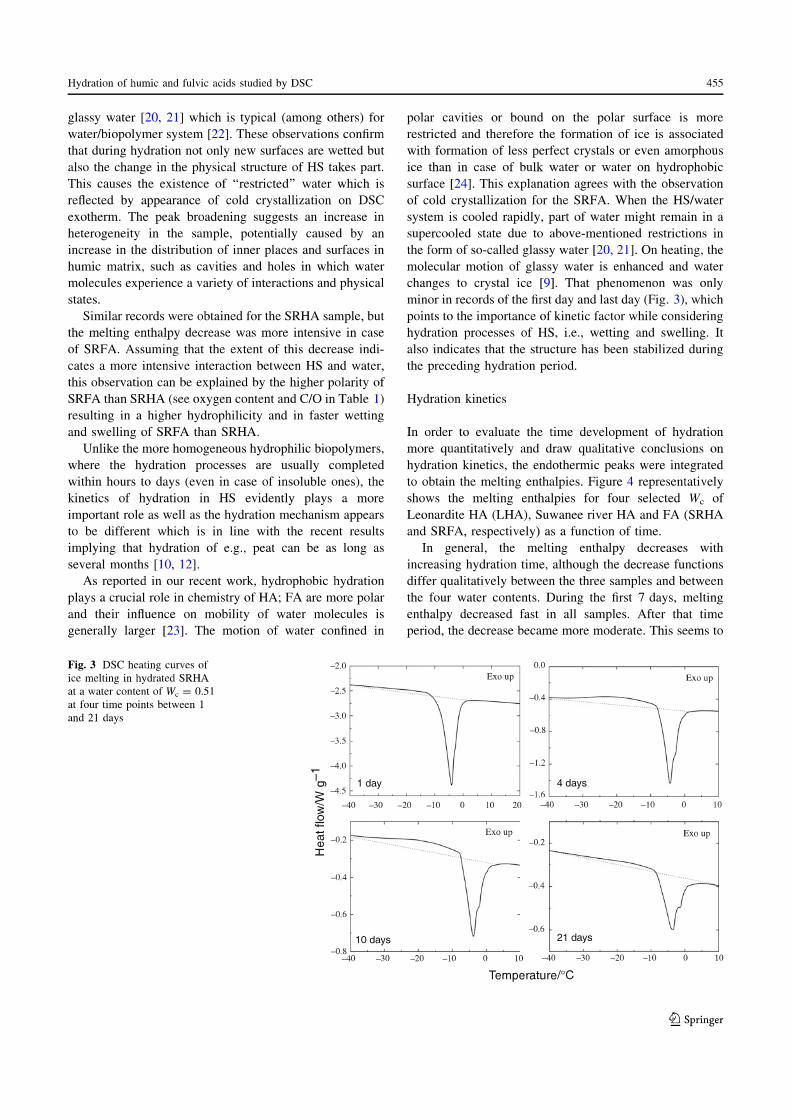
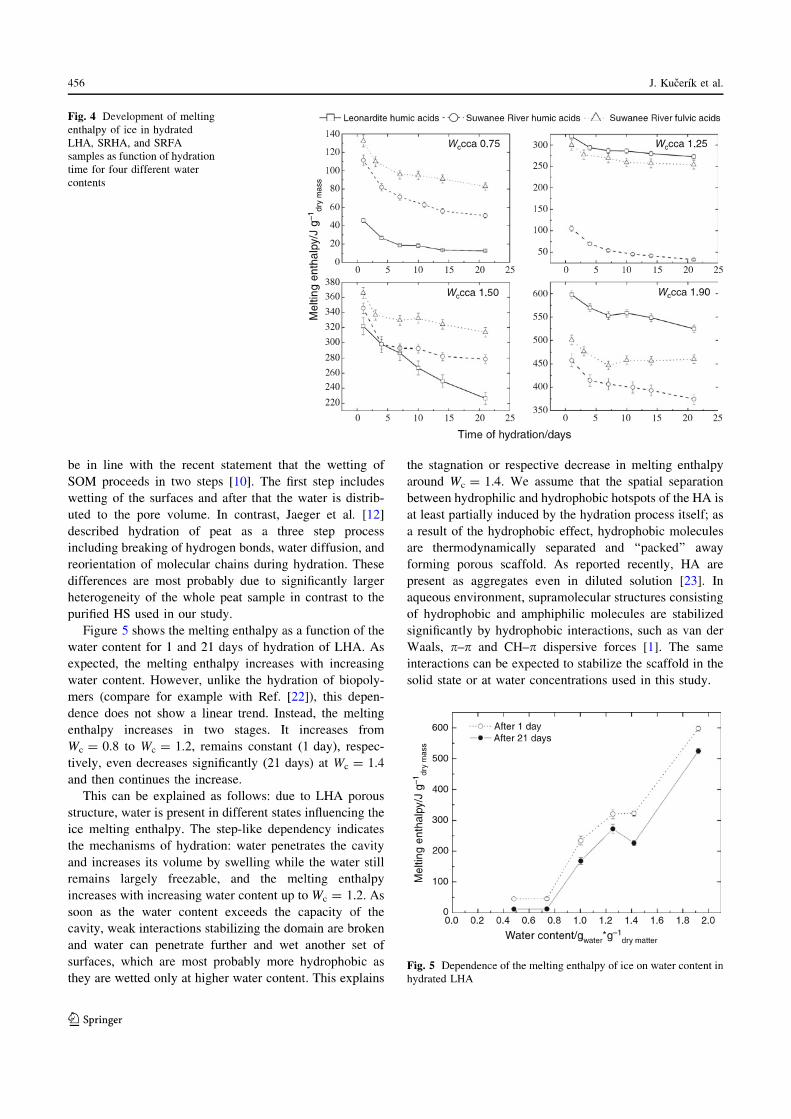
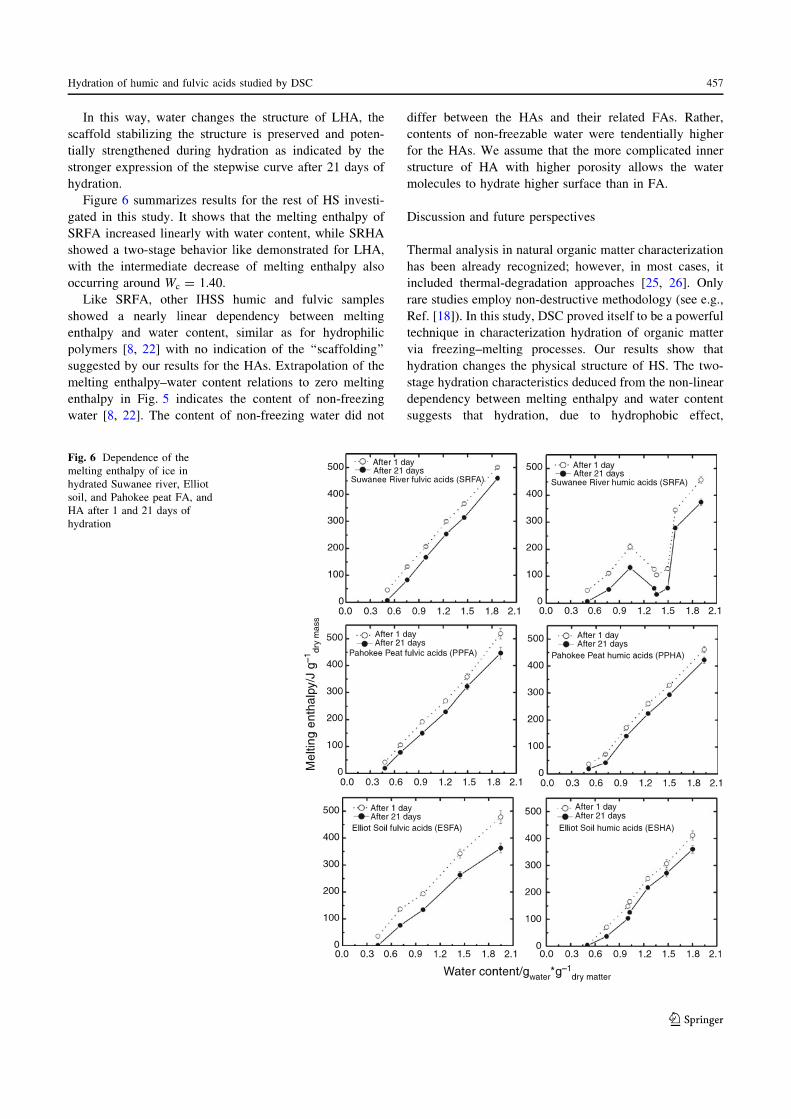


81
Appendix 5
Průšová, A., Conte, P., Kučerík, J., Alonzo, G. (2010) Dynamics of hyaluronan aqueous
solutions as assessed by fast field cycling NMR relaxometry. Analytical and Bioanalytical
Chemistry 397: 3023–3028.

ORIGINAL PAPER
Dynamics of hyaluronan aqueous solutions as assessedby fast field cycling NMR relaxometry
Alena Průšová & Pellegrino Conte & Jiří Kučerík &
Giuseppe Alonzo
Received: 9 April 2010 /Revised: 15 May 2010 /Accepted: 17 May 2010 /Published online: 14 June 2010# Springer-Verlag 2010
Abstract Fast field cycling (FFC) NMR relaxometry hasbeen used to study the conformational properties of aqueoussolutions of hyaluronan (HYA) at three concentrations in therange 10 to 25mgmL–1. Results revealed that, irrespective ofthe solution concentration, three different hydration layerssurround hyaluronan. The inner layer consists of watermolecules strongly retained in the proximity of the HYAsurface. Because of their strong interactions with HYA, watermolecules in this inner hydration layer are subject to veryslow dynamics and have the largest correlation times. Theother two hydration layers are made of water moleculeswhich are located progressively further from the HYAsurface. As a result, decreasing correlation times caused byfaster molecular motion were measured. The NMRD profilesobtained by FFC-NMR relaxometry also showed peaksattributable to 1H–14N quadrupole interactions. Changes inintensity and position of the quadrupolar peaks in the NMRDprofiles suggested that with increasing concentration theamido group is progressively involved in the formation ofweak and transient intramolecular water bridging adjacenthyaluronan chains. In this work, FFC-NMR was used for thefirst time to obtain deeper insight into HYA–water inter-actions and proved itself a powerful and promising tool inhyaluronan chemistry.
Keywords FFC-NMR . Relaxometry . Correlation time .
Quadrupole interactions . Hydration layer
Introduction
Hyaluronan (HYA) is a linear, unbranched, high-molecular-weight glycosaminoglycan polymer whose repeating unit is adimer formed from D-glucuronic acid and N-acetyl-D-glucos-amine [1]. The two monosaccharides are held together by aβ-(1→3) glycosidic bond. The disaccharides are, then,bound to each other by β-(1→4) glycosidic linkages.
HYA is an important biopolymer ubiquitous in vertebrates’tissues and in some bacteria but absent from fungi, plants, andinsects [2–5]. It is a crucial biopolymer involved inembryonic development, extracellular matrix homeostasis,wound healing, and tissue regeneration [6]. Its solutions arevery important in medical applications, for example oph-thalmology, pharmacology, drug delivery, viscoprotection,orthopedy, rheumatology, dermatology, and plastic surgery[4, 5, 7]. HYA is also used in cosmetics and cryo-biology [4].
In the last few years, many papers have appeared inliterature dealing with the chemical and physical properties ofhyaluronan solutions [7–15]. In all this work the structureand conformational behaviour of hyaluronan and hyaluronanderivatives have been studied by application of traditionalanalytical techniques, for example NMR [7–16], forcespectroscopy [17], rheology [8, 15], infrared spectroscopy[8–20], thermal analysis [21], and computational chemistry[23] or by classical wet chemical methods [12, 14, 24]. Tothe best of our knowledge, no paper describing application offast field cycling (FFC) NMR relaxometry in hyaluronanresearch has ever appeared in the scientific literature.
FFC-NMR relaxometry probes the molecular dynamicsof complex systems, for example plant tissues [25], food
A. Průšová : J. KučeríkFaculty of Chemistry, Brno University of Technology,Purkyňova 118,612 00 Brno, Czech Republic
P. Conte (*) :G. AlonzoDipartimento di Ingegneria e Tecnologie Agro-Forestali,Università degli Studi di Palermo,v.le delle Scienze 13, edificio 4,90128 Palermo, Italye-mail: [email protected]
Anal Bioanal Chem (2010) 397:3023–3028DOI 10.1007/s00216-010-3855-9
[26–30], seeds [31], archaeological materials [32], nano-porous media [33], and environmental matrices [25, 34] bymeasurement of longitudinal (T1) relaxation times [35–38].When analyzing liquid systems the technique seems to bevery sensitive to solvent molecules (e.g. water); because ofinteractions with solutes the solvent molecules becomeslower so their relaxation times decrease. For this reason,information about the structure and dynamics of solvents inclosest proximity to solutes can be obtained [25]. Furtheradvantages of FFC-NMR relaxometry are its sample non-destructivity, speed, and the possibility of isolating typicalrelaxation features associated with molecular processescharacterized by very long correlation times (e.g. molecularsurface dynamics and collective effects) [37].
The basic FFC-NMR or NMR dispersion (NMRD)experiment consists in application of a Zeeman magneticfield (B0) which cycles through three different valuesknown as the polarization (BPOL), relaxation (BRLX), andacquisition (BACQ) fields [37, 38]. BPOL is applied for afixed period of time (TPOL) in order to achieve magnetiza-tion saturation and sensitivity enhancement [37]. Then, themagnetic field is switched to a new one, BRLX, applied for aperiod (τ) during which magnetization intensity changes toreach a new equilibrium condition. Finally, acquisition ofthe free induction decay (FID) is achieved by applicationof the magnetic field BACQ concomitantly with a 90° pulseon the investigated nucleus.
The T1 relaxation times (and, as a consequence, thelongitudinal relaxation rates R1=1/T1) of the observednuclei are measured at each fixed BRLX intensity byprogressive variation of the τ values. The longitudinalrelaxation rates plotted versus the applied magnetic fieldstrengths represent the NMRD profiles (or dispersioncurves) which can provide information about the physical/chemical properties of complex materials [35–38]. Forexample, 1H NMRD analyses of hens’ eggs revealed thatquality loss during storage can be associated with theacidity increase arising from carbon dioxide diffusionthrough the eggshell [39]. Further, a two-stage gelationprocess (first formation of strongly linked dimers, thenweak inter-dimer aggregation) was discovered for CaCl2low methoxy pectin water solutions [40].
The objective of the work discussed in this paper was toapply fast field cycling NMR relaxometry in order toevaluate the conformational properties of hyaluronansolutions as affected by different HYA concentrations.Results confirmed literature data concerning the organiza-tion of water molecules surrounding hyaluronan. Inaddition, it was revealed that with increasing concentration(from 10 to 25 mg mL–1 in this study) the N atoms ofamido groups are progressively employed in weak andtransient water bridges with adjacent HYA chains causingnon-ideal behaviour of HYA solutions.
Materials and methods
Samples
A bacterial 1.36 MDa hyaluronan (HYA; the molecularweight was measured by size-exclusion chromatography)was kindly provided by CPN Company (Dolní Dobrouč,Czech Republic). HYA solutions were obtained by disso-lution of hyaluronan powder in Milli-Q water in order toobtain concentrations 10, 15, and 25 mg mL–1. Thesolutions were prepared by stirring HYA–water mixturesat room temperature for 24 hours as recommended byTakahashi et al. [41]. The pH of the HYA water solutionswas neutral, thereby enabling pH buffer effects to beneglected in further considerations.
FFC-NMR experiments
1H NMRD profiles (i.e. relaxation rates R1 or 1/T1 vs.proton Larmor frequencies) were acquired on a StelarSpinmaster-FFC-2000 Fast-Field-Cycling Relaxometer(Stelar s.r.l., Mede, PV–Italy) at a constant temperatureof 293 K. Field-switching time was 3 ms and spectrometerdead time was 15 μs. The proton spins were polarized at apolarization field (BPOL) corresponding to a protonLarmor frequency (ωL) of 29 MHz for a period ofpolarization (TPOL) included in the range 6–10 s. Arecycle delay of 10 s was always applied. The longitudinalmagnetization evolution was recorded at values of arelaxation magnetic field (BRLX) corresponding to ωL inthe range 0.010–20 MHz. The NMR signal was acquiredwith 1 scan for 16 linearly spaced time sets, each of themwas adjusted at every relaxation field to optimize thesampling of the decay/recovery curves. Within experi-mental error, all the decay/recovery curves of longitudinalmagnetization were exponential. Free induction decays(FID) were recorded after a single 1H 90° pulse applied atan acquisition field (BACQ) corresponding to the protonLarmor frequency of 16.2 MHz. A time domain of 100 μssampled with 512 points was also applied. The decay/recovery curves at each BRLX value (i.e. 1H signalintensity-vs-τ) were fitted by using a 1st-order exponentialdecay/recovery function after export of the experimentaldata to OriginPro 7.5 SR6 (Version 7.5885, OriginLab,Northampton, MA, USA).
FFC-NMR data elaboration
The NMRD profiles were fitted in OriginPro 7.5 SR6 witha Lorentzian function of the type [37, 42]:
R1 ¼Xn
1
AitC;i
1þ wLtC;i� �2 ð1Þ
3024 A. Průšová et al.
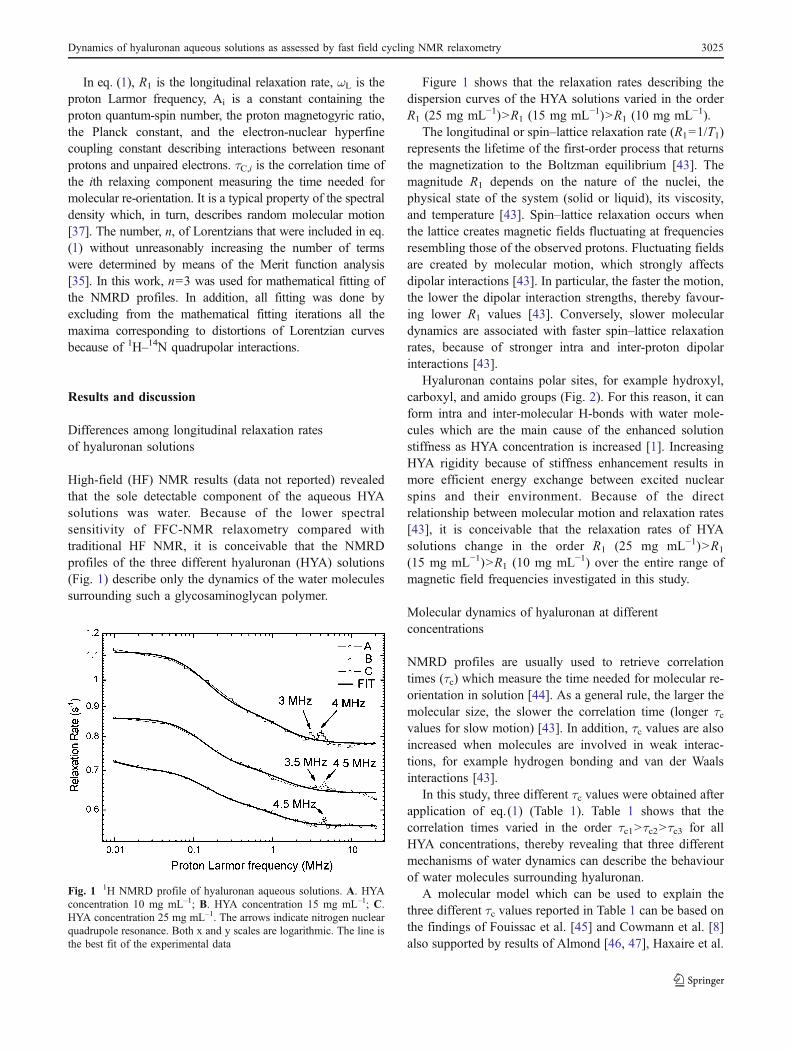
In eq. (1), R1 is the longitudinal relaxation rate, ωL is theproton Larmor frequency, Ai is a constant containing theproton quantum-spin number, the proton magnetogyric ratio,the Planck constant, and the electron-nuclear hyperfinecoupling constant describing interactions between resonantprotons and unpaired electrons. τC,i is the correlation time ofthe ith relaxing component measuring the time needed formolecular re-orientation. It is a typical property of the spectraldensity which, in turn, describes random molecular motion[37]. The number, n, of Lorentzians that were included in eq.(1) without unreasonably increasing the number of termswere determined by means of the Merit function analysis[35]. In this work, n=3 was used for mathematical fitting ofthe NMRD profiles. In addition, all fitting was done byexcluding from the mathematical fitting iterations all themaxima corresponding to distortions of Lorentzian curvesbecause of 1H–14N quadrupolar interactions.
Results and discussion
Differences among longitudinal relaxation ratesof hyaluronan solutions
High-field (HF) NMR results (data not reported) revealedthat the sole detectable component of the aqueous HYAsolutions was water. Because of the lower spectralsensitivity of FFC-NMR relaxometry compared withtraditional HF NMR, it is conceivable that the NMRDprofiles of the three different hyaluronan (HYA) solutions(Fig. 1) describe only the dynamics of the water moleculessurrounding such a glycosaminoglycan polymer.
Figure 1 shows that the relaxation rates describing thedispersion curves of the HYA solutions varied in the orderR1 (25 mg mL−1)>R1 (15 mg mL−1)>R1 (10 mg mL−1).
The longitudinal or spin–lattice relaxation rate (R1=1/T1)represents the lifetime of the first-order process that returnsthe magnetization to the Boltzman equilibrium [43]. Themagnitude R1 depends on the nature of the nuclei, thephysical state of the system (solid or liquid), its viscosity,and temperature [43]. Spin–lattice relaxation occurs whenthe lattice creates magnetic fields fluctuating at frequenciesresembling those of the observed protons. Fluctuating fieldsare created by molecular motion, which strongly affectsdipolar interactions [43]. In particular, the faster the motion,the lower the dipolar interaction strengths, thereby favour-ing lower R1 values [43]. Conversely, slower moleculardynamics are associated with faster spin–lattice relaxationrates, because of stronger intra and inter-proton dipolarinteractions [43].
Hyaluronan contains polar sites, for example hydroxyl,carboxyl, and amido groups (Fig. 2). For this reason, it canform intra and inter-molecular H-bonds with water mole-cules which are the main cause of the enhanced solutionstiffness as HYA concentration is increased [1]. IncreasingHYA rigidity because of stiffness enhancement results inmore efficient energy exchange between excited nuclearspins and their environment. Because of the directrelationship between molecular motion and relaxation rates[43], it is conceivable that the relaxation rates of HYAsolutions change in the order R1 (25 mg mL−1)>R1
(15 mg mL−1)>R1 (10 mg mL−1) over the entire range ofmagnetic field frequencies investigated in this study.
Molecular dynamics of hyaluronan at differentconcentrations
NMRD profiles are usually used to retrieve correlationtimes (τc) which measure the time needed for molecular re-orientation in solution [44]. As a general rule, the larger themolecular size, the slower the correlation time (longer τcvalues for slow motion) [43]. In addition, τc values are alsoincreased when molecules are involved in weak interac-tions, for example hydrogen bonding and van der Waalsinteractions [43].
In this study, three different τc values were obtained afterapplication of eq.(1) (Table 1). Table 1 shows that thecorrelation times varied in the order τc1>τc2>τc3 for allHYA concentrations, thereby revealing that three differentmechanisms of water dynamics can describe the behaviourof water molecules surrounding hyaluronan.
A molecular model which can be used to explain thethree different τc values reported in Table 1 can be based onthe findings of Fouissac et al. [45] and Cowmann et al. [8]also supported by results of Almond [46, 47], Haxaire et al.
Fig. 1 1H NMRD profile of hyaluronan aqueous solutions. A. HYAconcentration 10 mg mL–1; B. HYA concentration 15 mg mL–1; C.HYA concentration 25 mg mL–1. The arrows indicate nitrogen nuclearquadrupole resonance. Both x and y scales are logarithmic. The line isthe best fit of the experimental data
Dynamics of hyaluronan aqueous solutions as assessed by fast field cycling NMR relaxometry 3025
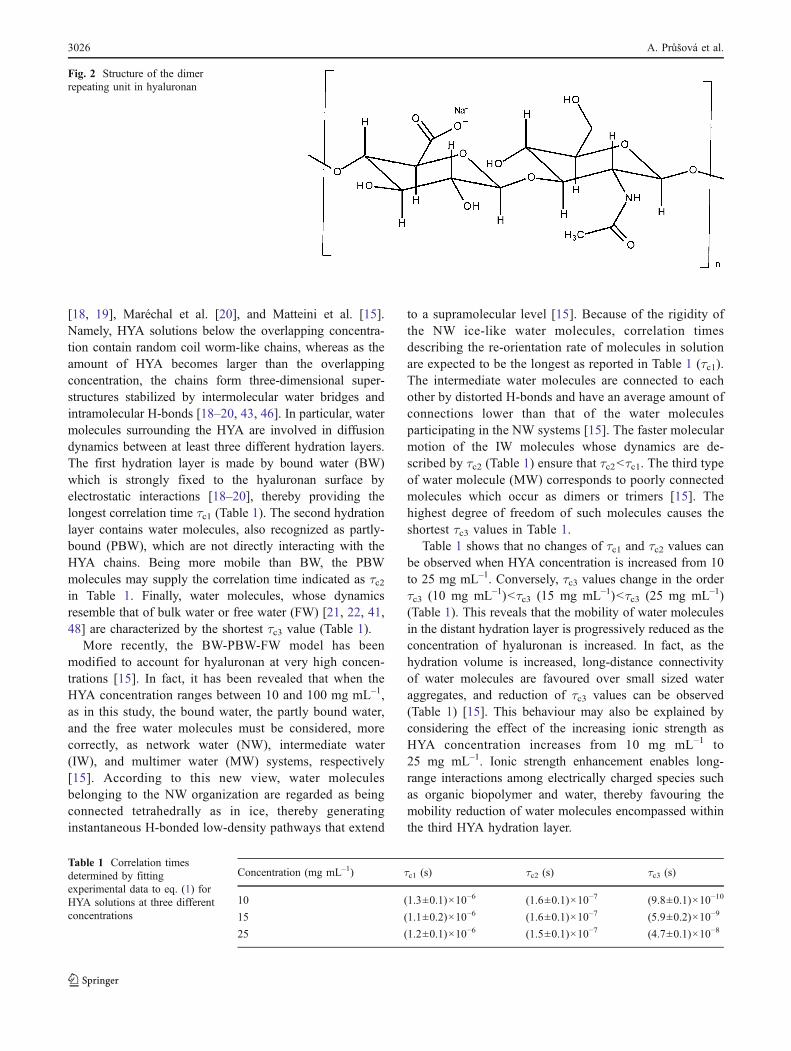
[18, 19], Maréchal et al. [20], and Matteini et al. [15].Namely, HYA solutions below the overlapping concentra-tion contain random coil worm-like chains, whereas as theamount of HYA becomes larger than the overlappingconcentration, the chains form three-dimensional super-structures stabilized by intermolecular water bridges andintramolecular H-bonds [18–20, 43, 46]. In particular, watermolecules surrounding the HYA are involved in diffusiondynamics between at least three different hydration layers.The first hydration layer is made by bound water (BW)which is strongly fixed to the hyaluronan surface byelectrostatic interactions [18–20], thereby providing thelongest correlation time τc1 (Table 1). The second hydrationlayer contains water molecules, also recognized as partly-bound (PBW), which are not directly interacting with theHYA chains. Being more mobile than BW, the PBWmolecules may supply the correlation time indicated as τc2in Table 1. Finally, water molecules, whose dynamicsresemble that of bulk water or free water (FW) [21, 22, 41,48] are characterized by the shortest τc3 value (Table 1).
More recently, the BW-PBW-FW model has beenmodified to account for hyaluronan at very high concen-trations [15]. In fact, it has been revealed that when theHYA concentration ranges between 10 and 100 mg mL–1,as in this study, the bound water, the partly bound water,and the free water molecules must be considered, morecorrectly, as network water (NW), intermediate water(IW), and multimer water (MW) systems, respectively[15]. According to this new view, water moleculesbelonging to the NW organization are regarded as beingconnected tetrahedrally as in ice, thereby generatinginstantaneous H-bonded low-density pathways that extend
to a supramolecular level [15]. Because of the rigidity ofthe NW ice-like water molecules, correlation timesdescribing the re-orientation rate of molecules in solutionare expected to be the longest as reported in Table 1 (τc1).The intermediate water molecules are connected to eachother by distorted H-bonds and have an average amount ofconnections lower than that of the water moleculesparticipating in the NW systems [15]. The faster molecularmotion of the IW molecules whose dynamics are de-scribed by τc2 (Table 1) ensure that τc2<τc1. The third typeof water molecule (MW) corresponds to poorly connectedmolecules which occur as dimers or trimers [15]. Thehighest degree of freedom of such molecules causes theshortest τc3 values in Table 1.
Table 1 shows that no changes of τc1 and τc2 values canbe observed when HYA concentration is increased from 10to 25 mg mL–1. Conversely, τc3 values change in the orderτc3 (10 mg mL–1)<τc3 (15 mg mL–1)<τc3 (25 mg mL–1)(Table 1). This reveals that the mobility of water moleculesin the distant hydration layer is progressively reduced as theconcentration of hyaluronan is increased. In fact, as thehydration volume is increased, long-distance connectivityof water molecules are favoured over small sized wateraggregates, and reduction of τc3 values can be observed(Table 1) [15]. This behaviour may also be explained byconsidering the effect of the increasing ionic strength asHYA concentration increases from 10 mg mL–1 to25 mg mL–1. Ionic strength enhancement enables long-range interactions among electrically charged species suchas organic biopolymer and water, thereby favouring themobility reduction of water molecules encompassed withinthe third HYA hydration layer.
Fig. 2 Structure of the dimerrepeating unit in hyaluronan
Concentration (mg mL–1) τc1 (s) τc2 (s) τc3 (s)
10 (1.3±0.1)×10−6 (1.6±0.1)×10−7 (9.8±0.1)×10−10
15 (1.1±0.2)×10−6 (1.6±0.1)×10−7 (5.9±0.2)×10−9
25 (1.2±0.1)×10−6 (1.5±0.1)×10−7 (4.7±0.1)×10−8
Table 1 Correlation timesdetermined by fittingexperimental data to eq. (1) forHYA solutions at three differentconcentrations
3026 A. Průšová et al.
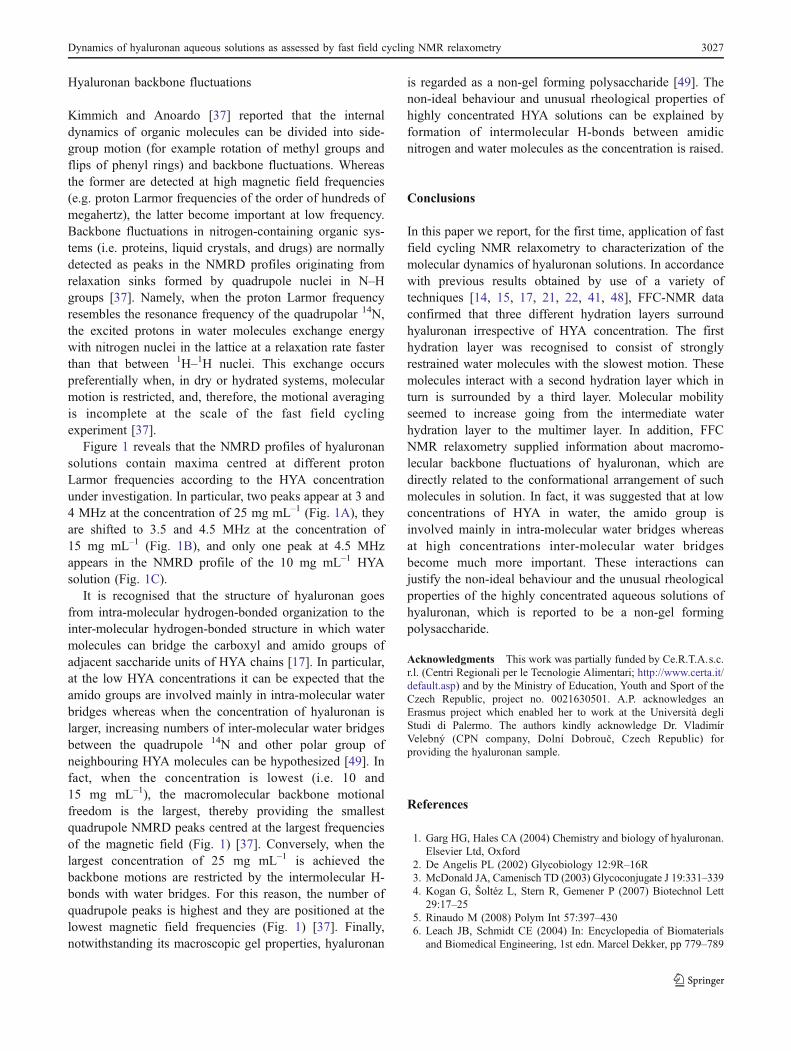
Hyaluronan backbone fluctuations
Kimmich and Anoardo [37] reported that the internaldynamics of organic molecules can be divided into side-group motion (for example rotation of methyl groups andflips of phenyl rings) and backbone fluctuations. Whereasthe former are detected at high magnetic field frequencies(e.g. proton Larmor frequencies of the order of hundreds ofmegahertz), the latter become important at low frequency.Backbone fluctuations in nitrogen-containing organic sys-tems (i.e. proteins, liquid crystals, and drugs) are normallydetected as peaks in the NMRD profiles originating fromrelaxation sinks formed by quadrupole nuclei in N–Hgroups [37]. Namely, when the proton Larmor frequencyresembles the resonance frequency of the quadrupolar 14N,the excited protons in water molecules exchange energywith nitrogen nuclei in the lattice at a relaxation rate fasterthan that between 1H–1H nuclei. This exchange occurspreferentially when, in dry or hydrated systems, molecularmotion is restricted, and, therefore, the motional averagingis incomplete at the scale of the fast field cyclingexperiment [37].
Figure 1 reveals that the NMRD profiles of hyaluronansolutions contain maxima centred at different protonLarmor frequencies according to the HYA concentrationunder investigation. In particular, two peaks appear at 3 and4 MHz at the concentration of 25 mg mL–1 (Fig. 1A), theyare shifted to 3.5 and 4.5 MHz at the concentration of15 mg mL–1 (Fig. 1B), and only one peak at 4.5 MHzappears in the NMRD profile of the 10 mg mL–1 HYAsolution (Fig. 1C).
It is recognised that the structure of hyaluronan goesfrom intra-molecular hydrogen-bonded organization to theinter-molecular hydrogen-bonded structure in which watermolecules can bridge the carboxyl and amido groups ofadjacent saccharide units of HYA chains [17]. In particular,at the low HYA concentrations it can be expected that theamido groups are involved mainly in intra-molecular waterbridges whereas when the concentration of hyaluronan islarger, increasing numbers of inter-molecular water bridgesbetween the quadrupole 14N and other polar group ofneighbouring HYA molecules can be hypothesized [49]. Infact, when the concentration is lowest (i.e. 10 and15 mg mL–1), the macromolecular backbone motionalfreedom is the largest, thereby providing the smallestquadrupole NMRD peaks centred at the largest frequenciesof the magnetic field (Fig. 1) [37]. Conversely, when thelargest concentration of 25 mg mL–1 is achieved thebackbone motions are restricted by the intermolecular H-bonds with water bridges. For this reason, the number ofquadrupole peaks is highest and they are positioned at thelowest magnetic field frequencies (Fig. 1) [37]. Finally,notwithstanding its macroscopic gel properties, hyaluronan
is regarded as a non-gel forming polysaccharide [49]. Thenon-ideal behaviour and unusual rheological properties ofhighly concentrated HYA solutions can be explained byformation of intermolecular H-bonds between amidicnitrogen and water molecules as the concentration is raised.
Conclusions
In this paper we report, for the first time, application of fastfield cycling NMR relaxometry to characterization of themolecular dynamics of hyaluronan solutions. In accordancewith previous results obtained by use of a variety oftechniques [14, 15, 17, 21, 22, 41, 48], FFC-NMR dataconfirmed that three different hydration layers surroundhyaluronan irrespective of HYA concentration. The firsthydration layer was recognised to consist of stronglyrestrained water molecules with the slowest motion. Thesemolecules interact with a second hydration layer which inturn is surrounded by a third layer. Molecular mobilityseemed to increase going from the intermediate waterhydration layer to the multimer layer. In addition, FFCNMR relaxometry supplied information about macromo-lecular backbone fluctuations of hyaluronan, which aredirectly related to the conformational arrangement of suchmolecules in solution. In fact, it was suggested that at lowconcentrations of HYA in water, the amido group isinvolved mainly in intra-molecular water bridges whereasat high concentrations inter-molecular water bridgesbecome much more important. These interactions canjustify the non-ideal behaviour and the unusual rheologicalproperties of the highly concentrated aqueous solutions ofhyaluronan, which is reported to be a non-gel formingpolysaccharide.
Acknowledgments This work was partially funded by Ce.R.T.A.s.c.r.l. (Centri Regionali per le Tecnologie Alimentari; http://www.certa.it/default.asp) and by the Ministry of Education, Youth and Sport of theCzech Republic, project no. 0021630501. A.P. acknowledges anErasmus project which enabled her to work at the Università degliStudi di Palermo. The authors kindly acknowledge Dr. VladimírVelebný (CPN company, Dolní Dobrouč, Czech Republic) forproviding the hyaluronan sample.
References
1. Garg HG, Hales CA (2004) Chemistry and biology of hyaluronan.Elsevier Ltd, Oxford
2. De Angelis PL (2002) Glycobiology 12:9R–16R3. McDonald JA, Camenisch TD (2003) Glycoconjugate J 19:331–3394. Kogan G, Šoltéz L, Stern R, Gemener P (2007) Biotechnol Lett
29:17–255. Rinaudo M (2008) Polym Int 57:397–4306. Leach JB, Schmidt CE (2004) In: Encyclopedia of Biomaterials
and Biomedical Engineering, 1st edn. Marcel Dekker, pp 779–789
Dynamics of hyaluronan aqueous solutions as assessed by fast field cycling NMR relaxometry 3027
7. Taglienti A, Sequi P, Valentini M (2009) Carbohydr Res 344:245–249
8. Cowman MK, Matsuoka S (2005) Carbohydr Res 340:791–8099. Blundell CD, Reed MAC, Almond A (2006) Carbohydr Res
341:2803–281510. Almond A (2007) Cell Mol Life Sci 64:1591–159611. Giannotti MI, Rinaudo M, Vancso GJ (2007) Biomacromolecules
8:2648–265212. Deschrevel B, Tranchepain F, Vincent J-C (2008) Matrix Biol
27:475–48513. Hargittai I, Hargittai M (2008) J Struct Chem 19:697–71714. Tømmeraas K, Melander C (2008) Biomacromolecules 9:1535–
154015. Matteini P, Dei L, Carretti E, Volpi N, Goti A, Pini R (2009)
Biomacromolecules 10:1516–152216. Blundell CD, Reed MAC, Almond A (2006) Carbohydr Res
341:2803–281517. Giannotti MI, Rinaudo M, Vancso GJ (2007) Biomacromolecules
8:2648–265218. Haxaire K, Maréchal Y, Milas M, Rinaudo M (2003) Biopolymers
72:10–2019. Haxaire K, Maréchal Y, Milas M, Rinaudo M (2003) Biopolymers
72:149–16120. Maréchal Y, Milas M, Rinaudo M (2003) Biopolymers 72:162–17321. Hatakeyama T, Hatakeyama H (1998) Thermochim Acta 308:3–2222. Lui J, Cowman MK (2000) J Therm Anal Calorim 59:547–55723. Pogány P, Kovács A (2009) Carbohydr Res 344:1745–175224. Rinaudo M (2006) Macromol Symp 245–246:549–55725. Conte P, Bubici S, Palazzolo E, Alonzo G (2009) Spectrosc Lett
42:235–23926. Bertram HC, Wiking L, Nielsen JH, Andersen HJ (2005) Int Dairy
J 15:1056–106327. Davenel A, Schuck P, Mariette F, Brulé G (2002) Lait 82:465–47328. Gianferri R, Maioli M, Delfini M, Brusio E (2007) Int Dairy J
17:167–176
29. Hernández-Sánchez N, Hills BP, Barreiro P, Marigheto N (2007)Postharvest Biol Technol 44:260–270
30. Tang HR, Zhao BL, Belton PS, Sutcliffe LH, Ng A (2000) MagnReson Chem 38:765–770
31. Prestes RA, Colnago LA, Forato LA, Vizzotto L, Novotny EH,Carrilho E (2007) Anal Chim Acta 596:325–329
32. Casieri C, Bubici S, Viola I, De Luca F (2004) Solid State NuclMagn Reson 26:65–73
33. Kausik R, Fatkullin N, Hüsing N, Kimmich R (2007) MagnReson Imaging 25:489–497
34. Melton JR, Kantzas A, Langford CH (2007) Anal Chim Acta605:46–52
35. Halle B, Johannesson H, Venu K (1998) J Magn Reson 135:1–1336. Wang YL, Belton PS (2000) Chem Phys Lett 325:33–3837. Kimmich R, Anoardo E (2004) Prog Nucl Magn Reson Spectrosc
44:257–32038. Ferrante G, Sykora S (2005) Adv Inorg Chem 57:405–47039. Laghi L, Cremonini MA, Placucci G, Sykora S, Wright K, Hills B
(2005) Magn Reson Imaging 23:01–51040. Dobies M, Kuśmia S, Jurga S (2005) Acta Phys Pol A 108:33–4641. Takahashi M, Hatakeyama T, Hatakeyama H (2000) Carbohydr
Polym 41:91–9542. Lauffer RB (1987) Chem Rev 87:901–92743. Bakhmutov VI (2005) Pratical NMR relaxation for chemists. John
Wiley & Sons Ltd, Chichester44. Bertini I, Luchinat C (1986) In: Gray ABP, Deries HB (eds) NMR
of paramagnetic molecules in biological systems. The Benjamin/Cummings Publishing Company Inc, California
45. Fouissac E, Milas M, Rinaudo M (1993) Macromol 26:6945–6951
46. Almond A, Sheehan JK, Brass A (1997) Glycobiology 7:597–60447. Almond A (2007) Cell Mol Life Sci 64:1591–159648. Wolfe J, Bryant G, Koster KL (2002) CryLetters 23:157–16649. Hardingham T (2004) In: Garg HG, Hales CA (eds) Chemistry
and biology of hyaluronan. Elsevier Ltd, Oxford
3028 A. Průšová et al.

88
Appendix 6
Průšová, A., Vergeldt, F.J., Kučerík, J. (2013) Influence of water content and drying on
the physical structure of native hyaluronan. Carbohydrate Polymers 95: 515–521.
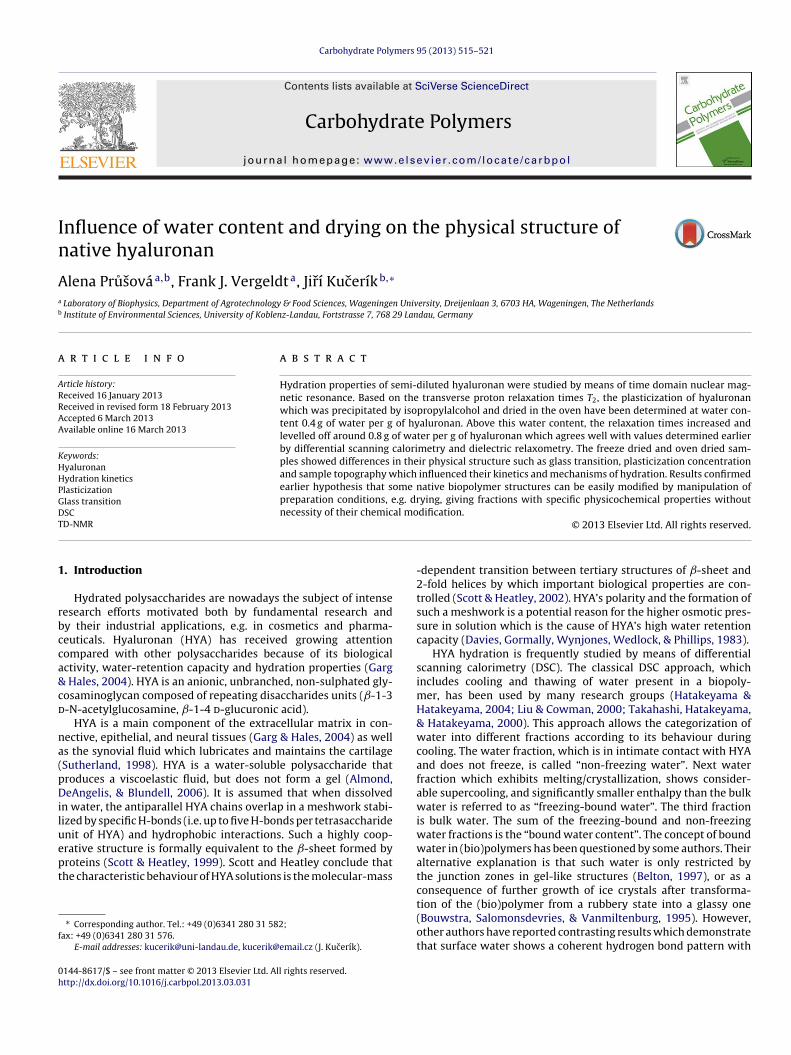
Carbohydrate Polymers 95 (2013) 515– 521
Contents lists available at SciVerse ScienceDirect
Carbohydrate Polymers
jo u rn al hom epa ge: www.elsev ier .com/ locate /carbpol
Influence of water content and drying on the physical structure ofnative hyaluronan
Alena Prusováa,b, Frank J. Vergeldta, Jirí Kuceríkb,∗
a Laboratory of Biophysics, Department of Agrotechnology & Food Sciences, Wageningen University, Dreijenlaan 3, 6703 HA, Wageningen, The Netherlandsb Institute of Environmental Sciences, University of Koblenz-Landau, Fortstrasse 7, 768 29 Landau, Germany
a r t i c l e i n f o
Article history:Received 16 January 2013Received in revised form 18 February 2013Accepted 6 March 2013Available online 16 March 2013
Keywords:HyaluronanHydration kineticsPlasticizationGlass transitionDSCTD-NMR
a b s t r a c t
Hydration properties of semi-diluted hyaluronan were studied by means of time domain nuclear mag-netic resonance. Based on the transverse proton relaxation times T2, the plasticization of hyaluronanwhich was precipitated by isopropylalcohol and dried in the oven have been determined at water con-tent 0.4 g of water per g of hyaluronan. Above this water content, the relaxation times increased andlevelled off around 0.8 g of water per g of hyaluronan which agrees well with values determined earlierby differential scanning calorimetry and dielectric relaxometry. The freeze dried and oven dried sam-ples showed differences in their physical structure such as glass transition, plasticization concentrationand sample topography which influenced their kinetics and mechanisms of hydration. Results confirmedearlier hypothesis that some native biopolymer structures can be easily modified by manipulation ofpreparation conditions, e.g. drying, giving fractions with specific physicochemical properties withoutnecessity of their chemical modification.
© 2013 Elsevier Ltd. All rights reserved.
1. Introduction
Hydrated polysaccharides are nowadays the subject of intenseresearch efforts motivated both by fundamental research andby their industrial applications, e.g. in cosmetics and pharma-ceuticals. Hyaluronan (HYA) has received growing attentioncompared with other polysaccharides because of its biologicalactivity, water-retention capacity and hydration properties (Garg& Hales, 2004). HYA is an anionic, unbranched, non-sulphated gly-cosaminoglycan composed of repeating disaccharides units (ˇ-1-3d-N-acetylglucosamine, ˇ-1-4 d-glucuronic acid).
HYA is a main component of the extracellular matrix in con-nective, epithelial, and neural tissues (Garg & Hales, 2004) as wellas the synovial fluid which lubricates and maintains the cartilage(Sutherland, 1998). HYA is a water-soluble polysaccharide thatproduces a viscoelastic fluid, but does not form a gel (Almond,DeAngelis, & Blundell, 2006). It is assumed that when dissolvedin water, the antiparallel HYA chains overlap in a meshwork stabi-lized by specific H-bonds (i.e. up to five H-bonds per tetrasaccharideunit of HYA) and hydrophobic interactions. Such a highly coop-erative structure is formally equivalent to the ˇ-sheet formed byproteins (Scott & Heatley, 1999). Scott and Heatley conclude thatthe characteristic behaviour of HYA solutions is the molecular-mass
∗ Corresponding author. Tel.: +49 (0)6341 280 31 582;fax: +49 (0)6341 280 31 576.
E-mail addresses: [email protected], [email protected] (J. Kucerík).
-dependent transition between tertiary structures of ˇ-sheet and2-fold helices by which important biological properties are con-trolled (Scott & Heatley, 2002). HYA’s polarity and the formation ofsuch a meshwork is a potential reason for the higher osmotic pres-sure in solution which is the cause of HYA’s high water retentioncapacity (Davies, Gormally, Wynjones, Wedlock, & Phillips, 1983).
HYA hydration is frequently studied by means of differentialscanning calorimetry (DSC). The classical DSC approach, whichincludes cooling and thawing of water present in a biopoly-mer, has been used by many research groups (Hatakeyama &Hatakeyama, 2004; Liu & Cowman, 2000; Takahashi, Hatakeyama,& Hatakeyama, 2000). This approach allows the categorization ofwater into different fractions according to its behaviour duringcooling. The water fraction, which is in intimate contact with HYAand does not freeze, is called “non-freezing water”. Next waterfraction which exhibits melting/crystallization, shows consider-able supercooling, and significantly smaller enthalpy than the bulkwater is referred to as “freezing-bound water”. The third fractionis bulk water. The sum of the freezing-bound and non-freezingwater fractions is the “bound water content”. The concept of boundwater in (bio)polymers has been questioned by some authors. Theiralternative explanation is that such water is only restricted bythe junction zones in gel-like structures (Belton, 1997), or as aconsequence of further growth of ice crystals after transforma-tion of the (bio)polymer from a rubbery state into a glassy one(Bouwstra, Salomonsdevries, & Vanmiltenburg, 1995). However,other authors have reported contrasting results which demonstratethat surface water shows a coherent hydrogen bond pattern with
0144-8617/$ – see front matter © 2013 Elsevier Ltd. All rights reserved.http://dx.doi.org/10.1016/j.carbpol.2013.03.031

516 A. Prusová et al. / Carbohydrate Polymers 95 (2013) 515– 521
a large, net dipole field (Yokomizo, Nakasako, Yamazaki, Shindo,& Higo, 2005). Such hydrogen bonds between water and biopoly-mers (proteins in this case) are stronger and have longer lifetimescompared with hydrogen bonds in bulk water (Chakraborty, Sinha,& Bandyopadhyay, 2007). That water is unavailable for colligativeeffects. Recently, an alternative approach based on water evap-oration has been introduced. It was shown that in the courseof water evaporation from a HYA solution a linear dependencyof evaporation enthalpy normalized by dry mass was abruptlyinterrupted at WC = 0.34 gH20/gHYA. This revealed that at this par-ticular water content the evaporation from HYA is compensated byanother processes associated probably with heat release (Prusova,Smejkalova, Chytil, Velebny, & Kucerik, 2010). This value was con-firmed when enthalpy of evaporation was determined at everyconversion degree during water evaporation (Kucerik et al., 2011).In the comparative study by (Mlcoch & Kucerik, 2013) it wasshowed that in the concentration interval 0.1–2 gwater/gpolysaccharidethis abrupt process can be observed only in HYA. However, thehydration numbers determined by thermoanalytical techniquesreflect the state of water under non-equilibrium conditions andin a particular temperature range.
Therefore the results obtained from DSC experiments shouldbe verified using an independent technique such as for examplenuclear magnetic resonance (NMR). Such a technique does notrequire extrapolation from observations made at temperatures farfrom the point of interest as is often done in the case of DSC. Besides,it is well known that the nuclear spin relaxation times, the spin-lattice relaxation time (T1) and the spin–spin relaxation time (T2)of hydrogen nuclei within water molecules are determined by thephysicochemical environment of the water (Shapiro, 2011). Conse-quently, the measurement of proton nuclear spin relaxation timesprovides information on polymer–water interactions and waterdynamics in such a system. In fact, water mobility slows because thewater is involved in H-bonds and other weak interactions. Watermobility is also slower when it is restricted in pores or cavitiesformed by molecules for example water soluble HYA. Thereforeproportionally shorter relaxation times are expected to be mea-sured (Topgaard & Soderman, 2002).
Past efforts to develop techniques to reprocess polysaccharideshave addressed mainly the hydrophobic/hydrophilic propertiesand gave little attention to how much the native structure wascompromised or physically changed. Understanding how polysac-charides interact with themselves, each other, and with waterin semi-diluted systems is of great importance as it determinesits final structure and physical properties. As shown recently byKucerik et al. (2011), HYA potentially has alternate physical struc-tures due to the presence of two types of glycosidic bonds andvariability of reactive groups. It has been suggested that manipula-tion of drying conditions could bring about differences in physicalstructure of HYA, thus extending the potential applications ofnative, chemically non-modified, HYA.
The first aim of this study is to test whether the results obtainedby several DSC approaches under non-isothermal conditionsreported recently (Prusova et al., 2010) are comparable withresults obtained using time domain NMR (TD-NMR). It is shownthat both approaches give comparable data and shed light on theprocesses taking part in HYA structure at low water content. Itis shown that the above-mentioned compensating process is theplasticization point above which the HYA segments have highermolecular motion, i.e. the physical structure is more susceptibleto any modification during drying. Therefore, the second aim ofthis study is to test whether using of various drying methodshave an influence on the resulting physical structure (mechanicalproperties, pore sizes, and hydration kinetics) of native HYA. Thiswas tested by means of DSC, TD-NMR, and Environmental scanningelectron microscopy techniques.
2. Experimental
The sodium salt form of bacterial HYA with a molecular weightof 800 kDa (measured by size-exclusion chromatography, resultsnot reported) was kindly provided by Contipro Pharma, Ltd. (DolníDobrouc, Czech Republic). This sample was prepared by precipitat-ing the solution through the addition of isopropylalcohol and thenoven-dried. This sample is referred to as precipitated hyaluronan(P-HYA) or as “original” HYA.
2.1. Sample preparation
Hyaluronan powder was put into standard 20 mm NMR tubes(two parallel samples were measured) which were then placed ina moisturizing container with 100% relative humidity at a constanttemperature of 19 ◦C. Samples were regularly homogenized andmeasured every 48 h using TD-NMR. The increasing water content(WC), i.e. mass of water per gram of hyaluronan, was determined byregularly weighing the HYA sample. In order to achieve a WC of 1 orhigher, liquid water was added and the sample was homogenizedfor a period of 72 h.
To study the effect of drying on the physical structure of HYA,the hyaluronan-water solution was prepared with a concentrationof 2.5% (w/w) and stirred for 24 h at room temperature. Two differ-ent drying methods were used: static drying of the solution in anoven at 25 ◦C, and freeze-drying. Therefore, three different hyaluro-nan samples were obtained: (i) static dried in the oven (O-HYA), ii)freeze dried (F-HYA) and (iii) original HYA sample (P-HYA). The pre-pared samples were stored in the desiccator at 19 ◦C and studiedusing DSC and TD-NMR techniques.
2.2. Time domain NMR
Time domain nuclear magnetic resonance (TD-NMR) mea-surements were performed using a MiniSpec (Bruker, Germany)instrument, operating at the proton Larmor frequency of 7.5 MHzfor protons. T2 relaxation decays, as a function of the WC of thesample, were obtained by applying the Carr–Purcell–Meiboom–Gill(CPMG) pulse sequence. Echo time was kept constant at 0.1 ms,and the number of echoes and repetitions was changed depend-ing on the WC. The repetition time between scans was five timesT1 to avoid the T1 weighting. To calculate T2 values, the trans-verse relaxation curves from CPMG decays were fitted with Eq.(1) using RI-WinFit software (Version 2.4, Resonance InstrumentLtd., Oxfordshire, United Kingdom) with either bi-exponential ortri-exponential functions (in dependency on statistical parameterssuch as �2, standard error and R2):
F(t) = �Ai exp
(−t
T2,i
), (1)
where A is amplitude, t is time and T2 is spin–spin relaxation time.The experiments were carried out at 25 ◦C.
2.3. Environmental scanning electron microscopy (ESEM)
ESEM microscopy was carried out on a Quanta 250 instrument(FEI, Brno, Czech Republic) in a low vacuum mode. A large fielddetector (LFD) was used with voltage 2–10 kV and spot size 3–4.Depending on the sample structure, a pressure between 50 and70 Pa was used. The dwell time for picture acquisition was 30 �s.All samples were stored and equilibrated in the desiccator over theNaOH pellets for 3 days prior to imaging.
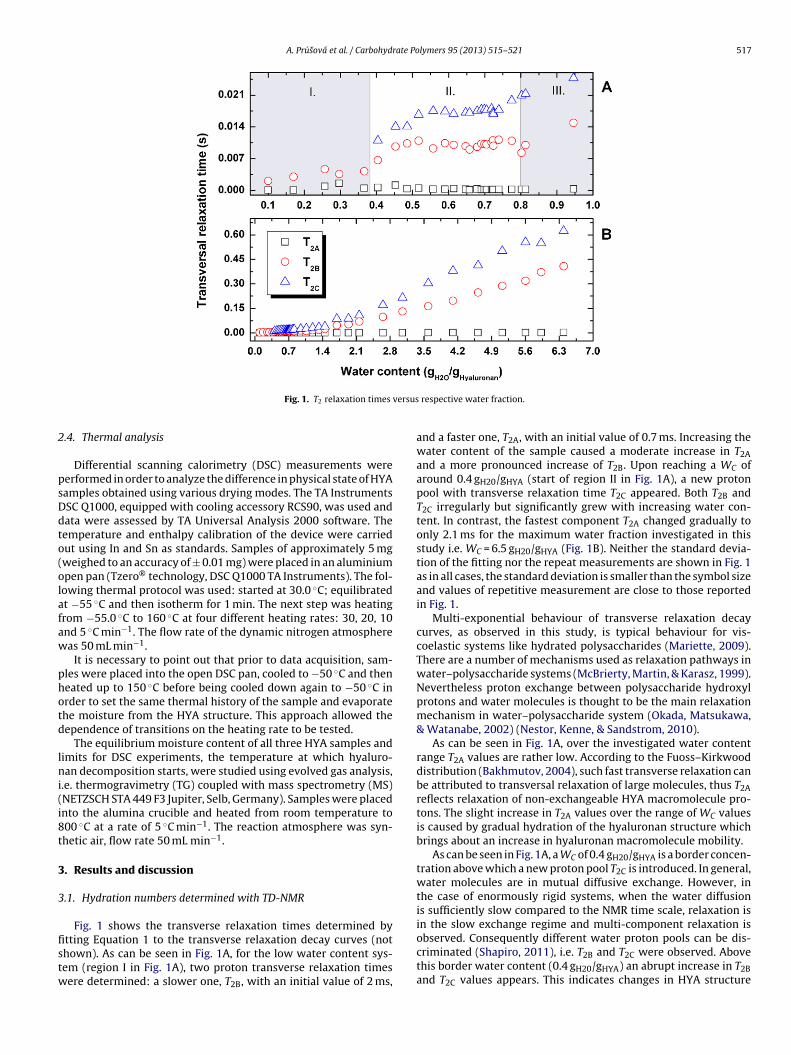
A. Prusová et al. / Carbohydrate Polymers 95 (2013) 515– 521 517
Fig. 1. T2 relaxation times versus respective water fraction.
2.4. Thermal analysis
Differential scanning calorimetry (DSC) measurements wereperformed in order to analyze the difference in physical state of HYAsamples obtained using various drying modes. The TA InstrumentsDSC Q1000, equipped with cooling accessory RCS90, was used anddata were assessed by TA Universal Analysis 2000 software. Thetemperature and enthalpy calibration of the device were carriedout using In and Sn as standards. Samples of approximately 5 mg(weighed to an accuracy of ± 0.01 mg) were placed in an aluminiumopen pan (Tzero® technology, DSC Q1000 TA Instruments). The fol-lowing thermal protocol was used: started at 30.0 ◦C; equilibratedat −55 ◦C and then isotherm for 1 min. The next step was heatingfrom −55.0 ◦C to 160 ◦C at four different heating rates: 30, 20, 10and 5 ◦C min−1. The flow rate of the dynamic nitrogen atmospherewas 50 mL min−1.
It is necessary to point out that prior to data acquisition, sam-ples were placed into the open DSC pan, cooled to −50 ◦C and thenheated up to 150 ◦C before being cooled down again to −50 ◦C inorder to set the same thermal history of the sample and evaporatethe moisture from the HYA structure. This approach allowed thedependence of transitions on the heating rate to be tested.
The equilibrium moisture content of all three HYA samples andlimits for DSC experiments, the temperature at which hyaluro-nan decomposition starts, were studied using evolved gas analysis,i.e. thermogravimetry (TG) coupled with mass spectrometry (MS)(NETZSCH STA 449 F3 Jupiter, Selb, Germany). Samples were placedinto the alumina crucible and heated from room temperature to800 ◦C at a rate of 5 ◦C min−1. The reaction atmosphere was syn-thetic air, flow rate 50 mL min−1.
3. Results and discussion
3.1. Hydration numbers determined with TD-NMR
Fig. 1 shows the transverse relaxation times determined byfitting Equation 1 to the transverse relaxation decay curves (notshown). As can be seen in Fig. 1A, for the low water content sys-tem (region I in Fig. 1A), two proton transverse relaxation timeswere determined: a slower one, T2B, with an initial value of 2 ms,
and a faster one, T2A, with an initial value of 0.7 ms. Increasing thewater content of the sample caused a moderate increase in T2Aand a more pronounced increase of T2B. Upon reaching a WC ofaround 0.4 gH20/gHYA (start of region II in Fig. 1A), a new protonpool with transverse relaxation time T2C appeared. Both T2B andT2C irregularly but significantly grew with increasing water con-tent. In contrast, the fastest component T2A changed gradually toonly 2.1 ms for the maximum water fraction investigated in thisstudy i.e. WC = 6.5 gH20/gHYA (Fig. 1B). Neither the standard devia-tion of the fitting nor the repeat measurements are shown in Fig. 1as in all cases, the standard deviation is smaller than the symbol sizeand values of repetitive measurement are close to those reportedin Fig. 1.
Multi-exponential behaviour of transverse relaxation decaycurves, as observed in this study, is typical behaviour for vis-coelastic systems like hydrated polysaccharides (Mariette, 2009).There are a number of mechanisms used as relaxation pathways inwater–polysaccharide systems (McBrierty, Martin, & Karasz, 1999).Nevertheless proton exchange between polysaccharide hydroxylprotons and water molecules is thought to be the main relaxationmechanism in water–polysaccharide system (Okada, Matsukawa,& Watanabe, 2002) (Nestor, Kenne, & Sandstrom, 2010).
As can be seen in Fig. 1A, over the investigated water contentrange T2A values are rather low. According to the Fuoss–Kirkwooddistribution (Bakhmutov, 2004), such fast transverse relaxation canbe attributed to transversal relaxation of large molecules, thus T2Areflects relaxation of non-exchangeable HYA macromolecule pro-tons. The slight increase in T2A values over the range of WC valuesis caused by gradual hydration of the hyaluronan structure whichbrings about an increase in hyaluronan macromolecule mobility.
As can be seen in Fig. 1A, a WC of 0.4 gH20/gHYA is a border concen-tration above which a new proton pool T2C is introduced. In general,water molecules are in mutual diffusive exchange. However, inthe case of enormously rigid systems, when the water diffusionis sufficiently slow compared to the NMR time scale, relaxation isin the slow exchange regime and multi-component relaxation isobserved. Consequently different water proton pools can be dis-criminated (Shapiro, 2011), i.e. T2B and T2C were observed. Abovethis border water content (0.4 gH20/gHYA) an abrupt increase in T2Band T2C values appears. This indicates changes in HYA structure
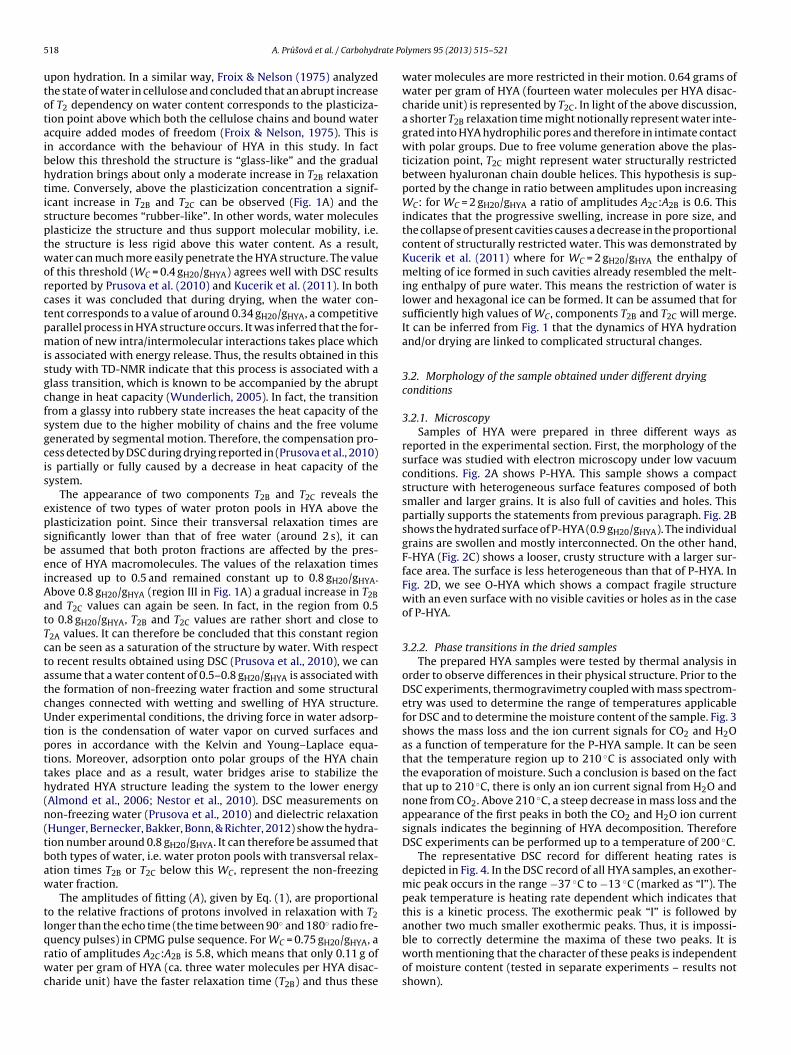
518 A. Prusová et al. / Carbohydrate Polymers 95 (2013) 515– 521
upon hydration. In a similar way, Froix & Nelson (1975) analyzedthe state of water in cellulose and concluded that an abrupt increaseof T2 dependency on water content corresponds to the plasticiza-tion point above which both the cellulose chains and bound wateracquire added modes of freedom (Froix & Nelson, 1975). This isin accordance with the behaviour of HYA in this study. In factbelow this threshold the structure is “glass-like” and the gradualhydration brings about only a moderate increase in T2B relaxationtime. Conversely, above the plasticization concentration a signif-icant increase in T2B and T2C can be observed (Fig. 1A) and thestructure becomes “rubber-like”. In other words, water moleculesplasticize the structure and thus support molecular mobility, i.e.the structure is less rigid above this water content. As a result,water can much more easily penetrate the HYA structure. The valueof this threshold (WC = 0.4 gH20/gHYA) agrees well with DSC resultsreported by Prusova et al. (2010) and Kucerik et al. (2011). In bothcases it was concluded that during drying, when the water con-tent corresponds to a value of around 0.34 gH20/gHYA, a competitiveparallel process in HYA structure occurs. It was inferred that the for-mation of new intra/intermolecular interactions takes place whichis associated with energy release. Thus, the results obtained in thisstudy with TD-NMR indicate that this process is associated with aglass transition, which is known to be accompanied by the abruptchange in heat capacity (Wunderlich, 2005). In fact, the transitionfrom a glassy into rubbery state increases the heat capacity of thesystem due to the higher mobility of chains and the free volumegenerated by segmental motion. Therefore, the compensation pro-cess detected by DSC during drying reported in (Prusova et al., 2010)is partially or fully caused by a decrease in heat capacity of thesystem.
The appearance of two components T2B and T2C reveals theexistence of two types of water proton pools in HYA above theplasticization point. Since their transversal relaxation times aresignificantly lower than that of free water (around 2 s), it canbe assumed that both proton fractions are affected by the pres-ence of HYA macromolecules. The values of the relaxation timesincreased up to 0.5 and remained constant up to 0.8 gH20/gHYA.Above 0.8 gH20/gHYA (region III in Fig. 1A) a gradual increase in T2Band T2C values can again be seen. In fact, in the region from 0.5to 0.8 gH20/gHYA, T2B and T2C values are rather short and close toT2A values. It can therefore be concluded that this constant regioncan be seen as a saturation of the structure by water. With respectto recent results obtained using DSC (Prusova et al., 2010), we canassume that a water content of 0.5–0.8 gH20/gHYA is associated withthe formation of non-freezing water fraction and some structuralchanges connected with wetting and swelling of HYA structure.Under experimental conditions, the driving force in water adsorp-tion is the condensation of water vapor on curved surfaces andpores in accordance with the Kelvin and Young–Laplace equa-tions. Moreover, adsorption onto polar groups of the HYA chaintakes place and as a result, water bridges arise to stabilize thehydrated HYA structure leading the system to the lower energy(Almond et al., 2006; Nestor et al., 2010). DSC measurements onnon-freezing water (Prusova et al., 2010) and dielectric relaxation(Hunger, Bernecker, Bakker, Bonn, & Richter, 2012) show the hydra-tion number around 0.8 gH20/gHYA. It can therefore be assumed thatboth types of water, i.e. water proton pools with transversal relax-ation times T2B or T2C below this WC, represent the non-freezingwater fraction.
The amplitudes of fitting (A), given by Eq. (1), are proportionalto the relative fractions of protons involved in relaxation with T2longer than the echo time (the time between 90◦ and 180◦ radio fre-quency pulses) in CPMG pulse sequence. For WC = 0.75 gH20/gHYA, aratio of amplitudes A2C:A2B is 5.8, which means that only 0.11 g ofwater per gram of HYA (ca. three water molecules per HYA disac-charide unit) have the faster relaxation time (T2B) and thus these
water molecules are more restricted in their motion. 0.64 grams ofwater per gram of HYA (fourteen water molecules per HYA disac-charide unit) is represented by T2C. In light of the above discussion,a shorter T2B relaxation time might notionally represent water inte-grated into HYA hydrophilic pores and therefore in intimate contactwith polar groups. Due to free volume generation above the plas-ticization point, T2C might represent water structurally restrictedbetween hyaluronan chain double helices. This hypothesis is sup-ported by the change in ratio between amplitudes upon increasingWC: for WC = 2 gH20/gHYA a ratio of amplitudes A2C:A2B is 0.6. Thisindicates that the progressive swelling, increase in pore size, andthe collapse of present cavities causes a decrease in the proportionalcontent of structurally restricted water. This was demonstrated byKucerik et al. (2011) where for WC = 2 gH20/gHYA the enthalpy ofmelting of ice formed in such cavities already resembled the melt-ing enthalpy of pure water. This means the restriction of water islower and hexagonal ice can be formed. It can be assumed that forsufficiently high values of WC, components T2B and T2C will merge.It can be inferred from Fig. 1 that the dynamics of HYA hydrationand/or drying are linked to complicated structural changes.
3.2. Morphology of the sample obtained under different dryingconditions
3.2.1. MicroscopySamples of HYA were prepared in three different ways as
reported in the experimental section. First, the morphology of thesurface was studied with electron microscopy under low vacuumconditions. Fig. 2A shows P-HYA. This sample shows a compactstructure with heterogeneous surface features composed of bothsmaller and larger grains. It is also full of cavities and holes. Thispartially supports the statements from previous paragraph. Fig. 2Bshows the hydrated surface of P-HYA (0.9 gH20/gHYA). The individualgrains are swollen and mostly interconnected. On the other hand,F-HYA (Fig. 2C) shows a looser, crusty structure with a larger sur-face area. The surface is less heterogeneous than that of P-HYA. InFig. 2D, we see O-HYA which shows a compact fragile structurewith an even surface with no visible cavities or holes as in the caseof P-HYA.
3.2.2. Phase transitions in the dried samplesThe prepared HYA samples were tested by thermal analysis in
order to observe differences in their physical structure. Prior to theDSC experiments, thermogravimetry coupled with mass spectrom-etry was used to determine the range of temperatures applicablefor DSC and to determine the moisture content of the sample. Fig. 3shows the mass loss and the ion current signals for CO2 and H2Oas a function of temperature for the P-HYA sample. It can be seenthat the temperature region up to 210 ◦C is associated only withthe evaporation of moisture. Such a conclusion is based on the factthat up to 210 ◦C, there is only an ion current signal from H2O andnone from CO2. Above 210 ◦C, a steep decrease in mass loss and theappearance of the first peaks in both the CO2 and H2O ion currentsignals indicates the beginning of HYA decomposition. ThereforeDSC experiments can be performed up to a temperature of 200 ◦C.
The representative DSC record for different heating rates isdepicted in Fig. 4. In the DSC record of all HYA samples, an exother-mic peak occurs in the range −37 ◦C to −13 ◦C (marked as “I”). Thepeak temperature is heating rate dependent which indicates thatthis is a kinetic process. The exothermic peak “I” is followed byanother two much smaller exothermic peaks. Thus, it is impossi-ble to correctly determine the maxima of these two peaks. It isworth mentioning that the character of these peaks is independentof moisture content (tested in separate experiments – results notshown).
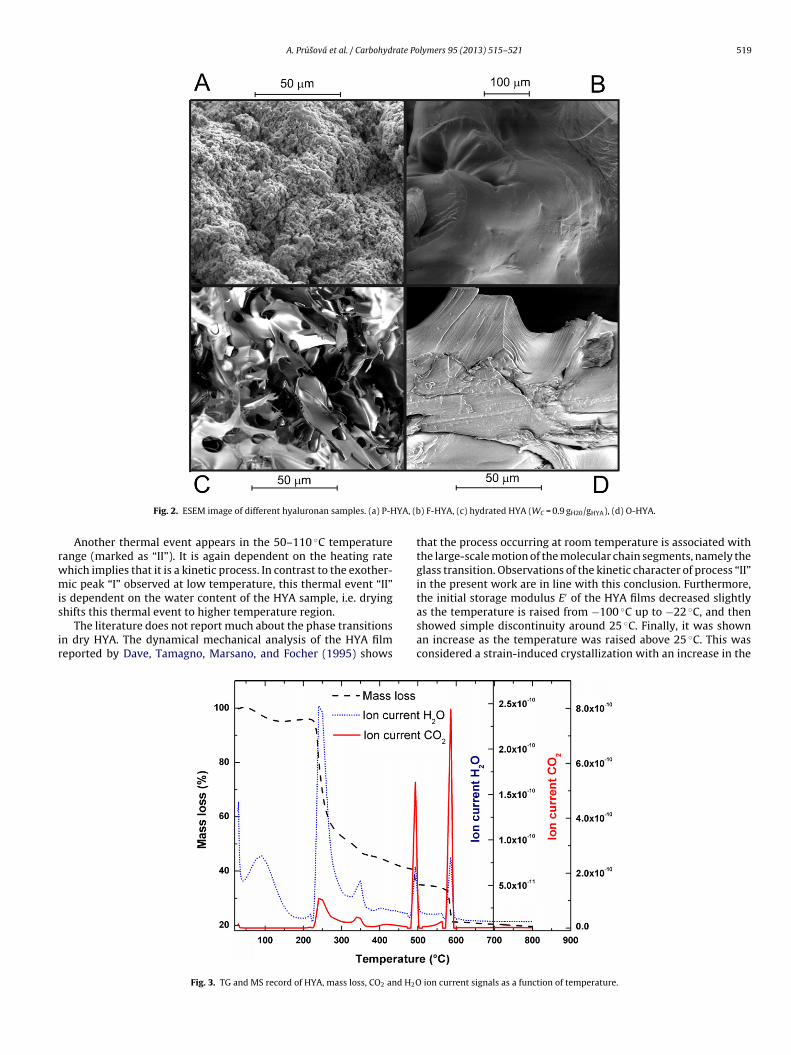
A. Prusová et al. / Carbohydrate Polymers 95 (2013) 515– 521 519
Fig. 2. ESEM image of different hyaluronan samples. (a) P-HYA, (b) F-HYA, (c) hydrated HYA (WC = 0.9 gH20/gHYA), (d) O-HYA.
Another thermal event appears in the 50–110 ◦C temperaturerange (marked as “II”). It is again dependent on the heating ratewhich implies that it is a kinetic process. In contrast to the exother-mic peak “I” observed at low temperature, this thermal event “II”is dependent on the water content of the HYA sample, i.e. dryingshifts this thermal event to higher temperature region.
The literature does not report much about the phase transitionsin dry HYA. The dynamical mechanical analysis of the HYA filmreported by Dave, Tamagno, Marsano, and Focher (1995) shows
that the process occurring at room temperature is associated withthe large-scale motion of the molecular chain segments, namely theglass transition. Observations of the kinetic character of process “II”in the present work are in line with this conclusion. Furthermore,the initial storage modulus E′ of the HYA films decreased slightlyas the temperature is raised from −100 ◦C up to −22 ◦C, and thenshowed simple discontinuity around 25 ◦C. Finally, it was shownan increase as the temperature was raised above 25 ◦C. This wasconsidered a strain-induced crystallization with an increase in the
Fig. 3. TG and MS record of HYA, mass loss, CO2 and H2O ion current signals as a function of temperature.
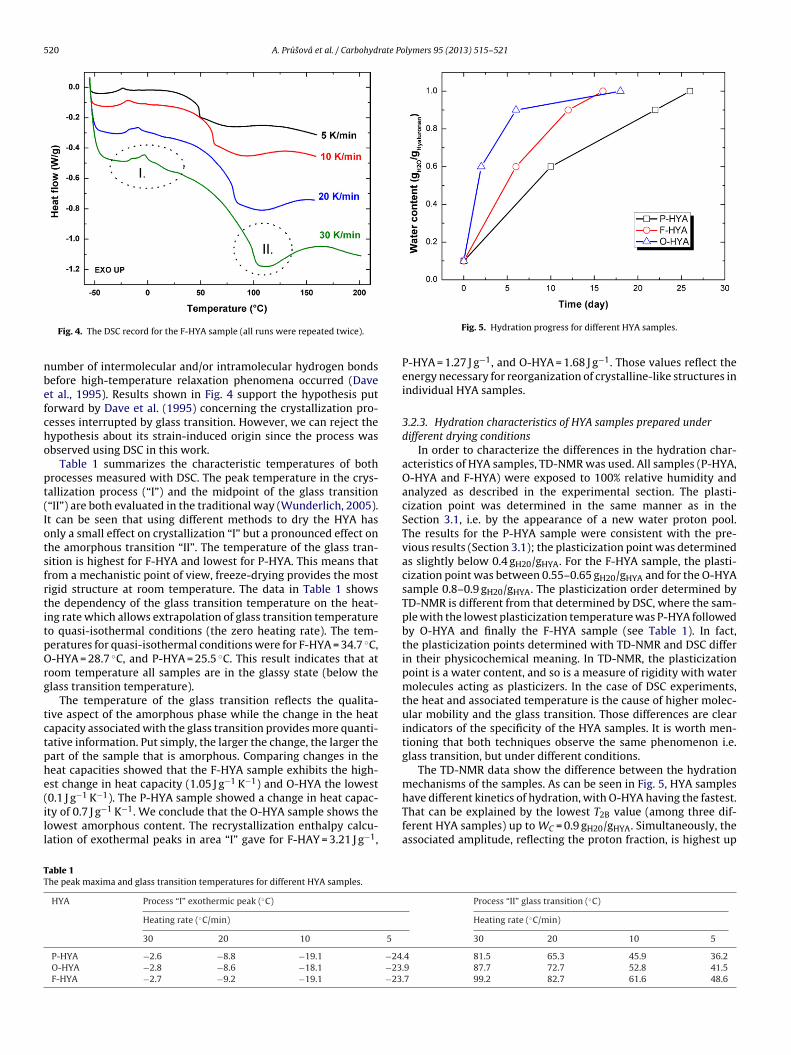
520 A. Prusová et al. / Carbohydrate Polymers 95 (2013) 515– 521
Fig. 4. The DSC record for the F-HYA sample (all runs were repeated twice).
number of intermolecular and/or intramolecular hydrogen bondsbefore high-temperature relaxation phenomena occurred (Daveet al., 1995). Results shown in Fig. 4 support the hypothesis putforward by Dave et al. (1995) concerning the crystallization pro-cesses interrupted by glass transition. However, we can reject thehypothesis about its strain-induced origin since the process wasobserved using DSC in this work.
Table 1 summarizes the characteristic temperatures of bothprocesses measured with DSC. The peak temperature in the crys-tallization process (“I”) and the midpoint of the glass transition(“II”) are both evaluated in the traditional way (Wunderlich, 2005).It can be seen that using different methods to dry the HYA hasonly a small effect on crystallization “I” but a pronounced effect onthe amorphous transition “II”. The temperature of the glass tran-sition is highest for F-HYA and lowest for P-HYA. This means thatfrom a mechanistic point of view, freeze-drying provides the mostrigid structure at room temperature. The data in Table 1 showsthe dependency of the glass transition temperature on the heat-ing rate which allows extrapolation of glass transition temperatureto quasi-isothermal conditions (the zero heating rate). The tem-peratures for quasi-isothermal conditions were for F-HYA = 34.7 ◦C,O-HYA = 28.7 ◦C, and P-HYA = 25.5 ◦C. This result indicates that atroom temperature all samples are in the glassy state (below theglass transition temperature).
The temperature of the glass transition reflects the qualita-tive aspect of the amorphous phase while the change in the heatcapacity associated with the glass transition provides more quanti-tative information. Put simply, the larger the change, the larger thepart of the sample that is amorphous. Comparing changes in theheat capacities showed that the F-HYA sample exhibits the high-est change in heat capacity (1.05 J g−1 K−1) and O-HYA the lowest(0.1 J g−1 K−1). The P-HYA sample showed a change in heat capac-ity of 0.7 J g−1 K−1. We conclude that the O-HYA sample shows thelowest amorphous content. The recrystallization enthalpy calcu-lation of exothermal peaks in area “I” gave for F-HAY = 3.21 J g−1,
Fig. 5. Hydration progress for different HYA samples.
P-HYA = 1.27 J g−1, and O-HYA = 1.68 J g−1. Those values reflect theenergy necessary for reorganization of crystalline-like structures inindividual HYA samples.
3.2.3. Hydration characteristics of HYA samples prepared underdifferent drying conditions
In order to characterize the differences in the hydration char-acteristics of HYA samples, TD-NMR was used. All samples (P-HYA,O-HYA and F-HYA) were exposed to 100% relative humidity andanalyzed as described in the experimental section. The plasti-cization point was determined in the same manner as in theSection 3.1, i.e. by the appearance of a new water proton pool.The results for the P-HYA sample were consistent with the pre-vious results (Section 3.1); the plasticization point was determinedas slightly below 0.4 gH20/gHYA. For the F-HYA sample, the plasti-cization point was between 0.55–0.65 gH20/gHYA and for the O-HYAsample 0.8–0.9 gH20/gHYA. The plasticization order determined byTD-NMR is different from that determined by DSC, where the sam-ple with the lowest plasticization temperature was P-HYA followedby O-HYA and finally the F-HYA sample (see Table 1). In fact,the plasticization points determined with TD-NMR and DSC differin their physicochemical meaning. In TD-NMR, the plasticizationpoint is a water content, and so is a measure of rigidity with watermolecules acting as plasticizers. In the case of DSC experiments,the heat and associated temperature is the cause of higher molec-ular mobility and the glass transition. Those differences are clearindicators of the specificity of the HYA samples. It is worth men-tioning that both techniques observe the same phenomenon i.e.glass transition, but under different conditions.
The TD-NMR data show the difference between the hydrationmechanisms of the samples. As can be seen in Fig. 5, HYA sampleshave different kinetics of hydration, with O-HYA having the fastest.That can be explained by the lowest T2B value (among three dif-ferent HYA samples) up to WC = 0.9 gH20/gHYA. Simultaneously, theassociated amplitude, reflecting the proton fraction, is highest up
Table 1The peak maxima and glass transition temperatures for different HYA samples.
HYA Process “I” exothermic peak (◦C) Process “II” glass transition (◦C)
Heating rate (◦C/min) Heating rate (◦C/min)
30 20 10 5 30 20 10 5
P-HYA −2.6 −8.8 −19.1 −24.4 81.5 65.3 45.9 36.2O-HYA −2.8 −8.6 −18.1 −23.9 87.7 72.7 52.8 41.5F-HYA −2.7 −9.2 −19.1 −23.7 99.2 82.7 61.6 48.6

A. Prusová et al. / Carbohydrate Polymers 95 (2013) 515– 521 521
to WC = 0.9 gH20/gHYA and then is approximately equal to amplitudeassociated with T2C relaxation time (data not shown). This meansthat below 0.9 gH20/gHYA, O-HYA has the largest fraction of struc-turally integrated water protons. In other words, O-HYA has thelargest number of small pores. These cannot be seen from the scan-ning electron microscope pictures under applied conditions andresolution (Fig. 2), but explain the fast kinetics of hydration (seeFig. 5).
In our recent work, analysis of the P-HYA sample at differentWC values using DSC gave a plasticization point of 0.34 gH20/gHYA(Prusova et al., 2010; Kucerik et al., 2011) which is in agree-ment with results obtained by TD-NMR in this work. In contrast,samples prepared under different drying conditions gave ratherdifferent results in terms of physicochemical properties andbehaviour such as glass transition and response to the moisturiz-ing conditions. This further emphasises our earlier statement thathydration, especially in the case of hyaluronan, is a “dynamic”value and reflects the sample’s history (preparation, condition-ing, drying. . .), the technique used for its determination, andslightly also the conditions under which the experiment is carriedout.
4. Conclusion
In this study, HYA samples were prepared under three dif-ferent drying conditions yielding the original, freeze-dried, andoven-dried HYA sample. It was demonstrated that DSC and TD-NMR are complementary techniques in terms of HYA hydration.The non-freezing water fraction in semi-diluted HYA can bedetermined using both techniques. Further, by using TD-NMRit is possible to determine the hydration kinetics of HYA andalso to determine the water content of an HYA sample thatcorresponds to the glass-to-rubbery-state transition which is ameasure of the rigidity of a system. The oven-dried sample hasthe fastest whereas the precipitated HYA sample has the slow-est hydration kinetics. Based on the glass transition temperature,it was observed that the sample prepared by freeze-drying wasthe most rigid one and the oven-dried sample had the low-est amorphous fraction. Hence it was demonstrated that thesupramolecular structure of native HYA is modified by dryingconditions. This represents a promising strategy for further appli-cation of this polysaccharide in its native state, for examplein the pharmaceutical industry in drug delivery systems withdelayed wetting, swelling, and consequent release of transporteddrugs.
Acknowledgements
The authors wish to thank Prof. Dr. Gabriele E. Schaumannand Dr. Jette Schwarz from Universität Koblenz-Landau in Lan-dau, Germany and Assoc. Prof. Dr. Henk Van As from WageningenUniversity, The Netherlands for their support and help, to Assoc.Prof. Dr. Vladimír Velebny from CPN Company, Dolní Dobrouc,Czech Republic for providing of hyaluronan and Andrew Cuthbert(MPhys) from Wageningen University, The Netherlands for correc-tion of English style and grammar.
References
Almond, A., DeAngelis, P. L., & Blundell, C. D. (2006). Hyaluronan: the local solu-tion conformation determined by NMR and computer modeling is close toa contracted left-handed 4-fold helix. Journal of Molecular Biology, 358(5),1256–1269.
Bakhmutov, V. I. (2004). Practical NMR relaxation for chemists. Chichester, West Sus-sex, England: Wiley.
Belton, P. S. (1997). NMR and the mobility of water in polysaccharide gels. Interna-tional Journal of Biological Macromolecules, 21(1/2), 81–88.
Bouwstra, J. A., Salomonsdevries, M. A., & Vanmiltenburg, J. C. (1995). The thermalbehaviour of water in hydrogels. Thermochimica Acta, 248, 319–327.
Chakraborty, S., Sinha, S. K., & Bandyopadhyay, S. (2007). Low-frequency vibrationalspectrum of water in the hydration layer of a protein: A molecular dynamicssimulation study. Journal of Physical Chemistry B, 111(48), 13626–13631.
Dave, Y., Tamagno, M., Marsano, E., & Focher, B. (1995). Hyaluronan acide (hydrox-ypropyl) cellulose blends – A solution and solid-state study. Abstracts of Papersof the American Chemical Society, 209, 149–150.
Davies, A., Gormally, J., Wynjones, E., Wedlock, D. J., & Phillips, G. O. (1983). A studyof factors influencing hydration of sodium hyaluronate from compressibilityand high-precision densitometric measurements. Biochemical Journal, 213(2),363–369.
Froix, M. F., & Nelson, R. (1975). Interaction of water with cellulose from nuclearmagnetic resonance relaxation times. Macromolecules, 8(6), 726–730.
Garg, H. G., & Hales, C. A. (2004). Chemistry and Biology of Hyaluronan. Amsterdam,Nederland: Elsevier.
Hatakeyama, T., Hatakeyama, H. (2004). Thermal Properties of Green Polymers andBiocomposites.
Hunger, J., Bernecker, A., Bakker, H. J., Bonn, M., & Richter, R. P. (2012). Hydrationdynamics of hyaluronan and dextran. Biophysical Journal, 103(1), L10–L12.
Kucerik, J., Prusova, A., Rotaru, A., Flimel, K., Janecek, J., & Conte, P. (2011). DSC studyon hyaluronan drying and hydration. Thermochimica Acta, 523(1/2), 245–249.
Liu, J., & Cowman, M. K. (2000). Thermal analysis of semi-dilute hyaluronan solutions.Journal of Thermal Analysis and Calorimetry, 59(1/2), 547–557.
Mariette, F. (2009). Investigations of food colloids by NMR and MRI. Current Opinionin Colloid & Interface Science, 14(3), 203–211.
McBrierty, V. J., Martin, S. J., & Karasz, F. E. (1999). Understanding hydrated polymers:The perspective of NMR. Journal of Molecular Liquids, 80(2/3), 179–205.
Mlcoch, T., & Kucerik, J. (2013). Hydration and drying of various polysac-charides studied using DSC. Journal of Thermal Analysis and Calorimetry,http://dx.doi.org/10.1007/s10973-013-2946-1
Nestor, G., Kenne, L., & Sandstrom, C. (2010). Experimental evidence of chemicalexchange over the beta(1 → 3) glycosidic linkage and hydrogen bonding involv-ing hydroxy protons in hyaluronan oligosaccharides by NMR spectroscopy.Organic & Biomolecular Chemistry, 8(12), 2795–2802.
Okada, R., Matsukawa, S., & Watanabe, T. (2002). Hydration structure and dynam-ics in pullulan aqueous solution based on H-1 NMR relaxation time. Journal ofMolecular Structure, 602, 473–483.
Prusova, A., Smejkalova, D., Chytil, M., Velebny, V., & Kucerik, J. (2010). An alternativeDSC approach to study hydration of hyaluronan. Carbohydrate Polymers, 82(2),498–503.
Scott, J. E., & Heatley, F. (1999). Hyaluronan forms specific stable tertiary structuresin aqueous solution: A C-13 NMR study. Proceedings of the National Academy ofSciences of the United States of America, 96(9), 4850–4855.
Scott, J. E., & Heatley, F. (2002). Biological properties of hyaluronan in aqueous solu-tion are controlled and sequestered by reversible tertiary structures, defined byNMR spectroscopy. Biomacromolecules, 3(3), 547–553.
Shapiro, Y. E. (2011). Structure and dynamics of hydrogels and organogels: An NMRspectroscopy approach. Progress in Polymer Science, 36(9), 1184–1253.
Sutherland, I. W. (1998). Novel and established applications of microbial polysac-charides. Trends in Biotechnology, 16(1), 41–46.
Takahashi, M., Hatakeyama, T., & Hatakeyama, H. (2000). Phenomenological the-ory describing the behaviour of non-freezing water in structure formationprocess of polysaccharide aqueous solutions. Carbohydrate Polymers, 41(1),91–95.
Topgaard, D., & Soderman, O. (2002). Changes of cellulose fiber wall structure dur-ing drying investigated using NMR self-diffusion and relaxation experiments.Cellulose, 9(2), 139–147.
Wunderlich, B. (2005). Thermal analysis of Polymeric Materials. Berlin: Springer-Verlag.
Yokomizo, T., Nakasako, M., Yamazaki, T., Shindo, H., & Higo, J. (2005). Hydrogen-bond patterns in the hydration structure of a protein. Chemical Physics Letters,401(4–6), 332–336.
PUBLICATIONS
96
PUBLICATIONS
Peer-reviewed:
Průšová, A., Šmejkalová, D., Chytil, M., Velebný, M., Kučerík, J. (2010). An alternative
DSC approach to study hydration of hyaluronan. Carbohydrate Polymers 82: 498-503.
Průšová, A., Conte, P., Kučerík, J., Alonzo, G. (2010) Dynamics of hyaluronan aqueous
solutions as assessed by fast field cycling NMR relaxometry. Analytical and Bioanalytical
Chemistry 397: 3023-3028.
Kučerík, J., Průšová, A., Rotaru, A., Flimel, K., Janeček, J., Conte, P. (2011). DSC study
on hyaluronan hydration and dehydration. Thermochimica acta 523: 245-249.
Šmejkalová, D., Hermannová, M., Šulánková, R., Průšová, A., Kučerík, J., Velebný, M.
(2012) Structural and conformation differences of acylated hyaluronan modified in protic
and aprotic solvent system. Carbohydrate Polymers 87: 1460-1466.
Kučerík, J., Bursáková, P., Průšová, A., Grebíková, L., Schaumann, G.E. (2012) Hydration
of humic and fulvic acids studied by DSC. Journal of thermal analysis and calorimetry
110: 451-459.
Špérová, M., Kučerík, J., Nasadil, P., Průšová, A. (2012) A hint on the correlation between
cellulose fibres polymerization degree and their thermal and thermo- oxidative degradation.
Journal of Thermal Analysis and Calorimetry 110: 71-76.
Průšová, A., Vergeldt, F.J., Kučerík, J. (2013) Influence of water content and drying on the
physical structure of native hyaluronan. Carbohydrate Polymers 95: 515-521.
Oral presentations:
Alena Průšová, Petra Bursáková, Jiří Kučerík. “Hydration of hyaluronan”.4th Meeting
on Chemistry & Life 2008, Brno, Czech Republic.
Alena Průšová, Pellegrino Conte, Jiří Kučerík, Claudio De Pasquale, Giuseppe Alonzo.
“Dynamics of water solutions of natural polysaccharides by fast field cycling NMR
relaxometry” European Geosciences Union General Assembly 2010 Vienna, Austria.
Alena Průšová, Jiří Kučerík, Gabriele E. Schaumann. “A comparative DSC and 1H
NMR relaxometry study on hyaluronan hydration” 1st Central and Eastern European
Conference on Thermal Analysis and Calorimetry 2011, Craiova, Romania.
PUBLICATIONS
97
Poster presentations:
Alena Průšová, Claudio De Pasquale, Vittorio Loddo, Leonardo Palmisano. “TiO2-H2O
interactions by fast field cycling (FFC) NMR relaxometry” European Geosciences
Union General Assembly 2010 Vienna, Austria.
Alena Průšová, Pellegrino Conte, Jiří Kučerík, Giuseppe Alonzo. “Dynamics of
hyaluronan aqueous solutions as affected by molecular size and ionic strength” 7th
conference of field cycling NMR relaxometry 2011, Torino, Italy

Curriculum vitae
98
CURRICULUM VITAE
Contact
Name: Alena Průšová
Address: Haldereng 29, Bennekom 6721XR, The Netherlands
Email: [email protected]
Telephone: 0031 657 766 595
Personal data
Date of birth: 09.06.1984
Place of birth: Ceske Budejovice, Czech Republic
Nationality: Czech
Education
Date: 2012 –2013
Qualification: Ph.D. study
University: University of Koblenz-Landau, Germany
Date: 2008 –2011
Qualification: Ph.D. study
University: Brno University of Technology, Czech Republic
Curriculum vitae
99
Date: 2003 –2008
Qualification: Physical and Consumer Chemistry, Dipl. Ing
University: Brno University of Technology, Czech Republic
Date: 1999 –2003
Qualification: GCSE in Food Chemistry
Secondary technical school in České Budějovice, Czech Republic
Related Documents