HYDRATE FORMATION IN WAXY OIL SYSTEMS By DEEPIKA VENKATARAMANI Bachelor of Technology in Chemical Engineering Anna University Chennai, Tamil Nadu, India 2009 Master of Science in Environmental Engineering Syracuse University Syracuse, NY 2011 Submitted to the Faculty of the Graduate College of the Oklahoma State University in partial fulfillment of the requirements for the Degree of DOCTOR OF PHILOSOPHY December, 2016

Welcome message from author
This document is posted to help you gain knowledge. Please leave a comment to let me know what you think about it! Share it to your friends and learn new things together.
Transcript

HYDRATE FORMATION IN WAXY OIL SYSTEMS
By
DEEPIKA VENKATARAMANI
Bachelor of Technology in Chemical Engineering
Anna University
Chennai, Tamil Nadu, India
2009
Master of Science in Environmental Engineering
Syracuse University
Syracuse, NY
2011
Submitted to the Faculty of the
Graduate College of the
Oklahoma State University
in partial fulfillment of
the requirements for
the Degree of
DOCTOR OF PHILOSOPHY
December, 2016

ii
HYDRATE FORMATION IN WAXY OIL SYSTEMS
Dissertation Approved:
Dr. Clint P. Aichele
Dissertation Adviser
Dr. Peter E. Clark
Dr. James E. Smay
Dr. Hariprasad J. Subramani
Dr. Jeffery L. White

iii Acknowledgements reflect the views of the author and are not endorsed by committee
members or Oklahoma State University.
ACKNOWLEDGEMENTS
I would like to thank my PhD advisor Dr. Clint P. Aichele for giving me the
opportunity to work on this project as well as several others, for his guidance and
constant encouragement throughout. I have learned a lot on work ethics from Dr. Aichele
which has been highly valuable.
I would like to thank my mentor and committee member Dr. Peter E. Clark for his
invaluable time and candid discussions both on professional and personal front. I have
deeply enjoyed our conversation on politics, government, and general life experiences.
I would also like to express my gratitude to my mentor and committee member
Dr. Hariprasad J. Subramani for initiating my research topic, valuable ideas, and
guidance. I would also like to thank my committee members Dr. Jefferey L. White, and
Dr. James E. Smay for their valuable time and motivating me to develop a professional
attitude towards scientific research. I sincerely appreciate my department head Dr. Rob
Whiteley for inspiring and guiding me in every step of my career. I’m grateful to Dr.
Sayeed Mohammed for his time and efforts in helping me understand fundamentals on a
critical issue related to my thesis. I appreciate Dr. Prem Bikkina, Dr. Jindal Shah, and Dr.
Ashlee Ford Versypt’s time and efforts in my overall development.
I would like to extend special thanks to Dr. Zachary Aman, Dr. Prasad Karanjkar,
Dr. Amit Ahuja, Dr. Sriraj Srinivasan, Shane Morrissey and other colleagues in the
industry for their guidance and useful discussions. I thank my colleagues from Shell for
providing me an amazing internship opportunity.
I would like to thank Gary Thacker for his help in putting together the flow loop. I
also thank Shelley Potter and Yvonne Roberts in guiding through laboratory safe
operation. I thank the department staff for their help with the administrative work and
special note of thanks to Eileen Nelson for her editorial help.
A very special mention to all the vendors and technical team from Canty Inc.,
McCrone Microscope Inc., Linkam, Dispersion Technology Inc., Tulco Chemicals,
VWR, Evonik, Core Labs and many others. Thank you! A heartfelt thank you also goes
out to Victor Lifton (Evonik), Jessica Kostraba, Doug Caldwell, Justin Halbach, Todd
Canty (Canty), Andrei Dukhin and Sean Parlia (Dispersion Technology), Ruben Nieblas
and John Hart (Linkam/ McCrone Microscope), Josh and James (Core Labs) for their
technical help with the instruments.
I thank my colleagues and friends especially Adane Nigatu, Anil Jammula,

iv Acknowledgements reflect the views of the author and are not endorsed by committee
members or Oklahoma State University.
Sravanti Vupputuri, and Solomon Gebrehoyannes for their valuable inputs in my research
and coursework. I thank my friends Ojo, Mesfin, Yehenew, Saba and several others for
their support, and making my stay enjoyable. I would like to acknowledge the help of the
past and present students in my research group. I also thank fellow students from civil
engineering department for letting me share their lab space and providing a friendly work
environment.
I thank my parents, Vasanthi and Venkataramani, for their unconditional love, support,
and encouragement without, which I would not have achieved much. A special and
heartfelt gratitude goes to my husband Gokul for holding me strong and walking with me
through this journey, especially during pressing times. I thank him for providing humor,
entertainment, abundant love, and a peaceful and happy home. I also thank my father-in-
law, Ganapathy, for his love, and encouragement. A special thanks goes to my
grandmother, Savithri for her love and cooking tips. I also thank my uncle, Harish, for
inspiring and believing in me. I thank my close and extended family for all their support
and encouragement. I would like to finally thank the almighty for giving me the best
opportunity I could have asked for. I dedicate this thesis to my parents, husband, uncle,
and mother-in-law (Late Mrs. Vijayalakshmi).

v
Name: DEEPIKA VENKATARAMANI
Date of Degree: DECEMBER, 2016
Title of Study: HYDRATE FORMATION IN WAXY OIL SYSTEMS
Major Field: CHEMICAL ENGINEERING
Abstract: Emulsions are of great importance due to their widespread occurrence in
industries such as pharmaceutical, cosmetics, food, agricultural, and energy. In the energy
industry, emulsions may be encountered in all stages of production, transportation, and
extraction. Along with naturally occurring surfactants, solid particles such as asphaltenes,
wax, clay, and silica are also present in crude oil. The formation and deposition of
precipitated solids such as waxes, hydrates, and asphaltenes cause significant flow
assurance problems for the energy industry. The motivation of this thesis was to develop
a fundamental understanding of the hydrate formation mechanisms in waxy oil systems.
This thesis focuses on the characterization of emulsions and hydrate formation in waxy
oil systems in the presence of stabilizing agents such as a surfactant (span 80). A direct
visualization and in-situ experimental method was developed for characterizing hydrate
formation in waxy oil systems. Single water drop hydrate formation experiments were
conducted with and without surfactant to evaluate the effect of wax concentration (1.25
and 5 wt.%), and cooling rates (0.5, 1, and 2 °C/min) on hydrate formation. In surfactant
free systems, the presence of wax in the oil phase was observed to enhance the diffusion
resistance of cyclopentane transport to the bulk water phase and hence delay hydrate
growth rate. Conversely, the presence of surfactant was observed to reduce the diffusion
resistance and promote hydrate formation. Faster hydrate growth was observed in
surfactant laden systems due to reduced interfacial tension, thereby enhancing the mass
transfer of cyclopentane to the water phase. In the absence of surfactant, wax
concentration and the cooling rates had a significant impact on the hydrate conversion
time. However, such observations were not seen in the presence of a surfactant. A four
step hydrate formation mechanism (wax precipitation, hydrate nucleation, lateral growth,
and radial growth) in waxy oil systems was proposed based on the experimental data.
Wax precipitation and hydrate nucleation were observed to be heat transfer limited
processes. Lateral growth was governed by diffusion of cyclopentane to the oil/water
interface, while radial growth was goverened by mass transfer of cyclopentane into the
water drop. Interfacial tension was observed to play a major role in hydrate conversion
rate. An in-situ experimental method was developed by direct visualization of hydrate
growth in emulsions. Hydrate formation was observed to affect the emulsion
morphology. Irreversible formation of multiple emulsions was observed upon hydrate
dissociation.

vi
TABLE OF CONTENTS
Chapter Page
I. INTRODUCTION ......................................................................................................1
1.1 Overview ............................................................................................................1
1.2 Motivation ..........................................................................................................2
1.3 Literature Review...............................................................................................4
1.3.1 Emulsions ..................................................................................................4
1.3.2 Hydrates ....................................................................................................8
1.3.3 Wax .........................................................................................................11
1.4 Safety ...............................................................................................................14
1.5 Thesis Outline .................................................................................................14
II. TRANSIENT STABILITY OF SURFACTANT AND SOLID STABILIZED
WATER-IN-OIL EMULSIONS ............................................................................17
2.1 Introduction ......................................................................................................17
2.2 Materials and Methods .....................................................................................20
2.2.1 Emulsion Preparation ..............................................................................20
2.2.2 Acoustic Spectroscopy ............................................................................21
2.2.3 Optical Microscopy .................................................................................23
2.2.4 Experimental Procedure ..........................................................................23
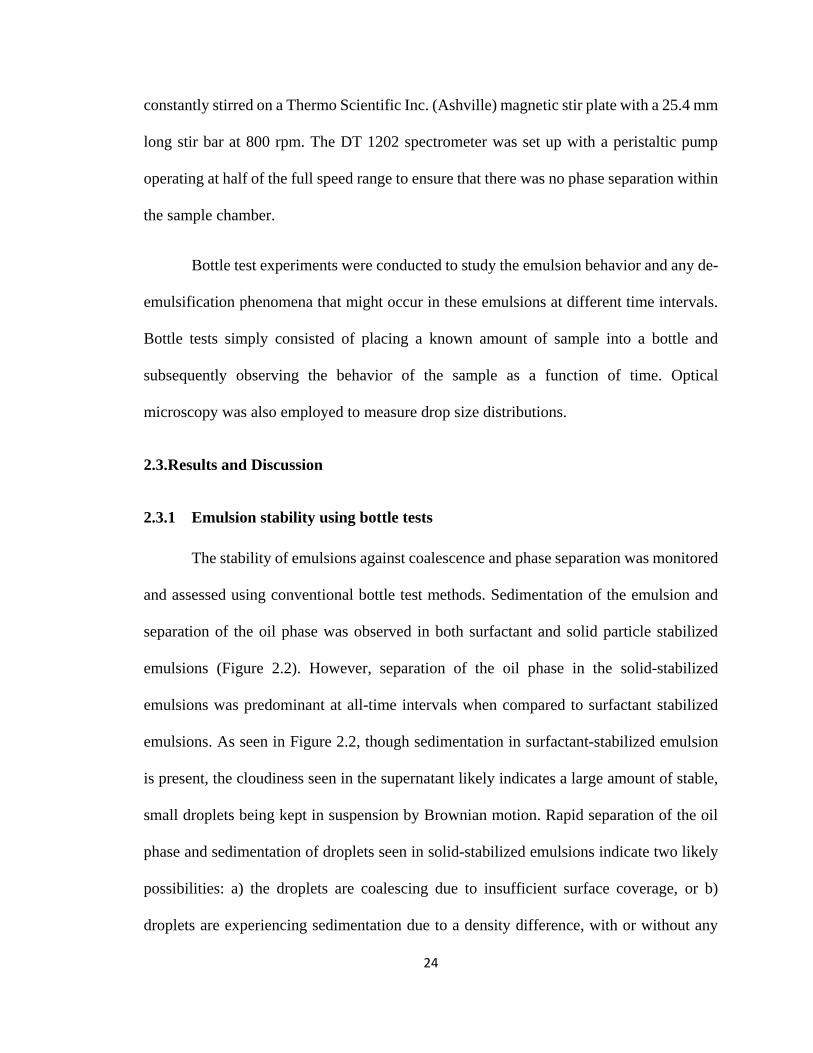
2.3 Results and Discussion ....................................................................................24
2.3.1 Emulsion Stability using Bottle Tests .....................................................24
2.3.2 Emulsion characterization: optical microscopy and acoustic/
electroacoustic spectroscopy ............................................................................26
2.4 Conclusions and Future Work .........................................................................35
III. CONCENTRATED EMULSION CHARACTERIZATION IN FLOWING
CONDITIONS……………………………………………………………………37
3.1 Introduction ......................................................................................................37
3.2 Materials and Methods .....................................................................................38
3.2.1 Experimental Setup .................................................................................38
3.2.2 Materials and Experimental Procedure ...................................................39
3.3 Results and Discussion ....................................................................................41
3.4 Conclusions and Future Work .........................................................................52

vii
Chapter Page
IV. IMPACT OF HYDRATE FORMATION ON EMULSION MORPHOLOGY IN
SURFACTANT AND SOLID STABILIZED EMULSIONS ...............................54
4.1 Introduction ......................................................................................................54
4.2 Materials and Methods .....................................................................................59
4.2.1 Materials .................................................................................................59
4.2.2 Method ....................................................................................................61
4.3 Results and Discussion ....................................................................................67
4.4 Conclusions ......................................................................................................77
V. SINGLE WATER DROP HYDRATE FORMATION IN WAXY OIL SYSTEMS
................................................................................................................................78
5.1 Introduction ......................................................................................................78
5.2 Materials and Methods .....................................................................................79
5.2.1 Materials .................................................................................................79
5.2.2 Method ....................................................................................................82
5.3 Results and Discussion ....................................................................................88
5.3.1 Effect of cooling rate, wax concentration, oil composition on wax
appearance temperature (WAT) .......................................................................88
5.3.2 Effect of wax concentration, and cooling rates on hydrate formation ....94
5.4 Conclusions ....................................................................................................115
VI. CONCLUSIONS AND RECOMMENDATIONS ..............................................117
6.1 Significant Contributions ...............................................................................117
6.2 Future Work ...................................................................................................120
REFERENCES ..........................................................................................................128
APPENDICES ...........................................................................................................142

viii
LIST OF TABLES
Table Page
Table 2.1: Average water droplet size in span80 and fumed silica stabilized emulsion
measured at different time intervals after emulsion preparation using acoustic spectrometer
........................................................................................................................................... 30
Table 2.2: Colloidal vibration current (CVI) and conductivity of decalin, decalin with
span80, decalin and fumed silica, span80 and fumed silica stabilized emulsion measured at
various time intervals using acoustic spectrometer .......................................................... 33
Table 3.1: Mean emulsion droplet size of solid particle and surfactant stabilized water-in-
oil emulsions at different water concentrations, flow rates, and temperatures. The average
droplet size was determined from the real-time images and videos captured from the inflow
microscope…………………………………………………………………………...…..52
Table 4.1: Summary of interfacial tension of oil-water interface in the absence and
presence of stabilizer. Oil here represents an equal volume mixture of crystal plus 70T
mineral oil and cyclopentane…………………………………………………………….67
Table 4. 2: Summary of average drop size of emulsions used for transient stability
test………………………………………………………………………………………..74
Table 5.1:Composition of wax obtained from Gas Chromatography analysis [99]……..80
Table 5.2: Wax appearance temperature (WAT) of the oil phase containing either 1.25
wt.% or 5 wt.% wax at different cooling rates using cross polarized microscopy……….90
Table 5.3: Summary of the average time required for visual observation of complete
conversion of water droplet into hydrates in “surfactant free” and “with surfactant” control
samples at constant heating and cooling rate of 2 °C/min……………………………….105
Table 5.4: Summary of the average time required for visual observation of complete
conversion of water droplet to hydrates at various wax concentrations and heating/ cooling
rate………………………………………………………………………………………105

ix
LIST OF FIGURES
Figure Page
Figure 1.1: Mechanism depicting wax stabilized water-in-oil emulsion preventing/
minimizing hydrate agglomeration and plugging. A hydrate-wax slurry mixture is formed,
flows through a pipeline and prevents plugging (adapted from Turner11)….......................3
Figure 1.2: Illustration of water-in-oil emulsion stabilized using a) surfactant b) solid
particles (Pickering emulsion)…………………………………………………………......5
Figure 2.1: Representative image of DT 1202 acoustic and electroacoustic spectrometer.
For this work, this instrument was used for measuring the emulsion droplet size, colloidal
vibration current (CVI), and aqueous/ non-aqueous conductivity………………………..22
Figure 2.2: Bottle test experiment showing the stability, phase separation and
sedimentation of water droplets in surfactant stabilized water-in-oil and solid particle
stabilized water-in-oil emulsion at different time intervals of sample preparation: a) 0th
hour, b) after 48 hours of emulsion preparation, c) after 1 week of emulsion preparation.
The sample was not stirred throughout this experiment…………………………………..25
Figure 2.3: Optical microscopy images (20X magnification) of span80 stabilized water-
in-decalin emulsion taken at different time intervals after emulsification a) 0th hour b) 48th
hour c) after 1 week............................................................................................................26
Figure 2.4: Optical microscopy images (20X magnification) of fumed silica stabilized
water-in-decalin emulsion taken at different time intervals after emulsification a) 0th hour
b) 48th hour c) after 1 week.................................................................................................26
Figure 2.5: Attenuation spectra of a) span80 stabilized emulsion b) fumed silica stabilized
emulsion at various time intervals using acoustic spectrometer. Arrows show the trend in
the attenuation spectra immediately and after 1 week of emulsion preparation at low and
high frequency……………………………………………………………………………27

x
Figure 2.6: Experimental and theoretical attenuation spectra of water-in-oil emulsion
measured immediately after sample preparation (0th hour attenuation) a) Attenuation
spectra of span80 stabilized emulsion assuming thermal loss mechanism b) Attenuation
spectra of fumed silica stabilized emulsion assuming scattering loss mechanism due to the
presence of large droplets…………………………………………………………….......28
Figure 2.7: Drop size distributions of a) span80 stabilized emulsion b) fumed silica
stabilized emulsion at various time intervals using acoustic spectrometer……………….30
Figure 3.1: Schematic of experimental flow loop setup to characterize concentrated
emulsions in flowing conditions.........................................................................................38
Figure 3.2: Glass beads particle size distribution (psd). a) Comparison of glass beads psd
measured using inflow microscopy (0.5 wt. % glass beads) and acoustic spectroscopy (10
wt. % glass beads b) Scanning electron microscopy image of 0.1 wt.% glass beads
suspension c) Image captured by inflow microscope d) Optical microscope image of 0.5
wt. % glass beads taken at 10X magnification....................................................................42
Figure 3.3: Droplet size distribution of solid stabilized 20 vol. % water-in-oil emulsion
and the corresponding images of the emulsion captured by an inflow microscope at
different operating flow rates at 25°C. In the figure, a) comparison of the psd obtained from
the inflow microscope of the emulsion at three different flow rates, and the images of
emulsion captured at b) 3.3 gpm, c) 6.6 gpm, and d) 8.3 gpm............................................43
Figure 3.4: Droplet size distribution of solid stabilized 20 vol. % water-in-oil emulsion
and the corresponding images of the emulsion captured by an inflow microscope at
different operating flow rates at 15°C. In the figure, a) comparison of the psd obtained from
the inflow microscope of the emulsion at three different flow rates, and the images of
emulsion captured at b) 3.3 gpm, c) 6.6 gpm, and d) 8.3 gpm……………………………44
Figure 3.5: Droplet size distribution of surfactant stabilized 20 vol. % water-in-oil
emulsion and the corresponding images of the emulsion captured by the inflow microscope
at different operating flow rates at 25°C. Figure a) shows comparison of the psd obtained
from the inflow microscope of the emulsion at three different flow rates, and the images of
emulsion captured at b) 3.3 gpm, c) 6.6 gpm, and d) 8.3 gpm……………………………45
Figure 3.6: Droplet size distribution of surfactant stabilized 20 vol. % water-in-oil
emulsion and the corresponding images of the emulsion captured by the inflow microscope
at different operating flow rates at 15°C. Figure, a) shows a comparison of the psd obtained
from the inflow microscope of the emulsion at three different flow rates, and the images of
emulsion captured at b) 3.3 gpm, c) 6.6 gpm, and d) 8.3 gpm……………………………46

xi
Figure 3.7: Images of emulsions captured by the inflow microscope at different water
concentrations at 25°C and a flow rate of 3.3 gpm. a), b) and c) represent images of solid
stabilized emulsions at 5, 10, and 20 vol. % water concentration respectively. d), e) and f)
represent images of surfactant stabilized emulsion at 5, 10, and 20 vol. % water
concentration respectively……………...………………………………………………...48
Figure 3.8: Images of solid stabilized emulsions captured by the inflow microscope at
different water concentrations and flow rates at 25°C. In the figure, a), b) and c) represent
images of the emulsion at 5, 10, and 20 vol. % water concentration respectively. i), ii) and
iii) represent images of the emulsion at 3.3 gpm, 6.6 gpm and 8.3 gpm, respectively.......49
Figure 3.9: Images of surfactant stabilized emulsion captured by the inflow microscope at
different water concentrations and flow rates at 25°C. Figures a), b) and c) represent images
of the emulsion at 5, 10, and 20 vol. % water concentration respectively. i), ii) and iii)
represent images of the emulsion at 3.3 gpm, 6.6 gpm and 8.3 gpm respectively……….50
Figure 4.1: Schematic of the temperature controlled stage and the visualization setup used
for experiments………………………………………………………………………… 62
Figure 4:2: Images captured (10x magnification) at various temperatures during hydrate
characterization experiment for 0.1 vol. % surfactant stabilized 10 vol. % water
emulsion………………………………………………………………………...………..64
Figure 4.3: Image J algorithm to determine droplets’ size and distribution for different
emulsion samples……………………………………………………...............................65
Figure 4.4: Dynamic interfacial tension of 50:50 equal volume mixture of cyclopentane
and crystal plus 70T mineral oil –water interface measured using pendant drop
technique……………………………………………………………………………..…..67
Figure 4.5: Images of hydrate crystals (at 10x magnification for 10 vol% and 20x
magnification for 40 vol%) captured in the hydrate formation zone of 0.1 °C for surfactant
stabilized emulsions with water concentrations equal to 10 and 40 vol% (scale bar = 100
µm)………………………………………………………………………….……………69
Figure 4.6: Images of hydrate crystals in surfactant stabilized 40 vol. % water emulsion
captured at 50x magnification………………………...………………………………….70
Figure 4.7: Images of hydrate crystals captured in the hydrate formation zone of 0.1°C
for Aerosil R974 stabilized 10 and 40 vol. % water concentration....…….…………......71
Figure 4.8: Hydrate crystals in Aerosil R974 stabilized 40 vol. % water emulsion………72

xii
Figure 4.9: Comparison of the emulsion droplet size distribution before hydrate formation
and upon hydrate dissociation for 0.1 vol. % Span 80 (surfactant) stabilized 40 vol. %
water-in-oil emulsion…………………………………………………………………….74
Figure 4.10: Comparison of the emulsion droplet size distribution before hydrate
formation and upon hydrate dissociation for 0.1 vol. % Aerosil R974 (solid particle)
stabilized 40 vol. % water emulsion. The distribution was obtained by counting the number
of droplets from the inset. ................................................................................................ .75
Figure 5.1: Schematic of temperature controlled and shear stage optical microscope
equipped with cross polarizing lens………………………………………………….......84
Figure 5.2: Temperature profile used for hydrate formation in waxy oil systems. The figure
illustrates physical changes to the sample captured at different operating conditions…...86
Figure 5.3: Images captured (10x magnification) at various temperatures during hydrate
characterization in waxy oil system containing 1.25 wt.% wax in mineral oil-cyclopentane
mixture. The experiment was conducted at heating and cooling rate of 2 °C/min……….87
Figure 5.4: Wax crystal morphology of 1.25 wt.% wax and 5 wt.% wax in mineral oil
system captured using cross polarized optical microscope at 5 °C at three different cooling
rates i) 0.5 °C/min ii) 1 °C/min iii) 2 °C/min. The scale bar indicates 100 µm…………..92
Figure 5.5: Single water drop hydrate formation in control sample containing pure
cyclopentane. The scale bar represents 100 µm…………………………………………..95
Figure 5.6: Images of control sample containing 25 wt.% mineral oil and 75 wt.%
cyclopentane. The scale bar represents 100 µm………………………………………….97
Figure 5.7: Initial emulsion droplet size, droplet size before and after hydrate formation,
multiple emulsion formation upon hydrate dissociation. The scale bar represents 100
µm………………………………………………………………………………………..98
Figure 5.8: Time required for complete conversion for 1.25 wt.% wax system containing
mineral oil and cyclopentane at 2 °C/min rate. The scale bar represents 100 µm..............99
Figure 5.9: Hydrate formation in 1.25 wt.% wax system at constant heating and cooling
rate of 1 °C/min at different time intervals. The scale bar represents 100 µm…………..101
Figure 5.10: Hydrate formation in 1.25 wt.% wax system at constant heating and cooling
rate of 0.5 °C/min at different time intervals…………………………………………….102
Figure 5.11: Hydrate formation in 5 wt.% wax system at constant heating and cooling rate
of 2 °C/min at different time intervals. The scale bar represents 100 µm…………........103

xiii
Figure 5.12: Hydrate formation in 1.25 wt.% wax system with 0.1 wt.% span 80, 23.65
wt.% mineral oil, and 75 wt.% cyclopentane at 2 °C/min heating and cooling rate…….108
Figure 5.13: Summary of time required for complete conversion of water droplet to
hydrates through visual observation as function of cooling rates and wax concentrations.
The solid data points indicate control samples…………………………………… …...109
Figure 5.14: Three phase system used for describing the driving force required for hydrate
formation at constant temperature (T) and pressure (P) [107]…………………………..111
Figure 5.15: Hydrate formation mechanism in waxy oil systems. Water droplet is
suspended in oil phase containing either 1.25 or 5 wt.% wax in 1:3 ratio of mineral oil and
cyclopentane on weight basis. …………………………………………………………..113
Figure 6.1: Experimental setup of the chiller used for carrying out hydrate formation
experiment in waxy oil systems………………………………………………………...123
Figure 6.2: Visual confirmation of hydrate formation in 40 wt.% water-in-oil emulsion
containing wax and surfactant in the oil phase……………………………………..…...123
Figure 6.3: Evolution of sample from emulsification to hydrate formation, and to hydrate
dissociation……………………………………………………………………………..124
Figure 6.4: Emulsion after hydrate dissociation and microscope image of the sample taken
from the emulsion layer of the sample subjected to hydrate formation. The scale bar
represents 50 µm…………………………………………………………………..……124
Figure 6.5: Transient stability microscope images of the 40 wt.% water-in-oil emulsion
used for hydrate studied in waxy oil systems. A) image of the emulsion sample at 0th hour
(immediately after emulsification) b) image of the sample after 6 hours of emulsification.
The scale bar represents 100 µm………………………………………………………...125
Figure 6.6: Flow loop setup used for emulsion, hydrates, and wax characterization. The
flow loop setup is equipped with inflow microscope, pressure transducer for measuring
properties under flowing conditions………………...……………………………….…127

1
CHAPTER I
INTRODUCTION
1.1. Overview
Emulsions are colloidal dispersions of a liquid in another immiscible liquid stabilized
using a surfactant and/ or solid particles [1]. Emulsions are of great importance due to their
widespread occurrence in industries such as pharmaceutical, cosmetics, food, agricultural, and
energy [2]. In the energy industry, emulsions may be encountered in all stages of production,
transportation, and operation [3]. Along with naturally occurring surfactants, a wide variety of
solid particles such as asphaltenes, waxes, clay, silica, and inorganic particles are also present
in the crude oil [4]. The presence of such stabilizers in the crude oil results in production
problems that are otherwise known as flow assurance issues. Flow assurance (coined by
Petrobras) in the oil and gas industry simply means ensuring successful, continuous,
economical, and environmentally safe transport of fluids from production to point of sale. Flow
assurance problems encountered in the energy industry include formation and deposition of
solids such as wax, asphaltenes, gas hydrates, inorganic solid/ scale deposits, slugging, and
corrosion [2, 5]. In the energy industry, emulsions are difficult to treat due to the presence of
a wide variety of stabilizers, thereby causing production and operational problems such as gas-
liquid separation, high production and treatment costs, productivity loss, and high pressure

2
losses [6]. Depositions of solids result in deferment (economic and production loss), safety,
and environmental concerns [5, 7-9]. This thesis focuses on emulsions, primarily water-in-oil
emulsions with applications pertinent to the energy industry. This thesis provides fundamental
understanding of hydrate formation mechanism in waxy oil systems, concentrated water-in-oil
emulsions, and emulsion characterization of either surfactant or solid particle stabilized
systems. The insight gained from this thesis aids in the development of flow assurance
mitigating strategies in emulsion forming systems. This chapter includes the motivation for the
work presented in this thesis, literature review about emulsions, gas hydrates, and wax, and
outline of this thesis.
1.2. Motivation
Hydrate formation, wax deposition, and other flow assurance issues are common in deep-
water extraction and production, as these systems are predisposed to extreme operating
conditions such as low temperature and high pressures, thereby plugging pipelines. Hence,
addressing these flow assurance issues are critical, as they can occur anywhere and in multiple
locations, and there are associated operating and maintenance costs involved in managing and
mitigating pipeline blockages. Millions of dollars are spent on remediation strategies that
include depressurization, chemical inhibitors/ injection method, mechanical, and thermal
methods. Though extensive research has been conducted on each of these flow assurance
issues independently from both microscopic to macro-scale level, there is very minimal
literature available when two or more of these issues occur simultaneously. Though hydrate
formation in waxy crudes and emulsified systems have occurred in several instances in the
oilfield, there is seldom any modeling or real-time experimental evidence available on
understanding the hydrate formation mechanism in such waxy oil systems or waxy oil

3
emulsions [10-12]. This has provided an impetus to conduct an experimental investigation to
understand hydrate formation mechanism in waxy oil systems. The motivation for this work is
twofold and includes: 1) characterization of emulsions, hydrate formation in concentrated
emulsions using a variety of stabilizing agents 2) hydrate formation mechanism in waxy oil
systems a) without surfactant b) in the presence of a surfactant.
Many researchers have established that solid stabilized/ Pickering emulsion is well
known to form stable oil-water dispersions. Even though a significant amount of research has
been conducted on solid-stabilized emulsions in flowing conditions, their effect on hydrate
agglomeration, plugging, and transportability in the presence of wax crystals is unclear and
requires further investigation. Figure 1.1 represents the water droplet stabilization mechanism
in waxy oil systems, and the interaction of hydrate-forming guest molecules (cyclopentane) on
wax stabilized emulsions.
Figure 1.1: Mechanism depicting wax stabilized water-in-oil emulsion preventing/
minimizing hydrate agglomeration and plugging. A hydrate-wax slurry mixture is formed,
flows through a pipeline and prevents plugging (adapted from Turner11)

4
This thesis provides fundamental understanding of hydrate formation mechanism in waxy
oil systems and thereby, pave a way to developing efficient and reliable techniques to resolve
aforementioned issues on pipeline plugging. This work involved experimental analysis to
investigate the effect of wax on hydrate formation both in the presence and absence of
surfactant.
1.3. Literature Review
1.3.1. Emulsions
An emulsion is a heterogeneous mixture of two immiscible liquids (or phases) where
one of the liquids, called dispersed phase, is present as droplets in another liquid continuous
phase [13]. Emulsions generally consist of polar aqueous and a non-polar phase that are
stabilized using a surface active agent called a surfactant. The phase in which the surfactant
tends to be soluble is usually the continuous phase as governed by Bancroft’s rule [14-18].
Emulsions are classified as oil-in-water (o/w), water-in-oil (w/o), oil-in-water-in-oil (o/w/o),
or water-in-oil-water (w/o/w) types, depending on the continuous phase and surfactant type.
Oil-in-water emulsions are those in which the oil droplets are dispersed in water continuous
phase and contain water-soluble surfactant with typically high hydrophile-lipophile balance
(HLB) of >8 [14-18]. Whereas water-in-oil emulsions are that kind where water droplets are
suspended in oil continuous phase, and the surfactants are oil-soluble with a HLB ratio of <7.
Surfactants consist of a polar head group (hydrophilic) soluble in the aqueous phase, and a
non-polar tail group (lipophilic) soluble in the oil phase. Emulsions are made stable in the
presence of adequate concentrations of surfactant and emulsification/ mixing conditions.
Emulsions are thermodynamically unstable systems due to the high interfacial tension two

5
immiscible phases, and the free energy of the system is not minimized [19, 20]. The role of a
surfactant is to reduce the interfacial tension between the phases, thereby minimizing the free
energy of the system. An emulsion is called stable when there is no change in the emulsion
droplet size over time, which is generally achieved when the surfactant concentration and
emulsification conditions (mixing speed, time) are optimized. The four ways in which an
emulsion becomes unstable are: creaming (or sedimentation), flocculation, coalescence, and
Ostwald ripening [13]. Changes in temperature, pH etc. also result in changes in emulsion
properties. Creaming or sedimentation occurs due to the density difference between the two
phases causing movement of the oil droplets (in o/w emulsions) or water droplets (in w/o
emulsions). Flocculation occurs due to aggregation of emulsion droplets without rupturing the
thin interfacial film, whereas, coalescence results in rupture of the interfacial film. Ostwald
ripening occurs due to diffusion of smaller droplets into larger ones.
Figure 1.2: Illustration of water-in-oil emulsion stabilized using a) surfactant b) solid particles
(Pickering emulsion)
In 1903, Ramsden observed that solid particles were capable of stabilizing emulsions,
but it was Pickering who first established through extensive experimental study that solid
particles function very similar to surfactant molecules in stabilizing oil-water interface [21,

6
22]. Figure 1.2 illustrates oil-water interface of an emulsion stabilized using either surfactant
or solid particles. Pickering observed that solid particles that are wetted more by the oil phase
and have a contact angle > 90°, act as an emulsifying agent for water-in-oil emulsions [23],
whereas particles preferably wetted by the water phase and have a contact angle < 90°,
produced oil-in-water emulsions [22, 23]. Ramsden and Pickering first quantified that
emulsion stabilization by solid particles occurs as a result of strong adsorption at the oil-water
interface [21]. Finkle et al established that the stability of emulsion was due to wetting of the
particles and the type of emulsion formed [24]. Aveyard and Binks observed that the free
energy of adsorption of particles caused emulsion stability [25]. Binks and Lumsdon
demonstrated that inversion of emulsions was quantified by the solid particles wettability and
contact angle [26]. Since the discovery of solid particle’s ability to stabilize emulsions, several
studies have been conducted on emulsion characteristics.
Several researchers identified that solid particles impart mechanical rigidity and
viscosity to the interfacial film if the solid particles form a tightly packed network around the
droplet [25, 27-30]. To this end, Simon et al studied the rheological properties of fumed silica
stabilized emulsions [31]. They studied the rheological properties of o/w and w/o emulsions
stabilized with particles of different polarity. Hydrophilic Aerosil R7200 and hydrophobic
Aerosil R972 were considered as stabilizers for the emulsion systems. Rheological properties
of w/o emulsions stabilized by hydrophobic particles were similar to o/w emulsions stabilized
by hydrophilic particles. They also investigated the rheological properties of o/w emulsion
stabilized by a mixture of particles keeping the total particle concentration constant but varying
the mass ratio between particles. They observed that the viscosity and stability of the emulsion
decreased with increase in the hydrophobic particle concentration.

7
Vignati et al examined the droplet interfacial tension of o/w Pickering emulsion using
micropipette tensiometry [32]. The authors observed that the particle surface adhesion at the
oil-water interface was strong and remained constrained at the droplet interface even upon
dilution. The authors demonstrated that the stabilization mechanism in Pickering emulsion was
due to steric hindrance or surface rheology effects. Fan and Striolo implemented particle
dynamics simulation to study the influence of solid nanoparticles on the oil-water interfacial
tension measurements [33]. The authors suggested that the interfacial tension depends directly
on the particle coverage and the affinity of nanoparticles to the interface. They observed that
increase in the primary particle size significantly increased the nanoparticles desorption
energy, leading to larger surface coverage and interfacial tension reduction.
Sullivan and Kilpatrick, Hannisdal, et al were some of the few researchers who
investigated the effect of silica nanoparticles on model oil emulsion stability with application
to the oil and gas industry [34, 35]. They demonstrated the stabilization mechanism of crude
oil components with either only hydrophobic or hydrophilic silica, and the ease of achieving
catastrophic phase inversion on emulsions stabilized by particles with intermediate wettability.
This thesis focuses on water-in-oil emulsions stabilized using either surfactant (span 80)
or solid particles (such as Aerosil R974, Aerosil R972, Aerosil R816). Different experimental
techniques (inflow microscopy, acoustic spectroscopy, optical microscopy and interfacial
tensiometer) were used for characterizing emulsion droplet size. All the work discussed in this
thesis were conducted using deionized water as the aqueous phase, and either model mineral
oil or decalin as the oil continuous phase.

8
1.3.2. Hydrates
Gas hydrates or clathrates are non-stoichiometric, crystalline like structures formed
from host water molecules and low molecular weight hydrocarbons (also known as guest
molecules) such as methane, ethane, propane, carbon-dioxide, nitrogen etc. [9]. Gas hydrates
are important primarily for two reasons: first, they serve as an energy source, and secondly,
they cause plugging of pipelines. In the energy industry, addressing flow assurance issues due
to hydrates is of primary importance due to deferred production, severe economic losses,
safety, and environmental concerns. On the other hand, however, hydrates are believed to serve
as a potential future energy source, as they can entrap large quantities of natural gas (1 m3 of
hydrate can entrain almost 180 m3 of natural gas at ambient conditions). The thermodynamic
conditions required for hydrate formation are low temperature, high pressure, and the presence
of hydrate-forming gas molecules, free water or brine. Hydrates are classified as either
structure I, II, or H depending on the cage size and fit of the guest molecule into the host
molecule [36]. Structure I hydrates are composed of twelve pentagonal (512) and two hexagonal
(62) cavities occupied by guest molecules (gases) such as methane, ethane, and carbon-dioxide
[36]. Structure II hydrates are the most common type in the oil and gas industry and are
composed of 51264 cavities and occupied by guest molecules such as propane and
iso-butane. Structure H hydrates are composed of high molecular gas compounds and are the
least common type [36]. This thesis focuses on structure II hydrates, with the only exception
being that all the studies would be focused on cyclopentane hydrates which serve the same
function as guest molecules in structure II gas hydrates. For the work discussed in this thesis,
cyclopentane hydrates are used instead of gas hydrates due to pressure limitations in our
laboratory facilities.

9
Since the discovery of hydrates by Hammerschmidt in early 1930’s, plugging due to
hydrates has been a serious challenge to the petroleum industry [9]. Hydrate formation may
occur during transient and abnormal operations such as start-up, restart, shut in, and in places
in the pipeline where there is a change in flow geometry, across valves, risers, and
offshore/subsea systems. In most cases, hydrate management is economically feasible and
favorable when compared to complete avoidance due to excessive capital and operating costs
involved in completely preventing hydrate formation [37]. The four methods used for hydrate
management and removing hydrate blockages include pressure reduction/ depressurization,
mechanical removal, chemical injection, and thermal application [9].
Hydrate dissociation by reducing pressure (depressurization) is the most widely used
technique in regions where the chemical injection is not easily accessible. The mechanical
removal method involves the use of coiled tubing which allows jetting of hot water to
dissociate hydrate plugs. In the chemical injection method, agents such as methanol, glycols,
anti-agglomerants etc. are injected into the pipeline wherever accessible to dissociate the plug.
The two different kinds of chemical injection methods include: use of thermodynamic
inhibitors or kinetic hydrate inhibitors (KHI). Thermodynamic inhibitors work by simply
shifting the phase equilibria/ hydrate equilibrium conditions towards lower temperatures at
fixed pressure. The most common thermodynamic inhibitor is methanol or glycol, but the
drawback to this method is that large quantities of chemicals are required. The other kind of
chemical injection method is called low dosage hydrate inhibitors (LDHI), which works by
limiting hydrate growth rate and delaying hydrate formation but has no effect on hydrate phase
boundaries. There are two different kinds of LDHI’s available: kinetic hydrate inhibitors (KHI)
and anti-agglomerants. KHI’s delay the hydrate nucleation time and growth of hydrates,

10
whereas anti-agglomerants such as certain polymeric surfactants, work as an agent that prevent
agglomeration/ coalescence of hydrate particles, thereby maintaining a hydrate slurry [38-41].
Certain surfactants such as span 80 perform the same function as an anti-agglomerant. Though
chemical injection is one of the most commonly practiced methods in the industry, it is also
mostly avoided due to associated costs involved in the separation of chemicals. The last method
used for hydrate remediation is the thermal method, where the approach is to increase the
temperature of the hydrate plug above the hydrate equilibrium/ dissociation temperature, which
is usually performed by heating bundle or electric heating of pipeline. In the energy industry,
though emulsions are known to produce production problems, recent studies have shown that
stable water-in-oil emulsions promote successful transport of hydrate slurries similar to cold
flow technology. The presence of a wide variety of surfactants and solid particles in the crude
oil increase stability of emulsions and function similar to anti-agglomerants, thereby
minimizing hydrate particle aggregation. Hence, there is an impetus to develop a fundamental
understanding of the hydrate formation mechanism in emulsions in the presence of a wide
variety of stabilizing agents. This thesis primarily focuses on the hydrate formation mechanism
in the presence of solid particles such as wax, and the characterization of such emulsions.
In this thesis, hydrate formation studies are conducted using cyclopentane in the oil
continuous phase. Structure II hydrates commonly found in the oilfield are produced at high
pressures. Reproducing such conditions in a laboratory scale setup are challenging due to
pressure limitations and safety concerns. So, an alternative compound known as cyclopentane
is used for hydrate formation. Cyclopentane and tetrahydrofuran (THF) are used as alternatives
to conduct laboratory-scale hydrate studies [40, 42-47]. Both cyclopentane and THF are known
to form structure II hydrates at atmospheric conditions. However, the literature shows that

11
cyclopentane is preferred as a hydrate-forming guest molecule over THF, as the latter is
miscible in water and also possesses mass transfer limitations between the guest molecule-
water that is critical in gas hydrate forming systems [38, 48-50]. Hence, all the work presented
in this thesis uses cyclopentane as an atmospheric model for gas hydrates in emulsions.
1.3.3.Wax
Waxes (particularly petroleum wax) are long chain, high molecular weight, saturated
hydrocarbons with carbon compounds from C18 to C75 and melting points ranging from 35-70
°C [51]. Wax present in crude oil consists of paraffin hydrocarbons (C18-C36) and naphthenic
hydrocarbons (C30-C60). Petroleum wax consists of a mixture of light paraffinic, intermediate,
and naphthenic hydrocarbons along with heavy organic compounds. Cloud point, also known
as wax appearance temperature (WAT), is the temperature at which the first wax crystal begins
to form [52]. At temperatures below WAT, wax crystals begin to precipitate and aggregate to
form a network of crystals. The two main critical challenges that occur due to wax are gel
formation and wax deposition [53]. Gel formation occurs typically at static conditions and
when the system temperature falls below WAT, thereby resulting in the formation of an
intermolecular network of wax particles. Wax deposition occurs when the oil temperature falls
below the WAT, and a negative thermal gradient between bulk oil and pipe surface exists.
Measuring WAT is one of the most critical parameters that helps establish a guideline
on the temperature ranges to operate in such a manner as to avoid deposition problems. WAT
is otherwise known as the highest temperature in which wax crystals are detected in the solid
state. WAT is a function of the oil composition, cooling rate, thermal history, pressure, and
fluid properties. Some of the most commonly used methods/ techniques for WAT measurement

12
include viscometry/ rheology, differential scanning calorimetry (DSC), Fourier transform
infrared spectroscopy (FTIR), filter plugging, cold finger, cross-polarized microscopy (CPM),
and ASTM visual techniques.
Viscometry techniques utilize the rheological behavior of the oil as a function
temperature and shear rate. If the sample exhibits Newtonian behavior and is a function of
temperature alone, then it is above WAT. Whereas, below WAT, the rheological properties
become dependent on the shear rate. WAT is determined as the point at which there is a sudden
change in the viscosity-temperature relationship.
DSC is one of the most widely used techniques for WAT measurement, which utilizes
the heat of dissociation for detecting WAT. FTIR technique involves the use of infrared
wavelengths to measure the increase in energy scattering during wax crystallization. CPM
technique is a visual method for detecting wax crystals. This is one of the most widely used
techniques for WAT measurement where an optical microscope with temperature controlled
stage and an analyzer-polarizer are used, and WAT is measured as a function of cooling rate.
Cold finger technique operates by generating a localized cold surface and is used to measure
the quantity of kinetics of wax deposition. Except for cold finger, all the other techniques
discussed above are used for WAT measurement, whereas, cold finger measures wax
deposition [54]. In this thesis, CPM was used for WAT measurement. All the experimental
work using waxy oil continuous phase discussed in chapter 5 was carried out using CPM.
Wax deposition is a critical flow assurance issue that can occur at any stage during
crude oil extraction, production, transportation, storage, and processing. As exploration and
production move into deep-water and offshore drilling, wax deposition problems have been

13
increasing steadily, as these conditions are subject to low temperatures. Hence, it is essential
to have prior knowledge of WAT deposition rate before approaching techniques for complete
avoidance. The three remediation methods for addressing flow assurance issues due to wax
are: mechanical, thermal, and chemical methods [4, 55].
The mechanical methods involve the use of pigs, plunger lifts, and scrappers to remove
wax deposited on pipe surfaces and prevent wax particles from agglomerating and causing
gelling of the crude oil. The thermal methods include the use of electric heating of pipelines,
circulation of hot water or steam etc. This technique facilitates wax removal by maintaining
the fluid temperature above the wax melting point. The chemical method aids in the use of
chemicals known as wax inhibitors that modify the pipe wall surface and wax crystal
properties. Wax inhibitors are classified into three categories: pour point depressants/ wax
crystal modifiers, detergents, and dispersants. Pour point depressants are chemicals that build
into wax crystals and modify the surface properties and agglomeration tendency of wax
crystals, thereby lowering the pour point.
In the present work, cyclopentane hydrate formation in waxy oil systems with and
without surfactant are studied using model oils. This thesis provides fundamental
understanding of the effect of wax, wax concentration, the effect of surfactant, and cooling
rates on cyclopentane hydrate formation. For this work, CPM technique is used for hydrate
and wax crystal characterization. This thesis provides an insight into emulsion properties upon
hydrate dissociation in the presence of surfactant and wax.

14
1.4. Safety
This thesis involved working with model oils such as crystal plus mineral oil, light
mineral oil, solvents such as cyclopentane, decalin, surfactants, and solid particles. All the
chemicals were stored in a flammable cabinet. Personal protective equipment, safe laboratory
practices, and standard operating procedures were followed for all the work presented in this
thesis. All the samples were properly labeled, stored in a fume hood when not in use, and
properly disposed off according to EHS chemical disposal rules and regulations.
1.5. Thesis Outline
This thesis is arranged in 5 chapters followed by supplementary information and
references. Chapter 2 describes transient emulsion properties of surfactant and solid stabilized
water-in-oil emulsions. The objective of this work was to elucidate the use of acoustic
spectroscopy for characterizing emulsion stabilization/ destabilization mechanism in these
emulsions. Acoustic spectroscopy measurements were carried out on these emulsions to
determine the initial droplet size distributions and their evolution over a period of one week.
A transient stability test was conducted to compare the behavior of surfactant and solid
particles at the oil-water interface. Experimental results indicated that a destabilization
mechanism, such as coalescence, can be characterized using acoustic spectroscopy.
Characteristics prevalent in the coalescing system, such as broad droplet size distribution and
polydispersity, were captured by acoustic spectroscopy in terms of change in the raw
experimental attenuation.
Chapter 3 describes the characterization of concentrated water-in-oil emulsions under
flowing conditions. In this work, an experimental flow loop setup equipped with an inflow

15
microscope was utilized to quantify emulsion drop size distributions as a function of water
concentration, flow rate, temperature, and stabilizing agent type. This work showed that the
drop size distribution was a function of temperature, water concentration, and flow rate for
surfactant stabilized emulsions. The solid-stabilized emulsions indicated that only water
concentration had an overall impact on the drop size distributions. Water concentration, flow
rate, and temperature have a significant impact on the emulsion droplet size in surfactant
stabilized systems.
Chapter 4 illustrates the effect of hydrate formation on emulsion droplet size captured
using optical microscopy. For this work, cyclopentane hydrate forming emulsions were
prepared using a surfactant (span 80), solid particles (Aerosil R974, Aerosil R816) and at two
different water concentrations of 10 and 40 vol.%. In-situ hydrate formation was observed in
concentrated emulsions without dilution. Hydrate formation and ice melting were observed to
occur simultaneously. Multiple emulsions formed, and eventually, a change in the emulsion
droplet size was observed upon hydrate dissociation.
Chapter 5 outlines single water drop hydrate formation mechanism in waxy oil systems
with and without the presence of a surfactant. For this work, an Olympus BX53 temperature
controlled and shear stage optical microscope was used for investigating hydrate formation as
a function of wax concentration, heating/ cooling rates, and with and without the presence of
surfactant (span80). In the absence of surfactant in the waxy oil continuous phase, the time
required for visual observation of hydrate formation throughout the entire water droplet was
observed to be higher at slower heating/cooling rates, and lower at faster rates irrespective of
the wax concentration. However, such observations were not seen in waxy oil systems
containing a fixed quantity of surfactant. Hydrate formation throughout the entire water droplet

16
surface area occurred in less than 20 minutes irrespective of the heating/cooling rates and wax
concentration. Such observations were not seen in waxy oil systems without surfactant.
Finally, chapter 6 discusses the preliminary experimental results on hydrate forming
emulsions containing wax and surfactant as stabilizing agents. This chapter also discusses the
significant modifications made to the flow loop setup described in chapter 3. The modifications
made to the flow loop design enables characterizing the pressure drop across the various
sections in the flow loop along with visual characterization of emulsions, hydrates, and wax.
This chapter enlists significant contributions made in this and for future work.

17
CHAPTER II
TRANSIENT STABILITY OF SURFACTANT AND SOLID STABILIZED
WATER-IN-OIL EMULSIONS
2.1. Introduction
An emulsion is called stable if there is no phase separation against any
destabilization phenomenon, such as coagulation and coalescence, phase inversion,
creaming, sedimentation and Ostwald ripening, and if the emulsification process is possible
[56]. Emulsifiers are additives that stabilize the oil-water interface. Surfactants are the
usual choice for this purpose and have been available in the market as an emulsifier for
both water-in-oil and oil-in-water emulsions. Surfactants are either ionic, non-ionic or
zwitterionic in nature. Surfactants reduce interfacial tension, thereby promoting the
creation of water-oil interface, and subsequently stabilizing the interface to resist
coalescence [22, 57].
Emulsions stabilized using finely divided particles/ nanoparticles are called solid-
stabilized emulsions (also known as Pickering emulsions) [22, 57]. Solid stabilized
emulsions have gained importance in the last two decades due to their applicability in many
industries (such as food, agriculture, pharmaceutical), their enhanced emulsion stability,
and their ability to produce droplets ranging from a few microns to several millimeters

18
(Levine, Bowen et al. 1989). Pickering identified that solid particles had the ability to
produce stable emulsions, and therefore, these are called Pickering emulsions [22, 57].
Solid particles function in a manner similar to surfactants. However, the preferential
wetting of solid particles plays a major role in determining whether oil-in-water or water-
in-oil emulsions are formed [23]. Solid particles such as pre-treated silica (available in the
market as Aerosil) have been widely used in the pharmaceutical and cosmetic industries as
a stabilizer, and also in the oil and gas industry for producing stable and large droplet
emulsions [58]. Solid particles such as hydrophobic silica are known to be preferentially
wetted by the oil phase, and lead to the formation of water-in-oil emulsions; whereas,
hydrophilic silica particles, which are preferentially wetted by the water phase, produce
stable oil-in-water emulsions [24, 57, 59].
Solid stabilized emulsions can be more stable, depending on surface coverage, as
compared to surfactant stabilized emulsions, due to the strong adhesion of solid particles
to the oil-water interface. The contact angle, coalescence kinetics, and particle interaction
energy contribute to the stability of the emulsions [59]. Stable emulsions are prepared
when the particles are neither too hydrophilic nor hydrophobic and if there is complete
surface coverage. Particles that form contact angle, θ >90° form a water-in-oil emulsion,
whereas, θ < 90° leads to an oil-in-water emulsion [23, 24, 59]. The particle shape, size,
and concentration greatly affect the emulsion stability and droplet size [60].
Acoustic and electroacoustic spectroscopy are some of the most reliable techniques
for characterizing concentrated dispersions and emulsions in-situ [61]. These ultrasound
based methods were chosen over other traditional particle sizing techniques, such as
dynamic light scattering, electron microscopy, etc., due to their ability to characterize

19
polydisperse and concentrated systems without dilution [61, 62]. For this study, we used
an Acoustic/Electroacoustic spectrometer DT 1202 (produced by Dispersion Technology
Inc.) for characterizing droplet size distribution of both surfactant and solid-stabilized
emulsions [61, 62].
The motivation behind this work was to demonstrate how acoustic spectroscopy
can be utilized to capture emulsion stabilization/ destabilization phenomena in surfactant
and solid-stabilized emulsions and characterize their transient stability over a period of
time. For the purpose of this work, emulsions that exhibit two different kinds of
stabilization/ destabilization mechanisms were studied using acoustic spectroscopy: one
that undergoes coalescence, and a second that exhibits high stability. A surfactant-
stabilized emulsion was used for investigating the transient behavior of a highly stable
emulsion since it is well known to produce stable and non-coalescing droplets when formed
above the critical micelle concentration. Since coalescence in surfactant stabilized systems
is well studied and understood, a solid stabilized emulsion was chosen for studying acoustic
interrogation of a coalescing system. Another important goal of this work was to
investigate how acoustic spectroscopy captures characteristics prevalent in coalescing
droplets, such as polydispersity and broad drop size distribution. For the purpose of this
study, both coalescing and highly stable emulsions were prepared using similar mixing
conditions and composition.
In this chapter, the droplet size distribution of water-in-oil emulsions stabilized
using hydrophobic fumed silica (Aerosil R972) and a non-ionic surfactant, sorbitan
monooleate (span 80) was studied at different time intervals after emulsification. Bottle

20
test and optical microscopy measurements were also carried out to validate the results
obtained from acoustic spectroscopy.
2.2. Material and Methods
2.2.1. Emulsion Preparation
The water-in-oil emulsions prepared for this study contained decalin with a density
of 0.786 g/cm3, and ultra-pure, deionized water with a resistivity of 18.2 MΩcm. Two
different stabilizers used for this study were sorbitan monooleate (span 80) and
hydrophobic fumed silica (Aerosil R972). Decalin was supplied by BDH chemicals.
For a surfactant-stabilized emulsion, span 80, C24H44O6 (molecular weight = 428.6
g/mol), supplied by Sigma Aldrich, with a density of 0.99 g/cm3 was used as an emulsifier.
The critical micelle concentration of span 80 in solvents such as decalin (dielectric constant
= 2.2) was identified as 1.5-2 wt.%[63]. Hence, the oil phase was composed of 2 wt.% of
span 80. Span 80 is used in industries as a surface-active emulsifier. Span 80 is a non-ionic
lipophilic emulsifier with a hydrophile-lipophile balance ratio (HLB) of 4.3. The low HLB
ratio of Span 80 is well known to produce w/o emulsion.
For Pickering emulsions, hydrophobic fumed silica (Aerosil R972) manufactured
by Evonik Industries (Rheinfelden, Germany), with a tamped density of 1.06 g/cm3 was
used as the stabilizing agent. Aerosil R972 is manufactured by flame pyrolysis of silica at
1000 °C and surface treated with dichlorodimethyl silane to impart hydrophobic
functionality. The primary particle size of Aerosil R972 is 16 nm, and the material typically
exists as a sintered aggregate with size varying in the size range 100-300 nm. To keep the

21
emulsifier concentration constant for both kinds of emulsions, 2 wt.% aerosil R972 was
dispersed in the oil phase.
Both types of emulsions were prepared using an Ultraturrax T25 homogenizer with
a maximum operating power of 25,000 rpm. The oil phase of the emulsions was prepared
by mixing 81.98 vol.% of Decalin with 2.12 vol.% of the stabilizer using a spatula and
homogenizing at 8000 rpm for 1 min to completely homogenize the oil phase. Then, 15.9
vol.% of water was slowly added to the oil phase and the emulsion was mixed using the
homogenizer at 8000 rpm for 10 minutes.
2.2.2 Acoustic Spectroscopy
For this work, an acoustic/electroacoustic spectrometer DT-1202 (manufactured by
Dispersion Technology, Inc.) was used for characterizing both kinds of emulsions. A
detailed description of this device is available in the literature [64] (Figure 2.1). The
spectrometer is used for measuring drop size distribution, zeta potential, and conductivity
simultaneously. The acoustic technique utilizes acoustic sound waves for measuring
particle and drop size distributions. The electroacoustic technique utilizes both electric and
acoustic signals for measuring the surface charge and zeta potential.

22
Figure 2.1: Representative image of DT 1202 acoustic and electroacoustic spectrometer.
For this work, this instrument was used for measuring the emulsion droplet size, colloidal
vibration current (CVI), and aqueous/ non-aqueous conductivity
Acoustic particle sizing is regulated by two International Standards: ISO 20998
Parts 1 and 2 [61, 62, 64]. The two essential features of the acoustic particle sizing
technique that make it absolute and keep it from requiring calibration are pulse technique
and variable gap method. The acoustic spectrometer works on the principle of generating
pulses at 18 different frequencies within the range from 1 to 100 MHz, and 21 gaps between
transmitter and receiver from 0.3 mm to 20 mm. A piezoelectric transducer (transmitter)
converts these signals to ultrasound pulses of the same frequency. These ultrasound pulses
propagate through a liquid sample, interact with the liquid and particles, and consequently
attenuate. A second transducer (receiver) converts the received sound pulse into electric
signals. The difference in the initial and final electric pulses serves as a measurement of

23
energy loss within the sample and is measured as attenuation. This energy loss is measured
at variable gaps and frequencies between the transmitter and receiver. The variable gap
method is coupled with the Beer-Lambert law for calculating attenuation coefficient, α,
and per unit length (dB/cm/MHz) [65]. Like density, viscosity, and sound speed, acoustic
attenuation is an intrinsic property, and unique to each system. The acoustic spectrometer
measures the raw experimental attenuation, which is then fitted into theoretical models to
predict the drop size distribution. The theoretical model used to predict the drop size
distribution is a function of the experimental attenuation and intrinsic properties of the
phases of the system. The software searches for the drop size distribution that provides the
best fit to the experimental attenuation spectra and predicts the mean droplet size and
distribution.
2.2.3 Optical Microscopy
For this work, a visualization technique was employed to quantify droplet size
distributions and transient emulsion behavior through the use of an Olympus BX53
polarized optical microscope with shear cell and temperature control (-50°C to 450°C)
stage. The specifications of the microscope are discussed in detail in Chapters 3, 4, and 5.
2.2.4 Experimental Procedure
An emulsion sample of 180 g was prepared as described in the emulsion preparation
method. Immediately after emulsification, the sample chamber of DT 1202 was filled with
the emulsion, and the particle size, colloidal vibration current, and conductivity were
measured and reported as “0th hour”. Transient emulsion stability and evolution of droplet
size was studied at different time intervals. Measurements were reported as “48th hour” and
“after 1 week” of emulsification. During the entire process, the emulsion samples were
24
constantly stirred on a Thermo Scientific Inc. (Ashville) magnetic stir plate with a 25.4 mm
long stir bar at 800 rpm. The DT 1202 spectrometer was set up with a peristaltic pump
operating at half of the full speed range to ensure that there was no phase separation within
the sample chamber.
Bottle test experiments were conducted to study the emulsion behavior and any de-
emulsification phenomena that might occur in these emulsions at different time intervals.
Bottle tests simply consisted of placing a known amount of sample into a bottle and
subsequently observing the behavior of the sample as a function of time. Optical
microscopy was also employed to measure drop size distributions.
2.3.Results and Discussion
2.3.1 Emulsion stability using bottle tests
The stability of emulsions against coalescence and phase separation was monitored
and assessed using conventional bottle test methods. Sedimentation of the emulsion and
separation of the oil phase was observed in both surfactant and solid particle stabilized
emulsions (Figure 2.2). However, separation of the oil phase in the solid-stabilized
emulsions was predominant at all-time intervals when compared to surfactant stabilized
emulsions. As seen in Figure 2.2, though sedimentation in surfactant-stabilized emulsion
is present, the cloudiness seen in the supernatant likely indicates a large amount of stable,
small droplets being kept in suspension by Brownian motion. Rapid separation of the oil
phase and sedimentation of droplets seen in solid-stabilized emulsions indicate two likely
possibilities: a) the droplets are coalescing due to insufficient surface coverage, or b)
droplets are experiencing sedimentation due to a density difference, with or without any

25
change in droplet size. No aqueous phase separation was noticed in either type of emulsion
even after 1 week of emulsification.
The evolution of both emulsions over time was followed simultaneously using
optical microscopy and acoustic spectroscopy for up to 1 week after emulsification. The
results obtained from these techniques are discussed in the following sections.
Figure 2.2: Bottle test experiment showing the stability, phase separation and
sedimentation of water droplets in surfactant stabilized water-in-oil and solid particle
stabilized water-in-oil emulsion at different time intervals of sample preparation: a) 0th
hour, b) after 48 hours of emulsion preparation, c) after 1 week of emulsion preparation.
The sample was not stirred throughout this experiment.

26
2.3.2 Emulsion characterization: optical microscopy and acoustic/electroacoustic
spectroscopy
Figure 2.3: Optical microscopy images (20X magnification) of span 80 stabilized water-
in-decalin emulsion taken at different time intervals after emulsification a) 0th hour b) 48th
hour c) after 1 week.
Figure 2.4: Optical microscopy images (20X magnification) of fumed silica stabilized
water-in-decalin emulsion taken at different time intervals after emulsification a) 0th hour
b) 48th hour c) after 1 week.
Optical microscopy experiments were conducted on the emulsion samples at time
intervals at which bottle test experiments were carried out. Images shown in Figure 2.3 a)
indicate that the droplet size distribution centered around 2 µm for the span80 stabilized
emulsion at the 0th hour measurement. Whereas in the solid stabilized emulsions, the

27
distribution shifted towards larger droplet size with a mean size around 8 µm (Figure 2.4
a). The solid stabilized emulsion also reveals polydisperse character with droplets in the
size range of 2- 20 µm. Images shown in Figure 2.3 indicate that for span80 stabilized
emulsions, the morphology of the droplets displays very little change with time. There was
only a slight shift in the mean droplet size from 1.5 to 3 µm after 1 week of emulsification.
Drelich et al., observed similar behavior in water-in-paraffin oil emulsion stabilized using
span80 [66]. The authors observed that up to 7 days after emulsification, there was only a
slight shift in the droplet size distribution from 1.5-3 µm [66].
Images in Figure 2.4 indicate the evolution of droplets over time with the
distribution shifting towards larger droplet size. Figure 2.4 also reveals that a large number
of small droplets coalesce to form bigger droplets, thus resulting in polydisperse behavior.
Figure 2.5: Attenuation spectra of a) span 80 stabilized emulsion b) fumed silica stabilized
emulsion at various time intervals using the acoustic spectrometer. Arrows show the trend
in the attenuation spectra immediately and after 1 week of emulsion preparation at low and
high frequency.

28
Figure 2.6: Experimental and theoretical attenuation spectra of water-in-oil emulsion
measured immediately after sample preparation (0th hour attenuation) a) Attenuation
spectra of span80 stabilized emulsion assuming thermal loss mechanism b) Attenuation
spectra of fumed silica stabilized emulsion assuming scattering loss mechanism due to the
presence of large droplets
Figure 2.5 and Figure 2.6 a) and b) show the attenuation spectra of span80 and
fumed silica stabilized emulsion (solid stabilized emulsion) respectively at three different
time intervals (0th hour, after 48 hours and after 1 week of emulsification). Figure 2.5 and
Figure 2.6 a) and b) show the evolution of attenuation spectra over time at the entire
frequency range (1-100 MHz). Figure 2.5 indicates that for span80 stabilized emulsions,
the low-frequency attenuation begins to decay with time. Whereas, this trend was not
observed for solid-stabilized emulsions Figure 2.6 b). The high-frequency attenuation (>10
MHz) was observed to increase for both kinds of emulsions with time. Dukhin and Goetz
also observed a similar trend in the evolution of attenuation spectra for span80 stabilized
emulsions [67]. The authors observed that for span80 stabilized water-in-kerosene oil

29
emulsion, the attenuation at lower frequency decays with time, whereas, at higher
frequencies, it increases over time [67]. The measured raw attenuation is a combination of
intrinsic, thermal, and scattering loss mechanisms. For this work, the intrinsic loss is the
attenuation caused by the continuous oil phase (decalin). As seen in Figure 2.5 a), for the
surfactant-stabilized emulsion, the thermal loss mechanism contributes to the overall
attenuation. Whereas, for the solid stabilized emulsion, the scattering loss mechanism
dominates the attenuation spectra over the entire frequency bandwidth with a decay in the
attenuation due to a thermal loss at higher frequencies (Figure 2.6 b)). High-frequency
attenuation is caused by scattering loss which is sensitive to large droplet size [64]. For
the two emulsion systems studied in this paper, the search routine in the DT-1202 software
was modified to take into account only the thermal loss mechanism for surfactant stabilized
emulsions and scattering loss for solid-stabilized emulsions. It was seen that the theoretical
attenuation fits the experimental data with a fitting error of < 15% for both kinds of
emulsions at all the measured time intervals. Thermal loss mechanism is sensitive at lower
frequencies up to 10 MHz and small droplet sizes [64, 67]. Whereas, scattering loss
mechanism is sensitive to higher frequencies and large droplet sizes [64, 67]. The evolution
of attenuation directly indicates variation in the droplet size distribution. An increase in
both the low and high-frequency attenuation as seen in Figure 2.6 b) indirectly indicates
changes in the physical and morphological properties of the system such as droplet
coalescence, polydispersity, and broad droplet size distributions.

30
Figure 2.7: Drop size distributions of a) span80 stabilized emulsion b) fumed silica
stabilized emulsion at various time intervals using acoustic spectrometer
Table 2.1: Average water droplet size in span80 and fumed silica stabilized emulsion
measured at different time intervals after emulsion preparation using acoustic spectrometer
Sample
Time after emulsion
preparation
Mean (µm)
Surfactant-stabilized emulsion
0th hour 2.0±0.32
48th hour 3.4±0.47
After 1 week 3.1±0.40
Solid particle stabilized emulsion
0th hour 6.4±0.18
48th hour 23.9±0.60
After 1 week 40.0±0.45
The acoustic spectrometer predicts the droplet size distribution based on raw
attenuation loss mechanism. Droplet size distribution shown in Figure 2.7 a) and b) are a
lognormal distribution that is generated as a result of the automatic calculation performed

31
by the DT 1202 software [64]. Figure 2.7 a) and Table 2.1 indicate that for the surfactant-
stabilized emulsion, no further increase in the mean droplet size is seen after 1 week of
emulsification and ceases after reaching 3 µm. This could be attributed to the fact that there
is leveling of attenuation at both low and high frequencies, as seen in Figure 2.5 a). This
behavior indicates that the emulsion is stable against de-stabilization mechanisms such as
coalescence. Table 2.1and Figure 2.7 b) indicates that droplet size evolves with time and
leads to broad and polydisperse droplet size distributions for solid-stabilized emulsions.
Figure 2.7 b) shows that with time, attenuation at both the low and high-frequency regions
increases, thereby indicating the generation of small and large micron-sized, polydisperse
droplets. This directly indicates that the Pickering emulsion is not stable against
coalescence. Bottle test results shown in Figure 2.2 also support this observation. Images
shown in Figure 2.4 illustrate that for solid-stabilized emulsions over time, a large number
of small droplets coalesce to form bigger droplets. This behavior results in a shift in the
distribution towards larger droplets.
Though solid particles are well known to produce stable emulsions, a lack of
particles at the interface can also result in poor emulsion stability [27, 60]. Emulsions are
stable against coalescence when the droplets are completely covered by a monolayer of
solid particles [27, 68]. Several studies have shown that emulsion stability increases with
increase in the concentration of particles [27, 69],[70],[71]. It has been previously found
that as particle concentration increases, the average drop size of solid-stabilized emulsions
decreases as more solid particles are available to stabilize small droplets [60, 72].
Depending on the amount of particles available and adsorbed on the droplet interface, the
droplets that have insufficient surface coverage will continue to coalesce [60, 71, 73]. This

32
results in a decrease in the total surface area until there is a sufficient amount of solid
surfactant available to stabilize the droplets against coalescence [27, 69].
Binks and others have observed that solid particles adsorb at the droplet interface
forming a hexagonal closed packed monolayer of particles [28, 68, 70, 71]. The amount of
solid particles required to completely cover the droplets versus the amount of solid particles
available would indicate whether the emulsion would be stable against coalescence [69].
Several studies have been conducted to understand the effect of particle concentration on
emulsion stability [27, 60, 69, 74]. It has been observed that the emulsion droplet size and
ratio of the amount of particles available to that required for complete coverage is a
function of particle concentration [28, 69, 74, 75]. Studies have also shown that excess
particles result in smaller droplet size emulsions and remain suspended in the continuous
phase, causing an increase in the viscosity and producing emulsions stable against
coalescence by forming a network of particles entrapping the water droplets [60, 69].
By knowing the oil concentration, droplet diameter, and interfacial area per unit
mass of silica particles, we can predict the amount of silica needed to achieve monolayer
coverage by hexagonal close packing [28, 69, 74, 75]. For this work, the interfacial area
per unit mass of silica particles was calculated using the relationship predicted by Wiley
and Aridity et al. [70, 71]. For the purpose of this work, we calculated that the amount of
silica needed to achieve dense monolayer coverage was 4.08g. The amount of silica
available (the mass of silica particles in the emulsion was 2 g) was found to be less than
the amount required to achieve monolayer coverage (4.08 g). This suggests that the droplets
initially formed had incomplete surface coverage and showed the tendency of the droplets
to coalesce. The results shown in Table 2.2 and Figure 2.7 b) agree with this findings.

33
Table 2.2: Colloidal vibration current (CVI) and conductivity of decalin, decalin with
span80, decalin and fumed silica, span80 and fumed silica stabilized emulsion measured at
various time intervals using acoustic spectrometer
Sample CVI Conductivity (S/m)
Decalin 30456 4.70E-12
Decalin+ 2wt% Span80 30970 5.50E-08
Decalin+ 2wt% Fumed Silica 30878 4.00E-12
Span80 stabilized emulsion
0th hour 19234 4.49E-08
48th hour 4858 5.25E-08
After 1 week 3970 3.70E-08
Solid stabilize emulsion
0th hour 7021 3.00E-12
48th hour 5966 1.10E-11
After 1 week 2193 8.90E-11
For non-aqueous systems, electroacoustic/ zeta potential measurement involves a
two-step process: 1. measurement of the background continuous phase colloidal
vibrational signal (CVI) and 2. measurement of CVI signal of the emulsion [64]. As seen
in Table 2.2 the presence of a stabilizing agent had no significant impact on the
continuous phase “decalin” CVI. The CVI of the emulsion was calculated by subtracting
the CVI contributed from the continuous oil phase “decalin”. It was observed that the
addition of dispersed phase to the continuous oil phase resulted in a decrease in the
decalin CVI (Table 2.2). CVI for both types of emulsions was observed to decrease with
evolution in time.

34
Table 2.2 illustrates that immediately after emulsification, the CVI of surfactant
and solid-stabilized emulsions decreased by 37% and 77%, respectively. This indicates that
solid particles dramatically decrease the CVI magnitude of the emulsion. It was observed
that for surfactant-stabilized emulsion, within 48 hours of emulsification, there was a 75%
decrease in the emulsion CVI. For solid-stabilized emulsions, the CVI gradually decreases
with time.
CVI signal is a magnitude of the zeta potential and is used for calculating the
surface charge of water droplets [64]. CVI is an intrinsic property of the sample and is a
function of the fluid properties, droplet size, and dielectric constant of the liquid phase [64].
The magnitude of CVI has no direct correlation to emulsion stability but corresponds to
the magnitude of zeta potential and changes in emulsion behavior and morphology [64].
CVI indicates the dynamic mobility of the droplets and is found to be proportional to the
surface charge and droplet diameter [64]. The CVI values of solid-stabilized emulsions
were found to be lower than surfactant stabilized emulsions at all-time intervals except
after 48 hours of emulsification. The decrease in the magnitude of CVI indicates changes
in the sample properties and emulsion behavior.
A correlation between decay in surface charge and conductivity increase was
established by Dukhin [67]. During coalescence, the droplets release ions into the
continuous phase thereby decreasing their surface charge and increasing conductivity
[67]. As seen in Table 2.2, the addition of a stabilizer to the continuous oil phase resulted
in an increase in the conductivity. The conductivity of the initial emulsion (both span80
and fumed silica stabilized emulsion) was greater than the continuous phase as a result of
adsorption of the stabilizing agent to the oil-water interface. As described by Dukhin,

35
increases in the conductivity of an emulsion with time indicate changes in the chemistry
of the system, such as coalescence [67].
A sharp increase in the conductivity was seen in solid stabilized emulsion (Table
2.2). The conductivity of the emulsion increases during droplet coalescence .Coalescence
causes the release of counter-ions from water droplets to the continuous phase and in turn
results in an increase in the conductivity [67]. As seen in Figure 2.4 and Figure 2.7 b), the
solid stabilized emulsion undergoes coalescence and a shift in the distribution towards
larger droplet sizes. This causes an increase in the conductivity of the emulsion with time.
2.4 Conclusions and Future Work
In this chapter, the drop size distribution, surface properties, and transient stability of
water-in-oil emulsion stabilized using a non-ionic surfactant (Span80) and hydrophobic
fumed silica was measured using acoustic spectroscopy. Differences in terms of the
evolution of drop size distribution and weakening of the surface charge of droplets were
observed. Increases in the attenuation at low and high frequencies for solid-stabilized
emulsions illustrate that droplet coalescence occurred, thereby leading to polydisperse
morphologies and large droplet size emulsions. Optical microscopy results validate the
droplet size distribution results obtained by acoustic spectroscopy. The acoustic
spectroscopy technique can be used to characterize the transient behavior of emulsions, as
it captures both morphological and physical changes in the emulsions through raw
attenuation, surface charge, and conductivity measurements. Changes in the experimental
attenuation and the colloidal vibration current can be used to illustrate changes in the
physical properties of the emulsions.

36
Further experiments and evaluation of the droplet size distribution and transient
stability for mixed surfactant and solid-stabilized emulsions as a function of water
concentration and emulsifier concentration would provide more insight into emulsion
stabilization mechanism and interfacial properties. To better understand the emulsion
stabilization and destabilization mechanisms, further work will be performed on specific
interfacial and rheological interactions between surfactant molecules and solid particles.

37
CHAPTER III
CONCENTRATED EMULSION CHARACTERIZATION IN FLOWING
CONDITIONS
3.1. Introduction
Characterizing concentrated dispersions is of importance, as the formation and
stabilization mechanisms of crude oil emulsions are challenging and require continuous
development. Several studies have demonstrated that fundamental understanding of
emulsion stability is imperative to predict strategies to address flow assurance related
issues and the associated economic costs [10, 11, 76]. Hence, characterizing concentrated
systems stabilized using both surfactants as well as solid particles is imperative to predict
the dynamic behavior of such complex emulsions under flowing conditions.
The objective of this chapter was to evaluate the effect of flow rate, water fraction,
and temperature on the emulsion morphology and stability of both surfactant and solid
particle stabilized emulsions. For this work, an experimental flow loop setup equipped
with an inflow microscope was utilized to quantify the behavior of concentrated emulsions
in flowing conditions.

38
3.2. Materials and Methods
3.2.1. Experimental Setup
An experimental flow loop setup equipped with an inflow microscope (Canty Inc.)
was used for characterizing emulsion droplet size and distribution, the morphology of the
droplets, and behavior of solid particles at the interface. The 8 ft X 8 ft flow loop consists
of jacketed 1” stainless steel tubing with fluid circulated using a 5 hp progressive cavity
pump. The flow loop can achieve temperatures in the range -30 C to 125 C and pressures
up to 150 psig. The experimental setup is outlined in Figure 3.1.
Figure 3.1: Schematic of experimental flow loop setup to characterize concentrated
emulsions in flowing conditions.

39
3.2.2. Materials and Experimental Procedure
To confirm the performance of the inflow microscope, the particle size distribution
of glass beads was measured in the flow loop. For this work, glass beads were purchased
from Polysciences Inc. with a vendor specified mean size in the range of 30-50 µm. A
deionized (DI) water suspension containing 0.5 wt. % glass beads were prepared by
dispersing the particles directly in the reservoir (shown in Figure 3.1). The glass beads
suspension was circulated at 3.3 gpm using a progressive cavity pump. The flow loop was
operated at room temperature during the entire experiment. Real-time images and videos
of the glass beads suspension obtained from the inflow microscope were utilized for
measuring particle size distributions. A similar experiment was conducted using a DT
1201 acoustic spectrometer (purchased from Dispersion Technology Inc.) to validate the
results obtained from the inflow microscope. For the acoustic spectrometer measurements,
a 10 wt. % glass beads sample was used instead of 0.5 wt. % suspension due to signal
noise constraints of the acoustic spectrometer. Glass beads were suspended in DI water
and circulated using the peristaltic pump attached to the acoustic spectrometer.
Water-in-oil emulsions were prepared using non-paraffinic Crystal Plus 70T
Mineral Oil. The mineral oil with a density of 0.85 g/cc and viscosity of 40 cP at 25°C
was purchased from STE Oils. For surfactant stabilized emulsions, a non-ionic surfactant,
Span80 (sorbitan mono-oleate) was used as the emulsifier. Span 80 has a density of 0.99
g/cc, and hydrophile-lipophile balance (HLB) of 4.3. For solid-stabilized emulsions, solid
nanoparticles were used as the stabilizing agent. For this work, hydrophobic fumed silica
nanoparticles, Aerosil R972 (purchased from Evonik Inc.) was used as the solid stabilizer.
Aerosil R972 is made up of sintered aggregates of nanoparticles with a primary particle

40
size of 16 nm and aggregate size varying in the range 100 nm – 1 µm. Aerosil R972 is
extremely hydrophobic and is known to form water-in-oil emulsions. Deionized water
(DI-Water) with a resistivity of 18.1 mΩ was used as the dispersed phase. Emulsions were
investigated with water fractions equal to 5, 10, and 20 vol. %. The surfactant/solids
concentration was held constant at 1 vol. % for all samples. All samples were prepared
gravimetrically, but concentrations are reported as vol. % to facilitate comparisons with
other applications.
For the flow loop experiments, 4 gallons of emulsion were prepared using an
Ultraturrax homogenizer at 3000 rpm for 5 mins. The emulsions were initially prepared
outside the flow loop and transferred to the reservoir immediately after preparation and
the temperature was maintained constant at 25°C using the recirculating chiller. The
emulsion sample was circulated at three different flow rates (3.3 gpm, 6.6 gpm and 8.3
gpm) at 25°C and the corresponding images and videos were captured using the inflow
microscope. The emulsion sample was cooled from 25°C to 15°C while the sample still
remained in the flow loop. The flow loop operating temperature was decreased by
circulating the chiller fluid to a set point of 15°C. This temperature ensured that the upper
pressure limit of the flow loop would not be exceeded at the high water concentrations.
Images and videos of the emulsion were captured at 15°C at the three different flow rates
(3 gpm, 6.6 gpm and 8.3 gpm).
A small quantity (25 mL) of the emulsion sample from the flow loop operating at
25°C was used for conductivity measurements. A non-aqueous conductivity probe
purchased from Dispersion Technology, Inc. was used in this work. Emulsion
conductivity measurements were performed at 25°C.

41
3.3. Results and Discussion
Figure 3.2 a) illustrates the particle size distribution of a glass beads suspension in
DI water obtained from the inflow microscope and acoustic spectrometer. Optical
microscopy and scanning electron microscopy (SEM) were also employed to validate the
results obtained from the inflow microscope. The mean particle diameter obtained from
inflow microscopy and acoustic spectroscopy techniques were 37.7 and 33.8 µm,
respectively. Though the mean particle diameters from the two techniques were not
identical, both mean values were within the vendor specified range. Acoustic spectroscopy
assumes a spherical morphology and predicts the hydrodynamic particle size [64],
whereas the inflow optical microscopy technique is a direct visual interrogation of the
system, and takes into account the particle aspect ratio. Images shown in Figure 3.2 b) and
d) indicate that glass beads contain irregularly shaped debris (confirmed by discussions
with the vendor), and contribute toward predicting a larger mean size, as seen by the
inflow microscopy technique.

42
Figure 3.2: Glass beads particle size distribution (psd). a) Comparison of glass beads psd
measured using inflow microscopy (0.5 wt. % glass beads) and acoustic spectroscopy (10
wt. % glass beads b) Scanning electron microscopy image of 0.1 wt.% glass beads
suspension c) Image captured by inflow microscope d) Optical microscope image of 0.5
wt. % glass beads taken at 10X magnification.
Figures 3.3 and 3.4 represent droplet size distributions of solid stabilized 20 vol.
% water-in-oil emulsion at three different flow rates at 25°C and 15°C, respectively.
Inflow microscopy images seen in Figures 3 and 4 illustrate the presence of polydisperse
and large water droplets in addition to small droplets. As seen in the distributions, as well
as in images in Figures 3.3, the fluid flow rate was observed to have minimal effect on the
droplet size and distributions. Results observed in Figures 3.3 and 3.4 indicate that solid
particles impart mechanical rigidity to droplets and prevent droplet breakup and interfacial
film rupture. The images shown in Figure 3.4 were captured when the process fluid

43
temperature was maintained at 15°C. Figure 3.3 a) and 4 a) illustrate that with a decrease
in process fluid temperature, the distribution shifted slightly to the left.
Figure 3.3: Droplet size distribution of solid stabilized 20 vol. % water-in-oil emulsion
and the corresponding images of the emulsion captured by an inflow microscope at
different operating flow rates at 25°C. In the figure, a) comparison of the psd obtained
from the inflow microscope of the emulsion at three different flow rates, and the images
of emulsion captured at b) 3.3 gpm, c) 6.6 gpm, and d) 8.3 gpm.

44
Figure 3.4: Droplet size distribution of solid stabilized 20 vol. % water-in-oil emulsion
and the corresponding images of the emulsion captured by an inflow microscope at
different operating flow rates at 15°C. In the figure, a) comparison of the psd obtained
from the inflow microscope of the emulsion at three different flow rates, and the images
of emulsion captured at b) 3.3 gpm, c) 6.6 gpm, and d) 8.3 gpm.
A similar trend was observed for solid stabilized 5 vol. % and 10 vol. % water-in-
oil emulsions at both the operating temperatures. Droplet size distribution and their
corresponding inflow microscopy images are not shown for every water concentration and
emulsion type, as no drastic difference in the droplet behavior was observed as a function
of flow rate and operating temperature. This work suggests that for solid-stabilized
emulsions, the operating temperature has a negligible effect on the average droplet size,
but it appears to influence the shape of the distributions.

45
Figure 3.5: Droplet size distribution of surfactant stabilized 20 vol. % water-in-oil
emulsion and the corresponding images of the emulsion captured by the inflow
microscope at different operating flow rates at 25°C. Figure a) shows a comparison of the
psd obtained from the inflow microscope of the emulsion at three different flow rates, and
the images of emulsion captured at b) 3.3 gpm, c) 6.6 gpm, and d) 8.3 gpm.

46
Figure 3.6: Droplet size distribution of surfactant stabilized 20 vol. % water-in-oil
emulsion and the corresponding images of the emulsion captured by the inflow
microscope at different operating flow rates at 15°C. Figure, a) shows a comparison of the
psd obtained from the inflow microscope of the emulsion at three different flow rates, and
the images of emulsion captured at b) 3.3 gpm, c) 6.6 gpm, and d) 8.3 gpm
Figures 3.5 and 3.6 represent the drop size distributions of surfactant stabilized 20
vol. % water-in-oil emulsions at three different flow rates at 25°C and 15°C, respectively.
The mean droplet size of the emulsion appeared to decrease with an increase in the flow
rate (Figure 3.5). This indicates that the droplets are likely deformable and the operating
flow rate can have an effect on the drop size distribution. With a decrease in the process
fluid temperature from 25°C to 15°C, the average droplet size decreased (Table 1 and
Figures 3.5 and 3.6). A decrease in the average droplet size that was observed at higher

47
flow rates and lower temperatures was possibly due to changes in the structure of the
surfactant layer at the interface. Drelich et al observed that span 80 emulsions showed
several destabilization processes due to change in the structure of the surfactant molecules
at the oil-water interface [66].
Several studies have identified that solid particles impart mechanical rigidity to
the interfacial film as the solid particles form a tightly packed network around the droplets
[77]. As the solid silica particles used for this work consisted of nanometer-sized particles
sintered to form a fractal-like network, we observed that the emulsion droplets in solid-
stabilized emulsions were mechanically rigid and didn’t show droplet breakup at high
flow rates (Figures 3.3 and 3.4). In addition, it has been shown that solid particles increase
the viscosity of emulsions by facilitating the production of large emulsion droplets [66].
As the emulsion droplet size increases, the hydrodynamic distance between droplets
decreases; thereby, increasing the emulsion viscosity [78].
Though the emulsion stress-strain relationship was not investigated in the present
work, visual observations suggest that solid particles acted as viscosity adjusters and
produced more viscous emulsions even at low water fractions in contrast to surfactant
stabilized emulsions. It was observed that the back-pressure on the pump while handling
solid-stabilized emulsions was consistently 2-3 times higher than that of surfactant
stabilized emulsions at all water fractions. Drelich et al performed rheological
measurements on span 80 and Aerosil R711 solid particle stabilized water-in-paraffin oil
emulsions to better understand the role of each of these systems on the emulsion
stabilization and formation mechanism [66]. They observed that span 80 stabilized
emulsions displayed a little change in the fluid flow behavior when compared to the

48
continuous paraffin oil phase (Newtonian behavior). The authors found that solid-
stabilized emulsions yielded non-Newtonian behavior likely due to the effect of the fractal
network formed by silica particles in the continuous oil phase. Similar observations were
made by other studies [78].
Conductivity measurements indicate that hydrophobic Aerosil R972 solid particles
produce highly non-aqueous emulsions with conductivity in the range of 10-11 S/m at all
water concentrations investigated in this work; whereas the conductivity of surfactant
stabilized emulsions increased from 10-9 S/m for the 5 vol. % water-in-oil emulsion to
10-4 S/m for the 20 vol. % water-in-oil emulsion.
Figure 3.7: Images of emulsions captured by the inflow microscope at different water
concentrations at 25°C and a flow rate of 3.3 gpm. a), b) and c) represent images of solid-
stabilized emulsions at 5, 10, and 20 vol. % water concentration respectively. d), e) and f)

49
represent images of surfactant-stabilized emulsion at 5, 10, and 20 vol. % water
concentration respectively.
Figure 3.7 provides inflow optical microscopy images captured at varying water
concentrations at a fixed fluid flow rate of 3.3 gpm and 25°C. As observed in Figures 3.3-
3.7 and Table 3.1, emulsion droplet size is a function of the dispersed phase concentration
for both surfactant and solid-stabilized emulsions. The visual evidence shown in Figure
3.7 illustrates the polydispersity of solid-stabilized emulsions, whereas, such
polydispersity in the droplet size distribution was not well pronounced in surfactant
stabilized emulsions. Figure 3.7 also illustrates the tendency of span 80 emulsions to
flocculate.
Figure 3.8: Images of solid-stabilized emulsions captured by the inflow microscope at
different water concentrations and flow rates at 25°C. In the figure, a), b) and c) represent

50
images of the emulsion at 5, 10, and 20 vol. % water concentration respectively. i), ii) and
iii) represent images of the emulsion at 3.3 gpm, 6.6 gpm and 8.3 gpm, respectively.
Figure 3.9: Images of surfactant-stabilized emulsion captured by the inflow microscope
at different water concentrations and flow rates at 25°C. Figures a), b) and c) represent
images of the emulsion at 5, 10, and 20 vol. % water concentration respectively. i), ii) and
iii) represent images of the emulsion at 3.3 gpm, 6.6 gpm and 8.3 gpm respectively.
Figures 3.8 and 3.9 correspond to the images captured by the inflow microscope
to delineate the effect of water fraction and flow rate on the emulsion drop size distribution
and morphology. As noticed in Figure 3.8, there appeared to be a negligible effect of flow

51
rate on the emulsion drop size and morphology. Figure 3.9 further illustrates the
flocculation tendency of span 80 emulsions, even in flowing conditions. Figure 3.9 also
illustrates the impact of water fraction and operating flow rate on the resulting drop size
distributions.
Several studies have previously shown that there is a significant contrast in the
interfacial properties between these two kinds of emulsions. Binks demonstrated that solid
particles function in similar ways to surfactant molecules except that they don’t reduce
the interfacial tension between the two immiscible phases [78]. Drelich et. al conducted
interfacial tension measurements on Aerosil R711 and span 80 stabilized emulsions using
a drop shape analysis system [66]. The results indicated that the presence of solid particles
had no effect on the oil-water interfacial tension, whereas, for surfactant-stabilized
emulsion, the oil-water interfacial tension decreased in the presence of surfactant
molecules. This insight coupled with the visual observations made in the present work
underscore the complexities that can arise in these systems.

52
Table 3.1: Mean emulsion droplet size of solid particle and surfactant stabilized water-
in-oil emulsions at different water concentrations, flow rates, and temperatures. The
average droplet size was determined from the real-time images and videos captured from
the inflow microscope.
Water Concentration
(Vol. %)
Flow rate
(gpm)
Solid stabilized
emulsions (µm)
Surfactant-stabilized
emulsions (µm)
25°C 15°C 25°C 15°C
5
3.3 9.5 10.3 5.4 3.8
6.6 9.1 10.7 4.3 3.2
8.3 9.2 9.9 3.8 3.0
10
3.3 14.1 14.5 8.7 5.9
6.6 13.9 13.6 6.7 4.4
8.3 14.2 13.5 6.2 4.2
20
3.3 16.2 16.3 14.5 8.5
6.6 16.8 16.2 11.3 7.8
8.3 16.6 16.7 10.6 7.2
3.4. Conclusion
The experimental flow loop setup equipped with an inflow microscope was
successful in characterizing emulsion drop size distribution and morphology over a range
of operating conditions. Inflow microscopy images and the drop size distributions of solid-
stabilized emulsions exhibited polydispersity. Surfactant-stabilized emulsions exhibited a
comparatively smaller droplet size distribution. For solid-stabilized emulsions,
temperature and fluid flow rate had a negligible effect on the drop size distributions (Table

53
3.1). Water concentration was identified as the primary variable that impacted the droplet
size distributions. For surfactant stabilized emulsions, flow rate, operating temperature,
and water concentration appeared to influence the droplet size distributions. Evolution of
multimodal distributions with a decrease in temperature and increase in flow rate was
observed in surfactant stabilized emulsions. These observations indicate that solid
particles formed a steric barrier around the water droplets imparting rigidity and
preventing droplet coalescence even in flowing conditions (Table 3.1). Surfactant-
stabilized emulsions were observed to form mechanically deformable droplets (Table 3.1).
Further experimental investigation on the rheological and interfacial properties will be
performed to evaluate the competitive effect of solid particles and surfactants on emulsion
formation and stabilization mechanisms. The experimental results coupled with future
investigations on the combined effect of solid particles and surfactants will provide new
insights for developing strategies for handling complex emulsions that are prevalent in the
energy industry.

54
CHAPTER IV
IMPACT OF HYDRATE FORMATION ON EMULSION MORPHOLOGY IN
SURFACTANT AND SOLID STABILIZED EMULSIONS
4.1. Introduction
Palermo et al and Turner proposed hydrate agglomeration and nucleation
mechanism in w/o emulsion[79],[80]. To this end, Høiland et al explored the interaction
between hydrates and emulsions at high water fraction[10]. Høiland et al also investigated
the effect of hydrate particles on emulsion phase inversion. The authors observed that
increase in water fraction resulted in emulsion inversion from water-in-oil (w/o) to oil-in-
water (o/w) type in the presence of Freon hydrates. Høiland et al developed and tested a
method for evaluating the wettability of hydrate particles in crude oil systems. The authors
assumed the solid particles present in the crude oil, such as silica, adsorb to hydrate the
acting as colloidal stabilizers resulting in Pickering emulsions. The authors observed that
hydrophobic solid particles adsorbed on the hydrate surface prevent hydrate
agglomeration.
Linares et al conducted experiments on gas hydrate formation in a water-in-model
oil emulsions system[81]. The authors prepared emulsions that are common in crude oil

55
systems by varying the surfactant concentration and water content to demonstrate the
stability of emulsions upon ice and hydrate formation. The model oil (Crystal plus 70T
mineral oil) used by Linares et al is similar to the model isoparaffinic oil system that will
be used in this proposed work. Stable water-in-oil emulsions were prepared using span 80
and AOT surfactant mixture. Stable emulsions were formed at varying water fractions
(10-70 vol. %) and surfactant concentrations (1 and 5 wt. %). The authors observed that
emulsion viscosity increased with increase in the water fraction.
Sjöblom et al conducted experiments to investigate the properties of oils that
contribute to hydrate plugging and non-plugging of pipelines[12]. Rheological,
interfacial, micromechanical force, and droplet size measurements were examined for
three different surface treated crude oil-water systems. The authors concluded that
capillary attractive forces between hydrate particles contribute to hydrate agglomeration
and plugging. Adsorption of solid particles on the oil-water interface, emulsion stability,
high shear rate, low interfacial tension, and anti-agglomerants prevent hydrate particle
adhesion and agglomeration.
Lachance et al conducted several experiments on the formation of hydrate slurries
in a once-through flow loop and field trial test [82]. Once through flow loop tests were
conducted to simulate and provide insight into the evolution of hydrate formation in crude
oil emulsions using span 80 as a surfactant. A Canty inflow microscope was utilized to
obtain droplet size and distribution to study the effect of water cut on dispersion
characterization and hydrate slurry formation. The emulsion droplet images and
distribution captured by the inflow microscope were similar to the results we obtained for
5 and 20 vol. % water-in-model oil emulsion stabilized using span 80 as a surfactant. The

56
authors concluded that water dispersion characteristics (water cut, fluid velocity, emulsion
composition, and stability) showed the most effect on hydrate formation and aggregation.
They observed that emulsions with high water cut aided in increasing droplet coalescence
promoting hydrate formation. Increased emulsion stability aided in reducing hydrate
aggregation tendencies.
Several studies have been conducted to investigate hydrate nucleation, crystal
growth, and their morphology using cyclopentane [45-47, 83-86]. Hence, for this study,
cyclopentane is used as a guest molecule in the hydrate forming emulsion. The focus of
this work was to investigate hydrate formation in oil-dominated systems in the presence
of different stabilizers such as surfactants and solid particles. Water-in-oil emulsions
(water dispersed in continuous oil phase) is one of the most predominant multiphase flow
situations encountered in the petroleum industry. In such oil dominated systems, hydrate
blockages have been proposed to occur in a four-step mechanism [80, 87, 88]. Studies
have shown that as the emulsion enters into a hydrate formation region (low temperature
and high-pressure conditions favorable to hydrate formation), hydrate grows on water
droplets similar to a shrinking core model, agglomerate, or plug flow line. As the hydrate
shell grows around the water droplet, diffusion of gas through water droplets occurs as a
function of droplet size. Hydrate agglomeration is prevented in the presence of small water
droplets as the hydrates grow inward and result in a fully converted hydrate particle that
remains suspended. Whereas, large droplets result in capillary attraction between hydrate
particles due to water bridging, and cause agglomeration and eventually plugging [37].
Hence, it is imperative to determine the emulsion droplet size, hydrate crystal size, and
hydrate morphology.

57
Hydrate formation is an interfacial phenomenon, so understanding and quantifying
interfacial behavior, such as surfactant type and distribution at the interface, is critical in
order to develop hydrate management strategies [37]. As crude oil contains several
naturally occurring surfactants, solid particles, and surface active materials, it is
imperative to investigate hydrate crystal growth and interfacial characterization in the
presence of surfactant and solid particles. Furthermore, hydrate characterization would
provide an insight into processing efficiency and transportation of hydrate crystals and
slurries. To this end, Karanjkar studied the effect of surfactant (Span 80) on hydrate
formation and crystal morphology in cyclopentane hydrate forming systems using a
visualization technique [44]. Single water drop microscopy experiments showed conical
hydrate crystals with hairy or mushy hydrate morphology in a surfactant laden system.
Such morphology was observed due to excess Laplace pressure generated by reduced
interfacial tension in the presence of surfactant which resulted in inward growth of hydrate
crystals. In the absence of surfactant, lateral growth of a faceted plate-like structure was
observed. Similar work was conducted by Zylyftari et al. and Ahuja on hydrate formation
in emulsions [46, 85]. A porous, hairy, or mushy hydrate structure was formed in the
surfactant stabilized emulsions. To this end, Cha et al conducted visualization experiments
to evaluate the effect of solid particle loading on hydrate formation[89]. Conical hydrate
crystals with a hairy or mushy like structure were observed at solids loading < 1 wt. % of
the oil phase, whereas, hydrate formation was greatly reduced or prevented in emulsions
containing >2 wt. % solid concentration. Nakajima et al studied the effect of surfactants
on energy storage in cyclopentane hydrate formation and observed hydrate morphology
similar to that seen by Karanjkar [44, 50]. Several studies have shown that hydrate

58
formation leads to an abrupt increase in emulsion viscosity, and mechanical properties,
thus leading to a sudden rise in system pressure and plugging of flow lines[43, 46, 56, 84,
86, 90-92]. Peixinho et al. studied the effect of nucleation time and crystal growth time in
cyclopentane hydrate forming emulsions [83].
Though several studies have been carried out on cyclopentane hydrate forming
systems, limited laboratory scale experimental work has been conducted on hydrate
characterization and emulsion properties after hydrate dissociation in concentrated
emulsions [43-46, 85, 89]. Moreover, the effect of stabilizer type, and the water fraction
on hydrate formation in emulsions is not comprehensively understood, and hence requires
further investigation. This study probes the effect of stabilizer type and water fraction on
emulsion droplet size before hydrate formation and upon hydrate dissociation in
cyclopentane hydrate forming water-in-oil emulsions. In this study, emulsion droplet size
and hydrate crystal formation are studied using visualization technique, and interfacial
properties are characterized using IFT measurements. For this work, cyclopentane hydrate
forming emulsions were prepared at two different water fractions (10 and 40 vol. %) and
three different stabilizers, such as a non-ionic surfactant (span 80) and solid particles of
different wettability (Aerosil R974 and Aerosil R816). Solid particles with different
wettability were chosen to investigate the effect on hydrate formation and emulsion
properties upon hydrate dissociation. In addition to visualization, a statistical analysis was
performed to compare emulsion properties before and after hydrate dissociation. What
follows is a detailed description of experimental procedure adopted to accomplish the
objectives of this work.

59
4.2.Materials and Methods
The experiments carried out in this work consist of several steps such as preparation
of emulsion samples, cooling and heating process of the samples to study hydrate growth
and dissociation and visualization of the samples during this process. Following is a brief
description of the materials and methodology used to perform proposed experiments.
4.2.1. Materials
Water-in-oil emulsions were prepared using Crystal Plus 70T mineral oil,
cyclopentane, and stabilizers such as non-ionic surfactant (span 80) and solid particles
(Aerosil R974 and Aerosil R816). Crystal Plus 70T (purchased from STE Oils) is a
technical grade white mineral oil with a density of 825 kg/m3 at 25 oC and viscosity of 20
cP at 25 oC. As discussed earlier, since Cyclopentane forms structure II hydrates at nearly
atmospheric conditions, it was considered as an appropriate guest molecule for this work.
Cyclopentane used for the experiments were of 99 wt.% purity, density of 750 kg/m3
purchased from BDH chemicals. The continuous oil phase used in this work was prepared
using a 50:50 equal volume mixture of crystal plus 70T mineral oil and cyclopentane. An
equal volume mixture of mineral oil and cyclopentane ensured that cyclopentane was in
stoichiometric excess (1 mol of cyclopentane:17 mol of water). This emulsion
composition is similar to the study conducted by Karanjakar et al. [43]. For the control
sample, the oil phase consisted of mineral oil and stabilizer. Deionized water obtained
from a Millipore Direct Q3 system was used as the internal/aqueous phase. Two different
water concentrations (10 and 40 vol.%) were used in this study to evaluate the effect of

60
low (10 vol.%) and high (40 vol.%) water cut on hydrate formation and emulsion
morphology in water-in-oil emulsions.
The three kinds of stabilizers used for this study were span 80, Aerosil R974, and
Aerosil R816. Span 80 (sorbitan monooeleate) was used for this study, as it is well known
to form stable water-in-oil emulsions due to its low hydrophilic-lipophilic balance (HLB)
of 4.3. Span 80 is a non-ionic surfactant with a density equal to 990 kg/m3 and was
purchased from Sigma-Aldrich. The two kinds of solid particles (Aerosil R974 and
Aerosil R816) used as stabilizers in this study were provided by Evonik Inc. Aerosil R974
and Aerosil R816 are fumed silica particles synthesized by flame pyrolysis. The primary
particle size of these fumed silica particles are around 10-20 nm with an agglomerate size
< 1 µm. The two kinds of fumed silica particles used in this study have a tamped density
of 50-60 g/L and a specific surface area of 200 m2/g. These two types of solid particles
were used due to their difference in particle hydrophobicity/wettability. Aerosil R974 is
highly hydrophobic and is always known to form water-in-oil emulsions at all water
concentrations as compared to Aerosil R816. Aerosil R816 is synthesized with
intermittent wettability and hydrophobicity and hence produces both water-in-oil and oil-
in-water emulsions depending on the aqueous phase concentration. These two types of
solid particles were chosen to evaluate the effect of particle hydrophobicity on emulsion
stability and hydrate formation. For both surfactant and solid particle stabilized emulsions,
based on the oil concentration, the stabilizer concentration was kept constant at 0.1 vol.
%. Karanjkar identified the critical micelle concentration (CMC) for span 80 to be equal
to 0.03 vol. % for the oil mixture used in this study. Since our work is based on the

61
previous studies by Karanjkar and Ahuja, we decided to use 0.1 vol. % span 80 for
surfactant stabilized emulsions [44, 85]. As one of our objectives was to probe the
similarities/differences in hydrate formation in surfactant and solid-stabilized emulsions,
we decided to keep the stabilizer concentration constant (0.1 vol. % of the oil phase) in
both kinds of emulsions. The emulsion sample (50 g) used in this work was prepared by
adding the stabilizer to the mixture containing equal volume fraction of mineral oil and
cyclopentane. The stabilizer was dispersed well in the oil mixture by stirring it using a
spatula. The aqueous phase was added to the oil mixture dropwise and mixed well using
an IKA Ultraturrax T25 homogenizer at 2800 rpm for 5 min. Similar experiments were
performed with a control sample. The control sample, however, did not show any sign
of hydrate formation throughout the experiment in the hydrate formation zone. The control
samples were prepared similarly except that the oil phase was composed of mineral oil
and stabilizer instead of equal volume mixture of mineral oil and cyclopentane.
4.2.2. Methods
To accomplish the objectives of this research, a step by step procedure consisting
of measurements of interfacial tension, visualization, and image analysis/measurement
was followed.
4.2.2.1.Visualization technique
In this work, an Olympus BX53 polarized optical microscope equipped with a
Linkam CSS 450 temperature controlled shear stage and a high-speed camera was used
for visualization. The microscope was equipped with a Peltier stage that could operate in
the temperature range of -45 °C to 450 °C and a maximum shear rate equal to 10 rad/s. It

62
should be noted that the samples under visualization were not subjected to shear
throughout the course of the experiment. The temperature controlled stage consisted of a
circular well mounted on a quartz window with a sample diameter of 30 mm and viewing
diameter of 2.8 mm as shown in Figure 4.1.
Figure 4.1: Schematic of the temperature controlled stage and the visualization setup used
for experiments.
The emulsion sample of volume 0.5 mL at room temperature was loaded on the
microscope stage. The experimental procedure followed in this work is similar to the work
conducted by Ahuja [45] and Karanjkar [93]. However, the experimental conditions differ
in terms of the oil composition, sample volume used for visualization, mixing conditions,

63
and the temperatures used for the quenching and reheating process. For this work, the
temperature profile used in the microscope is described below:
a) The temperature stage was initially set to 25oC followed by the quenching process.
Quenching of emulsion to form ice was identified to induce faster hydrate
formation by overcoming long induction times during hydrate nucleation [93].
Hence, the temperature was lowered to -25 °C (Tice) at a rate of 10 °C/min to
induce ice crystallization of the emulsion droplets.
b) The sample was held at that temperature (Tice) until more than 50% of the water
droplets were converted to ice. Visual observation was used to confirm that at least
50% of the water droplets were converted to ice. Our experimental observations
showed that at least 30 minutes of hold time was required to convert more than
50% of the droplets to ice. The appearance of white spots on the water droplets
indicates ice formation, as seen in Figure 4.2(e).
c) Next, the temperature was increased from Tice to 0.1 °C (Thyd) at a rate of 2 °C/min
and held at this temperature for 60 mins to allow the hydrate crystals to grow. A
slower heating rate was chosen in this step to ensure melting of ice before hydrate
formation.
d) The temperature was increased back to 25 °C at a rate of 5 °C/min rate to study
the effect of hydrate dissociation on emulsion droplet size.

64
Figure 4.2: Images captured (10x magnification) at various temperatures during hydrate
characterization experiment for 0.1 vol. % surfactant stabilized 10 vol. % water emulsion.
Transient emulsion stability tests were conducted on hydrate forming emulsions
by measuring the emulsion drop size distribution of a representative sample that was used
for hydrate studies. The hydrates experiments were carried out within 5 mins of emulsion
preparation, and the transient stability test was conducted after two hours on the same

65
sample. The drop size distribution for the emulsion before hydrate formation and after
hydrate dissociation was determined using Image J software. For each sample, the
algorithm illustrated in Figure 4.3 was followed to determine the size of each droplet and
statistical parameters, such as mean droplet size and standard deviation of the droplets’
size.
Figure 4.3: Image J algorithm to determine droplets’ size and distribution for different
emulsion samples.

66
4.2.2.2.Interfacial tension
A high pressure, interfacial tensiometer (IFT) model # IFT-10-OS purchased from
Core Lab Instruments (Tulsa, OK) was used for conducting dynamic interfacial tension
measurements. The pendant drop method was used for measuring the interfacial tension
of pure water-cyclopentane, 50:50 equal volume mixture of mineral oil-cyclopentane, and
water in the absence of stabilizer and at 0.1 vol. % stabilizer (either surfactant or solid
particles) concentration at ambient conditions. The measurements were conducted for a
minimum of 5 min until steady state was reached as shown in Figure 4.4. The steady state
was identified when the IFT measurements showed a variation less than 0.05 mN/m. The
experiments were performed at least three times to quantify the precision of the technique.
A summary of interfacial tension measurement of the different systems of interest for this
study is given in Table 4.1. The interfacial tension of the oil-water system in the presence
of 0.1 vol.% solid particles (50 mN/m) was observed to be the same as pure
(oil+cyclopentane) - water (48.2 mN/m). This observation is congruent with Drelich et al,
who observed that solid particles did not reduce the interfacial tension [56]. The plausible
explanation for such behavior by solid particles on the oil-water interfacial tension could
be attributed to the high amount of energy required by solid particles to desorb from the
interface, whereas in the presence of a surfactant, the interfacial tension was reduced to 3
mN/m [22].

67
Figure 4.4: Dynamic interfacial tension of 50:50 equal volume mixture of cyclopentane
and crystal plus 70T mineral oil containing 0.1 vol.% span 80 measured using pendant
drop technique
Table 4.1: Summary of interfacial tension of oil-water interface in the absence
and presence of a stabilizer. Oil here represents an equal volume mixture of crystal plus
70T mineral oil and cyclopentane.
System Dynamic Interfacial
Tension (mN/m)
Oil -water 48.36 ±0.06
Oil+ 0.1 vol% Span 80 - water 3.04 ±0.02
Oil+ 0.1 vol% Aerosil R816 - water 50.3 ±0.03
Oil+ 0.1 vol% Aerosil R974 - water 50.16±0.05
4.3. Results and Discussion
The images captured along the temperature variation for surfactant stabilized 10 vol.
% water emulsion are presented in Figure 4.2 (a)-(l). Figure 4.2 (a) is a representative
image of the emulsion at 25 oC during the start of the experiment. Figures 4.1 (b) to (d)
are images captured during quenching of emulsion droplets to form ice. White spots

68
highlighted in Figures 4.1 (e) to (g) represent water droplets that are converted to ice.
Water droplets that were converted to ice were found to melt around -0.4 oC. The sample
was set to 0.1°C to observe hydrate formation in emulsions. A crystalline like structure
was observed to grow at the interface of water droplets that were converted to ice and
subsequently melted. Irregularly shaped crystals were observed and are highlighted in red
in Figures 4.1 (i) and (j). Figures 4.1 (k) and (l) are representative images of the emulsion
after hydrate dissociation. As seen in the images in Figure 4.1, after hydrate dissociation,
the mean emulsion droplet size was greater when compared to droplet size at the start of
the experiment. Similar observations were reported by Karanjkar [44].
Representative images of hydrate crystals and emulsion morphology at the hydrate
formation zone (at 0.1°C) for surfactant stabilized 10 and 40 vol. % water emulsions are
reported in Figure 4.5. Figure 4.6 represents images of hydrate crystals captured at higher
magnification for surfactant stabilized 40 vol. % water-in-oil emulsion. A similar
experimental procedure was carried out in the control sample which is devoid of hydrate
forming compound (cyclopentane). Though conversion of water droplets into ice was
observed in both control and hydrate forming emulsions, hydrate crystals were not
observed in the control sample in the hydrate formation zone.

69
Figure 4.5: Images of hydrate crystals (at 10x magnification for 10 vol% and 20x
magnification for 40 vol%) captured in the hydrate formation zone of 0.1 °C for surfactant
stabilized emulsions with water concentrations equal to 10 and 40 vol% (scale bar = 100
m).

70
Figure 4.6: Images of hydrate crystals in surfactant stabilized 40 vol. % water emulsion
captured at 50x magnification.

71
Figure 4.7: Images of hydrate crystals captured in the hydrate formation zone of 0.1°C
for Aerosil R974 stabilized 10 and 40 vol. % water concentration.

72
Figure 4.8: Hydrate crystals in Aerosil R974 stabilized 40 vol. % water emulsion. The
regions highlighted in red indicate hydrate crystals
In solid-stabilized emulsions, hydrate formation was observed at all water
fractions. However, a wide variety of hydrate crystallinity/ irregularity in the crystalline
structure was observed (Figure 4.7). Figure 4.8 represents images of the hydrate crystal in
Aerosil R974 stabilized 40 vol. % water emulsion. The tip of the crystals were observed
to be pointing inward (Figure 4.8). Cha et al conducted a similar experiment on a
cyclopentane hydrate slurry system with either span 80 or silica particles in the presence
of fixed span 80 concentration [89]. They observed that at low particle concentration (<=
1 wt. %), hydrate morphology was similar to that of a surfactant stabilized system. They

73
also observed that at high solid concentrations, the rate of hydrate formation and
agglomeration was slow.
The irregularity and random growth of hydrate crystals in solid stabilized
emulsions could be attributed to the effect of solid particles on the oil-water interfacial
tension. Since solid particles have minimal effect on oil-water interfacial tension (Table
4.1), it is hypothesized that during hydrate nucleation, the initial hydrate crystal doesn’t
experience enough excess surface/Laplace pressure, thereby retarding the compression
and lateral overgrowth of conical hydrate crystals into a hairy/ mushy structure. Karanjkar
[93] observed that for surfactant free systems, a faceted plate like hydrate structure was
observed where the lateral growth of hydrate leads to thin shell formation. The faceted
shell formed by joining hydrate facets slows the radial growth of hydrate. At the
experimental conditions studied in this paper, solid particles were shown to not
significantly reduce the interfacial tension, unlike the surfactant laden system (Table 4.1).
The possible reason could be that the solid particles at the interface form a physical barrier
around the water droplets which slow down the diffusion of hydrate forming cyclopentane
molecules from the oil phase to water droplets.

74
Table 4.2: Summary of average drop size of emulsions before hydrate formation and after
hydrate dissociation.
Emulsion
Mean droplet size (µm) Standard
deviation
Before hydrate
formation
Upon hydrate
dissociation Water content (vol. %) Stabilizer
10
Span 80 14.7 ± 1.8 18.3 ± 2.6
Aerosil R974 7.7 ± 0.5 8.3 ± 0.8
Aerosil R816 13.7 ± 7.4 13.1± 3.8
40
Span 80 13.1 ± 4.6 16.2 ± 5.9
Aerosil R974 24.6 ± 10.6 28.2 ± 9.0
Aerosil R816 15.4 ± 4.4 15.0 ± 6.7
Figure 4.9: Comparison of the emulsion droplet size distribution before hydrate formation
and upon hydrate dissociation for 0.1 vol. % Span 80 (surfactant) stabilized 40 vol. %
water-in-oil emulsion.

75
Figure 4.10: Comparison of the emulsion droplet size distribution before hydrate
formation and upon hydrate dissociation for 0.1 vol. % Aerosil R974 (solid particle)
stabilized 40 vol. % water emulsion. The distribution was obtained by counting the
number of droplets from the inset.

76
Comparing the drop size distribution of the emulsions before and after hydrate
formation, as seen in Figures 4.9 and 4.10, it is evident that the emulsion droplet size
increases upon hydrate dissociation in surfactant stabilized 40 vol. % water emulsion.
Similar observations were seen in surfactant stabilized 10 vol. % water emulsion. These
observations were not evident in solid stabilized emulsions. Table 4.2 summarizes the
effect of stabilizer type on emulsion mean droplet size before hydrate formation and upon
hydrate dissociation. Based on results shown in Table 4.2, upon hydrate dissociation, a
significant difference in the mean droplet size was observed in surfactant stabilized
emulsions. A significant difference in the mean droplet size was observed in surfactant
stabilized emulsions at both 10 and 40 vol. % water concentration. However, this trend
was not seen on solid stabilized emulsions.
Emulsion droplet deformation, which is a characteristic feature of surfactant stabilized
emulsions, has a critical influence on changes in emulsion droplet size after hydrate
dissociation. Changes in the structure of the surfactant layer at the interface occur due to
variations in the sample temperature [56, 94]. During hydrate formation, the hydrate
particles agglomerate, thereby promoting droplet coalescence upon dissociation. The
combined effect of changes in surfactant properties at the interface and flocculation leads
to an increase in the mean droplet size. Conversely, solid particles are identified to impart
mechanical rigidity to the oil-water interface by forming a network around water droplets
and irreversibly adsorbing at the interface [22, 57]. The mechanical rigidity imparted by
solid particles at the interface reduces flocculation and hydrate agglomeration. To this end,
Venkataramani and Aichele conducted flow loop experiments on surfactant and on solid
stabilized emulsions [95]. These experiments identified that for surfactant stabilized

77
emulsions, flow rate, and temperature has a significant impact on the emulsion droplet
size. Solid stabilized emulsions did not exhibit changes in the mean droplet size and
distributions with changes in flow rate and temperature.
4.4. Conclusions
Hydrate formation was observed in surfactant and solid stabilized emulsions at
both low and high water cuts. Hydrate crystals were observed at the oil-water interface in
both surfactant and solid stabilized emulsions. However, a wide variety of crystallinity
was present in solid stabilized emulsions. Solid particles were observed to have no effect
on the pure oil-water interfacial tension thereby resulting in a lack of excess surface
pressure at the oil-water interface that drives the inward growth of conical hydrate crystals.
Therefore, irregularities in the hydrate crystal structure are expected in solid stabilized
emulsions as supported by visual observations. Mean emulsion droplet size increased
upon hydrate dissociation in surfactant stabilized emulsions. A significant difference in
the mean droplet size was seen in surfactant stabilized emulsions at both water fractions
(10 and 40 vol. %). Future work will focus on the impact of particle wettability and particle
loading on hydrate formation in emulsions.

78
CHAPTER V
SINGLE WATER DROP HYDRATE FORMATION IN WAXY OIL SYSTEMS
5.1.Introduction
Waxes are long chain, high molecular weight carbon compounds present in crude
oil [51]. Visintin et al hypothesized that paraffin molecules stabilize emulsions by
adsorbing at the oil-water interface, forming Pickering emulsions[96]. The authors
predicted that paraffin crystals which precipitate at temperatures below the wax
appearance temperature (WAT), adsorb on the droplet surface, cover it, and stabilize the
emulsion forming floc-like network with dispersed water droplets entrapped in the wax
crystal network [96]. Bilyeu et al studied the mechanisms involved in treating a subsea
bare flow line that was plugged with hydrates and waxes[97]. Bilyeu observed that it was
easier to eliminate hydrates in a pipeline that is plugged with hydrates and waxes
simultaneously. Waxes were difficult to eliminate due to hard gel-like network that
remained in the flow line. Two sided depressurization and micro annular pressure pulse
method were utilized to remove hydrates and waxes respectively. Though techniques are
available to remove hydrates and wax plugs simultaneously, there is still no literature or
experimental data available on hydrate formation mechanism in waxy oil systems.

79
Although considerable research has been conducted on emulsions, hydrates, and
wax independently, there is a void left in understanding the fluid properties when these
systems occur simultaneously. Multiphase flow systems with hydrates, wax, and
emulsions are commonly found in the field. There is a lack of understanding of the
relationship between emulsions and other types of dispersions, such as hydrates, wax, and
hydrate formation in waxy oil systems under flowing conditions [98]. This has provided
an impetus to conduct experimental investigations of crude oil emulsions under flowing
conditions that can lead to improved understanding of the water – oil multiphase flow
phenomenon, thereby paving a way to develop economically feasible flow assurance
remediation strategies.
5.2. Materials and Methods
5.2.1. Materials
The objective of this work was to investigate the hydrate formation mechanism in
waxy oil systems. For this purpose, a model waxy oil continuous phase was prepared using
model oil (such as light mineral oil), cyclopentane, and paraffin wax. The experimental
work conducted for this study was classified into two categories: first, in the absence of
surfactant in the oil continuous phase, and second, containing a surfactant in the oil phase.
For all the studies discussed in this work, an oil continuous phase was prepared using 3:1
ratio of cyclopentane and mineral oil-wax mixture on a weight basis.
Light Mineral Oil with a density equal to 0.838 g/cc (at 25 °C), viscosity of 14.2 cP
(at 40 °C) was purchased from Sigma-Aldrich. Paraffin wax (purchased from Sigma-

80
Aldrich) with a melting point of 58-62 °C and viscosity of 3-6 cP at 100 °C was used in
the oil phase. The composition of the wax used in this study was determined by Gas
Chromatography (GC) analysis and is provided in Table 5.1. The data presented in Table
5.1 was obtained from Parthasarthi [99]
Table 5.1:Composition of wax obtained from Gas Chromatography analysis [99]
Component Composition (Mass %)
nC20 0.05
nC21 0.29
nC22 1.07
nC23 2.87
nC24 5.09
nC25 8.16
nC26 13.42
nC27 14.47
nC28 12.45
nC29 12.22
nC30 10.7
nC31 8.05
nC32 6.01
nC33 2.17
nC34 1.38
nC35 0.53
nC36 0.41
nC37 0.21
nC38 0.19
nC39 0.11
nC40 0.15
As discussed earlier in chapter I, since cyclopentane forms structure II hydrates at
nearly atmospheric conditions, it was considered as an appropriate hydrate-forming guest

81
molecule for this work. Cyclopentane (purchased from Alfa Aeaser) with a purity of 95%,
density equal to 0.75 g/cm3 was used as a hydrate-forming guest molecule. For this work,
two different wax concentrations: 1.25 wt.% (low wax content) and 5 wt.% (high wax
content) were used to evaluate the effect of wax concentration on hydrate formation. The
oil phase consisted of 75 wt. % cyclopentane, either 1.25 or 5 wt.% wax and the remaining
was light mineral oil. The oil phase was prepared in small batches of 25g. Every data point
shown in this work was repeated at-least three times using the same batch of sample. A
high concentration of cyclopentane (75 wt.%) was used in the oil phase, although the
stoichiometric ratio required for 1 mol of structure II/ cyclopentane hydrates is only 17
mol of water. A high concentration of cyclopentane was used to ensure that hydrate
formation would occur in the presence of wax in the oil phase and therefore would not
become a limiting factor.
For the surfactant-free 1.25 wt.% wax system, the oil phase was prepared by first
heating 23.75 wt.% of light mineral oil and 1.25 wt.% wax mixture to 100 °C on a stir/
hot plate in a glass beaker covered with parafilm for 24 hours. This step was done to ensure
complete dissolution of wax nanocrystals and erase any wax crystallization history. After
24 hours of heating, the temperature of the oil-wax mixture was reduced to 45 °C prior to
adding cyclopentane to the oil-wax mixture. The oil-wax mixture was cooled to 45 °C, as
the boiling point of cyclopentane is 49-50 °C (from MSDS). During the entire process,
the sample was stirred using a 1” long stir bar on a stir/hot plate at 600 rpm. Similarly, 5
wt.% wax in mineral oil-cyclopentane mixture was prepared by heating 20 wt.% mineral
oil and 5 wt.% wax mixture to 100 C for 24 hours. 75 wt.% of cyclopentane was added
after cooling the sample to 45 °C.

82
For the surfactant-free case, two different kinds of control sample were prepared:
one containing only cyclopentane as the oil phase, and the second containing 75 wt.%
cyclopentane and 25 wt.% mineral oil. Deionized water with a resistivity of 18.1 MΩcm
was used as the aqueous phase.
In order to correlate the experimental work discussed in this thesis to real world
systems, a model waxy oil system was prepared in the presence of a stabilizing agent such
as a surfactant. A stabilizer, such as a non-ionic surfactant (span 80), was added to the oil
phase to evaluate the effect of hydrate formation in waxy oil systems in the presence of
an emulsifier. The oil phase preparation for the surfactant laden system was identical to
the surfactant-free case except that after the addition of cyclopentane to the mineral oil-
wax mixture, 0.1 wt.% span 80 was added the oil phase. The mineral oil composition was
either 23.65 wt.% or 19.9 wt.% depending on the wax concentration. However,
cyclopentane concentration was kept constant at 75 wt.% of the oil phase, and
cyclopentane to mineral oil-wax mixture composition was kept constant at 3:1 ratio on a
weight basis. Surfactant-containing 1.25 wt.% wax system was composed of 75 wt.%
cyclopentane, 1.25 wt.% wax, 23.65 wt.% mineral oil, and 0.1 wt.% span 80. The control
sample for the surfactant containing system was prepared with 0.1 wt.% span 80, 24.9
wt.% mineral oil and 75 wt.% cyclopentane to evaluate the effect of wax on hydrate
formation in the presence of an emulsifier.
5.2.2. Visual/ Microscopy Method
Single water drop hydrate formation experiments were conducted using a
temperature/ shear controlled microscope stage to evaluate the effect of wax concentration

83
and heating/ cooling rate on hydrate formation in waxy oil systems. For this work, an
Olympus BX53 polarized optical microscope (equipped with a Linkam CSS 450
temperature controlled shear stage) and a high-speed camera was used for visualization.
The microscope is equipped with a Peltier stage that could operate in the temperature
range of -45 °C to 450 °C and at a maximum shear rate of 10 rad/s. For this study, the
samples under visualization were not subjected to shear throughout the course of the
experiment. The temperature controlled stage consisted of a circular well mounted on a
quartz window with a sample diameter of 30 mm and viewing diameter of 2.8 mm as
shown in Figure 5.1. The stage was previously set to 25 °C before loading the sample. For
single water drop hydrate experiments, approximately 100-150 µm diameter water drop
(< 2 µL) was placed on the bottom stage of the shear/ temperature controlled microscope
as shown in Figure 5.1. The sample cell was then filled with the oil continuous phase. The
bottom stage was immediately covered with the lid of the temperature control stage as
shown in Figure 5.1 to avoid vaporization of cyclopentane. The stage was then connected
to a liquid nitrogen pump for operating at lower temperatures.

84
Figure 5.1: Schematic of temperature controlled and shear stage optical microscope
equipped with cross polarizing lens
The temperature profile used for this study is given below:
After loading the sample to the microscope stage that was previously set to 25 °C,
the sample temperature was lowered to -25 °C at 2 °C/min rate to quench the water
droplet to form ice. Quenching of water droplets to form ice was identified to
reduce the stochastic hydrate induction time.
The sample was held at -25 °C for 5 min until a visually complete conversion of
the water droplet to ice was observed.

85
The sample was then heated to -0.5 °C at 2 °C/min rate to melt ice into liquid
water. Ice melting was observed to begin when the sample temperature was around
-1.5 °C to -1.0 °C, and was completed by the time the sample temperature reached
-0.5 °C. Hence, the sample was held at -0.5 °C for 5 min to ensure complete
melting of ice into liquid water. The free liquid water available upon ice melting
was identified to initiate hydrate nucleation by overcoming the long hydrate
induction time that is otherwise associated with cyclopentane hydrate formation.
Along with ice melting, hydrate nucleation and hydrate crystal growth were
observed to occur simultaneously at the interface. However, hydrate crystals were
easily distinguishable from ice, as these crystals were observed to form initially at
the interface and subsequently grow inward.
The sample temperature was increased to 0.1 °C at 2 °C/min rate and held at this
temperature for a minimum of 30 minutes or longer until visually complete
conversion of the water droplet to hydrates was observed. If complete conversion
was not observed by the end of 30 minutes, the hold time was increased by another
30 minutes. This step was repeated until visually the entire water droplet was
converted to hydrates and no further changes to the sample was observed through
visualization. For this work, hydrate conversion time was calculated as the time
taken at which the sample temperature reaches -0.5 °C to the time taken for the
water droplet to completely convert into hydrates by means of visual observation
(at 0.1 °C).

86
After visually complete conversion was observed, the sample was heated back to
25 °C at 2 °C/min rate and held at this temperature for 5 min to evaluate changes
in the hydrate-wax system upon hydrate dissociation.
Figure 5.2: Temperature profile used for hydrate formation in waxy oil systems. The figure
illustrates physical changes to the sample captured at different operating conditions
Figures 5.2 and 5.3 illustrates the temperature profile used for this work and the
physical changes to the sample captured using the visualization technique. Throughout

87
the course of the experiment, the heating and cooling rate was kept constant. The above
experimental procedure was repeated at 1 °C/min and 0.5 °C/min rates to evaluate the
effect of heating and cooling rate on hydrate formation in waxy oil systems. This
experiment was conducted to interrogate the effect of wax growth rate and crystal size on
hydrate formation, and to validate the hypothesis that in waxy oil systems, slower cooling
rate delays hydrate formation and hence, delays complete conversion.
Figure 5.3: Images captured (10x magnification) at various temperatures during hydrate
characterization in waxy oil system containing 1.25 wt.% wax in the mineral oil-

88
cyclopentane mixture. The experiment was conducted at heating and cooling rate of 2
°C/min.
The previously described experimental procedure was repeated even for surfactant
containing oil phase where the wax concentration and heating/ cooling rates were varied
to evaluate their effect on hydrate formation. For all the control samples used in this study,
the heating and cooling rate were kept constant at 2 °C/min as the control samples did not
contain any wax. Moreover, it was observed through this work, as well as several others,
that heating or cooling rate didn’t have a significant effect on hydrate formation or hydrate
conversion time in systems containing either pure cyclopentane or cyclopentane-oil
mixture [44]. However, in affected systems containing wax, the wax appearance
temperature (WAT) was found to be dependent on the cooling rate. The hydrate formation
experimental procedure was also repeated without quenching the water droplet to form
ice. The sample was held at 0.1 °C instead of quenching to -25 °C for several hours (6
hours). No hydrate formation was observed, thereby validating the long induction time
associated with cyclopentane hydrates.
5.3. Results and Discussion
5.3.1. Effect of cooling rate, wax concentration, oil phase composition on wax
appearance temperature (WAT)
Wax appearance temperature (WAT), also known as cloud point, is the highest
temperature below which wax crystals are precipitated. It is also known as the temperature
at which visible crystallization of wax occurs. WAT depends on the concentration of wax,
crude oil properties, and the molecular weight of the waxes. Measuring WAT is critical

89
due to its ability to cause deferred production. In addition to this, WAT acts like a
guideline for the operators above which the flow lines need to be operated for easy
transportation of fluids. For this study, the WAT of wax-mineral oil, wax-mineral oil-
cyclopentane, and wax-mineral oil-cyclopentane-span 80 systems were measured at two
wax concentrations (1.25 wt.%, and 5 wt.%) and three different cooling rates (0.5, 1, and
2 °C/min). WAT measurements were conducted on six different continuous phases: 1.25
wt.% wax in mineral oil, 1.25 wt.% wax in 23.75 wt.% mineral oil-75 wt.% cyclopentane,
1.25 wt.% wax in 23.65 wt.% mineral oil-0.1 wt.% span 80-75 wt.% cyclopentane, 5 wt.%
wax in mineral oil, 5 wt.% wax in 20 wt.% mineral oil-75 wt.% cyclopentane, 5 wt.% wax
in 19.9 wt.% mineral oil-0.1 wt.% span 80-75 wt.% cyclopentane. 1 mL of the sample was
placed in the sample chamber and WAT was measured by cooling the sample from 40 °C
to 1 °C. The microscope stage was preheated to 40 °C prior to loading the sample and was
held at this temperature for at-least 10 min and sheared at 0.1 rad/s prior to cooling the
sample to ensure dissolution of wax crystals. However, the sample was not sheared during
the course of the experiment and shearing of the sample was observed to have no overall
effect on either the WAT or wax crystal size. The oil phase was heated no higher than 40
°C, as the boiling point of cyclopentane is 45-50 °C. This step also ensured that the sample
was above the cloud point, and erased any wax history due to nano-wax crystals.
The WAT of the system containing 5 wt.% wax in pure mineral oil was higher
than WAT of 1.25 wt.% wax system at all three cooling rates (Table 5.2). As expected, 5
wt.% wax-mineral oil system exhibited higher WAT when compared to 1.25 wt.% wax
system due to a high concentration of wax in the system (5 wt.% wax system contains four
times higher wax concentration than 1.25 wt.% wax system). Several studies have

90
established that wax concentration has a direct influence on the WAT, and WAT increases
with an increase in wax concentration using solid-liquid equilibrium [100, 101]. The
amount of wax available in the 5 wt.% system was four times the concentration in the 1.25
wt.% system and hence, the density of nanometer-sized wax crystals is higher in the 5
wt.% wax system. In these systems, as temperature decreases, greater precipitation and
therefore faster aggregation of nanometer-sized wax crystals occurs at a comparatively
higher temperature, resulting in higher WAT. Table 5.2 illustrates a difference of at-least
10° C in WAT between the 5 wt.% wax and 1.25 wt.% wax systems in pure mineral oil at
all cooling rates, thereby demonstrating the influencing of wax concentration on WAT.
Table 5.2: Wax appearance temperature (WAT) of the oil phase containing either 1.25
wt.% or 5 wt.% wax at different cooling rates using cross-polarized microscopy
Table 5.2 indicates that the WAT was observed to be higher at a slower cooling
rate and lower at a faster cooling rate. Since WAT is a kinetic process, cooling rate is
Sample Cooling Rate (C/min)
0.5 1 2
1.25wt.% Wax+Mineral Oil 15.6 14.8 13
1.25wt.%Wax+23.75wt.% Mineral Oil+75wt.% Cyclopentane 14.6 13.8 13.5
1.25wt.% Wax+0.1wt.% Span 80+23.75wt.% Mineral Oil+
75wt.% Cyclopentane 14.2 13.6 13.3
5wt.% Wax+Mineral Oil 26.8 25.5 23.9
5wt.% Wax+20wt.% Mineral Oil+ 75wt.% Cyclopentane 18.4 17.8 17.5
5wt.% Wax+0.1wt.% Span 80+20wt.% Mineral Oil+75 wt.%
Cyclopentane 17.5 17.5 17.2
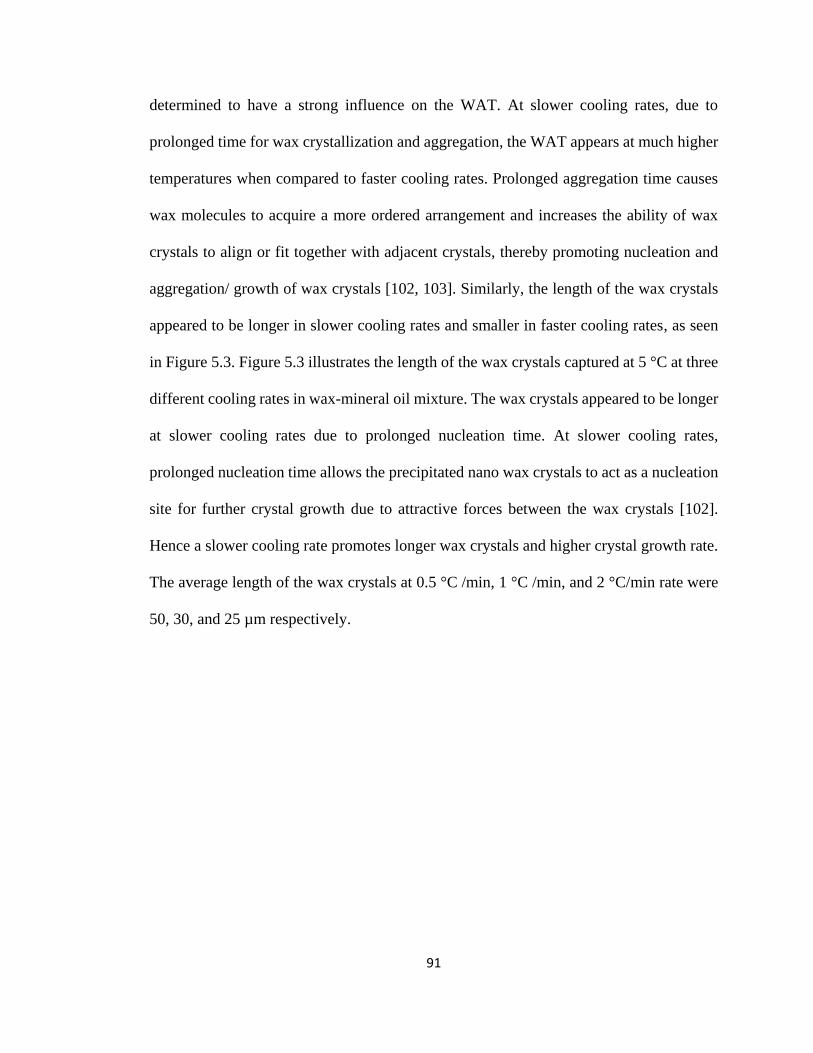
91
determined to have a strong influence on the WAT. At slower cooling rates, due to
prolonged time for wax crystallization and aggregation, the WAT appears at much higher
temperatures when compared to faster cooling rates. Prolonged aggregation time causes
wax molecules to acquire a more ordered arrangement and increases the ability of wax
crystals to align or fit together with adjacent crystals, thereby promoting nucleation and
aggregation/ growth of wax crystals [102, 103]. Similarly, the length of the wax crystals
appeared to be longer in slower cooling rates and smaller in faster cooling rates, as seen
in Figure 5.3. Figure 5.3 illustrates the length of the wax crystals captured at 5 °C at three
different cooling rates in wax-mineral oil mixture. The wax crystals appeared to be longer
at slower cooling rates due to prolonged nucleation time. At slower cooling rates,
prolonged nucleation time allows the precipitated nano wax crystals to act as a nucleation
site for further crystal growth due to attractive forces between the wax crystals [102].
Hence a slower cooling rate promotes longer wax crystals and higher crystal growth rate.
The average length of the wax crystals at 0.5 °C /min, 1 °C /min, and 2 °C/min rate were
50, 30, and 25 µm respectively.

92
Figure 5.4: Wax crystal morphology of 1.25 wt.% wax and 5 wt.% wax in mineral oil
system captured using cross-polarized optical microscope at 5 °C at three different cooling
rates i) 0.5 °C/min ii) 1 °C/min iii) 2 °C/min. The scale bar indicates 100 µm.
WAT was also measured for the oil phase containing mineral oil-wax-
cyclopentane mixture at different cooling rates. As seen in Table 5.2, the addition of

93
cyclopentane to the oil phase was observed to lower the WAT (when compared to the pure
mineral oil-wax system) by 1 °C in 1.25 wt.% wax system, and by 7-8 °C in 5 wt.% wax
system at all cooling rates. Since the wax molecule primarily consists of long chain
hydrocarbon molecules (n-paraffin’s), the presence of cyclic compounds and any
associated side branches is known to build into the wax crystals, thereby solubilizing some
of the hydrocarbon chains in the wax molecules and lowering the WAT. The presence of
cyclopentane in the waxy oil phase showed efficiency in reducing the WAT and presented
a synergistic effect with a wax inhibitor (primary role of a wax inhibitor is to cause
depression of WAT thereby delaying wax precipitation and plugging). Several studies
have also shown that high concentrations of cyclic compounds introduce significant
structural disorientation by solubilizing some of the carbon chains in the wax structure
and lowering the cloud point [55, 104, 105]. As seen in this work, the addition of
cyclopentane was observed to delay the aggregation of wax crystals, thereby resulting in
smaller wax crystals and lower WAT irrespective of the cooling rate and wax
concentration. Similar observations were seen in other studies in which the presence of
asphaltene and other aromatic compounds had a strong impact on the WAT and crystal
size [106]. The addition of a stabilizing agent such as a surfactant (Span 80) to the wax-
oil-cyclopentane mixture was observed to have minimal impact on WAT when compared
to WAT of wax-oil-cyclopentane mixture at all cooling rates and wax concentrations
except for 0.5 °C/min (Table 5.2). At the slowest rate, the WAT appeared to be lowered
by 1 °C in the presence of a surfactant. Similar observations on the wax crystal size were
seen in the oil-wax-cyclopentane mixture when compared to the wax-mineral oil mixture.

94
However, no noticeable difference in the wax crystal size was seen in the presence of a
surfactant to the wax-oil-cyclopentane mixture.
5.3.2. Effect of wax concentration and cooling rates on hydrate formation
5.3.2.1 Surfactant-free case
Single water drop hydrate formation experiments were conducted in an oil phase
containing no surfactant. For this study, hydrate formation experiments were carried out
in the oil phase containing: 1.25 wt.% wax- 23.75 wt.% oil- 75 wt.% cyclopentane, and 5
wt.% wax- 20 wt.% oil-75 wt.% cyclopentane. Along with these systems, control
experiments were conducted in pure cyclopentane and 25 wt.% oil-75 wt.% cyclopentane
mixture to evaluate the effect of wax and the oil continuous phase on hydrate formation.
All the control sample experiments were conducted at a constant heating and cooling rate
of 2 °C/min. Figure 5.5 illustrates hydrate formation in a pure cyclopentane – water
system. Hydrate formation was observed to occur simultaneously upon ice melting and
instantaneously on the availability of free liquid water. Figure 5.5 represents the hydrate
morphology and changes occurring at the oil-water interface and the interior of the water
droplet at different time intervals. The three step hydrate formation mechanism [a) hydrate
nucleation b) lateral growth c) radial growth] was observed along with the time required
for complete conversion of water droplet to hydrates through visual observation. For this
work, what is considered as complete conversion is based on visual observation from two-
dimensional image. No quantification in terms of percent mass converted to hydrates was
conducted, and therefore it can’t be qualitatively confirmed whether complete conversion

95
was achieved in a three dimensional aspect. In the presence of pure cyclopentane, the time
required for complete conversion was approximately 27 minutes.
Figure 5.5: Single water drop hydrate formation in control sample containing pure
cyclopentane. The scale bar represents 100 µm.
A similar experiment was conducted on the control sample with oil phase
composition consisting of 25 wt.% mineral oil and 75 wt.% cyclopentane. Figure 5.6
represents the morphological changes occurring during hydrate formation and the time
required for complete conversion. For mineral oil- cyclopentane mixture, the time
required for hydrate conversion was 33% more than the time required in pure
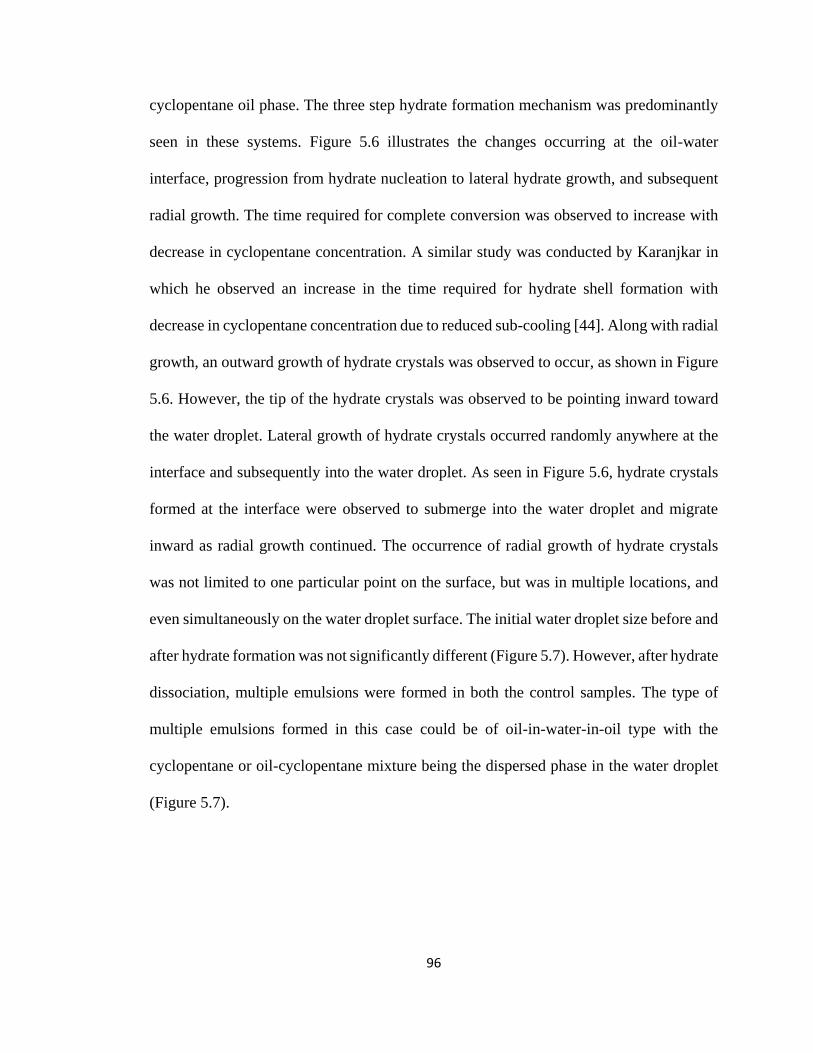
96
cyclopentane oil phase. The three step hydrate formation mechanism was predominantly
seen in these systems. Figure 5.6 illustrates the changes occurring at the oil-water
interface, progression from hydrate nucleation to lateral hydrate growth, and subsequent
radial growth. The time required for complete conversion was observed to increase with
decrease in cyclopentane concentration. A similar study was conducted by Karanjkar in
which he observed an increase in the time required for hydrate shell formation with
decrease in cyclopentane concentration due to reduced sub-cooling [44]. Along with radial
growth, an outward growth of hydrate crystals was observed to occur, as shown in Figure
5.6. However, the tip of the hydrate crystals was observed to be pointing inward toward
the water droplet. Lateral growth of hydrate crystals occurred randomly anywhere at the
interface and subsequently into the water droplet. As seen in Figure 5.6, hydrate crystals
formed at the interface were observed to submerge into the water droplet and migrate
inward as radial growth continued. The occurrence of radial growth of hydrate crystals
was not limited to one particular point on the surface, but was in multiple locations, and
even simultaneously on the water droplet surface. The initial water droplet size before and
after hydrate formation was not significantly different (Figure 5.7). However, after hydrate
dissociation, multiple emulsions were formed in both the control samples. The type of
multiple emulsions formed in this case could be of oil-in-water-in-oil type with the
cyclopentane or oil-cyclopentane mixture being the dispersed phase in the water droplet
(Figure 5.7).

97
Figure 5.6: Images of control sample containing 25 wt.% mineral oil and 75 wt.%
cyclopentane. The scale bar represents 100 µm.

98
Figure 5.7: Initial emulsion droplet size, droplet size before and after hydrate formation,
multiple emulsion formation upon hydrate dissociation. The scale bar represents 100 µm.
The effect of wax on hydrate formation is shown in Figure 5.8. Figure 5.8
represents hydrate formation in 1.25 wt.% wax system at constant heating and cooling rate
of 2 °C/min. The hydrate formation mechanism in a waxy oil system was found to be
identical to hydrate formation in a pure cyclopentane or oil-cyclopentane mixture, except
that in waxy oil systems, wax precipitation and formation of a gel-like network around the
water droplet occurs prior to hydrate formation. During the cooling cycle, wax precipitates
out of the solution and remains suspended in the oil. With further decrease in the
temperature, the precipitated wax crystals were observed to aggregate to form an ordered
arrangement of wax crystals forming a gel-like network. The gel-like network was
observed to entrap the water molecule and act as a barrier for cyclopentane to diffuse into
the water molecule. As seen in Figure 5.8, hydrate nucleation was observed to occur
simultaneously along with ice melting. However, the wax crystals around the water
droplet were identified to delay the time required for complete hydrate conversion. As
indicated in Figure 5.8, the time required for complete conversion was approximately 52
minutes. The time required for complete conversion in 1.25 wt.% wax system at 2 °C/min

99
cooling rate was observed to be 92.6%, and 31% more than the time required for hydrate
formation in pure cyclopentane, and mineral oil-cyclopentane mixture respectively
(Figures 5.5, 5.6, and 5.8).
Figure 5.8: Time required for complete conversion for 1.25 wt.% wax system containing
mineral oil and cyclopentane at 2 °C/min rate. The scale bar represents 100 µm.
Comparing the hydrate formation in waxy oil and non-waxy oil systems, though
hydrate nucleation occurs randomly and instantaneously on the availability of free water
from ice melting in both these systems, the time required for lateral growth and complete
surface coverage with hydrate crystals and subsequent radial growth was further extended
in the presence of wax (Figures 5.5, 5.6, and 5.8). The aggregation of wax crystals at the

100
interface and the presence of a network or chain-like structure around the water droplet
are hypothesized to minimize the interfacial area available for transport of hydrate forming
moleculue (cyclopentane) into the water droplet. Hence, wax acts as a barrier for
cyclopentante transport and enhance the diffusion resistance for hydrate formation.
A similar experiment was conducted on 1.25 wt.% wax system at varying heating
and cooling rates (1 °C/min and 0.5 °C/min) to evaluate its effect on hydrate formation
and time required for complete conversion. Figures 5.9 and 5.10 show the evolution of
hydrate formation from ice melting to complete conversion at 1 °C/min, and 0.5 °C/min
cooling rates respectively. The hydrate formation mechanism was observed to be identical
in all the systems (three different cooling rates), but differences exist in the time required
for complete conversion. For a 1.25 wt.% wax system, the time required for complete
conversion was 96 minutes, and 129 minutes at 1 °C/min, and 0.5 °C/min, respectively.
The time required for complete conversion at 1 °C/min, and 0.5 °C/min cooling rate were
85%, and 148% more than the time required at 2 °C/min rate, respectively. The
progression from hydrate nucleation to lateral and radial growth (in terms of time required
for conversion) was found to be slower and more prolonged with a slower cooling rate
due to precipitation of elongated wax crystals at the slower cooling rate (Figure 5.4). Wax
crystals precipitated out of solution at slower cooling rates were observed to be longer,
yielding to a strong and interconnected network of wax crystals at the oil-water and
thereby reducing the interfacial area for diffusion of cyclopentane into water.

101
Figure 5.9: Hydrate formation in 1.25 wt.% wax system at constant heating and cooling
rate of 1 °C/min at different time intervals. The scale bar represents 100 µm.

102
Figure 5.10: Hydrate formation in 1.25 wt.% wax system at constant heating and cooling
rate of 0.5 °C/min at different time intervals.
Another hydrate formation experiment was conducted on 5 wt.% wax-20 wt.%
mineral oil-75 wt.% cyclopentane mixture to evaluate the effect of wax concertation on
hydrate formation. Figure 5.11 shows the evolution of water droplets toward complete
conversion into hydrates at different time intervals at a constant heating and cooling rate
of 2 °C/min. Comparing the 1.25 wt.% wax and 5 wt.% wax systems at 2 °C/min rate, the
average time required for complete conversion was found to increase with increase in wax
concentration (Figures 5.5, 5.11). The time required for completion conversion for the
sample shown in Figure 5.11 was 94 minutes. The time required for complete conversion

103
for 5 wt.% wax system at 2 °C/min rate was 3.5 times, and 2.6 times the conversion time
required in pure cyclopentane and mineral oil-cyclopentane samples, respectively (Table
5.3, and Table 5.4). For 5 wt.% wax system, a four times increase in the wax concentration
yielded 57% increase in the average time for complete conversion when compared to 1.25
wt.% wax system (Table 5.4).
Figure 5.11: Hydrate formation in 5 wt.% wax system at constant heating and cooling
rate of 2 °C/min at different time intervals. The scale bar represents 100 µm.

104
Table 5.3 represents the time required for complete conversion in control samples
at a constant cooling rate of 2 °C/min , whereas Table 5.4 summarizes the effect of cooling
rate and wax concentration on the time required for complete conversion. The data
represented in Table 5.3 and Table 5.4 are an average of three independent measurements.
As seen in Table 5.4, an increase in wax concentration resulted in an increase in time
required for complete conversion. However, the trend was not identical at the slowest
cooling rate for the 1.25 wt.% and 5 wt.% wax systems. Comparing the hydrate conversion
time between 1.25 wt.% wax and 5 wt.% wax systems, a four times increase in the wax
concentration (in 5 wt.% wax system) yielded a 30-minute increase in the time required
for conversion at 2 °C/min rate. A 10-minute increase was seen at 1 °C/min, and on the
contrary, a 10-minute decrease was seen at 0.5 °C/min cooling rate. The addition of 1.25
wt.% wax to the mineral oil-cyclopentane mixture resulted in an increase in the hydrate
conversion time by 3.5, 2.6, and 1.5 times when compared to the mineral oil-cyclopentane
mixture at 2 °C/min, 1 °C/min, and 0.5 °C/min rates, respectively. A 5% increase in the
wax concentration to the mineral oil-cyclopentane mixture resulted in a 3.2, 3, and 2.2
times increase in the hydrate conversion time at 2 °C/min, 1 °C/min, and 0.5 °C/min rates,
respectively.

105
Table 5.3: Summary of the average time required for visual observation of complete
conversion of water droplet into hydrates in “surfactant-free” and “with surfactant”
control samples at constant heating and cooling rate of 2 °C/min
Sample
Time for visual observation of
complete conversion at 2 °C/min
cooling rate (minutes)
Pure cyclopentane (100%) 27 mins
25 wt.% mineral oil+75 wt.% cyclopentane 36 mins
0.1 wt.% Span80+24.9 wt.% mineral oil+75
wt.% cyclopentane
16 mins
Table 5.4: Summary of the average time required for visual observation of complete
conversion of water droplet to hydrates at various wax concentrations and heating/ cooling
rates
Sample
Time for visual observation of
complete conversion at different
cooling rates (minutes)
0.5
(°C/min)
1
(°C/min)
2
(°C/min)
1.25wt.%Wax+23.75wt.% Mineral
Oil+75wt.% Cyclopentane 129.25 96.73 52.80
5wt.% Wax+20wt.% Mineral Oil+ 75wt.%
Cyclopentane 116.53 108.76 82.25
1.25wt.% Wax+0.1wt.% Span80+23.75wt.%
Mineral Oil+ 75wt.% Cyclopentane 24.53 19.53 18.25
5wt.% Wax+0.1wt.% Span80+20wt.%
Mineral Oil+75 wt.% Cyclopentane 23.27 21.00 22.50
5.3.2.2 Surfactant-containing systems
To evaluate the effect of oil soluble surfactant such as Span 80 on hydrate
formation, a control sample containing 0.1 wt.% Span 80, 24.9 wt.% mineral oil, and 75
wt.% cyclopentane was prepared. As shown in Table 5.3, addition of surfactant (0.1 wt.%
increase in span80 concentration) to the mineral oil-cyclopentane mixture resulted in a

106
55% decrease in the time required for complete conversion. A reduction in the conversion
time was expected, as surfactant reduces the surface tension, thereby promoting the
diffusion of cyclopentane into water molecules. The process leading to hydrate formation
in surfactant stabilized system was identical to the surfactant-free case and involved the
three-step mechanism: hydrate nucleation, lateral growth, and radial growth. The only
difference in these two systems was that the time required for complete conversion was
significantly reduced in the presence of surfactant, thereby shortening the time interval
between hydrate nucleation to radial growth. Figure 5.12 represents the time required for
complete conversion of water droplets to hydrates at different time intervals in the
presence of surfactant in a 1.25 wt.% wax system. As seen in Figure 5.12, hydrate
nucleation occurred instantaneously on the availability of free water. However, the time
required for progression from lateral growth to radial growth in a surfactant stabilized
system was significantly reduced by at-least 65% - 80% at all cooling rates when
compared to surfactant free systems. At 2 °C/min cooling rate, a 1.25 wt.% increase in the
wax concentration to the surfactant-oil-cyclopentane mixture was observed to increase the
hydrate conversion time by 14% when compared to the control system containing
surfactant (Table 5.3, and Table 5.4). Decrease in the cooling rate was observed to have a
significant increase in the time required for complete conversion from 14% to 53% when
compared to the surfactant control sample. However, for the surfactant stabilized 1.25
wt.% wax system, the hydrate conversion time was 7%, and 34% higher at 1 °C/min, and
0.5 °C/min, respectively, when compared to the fastest cooling rate (2 °C/min). A
minimum of 65% - 80% decrease in the hydrate conversion time was observed in the
presence of surfactant in the 1.25 wt.% wax-oil-cyclopentane mixture at different cooling

107
rates when compared to its corresponding surfactant free system. Whereas, a 73% - 80%
decrease in the hydrate conversion time was observed with the addition of 0.1 wt.%
surfactant to 5 wt.% wax-oil-cyclopentane mixture. An increase in the wax concentration
was shown to have minimal impact on the hydrate conversion time.
Figure 5.13 represents the trend followed by the different systems on hydrate
conversion as a function of cooling rate. An increase in the hydrate conversion time was
observed with a decrease in the cooling rate for all samples, but the increase in conversion
time was not significant in surfactant stabilized systems when compared to a surfactant
free system. Though the trend followed by surfactant stabilized systems on hydrate
conversion was identical to surfactant free systems, the difference between the conversion
time as a function of wax concentration was not significant as it was in the surfactant-free
case.

108
Figure 5.12: Hydrate formation in 1.25 wt.% wax system with 0.1 wt.% span 80, 23.65
wt.% mineral oil, and 75 wt.% cyclopentane at 2 °C/min heating and cooling rate

109
Figure 5.13: Summary of time required for complete conversion of water droplet to
hydrates through visual observation as function of cooling rates and wax concentrations.
The solid data points indicate control samples
5.3.2.3 Hydrate Formation Mechanism
Figure 5.15 shows the hydrate formation mechanism in waxy oil systems. In waxy oil
systems, in addition to the three step mechanism associated with cyclopentane hydrates,
wax precipitation and aggregation is also involved. The experimental results shown in this
work demonstrated that the presence of wax greatly influenced hydrate formation and time

110
required for complete conversion. Moreover, the factors affecting wax appearance
temperature (WAT), such as wax concentration and cooling rate, were also found to have
a significant impact on hydrate formation. The hydrate formation mechanism in waxy oil
systems can be described in four steps:
a) Wax precipitation around water droplet
A decrease in temperature below the wax appearance temperature (WAT) results in
precipitation of nano wax crystals. The decrease in temperature results in lowering of
molecular motion, and the attractive forces between the crystals increases, thereby
promoting the growth of an ordered network of wax crystals [102, 103]. Wax precipitation
is a two-step mechanism and involves nucleation and growth. A decrease in the solution
temperature causes aggregation of nano wax crystals (also known as nucleation) until the
aggregates/nuclei reach a critical size in order to be visualized and become stable. Nuclei
size begins to increase and growth of wax crystals occur due to attractive forces between
the molecules [102, 103].
b) Hydrate nucleation
Quenching of water drops to form ice and subsequent melting of ice to free liquid
water was demonstrated to initiate hydrate nucleation rather instantaneously and randomly
anywhere at the oil-water interface. The free water available from ice melting was proven
to reduce the stochastic long hydrate nucleation/ induction time that is otherwise
associated with cyclopentane hydrates and promotes hydrate nucleation. A similar hydrate
formation experiment was conducted without quenching the water droplet to form ice.
Hydrate nucleation was not observed despite holding the sample at 0.1 C for several hours.

111
Hence, availability of free water from ice melting due to heat transfer was determined as
the rate limiting step. Though availability of free water promotes hydrate nucleation, the
driving force behind the immiscible cyclopentane oil phase to diffuse into water
contributes significantly towards the overall hydrate formation mechanism. The driving
force behind cyclopentane diffusion into water drop is due to chemical potential difference
between the phases. The driving force for cyclopentane hydrate nucleation is analogous
to that of gas hydrate nucleation. For gas hydrate systems, the difference between the
chemical potential for the old and the new phase acts as the driving force for hydrate
formation [107]. To understand the driving force for gas hydrate formation, Kaschiev
suggested a three-phase system for one component gas at constant temperature and
pressure (Figure 5.14) [107].
(P,T) = const.
Gas µgg
Solution
µhs= µgs +nw µw
Hydrate µh
Figure 5.14: Three phase system used for describing the driving force required for hydrate
formation at constant temperature (T) and pressure (P) [107].
µµnewµold = µhs - µh Eq. 5.1
G+nwH2O G.nwH2O Eq. 5.2
µhs = µgs +nw µw Eq. 5.3
µµhsµh = µgs +nw µw - µh Eq. 5.4

112
At constant temperature T, and pressure P, the hydrate phase reaction occurring in
solution is expressed as given in Eq. 5.2. According to the thermodynamic relation
between chemical potentials in equilibria, the chemical potential of the hydrate building
unit in solution (µhs) is given in Eq. 5.3. The difference in the chemical potential, Δµ (also
known as supersaturation) is the driving force for hydrate nucleation. Supersaturation (Δµ)
is defined as chemical potential difference between the hydrate phase in solution (Δµhs),
and hydrates (Δµh). Hydrate nucleation and crystal growth occurs until the system is
supersaturated (Δµ > 0), indicating that the chemical potential of the old phase is greater
than the new phase. In other terms, diffusion of hydrate-forming guest molecule into water
occurs rapidly as long as the chemical potential of the guest molecule in the oil phase is
greater than that in the aqueous phase. Once the system reaches equilibrium, diffusion
doesn’t occur any further (Δµ= 0, system is saturated). Diffusion and hydrate nucleation
ceases completely, and instead hydrate dissolution starts to occur when Δµ <0
(undersaturated) [107].
c) Lateral growth
The nucleation of hydrate crystals at the interface further promotes the growth of
hydrate crystals around the surface of the water droplet until the entire surface is covered
with hydrate crystals. Figure 5.15 shows hydrate nucleation at the oil-water interface and
the progression from hydrate nucleation to lateral growth where the entire surface of the
water droplet is covered with hydrate crystals. In the presence of wax in the oil phase, a
layer of wax crystals is formed at the interface and an interconnected or gel-like network
exists around the water droplet. Wax crystals at the interface act as a barrier, thereby
minimizing the interfacial area available for direct contact between the two immiscible

113
phases, and further elongating the time required for progression from hydrate nucleation
to lateral growth. Wax crystals precipitated at the interface are dependent on the cooling
rate and wax concentration. Wax enhances the diffusion resistance of cyclopentane
transport to the bulk water phase and delays hydrate growth rate.
d) Radial growth
In waxy oil systems, progression from lateral growth/ complete surface coverage to
radial growth is governed by mass transfer or diffusion of cyclopentane through the layer
of wax crystals around the water droplet and through the hydrate shell formed during
lateral growth. Thus, wax concentration, cooling rate, and diffusion determine the rate of
radial growth.
Figure 5.15: Hydrate formation mechanism in waxy oil systems. The water droplet is
suspended in an oil phase containing either 1.25 or 5 wt.% wax in 1:3 ratio of mineral oil
and cyclopentane on a weight basis.

114
The hydrate formation mechanism in waxy oil systems as described above can be
primarily classified as a thermodynamically driven process until ice dissociation and
hydrate nucleation occurs, following which kinetics dominates the formation mechanism.
Though the formation mechanism in the presence of wax is identical to gas hydrate
formation, the presence of wax was observed to enhance the diffusion resistance of
hydrate formation. In the absence of a surfactant, the high interfacial tension between oil-
water interface along with the diffusion barrier created by wax crystals, reduces the rate
of cyclopentane transport from the oil phase to the bulk water phase thereby resulting in
slower hydrate growth rate. In the presence of a surfactant, the progression from lateral
growth to radial growth is much faster when compared to the surfactant-free case, owing
to a reduction in the interfacial tension.
Severel studies have shown that surfactants greatly enhance the kinetics of hydrate
formation by increasing the solubility of the hydrate forming guest molecule in the
aqueous phase [108-113]. Increase in the solubility results in a decrease in the time
required for the chemical potential difference (driving force for hydrate formation) to
reach equilibrium (saturation). Surfactant molecules were observed to not only increase
the solubility of hydrocarbon gas in the aqueous phase but also acts as a nucleating site,
inducing the formation of hydrate crystals around the micelles [109]. However, several
studies have shown that micelle formation is not responsible for faster hydrate growth rate
as hydrate formation occurs at temperature below the Krafft point of the surfactant [112-
114]. Studies have shown that the presence of micelles accelerate the hydrate growth rate
by reducing the hydrate nucleation barrier (presence of surfactant results in lower
induction time). Additionally it was observed that surfactants do not influence the

115
thermodynamic phase boundary as the surfactant molecules do not participate in hydrate
formation. For this study, the surfactant concentration (0.1 wt.% of the oil phase) was
above the critical micelle concentration (CMC) indicating the prence of micelles in the oil
phase. Studies have shown that along with increase in the solubility of hydrate forming
guest molecule, lower interfacial tension due to the presence of surfactants, favorably
affects hydrate formation rate by enhancing the mass transfer and diffusion of hydrate
forming gases to the bulk water [110-112, 115, 116]. Lowering of interfacial tension is
also seen to significantly change the hydrate morphology resulting in catastrophic hydrate
growth. It has been suggested that this catastrophic growth of hydrates in the presence of
surfactants is probably due to continuous availability of water at the interface.
5.4. Conclusions
The presence of wax in the oil phase was observed to have a significant impact on
the time required for complete conversion. For systems containing no surfactant, wax
concentration, and cooling rate were observed to impact the time required for complete
conversion. While in surfactant stabilized systems, cooling rate, and wax concentration
didn’t have a significantly strong influence on the hydrate conversion time. The addition
of mineral oil to cyclopentane oil phase was found to increase the hydrate conversion time
by 33%, but addition of surfactant to the oil-cyclopentane mixture was found to reduce
the hydrate conversion time by > 50%. Presence of wax in the oil-cyclopentane mixture
was observed to further increase the time required for complete conversion in the
surfactant free case. Hydrate conversion time was identified to increase with slower

116
cooling rate irrespective of the wax concentration in the surfactant free system. Hydrate
formation mechanism in waxy oil systems was hypothesized to be a four step process that
includes: wax precipitation and aggregation, hydrate nucleation, lateral growth, and radial
growth.

117
CHAPTER VI
CONCLUSIONS AND RECOMMENDATIONS
6.1. Significant Contributions
This thesis focuses on the characterization of emulsions and hydrates in waxy oil
systems. A novel experimental method for characterizing hydrate formation with and
without surfactant as a function of wax concentration (1.25 and 5 wt.% wax) and cooling
rates (0.5, 1, and 2 °C/min) is presented. A direct visualization of hydrate growth in a
single water drop suspended in the waxy oil phase is introduced in this thesis that can be
used to visualize the changes occurring in the system when hydrates and wax occur
simultaneously. The visualization experiment provided a fundamental understanding of
the hydrate formation mechanism in the presence of wax and the effect of surfactant, wax
concentration, and cooling rates on hydrate formation. The presence of wax in the oil
phase was observed to enhance the diffusion resistance for cyclopentane transport from
the oil phase to the bulk water phase. The presence of surfactant in the oil phase (waxy oil
continuous phase) was observed to accelerate the hydrate formtion rate by a factor of 2.5-
5.3 when compared to the surfactant free waxy oil system. In surfactant containing
systems, wax concentration and cooling rates were observed to have a minimal impact on

118
hydrate conversion time. Similar observations were not seen in the surfactant-free
systems. In surfactant free systems, the slower cooling rate was identified to increase the
hydrate conversion time. However, faster cooling rates resulted in a decrease in the
hydrate conversion time. Precipitation of longer/ elongated wax crystals and formation of
an inter-connected network of wax crystals at slower cooling rates were considered to
minimize the contact area available between oil and water thereby delaying hydrate
formation. A four step hydrate formation mechanism in waxy oil systems (wax
precipitation, hydrate nucleation, lateral growth, and radial growth) was postulated based
on the experimental data. The presence of wax was observed to delay the rate of diffusion
of cyclopentane due to the chemical potential difference between cyclopentane in the oil
phase and aqueous phase (driving force for hydrate formation), high interfacial tension,
and diffusion resistance. On the contrary, surfactant reduced the diffusion resistance of
cyclopentane transport across the oil/water interface, thereby promoting hydrate growth.
An in-situ, hydrate formation experimental method was developed using a visualization
technique. The experimental method enabled direct visualization of changes occurring in
the emulsion upon ice dissociation, hydrate formation, and hydrate dissociation. Ice
melting and hydrate formation were observed to occur simultaneously. Hydrate crystals
were observed to form at the oil-water interface and in-situ conversion of water droplets
to hydrates were also captured using this method. An irreversible formation of multiple
emulsions was observed upon hydrate dissociation.
This thesis provides a fundamental understanding of concentrated emulsion
characterization at both quiescent and flowing conditions. Data are presented on
concentrated emulsion characterization using several experimental techniques such as

119
inflow microscope, acoustic spectroscopy, and optical microscopy. The experimental
results from each of these techniques were validated with other techniques used for
emulsion characterization. A flow loop setup equipped with an inflow microscope was
used for characterizing model water-in-oil emulsions. The effect of water cut (5, 10, and
20 vol.%), stabilizer type (span 80 and aerosol R972), temperature (25 °C and 15 °C), and
flow rate (3.3 gpm, 6.6 gpm and 8.3 gpm) on emulsion properties and droplet size
distribution were measured. This work showed that the drop size distribution was a
function of temperature, water concentration, and flow rate for surfactant stabilized
emulsions. The solid stabilized emulsions indicated that only water concentration had an
overall impact on the drop size distributions.
Water-in-oil emulsions with a dispersed phase fraction equal to 15 wt.% were
prepared using either a non-ionic surfactant or solid hydrophobic nanoparticles under
identical conditions of high energy mixing. Acoustic spectroscopy measurements were
carried out on these emulsions to determine the initial droplet size distributions and their
evolution over a period of one week. Transient stability, solution conductivity, and surface
charge measurements were conducted in parallel to compare the behavior of surfactant
and solid particles at the oil-water interface. Coalescence of solid-stabilized emulsions led
to broad droplet size distributions with larger droplets when compared to surfactant-
stabilized emulsions. Incomplete surface coverage by solid particles resulted in the
emulsions being unstable against coalescence, thereby shifting the distribution towards
larger droplet size. This behavior was captured by acoustic spectroscopy in terms of
change in the raw experimental attenuation, colloidal vibration current, and conductivity
measurements at different time intervals. Conductivity measurements in solid stabilized

120
emulsions showed that with time, counter-ions from water droplets were released into the
continuous oil phase, thereby increasing the conductivity of the emulsions.
Complimentary bottle test and optical microscopy experiments were conducted on these
emulsions to validate the droplet size distribution and transient behavior of emulsions
measured using acoustic spectroscopy.
6.2. Future Work
Experimental investigations of hydrate formation in waxy oil systems were
conducted in a small-scale laboratory setup. Single drop hydrate formation experiments
were performed at various wax concentrations (1.25 and 5 wt.% wax) and cooling rates
(0.5, 1, and 2 °C/min). The next step would be to interrogate the hydrate formation
mechanism in waxy oil systems in the presence of multiple water droplets in the form of
an emulsion. This work will be significant as oilfield emulsions are commonly
encountered at high water concentrations, and it is imperative to develop experimental
results that have direct applications for field study. Further experimental investigation on
hydrate formation in waxy oil emulsions in flowing conditions would provide an insight
into the flow behavior of hydrate forming emulsions in the presence of wax and stabilizing
agents such as a surfactant. This work would lead to an understanding of multiphase fluid
flow behavior due to hydrates, wax, and emulsions, thus paving a way to develop better
economically feasible flow assurance remediation strategies for a wide variety of
industrial applications.
Preliminary experimental work was conducted using optical microscopy to
investigate hydrate formation in model waxy oil emulsions at various water

121
concentrations. For this work, hydrate-forming water-in-oil emulsions were prepared
using paraffin wax, surfactant (span 80), cyclopentane, light mineral oil, and deionized
water. An oil phase composition was prepared with a 50:50 mixture of light mineral oil
and cyclopentane on an equal weight basis. Light mineral oil purchased from Sigma-
Aldrich was used as model mineral oil. 95% purity cyclopentane purchased from Alfa
Aesar was used as the hydrate forming liquid molecule. An oil soluble non-ionic surfactant
such as Span 80 was used as the stabilizing agent. For all the systems, the surfactant
concentration was kept constant at 0.1 wt.%. Model paraffin wax with a melting point of
58-62 °C was purchased from Sigma-Aldrich. The wax concertation was kept constant at
1.25 wt.% for all the systems. A low wax concentration was chosen for this study in order
to avoid phase separation issues at low temperatures and at high water concentration
systems. Hydrate forming water-in-oil emulsions were prepared at 5, 10, 20, 30, and 40
wt.% water concentrations. For 40 wt.% water-in-oil emulsion, an oil phase was prepared
with 0.1 wt.% span80, 1.25 wt.% wax, and 58.65 wt.% of model mineral oil-cyclopentane
mixture on 50:50 equal weight basis. For this work, 100 g basis of the sample was used.
For preparing 100 g of a water-in-oil emulsion, an oil phase was prepared by heating
29.325 wt.% mineral oil and 1.25 wt.% wax mixture to 100 °C for 24 hours to ensure
complete wax dissolution and erase any thermal history. The sample was heated on a stir/
hot plate using a 1” long stir bar at 600 rpm. The sample temperature was reduced to 40
°C prior to adding 29.325 wt.% cyclopentane and 0.1 wt.% span 80. The oil phase was
stirred using an Ultra Turrax T25 homogenizer at 2800 rpm for one minute prior to adding
the dispersed phase. 40 wt.% of water was added dropwise to the oil mixture and the
sample was prepared using the homogenizer at 8000 rpm, for 20 mins. The sample was

122
immediately placed in the chiller previously set to 0.1 °C. Figure 6.1 illustrates the chiller
setup used for this work. After placing the sample in the chiller, it was constantly stirred
using a homogenizer set at 3000 rpm to ensure mixing of the sample during hydrate
formation. The sample temperature was measured periodically, and once the sample
temperature reached approximately 1-2 °C, the sample was seeded using ice crystals. It
took about 2 hours to reach this temperature after placing it in the chiller. A small quantity
(less than one spatula full) of ice crystals were added to the sample and stirred well before
placing it back into the chiller. The sample was constantly stirred after seeding. Within 2-
3 hours after seeding, the entire sample was converted into hydrates. Hydrate formation
was confirmed, as the sample turned into a solid-like structure and didn’t flow (Figure
6.2). After hydrate formation, the sample was kept at room temperature to investigate the
effect of hydrate formation on emulsion droplet size distribution and its stability (Figure
6.3). Phase separation was observed in this sample upon hydrate dissociation (Figures 6.3,
and 6.4). A small amount of the sample from the emulsion layer in the phase separated
sample was used to measure the emulsion droplet size upon hydrate dissociation (Figure
6.4). A significant increase in the emulsion droplet size and distribution was observed
after hydrate dissociation when compared to the initial emulsion droplet size.
Simultaneously, an emulsion stability test was conducted to evaluate any changes in the
emulsion droplet size over the course of the experiment (Figure 6.5). A transient stability
test indicated no significant changes in the emulsion droplet size and distribution.

123
Figure 6.1: Experimental setup of the chiller used for carrying out hydrate formation
experiment in waxy oil systems
Figure 6.2: Visual confirmation of hydrate formation in 40 wt.% water-in-oil emulsion
containing wax and surfactant in the oil phase

124
Figure 6.3: Evolution of sample from emulsification to hydrate formation, and to hydrate
dissociation
Figure 6.4: Emulsion after hydrate dissociation and microscope image of the sample
taken from the emulsion layer of the sample subjected to hydrate formation. The scale bar
represents 50 µm

125
Figure 6.5: Transient stability microscope images of the 40 wt.% water-in-oil emulsion
used for hydrate studied in waxy oil systems. A) image of the emulsion sample at 0th hour
(immediately after emulsification) b) image of the sample after 6 hours of emulsification.
The scale bar represents 100 µm
A comparable experiment was conducted at 30, 20, 10, and 5 wt.% water
concentrations. Hydrates were observed to form at 30 and 20 wt.% water concentrations.
However, hydrate formation was not observed in 5 and 10 wt.% water concentrations,
even after 12 hours of seeding. The next step forward would be to conduct in-situ hydrate
formation in waxy oil emulsions using an optical microscope. A similar experimental
procedure, as discussed in Chapter IV, can be used to investigate the changes in the
emulsion properties and oil-water interface upon hydrate formation and dissociation. In
order to correlate the experimental work discussed above to real world systems, a flow
loop setup can be used to interrogate the multiphase fluid flow behavior in the presence
of hydrates and wax. The flow loop setup discussed in Chapter III was redesigned and
rebuilt into a horizontal setup. The modification to the experimental design was carried
out in order to avoid any changes to the fluid property with change in the pipe orientation,
and also to enable the use of hazardous chemicals such as crude oil and flammable
materials. Consequently, the vertical flow loop setup discussed in Chapter III was

126
redesigned as shown in Figure 6.6. The new flow loop setup is equipped with pressure
transducers at different locations in the flow loop test section to evaluate pressure changes
along the length of the pipe. Any pressure fluctuations due to hydrate formation or wax
build up can be easily detected using these transducers. This setup would also enable
pressure drop calculation between two points in the test section associated with changes
in the fluid property.

127
Figure 6.7: Flow loop setup used for emulsion, hydrates, and wax characterization. The
flow loop setup is equipped with inflow microscope, pressure transducer for measuring
properties under flowing conditions

128
REFERENCES
1. Sjöblom, J., Emulsions and Emulsion Stability. Second ed. 2005: CRC Press.
2. Laurier, L.S., Petroleum Emulsions, in Emulsions. 1992, American Chemical
Society. p. 1-49.
3. Langevin, D., et al., Crude Oil Emulsion Properties and their application to
Heavy Oil Transportation. Oil & Gas Science and Technology - Rev. IFP, 2004.
59(5): p. 511-521.
4. Sjöblom, J., Encyclopedic Handbook of Emulsion Technology, ed. J. Sjöblom.
Vol. 1. 2001, New York: Marcel Decker.
5. Hudson, J.D., et al., Flow Assurance for Subsea Wells. 2000, Offshore
Technology Conference.
6. Kokal, S.L., Crude Oil Emulsions: A State-Of-The-Art Review. Society of
Petroleum Engineers 2004.
7. Dendy Sloan, E.J. Hydrate Engineering. in Society of PEtroleum Engineering.
2000. Richardson, Texas: Society of Petroleum Emgineering.
8. Zerpa, L.E., et al., Surface Chemistry and Gas Hydrates in Flow Assurance.
Industrial & Engineering Chemistry Research, 2010. 50(1): p. 188-197.
9. Sloan, E.D. and C.A. Koh, Clathrate Hydrates of Natural Gases. 2008. 643.
10. Høiland, S., et al., Wettability of Freon hydrates in crude oil/brine emulsions.
Journal of Colloid and Interface Science, 2005. 287(1): p. 217-225.

129
11. Sum, A.K., C.A. Koh, and E.D. Sloan, Clathrate Hydrates: From Laboratory
Science to Engineering Practice. Industrial & Engineering Chemistry Research,
2009. 48(16): p. 7457-7465.
12. Sjöblom, J., et al., Investigation of the Hydrate Plugging and Non-Plugging
Properties of Oils. Journal of Dispersion Science and Technology, 2010. 31(8):
p. 1100-1119.
13. Binks, B.P., ed. Modern Aspects Of Emulsion Science. 1998, The Royal Society
of Chemistry: Cambridge, UK.
14. Bancroft, W.D., The Theory of Emulsification, I. The Journal of Physical
Chemistry, 1911. 16(3): p. 177-233.
15. Bancroft, W.D., The Theory of Emulsification, II. The Journal of Physical
Chemistry, 1911. 16(5): p. 345-372.
16. Bancroft, W.D., The Theory of Emulsification, III. The Journal of Physical
Chemistry, 1911. 16(6): p. 475-512.
17. Bancroft, W.D., The Theory of Emulsification, IV. The Journal of Physical
Chemistry, 1911. 16(9): p. 739-758.
18. Bancroft, W.D., The Theory of Emulsification, V. The Journal of Physical
Chemistry, 1912. 17(6): p. 501-519.
19. Becher, P., Encyclopedia Of Emulsion Technology. Vol. 1. 1983, New York:
Marcel Dekker.
20. Becher, P., Emulsions: Theory And Practice. 2001, Washington D.C: Oxford
University Press.

130
21. Ramsden, W., "Separation of solids in the surface-layers of solutions and
'Suspensions' (Observations on surface-membranes, bubbles, emulsions, and
mechanical coagulation). Preliminary Account.". Proceedings of the Royal
Society of London, 1903. 72(479): p. 156-164.
22. Pickering, S.U., Pickering Emulsions. Journal of Chemical Society, 1907. 91.
23. Binks, B.P. and J.H. Clint, Solid Wettability from Surface Energy Components:
Relevance to Pickering Emulsions. Langmuir, 2002. 18: p. 1270-1273.
24. Finkle, P., H.D. Draper, and J.H. Hildebrand, The Theory of Emulsification I.
Journal of the American Chemical Society, 1923. 45(12): p. 2780-2788.
25. Aveyard, R., B.P. Binks, and J.H. Clint, Emulsions stabilised solely by colloidal
particles. Advances in Colloid and Interface Science, 2003. 100-102: p. 503-546.
26. Binks, B.P. and S.O. Lumsdon, Catastrophic inversion of w/o emuslion
stabilized by hydrophobic silica. Langmuir, 2000. 16: p. 2539-2547.
27. Tambe, D.E. and M.M. Sharma, Factors Controlling the Stability of Colloid-
Stabilized Emulsions: I. An Experimental Investigation. Journal of Colloid and
Interface Science, 1993. 157(1): p. 244-253.
28. Menon, V.B. and D.T. Wasan, Characterization of Oil-Water Interfaces
Containing Finely Divided Solids with Applications to the Coalescence of Water-
in-Oil Emulsion: A review. Colloid and Surfaces, 1988. 29: p. 7-27.
29. Tambe, D.E. and M.M. Sharma, Factors Controlling the Stability of Colloid-
Stabilized Emulsions: II. A Model for the Rheological Properties of Colloid-
Laden Interfaces. Journal of Colloid and Interface Science, 1994. 162(1): p. 1-
10.

131
30. Binks, B.P. and M. Kirkland, Interfacial structure of solid-stabilised emulsions
studied by scanning electron microscopy. Physical Chemistry Chemical Physics,
2002. 4(15): p. 3727-3733.
31. Simon, S., et al., Rheological Properties of Particle-Stabilized Emulsions.
Journal of Dispersion Science and Technology, 2010. 31(5): p. 632-640.
32. Vignati, E., R. Piazza, and T.P. Lockhart, Pickering Emulsions: Interfacial
Tension, Colloidal Layer Morphology, and Trapped-Particle Motion. Langmuir,
2003. 19(17): p. 6650-6656.
33. Fan, H. and A. Striolo, Nanoparticle effects on the water-oil interfacial tension.
Physical Review E, 2012. 86(5).
34. Sullivan, A.P. and P.K. Kilpatrick, The Effects of Inorganic Solid Particles on
Water and Crude Oil Emulsion Stability. Industrial & Engineering Chemistry
Research, 2002. 41(14): p. 3389-3404.
35. Hannisdal, A., et al., Particle-stabilized emulsions: Effect of heavy crude oil
components pre-adsorbed onto stabilizing solids. Colloids and Surfaces A:
Physicochemical and Engineering Aspects, 2006. 276(1–3): p. 45-58.
36. Englezos, P., Clathrate hydrates. Industrial & Engineering Chemistry Research,
1993. 32(7): p. 1251-1274.
37. Sloan Jr, E.D. and C. Koh, Clathrate hydrates of natural gases. 2007: CRC
press.
38. Li, X., L. Negadi, and A. Firoozabadi, Anti-agglomeration in Cyclopentane
Hydrates from Bio- and Co-surfactants. Energy & Fuels, 2010. 24(9): p. 4937-
4943.

132
39. Aman, Z.M., et al., Interfacial mechanisms governing cyclopentane clathrate
hydrate adhesion/cohesion. Physical Chemistry Chemical Physics, 2011. 13(44):
p. 19796-19806.
40. Dieker, L.E., Cyclopentane hydrate interparticle adhesion force measurements.
2009, Colorado School of Mines.
41. Mitarai, M., et al., Surfactant Effects on the Crystal Growth of Clathrate Hydrate
at the Interface of Water and Hydrophobic-Guest Liquid. Crystal Growth &
Design, 2015. 15(2): p. 812-821.
42. Ahuja, A., G. Zylyftari, and J.F. Morris, Calorimetric and Rheological Studies
on Cyclopentane Hydrate-Forming Water-in-Kerosene Emulsions. Journal of
Chemical & Engineering Data, 2015. 60(2): p. 362-368.
43. Karanjkar, P.U., J.W. Lee, and J.F. Morris, Calorimetric investigation of
cyclopentane hydrate formation in an emulsion. Chemical Engineering Science,
2012. 68(1): p. 481-491.
44. Karanjkar, P.U., Evolving morphology and rheological properties of an emulsion
undergoing clathrate hydrate formation, in Chemical Enginnering 2012, City
University of New York: New York.
45. Ahuja, A., G. Zylyftari, and J.F. Morris, Yield stress measurements of
cyclopentane hydrate slurry. Journal of Non-Newtonian Fluid Mechanics, 2015.
220: p. 116-125.
46. Zylyftari, G., A. Ahuja, and J.F. Morris, Nucleation of cyclopentane hydrate by
ice studied by morphology and rheology. Chemical Engineering Science, 2014.
116: p. 497-507.

133
47. Zylyftari, G., A. Ahuja, and J.F. Morris, Modeling Oilfield Emulsions:
Comparison of Cyclopentane Hydrate and Ice. Energy & Fuels, 2015.
48. Dirdal, E.G., et al., Can cyclopentane hydrate formation be used to rank the
performance of kinetic hydrate inhibitors? Chemical Engineering Science, 2012.
82: p. 177-184.
49. Nicholas, J.W., et al., Assessing the feasibility of hydrate deposition on pipeline
walls—Adhesion force measurements of clathrate hydrate particles on carbon
steel. Journal of Colloid and Interface Science, 2009. 331(2): p. 322-328.
50. Nakajima, M., R. Ohmura, and Y.H. Mori, Clathrate Hydrate Formation from
Cyclopentane-in-Water Emulsions. Industrial & Engineering Chemistry
Research, 2008. 47(22): p. 8933-8939.
51. Wardhaugh, L. and D. Boger, Flow characteristics of waxy crude oils:
application to pipeline design. AIChE Journal, 1991. 37(6): p. 871-885.
52. Aiyejina, A., et al., Wax formation in oil pipelines: A critical review.
International Journal of Multiphase Flow, 2011. 37(7): p. 671-694.
53. B.T. Ellison, C.T.G., L.M. Frostman, and S.E. Lorimer, The Physical Chemistry
of Wax, Hydrates, and Asphaltene, in Offshore Technology Conference. 2000,
Offshore Technology Conference: Houston, TX.
54. Roenningsen, H.P., et al., Wax precipitation from North Sea crude oils: 1.
Crystallization and dissolution temperatures, and Newtonian and non-Newtonian
flow properties. Energy & Fuels, 1991. 5(6): p. 895-908.

134
55. Pedersen, K.S. and H.P. Rønningsen, Influence of Wax Inhibitors on Wax
Appearance Temperature, Pour Point, and Viscosity of Waxy Crude Oils. Energy
& Fuels, 2003. 17(2): p. 321-328.
56. Drelich, A., et al., Evolution of water-in-oil emulsions stabilized with solid
particles-Influence of added emulsifier. Colloids and Surfaces A:
Physicochemical and Engineering Aspects, 2010. 365(1-3): p. 171-177.
57. Binks, B.P., Particles as surfactants similarities and differences. Colloid and
Interface Science, 2002. 7: p. 21-41.
58. Leal-Calderon, F. and V. Schmitt, Solid-stabilized emulsions. Current Opinion in
Colloid & Interface Science, 2008. 13(4): p. 217-227.
59. Binks, B.P. and S.O. Lumsdon, Influence of Particle Wettability on the Type and
Stability of Surfactant-Free Emulsions. Langmuir, 2000. 16: p. 8622-8631.
60. Frelichowska, J., M.-A. Bolzinger, and Y. Chevalier, Effects of solid particle
content on properties of o/w Pickering emulsions. Journal of Colloid and
Interface Science, 2010. 351(2): p. 348-356.
61. Dukhin, A.S. and P.J. Goetz, Acoustic and electroacoustic spectroscopy.
Langmuir, 1996. 12(18): p. 4336-4344.
62. Dukhin, A.S., Ultrasound for Characterizing Colloids Particle Sizing, Zeta
Potential Rheology. 2002: Elsevier.
63. M. Chatterjee, M.K.N., B. Siladitya, and D. Ganguli, Role of organic solvents
and surface-active agents in the sol-emulsion-gel synthesis of spherical alumina
powders. Journal of Materials Research, 1999. 15(1): p. 176-185.

135
64. Dukhin, A.S. and P.J. Goetz, Characterization of Liquids, Nano- and
Microparticulates, and Porous Bodies using Ultrasound 2ed. 2010: Elsevier.
503.
65. Dukhin, A.S. and P.J. Goetz, Acoustic and electroacoustic spectroscopy for
characterizing concentrated dispersions and emulsions. Advances in Colloid and
Interface Science, 2001. 92(1–3): p. 73-132.
66. Drelich, A., et al., Evolution of water-in-oil emulsions stabilized with solid
particles. Colloids and Surfaces A: Physicochemical and Engineering Aspects,
2010. 365(1-3): p. 171-177.
67. Dukhin, A. and P. Goetz, Evolution of water-in-oil emulsion controlled by
droplet-bulk ion exchange: acoustic, electroacoustic, conductivity and image
analysis. Colloids and Surfaces A: Physicochemical and Engineering Aspects,
2005. 253(1-3): p. 51-64.
68. Horozov, T.S. and B.P. Binks, Particle-Stabilized Emulsions: A Bilayer or a
Bridging Monolayer? Angewandte Chemie International Edition, 2006. 45(5): p.
773-776.
69. Yan, Y. and J.H. Masliyah, Solids-stabilized oil-in-water emulsions: Scavenging
of emulsion droplets by fresh oil addition. Colloids and Surfaces A:
Physicochemical and Engineering Aspects, 1993. 75(0): p. 123-132.
70. Arditty, S., et al., Some general features of limited coalescence in solid-stabilized
emulsions. Eur. Phys. J. E, 2003. 11(3): p. 273-281.
71. Wiley, R.M., Limited coalescence of oil droplets in coarse oil-in-water
emulsions. Journal of Colloid Science, 1954. 9(5): p. 427-437.

136
72. Binks, B.P. and C.P. Whitby, Silica Particle-Stabilized Emulsions of Silicone Oil
and Water: Aspects of Emulsification. Langmuir, 2004. 20(4): p. 1130-1137.
73. Destribats, M., et al., Outstanding Stability of Poorly-protected Pickering
Emulsions, in Trends in Colloid and Interface Science XXIII. 2010, Springer
Berlin Heidelberg. p. 13-18.
74. Levine, S., B.D. Bowen, and S.J. Partridge, Stabilization of emulsions by fine
particles I. Partitioning of particles between continuous phase and oil/water
interface. Colloids and Surfaces, 1989. 38(2): p. 325-343.
75. Binks, B.P. and S.O. Lumsdon, Pickering Emulsions Stabilized by
Monodispersed Latex Particles: Effects of Particle Size. Langmuir, 2001. 17: p.
4540-4547.
76. Sjoblom, J., et al., Investigation of the Hydrate Plugging and Non-Plugging
Properties of Oils. Journal of Dispersion Science and Technology, 2010. 31(8):
p. 1100-1119.
77. Pichot, R., F. Spyropoulos, and I.T. Norton, Competitive adsorption of
surfactants and hydrophilic silica particles at the oil–water interface: Interfacial
tension and contact angle studies. Journal of Colloid and Interface Science,
2012. 377(1): p. 396-405.
78. Masalova, I. and E. Kharatyan, Effect of silica particles on stability of highly
concentrated water-in-oil emulsions with non-ionic surfactant. Colloid Journal,
2013. 75(1): p. 95-102.
79. Palermo, T.A., D; Borregales, M.; Dalmazzone, C.; Rousseau, L. Study of the
agglomeration between hydrate particles in oil using differential scanning

137
calorimetry (DSC). in 5th International Conference on Gas Hydrates. 2005.
Trondheim, Norway.
80. Turner, D.J., Clathrate hydrate formation in water-in-oil dispersions, in
Department of Chemical and Petroleum Refining Engineering. 2005, Colorado
School of Mines: Golden, Colorado.
81. Delgado-Linares, J.G., et al., Model Water-in-Oil Emulsions for Gas Hydrate
Studies in Oil Continuous Systems. Energy & Fuels, 2013. 27(8): p. 4564-4573.
82. Lachance, J.W., et al., Formation of Hydrate Slurries in a Once-Through
Operation. Energy & Fuels, 2012. 26(7): p. 4059-4066.
83. Peixinho, J., et al., Rheology of hydrate forming emulsions. Langmuir, 2010.
26(14): p. 11699-11704.
84. Zylyftari, G., J.W. Lee, and J.F. Morris, Salt effects on thermodynamic and
rheological properties of hydrate forming emulsions. Chemical Engineering
Science, 2013. 95: p. 148-160.
85. Ahuja, A., Hydrate Forming Emulsion: Rheology and Morphology Analysis for
Flow Assurance, in Department of Chemical Engineering. 2015, The City
University of New York: New York.
86. Patrick J. Rensing, M.L., Amadeu K. Sum, Carolyn A. Koh, Dendy E. Sloan,
Viscosity and yield stress of ice slurries formed in water-in-oil emulsions. Non-
Newtonian Fluid Mechanics 2011. 166: p. 859-866.
87. Boxall, J.A., et al. Hydrate blockage potential in an oil-dominated system studied
using a four inch flow loop. in Proceedings of the Sixth Internantional
Conference on Gas Hydrates. 2008. Vancouver, Canada.

138
88. Turner, D.J., K.T. Miller, and E. Dendy Sloan, Methane hydrate formation and
an inward growing shell model in water-in-oil dispersions. Chemical
Engineering Science, 2009. 64(18): p. 3996-4004.
89. Cha, M., et al., Hydrophobic Particle Effects on Hydrate Crystal Growth at the
Water–Oil Interface. Chemistry – An Asian Journal, 2014. 9(1): p. 261-267.
90. Webb, E.B., et al., High-pressure rheology of hydrate slurries formed from
water-in-oil emulsions. Energy & Fuels, 2012. 26(6): p. 3504-3509.
91. Fidel-Dufour, A., F. Gruy, and J.-M. Herri, Rheology of methane hydrate slurries
during their crystallization in a water in dodecane emulsion under flowing.
Chemical Engineering Science, 2006. 61(2): p. 505-515.
92. Joshi, S.V., et al., Experimental flowloop investigations of gas hydrate formation
in high water cut systems. Chemical Engineering Science, 2013. 97: p. 198-209.
93. Karanjkar, P.U., Evolving morphology and rheological properties of an emulsion
undergoing clathrate hydrate formation. 2012: City University of New York.
94. Sjöblom, J., et al., Our current understanding of water-in-crude oil emulsions.
Advances in Colloid and Interface Science, 2003. 100-102: p. 399-473.
95. Venkataramani, D. and C.P. Aichele, Concentrated Emulsion Characterization
in Flowing Conditions. Energy & Fuels, 2015. 29(5): p. 2801-2807.
96. Visintin, R.F.G., et al., Structure of waxy crude oil emulsion gels. Journal of
Non-Newtonian Fluid Mechanics, 2008. 149(1-3): p. 34-39.
97. Bilyeu, D.J. and T.X. Chen, Clearing Hydrate and Wax Blockages in a Subsea
Flowline. Offshore Technology Conference.

139
98. Moradpour, H., A. Chapoy, and B. Tohidi, Phase Inversion in Water-Oil
Emulsions with and without Gas Hydrates. Energy and Fuels, 2011. 25: p. 5736-
5745.
99. Parthasarathi, P., Deposition and Aging of Waxy Solids from Paraffinic Mixtures,
in Department of Chemical and Petroleum Engineering. 2004, The University of
Calgary: Calgary, Alberta.
100. Dantas Neto, A.A.G., E. A. S.; Barros Neto, E. L.; Dantas, T. N. C.; Moura, C. P.
A. M, Determination Of Wax Appearance Temperature (Wat) In Paraffin/Solvent
Systems By Photoelectric Signal And Viscosimetry. Brazilian Journal Of
Petroleum And Gas, 2009. 3(4): p. 149-157.
101. Zhao, Y., et al., Utilization of DSC, NIR, and NMR for wax appearance
temperature and chemical additive performance characterization. Journal of
Thermal Analysis and Calorimetry, 2015. 120(2): p. 1427-1433.
102. Turner, W.R., Normal Alkanes, Technical Review. Ind. Eng. Chem. Prod. Res.
Dev., , 1971. 10(3): p. 238-260.
103. Hammami, A., Thermal Behaviour and Non-isothermal Crystallization kinetics
of normal-Alkanes and their Waxy Mixtures under Quiescent Conditions. 1994,
University of Calgary: Calgary, Alberta.
104. Oliveira, G.E., et al., The Effect of Asphaltenes, Naphthenic Acids, and
Polymeric Inhibitors on the Pour Point of Paraffins Solutions. Journal of
Dispersion Science and Technology, 2007. 28(3): p. 349-356.

140
105. Garcıa, M.d.C., et al., The influence of alkane class-types on crude oil wax
crystallization and inhibitors efficiency. Journal of Petroleum Science and
Engineering, 2000. 25(3–4): p. 99-105.
106. Venkatesan, R., et al., The strength of paraffin gels formed under static and flow
conditions. Chemical Engineering Science, 2005. 60(13): p. 3587-3598.
107. Kashchiev, D. and A. Firoozabadi, Driving force for crystallization of gas
hydrates. Journal of Crystal Growth, 2002. 241(1–2): p. 220-230.
108. Zhang, J.S., S. Lee, and J.W. Lee, Kinetics of Methane Hydrate Formation from
SDS Solution. Industrial & Engineering Chemistry Research, 2007. 46(19): p.
6353-6359.
109. Zhong, Y. and R.E. Rogers, Surfactant effects on gas hydrate formation.
Chemical Engineering Science, 2000. 55(19): p. 4175-4187.
110. Kumar, A., et al., Influence of contact medium and surfactants on carbon dioxide
clathrate hydrate kinetics. Fuel, 2013. 105: p. 664-671.
111. Watanabe, K., S. Imai, and Y.H. Mori, Surfactant effects on hydrate formation in
an unstirred gas/liquid system: An experimental study using HFC-32 and sodium
dodecyl sulfate. Chemical Engineering Science, 2005. 60(17): p. 4846-4857.
112. Kumar, A., et al., Role of Surfactants in Promoting Gas Hydrate Formation.
Industrial & Engineering Chemistry Research, 2015. 54(49): p. 12217-12232.
113. Kalogerakis, N., et al., Effect of Surfactants on Hydrate Formation Kinetics.
Society of Petroleum Engineers.

141
114. Di Profio, P., et al., Surfactant promoting effects on clathrate hydrate formation:
Are micelles really involved? Chemical Engineering Science, 2005. 60(15): p.
4141-4145.
115. Zhang, B.-y., Q. Wu, and D.-l. Sun, Effect of surfactant Tween on induction time
of gas hydrate formation. Journal of China University of Mining and
Technology, 2008. 18(1): p. 18-21.
116. Rogers, R., et al., Investigations into surfactant/gas hydrate relationship. Journal
of Petroleum Science and Engineering, 2007. 56(1–3): p. 82-88.

142
APPENDICES
APPENDIX A- IMAGES CAPTURED USING CROSS POLARIZED OPTICAL
MICROSCOPY FOR HYDRATE FORMATION STUDIES IN WAXY OIL SYSTEMS
Images at the oil-water interface captured at 20x magnification in surfactant free 1.25 wt.% wax
in mineral oil-cyclopentane mixture

APPENDIX B- DROP SIZE DISTRIBUTION OF REFERENCE SYSTEMS USED FOR
CALIBRATION
Particle size distribution of 10 wt.% colloidal silica solution captured using acoustic
spectroscopy. The inset image was captured using transmission electron microscopy (TEM)

Particle size distribution of 0.1 wt.% Aerosil R972 in crystal plus 70T mineral oil in captured
using acoustic spectroscopy. The inset image was captured using transmission electron
microscopy (TEM)
Nonaqueous conductivity measurement of water-in-oil emulsion stabilized using solid particle
and surfactant discussed in Chapter II
10-13
10-12
10-11
10-10
10-9
10-8
10-7
0 0.05 0.1 0.15 0.2 0.25 0.3
Span80 emulsion
Fumed silica emulsion
Co
nd
ucti
vit
y (
S/m
)
Water fraction

APPENDIX C- FLOW LOOP SETUP USED FOR EMULSION AND HYDRATE
CHARACTERIZATION DESCRIBED IN CHAPTER III
Reservoir Top view of the reservoir

VITA
Deepika Venkataramani
Candidate for the Degree of
Doctor of Philosophy
Thesis: HYDRATE FORMATION IN WAXY OIL SYSTEMS
Major Field: Chemical Engineering
Biographical:
Education:
Completed the requirements for the Doctor of Philosophy in Chemical
Engineering at Oklahoma State University, Stillwater, Oklahoma in December,
2016.
Completed the requirements for the Master of Science in Environmental
Engineering at Syracuse University, Syracuse, New York in December, 2010.
Completed the requirements for the Bachelor of Engineering in Chemical
Engineering at University of Pune, Pune, Maharashtra, India in May, 2006.
Experience:
Graduate Intern (Research and Development), Shell Global Solutions, Houston,
Texas: May 2015- August 2015
Research Assistant, School of Chemical Engineering, Oklahoma State
University, Stillwater, Oklahoma: August 2012 – December 2016
Teaching Assistant, School of Chemical Engineering, Oklahoma State
University, Stillwater, Oklahoma: August 2008 – May 2010
Professional Memberships:
American Institute of Chemical Engineers, American Chemical Society, Society
of Petroleum Engineers, Sustainable Remediation Forum, American Academy
of Environmental Engineers, Indian Institute of Chemical Engineers
Honor Societies:
Omega Chi Epsilon
Related Documents