Citation: Rajkovi´ c, P.; Aleksi´ c, D.; Djordjevi´ c, A.; Jankovi´ c, D. Hybrid Software Deployment Strategy for Complex Industrial Systems. Electronics 2022, 11, 2186. https:// doi.org/10.3390/electronics11142186 Academic Editor: Manuel Mazzara Received: 1 June 2022 Accepted: 7 July 2022 Published: 12 July 2022 Publisher’s Note: MDPI stays neutral with regard to jurisdictional claims in published maps and institutional affil- iations. Copyright: © 2022 by the authors. Licensee MDPI, Basel, Switzerland. This article is an open access article distributed under the terms and conditions of the Creative Commons Attribution (CC BY) license (https:// creativecommons.org/licenses/by/ 4.0/). electronics Article Hybrid Software Deployment Strategy for Complex Industrial Systems Petar Rajkovi´ c 1, * , Dejan Aleksi´ c 2 , Andjelija Djordjevi´ c 1 and Dragan Jankovi´ c 1 1 Faculty of Electronic Engineering, University of Niš, 18115 Niš, Serbia; [email protected] (A.D.); [email protected] (D.J.) 2 Department of Physics, Faculty of Sciences and Mathematics, University of Niš, 18000 Niš, Serbia; [email protected] * Correspondence: [email protected] Abstract: Complex industrial systems run the different pieces of software in several interconnected physical layers. The software update in such an environment must be performed in the shortest possible period with the lowest possible resource usage. Namely, it is critical to minimize the data traffic, decrease software downtime, and reduce the impact of the transitional stage during the update process. To meet these requirements and to unify the update process, the common software node structure along with a hybrid software deployment strategy is proposed. The hybrid strategy is defined as a combination of the existing and well-tested techniques—blue/green, canary, and feature flags. The main aim was to utilize their positive sides and to obtain a better overall effect. The approach was tested in the simulation environment, based on the realistic factory layout, and running the software related to the enterprise resource planning (ERP) level. For successful updates, the proposed hybrid deployment method reduced downtime on server nodes to less than 5% and on client nodes to a half compared with the standard approach. The volume of data traffic reduction in a configuration with sentinel nodes is reduced by one-third. The presented results look promising, especially in cases of erroneous updates when a roll back is needed, where the downtime on the server nodes is reduced to the level of 3%. Achieved results are used to define the set of recommendations that could be extended for the other software layers, followed by a discussion about further potential problems and strategy variations. Keywords: hybrid software deployment method; software life cycle; software in the industrial environment 1. Background and Significance The software required to successfully run the complex industrial systems is distributed across multiple layers, in various configurations [1–3], according to the ISA-95 model (Figure 1). Starting from the sensors/actuator layers, through the edge/programmable logic controllers (PLC) layer [4], via supervisory control and data acquisition/human- machine interface (SCADA/HMI) [5,6] and manufacturing execution systems (MES) [7] way up to enterprise resource planning (ERP) [8], all pieces of equipment run the software that needs to be updated occasionally. Since the manufacturing environment is often in highly regulated industries, this implies that all deployed software instances must be standardized [9] and able to retain constant high reliability [10]. The difference between software instances running at various levels is such that the definition of joint hardware/software stack is not quite feasible. When possible, the complexity is as close as explained in [11]. Usually, the implementational and organizational aspects show a large-scale variance. Not only is the application development technology different, but also basic design principles such as the type of program, backbone design paradigms, and general usage philosophy [12–14]. Furthermore, the volume of data traffic per layer and between layers could easily be different. Nevertheless, the software that runs Electronics 2022, 11, 2186. https://doi.org/10.3390/electronics11142186 https://www.mdpi.com/journal/electronics

Welcome message from author
This document is posted to help you gain knowledge. Please leave a comment to let me know what you think about it! Share it to your friends and learn new things together.
Transcript

Citation: Rajkovic, P.; Aleksic, D.;
Djordjevic, A.; Jankovic, D. Hybrid
Software Deployment Strategy for
Complex Industrial Systems.
Electronics 2022, 11, 2186. https://
doi.org/10.3390/electronics11142186
Academic Editor: Manuel Mazzara
Received: 1 June 2022
Accepted: 7 July 2022
Published: 12 July 2022
Publisher’s Note: MDPI stays neutral
with regard to jurisdictional claims in
published maps and institutional affil-
iations.
Copyright: © 2022 by the authors.
Licensee MDPI, Basel, Switzerland.
This article is an open access article
distributed under the terms and
conditions of the Creative Commons
Attribution (CC BY) license (https://
creativecommons.org/licenses/by/
4.0/).
electronics
Article
Hybrid Software Deployment Strategy for ComplexIndustrial SystemsPetar Rajkovic 1,* , Dejan Aleksic 2, Andjelija Djordjevic 1 and Dragan Jankovic 1
1 Faculty of Electronic Engineering, University of Niš, 18115 Niš, Serbia;[email protected] (A.D.); [email protected] (D.J.)
2 Department of Physics, Faculty of Sciences and Mathematics, University of Niš, 18000 Niš, Serbia;[email protected]
* Correspondence: [email protected]
Abstract: Complex industrial systems run the different pieces of software in several interconnectedphysical layers. The software update in such an environment must be performed in the shortestpossible period with the lowest possible resource usage. Namely, it is critical to minimize the datatraffic, decrease software downtime, and reduce the impact of the transitional stage during the updateprocess. To meet these requirements and to unify the update process, the common software nodestructure along with a hybrid software deployment strategy is proposed. The hybrid strategy isdefined as a combination of the existing and well-tested techniques—blue/green, canary, and featureflags. The main aim was to utilize their positive sides and to obtain a better overall effect. Theapproach was tested in the simulation environment, based on the realistic factory layout, and runningthe software related to the enterprise resource planning (ERP) level. For successful updates, theproposed hybrid deployment method reduced downtime on server nodes to less than 5% and onclient nodes to a half compared with the standard approach. The volume of data traffic reduction ina configuration with sentinel nodes is reduced by one-third. The presented results look promising,especially in cases of erroneous updates when a roll back is needed, where the downtime on the servernodes is reduced to the level of 3%. Achieved results are used to define the set of recommendationsthat could be extended for the other software layers, followed by a discussion about further potentialproblems and strategy variations.
Keywords: hybrid software deployment method; software life cycle; software in the industrialenvironment
1. Background and Significance
The software required to successfully run the complex industrial systems is distributedacross multiple layers, in various configurations [1–3], according to the ISA-95 model(Figure 1). Starting from the sensors/actuator layers, through the edge/programmablelogic controllers (PLC) layer [4], via supervisory control and data acquisition/human-machine interface (SCADA/HMI) [5,6] and manufacturing execution systems (MES) [7]way up to enterprise resource planning (ERP) [8], all pieces of equipment run the softwarethat needs to be updated occasionally. Since the manufacturing environment is often inhighly regulated industries, this implies that all deployed software instances must bestandardized [9] and able to retain constant high reliability [10].
The difference between software instances running at various levels is such thatthe definition of joint hardware/software stack is not quite feasible. When possible, thecomplexity is as close as explained in [11]. Usually, the implementational and organizationalaspects show a large-scale variance. Not only is the application development technologydifferent, but also basic design principles such as the type of program, backbone designparadigms, and general usage philosophy [12–14]. Furthermore, the volume of data trafficper layer and between layers could easily be different. Nevertheless, the software that runs
Electronics 2022, 11, 2186. https://doi.org/10.3390/electronics11142186 https://www.mdpi.com/journal/electronics

Electronics 2022, 11, 2186 2 of 28
at one level must communicate with the software running on the level above and the levelbelow (Figure 1). In short, the communication protocols are not equal in every case [15,16].
Figure 1. ISA-95 architecture for industrial automation systems.
These facts prove that the software update is slightly more complex than in situa-tions where the system is based on the same or comparable technology and the samecommunication protocols. Since the software needs to be updated from time to time, sucha challenging environment requires precisely defined processes and scenarios that couldmake the deployment of an updated version effective and efficient [17]. Regardless of thelevel and mentioned differences, the update process could follow similar procedural steps.The general resource awareness points could be identified, such as memory usage, datatraffic, and downtime period [18,19].
The complete area of industrial software development, implementation, and deploy-ment is considered very dynamic currently. The presented results cover near-completeIndustry 4.0 software integration maturity models [20], which is an impressive stage ofdevelopment in the area as of now. The results of the research from various computerscience topics are used to improve the overall experience in the industrial domain andimprove the Industry 4.0 agenda [21]. It is not only the improvement of the product qual-ity management system as described in [22] but also the usage of artificial intelligence(AI) and deep learning algorithms that could improve the segments of system securitymonitoring [23,24] and general fault diagnostics [25,26].
Nevertheless, all the mentioned pieces of the software need to be updated sometimes,and the proper update strategy will lead to lower downtime and higher customer satisfac-tion. The main objective of this paper is to highlight the common problems with softwareupdates across multiple layers in the complex industrial environment and to introduce a setof recommendations and guidelines for the most time- and cost-effective software updatesfrom the resource awareness point of view. As the showcase, the executed experimentswere with the software used on the ERP level. The ERP level is the environment wherethe performed experiments will have the lowest impact on production [27]. Since thislevel might be decoupled more easily from the rest of the system, it proved to be the mostconvenient level for both trials, testing, and the initial production deployment. Therefore,different deployment strategies and the influence of the critical resource managementpoints could be examined.
The most critical points for resource management are the storage capacity (especiallyat the lower levels) [28], downtime during the update process [29], and the data trafficthrough the connecting networks [30]. Namely, MES systems could run in a shop floorenvironment on computers connected to the wireless network which could experiencedifferent disruptions as the result of operating nearby machines generating high frequencies.When deploying an updated version of the software to some programmable device, an

Electronics 2022, 11, 2186 3 of 28
update package needs to be distributed via a network and stored on the destination device,and the previous version needs to be backed up in case of roll back.
Depending on the type of devices, their number, and the layer of running software,the amount of transferred data (per device) could be, according to our experience, between10 kB and 1 GB. The clients on the sensor levels need small packages, the size of which ismeasured in kilobytes, and which execute few functions. Oppositely, the installation of theserver node software at the ERP level might need several gigabytes. Considering regulardata traffic, the additional network load created as the result of the software update coulduse a substantial portion of the data throughput and cause communication problems [31].Moreover, the devices on which the software is executed could have limited storage capacity,which would require backup in a remote location.
The next important case is the situation where bugs and software errors are discov-ered after the deployment. When this situation occurs, the deployed software needs toroll back to the previous version. The roll-back procedure entails additional time andnetwork resources [32,33]. This means that the system must contain nodes with enoughstorage space to store several versions of the active software. Unfortunately, this is notpossible every time, and in these cases, downtime for the roll-back scenario would bepointedly extended.
To overcome the described problems, the update process must be carefully planned,and an adequate procedure should be followed. The mentioned procedures are calleddeployment strategies and a desirable choice of deployment strategy would reduce thedowntime and other downsides of the update process. Unfortunately, in such a complexenvironment, none of the existing and well-known deployment strategies alone couldbring a satisfying solution. Each separate strategy tends to bring not only positive butalso negative effects to the update process. For example, blue/green deployment couldreduce the downtime close to zero, but it offers verification on a single node only; canaryoffers the possibility to test in a production environment but does not define scenarios ofwhat to do when the change happens between software layers. In the end, dark mode andfeature flags alone could lead to an uncomprehensive software solution where the statustracking and roll back to the previous state could be a task close to impossible. Thus, thedecision was to try to define a hybrid strategy that would synergistically use the existingones, emphasizing their positive and reducing their negative sides.
To reduce the impact of the mentioned problems on the system uptime, the commonsoftware node structure together with the hybrid deployment approach was proposed. Thecommon software node structure is based on blue/green architecture extended by featureflags. Such a design is applicable in most cases, both in server and client nodes. In this way,the software update will more likely be the case of the version switchover than the noderestart. For client networks, the preferable approach will be the usage of sentinel nodeswhich will reduce the network peaks and improve canary deployment, which is a commonstrategy for client networks.
To make the complete system more effective, the design is enriched with the potentialuse of distributed backups and message queues as additional support mechanisms. Thementioned combination of deployment methods could be used further for other softwarelayers [34].
In this research, the results for the clients on levels 3 and 4 (mostly on the ERP level) arepresented and elaborated on. Except for ERP, the proposed approach is fully applicable tothe MES, while some adaptations could be used at the lower levels as well. The discussionsection conveys potential problems and strategy variations when the proposed hybridapproach must be applied to sensor networks, Internet of Things (IoT), and SCADA levels.The simulation, based on a realistic factory layout, used for the test was one of the firststeps in the ongoing research, expected to result in the digital twin which could be used asa testbed for the system running the software in multiple ISA-95 levels.
Electronics 2022, 11, 2186 4 of 28
2. Related Work and Common Deployment Strategies
As mentioned previously, the software update is a delicate process, during whicha product version is changed. This process could often leave a software instance in anintermediate, undefined, or even a vulnerable state. Such a state often requires downtime,which inevitably leads to data loss. In lower-level industrial systems, reducing downtimeand data loss is necessary. Thanks to the evolution of the software industry, deploymentmethods have been developed and improved to make software updates as efficient aspossible. With a proper deployment strategy, overall time and resource losses could beas small as possible. This section provides an overview of some existing deploymentstrategies which were used as a basis for the set of recommendations provided by thispaper. Along with them, the insight in the current Industry 4.0 research is presented, withspecial attention to the concepts useful for further research.
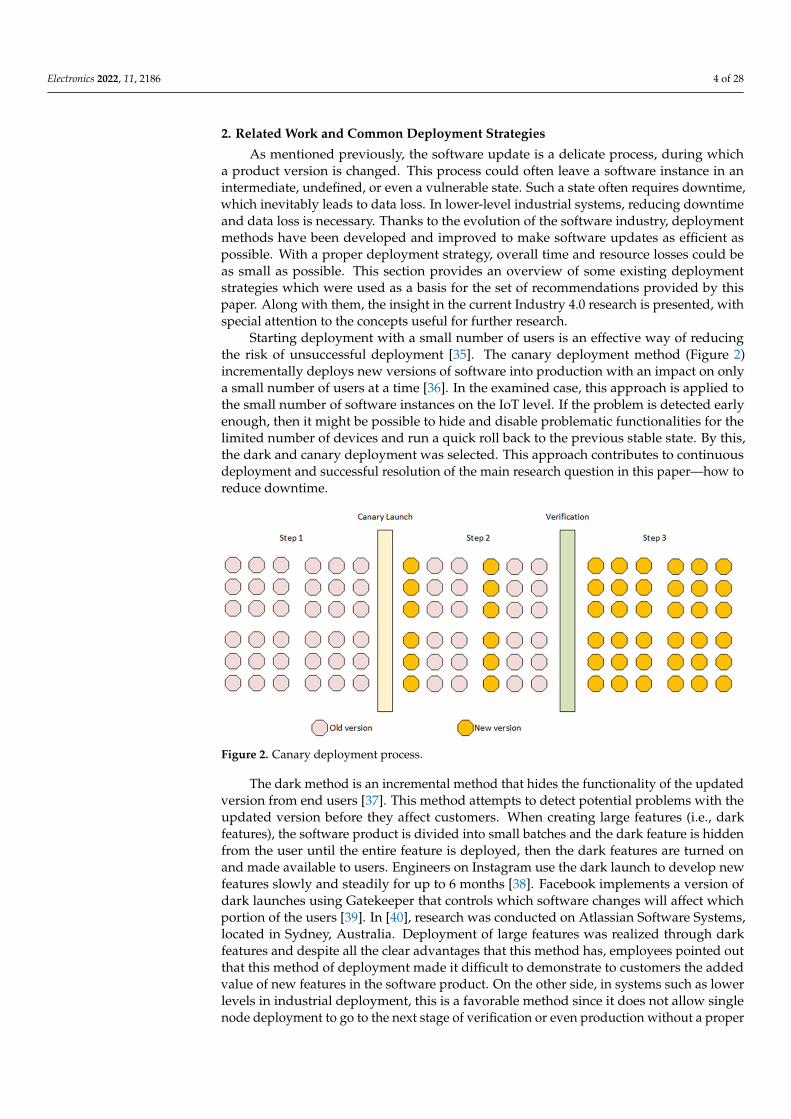
Starting deployment with a small number of users is an effective way of reducingthe risk of unsuccessful deployment [35]. The canary deployment method (Figure 2)incrementally deploys new versions of software into production with an impact on onlya small number of users at a time [36]. In the examined case, this approach is applied tothe small number of software instances on the IoT level. If the problem is detected earlyenough, then it might be possible to hide and disable problematic functionalities for thelimited number of devices and run a quick roll back to the previous stable state. By this,the dark and canary deployment was selected. This approach contributes to continuousdeployment and successful resolution of the main research question in this paper—how toreduce downtime.
Figure 2. Canary deployment process.
The dark method is an incremental method that hides the functionality of the updatedversion from end users [37]. This method attempts to detect potential problems with theupdated version before they affect customers. When creating large features (i.e., darkfeatures), the software product is divided into small batches and the dark feature is hiddenfrom the user until the entire feature is deployed, then the dark features are turned onand made available to users. Engineers on Instagram use the dark launch to develop newfeatures slowly and steadily for up to 6 months [38]. Facebook implements a version ofdark launches using Gatekeeper that controls which software changes will affect whichportion of the users [39]. In [40], research was conducted on Atlassian Software Systems,located in Sydney, Australia. Deployment of large features was realized through darkfeatures and despite all the clear advantages that this method has, employees pointed outthat this method of deployment made it difficult to demonstrate to customers the addedvalue of new features in the software product. On the other side, in systems such as lowerlevels in industrial deployment, this is a favorable method since it does not allow singlenode deployment to go to the next stage of verification or even production without a proper

Electronics 2022, 11, 2186 5 of 28
checkup. Generally, the canary method is used during the single node update to mitigatethe risk of releasing large feature groups with significant failures.
Many companies that provide large-scale upgrades use a combination of dark launchesand feature flags (Figure 3) to deploy large architectural changes. By using feature flags,the developer turns features on and off through the configuration server until it is fullyready for use. In this way, integration problems and maintenance of long-running featurebranches are avoided [38]. The paper [41] states that conditional logic and configurationflags were used to implement feature flags. Etsy uses configuration flags that switch onand off specific portions of the software code [42], and Rally Software uses a conditionalframework [34]. This is proven to be a good approach in industrial systems when newfeatures are introduced. The potential for such an approach is shifted to higher levels ofthe software—closer to MES and ERP. In lower levels, the canary approach is chosen sincefeature flags would create additional complexity in the environment where overall resourceawareness is necessary.
Figure 3. Dark launch and feature flags.
One of the most used deployment techniques, regardless of whether the nodes haveenough resources, is the blue/green deployment technique (Figure 4). It uses two identicalenvironments, one for production and the other for staging, with changes planned to beintroduced. Even if an error occurs, the previously safe environment can be restored veryquickly and easily [43]. Using this technique requires additional costs to create a duplicateenvironment, making it perfectly suitable for higher levels in the ISA-95 stack.
Figure 4. Blue/green deployment.

Electronics 2022, 11, 2186 6 of 28
In the work presented in [44], dark and canary deployment strategies are proposedfor successful deployment. It is also stated that one of the essential characteristics of goodcontinuous deployment is the fast feedback of users. Besides numerous errors caused by thedeployment that could be easily detected through internal diagnostics and log analysis, thepossibility that users could report the detected problem makes them feel more importantand contributes to a general acceptance of the system. Since this is the requirement on theMES and ERP level, where the number of active users is significantly higher than in thelower levels, the blue/green testing method is suitable.
Not only standard deployment strategies from the software development domainare of interest in the presented research, but also some approaches are known from theindustrial environment. One of them is the so-called hybrid software defined network(hybrid SDN or HSDN) [45]. They are used to make data management more effective witha reduced hardware cost, by splitting the system into management, control, and data plane.Splitting the complete environment into mentioned planes makes it like the ISA-95 stackand brings comparable software deployment challenges.
To build the hybrid strategy, the current research partly relies on the approaches de-fined in island-based, service-based, and class-based HSDNs, as described in [45]. Lookingin this direction, the study [46] helped in understanding the industrial networks and usingthe evaluated approaches for incremental deployment that could be used for level 3 and4 software, in a way that looks like the implementation of the feature flags deploymentmethod. The explanation of intra-domain deployment given in [47] was important as a wayto prove that the canary deployment is the proper baseline for the client update strategy,while the explanation of the importance of traffic engineering defines the need for theintroduction of backup and sentinel nodes in the client networks.
The usage of queuing models and buffers is another approach frequently used in theHSDN domain [48] and is used in this research when the model of the single node wasdefined. By default, a single software node consists of blue and green software versionstogether with a buffer that makes the data synchronization between two software layers, orbetween clients and servers, smoother, more error-prone, and effective.
Hybrid deployment models are a well-known engineering approach [49], and withall their technical benefits, they are also tailored and used to make the customer moresatisfied by targeting their specific needs, reducing system downtime, and preventingerror propagation.
3. Materials and Methods
As the starting point, the comparison of the mentioned, well-known, and widely usedsoftware deployment strategies is performed. Relying on the findings explained in therelated work presented in the previous section, none of the strategies could be used as aperfect solution in every case. Thus, the next step in the research was to identify the mainpositive and negative characteristics of each of the described approaches and use them in asynergistic way to obtain the most effective deployment approach. The main purpose wasto devise an approach that could be used, to some extent, in all five layers of the industrialsoftware environment. The collateral benefit expected from this research is the generalrecommended architecture for the single software node regardless of the software level.
3.1. Towards a General Hybrid Approach
The most used deployment strategies are analyzed and their positive sides are high-lighted. As has been mentioned before, none of them proved to be an ideal solution forevery case, but with a proper combination, their downsides will have a lower effect on theoverall process.
The initial choice was the combination of blue/green and canary deployment. Thus,the blue/green approach was introduced on every node—both server and client (wheneverit was possible). For the group of clients where the examined software should be deployed,the canary approach is defined as the basic viable deployment scenario. This is a usual and

Electronics 2022, 11, 2186 7 of 28
widely used combination. The most important characteristic shared by both the blue/greenand canary releases is the possibility to test new versions in a live production environmentwith a reduced risk level. When developing the updated version of the software, it isusually tested in a single server node and with several clients. Even though the updatedversion could work properly in the test environment, the deployment to the full-scaleproduction area could lead to complications not predicted before.
Next, both methods provide the possibility for close-to-zero downtime. The versionchange might occur quickly enough for the software update to become a process that couldbe performed not only during non-peak hours but virtually anytime.
The downside for the blue/green deployment is that the deployment process couldrequire more space for different versions and that the targeted pieces of software needadditional logic for change management. The elements such as message queues andlong-running processes need to be carefully monitored if no downtime is required. Theadditional problem with blue/green and canary occurs when a change in different softwarelevels or layers is needed for an updated version. Regardless of database schema change,communication protocol update, or a required updated version of the software in theconnection layer, all of these must be considered during the update process. The level ofchange could be such that a simple switchover is not possible, and thus deployment wouldrequire significant downtime. The additional downside is the roll-back scenario. When ithappens, the system needs to go back to the previous version, and another downtime slotrises. This is often highlighted as a crucial problem by the customer.
To reduce the downtime when a roll back is needed and to control the launch ofnew features, the dark launch and feature flags are added to the tested software (namely,to the green version). This is intended to simplify turning on or off new features in theenvironment that remain almost unchanged. New functionalities could be developed andcontrolled by simple Boolean variables. In an ideal case, this approach requires less timeboth for planning and coordination and for testing. Thus, development and testing couldbe parallelized (depending on the nature of the change). The cost of this approach is theadditional programming and organizational effort where the feature flag system is set upand later utilized.
The increased number of configuration parameters could be a problem with featureflags. They need to be carefully managed in order not to cause more problems in the future.Moreover, the additional coding effort is needed to maintain the code and could eventuallyleave the application more fragile if updates are not thoughtfully planned.
The initial impression is that all mentioned approaches contrast with each otherrather than being complementary. Instead of sticking to a single deployment method, thechoice was to combine them in a suitable system where each technique fills the gaps ofthe others (Figure 5). The suggested approach is considered the hybrid approach since itis the combination of canary deployment and blue/green technique enhanced with thedark launch approach and the feature flags. This setup could be supported with buffersbetween the levels, or between clients and servers, ensuring precise message processing asstated in [50].
3.2. Configuration for a Single Node
Deployment for server and client nodes could look different, but the software organi-zation on both ends could follow the same pattern. Besides the fact that in a distributedenvironment, the number of server nodes is pointedly lower than the number of clients, itis worth having predefined baselines for all the different software instances.
Consequently, the update process could be driven by the same pattern and the sameset of actions might be performed along the line. An additional piece of software, theupdater, could be used then both for the server and client updates. Although the numberof distributed update packages for server nodes will be lower than for the clients, this isnot the limiting factor that would require different deployment approaches.

Electronics 2022, 11, 2186 8 of 28
Figure 5. Hybrid deployment approach with unified node structure– the overview.
The available space in the server node is higher, thus the blue/green approachis a desirable choice. Moreover, client machines for software running in levels 3 and4 are regular computers, so the space will not have a limited role. The extension of thedeployed software with the incoming and outgoing message buffers is considered anadditional option in cases when the order of message synchronization is critical. Fromthe technological perspective, message queues are a standard component used in manysystems regularly.
The software configuration in the single node follows the approach based on theblue/green method extended with the dark method and feature flags. The additional costin terms of needed development time is acceptable for levels 3 and 4 since the roll back iseasy because both client and servers could contain enough storage space.
The mentioned combination could be used both in server and client nodes in levels3 and 4; the update process would, ideally, always follow the scenario where the system isswitched to the updated version, which gradually enables new features. The main elementsof the software configuration in a single software node are the blue version (currentlyrunning version), the green version with feature flags, and the communication buffer(Figure 6).
Figure 6. Main elements of a single software node configuration—blue (current version), green withfeature flags (updated version), and communication buffer.

Electronics 2022, 11, 2186 9 of 28
Before the update starts, the current version (blue) is active, and the previous version(green) is passive and ready to take over if necessary (Figure 7). The deployment startswith the archiving of the previous version. At this moment, the current version is runningwithout the backup, and the updated version is being uploaded, becoming the new green.The updated version is uploaded in black mode with all feature flags disabled. In thatway, initially, the users will see no difference and they will continue to work with the sameversion of the software.
Figure 7. Blue/green + feature flags deployment strategy on a single node.
After the execution instance switches from the current (blue) to the new green, thefeature flags will be turned on in a predefined scenario. In this way, the deployment teamwill be able to control the update and, if any problems occur, keep some feature flags turnedoff until the problems are fixed and the next version is ready to deploy. The scenario ofhow to turn on and off the feature flag could be defined in multiple ways, but this topicis out of the scope of this paper. This scenario is perfectly suitable when it comes to theupdate of the server node.
In case the update of client nodes is needed, the process must be slightly modified.In the usual environment of MES or ERP level, there could be several hundred clientsconnecting to the same server. Updating all of them in a single shot is slightly risky sincethe number of the affected nodes will be significant, which could result in significantcustomer dissatisfaction. To avoid this potential threat, canary deployment for the clientswill be introduced.

Electronics 2022, 11, 2186 10 of 28
3.3. Choosing the Initial Set of Deployment Nodes
The update process for the client nodes starts by choosing the initial set of deploymentnodes. The chosen clients will serve as the target nodes for the first wave of the newsoftware version deployment—the canaries (Figure 8). After the canaries, the rest of thenodes from the group will be targeted by the update process. The nodes are divided intogroups based on the organizational or network location. In most cases, a group is the set ofnodes that belong to the same work center or area, but sometimes, one set of the node couldbe considered a group if they are connected to the same piece of the network equipment.
Figure 8. Client update distribution across the factory layout.
The methods for the node grouping and/or choosing initial nodes are not part ofthis work, but, in short, they are based on the premise that the selected nodes must beconsidered representative of their group. This means that these should be nodes with theheaviest traffic, the nodes where the higher number of actions is taken, or the nodes whichserve the highest number of different users. Each of these criteria plays its role when itcomes to choosing the canary nodes, and the nodes, depending on their position, will beselected based on the mentioned criteria.
The precise definition of the node choosing process is still considered a work inprogress and will be the topic in the next research stage. For the moment, the analysis ofthe client logs was the process that gives insight into the number of executed actions, theirdiversity, and then the number of different users followed by the client’s active time. Fromthe list of the active users, the list of their profiles could be obtained, which means thatanalyzing user diversity is possible. This helps us to define the specific measure calledthe node importance factor. The measure of node importance within its group (marked asparameter N), is calculated as:
N = A × D × U × P × (T/24.0), (1)
The higher calculated value N means the higher node importance factor. Lookingat Equation (1), the value A represents the number of registered actions per client, whilethe value D represents the action diversity coefficient. It is the value between 0 and 1 that

Electronics 2022, 11, 2186 11 of 28
represents the ratio between the number of different actions used in the specific client andthe total possible number of actions.
The next important parameters are the U and the P. Similarly to A and D, the value U isthe number of different users that were logged into the client and the D is the ratio betweenthe number of different user profiles logged and the total number of the user profiles.In addition, the value T is the number of active daily hours. All the mentioned valuesare calculated as the daily average for the last 90 days (about 3 months). In perspective,the length of the observed period will become a parameter for the calculation of thenode importance.
After the initial set of nodes has been defined, the update process can start. The update,following the method described in this paper, was performed only in these nodes followingthe previously defined approach. Consequently, when the feature flags start to be enabled,in case of a problem, only a limited number of nodes will be affected, and the correctiveactions could be performed faster and more effectively. It is also worth mentioning that thevolume of the software update could significantly affect network traffic in the productionenvironment, especially at ERP and MES levels. At the two levels mentioned, clients couldbe complex applications consuming a few hundred megabytes. The next section discussesthe additional techniques which should enhance the general hybrid approach.
3.4. The General Downtime Problem
The effect on data traffic, or reduced bandwidth, is not the only problem that could betriggered by the update process itself. The next important topic is node downtime. Duringthe update process, the targeted node could go offline for a certain period. Depending onthe implementation technology and the software type, the downtime associated with theversion switch could turn the system offline for a longer or shorter period. The effect of thenode downtime could also affect a different number of nodes. If the client node is offline,this is usually limited only to a single node. However, when the server node goes offline,all the connected clients could go to the disconnected state too. The worst-case scenarioin both cases is related to the period needed to restart the updated application. Again,this is related to the used technology and the time needed for restart could be betweena few seconds and dozens of minutes, according to our experience in different domainssuch as [51,52].
3.5. Additional Techniques Used to Improve Efficiency
To make the complete system more reliable and to improve the deployment efficiency,the system was enriched by the introduction of three additional techniques—sentinel nodes,backup nodes, and loose coupling between clients and servers using message buffers.
The idea with sentinel nodes is in line with canary deployments. The idea is to splitclients into logical groups and then pick one of the clients from each group and promoteit to the sentinel node. These groups usually consist of the client nodes belonging to thesame network segment, or the same space area, or they execute the same set of actions.This means that the selected sentinel node will be used as the initial node when an updatedversion must be deployed. Choosing sentinel nodes in advance will give the advantagein deployment planning and will ensure that the verification of the new features will gothrough the most convenient path of execution. Since the sentinel node is close to equal tothe rest of the group members, the discovered issue on that node will be equal of that onany other node.
After the updated version is verified in the sentinel node, the new software willthen be distributed to the other client nodes within the sentinel’s group. In that way, thecanary strategy is applied, which proves its value in the mentioned case. Furthermore, thisapproach with slight modification could reduce data bandwidth problems if the sentinelnode is used as the distribution point for the client update. This approach will also helpto reduce the data bandwidth from and to the server which will reduce the potential dataflood. On the other hand, the traffic in a sentinel’s network segment will be increased. This

Electronics 2022, 11, 2186 12 of 28
is not considered a major problem since the data traffic between client nodes is significantlylower than inbound and outbound server data flow.
Namely, if the update process has been run from a single node, the server, a completeupdate package will be distributed as many times as necessary to correspond to the totalnumber of clients. If the update must be conducted at ERP or MES level, the updatepackage could reach hundreds of megabytes, causing extreme outbound network load forthe server for some period. During this process, regular communication with the serverwill be seriously affected, which could result in processing delays and could cause othercommunication errors.
Using the sentinel node as the distribution point for the update will reduce the loadon the server. On the other hand, the cost for this reduced load is the increased load on thesentinel node, but the traffic will go between the clients, causing potential communicationproblems only for sentinel nodes for some period (Figure 8). The sentinel nodes act as thebranch node in the tree-like structure that could be used for the software update distributionand could be further divided into levels. To achieve further optimization in the distribution,sentinel nodes in level 1 will receive the update first (Figure 8). They will distribute theupdate to connected level 2 nodes. Level 2 nodes will distribute the update across theirsubset of the dependent nodes—to level 3 nodes. The nodes dependent on level 2 nodes arenot limited to their work center or cell but are connected to the network topology. Level 3nodes are terminal nodes in the presented example, and they will not distribute the updatesfurther. At this point, the problem of picking sentinel nodes will not be elaborated on indetail. How to choose sentinel nodes and how to organize them is an interesting topic, butunfortunately, not the focus of this paper.
This approach could be further improved by defining an updated tree for each groupof nodes. This means that the maximal number of clients connected in one group mustbe defined. These clients will then receive the update package from the sentinel node,and each of them will then forward deployment to the next nodes within the same group.In that way, the created structure will be a B-like tree, with a total update time slightlyhigher; however, the impact on overall communication bandwidth across the network willbe significantly reduced.
Sentinel nodes are a good approach where the clients have enough space to keep bothblue and green versions of the software together with an update package. Unfortunately,especially at the lower levels such as IoT and sensor networks, the hardware nodes do nothave enough storage capacity. In this case, the proposed enhanced blue/green approach isnot feasible, and the additional backup nodes will be introduced (Figure 9). The backupnode is a device with a larger storage capacity and better communication bandwidth that allowsstorage of at least two versions of the software together with an update and roll-back package.
Figure 9. Client update distribution with sentinel node (left) and backup node (right).

Electronics 2022, 11, 2186 13 of 28
As mentioned previously, since this case does not allow the possibility of having twoversions in the same client node, downtime during the update is unavoidable. The updateprocess on the single client will consist of stopping the previous version, replacing it with acompletely new set of files, and then running an updated version. If the error is detectedon the client node after the update, the backup node will trigger the roll-back process. Inthis scenario, the backup node handles the complete update process and takes care of theorder of the update. The backup node will choose which client nodes will be first to receivean update and then will take care of the update sequence. Moreover, if the feature flagapproach is possible, the backup node will take control of turning feature flags on afterthe deployment.
In both mentioned approaches, one problem that could lead to the downtime of thecomplete system is the situation when the server needs to be updated and the process itselfis such that the server will be offline. Moreover, if the server needs to restart, the sameproblem will appear. To avoid this problem, the introduction of the message queue is thedesirable technique whenever it is possible—at IoT and MES levels. Having a messagequeue between clients and servers will make client operations possible when the serveris not active. Message queues could be implemented in the client nodes or as part of theserver. Moreover, in lower layers, it is common to implement a joint message queue forthe set of client nodes. Message queues will collect and send messages to the server oncethey become active again. Clients will detect that they are disconnected, but using themessage queue will allow them to have at least some operations active and possible. Fullfunctionality will be restored when a server is online again.
4. Results and Analysis
The main goal of this research was to define a deployment strategy, followed bycustom-built monitoring and deployment tools, which will make the update process easierand more effective. This paper, tending to present the first results, is focused on differentdeployment strategies and their combination into a hybrid approach. The presentedapproach is not to look at the different deployment strategies as opposing, but to considerthem together as complementary and thus use the best features from each of them.
The term “easier” used in this paper is related to the more ergonomic deploymentenvironment that will allow the administrator to easily identify potential problems and reactfaster. The next steps in the development will include more intelligent system responsesthat will automatically trigger maintenance actions. The dark method with feature flags isthe main paradigm that helps in this sense. The possibility to revert the functionality tothe previous version in the runtime, without additional downtime and network traffic thatwould be required with the hard roll back, is the main contribution to the “easier” roll back.
The term “more effective” is used in the sense that the proposed approach shouldreduce downtime whenever and wherever possible, to try to eliminate data loss and reducethe potential traffic peaks in some segments during the update and roll-back processes.This updated efficiency and reduced data traffic peaks are paid for by the potentially longerupdate period.
4.1. Effects on Server Nodes
To achieve the research goal, the decision was to replace the standard update strategy.The standard update strategy is defined by three basic steps—copy the updated version tothe destination node, stop the current version, and run the updated version. This strategyis replaced with a new hybrid approach where different scenarios are active in a slightlydifferent configuration.
Defining a common node structure (Figure 6) made an initial step toward the de-ployment process standardization and made the transition from the standard deploymenttowards a hybrid approach at the node level via a basic blue/green strategy possible(Figure 10). Standard deployment leaves the system in disconnected mode for a long time.The downtime period itself is calculated simply as the difference of average moments

Electronics 2022, 11, 2186 14 of 28
where all clients (n—total number of clients) are reconnected after restart (CR) and themoments when the client is disconnected (CD), as in the following:
DT =1n
n
∑k=1
(CRk − CDk) (2)
Figure 10. Comparison of server node restart process with the standard approach, blue/green andblue/green with feature flags.
The moment where client disconnection is detected could also be looked at from theserver’s perspective and this is the moment where, in shutdown procedure, communicationservices are terminated. From the server’s point of view, the important moment is whenthe first client has connected again. This is the moment when the server could verify thatit is again able to exchange data with the clients. For this paper, more important is themeasure from the client’s point of view since it gives a feeling of the system downtime thatis closer to the customer’s perception.
To reduce the described downtime effect, blue/green deployment is an often-usedapproach. In this case, the downtime is limited to the switchover time, the period afterclients are disconnected from blue (lead-in part of the downtime), and the period whenthe clients establish the connection again to green. A switchover routine run by a separatepiece of software is used to handle state change both for blue and green instances. In thisscenario, clients are only aware of connection and disconnection events and look to theserver as a single node.
By enabling feature flags, the downtime period could be reduced further, and thismakes an important contribution to the hybrid approach. Since communication servicescould be treated as the feature of the software node, the green instance could be runningbefore the switchover starts. In this case, the switchover routine will trigger communicationto start on green and communication to close in blue which would reduce the lead-in partof the downtime period. The additional update, which is a part of the future researchthat could reduce downloads further, could be implemented on client nodes. Clientnodes could ping the green instance immediately after they lose connection to blue and

Electronics 2022, 11, 2186 15 of 28
within milliseconds reestablish their operation. This update would require additionalprogramming effort, but the downtime on the client-side will then be close to 0, leading tobetter customer satisfaction.
The effect of the blue/green approach at ERP levels is displayed in Table 1. In bothcases, the architecture is a standard client/server where one server node is connectedto several dozens of clients. The used test environment had one ERP connection serverfollowed by 320 clients. For the testing, clients were grouped into groups of 20, where eachgroup belonged to the same network segment. The servers were in an isolated firewall-guarded network with traffic control. The overall access time between groups of clientsand the server is not equal, and in some cases, data packets travel through the differentsetup of network devices between the client and the server.
Table 1. ERP level—server node restart (regular case, all measurements in seconds, STD—standardapproach, B—blue, G—green, FF—feature flags).
Measure (Average of 10) STD B/G B/G vs. STD (%) B/G + FF B/G + FF vs. STD (%)
Server Shutdown 126.44 (B) 129.39 102.33 (B) 131.15 103.72Clients disconnected after (CD) 8.30 261.72 NA 268.05 N/A
Server start (duration) 240.72 (G) 259.89 107.96 (G) 266.39 110.66Full server restart process completed 371.58 280.06 75.37 277.94 74.80
1st client reconnected 375.19 284.93 75.94 280.31 74.71All clients reconnected (CR) 380.65 291.16 76.49 285.77 75.07
Total combined downtime (CR-CD) 372.35 29.44 7.91 17.72 4.76
With the standard approach, server shutdown starts at some point, and soon after (onaverage, after 8.30 s), clients are disconnected from the server and the downtime is countedfrom this point. After both shutdown and start processes are completed, the system is backonline when the SERVER_STARTED signal can be detected. This happens after 371.58 s(about 6 min) on average. Then, the clients need to reestablish the connection, whichrequires approximately 10 s more. Then, the average downtime for the server update ismore than 6 min (372.35 s (about 6 min)).
With the proposed update, total downtime is reduced to less than 20 s (17.72 s). Themain gain is that the time for the previous version’s shutdown and the start of the newone is not accumulated. The updated version is started while the old one is running. Thecritical moment is the communication switch. The communication switch starts now whenthe new system becomes active. After this point, clients are disconnected after no morethan 2 s, and this point represents the start of the downtime (on average, this happens 268 s(about 4 and a half minutes) after the restart process begins).
Activating the updated version and communication switch takes around 10 s, andafter approximately 278 s (about 4 and a half minutes), the updated version fires theSERVER_STARTED event. All the clients become connected again in less than 20 s afterthe moment when they become disconnected. In this way, the downtime is reduced morethan 18 times, and the complete process could be considered almost transparent for theclient nodes. In this scenario, the effect of the dark deployment with feature flags is seenin the slightly higher startup time, since their implementation requires an additional coremodule that needs to be started early in the loading sequence (131 vs. 126 s (about 2 min))and without the possibility to be loaded simultaneously with other functionality.
A more complex case occurs when the problem is noticed and when the system needsroll back (Table 2). The roll back in the regular case requires system shutdown, configurationupdate back to the original, and the server restart in the sequence (Figure 11). With theaddition of the time needed for the client reconnection, the total downtime is easily raisedto more than 7 1
2 minutes. If it is considered that the regular update happens before theerroneous one, the total accumulated downtime for the deployment and roll back is almost15 min, which is, in some environments, close to unacceptable.

Electronics 2022, 11, 2186 16 of 28
Table 2. ERP level—server node restart (roll back required, all measurements in seconds, timereference point—restart/roll back process initiated, STD—standard approach, B—blue, G—green,FF—feature flags).
Measure (Average of 10) STD B/G B/G + FF
System Shutdown 127.18 (G) 130.81 (G) 0Configuration update 65 0 3.85
All clients disconnected (CD) 4.55 2.19 0.55Restart/Switchover Completed 440.74 (B) 13.85 (G) 5.21
1st client reconnected 445.91 18.77 8.64All clients reconnected (CR) 448.63 24.04 11.96
Total downtime (CR–CD) 444.08 21.85 11.41Downtime compared to STD (%) 100 4.92 2.08
Figure 11. Comparison of server node restart process with the standard approach, blue/green andblue/green with feature flags in the case when a roll back is needed after the software update.
The roll back in the case of simple blue/green deployment is slightly higher than inthe case of the upgrade. The additional time to update the configuration is not needed, butthe total switchover time consists of client disconnection and synchronization switchover.In the average case, this is slightly under 14 s. If the time needed for the client reconnectionis summed up, it could be concluded that it is a few moments more than 24 s. Combinedwith the initial system update, the total downtime, in this case, is around 42 s. Comparedwith almost 15 min in the initial case, it is a little more than 5% of the initial time.
Looking at the process when a system upgrade is followed by the detected error(Figure 11), the standard approach is proven to be the least effective. Total downtime istwice the time needed for restart, increased with the time needed for the configurationrestore. Standard blue/green reduces the time needed for the configuration restore sincethe blue version is ready to be reactivated, thus the total downtime is twice that of the caseof a successful update. In the case when feature flags are used, the roll-back time will befurther reduced only for the time needed to switch the new features off. In this case, greenwill continue to run, and clients would not need to have a long disconnection period.
Enabling the dark method with the feature flags will reduce the switchover time in theroll-back case even more. In this case, the switchover to a new software instance will not be

Electronics 2022, 11, 2186 17 of 28
needed. The only action needed by the deployment engineer is to turn the feature flags offand eventually wait until all the clients are reconnected. Depending on the nature of thechange, the total time needed is the time needed for the configuration update increasedby the time needed for client reconnection. In the worst-case scenario, this time is close to12 s, which is 50% of the time needed for the clear blue/green deployment (Table 1). Thetotal time needed for the update and the roll back combined is under 30 s (29.86 s), whichmakes only 3.62% of the time needed with the standard approach—820.98 s (about 13 and ahalf minutes).
The proposed effect is suitable for the server nodes and makes their update and roll-back processes significantly more effective than in the case of a regular approach (Figure 12).The analysis of network traffic does not apply to the server nodes, since only one softwareinstance needs to be uploaded at once. Server nodes have enough storage space to keepmultiple instances of the software packages, so the analysis mentioned is irrelevant.
Figure 12. Comparison of time needed for various stages of the update process using standard,blue/green, and blue/green with feature flags approach.
4.2. Effects on Client Network Nodes
Traffic analysis is more than relevant in the case of client deployments. First, theupdate package needs to be distributed to each client. Then, this updated package mustbe unpacked, and the version needs to be updated. This update process looks like the onefrom the server nodes, the only difference being that clients sometimes do not have enoughspace to keep multiple versions. For the client deployment, the following cases will beconsidered—standard approach, canary with sentinel, and canary with backup node. Thedifference between canary with sentinel and canary with backup node is the fact that in thelatter one, the clients do not have enough storage space to store more than one version ofthe software.
For this research, four variations of the test client network are used (Figure 13). The testis, at first, conducted with standard deployment where all nodes are updated at once. Thesecond experiment was to run deployment in two waves using the basic canary approach—first, the subset of 20 nodes is updated, followed by the remaining 300. The third scenariois based on the usage of canary networks with the sentinel nodes. Sentinel nodes will beupdated first, and they will handle the update for the nodes in their subnetwork. In thisscenario, all the nodes are equal by their structure and capability, thus sentinel node couldbe at any moment replaced by some other node from its network.

Electronics 2022, 11, 2186 18 of 28
Figure 13. Schematic comparison of analyzed deployment strategies (standard approach, basic canary,canary with sentinel node, and canary with backup node).
The same idea is used in the fourth scenario, where backup nodes replaced sentinels.The major difference in the third and fourth scenarios is that nodes in the fourth scenarioare considered less capable than the backup nodes and they are not able of supportingthe proposed common node structure but only keeping one version of the software at agiven moment.
For the test, the environment configuration with 320 clients was used. The testenvironment is generated as the 4× multiplication of the real environment as in Figure 8.In standard deployment, they are not grouped at all. In canary deployments, they aregrouped in buckets of 16 clients. This makes 20 client buckets. The average client updatepackage size is considered to be the file of 50 MB of data.
In scenarios with standard and sentinel approaches, all the clients’ nodes are the same,while in the configuration with backup nodes, the backup node is a more capable hardwarenode in terms of storage space. Regarding deployment configuration, clients in canary withsentinel are supported with both blue/green deployment and dark mode with feature flags.In the configuration with backup nodes, the full set of deployment approaches is applicableonly on backup nodes, while other clients are capable only of the standard update (Table 3).

Electronics 2022, 11, 2186 19 of 28
Table 3. Effects of different client deployment approaches (regular case, deployment successful,STD—standard approach, WoD—wave of distribution).
Measure (Average of 10) STD BasicCanary
Canary withSentinel
Canary withBackup Node
Number of update packages sent fromthe server to clients (1st WoD) 320 20 20 20
Amount of data sent from the serverto clients (in GB, 1st WoD) 15.63 0.98 0.98 0.98
Network traffic peak(in %, server outbound, 1st WoD) 100 100 67.75 70.88
Network traffic peak duration (inseconds, server outbound, 1st WoD) 214.57 166.82 18.77 18.65
Space needed per 1st WoD (in MB) 120 120 120 180
Space needed per 2nd Wod (in MB) 120 120 120 60
Distribution group size (2nd WoD) - 300 16 16
Amount of data sent in a group ofclients (in GB, 2nd WoD) - 14.68 0.78 0.78
Distribution time per group of clients(in seconds, 2nd WoD) - 239.55 21.05 19.86
Single client switchover/update time(in seconds) 32.28 34.87 4.58 37.85
The time when 1st client reportedback with the updated version 116.52 105.77 52.06 54.71
Total update time (all clients reportedback with the updated version) 231.42 188.54 121.63 180.34
Total update time compared to theSTD (in %) 100 81.47 52.56 77.93
Looking at the number of the emitted updated packages and the total amount ofdistributed data, these numbers are equal in all four scenarios. A total of 320 packagesare sent over the network. With the package size of 50 MB, it makes the total amount oftransferred data 15.63 GB. The distribution of the update packages is the point that makesthe difference (Figure 14). In the standard approach and basic canary, update packages areemitted from a single spot, making a massive impact on data traffic and causing a highnetwork load. Since, in practical deployments, this update distribution node is usuallya server node, the effect on the complete system performance is obvious. Thus, there isupdate package distribution to sentinel or backup nodes for the second wave of the client.In this scenario, the server will send less than 1 GB of data to the first wave canary nodes,and then each of them will send 0.78 GB of data within its subnetwork.
This will help to reduce network peaks duration, distribution, and total update timeneeded (Figure 15). In the controlled environment, such as a test network, a network peakof 100% was detected in the server node and lasted for more than 3 1
2 minutes for standarddeployment and almost 3 min for the basic canary approach. In the remaining two cases,with sentinel/backup nodes, the highest network peaks were around 70% and lasted lessthan 20 s.

Electronics 2022, 11, 2186 20 of 28
Figure 14. Comparison of the number of update packages and distribution group size per differentclient deployment approaches.
Figure 15. Comparison of time needed for various stages of the client update process.
Distribution time decrease is the collateral benefit of the introduction of sentinel nodesand network traffic reduction. The time needed for the basic canary or standard approachis somewhere between three and four minutes, while for the updated canary scenarios, thetime is on the level of 20 s. Another significant improvement is the time needed for thefirst node to report back with the updated version. For the updated canaries, this is at thelevel of 50 s, while for the basic canary and standard deployment, the value is raised to2 min. Here, it is important to point out that the time for the client to report back is the timeneeded to upload an updated version combined with the time for a software switchoverin the client node. Wherever it is possible to implement a common node structure, theswitchover time was under 5 s, while for the nodes without this possibility, version changewas between 30 and 40 s.
Having this in mind, it can be concluded that the most effective deployment environ-ment is the one with the sentinel nodes. Using this approach, the effect of the networkbottleneck will be avoided, which is not possible when using the standard approach. Thiseffect causes the most delay in the standard deployment process. When the server emitsupdate packages, the network becomes overloaded for some amount of time, causing theprolonged execution of software updates.

Electronics 2022, 11, 2186 21 of 28
With the updated canary approaches, the 100% network peak is not present since thetotal amount of emitted data is only 1/20 of the amount of data with the initial approach.Further update package distribution is conducted in the client network where sentineland backup nodes coordinate updates within their groups. Distribution time is close inthe configuration with sentinel and backup nodes. The difference is evident in the totalupdate time. In the configuration with backup nodes, there is no possibility to implementthe blue/green approach in all clients, but only in backup nodes. Thus, the update forthe remaining client instances must be as in the standard deployment approach and willconsume a significant amount of time.
The results for the case when the roll back is needed are shown in Table 4, and theircomparison in Figure 16. The results may vary depending on the node structure used forthe test. If the hardware has enough storage and processing power to bear the generalnode structure as proposed in this research, the overall switchover time will be significantlylowered. The application of the blue/green strategy enhanced by dark mode and featureflags was discussed in the previous section and the same conclusions apply to the clientnodes. In the presented research, the only scenario where the proposed node structure isnot applicable is the canary with backup nodes. By design, this approach is used wherethere is no possibility to secure the necessary number of nodes with a higher capacity.
Table 4. Effects of different client deployment approaches (roll back needed case).
Measure (Average of 10) Standard Approach Basic Canary Canary with Sentinel Canary with Backup Node
Single client switchover/restarttime (seconds) 34.10 35.18 6.78 8.05
The time when 1st clientreported back with the previous
version (seconds)40.21 46.88 11.67 12.45
Total update time (all clientsreported back with the previous
version) (seconds)91.33 74.04 21.19 26.72
Update time compared to thestandard approach (%) 100 81.06 23.20 29.25
Figure 16. Comparison of time needed for various stages of the client update process when a rollback is needed.

Electronics 2022, 11, 2186 22 of 28
The immediate advantage for the clients who have enough storage space is the factthat there will be no need to re-emit update packages from the server. In the standardapproach, the client will just shut down the current version, and start the previous one.In the other three cases, only roll back will be needed in sentinel/backup nodes while theother clients will not be affected since they will stay with the old software version. Thus, inroll back, none of the nodes will send additional packages for the update.
The total required time where all clients return to the previous version is just above 90 s(1 and a half minutes), while the time needed for full roll back with sentinel and backuplead client networks is 21.19 and 26.72 s, respectively. This is on the level between 20 and30% compared to the initial strategy.
5. Discussion
The immediate benefit of the blue/green approach is instantly visible on every leveland every type of node. Whenever it has been applied, the downtime is reduced fromthe amount needed from software restart time (shut down + start) to the communicationswitch time. With this approach, it is safe to let the previous version run until the updatedversion is updated and started. Once the updated version is started, the communicationneeds to switch to the updated version. During this process, the previous version will go tothe disconnected state and then later will be shut down. At the same time, the updatedversion will become active and take over the functionality. Enhancing the node withalready implemented blue/green with the feature flags and dark launch approach is a stepfurther. With this combined approach, the lead-in part of the downtime will be reduced,and the complete switchover will be more effective. The combined approach is applicableboth on the server and client nodes with proven effects. One conditional downside of theintroduction of such a deployment scenario is a need for additional software deploymentsince the complete software segment related to feature flags must be carefully designedand implemented alongside the other features.
If the blue/green update process is applied to the server node, the downtime will bein seconds, rather than minutes. For the clients, the same scenario will result in similardowntime. Depending on the implementation, active client connections could be trans-ferred from the previous version to the new one and in this case, the additional downtimefor the clients is close to nothing. On the other hand, if this is not possible, clients willbecome disconnected when the previous version goes offline and will then be connectedagain when they become able to ping a new running instance of the server process. Thetotal benefit is significant since the complete process looks seamless from the client’s pointof view. A potential loss of data is also reduced due to the lower communication downtime.
Any deployment scenario, but especially blue/green, could be further improved byadding message buffers between clients and the server node. If the client comes withthe implemented message queue, this will collect messages that should be sent from theclient to the server until the server is down and, theoretically, no data loss will happenin the client-to-server communication. This is one of the directions for future researchand experiments with diverse types of message queues could help in achieving betterperformances under different environmental conditions.
As has been mentioned before, the dark method with feature flags is used in theproposed hybrid deployment solution as the extension of the blue/green deployment, andit applies to any kind of software node. The effect of this method is not that visible duringthe regular deployments mostly during the roll-back process. Once the software instancegets switched from the old to the updated version, all feature flags will be disabled, and thesystem will operate with the same configuration. Feature flags will then be activated, andthe system behavior will be monitored. If some problem appears, the feature flags couldbe disabled, and the system roll back, in the ideal case, will be conducted without anothersoftware restart. With this approach, the roll back is switching the feature flag back to theinitial state.

Electronics 2022, 11, 2186 23 of 28
The dark method with feature flags applies both to the server and client nodes withequally favorable effects. Rolling back to the previous version without software restartis especially important for the clients at lower levels, such as sensor nodes. These nodesusually operate on batteries in a remote environment, and the amount of power neededfor the transfer of the updated version and software restart is higher than the amount ofenergy they need for regular operation. The possibility to avoid node restart when a rollback is needed will significantly save the battery power and the node will not be at risk ofremaining without the power in the middle of the update process.
Blue/green and dark mode deployments are mostly related to the updates of thesingle nodes. For the update scenario for large client networks, canary deployment is awell-known and widely used method. It proves its worth even in its basic configuration,but with the proposed updates based on the introduction of backup and sentinel nodes,its potential is increased. The possibility to send the update to the initial set of nodes isused for the final verification before the full set of clients becomes updated, which is thestrongest advantage of any canary deployment. To make the set of canary nodes morerepresentative, the clients should be split into logical groups, and one of the nodes shouldbe promoted to the sentinel node. This node is chosen heuristically and it should be agenuine representative of the whole group. Usually, the node would run most of theupdated functionalities, so the results will be relevant. The sentinel node could also beused as the distribution node that will trigger the update within the same group. In thisway, the server will not have the traffic peak when it comes to the client update process.The server will distribute the updated version to sentinel nodes, and sentinel nodes willdistribute updates within their group.
In cases when the clients are limited with space and where it is not possible to storetwo versions of the software simultaneously, the backup node will be used as a conceptthat will replace the sentinel node. The backup node will take responsibility for the updatedistribution. It will choose the initial node for the software update (choose its canaries),enable feature flags, and then follow up the update to the other nodes.
During this research, the proposed approach was tested in level 4 and partly level3 applications—ERP and MES. The applications running to these two levels are closestto most of the users and they work in an environment where networking the bandwidthand the storage space in a single node is not so problematic compared to sensor networks(level 1) and IoT (level 2) nodes, where the challenges are different as has been explainedin [53]. In any case, we hope that the described approach is general enough that it couldbe used in every layer with a slightly different setup of the elements used. Our parallelresearch shows the expected results in the lower-level nodes [34]. The current conclusioncould be represented by the scheme of the usage of different strategies according to thesoftware level, as has been shown in Table 5.
Table 5. Elements of the deployment strategy used in various levels (BG—blue/green, DF—darkmode with feature flags, CS—canary with sentinel node, CB—canary with backup node, IB—intermediate buffer, (XX)—optionally).
Level Server Client Network Single Client
Levels 0 and 1 (sensor network) BG + (DF) CB + IB (BG) + IBLevel 2 (IoT nodes and edge computers) BG + (DF) CB/CS + IB BG + IB
Level 3 (MES) BG + DF CS/CB BG + DF + IBLevel 4 (ERP) BG + DF CS BG + DF + IB
The blue/green is the major choice for any server deployment. Server nodes are notnumerous in the overall network, so the number of software uploads will not be high inany case, which means that the problems with the data traffic should not appear. Next,wherever it is possible, the strong suggestion is to include a dark mode with feature flags.Due to the technology limitations, the proposed hybrid strategy was used in MES and ERPclients in the current test deployment setup.

Electronics 2022, 11, 2186 24 of 28
Bearing in mind the complexity of server-side software in levels 3 and 4, one potentialdirection for future work is the introduction of microservice architecture; the introductionof microservices at least on levels 3 and 4 will be considered. Microservices will be a crucialstep forward since they allow deployment of the updates to the isolated part, withoutaffecting the rest of the system. The complete microservices structure consists of severalindependent microservices, unlike the standard server architecture with a single serviceloading multiple modules. In the case when one microservice crashes, it will not causethe general failure of the total system. Since the erroneous service is isolated, the rest ofthe system will continue to run. Microservice architecture has higher fault tolerance andfaster recovery compared to the standard system. The cost of microservice introduction isincreased complexity needed for orchestration and interservice communication.
The overall analysis of the potential benefits is shown in Table 6. There, the totalnumber of nodes in the network is defined as NN, while the number of nodes in level 1 ismarked with N1. One level 1 node is usually used as the sentinel/backup node for a singlelevel 2 group. Sometimes, this is not the case, and thus the number of level 2 groups coulddiffer from N1. This value is marked with G. This could happen when multiple groupshave one sentinel node due to the network topology, or where one level 2 group could havemore than one sentinel/backup node.
Table 6. The estimated effects of the proposed deployment strategy (TD—time to shut down thesoftware in the node, TU—time to start the software in the node, TS—time switch between theversions, IS—software instance size per node, BS—buffer size, NN—total number of nodes, N1—number of level 1 nodes, G—number of level 2 groups).
Measurement With Standard Deployment With One of the KnownStrategies With Hybrid Approach
Number of software uploads tolevel 1 nodes (successful
deployment)NN
Canary:First wave: N1
Second wave NN—N1Up to N1
Number of software uploads tolevel 2 nodes (average per group,
successful deployments)0 0 (NN − N1)/G
Number of software uploads tolevel 1 nodes (roll back needed) NN N1 Up to N1
Security checks on upload NN N1 1
Downtime per node TD + TU Blue/Green: TS TS
used space per node IS Blue/Green: 2 × IS 2 × IS + BS
Total used space NN × IS NN × 2 × IS NN × (2 × IS + BS) + IS
Update distribution Manual or with a taskscheduler With task scheduler Optimized in server or
sentinel/buffer node
These values are important since they are used to estimate the number of client uploadswithin the complete network as well as its segments and subsegments. Moreover, witha knowledge of the size of the updated package (IS, in the calculation table), it is easy tofurther calculate the network traffic during the update process and to estimate the hardwarerequirements for the clients, server, and the network throughput.
Additional values that are important to measure the system behavior and to estimatepotential downtimes are the values TD, TU, and TS which are, respectively, time needed toshut down the software instance, the time needed to start it up, and the time needed for theswitchover between two software versions where the targeted node can run the softwaredeployed in the blue/green or blue/green with the feature flags manner. The usual timeneeded for the node full restart is TD + TU, and if the possibility for the switchover exists,the time is TS.

Electronics 2022, 11, 2186 25 of 28
With the standard deployment, the complete process is handled either by an engineeror as the scheduled task forwarded through the node network. The biggest possibleproblem is the possibility of human error during the update. For this reason, all well-known strategies require automatization. The automated set of steps reduces the need forintervention in most cases. The proposed hybrid approach is a step forward in this directionsince the update is performed through the piece of software running in the sentinel/backupor the server node. This approach gives better control and monitoring, at the cost of theadditional software development.
Regarding client networks, canary deployment is a safe way of ensuring fewer prob-lems in the case of roll back. Depending on the computing power and storage space, thegeneral suggestion would be to use a canary with a sentinel or a canary with a backup node.The latter one is used in the lower levels where space could be considered a significantissue. This strategy may be further improved by the research on more effective algo-rithms that should help when choosing the optimal representatives for canary, sentinel, orbackup nodes.
6. Conclusions
Deploying software in a complex industrial system is a challenge since it should workwith high reliability with the applications developed in heterogeneous environments anddedicated to different ISA-95 levels. Over the years, we experimented with many diverseand well-known deployment strategies, and the conclusion was that every strategy has itsstrengths and weaknesses. Thus, the decision to combine blue/green, canary, dark, andfeature flag deployments into a synergistic system making a hybrid deployment approachwas made.
Together with the hybrid deployment approach, we imposed the usage of the addi-tional techniques to make a more error-proof deployment. These techniques assume theuse of sentinel nodes and inter-level buffer. We suggest using this kind of buffer in theclient machines whenever possible since this will reduce the data loss in cases where clientscould stay disconnected for some period and where the loss of the collected data is notacceptable. In cases when the usage of the sentinel node is not possible, the application ofthe backup node is suggested.
Using the proposed hybrid strategy together with the additional techniques mentioned,we managed to reduce the downtime when the updated version of the software is deployedand reduce the effect of the high network load during the software update. The proposedapproach gave the best effect for roll-back scenarios for server nodes—the downtime isreduced to only 3% compared with the standard approach. The improvement for thesuccessful update is also significant and it is under 6% of the downtime when the regularapproach is used. For client network updates, the best scenario is the use of the network ofequal nodes where some of them are considered sentinel nodes. In this way, the replacementof the sentinel node is possible at any given moment. Downtime in this scenario is 50%compared to the downtime for the successful updates, and only 30% in the case when aroll back is needed. Network peak reduction is from 100 to 70% of network load, and theduration of network peak period is reduced from approximately 200 to only 20 s.
The proposed hybrid deployment scenario together with the common software nodestructure looks like a promising system that will be developed further and validated ina real production environment. The system is currently undergoing testing in the lowerISA-95 levels with promising results. The hidden cost behind the described concepts is theadditional time needed for programming and verification. Fortunately, this cost eventuallypays off since the lower downtime and stable production system lead to higher customersatisfaction and better overall software acceptance.

Electronics 2022, 11, 2186 26 of 28
Author Contributions: Conceptualization, P.R. and D.A.; methodology, P.R., D.A. and D.J.; software,P.R. and A.D.; validation, A.D. and D.J.; formal analysis, D.J. and D.A.; investigation, P.R. and A.D.;resources, P.R. and D.A.; data curation, P.R.; writing—original draft preparation, P.R.; writing—review and editing, P.R., D.A., A.D. and D.J.; visualization, P.R. and A.D.; supervision, D.J.; projectadministration, P.R.; funding acquisition, P.R. and D.A. All authors have read and agreed to thepublished version of the manuscript.
Funding: This work has been funded by the Ministry of Education, Science, and TechnologicalDevelopment of the Republic of Serbia, grant number 451-03-68/2022-14/200102.
Institutional Review Board Statement: Not applicable.
Informed Consent Statement: Not applicable.
Data Availability Statement: The data were generated during the study at the Faculty of ElectronicEngineering, University of Niš.
Acknowledgments: This work has been supported by the cost action CA 19135 CERCIRAS (Connect-ing Education and Research Communities for an Innovative Resource Aware Society).
Conflicts of Interest: The authors declare no conflict of interest. The funders had no role in the designof the study; in the collection, analyses, or interpretation of data; in the writing of the manuscript, orin the decision to publish the results.
References1. Shu, Z.; Wan, J.; Zhang, D.; Li, D. Cloud-integrated cyber-physical systems for complex industrial applications. Mob. Netw. Appl.
2016, 21, 865–878. [CrossRef]2. Wan, J.; Tang, S.; Shu, Z.; Li, D.; Wang, S.; Imran, M.; Vasilakos, A.V. Software-defined industrial internet of things in the context
of industry 4.0. IEEE Sens. J. 2016, 16, 7373–7380. [CrossRef]3. Kharchenko, V.; Kondratenko, Y.; Kacprzyk, J. Green IT Engineering: Concepts, Models, Complex Systems Architectures; Springer
International Publishing: Cham, Switzerland, 2017; p. 305.4. Wang, Q.; Jiang, J. Comparative examination on architecture and protocol of industrial wireless sensor network standards. IEEE
Commun. Surv. Tutor. 2016, 18, 2197–2219. [CrossRef]5. Sajid, A.; Abbas, H.; Saleem, K. Cloud-assisted IoT-based SCADA systems security: A review of the state of the art and future
challenges. IEEE Access 2016, 4, 1375–1384. [CrossRef]6. Anton, S.D.; Fraunholz, D.; Lipps, C.; Pohl, F.; Zimmermann, M.; Schotten, H.D. Two Decades of SCADA Exploitation: A Brief
History. In Proceedings of the 2017 IEEE Conference on Application, Information and Network Security (AINS), Miri, Malaysia,13–14 November 2017; pp. 98–104.
7. Mantravadi, S.; Møller, C. An overview of next-generation manufacturing execution systems: How important is MES for industry4.0? Procedia Manuf. 2019, 30, 588–595. [CrossRef]
8. Abd Elmonem, M.A.; Nasr, E.S.; Geith, M.H. Benefits and challenges of cloud ERP systems—A systematic literature review.Future Comput. Inform. J. 2016, 1, 1–9. [CrossRef]
9. Karnouskos, S.; Sinha, R.; Leitão, P.; Ribeiro, L.; Strasser, T.I. Assessing the Integration of Software Agents and IndustrialAutomation Systems with ISO/IEC 25010. In Proceedings of the 2018 IEEE 16th International Conference on Industrial Informatics(INDIN), Porto, Portugal, 18–20 July 2018; pp. 61–66.
10. Kumar, K.; Kumar, S.; Singh, L.K.; Mishra, A. Predicting Reliability of Software in Industrial Systems using a Petri Net basedApproach: A Case Study on a Safety System used in Nuclear Power Plant. Inf. Softw. Technol. 2022, 146, 106895. [CrossRef]
11. Castrillon, J.; Lieber, M.; Klüppelholz, S.; Völp, M.; Asmussen, N.; Assmann, U.; Baader, F.; Baier, C.; Fettweis, G.; Fröhlich,J.; et al. A hardware/software stack for heterogeneous systems. IEEE Trans. Multi-Scale Comput. Syst. 2017, 4, 243–259. [CrossRef]
12. Kassab, M.; Mazzara, M.; Lee, J.; Succi, G. Software architectural patterns in practice: An empirical study. Innov. Syst. Softw. Eng.2018, 14, 263–271. [CrossRef]
13. Souza, E.; Moreira, A.; Goulão, M. Deriving architectural models from requirements specifications: A systematic mapping study.Inf. Softw. Technol. 2019, 109, 26–39. [CrossRef]
14. Ozkaya, M.; Erata, F. A survey on the practical use of UML for different software architecture viewpoints. Inf. Softw. Technol. 2020,121, 106275. [CrossRef]
15. Salman, T.; Jain, R. A survey of protocols and standards for internet of things. arXiv 2019, arXiv:1903.11549. [CrossRef]16. Amini, M.; Abukari, A.M. ERP Systems Architecture for The Modern Age: A Review of The State of The Art Technologies. J. Appl.
Intell. Syst. Inf. Sci. 2020, 1, 70–90.17. Mugarza, I.; Parra, J.; Jacob, E. Analysis of existing dynamic software updating techniques for safe and secure industrial control
systems. Int. J. Saf. Secur. Eng. 2018, 8, 121–131. [CrossRef]

Electronics 2022, 11, 2186 27 of 28
18. Wood, T.; Cherkasova, L.; Ozonat, K.; Shenoy, P. Profiling and modeling resource usage of virtualized applications.In ACM/IFIP/USENIX International Conference on Distributed Systems Platforms and Open Distributed Processing; Springer:Berlin/Heidelberg, Germany, 2008; pp. 366–387.
19. Taherizadeh, S.; Jones, A.C.; Taylor, I.; Zhao, Z.; Stankovski, V. Monitoring self-adaptive applications within edge computingframeworks: A state-of-the-art review. J. Syst. Softw. 2018, 136, 19–38. [CrossRef]
20. Leyh, C.; Schäffer, T.; Bley, K.; Forstenhäusler, S. Assessing the IT and Software Landscapes of Industry 4.0—Enterprises: TheMaturity Model SIMMI 4.0. In Information Technology for Management: New Ideas and Real Solutions. ISM AITM 2016 2016—LectureNotes in Business Information Processing; Ziemba, E., Ed.; Springer: Cham, Switzerland, 2017; Volume 277. [CrossRef]
21. Lasi, H.; Fettke, P.; Kemper, H.G.; Feld, T.; Hoffmann, M. Industry 4.0. Bus. Inf. Syst. Eng. 2014, 6, 239–242. [CrossRef]22. Ammar, M.; Haleem, A.; Javaid, M.; Bahl, S.; Verma, A.S. Implementing Industry 4.0 technologies in self-healing materials and
digitally managing the quality of manufacturing. Mater. Today Proc. 2022, 52, 2285–2294. [CrossRef]23. Tran, M.Q.; Elsisi, M.; Liu, M.K.; Vu, V.Q.; Mahmoud, K.; Darwish, M.M.; Abdelaziz, A.Y.; Lehtonen, M. Reliable Deep Learning
and IoT-Based Monitoring System for Secure Computer Numerical Control Machines Against Cyber-Attacks with ExperimentalVerification. IEEE Access 2022, 10, 23186–23197. [CrossRef]
24. Elsisi, M.; Tran, M.-Q.; Mahmoud, K.; Mansour, D.-E.A.; Lehtonen, M.; Darwish, M.M. Towards Secured Online Monitoring forDigitalized GIS Against Cyber-Attacks Based on IoT and Machine Learning. IEEE Access 2021, 9, 78415–78427. [CrossRef]
25. Tran, M.-Q.; Elsisi, M.; Mahmoud, K.; Liu, M.-K.; Lehtonen, M.; Darwish, M.M. Experimental Setup for Online Fault Diagnosisof Induction Machines via Promising IoT and Machine Learning: Towards Industry 4.0 Empowerment. IEEE Access 2021, 9,115429–115441. [CrossRef]
26. Elsisi, M.; Tran, M.-Q.; Mahmoud, K.; Mansour, D.-E.A.; Lehtonen, M.; Darwish, M.M. Effective IoT-based deep learning platformfor online fault diagnosis of power transformers against cyberattacks and data uncertainties. Measurement 2022, 190, 110686.[CrossRef]
27. Gaur, M. ERP Migration Challenges and Solution Approach Focused on SAP customers. Int. J. Adv. Res. Comput. Sci. Technol.2020, 8, 15–21.
28. Cuka, M.; Elmazi, D.; Bylykbashi, K.; Spaho, E.; Ikeda, M.; Barolli, L. A Fuzzy-Based System for Selection of IoT Devices inOpportunistic Networks Considering IoT Device Storage, Waiting Time and Security Parameters. In Advances in Internet, Data &Web Technologies—International Conference on Emerging Internetworking, Data & Web Technologies; Barolli, L., Xhafa, F., Javaid, N.,Spaho, E., Kolici, V., Eds.; Springer: Cham, Switzerland, 2018; pp. 94–105.
29. Mugarza, I.; Flores, J.L.; Montero, J.L. Security issues and software updates management in the industrial internet of things (iiot)era. Sensors 2020, 20, 7160. [CrossRef] [PubMed]
30. Hassan, M.M.; Gumaei, A.; Huda, S.; Almogren, A. Increasing the trustworthiness in the industrial IoT networks through areliable cyberattack detection model. IEEE Trans. Ind. Inform. 2020, 16, 6154–6162. [CrossRef]
31. Nie, L.; Wang, X.; Wang, S.; Ning, Z.; Obaidat, M.S.; Sadoun, B.; Li, S. Network traffic prediction in industrial Internet of Thingsbackbone networks: A multitask learning mechanism. IEEE Trans. Ind. Inform. 2021, 17, 7123–7132. [CrossRef]
32. Pulkkinen, V. Continuous deployment of software. In Proceedings of the Seminar No. 58312107; University of Helsinki: Helsinki,Finland, 2013; pp. 46–52.
33. Arachchi, S.A.I.B.S.; Perera, I. Continuous Integration and Continuous Delivery Pipeline Automation for Agile Software ProjectManagement. In Proceedings of the 2018 Moratuwa Engineering Research Conference (MERCon), Moratuwa, Sri Lanka, 30May–1 June 2018; pp. 156–161.
34. Rajkovic, P.; Aleksic, D.; Jankovic, D.; Milenkovic, A.; Ðordevic, A. Resource Awareness in Complex Industrial Systems–AStrategy for Software Updates. In Proceedings of the First Workshop on Connecting Education and Research Communities for anInnovative Resource Aware Society (CERCIRAS), Novi Sad, Serbia, 2 September 2021; Available online: https://ceur-ws.org/Vol-3145/paper10.pdf (accessed on 1 June 2022).
35. Shahin, M.; Babar, M.A.; Zhu, L. Continuous Integration, Delivery and Deployment: A Systematic Review on Approaches, Tools,Challenges and Practices. IEEE Access 2017, 5, 3909–3943. [CrossRef]
36. Fowler, M. CanaryRelease. June 2014. Available online: https://martinfowler.com/bliki/CanaryRelease.html (accessed on1 June 2022).
37. Fowler, M. DarkLaunching. April 2020. Available online: https://martinfowler.com/bliki/DarkLaunching.html (accessed on 1June 2022).
38. Parnin, C.; Helms, E.; Atlee, C.; Boughton, H.; Ghattas, M.; Glover, A.; Holman, J.; Micco, J.; Murphy, B.; Savor, T.; et al. The Top10 Adages in Continuous Deployment. IEEE Softw. 2017, 34, 86–95. [CrossRef]
39. Feitelson, D.G.; Frachtenberg, E.; Beck, K.L. Development and Deployment at Facebook. IEEE Internet Comput. 2013, 17, 8–17.[CrossRef]
40. Claps, G.G.; Svensson, R.B.; Aurum, A. On the journey to continuous deployment: Technical and social challenges along the way.Inf. Softw. Technol. 2015, 57, 21–31. [CrossRef]
41. Rahman, A.A.U.; Helms, E.; Williams, L.; Parnin, C. Synthesizing Continuous Deployment Practices Used in Software Develop-ment. In Proceedings of the 2015 Agile Conference, National Harbor, MD, USA, 3–7 August 2015; pp. 1–10. [CrossRef]
42. Brittain, M. Continuous Deployment: The Dirty Details. January 2013. Available online: http://www.slideshare.net/mikebrittain/mbrittain-continuous-deploymentalm3public?related=1 (accessed on 1 June 2022).

Electronics 2022, 11, 2186 28 of 28
43. Buzachis, A.; Galletta, A.; Celesti, A.; Carnevale, L.; Villari, M. Towards Osmotic Computing: A Blue-Green Strategy for theFast Re-Deployment of Microservices. In Proceedings of the 2019 IEEE Symposium on Computers and Communications (ISCC),Barcelona, Spain, 29 June–3 July 2019; pp. 1–6. [CrossRef]
44. Rodríguez, P.; Haghighatkhah, A.; Lwakatare, L.E.; Teppola, S.; Suomalainen, T.; Eskeli, J.; Karvonen, T.; Kuvaja, P.; Verner, J.M.;Oivo, M. Continuous deployment of software-intensive products and services: A systematic mapping study. J. Syst. Softw. 2017,123, 263–291. [CrossRef]
45. Khorsandroo, S.; Sánchez, A.G.; Tosun, A.S.; Arco, J.M.; Doriguzzi-Corin, R. Hybrid SDN evolution: A comprehensive survey ofthe state-of-the-art. Comput. Netw. 2021, 192, 107981. [CrossRef]
46. Amin, R.; Reisslein, M.; Shah, N. Hybrid SDN Networks: A Survey of Existing Approaches. IEEE Commun. Surv. Tutor. 2018, 20,3259–3306. [CrossRef]
47. Huang, X.; Cheng, S.; Cao, K.; Cong, P.; Wei, T.; Hu, S. A Survey of Deployment Solutions and Optimization Strategies for HybridSDN Networks. IEEE Commun. Surv. Tutor. 2019, 21, 1483–1507. [CrossRef]
48. Xiong, B.; Yang, K.; Zhao, J.; Li, W.; Li, K. Performance evaluation of OpenFlow-based software-defined networks based onqueueing model. Comput. Netw. 2016, 102, 172–185. [CrossRef]
49. Wang, B.; Moon, Y.B. Hybrid modeling and simulation for innovation deployment strategies. Ind. Manag. Data Syst. 2013, 113,136–154. [CrossRef]
50. Yassein, M.B.; Shatnawi, M.Q.; Aljwarneh, S.; Al-Hatmi, R. Internet of Things: Survey and Open Issues of MQTT Protocol. InProceedings of the 2017 International Conference on Engineering & MIS (ICEMIS), Monastir, Tunisia, 8–10 May 2017; pp. 1–6.
51. Mugarza, I.; Parra, J.; Jacob, E. Cetratus: A framework for zero downtime secure software updates in safety-critical systems. Softw.Pract. Exp. 2020, 50, 1399–1424. [CrossRef]
52. Naseer, U.; Niccolini, L.; Pant, U.; Frindell, A.; Dasineni, R.; Benson, T.A. Zero Downtime Release: Disruption-Free LoadBalancing of a Multi-Billion User Website. In Proceedings of the Annual Conference of the ACM Special Interest Group on DataCommunication on the Applications, Technologies, Architectures, and Protocols for Computer Communication, New York, NY,USA, 10–14 August 2020; pp. 529–541.
53. Motta, R.C.; de Oliveira, K.M.; Travassos, G.H. On Challenges in Engineering IoT Software Systems. In Proceedings of the XXXIIBrazilian Symposium on Software Engineering, Sao Carlos, Brazil, 17–21 September 2018; pp. 42–51.
Related Documents


