Hybrid neural network–particle swarm method to predict global radiation over the Norte Chico (Chile) Alejandro A. Pe ´ rez Ponce, Juan A. Lazzu ´s, a) and Luis O. Palma Chilla Departamento de Fı ´sica, Universidad de La Serena, Casilla 554, La Serena, Chile (Received 23 January 2012; accepted 4 March 2012; published online xx xx xxxx) Solar energy estimation procedures are very important in the renewable energy field for development of mathematical models, optimization, and advanced control of processes. Solar radiation data provide information on how much of the sun’s energy strikes a surface at a location on earth during a particular time period. These data are needed for effective research into solar-energy utilization. Due to the cost and diffi- culty in measurement, these data are not readily available. Therefore, there is the need to develop alternative ways of generating these data. In this study, an artificial neural network (ANN) was used for the estimation of daily global solar radiation (R G ) over the Norte Chico using 17 552 data measured from 21 meteorological stations (years 2004–2010) located in the south area of the Atacama Desert. The ANN was developed with particle swarm optimization. Six input parameters were used to train the network. These parameters were elevation, longitude, latitude, air temperature, relative humidity, and wind speed. The network that obtained the lowest deviation during the training was one with 6 neurons in the input layer, 18 and 6 neu- rons in the hidden layers, and one neuron in the output layer. The results show that the ANN can be accurately trained and that the chosen architecture can estimate the R G with acceptable accuracy: average absolute relative deviation less than 10% for the training and for the validation step. The low deviations found with the proposed method indicate that it can estimate R G with better accuracy than other methods available in the literature. V C 2012 American Institute of Physics. [http://dx.doi.org/10.1063/1.3699616] I. INTRODUCTION Energy is essential for the economic and social development and improved quality of life in Chile and principally on the Norte Chico zone, located in the hyper-arid Atacama Desert. This zone is under the influence of the south-eastern Pacific subtropical anticyclone affected by the cycles of La Nin ˜a with periods of drought prolonged, and El Nin ˜o with abnormal increase of the quantity of precipitation and of its temporary extension. 1–3 The Norte Chico is one of the most sensitive areas in South America. 2 Recent studies of oceanic and atmospheric variability have confirmed the implications of the dynamics of El Nin ˜o-southern oscillation (ENSO) cycle on the climate of coast cities. 4 Ecosystems in arid climates react very sensitively to changes caused by these phenomena. 3 The major feature of El Nin ˜o is periodic water scarcity due to highly variable rainfall and runoff. This may result in severe economic problems when the water scarcity appears during several consecutive years. Therefore, the energy resources are of vital importance both economically and environmentally. Solar energy is being seriously con- sidered for satisfying a significant part of energy demand in this arid zone. The importance of knowing the temporal and spatial variations of solar radiation (energy) in arid climates have been explored in several papers. 5 Given the growing concern about energy use and its adverse a) Author to whom correspondence should be addressed. Electronic mail: [email protected]. Tel.: þ 56 51-204128. Fax: þ 56 51-206658. 1941-7012/2012/4(2)000000/10/$30.00 V C 2012 American Institute of Physics 4, 000000-1 JOURNAL OF RENEWABLE AND SUSTAINABLE ENERGY 4, 000000 (2012)

Welcome message from author
This document is posted to help you gain knowledge. Please leave a comment to let me know what you think about it! Share it to your friends and learn new things together.
Transcript
Hybrid neural network–particle swarm method to predictglobal radiation over the Norte Chico (Chile)
Alejandro A. Perez Ponce, Juan A. Lazzus,a) and Luis O. Palma ChillaDepartamento de Fısica, Universidad de La Serena, Casilla 554, La Serena, Chile
(Received 23 January 2012; accepted 4 March 2012; published online xx xx xxxx)
Solar energy estimation procedures are very important in the renewable energy field
for development of mathematical models, optimization, and advanced control of
processes. Solar radiation data provide information on how much of the sun’s energy
strikes a surface at a location on earth during a particular time period. These data are
needed for effective research into solar-energy utilization. Due to the cost and diffi-
culty in measurement, these data are not readily available. Therefore, there is the
need to develop alternative ways of generating these data. In this study, an artificial
neural network (ANN) was used for the estimation of daily global solar radiation
(RG) over the Norte Chico using 17 552 data measured from 21 meteorological
stations (years 2004–2010) located in the south area of the Atacama Desert. The
ANN was developed with particle swarm optimization. Six input parameters were
used to train the network. These parameters were elevation, longitude, latitude, air
temperature, relative humidity, and wind speed. The network that obtained the lowest
deviation during the training was one with 6 neurons in the input layer, 18 and 6 neu-
rons in the hidden layers, and one neuron in the output layer. The results show that
the ANN can be accurately trained and that the chosen architecture can estimate the
RG with acceptable accuracy: average absolute relative deviation less than 10% for
the training and for the validation step. The low deviations found with the proposed
method indicate that it can estimate RG with better accuracy than other methods
available in the literature. VC 2012 American Institute of Physics.
[http://dx.doi.org/10.1063/1.3699616]
I. INTRODUCTION
Energy is essential for the economic and social development and improved quality of life
in Chile and principally on the Norte Chico zone, located in the hyper-arid Atacama Desert.
This zone is under the influence of the south-eastern Pacific subtropical anticyclone affected by
the cycles of La Nina with periods of drought prolonged, and El Nino with abnormal increase
of the quantity of precipitation and of its temporary extension.1–3 The Norte Chico is one of the
most sensitive areas in South America.2 Recent studies of oceanic and atmospheric variability
have confirmed the implications of the dynamics of El Nino-southern oscillation (ENSO) cycle
on the climate of coast cities.4 Ecosystems in arid climates react very sensitively to changes
caused by these phenomena.3 The major feature of El Nino is periodic water scarcity due to
highly variable rainfall and runoff. This may result in severe economic problems when the
water scarcity appears during several consecutive years. Therefore, the energy resources are of
vital importance both economically and environmentally. Solar energy is being seriously con-
sidered for satisfying a significant part of energy demand in this arid zone. The importance of
knowing the temporal and spatial variations of solar radiation (energy) in arid climates have
been explored in several papers.5 Given the growing concern about energy use and its adverse
a)Author to whom correspondence should be addressed. Electronic mail: [email protected]. Tel.:þ 56 51-204128. Fax:þ 56
51-206658.
1941-7012/2012/4(2)000000/10/$30.00 VC 2012 American Institute of Physics4, 000000-1
JOURNAL OF RENEWABLE AND SUSTAINABLE ENERGY 4, 000000 (2012)
impact on the environment, this could have far-reaching energy and without environmental
problems.
Solar energy estimation procedures are very important in the renewable energy field for de-
velopment of mathematical models, optimization, and advanced control of processes. Solar radi-
ation data provide information on how much of the sun’s energy strikes a surface at a location
on earth during a particular time period. These data are needed for effective research into solar-
energy utilization.6 Due to the cost and difficulty in measurement, these data are not readily
available.7 Therefore, there is the need to develop alternative ways to generate these data.6
Many models have been developed to predict the solar radiation such as Angstrom8 and
Hottel.9 Comparative studies of artificial neural networks (ANNs) and the traditional regression
approaches in modeling global solar radiation (RG) have been shown that ANN methodology
offers a promising alternative to the traditional approach.6,10 The relationship between radiation
and meteorological data is highly non-linear, and consequently an ANN can be a suitable alter-
native to model the underlying radiation properties.
In this work, global radiation data taken from years 2001–2007 were used to train a neural
network. But to obtain still more effective and fast discrimination, particle swarm optimization
(PSO) technique has been introduced to train the ANN architecture. PSO algorithm is preferred
because of its successful implementation to solve many complex optimization problems.11 To
distinguish between the different values of daily RG, and so the ANNþ PSO method can dis-
criminate and learn in an optimum form, geographical and meteorological data were used.
II. DATABASE USED
A data set of 17 552 points of daily RG of 6 years (2004–2010) was used to develop the
ANN method. This work used a leave-25%-out cross-validation method to estimate the predic-
tive capabilities of the model. This approach was applied to each station. Then, 14 042 data
points were used to train the network and 3510 data points (not used in the training process)
were predicted. All data points were taken from CEAZA-MET database.12 To distinguish between
the different values of daily RG, so the ANN can discriminate and learn in optimum form, me-
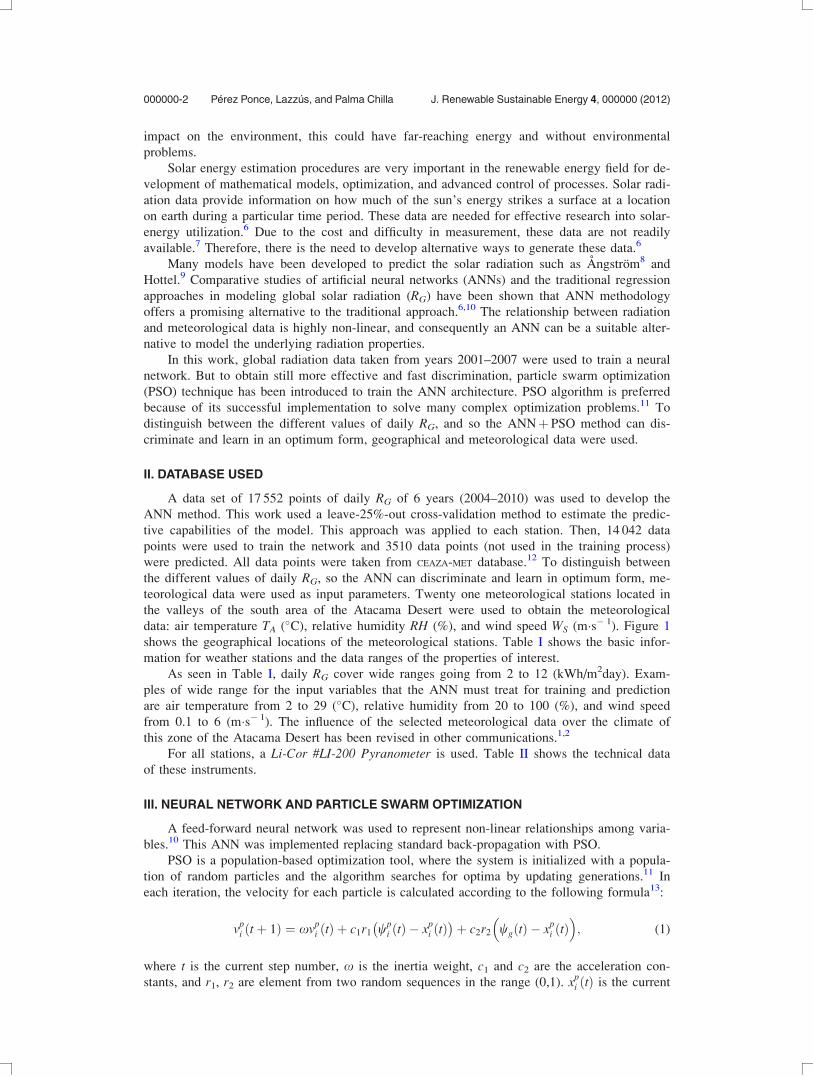
teorological data were used as input parameters. Twenty one meteorological stations located in
the valleys of the south area of the Atacama Desert were used to obtain the meteorological
data: air temperature TA (�C), relative humidity RH (%), and wind speed WS (m�s� 1). Figure 1
shows the geographical locations of the meteorological stations. Table I shows the basic infor-
mation for weather stations and the data ranges of the properties of interest.
As seen in Table I, daily RG cover wide ranges going from 2 to 12 (kWh/m2day). Exam-
ples of wide range for the input variables that the ANN must treat for training and prediction
are air temperature from 2 to 29 (�C), relative humidity from 20 to 100 (%), and wind speed
from 0.1 to 6 (m�s� 1). The influence of the selected meteorological data over the climate of
this zone of the Atacama Desert has been revised in other communications.1,2
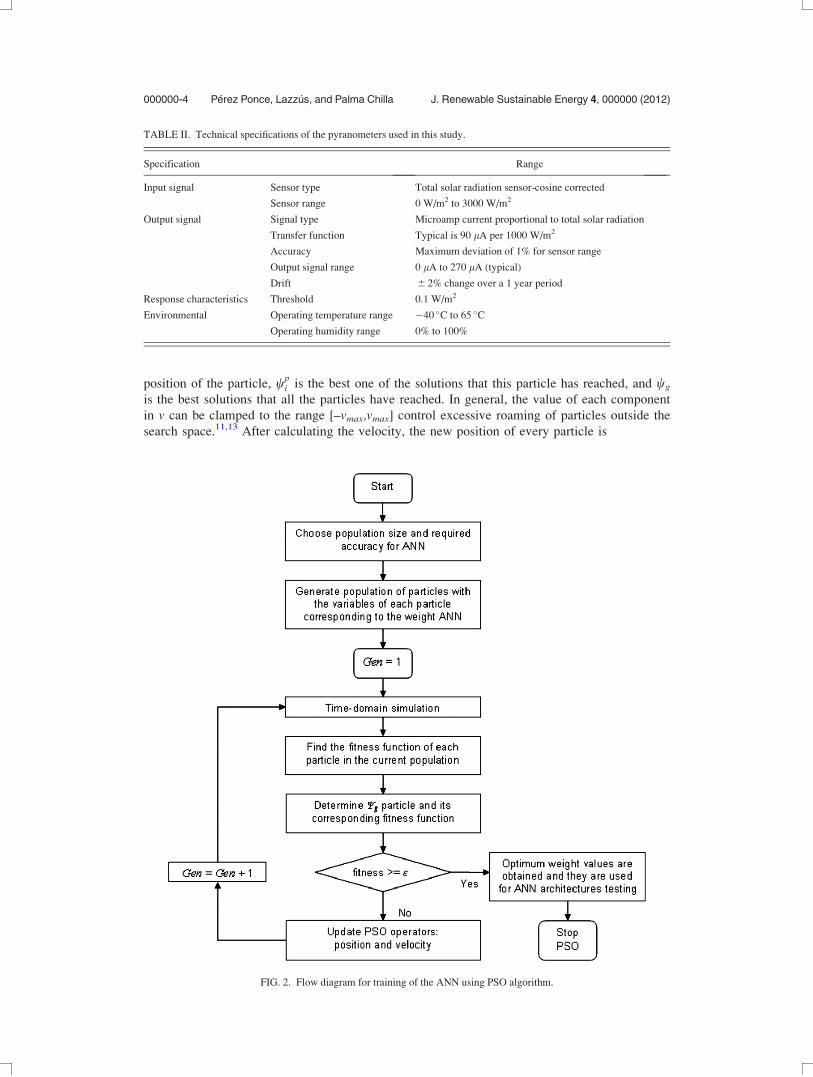
For all stations, a Li-Cor #LI-200 Pyranometer is used. Table II shows the technical data
of these instruments.
III. NEURAL NETWORK AND PARTICLE SWARM OPTIMIZATION
A feed-forward neural network was used to represent non-linear relationships among varia-
bles.10 This ANN was implemented replacing standard back-propagation with PSO.
PSO is a population-based optimization tool, where the system is initialized with a popula-
tion of random particles and the algorithm searches for optima by updating generations.11 In
each iteration, the velocity for each particle is calculated according to the following formula13:
vpi tþ 1ð Þ ¼ xvp
i tð Þ þ c1r1 wpi tð Þ � xp
i tð Þ� �
þ c2r2 wg tð Þ � xpi tð Þ
� �; (1)
where t is the current step number, x is the inertia weight, c1 and c2 are the acceleration con-
stants, and r1, r2 are element from two random sequences in the range (0,1). xpi tð Þ is the current
000000-2 Perez Ponce, Lazzus, and Palma Chilla J. Renewable Sustainable Energy 4, 000000 (2012)
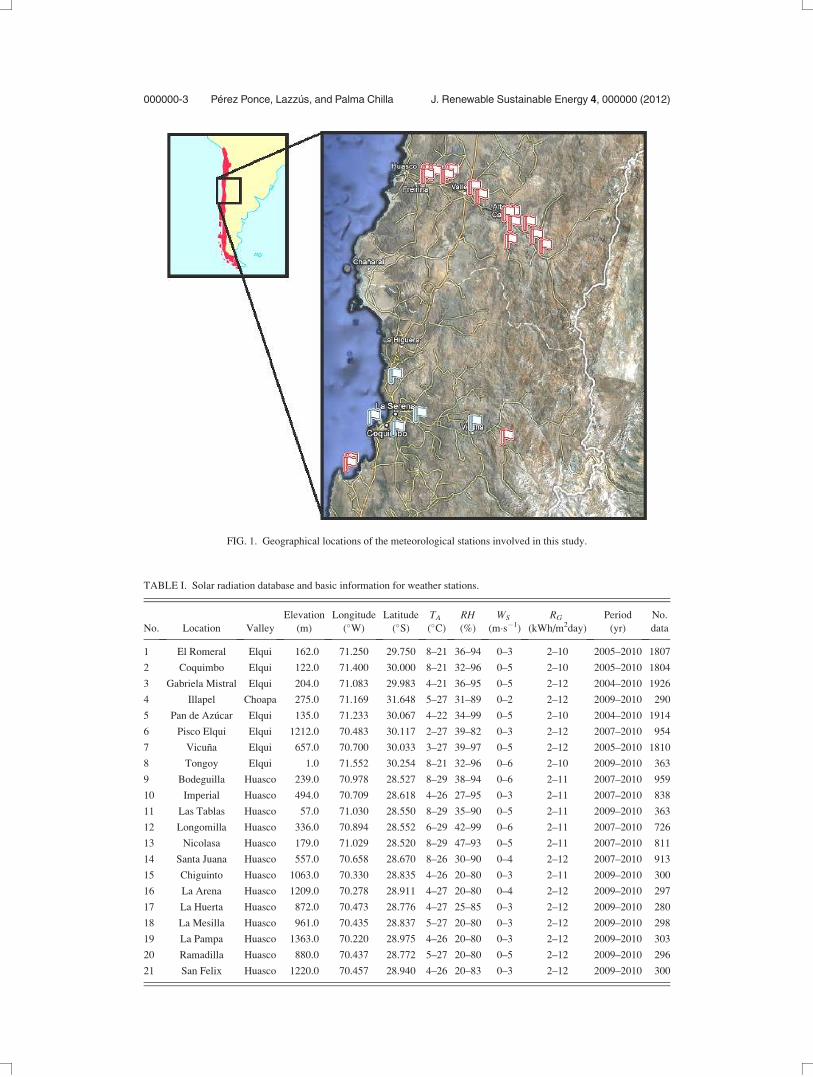
FIG. 1. Geographical locations of the meteorological stations involved in this study.
TABLE I. Solar radiation database and basic information for weather stations.
No. Location Valley
Elevation
(m)
Longitude
(�W)
Latitude
(�S)
TA
(�C)
RH(%)
WS
(m�s�1)
RG
(kWh/m2day)
Period
(yr)
No.
data
1 El Romeral Elqui 162.0 71.250 29.750 8–21 36–94 0–3 2–10 2005–2010 1807
2 Coquimbo Elqui 122.0 71.400 30.000 8–21 32–96 0–5 2–10 2005–2010 1804
3 Gabriela Mistral Elqui 204.0 71.083 29.983 4–21 36–95 0–5 2–12 2004–2010 1926
4 Illapel Choapa 275.0 71.169 31.648 5–27 31–89 0–2 2–12 2009–2010 290
5 Pan de Azucar Elqui 135.0 71.233 30.067 4–22 34–99 0–5 2–10 2004–2010 1914
6 Pisco Elqui Elqui 1212.0 70.483 30.117 2–27 39–82 0–3 2–12 2007–2010 954
7 Vicuna Elqui 657.0 70.700 30.033 3–27 39–97 0–5 2–12 2005–2010 1810
8 Tongoy Elqui 1.0 71.552 30.254 8–21 32–96 0–6 2–10 2009–2010 363
9 Bodeguilla Huasco 239.0 70.978 28.527 8–29 38–94 0–6 2–11 2007–2010 959
10 Imperial Huasco 494.0 70.709 28.618 4–26 27–95 0–3 2–11 2007–2010 838
11 Las Tablas Huasco 57.0 71.030 28.550 8–29 35–90 0–5 2–11 2009–2010 363
12 Longomilla Huasco 336.0 70.894 28.552 6–29 42–99 0–6 2–11 2007–2010 726
13 Nicolasa Huasco 179.0 71.029 28.520 8–29 47–93 0–5 2–11 2007–2010 811
14 Santa Juana Huasco 557.0 70.658 28.670 8–26 30–90 0–4 2–12 2007–2010 913
15 Chiguinto Huasco 1063.0 70.330 28.835 4–26 20–80 0–3 2–11 2009–2010 300
16 La Arena Huasco 1209.0 70.278 28.911 4–27 20–80 0–4 2–12 2009–2010 297
17 La Huerta Huasco 872.0 70.473 28.776 4–27 25–85 0–3 2–12 2009–2010 280
18 La Mesilla Huasco 961.0 70.435 28.837 5–27 20–80 0–3 2–12 2009–2010 298
19 La Pampa Huasco 1363.0 70.220 28.975 4–26 20–80 0–3 2–12 2009–2010 303
20 Ramadilla Huasco 880.0 70.437 28.772 5–27 20–80 0–5 2–12 2009–2010 296
21 San Felix Huasco 1220.0 70.457 28.940 4–26 20–83 0–3 2–12 2009–2010 300
000000-3 Perez Ponce, Lazzus, and Palma Chilla J. Renewable Sustainable Energy 4, 000000 (2012)
position of the particle, wpi is the best one of the solutions that this particle has reached, and wg
is the best solutions that all the particles have reached. In general, the value of each component
in v can be clamped to the range [–vmax,vmax] control excessive roaming of particles outside the
search space.11,13 After calculating the velocity, the new position of every particle is
TABLE II. Technical specifications of the pyranometers used in this study.
Specification Range
Input signal Sensor type Total solar radiation sensor-cosine corrected
Sensor range 0 W/m2 to 3000 W/m2
Output signal Signal type Microamp current proportional to total solar radiation
Transfer function Typical is 90 lA per 1000 W/m2
Accuracy Maximum deviation of 1% for sensor range
Output signal range 0 lA to 270 lA (typical)
Drift 6 2% change over a 1 year period
Response characteristics Threshold 0.1 W/m2
Environmental Operating temperature range �40 �C to 65 �C
Operating humidity range 0% to 100%
FIG. 2. Flow diagram for training of the ANN using PSO algorithm.
000000-4 Perez Ponce, Lazzus, and Palma Chilla J. Renewable Sustainable Energy 4, 000000 (2012)
xp tþ 1ð Þ ¼ xp tð Þ þ vp tþ 1ð Þ; (2)
where x and v denote a particle position and its corresponding velocity in a search space,
respectively.
The total steps to calculate the output parameter, using the input parameters, were as
follows.14
The data were normalized using the following equation:
pi ¼ Pi � Pmini
� � 2
Pmaxi � Pmin
i
� 1; (3)
where Pi is the input variables i, Pmini and Pmax
i are the smallest and largest value of the data.
Next, the net inputs (N) are calculated for the hidden neurons coming from the inputs neurons.
For a hidden neuron
Nhj ¼
Xn
i
whijpi þ bh
j ; (4)
where pi is the vector of the inputs of the training, j is the hidden neuron, wij is the weight of
the connection among the input neurons with the hidden layer, and the term bj corresponds
to the bias of the neuron j of the hidden layer reached in its activation. Starting from these
inputs, the outputs (y) of the hidden neurons are calculated using a transfer function fh associ-
ated with the neurons of this layer
yhj ¼ f h
j
Xn
i
whijpi þ bh
j
!: (5)
To minimize the error, the transfer function f should be differentiable. In the ANN, the hyper-
bolic tangent function (tansig) was used as
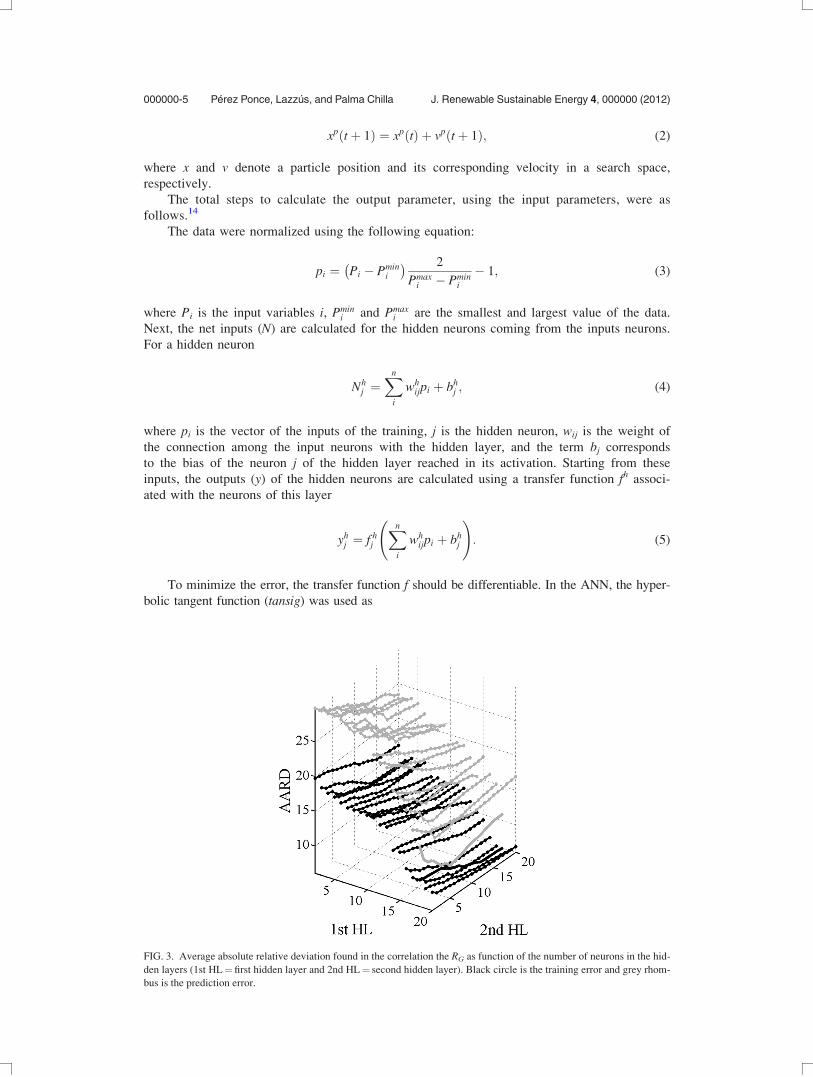
FIG. 3. Average absolute relative deviation found in the correlation the RG as function of the number of neurons in the hid-
den layers (1st HL¼first hidden layer and 2nd HL¼ second hidden layer). Black circle is the training error and grey rhom-
bus is the prediction error.
000000-5 Perez Ponce, Lazzus, and Palma Chilla J. Renewable Sustainable Energy 4, 000000 (2012)
f Njk
� �¼ eNjk � e�Njk
eNjk þ e�Njk: (6)
All the neurons of the ANN have an associated activation value for a give input pattern; the
algorithm continues finding the error that is presented for each neuron, except those of the input
layer. After finding the output values, the weights of all layers of the network are actualized by
PSO using Eqs. (1) and (2).13
The PSO algorithm is very different than any of the traditional methods of training.11 Each
neuron contains a position and velocity. The position corresponds to the weight of a neuron.
The velocity is used to update the weight. The velocity is used to control how much the posi-
tion is updated. On each pass through a data set, PSO compares each weight’s fitness. The net-
work with the highest fitness is considered the global best. The other weights are updated based
on the global best network rather than on their personal error or fitness.11 In this study, network
fitness was determined to be the mean square of errors for the entire training set
F ¼X
Recorded Value� Network Predicted Valueð Þ2: (7)
This process repeats for the total number of patterns to training. For a successful process,
the objective of the algorithm is to modernize all the weights minimizing the total mean
squared error (e)
TABLE III. Overall minimum, maximum, and average deviations for the calculated RG using the ANN.
ANN model Training set Prediction set Total set
Experimental data
No. data points 14 042 3510 17 552
Deviations
AARDmin 0.01 0.01 0.01
AARDmax 21.88 21.71 21.88
AARD 9.31 9.63 9.47
No. AARD> 20 636 171 807
R2 0.9204 0.9212 0.9210
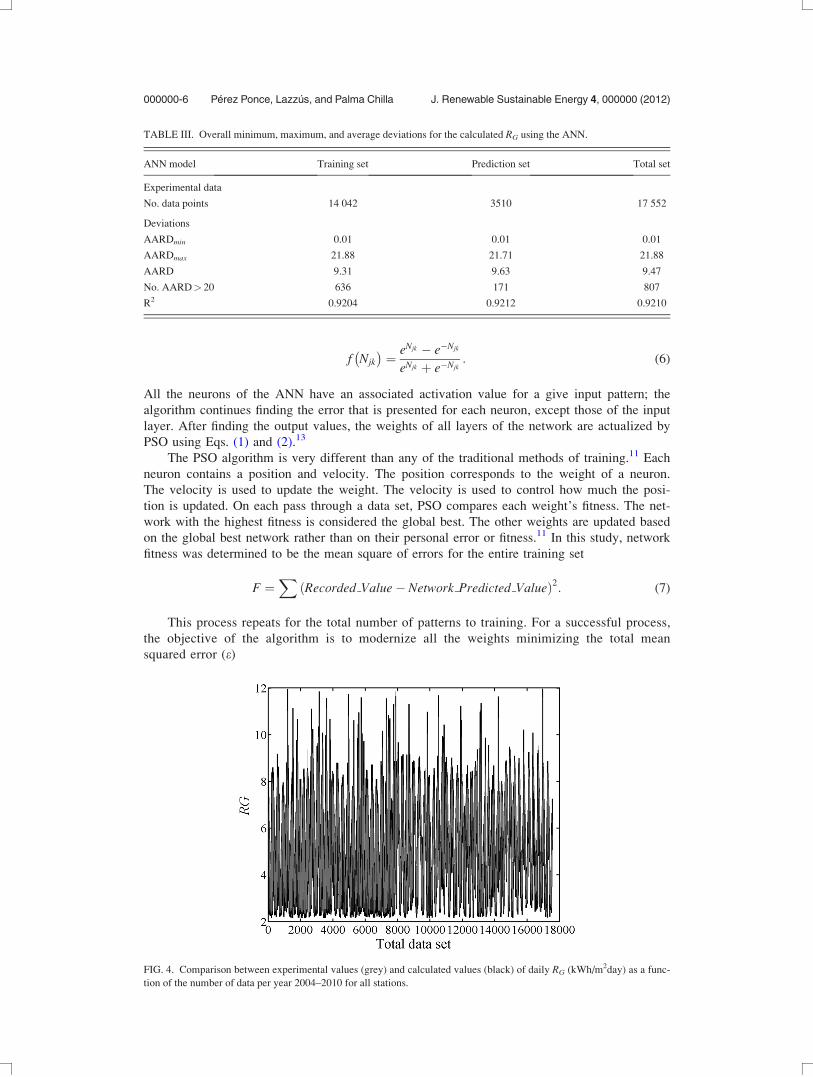
FIG. 4. Comparison between experimental values (grey) and calculated values (black) of daily RG (kWh/m2day) as a func-
tion of the number of data per year 2004–2010 for all stations.
000000-6 Perez Ponce, Lazzus, and Palma Chilla J. Renewable Sustainable Energy 4, 000000 (2012)

e2 ¼ 1
2
XF2: (8)
Figure 2 presents a block diagram of the program developed and written in MATLAB.
The most basic architecture normally used for this type of application involves a neural net-
work consisting of three or four layers.14 The input layer contains one neuron (node) for each
input parameter. The output layer has one node generating the scaled estimated value of the RG.
The number of hidden neurons needs to be sufficient to ensure that the information contained in
the data utilized for training the network is adequately represented. There is no specific approach
to determine the number of neurons of the hidden layer, and many alternative combinations are
possible. The optimum number of neurons was determined by adding neurons in systematic form
and evaluating the deviations of the sets during the learning process.11 Several network architec-
tures were tested to select the most accurate. The accuracy was checked using the average abso-
lute relative deviation (AARD) between the calculated values (calc) and experimental data (exp)
of RG during the training and the prediction steps. The deviations were calculated as
AARD ¼ 100
n
Xn
i¼1
RcalcG � Rexp
G
RexpG
��������i
: (9)
Figure 3 shows the average absolute relative deviation found in correlating the RG as func-
tion of the number of neurons in the hidden layers (1st HL¼ first hidden layer and 2nd
HL¼ second hidden layer).
TABLE IV. Comparison of the method proposed in this work with other
methods found in the literature to estimate RG.
Method AARD Accuracy (%)
Ref. 6 10.3–11.8
Ref. 10 82–92
Ref. 15 92
Ref. 16 74–92
Ref. 17 90
This work 9.6 93
FIG. 5. Deviations found in the prediction of RG using artificial neural network with particle swarm optimization ( ), and
artificial neural network with standard back-propagation (�).
000000-7 Perez Ponce, Lazzus, and Palma Chilla J. Renewable Sustainable Energy 4, 000000 (2012)
IV. RESULTS AND DISCUSSION
The results of the ANNþPSO model are presented using Eq. (9). Table III shows the over-
all minimum, maximum, and average deviations for all data using the proposed ANNþ PSO.
These results show that the ANN can be accurately trained and that the chosen architecture can
estimate the RG with acceptable accuracy (AARD less than 10% for the training and for the vali-
dation step).
Figure 4 shows a comparison between experimental and calculated values of RG as a func-
tion of the number of data per year (2004–2010). Note that for the training set (14 042 data
points), the correlation coefficient R2 is 0.9204. For the prediction set (3510 data points), the
correlation coefficient R2 is 0.9212. And for the total set, R2 is 0.9210.
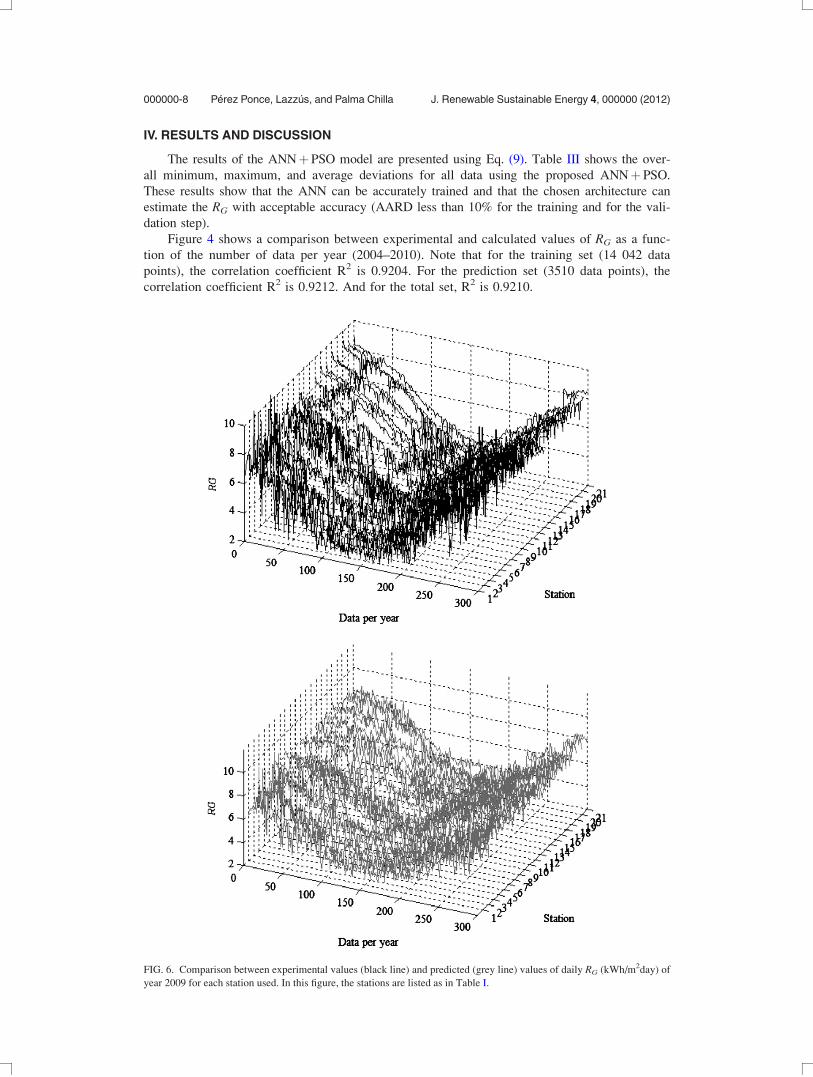
FIG. 6. Comparison between experimental values (black line) and predicted (grey line) values of daily RG (kWh/m2day) of
year 2009 for each station used. In this figure, the stations are listed as in Table I.
000000-8 Perez Ponce, Lazzus, and Palma Chilla J. Renewable Sustainable Energy 4, 000000 (2012)
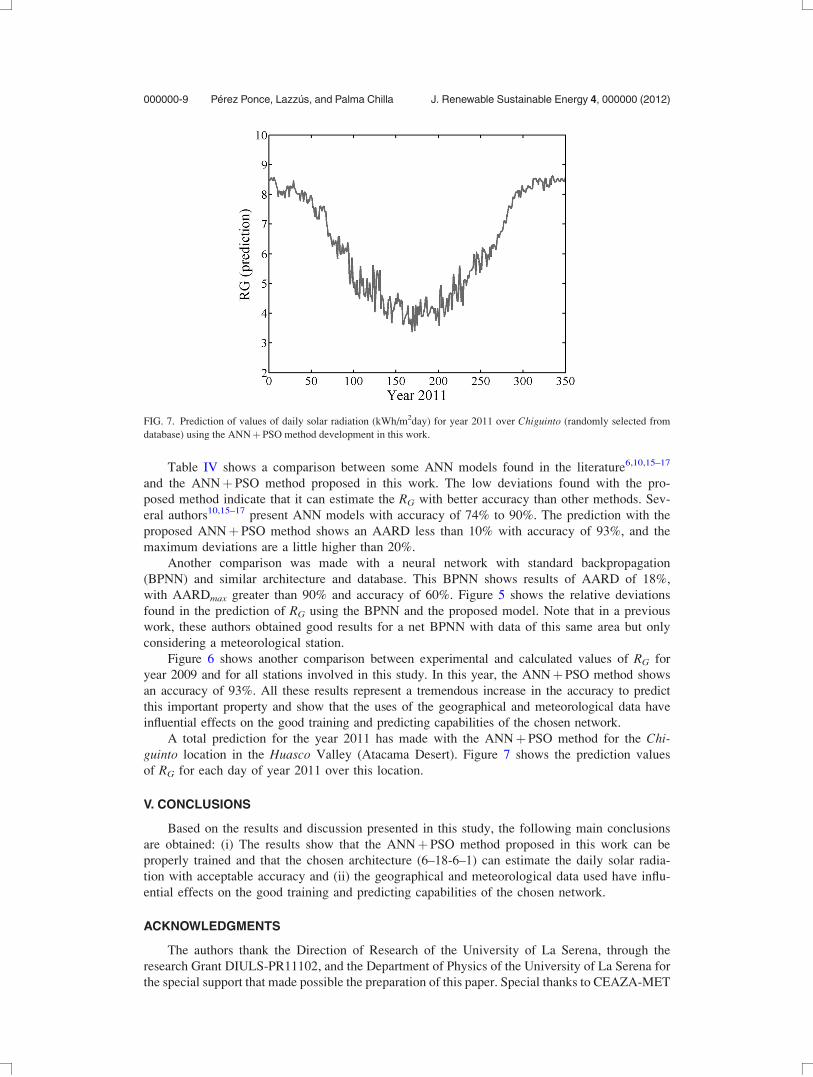
Table IV shows a comparison between some ANN models found in the literature6,10,15–17
and the ANNþ PSO method proposed in this work. The low deviations found with the pro-
posed method indicate that it can estimate the RG with better accuracy than other methods. Sev-
eral authors10,15–17 present ANN models with accuracy of 74% to 90%. The prediction with the
proposed ANNþ PSO method shows an AARD less than 10% with accuracy of 93%, and the
maximum deviations are a little higher than 20%.
Another comparison was made with a neural network with standard backpropagation
(BPNN) and similar architecture and database. This BPNN shows results of AARD of 18%,
with AARDmax greater than 90% and accuracy of 60%. Figure 5 shows the relative deviations
found in the prediction of RG using the BPNN and the proposed model. Note that in a previous
work, these authors obtained good results for a net BPNN with data of this same area but only
considering a meteorological station.
Figure 6 shows another comparison between experimental and calculated values of RG for
year 2009 and for all stations involved in this study. In this year, the ANNþPSO method shows
an accuracy of 93%. All these results represent a tremendous increase in the accuracy to predict
this important property and show that the uses of the geographical and meteorological data have
influential effects on the good training and predicting capabilities of the chosen network.
A total prediction for the year 2011 has made with the ANNþPSO method for the Chi-guinto location in the Huasco Valley (Atacama Desert). Figure 7 shows the prediction values
of RG for each day of year 2011 over this location.
V. CONCLUSIONS
Based on the results and discussion presented in this study, the following main conclusions
are obtained: (i) The results show that the ANNþPSO method proposed in this work can be
properly trained and that the chosen architecture (6–18-6–1) can estimate the daily solar radia-
tion with acceptable accuracy and (ii) the geographical and meteorological data used have influ-
ential effects on the good training and predicting capabilities of the chosen network.
ACKNOWLEDGMENTS
The authors thank the Direction of Research of the University of La Serena, through the
research Grant DIULS-PR11102, and the Department of Physics of the University of La Serena for
the special support that made possible the preparation of this paper. Special thanks to CEAZA-MET
FIG. 7. Prediction of values of daily solar radiation (kWh/m2day) for year 2011 over Chiguinto (randomly selected from
database) using the ANNþPSO method development in this work.
000000-9 Perez Ponce, Lazzus, and Palma Chilla J. Renewable Sustainable Energy 4, 000000 (2012)

by the meteorological data set. L. O. Palma Chilla is supported by the Doctoral Program in Physics
of the University of Tarapaca. A. A. Perez Ponce is supported by the project MECESUP-2–0703.
1N. Kalthoff, I. Bischoff-Gauß, M. Fiebig-Wittmaack, F. Fiedler, J. Thurauf, E. Novoa, C. Pizarro, R. Castillo, L. Gal-lardo, R. Rondanelli, and M. Kohler, J. Appl. Meteorol. 41, 953 (2002).
2N. Kalthoff, M. Fiebig-Wittmaack, C. Meißner, M. Kohler, M. Uriarte, and I. Bischoff-Gauß, J. Arid Environ. 65, 420(2006).
3K. Wyrtki, J. Geophys. Res. 90, 7129, doi: 10.1029/JC090iC04p07129 (1985).4C. S. Meinen and M. J. McPhaden, J. Climate 13, 3551 (2000).5K. Kaygusuz and A. Sari, Energy Convers. Manage. 44, 459 (2003).6S. Rehman and M. Mohandes, Energy Policy 36, 571 (2008).7J. A. Duffie and W. A. Beckman, Solar Engineering of Thermal Processes (Wiley, New York, 1991).8A. Angstrom, Q. J. R. Meteorol. Soc. 50, 121 (1924).9H. C. Hottel, Sol. Energy 18, 129 (1976).
10J. C. Lam, K. K. W. Wan, and L. Yang, Energy Convers. Manage. 49, 1080 (2008).11J. A. Lazzus, Int. J. Thermophys. 32, 957 (2011).12See http://www.ceazamet.cl for information about CEAZA.13J. A. Lazzus, Comput. Math. Appl. 60, 2260 (2010).14J. A. Lazzus, A. A. Perez Ponce, and J. Marın, Appl. Sol. Energy 47, 66 (2011).15J. Soares, A. P. Oliveira, M. Z. Boznar, P. Mlakar, J. F. Escobedo, and A. J. Machado, Appl. Energy 79, 201 (2004).16F. S. Tymvios, C. P. Jacovides, S. C. Michaelides, and C. Scouteli, Sol. Energy 78, 752 (2005).17K. K. W. Wan, H. L. Tang, L. Yang, and J. C. Lam, Energy 33, 1115 (2008).
000000-10 Perez Ponce, Lazzus, and Palma Chilla J. Renewable Sustainable Energy 4, 000000 (2012)
Related Documents