Welcome message from author
This document is posted to help you gain knowledge. Please leave a comment to let me know what you think about it! Share it to your friends and learn new things together.
Transcript
Hybrid Model for Vascular Tree StructuresAnna Puig, Dani Tost, and Isabel NavazoSoftware Department, Avda. Diagonal, 647, 8 oor, 08018 Barcelona, SPAIN,[email protected],WWW home page: http:://www.lsi.upc.es/ anna/Abstract. This paper proposes a new representation scheme of the cere-bral blood vessels. This model provides information on the semantics ofthe vascular structure: the topological relationships between vessels andthe labeling of vascular accidents such as aneurysms and stenoses. Inaddition, the model keeps information of the inner surface geometry aswell as of the vascular map volume properties, i.e. the tissue density, theblood ow velocity and the vessel wall elasticity.The model can be constructed automatically in a pre-process from a setof segmented MRA images. Its memory requirements are optimized onthe basis of the sparseness of the vascular structure. It allows fast queriesand e�cient traversals and navigations. The visualizations of the vesselsurface can be performed at di�erent levels of detail. The direct renderingof the volume is fast because the model provides a natural way to skipover empty data.The paper analyzes the memory requirements of the model along withthe costs of the most important operations on it.1 IntroductionVascular diseases represent a 10% of the clinical examinations. Current diagnosismethods are based on vessel images obtained by: X-Rays, DSA (Digital Subtrac-tion Angiography), contrasted CT (Computer Tomography) or MRA (MagneticResonance Angiography). From these images, physicians must mentally recon-struct the 3D shape of the vessels in order to detect lesions, such as stenosesand aneurysms. This is a di�cult task because the brain vascular system hasa complex tree-like structure, and the vessels are small, narrow and sparse incomparison to the surrounding volume. The reconstruction and visualization ofblood vessels tri-dimensional model from a set of slices provides better means ofdiagnosing and treating vascular pathologies.Previous papers on this topic address three main approaches:{ Direct visualization of the data, generally performed with the MaximumIntensity Projection (MIP) [1],{ blood vessels surface extraction using Marching Cubes (MC) [2] and DividingCubes (DC) [3] algorithms,{ Construction of a topological description of the vascular system (symbolicmodel) [4, 5, 6].

The former approach does not require any pre-processing. Even the segmen-tation, which is required for most operations on MRA data [7] can be avoidedwith MIP projection. However, MIP lacks depth perception, and therefore itproduces ambiguities in the overlapping of vessels, diameters reduction and lossof the smallest vessels. Depth clues can be added to the rendering [8] but, forclinician's use, it is generally necessary to compute in batch several di�erent MIPviews and record them as a �lm. Other visualization strategies require a goodsegmentation [9] and they are generally two slow for routine diagnosis, althoughthey can be speeded-up by using hardware 3D texture mapping [10].The main drawback of the second approach is that due to the nature of thevessels, the surface model is composed of a huge amount of tiny faces and theconnectivity is di�cult to guarantee. In addition, according to [6], the trilinearinterpolation done in these methods is not suitable for the modeling of localdeformations in elbows, aneurysms and stenoses.This paper addresses the third approach: the construction of a symbolicmodel of the vascular tree providing information of the medial line of the vesselsand of their diameters. This strategy provides a better understanding of thestructure than the two former ones. In addition, it may allow the generationof a simpler and smoother surface model. However, the automatic constructionof such a model is complex, because it requires the medial line extraction anddiameters computation.Several symbolic models have been previously proposed. In [4], individualvessels are modeled as a set of cylinders joined onto common circular sections.The model is extracted manually. Its main drawback is that it does not providea global representation of the topological relationships between vessels. In [5]the vascular structure is represented as a symbolic tree, composed of numberedbranches connected at bifurcation nodes, where the diameters of the vesselsand the axes orientations are stored. The model computed in [6] is a tree ofspline curves marking the center lines of the vessels, plus a sequence of cross-section contours perpendicular to the axis. A smooth surface model composed oftensor product rectangular patches can be �tted on this symbolic model. Bothmodels can be constructed automatically. As a drawback, they do not providea speci�c representation of aneuryms and stenoses. In addition, they do notgive simultaneous information of the surface geometry and the internal propertyvalues. The hybrid model presented herein is intended at �lling this gap. It is�rst described in section 2 and next evaluated in section 3 in terms of memoryrequirements and e�ciency of its visualizations.2 Model representationThe proposed model of the vascular structure provides three layers of informa-tion: the global structure of the map, the vascular surface and the inner volume.The global structure is the set of topological relationships between the di�er-ent components of the map, as well as their semantical meaning. The vascularsurface de�nes the global shape of the internal vascular wall. Finally, the vol-
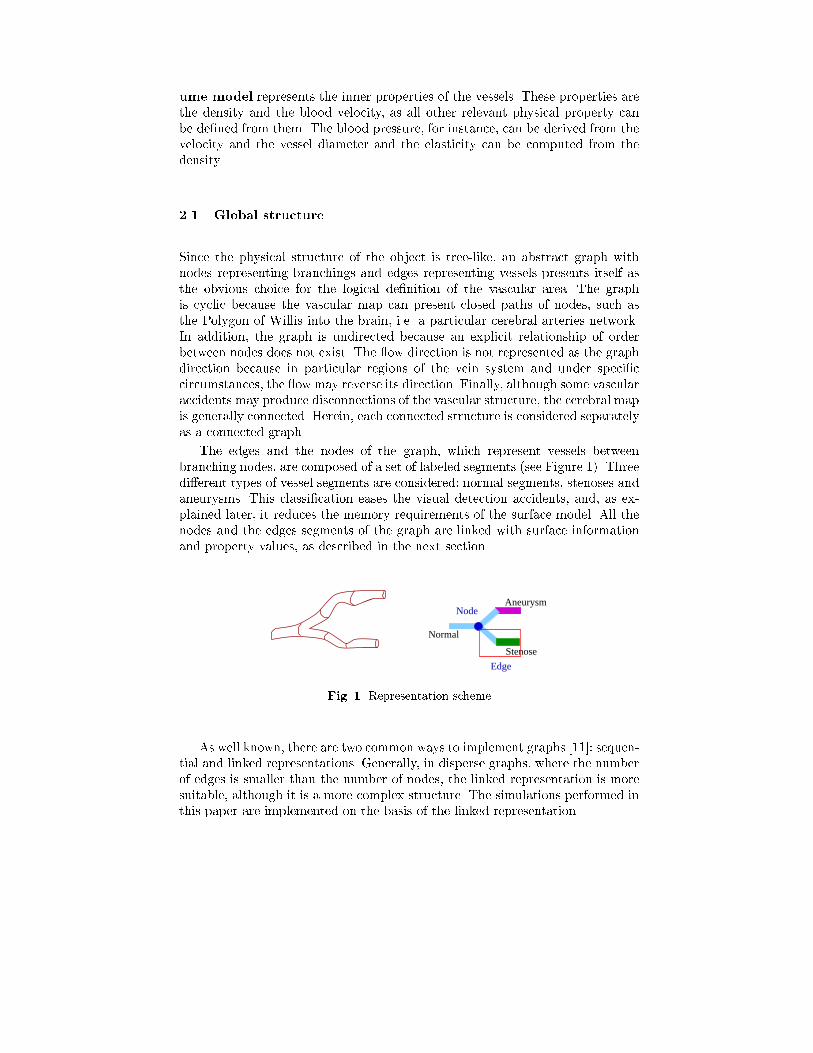
ume model represents the inner properties of the vessels. These properties arethe density and the blood velocity, as all other relevant physical property canbe de�ned from them. The blood pressure, for instance, can be derived from thevelocity and the vessel diameter and the elasticity can be computed from thedensity.2.1 Global structureSince the physical structure of the object is tree-like, an abstract graph withnodes representing branchings and edges representing vessels presents itself asthe obvious choice for the logical de�nition of the vascular area. The graphis cyclic because the vascular map can present closed paths of nodes, such asthe Polygon of Willis into the brain, i.e. a particular cerebral arteries network.In addition, the graph is undirected because an explicit relationship of orderbetween nodes does not exist. The ow direction is not represented as the graphdirection because in particular regions of the vein system and under speci�ccircumstances, the ow may reverse its direction. Finally, although some vascularaccidents may produce disconnections of the vascular structure, the cerebral mapis generally connected. Herein, each connected structure is considered separatelyas a connected graph.The edges and the nodes of the graph, which represent vessels betweenbranching nodes, are composed of a set of labeled segments (see Figure 1). Threedi�erent types of vessel segments are considered: normal segments, stenoses andaneurysms. This classi�cation eases the visual detection accidents, and, as ex-plained later, it reduces the memory requirements of the surface model. All thenodes and the edges segments of the graph are linked with surface informationand property values, as described in the next section.Stenose
Normal
Aneurysm
Edge
Node
Fig. 1. Representation schemeAs well known, there are two common ways to implement graphs [11]: sequen-tial and linked representations. Generally, in disperse graphs, where the numberof edges is smaller than the number of nodes, the linked representation is moresuitable, although it is a more complex structure. The simulations performed inthis paper are implemented on the basis of the linked representation.
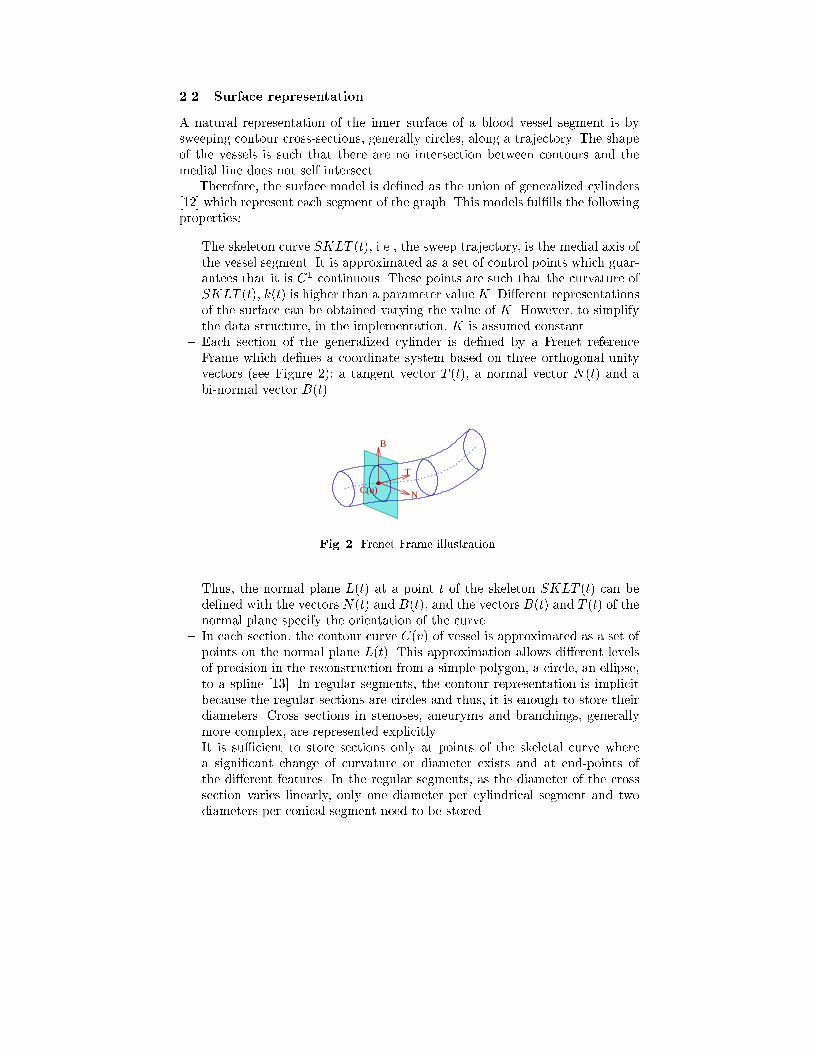
2.2 Surface representationA natural representation of the inner surface of a blood vessel segment is bysweeping contour cross-sections, generally circles, along a trajectory. The shapeof the vessels is such that there are no intersection between contours and themedial line does not self intersect.Therefore, the surface model is de�ned as the union of generalized cylinders[12] which represent each segment of the graph. This models ful�lls the followingproperties:{ The skeleton curve SKLT (t), i.e., the sweep trajectory, is the medial axis ofthe vessel segment. It is approximated as a set of control points which guar-antees that it is C1 continuous. These points are such that the curvature ofSKLT (t), k(t) is higher than a parameter value K. Di�erent representationsof the surface can be obtained varying the value of K. However, to simplifythe data structure, in the implementation, K is assumed constant.{ Each section of the generalized cylinder is de�ned by a Frenet referenceFrame which de�nes a coordinate system based on three orthogonal unityvectors (see Figure 2): a tangent vector T (t), a normal vector N(t) and abi-normal vector B(t).T
B
NC(u)Fig. 2. Frenet Frame illustration.Thus, the normal plane L(t) at a point t of the skeleton SKLT (t) can bede�ned with the vectors N(t) and B(t), and the vectors B(t) and T (t) of thenormal plane specify the orientation of the curve.{ In each section, the contour curve C(v) of vessel is approximated as a set ofpoints on the normal plane L(t). This approximation allows di�erent levelsof precision in the reconstruction from a simple polygon, a circle, an ellipse,to a spline [13]. In regular segments, the contour representation is implicitbecause the regular sections are circles and thus, it is enough to store theirdiameters. Cross sections in stenoses, aneuryms and branchings, generallymore complex, are represented explicitly.{ It is su�cient to store sections only at points of the skeletal curve wherea signi�cant change of curvature or diameter exists and at end-points ofthe di�erent features. In the regular segments, as the diameter of the crosssection varies linearly, only one diameter per cylindrical segment and twodiameters per conical segment need to be stored.
{ There is a unique correspondence between the points of two consecutivesections. In the branching nodes, this correspondence is based on the criteriade�ned in [14] and [15].{ There is no blending between two consecutive cross-sections, as vessels donot present twists in their shape. Therefore a linear interpolation betweensection su�ces [12].The surface model distributed into each node of the graph structure is de�nedas the clipping region of the generalized cylinders against the node spatial region.Then, the surface data attached to a node is the skeletal curves and the set ofend contour curves of the anatomical features which are concatenated in thenode.This surface representation enables the evaluation of the geometry of theboundary model with di�erent levels of detail. The simplest evaluation is a unionof generalized cylinders between nodes. A smoother one consists in polygonal-izing the surface by tiling between contour curves ([14], [15]). Finally, it canbe approximated by tensor product spline surfaces. This property of the modelmakes it suitable to the variety of operations that must be realized on it. Someoperations, such as uid simulations, require only simple cylindrical approxima-tions while other ones, such as the navigations, need smoother surfaces.2.3 Volume representationThe volume data represent the inner properties of the vessels, i.e. the densityand the velocity. The most usual way of representing volume properties is thevoxel model. This model allows direct access to a point, given its coordinates,and ordered traversals according to a coordinate direction. On the contrary,it does not provide a direct traversal of the vascular graph structure. Fromthe occupancy point of view, it has high memory requirements. Even though,considering the sparse structure of the vessels, the voxels corresponding to thevascular map occupy only around a 2% of the model. Thus, the voxel model seemsto require too much memory to be suitable for the representation of the vessels.Several compression schemes have been analyzed in the literature [16], such as theoctree model and the frequential models. However, the former one is not suitablefor scattered distributions of the objects, as in the vessels case. Besides, althoughsome research on direct visualization of frequency models have been carried on[17], the rendering of these models is does not yet provide enough quality andperformance to be suitable for computer assisted neurovascular application.An alternative model is a compression of the voxel model using a run-lengthencoding [18], [19]. It is a suitable model for low occupancy data sets, especiallyif the original data is full of long constant property values sequences. A �rstdi�culty with this codi�cation is that the direct access to a voxel must beperformed as a search on the run-length structure. [18] proposes to use additionalindexed tables with pointers to the �rst voxel of each slice and each row in orderto reduce the search to a column length. A second di�culty with a run-lengthencoded volume is that the volume can only be traversed optimally in the order
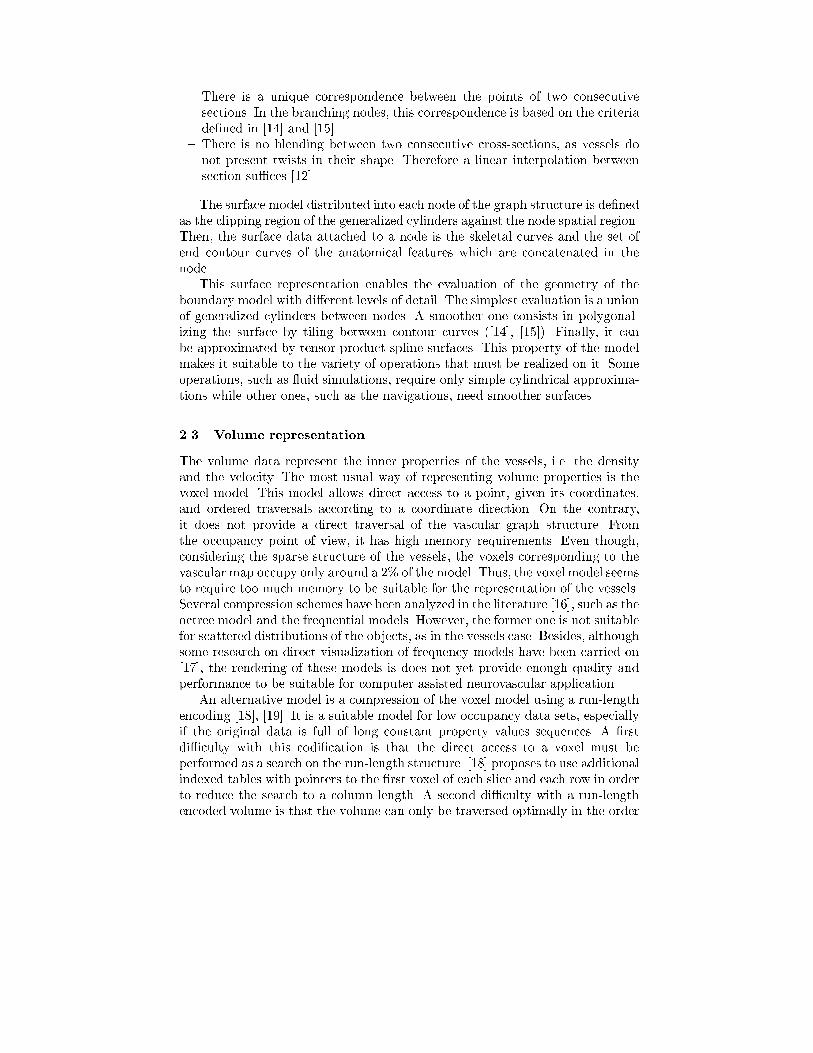
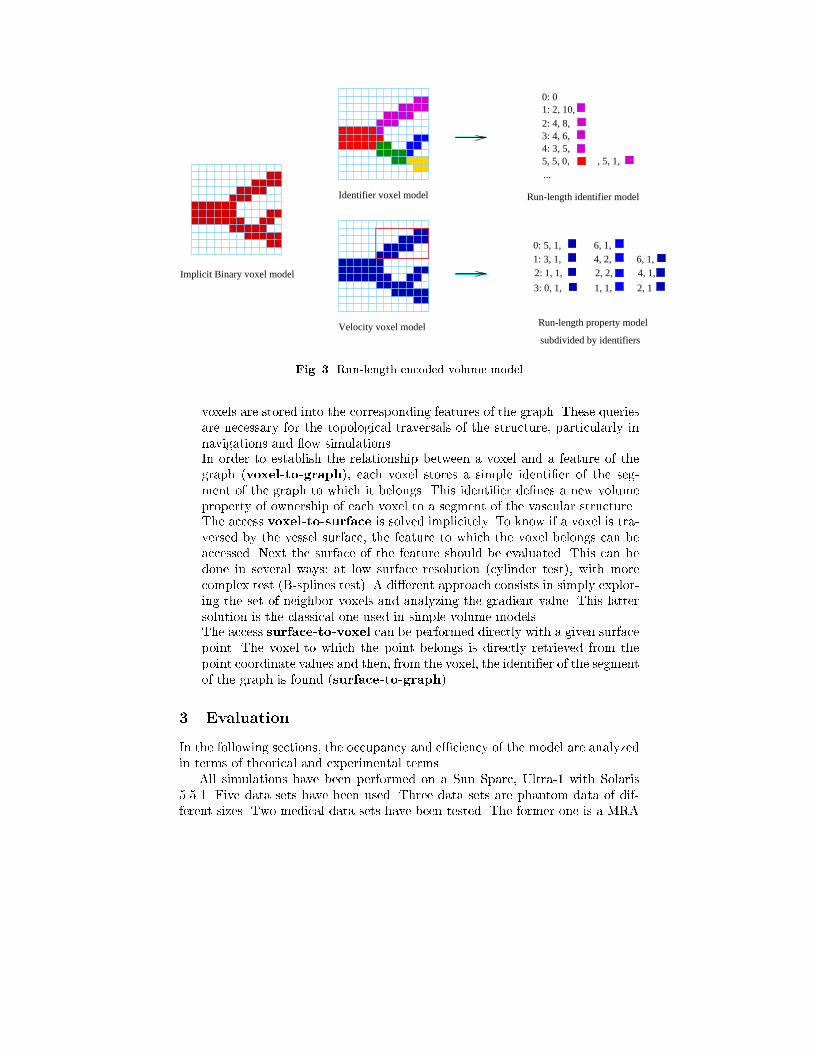
in which the voxels are encoded. Thus, only a coordinate axis traversal of themodel is optimal. Again, [18] solves this problem by precomputing three run-length encoding, one for each of the three coordinate axes. Finally, as the run-length is a spatial enumeration scheme, the volume traversal according to thetopological order is, as in the voxel model, computationally expensive. This is amajor drawback because topogical traversals of the graph are needed in blood ow simulations as well as navigations.To solve the latter problem the volume representation proposed herein keepsseparate volume representation of all the segments of the graph nodes and allthe branches (features). This allows a random access to the features, as requiredin navigations, while taking bene�t of the spatial ordering of each separate voxelmodel. Speci�cally, the volume representation of each node and segment is asubset of the original voxel model enclosing the bounding box of the feature,such that only the voxels belonging to the feature have a property value. Thisrepresentation involves overlapping of spatially close features of the graph al-though the property values of vascular voxels are stored only once in the unionof all these subsets.The volume models of each feature can be coded either as voxel sets ofthe bounding box or as run-length according to the ownership of each voxelto the feature. Both representations allow direct accesses to the voxel data ofeach feature, as well as ordered traversals according to a coordinate direction.However, the run-length traversals are slower than the raw model ones. Fromthe memory point of view, on one hand, empty voxels of the overlapping regionsmay be codi�ed several times in the raw voxel scheme. On the other hand, therun-length encoding is generally more compact, although for small regions, theextra pointer tables can produce an unacceptable overhead. The tradeo� betweenmemory and e�ciency depends on the actual distribution of the vessels in inputdata. This double structure (encoding of segments and branches and encodingof the property values) is depicted in Figure 3. It takes advantage of the spatialstructure of the voxel model. Thus, it allows a direct access to the propertyvalues of any voxel of a segment or a branch.Keeping the original voxel model in addition to the features volume schemesis redundant and una�ordable in most applications environment because of thememory limitations. Thus, the initial voxel model is segmented and it is com-pacted by a run-length encoding method on the basis of the vessel ownershipproperty value of each voxel. This model is necessary to keep the implicit spatialorder of the voxel model and to compress the sparseness of the data, withoutloosing the direct access of a voxel.2.4 Management of the three information layersThe main characteristic of the three layers model is that it provides simultaneousaccess to the topology, the surface and the properties. These di�erent queriesare managed as follows: Speci�cally, the following queries should be feasible:{ All the accesses from the graph to the surface (graph-to-surface) and tothe volume data (graph-to-surface) are direct because the surface and the
0: 01: 2, 10, 2: 4, 8, 3: 4, 6,4: 3, 5,5, 5, 0, , 5, 1, ...
0: 5, 1, 6, 1,1: 3, 1, 4, 2, 6, 1,2: 1, 1, 2, 2, 4, 1,
3: 0, 1, 1, 1, 2, 1
Run-length property model
subdivided by identifiers
Identifier voxel model
Velocity voxel model
Implicit Binary voxel model
Run-length identifier model
Fig. 3. Run-length encoded volume modelvoxels are stored into the corresponding features of the graph. These queriesare necessary for the topological traversals of the structure, particularly innavigations and ow simulations.{ In order to establish the relationship between a voxel and a feature of thegraph (voxel-to-graph), each voxel stores a simple identi�er of the seg-ment of the graph to which it belongs. This identi�er de�nes a new volumeproperty of ownership of each voxel to a segment of the vascular structure.{ The access voxel-to-surface is solved implicitely. To know if a voxel is tra-versed by the vessel surface, the feature to which the voxel belongs can beaccessed. Next the surface of the feature should be evaluated. This can bedone in several ways: at low surface resolution (cylinder test), with morecomplex test (B-splines test). A di�erent approach consists in simply explor-ing the set of neighbor voxels and analyzing the gradient value. This lattersolution is the classical one used in simple volume models.{ The access surface-to-voxel can be performed directly with a given surfacepoint. The voxel to which the point belongs is directly retrieved from thepoint coordinate values and then, from the voxel, the identi�er of the segmentof the graph is found (surface-to-graph).3 EvaluationIn the following sections, the occupancy and e�ciency of the model are analyzedin terms of theorical and experimental terms.All simulations have been performed on a Sun Sparc, Ultra-1 with Solaris5.5.1. Five data sets have been used. Three data sets are phantom data of dif-ferent sizes. Two medical data sets have been tested. The former one is a MRA
data set and the latter is from SCTA. A segmentation preprocess is performedbefore building the model.3.1 OccupancyIn order to analyze this scheme in relation to the classical voxel model, and inrelation to a surface model, such as a set of triangles from a Marching Cubesalgorithm, it is necessary to consider some parameters inherent to the vasculardata structure. Let n3 be the number of voxels of the original data set, and n3bthe number of voxels of the bounding box. Let nv the number of voxels whichcontains blood vessels. nv is 0:02� n3b . Let nf be the number of total featuresof the vascular data with a mean size of n3ss voxels.A classical voxel model of the whole volume requires 28�n3 bytes (1 integerfor the density value and 3 oats for the velocity value at each voxel). A run-length compression of the boundary box representation needs 28� 0:02� n3b +6 � 4 � n2b bytes, where the last adder is the occupancy of the three tablesordered according to the three main axis respectively and assuming that thenumber of features can be codi�ed with one integer. If a double structure ofvolume data is stored in order to keep both spatial and ordered traversal, therun-length model of the whole data, according to the identi�er of the features,takes 0:02�n2b � 8+6� 4�n2b , where the �rst adder is a coarse approximationof the real cost n2b � (log2nf + log2nb) bits of a general case of run-length [20].In addition to the primary model (i.e. the run-length of labeled voxels) stor-age requirements, a secondary model for each feature must be codi�ed. If thesesecondary models are codi�ed with boundary boxes, the mean global occupancyis 28 � nf � n3ss bytes, whereas if these secondary models are run-length codeaccording the ownership of the feature, the memory needed is 28� 0:02� n3b +6� 4� n2ss bytes.The memory space required to store the graph and the surface is the fol-lowing. First, the occupancy of the graph is 2 � e, where e is the number of theedges between branchings. In addition, if each feature has, in mean, three con-trol points and the number of points for each contour is at most 20, the surfacerepresentation needs 20� 3� nf � 16 bytes.Table 1 shows the memory requeriments of the symbolic model of di�erentinput data sets, as well as, the memory requeriments of the classical voxel modeland of the mesh of triangles model.The reduction of the memory requirements ranges from 37:74% to 95; 85%.The maximum e�ciency is achieved when the occupancy of the data is low andwhen the distribution of the data in the volume is more concentrated. This isthe case of the model MRA which represents blood vessels. By opposite, modelPhantom 3, which represents a skull has also a relatively low occupancy but thedata are spread over the whole model. Therefore the compression rate is lower.Finally SCTA produces an overhead of memory requirement because the data,interleaved surface layers, occupy the whole original volume. Summarizing, themodel proves to be e�cient for sparse and concentrated structures.
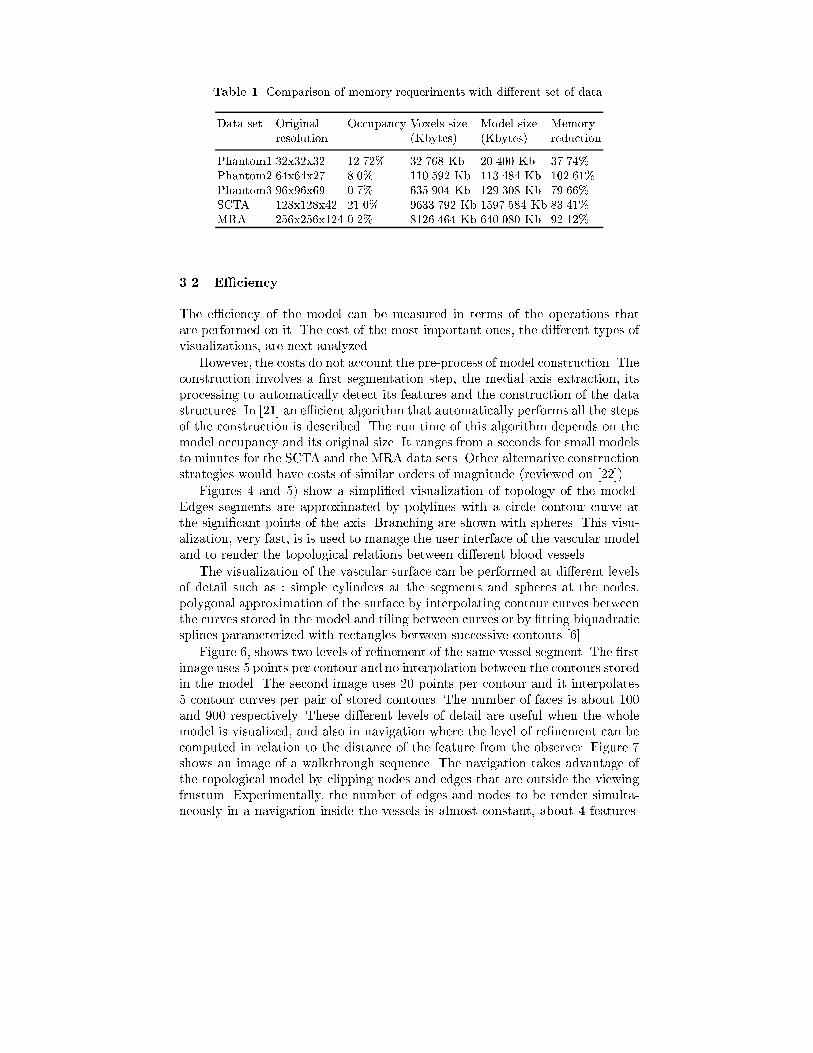
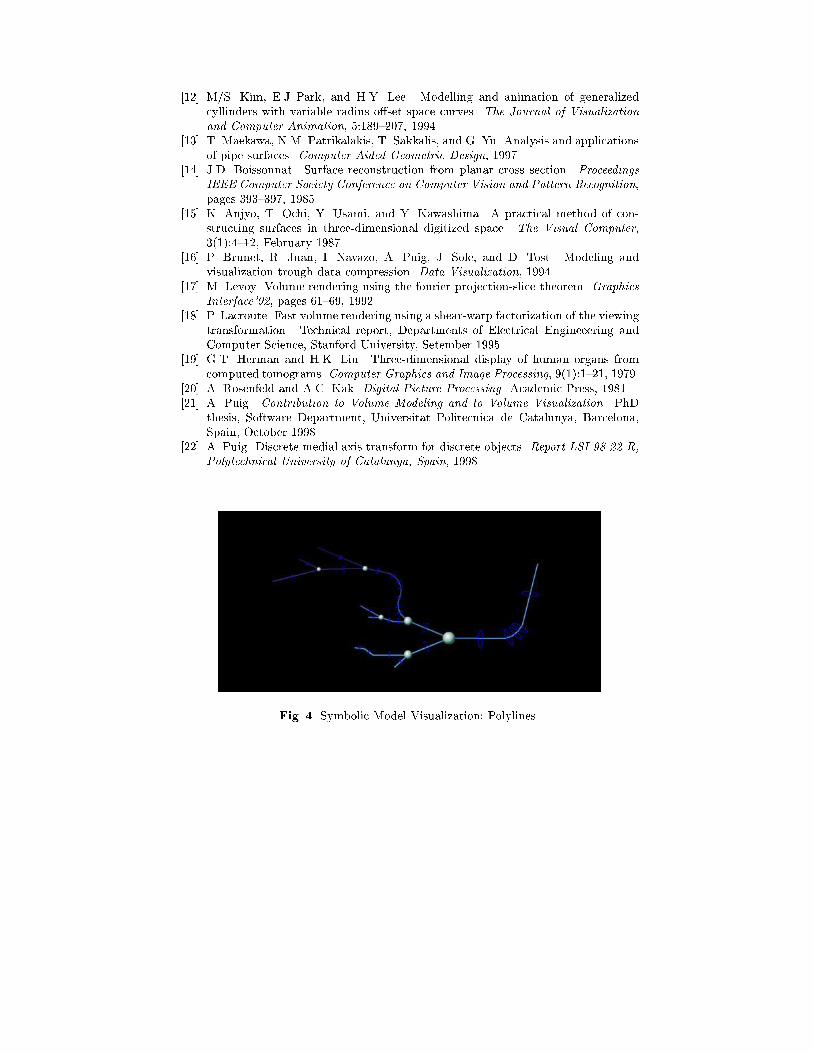
Table 1. Comparison of memory requeriments with di�erent set of data.Data set Original Occupancy Voxels size Model size Memoryresolution (Kbytes) (Kbytes) reductionPhantom1 32x32x32 12.72% 32.768 Kb 20.400 Kb 37.74%Phantom2 64x64x27 8.0% 110.592 Kb 113.484 Kb 102.61%Phantom3 96x96x69 0.7% 635.904 Kb 129.308 Kb 79.66%SCTA 128x128x42 21.0% 9633.792 Kb 1597.584 Kb 83.41%MRA 256x256x124 0.2% 8126.464 Kb 640.080 Kb 92.12%3.2 E�ciencyThe e�ciency of the model can be measured in terms of the operations thatare performed on it. The cost of the most important ones, the di�erent types ofvisualizations, are next analyzed.However, the costs do not account the pre-process of model construction. Theconstruction involves a �rst segmentation step, the medial axis extraction, itsprocessing to automatically detect its features and the construction of the datastructures. In [21] an e�cient algorithm that automatically performs all the stepsof the construction is described. The run time of this algorithm depends on themodel occupancy and its original size. It ranges from a seconds for small modelsto minutes for the SCTA and the MRA data sets. Other alternative constructionstrategies would have costs of similar orders of magnitude (reviewed on [22]).Figures 4 and 5) show a simpli�ed visualization of topology of the model.Edges segments are approximated by polylines with a circle contour curve atthe signi�cant points of the axis. Branching are shown with spheres. This visu-alization, very fast, is is used to manage the user interface of the vascular modeland to render the topological relations between di�erent blood vessels.The visualization of the vascular surface can be performed at di�erent levelsof detail such as : simple cylinders at the segments and spheres at the nodes,polygonal approximation of the surface by interpolating contour curves betweenthe curves stored in the model and tiling between curves or by �tting biquadraticsplines parameterized with rectangles between successive contours [6].Figure 6, shows two levels of re�nement of the same vessel segment. The �rstimage uses 5 points per contour and no interpolation between the contours storedin the model. The second image uses 20 points per contour and it interpolates5 contour curves per pair of stored contours. The number of faces is about 100and 900 respectively. These di�erent levels of detail are useful when the wholemodel is visualized, and also in navigation where the level of re�nement can becomputed in relation to the distance of the feature from the observer. Figure 7shows an image of a walkthrough sequence. The navigation takes advantage ofthe topological model by clipping nodes and edges that are outside the viewingfrustum. Experimentally, the number of edges and nodes to be render simulta-neously in a navigation inside the vessels is almost constant, about 4 features.
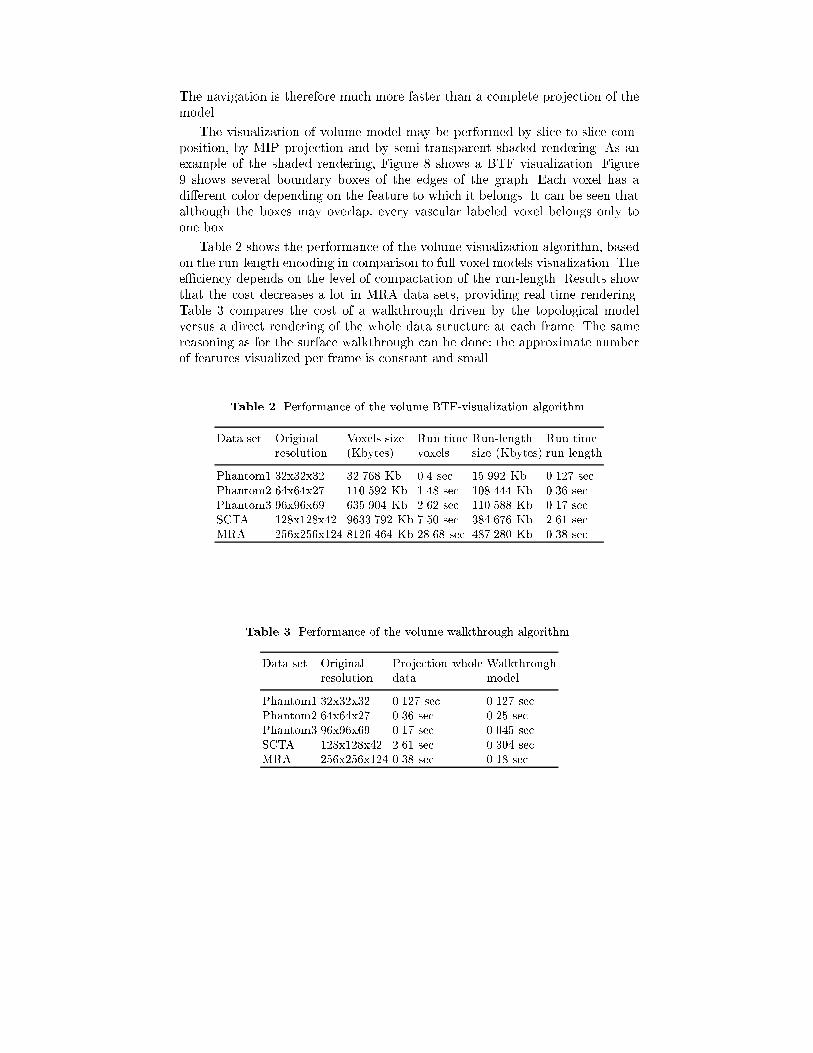
The navigation is therefore much more faster than a complete projection of themodel.The visualization of volume model may be performed by slice-to-slice com-position, by MIP projection and by semi-transparent shaded rendering. As anexample of the shaded rendering, Figure 8 shows a BTF visualization. Figure9 shows several boundary boxes of the edges of the graph. Each voxel has adi�erent color depending on the feature to which it belongs. It can be seen thatalthough the boxes may overlap, every vascular labeled voxel belongs only toone box.Table 2 shows the performance of the volume visualization algorithm, basedon the run-length encoding in comparison to full voxel models visualization. Thee�ciency depends on the level of compactation of the run-length. Results showthat the cost decreases a lot in MRA data sets, providing real time rendering.Table 3 compares the cost of a walkthrough driven by the topological modelversus a direct rendering of the whole data structure at each frame. The samereasoning as for the surface walkthrough can be done: the approximate numberof features visualized per frame is constant and small.Table 2. Performance of the volume BTF-visualization algorithm.Data set Original Voxels size Run time Run-length Run timeresolution (Kbytes) voxels size (Kbytes) run-lengthPhantom1 32x32x32 32.768 Kb 0.4 sec. 15.992 Kb 0.127 sec.Phantom2 64x64x27 110.592 Kb 1.48 sec. 108.444 Kb 0.36 sec.Phantom3 96x96x69 635.904 Kb 2.62 sec. 110.588 Kb 0.17 sec.SCTA 128x128x42 9633.792 Kb 7.50 sec. 384.676 Kb 2.61 sec.MRA 256x256x124 8126.464 Kb 28.68 sec. 487.280 Kb 0.38 sec.Table 3. Performance of the volume walkthrough algorithm.Data set Original Projection whole Walkthroughresolution data modelPhantom1 32x32x32 0.127 sec. 0.127 sec.Phantom2 64x64x27 0.36 sec. 0.25 sec.Phantom3 96x96x69 0.17 sec. 0.045 sec.SCTA 128x128x42 2.61 sec. 0.304 sec.MRA 256x256x124 0.38 sec. 0.18 sec.
4 Conclusions and future workThe main contribution of this paper is the proposal of a representation schemefor blood vessels, of their surface, as well as their volume. It is a multiresolutionand hybrid model: it stores symbolic information on the topology and geometryas well as volume and surface data. These characteristics provide exibility andthey enable the realization of all the physicians requirements in a ComputedAssisted Neurovascular System.The model has been implemented and tested with di�erent visualizationstrategies. Results show that for MRA data a compression rate of 90% canbe achieved. Visualizations reduce impressively their cost, especially navigationsdriven by the topological model.Work on progress is the integrated visualization of the blood ow velocitywith the vascular surface. Another question is how to improve the control ofthe re�nement level by automatically tuning the value K, which determines thenumber of control points stored in the codi�cation of the axis model.References[1] A. Savopoulos G. Sakas, M. Grimm. Optimized maximum intensity projection(mip). 6th Eurographics Workshop on Rendering, pages 81{93, June 1995.[2] G. Gerig, R. Kikinis, and F.A. Jolesz. Image processing of routine spin-echomr images to enhance vascular structures: Comparison with mr angiography. 3DImaging in Medicine: Algorithms, Systems and Applications, pages 121{132, 1990.[3] H.C. Cline, W.E. Lorensen, R. Kikinis, and F. Jolesz. Three-dimensional segmen-tation of mr images of the head using probability and connectivity. Journal ofComputer Assisted Tomography, 14(6):1037{1045, November/December 1990.[4] C. Barillot, B. Gibaud, J. Scarabin, and J. Coatrieux. 3d reconstruction of cerebralblood vessels. IEEE Computer Graphics and Applications, 5(12):13{19, December1985.[5] C. Zahlten, H. Jurgens, and H.O. Peitgen. Reconstruction of branching bloodvessels from ct-data. Proceedins of Rostock, 1994.[6] H.H. Ehricke, K. Donner, W. Koller, and W. Straber. Visualization of vasculaturefrom volume data. Computer and Graphics, 18(3):395{406, 1994.[7] D. Vandermeulen, R. Verbeeck, L. Berben, D. Delaere, P. Suetens, and G. Mar-chal. Continuous voxel classi�cation by stochastic relaxation: Theory and appli-cation to mr imaging and mr angiography. Internal Research Report, MedicalImaging Research Lab, ESAT, Belgium, 1994.[8] W. Heidrich, M. McCool, and J. Stevens. Interactive maximum projection vol-ume rendering. Proceedings of the IEEE Volume Visualization 95, pages 11{18,October 1995.[9] K.H. Hohne, M. Bomans, A. Pommert, M. Riemer, C. Schierds, U. Tiede, andG. Wiebecke. 3d visualization of tomographic volume data using the generalizedvoxel-model. The Visual Computer, 6(1):28{36, February 1990.[10] K.J. Zuiderveld. Vr in radiology - �rst experiences at the university hospitalutrecht. ACM Computer Graphics, pages 47{48, November 1996.[11] A.V. Aho, J.E. Hopcroft, and J.D. Ullman. Data Structures and Algorithms.Addison-Wesley, 1983.
[12] M/S. Kim, E.J Park, and H.Y. Lee. Modelling and animation of generalizedcyllinders with variable radius o�set space curves. The Journal of Visualizationand Computer Animation, 5:189{207, 1994.[13] T. Maekawa, N.M. Patrikalakis, T. Sakkalis, and G. Yu. Analysis and applicationsof pipe surfaces. Computer Aided Geometric Design, 1997.[14] J.D. Boissonnat. Surface reconstruction from planar cross section. ProceedingsIEEE Computer Society Conference on Computer Vision and Pattern Recognition,pages 393{397, 1985.[15] K. Anjyo, T. Ochi, Y. Usami, and Y. Kawashima. A practical method of con-structing surfaces in three-dimensional digitized space. The Visual Computer,3(1):4{12, February 1987.[16] P. Brunet, R. Juan, I. Navazo, A. Puig, J. Sole, and D. Tost. Modeling andvisualization trough data compression. Data Visualization, 1994.[17] M. Levoy. Volume rendering using the fourier projection-slice theorem. GraphicsInterface'92, pages 61{69, 1992.[18] P. Lacroute. Fast volume rendering using a shear-warp factorization of the viewingtransformation. Technical report, Departments of Electrical Engineeering andComputer Science, Stanford University, Setember 1995.[19] G.T. Herman and H.K. Liu. Three-dimensional display of human organs fromcomputed tomograms. Computer Graphics and Image Processing, 9(1):1{21, 1979.[20] A. Rosenfeld and A.C. Kak. Digital Picture Processing. Academic Press, 1981.[21] A. Puig. Contribution to Volume Modeling and to Volume Visualization. PhDthesis, Software Department, Universitat Politecnica de Catalunya, Barcelona,Spain, October 1998.[22] A. Puig. Discrete medial axis transform for discrete objects. Report LSI-98-22-R,Polytechnical University of Catalunya, Spain, 1998.
Fig. 4. Symbolic Model Visualization: Polylines.
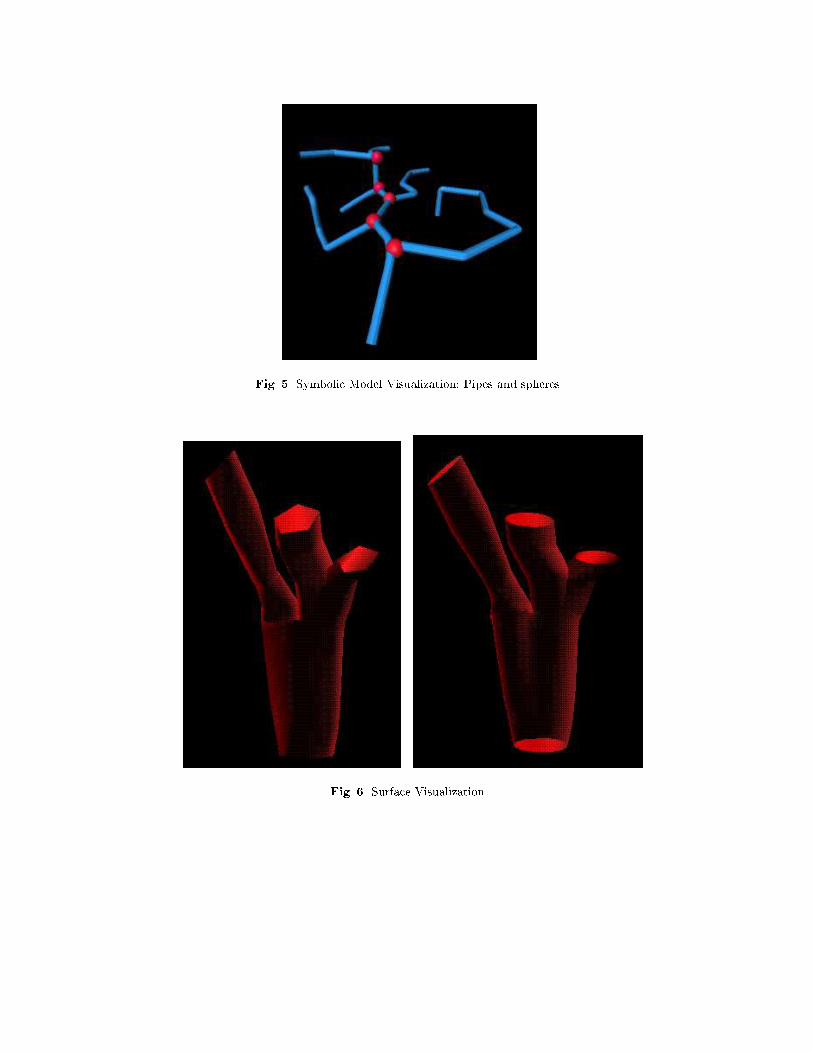
Fig. 5. Symbolic Model Visualization: Pipes and spheres.
Fig. 6. Surface Visualization.
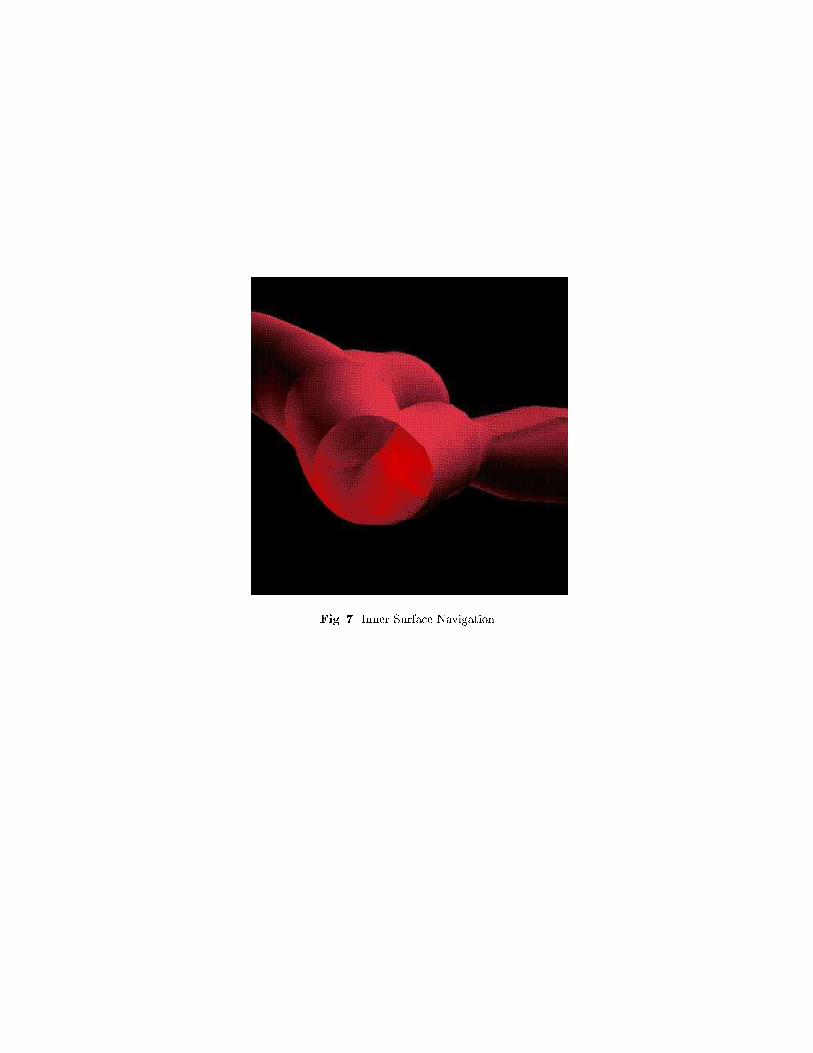
Fig. 7. Inner Surface Navigation.
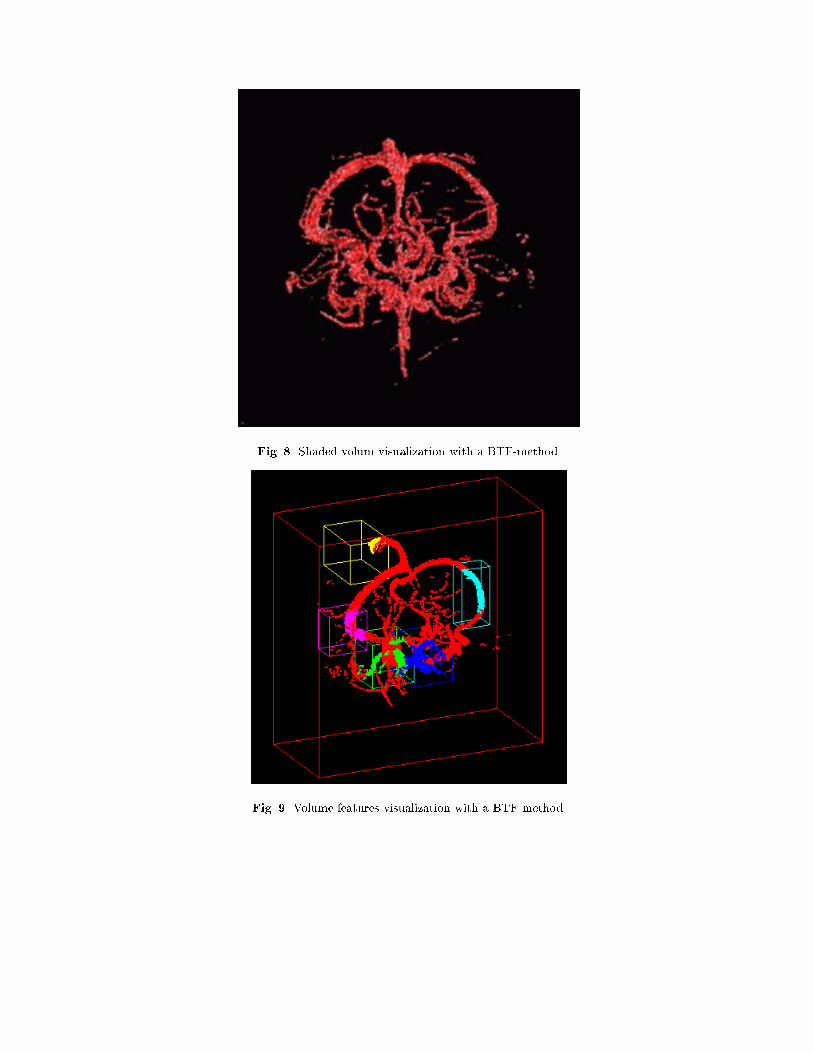
Fig. 8. Shaded volum visualization with a BTF-method.
Fig. 9. Volume features visualization with a BTF-method.
Related Documents