Qantas Airways Limited 1H14 Results Supplementary Slides 27 February 2014 2 Group Performance

Welcome message from author
This document is posted to help you gain knowledge. Please leave a comment to let me know what you think about it! Share it to your friends and learn new things together.
Transcript
Qantas Airways Limited1H14 Results
Supplementary Slides
27 February 2014
2
Group Performance
3
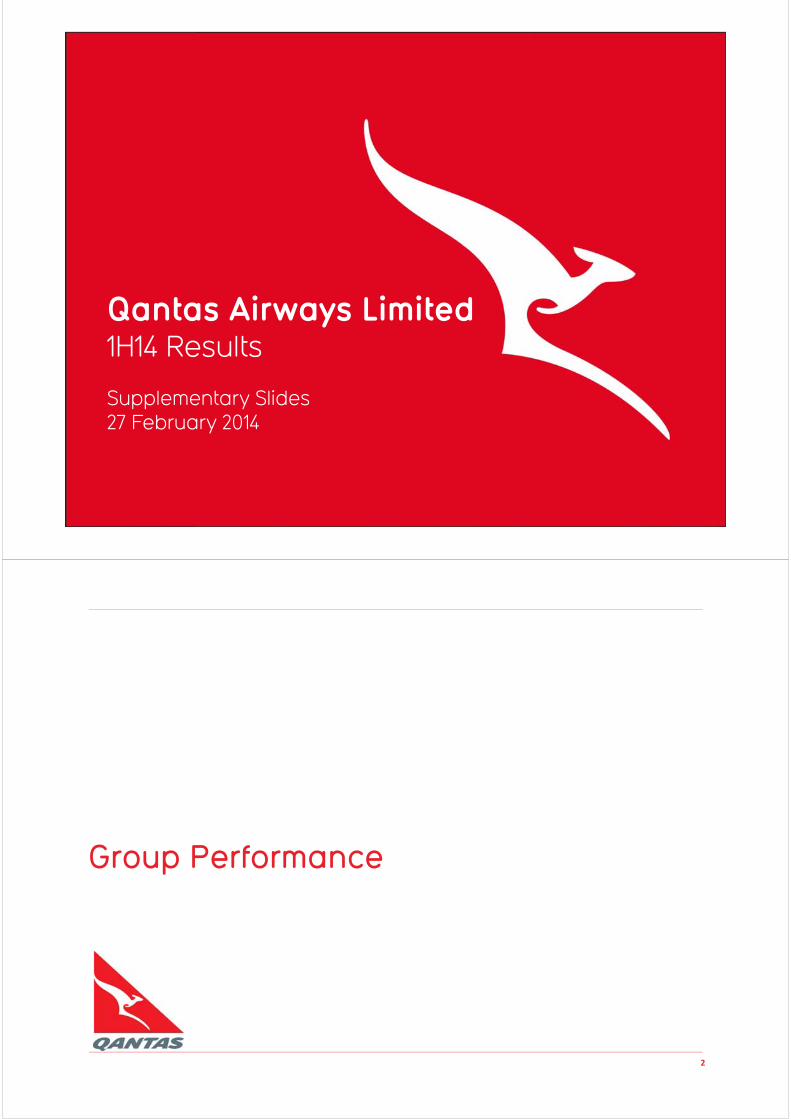
Group Highlights – Underlying Income Statement1
1. Underlying PBT is a non‐statutory measure and is the primary reporting measure used by the Qantas Group’s chief operating decision‐making bodies, being the Chief Executive Officer, GroupManagement Committee and the Board of Directors, for the purpose of assessing the performance of the Group. Underlying PBT is derived by adjusting Statutory PBT for the impact of AASB 139:Financial Instruments: Recognition and Measurement (AASB 139) which relate to other reporting periods and identifying certain other items which are not included in Underlying PBT. Refer toSupplementary Slide 4. 2. Net passenger revenue has been adjusted in 1H14 to include revenue from charter operations previously reported in Other revenue. 1H13 Net passenger revenue and Otherrevenue has been restated accordingly. These items remain excluded from the calculation of yield. 3. 1H13 has been restated for the impact of the mandatory application of the revised AccountingStandard AASB 119: Employee Benefits.
$M 1H14 1H133 VLY VLY %
Net passenger revenue2 6,786 7,042 (256) (4)
Net freight revenue 500 475 25 5
Other revenue2 617 725 (108) (15)
Revenue 7,903 8,242 (339) (4)
Operating expenses (excluding fuel) 4,797 4,770 27 (1)
Fuel 2,255 2,181 74 (3)
Depreciation and amortisation 746 719 27 (4)
Non‐cancellable aircraft operating lease rentals 261 265 (4) 2
Expenses 8,059 7,935 124 (2)
Underlying EBIT (156) 307 (463) >(100)
Net finance costs (96) (87) 9 (10)
Underlying PBT1 (252) 220 (472) >(100)
AASB 139 mark‐to‐market movements relating to other reporting periods1 54 34 20 59
Other items not included in Underlying PBT1 (107) (106) (1) (1)
Statutory PBT (305) 148 (453) >(100)
4
Reconciliation to Statutory PBT
1. Underlying PBT is a non‐statutory measure and is the primary reporting measure used by the Qantas Group’s chief operating decision‐making bodies, being the Chief Executive Officer, GroupManagement Committee and the Board of Directors, for the purpose of assessing the performance of the Group. Underlying PBT is derived by adjusting Statutory PBT for the impact of AASB 139:Financial Instruments: Recognition and Measurement (AASB 139) which relate to other reporting periods and identifying certain other items which are not included in Underlying PBT. Refer 1H14Results presentation slide 6. 2. Net passenger revenue has been adjusted in 1H14 to include revenue from charter operations previously reported in Other revenue. 1H13 Net passenger revenue andOther revenue have been restated accordingly. These items remain excluded from the calculation of yield. 3. 1H13 has been restated for the impact of the mandatory application of the revisedAccounting Standard AASB 119: Employee Benefits.
$M 1H14 1H133
Underlying1 Ineffectiveness relating to
other reporting periods
Other items not included in
Underlying PBT
Statutory Underlying1 Ineffectiveness relating to
other reporting periods
Other items not included in
Underlying PBT
Statutory
Net passenger revenue2 6,786 ‐ ‐ 6,786 7,042 ‐ ‐ 7,042
Net freight revenue 500 ‐ ‐ 500 475 ‐ ‐ 475
Other revenue2 617 ‐ ‐ 617 725 ‐ ‐ 725
Revenue 7,903 ‐ ‐ 7,903 8,242 ‐ ‐ 8,242
Operating expenses (excl fuel) 4,797 (38) 107 4,866 4,770 5 106 4,881
Fuel 2,255 (14) ‐ 2,241 2,181 (46) ‐ 2,135
Depreciation and amortisation 746 ‐ ‐ 746 719 ‐ ‐ 719
Non–cancellable aircraft operating lease rentals
261 ‐ ‐ 261 265 ‐ ‐ 265
Expenses 8,059 (52) 107 8,114 7,935 (41) 106 8,000
EBIT (156) 52 (107) (211) 307 41 (106) 242
Net finance costs (96) 2 ‐ (94) (87) (7) ‐ (94)
PBT (252) 54 (107) (305) 220 34 (106) 148
5
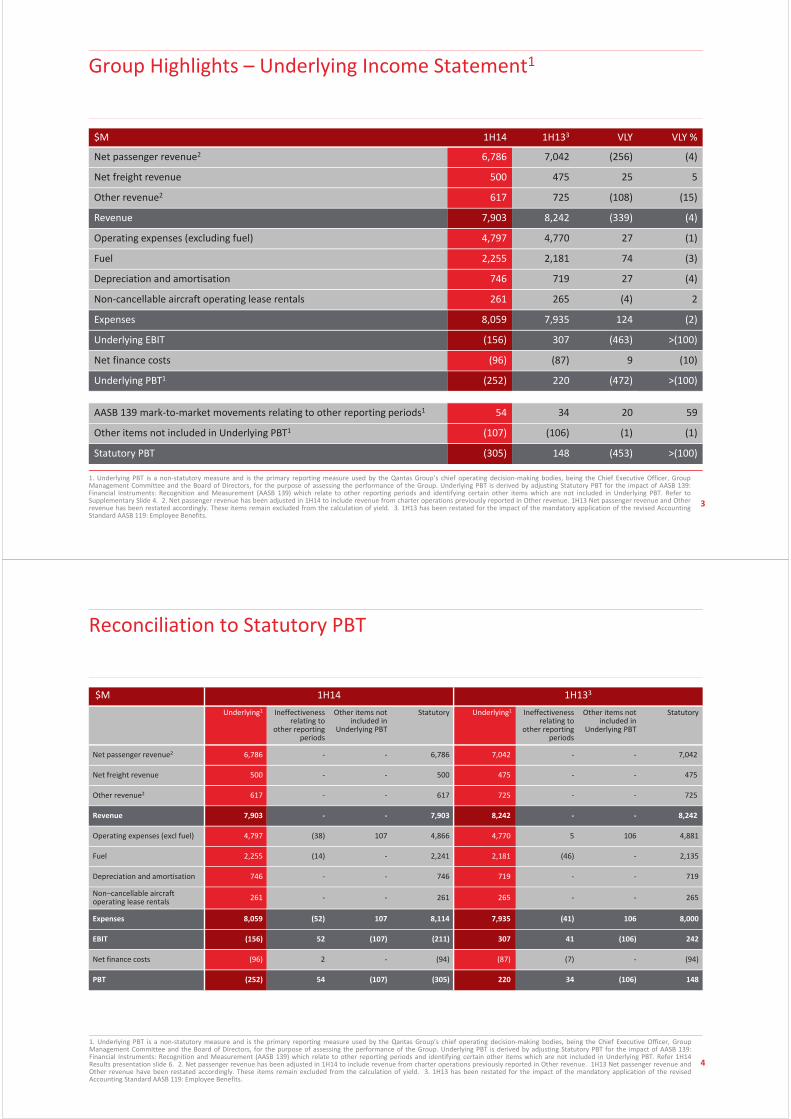
NET PASSENGER REVENUE1 DOWN 4%
• Group yield (excluding FX) down 3% and loads down 1.5pts
• Charter revenue growth
• Increased revenue from partner airlines including Emirates
NET FREIGHT REVENUE UP 5%
• AaE2 revenue contribution, consolidated from November 2012
• Reduced international capacity due to network changes
FREQUENT FLYER REDEMPTION, MARKETING, STORE AND OTHER REVENUE UP 12%
• 11% increase in awards redeemed
• 8% membership growth
• Increased redemption activity driven by new partners
(1.2)%RPKs (m) 57,095 56,393
ASKs (m) 71,374 71,8440.7%
(Continued next slide)
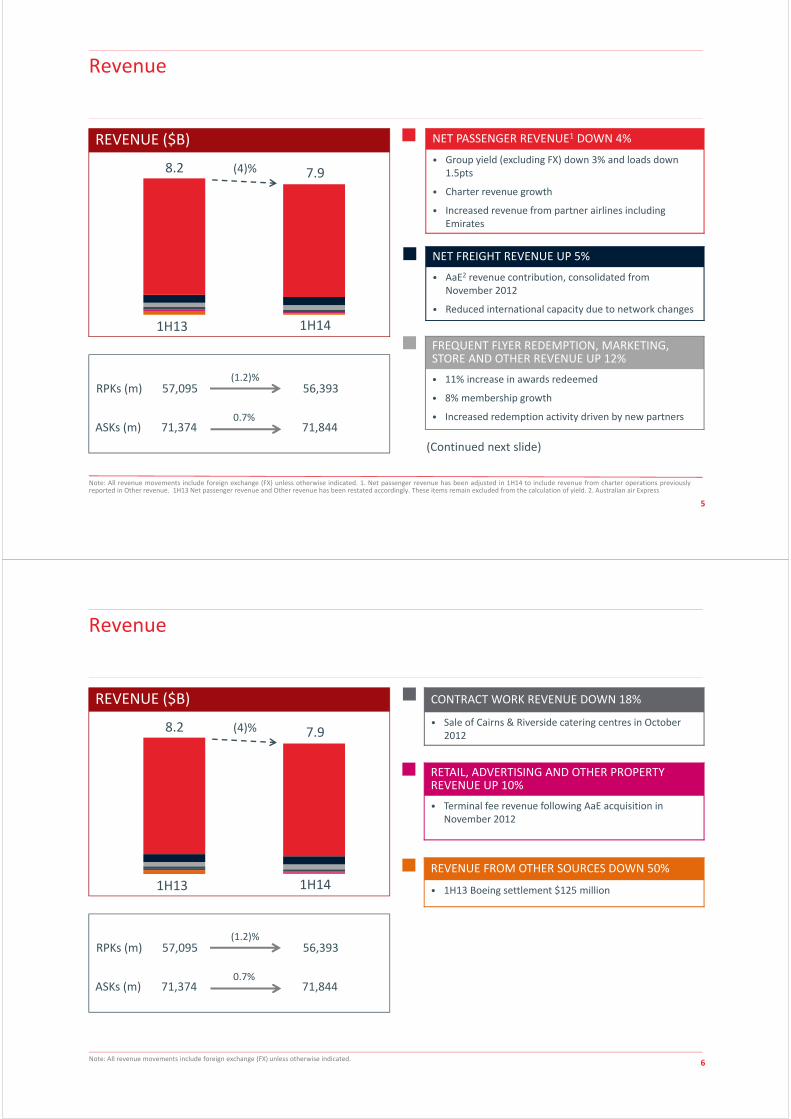
REVENUE ($B)
1H13 1H14
8.2 7.9(4)%
Note: All revenue movements include foreign exchange (FX) unless otherwise indicated. 1. Net passenger revenue has been adjusted in 1H14 to include revenue from charter operations previouslyreported in Other revenue. 1H13 Net passenger revenue and Other revenue has been restated accordingly. These items remain excluded from the calculation of yield. 2. Australian air Express
Revenue
6
Revenue
RETAIL, ADVERTISING AND OTHER PROPERTY REVENUE UP 10%
• Terminal fee revenue following AaE acquisition in November 2012
REVENUE FROM OTHER SOURCES DOWN 50%
• 1H13 Boeing settlement $125 million
Note: All revenue movements include foreign exchange (FX) unless otherwise indicated.
CONTRACT WORK REVENUE DOWN 18%
• Sale of Cairns & Riverside catering centres in October 2012
(1.2)%RPKs (m) 57,095 56,393
ASKs (m) 71,374 71,8440.7%
REVENUE ($B)
1H13 1H14
8.2 7.9(4)%
7
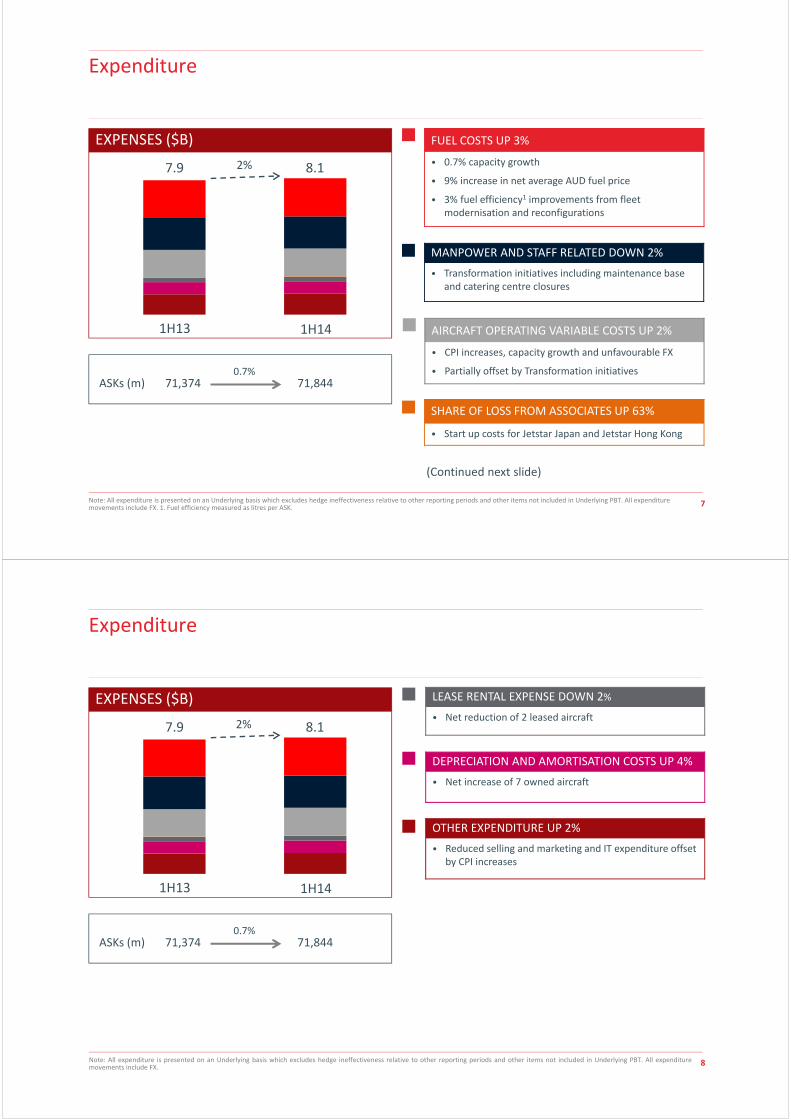
Expenditure
Note: All expenditure is presented on an Underlying basis which excludes hedge ineffectiveness relative to other reporting periods and other items not included in Underlying PBT. All expenditure movements include FX. 1. Fuel efficiency measured as litres per ASK.
ASKs (m) 71,374 71,8440.7%
EXPENSES ($B)
1H13 1H14
7.9 8.12%
AIRCRAFT OPERATING VARIABLE COSTS UP 2%
• CPI increases, capacity growth and unfavourable FX
• Partially offset by Transformation initiatives
FUEL COSTS UP 3%
• 0.7% capacity growth
• 9% increase in net average AUD fuel price
• 3% fuel efficiency1 improvements from fleet modernisation and reconfigurations
MANPOWER AND STAFF RELATED DOWN 2%
• Transformation initiatives including maintenance base and catering centre closures
SHARE OF LOSS FROM ASSOCIATES UP 63%
• Start up costs for Jetstar Japan and Jetstar Hong Kong
(Continued next slide)
8
Expenditure
LEASE RENTAL EXPENSE DOWN 2%
• Net reduction of 2 leased aircraft
OTHER EXPENDITURE UP 2%
• Reduced selling and marketing and IT expenditure offset by CPI increases
Note: All expenditure is presented on an Underlying basis which excludes hedge ineffectiveness relative to other reporting periods and other items not included in Underlying PBT. All expendituremovements include FX.
DEPRECIATION AND AMORTISATION COSTS UP 4%
• Net increase of 7 owned aircraft
ASKs (m) 71,374 71,8440.7%
EXPENSES ($B)
1H13 1H14
7.9 8.12%
9
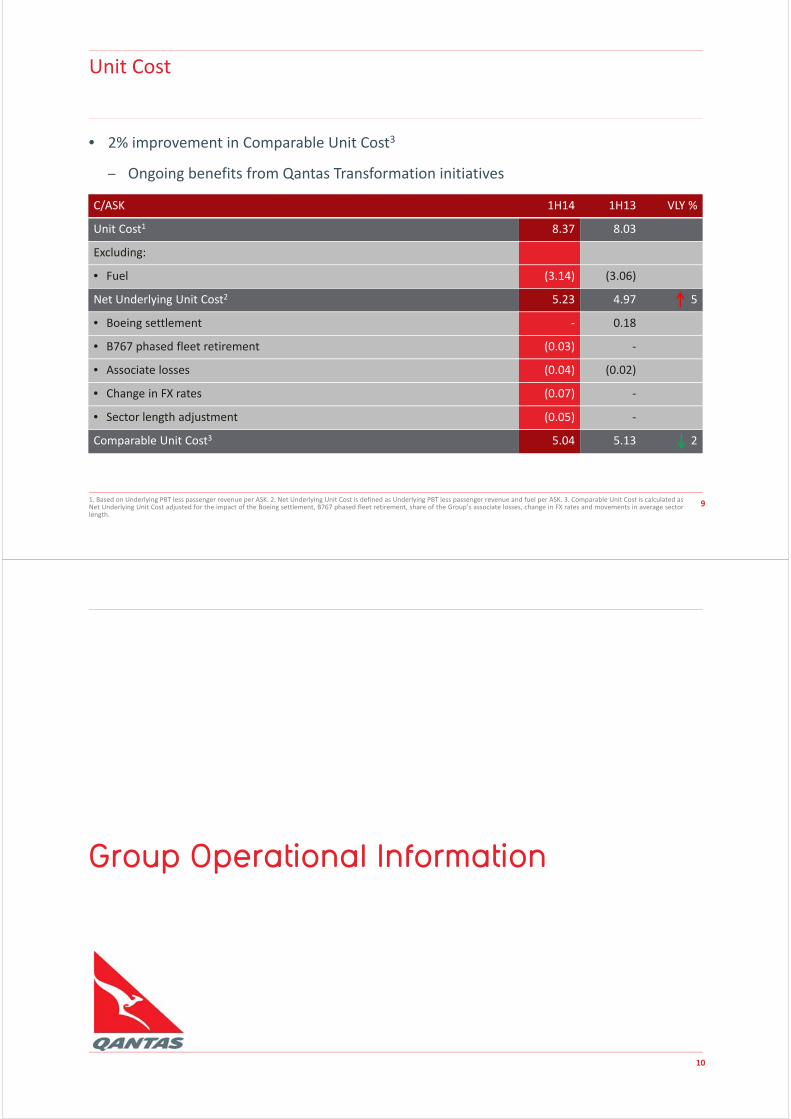
Unit Cost
C/ASK 1H14 1H13 VLY %
Unit Cost1 8.37 8.03
Excluding:
• Fuel (3.14) (3.06)
Net Underlying Unit Cost2 5.23 4.97 5
• Boeing settlement ‐ 0.18
• B767 phased fleet retirement (0.03) ‐
• Associate losses (0.04) (0.02)
• Change in FX rates (0.07) ‐
• Sector length adjustment (0.05) ‐
Comparable Unit Cost3 5.04 5.13 2
1. Based on Underlying PBT less passenger revenue per ASK. 2. Net Underlying Unit Cost is defined as Underlying PBT less passenger revenue and fuel per ASK. 3. Comparable Unit Cost is calculated asNet Underlying Unit Cost adjusted for the impact of the Boeing settlement, B767 phased fleet retirement, share of the Group’s associate losses, change in FX rates and movements in average sectorlength.
• 2% improvement in Comparable Unit Cost3
– Ongoing benefits from Qantas Transformation initiatives
10
Group Operational Information
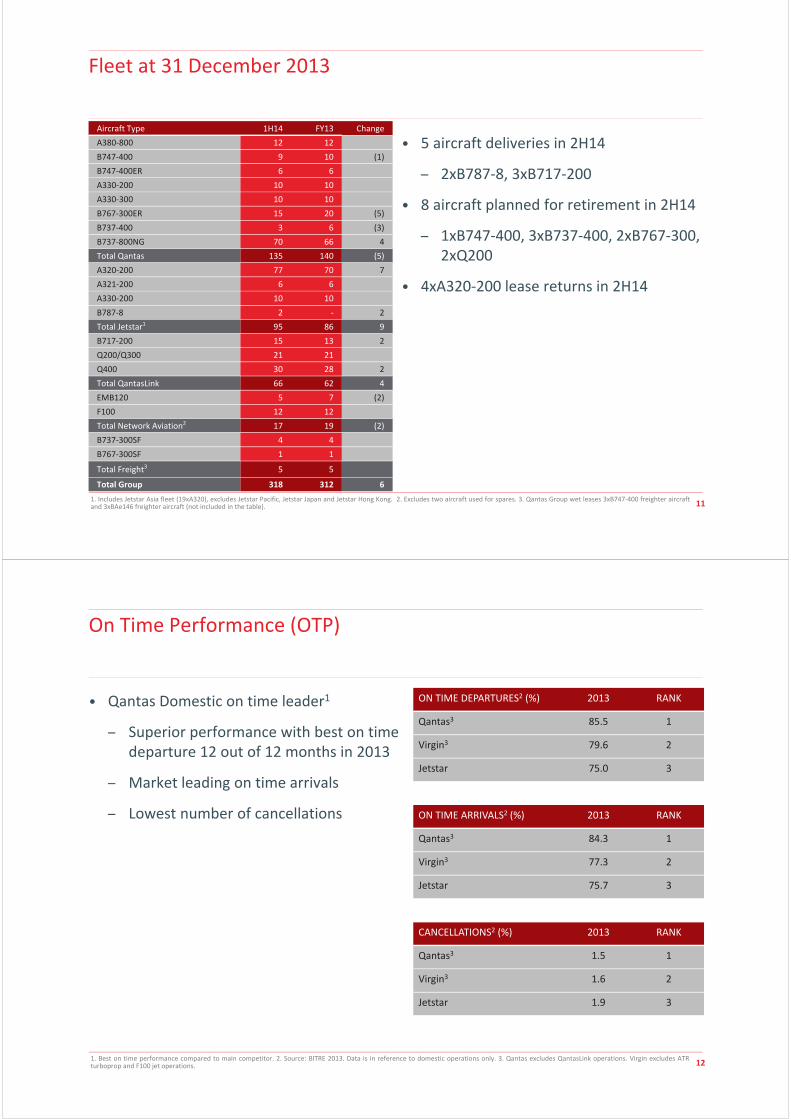
111. Includes Jetstar Asia fleet (19xA320), excludes Jetstar Pacific, Jetstar Japan and Jetstar Hong Kong. 2. Excludes two aircraft used for spares. 3. Qantas Group wet leases 3xB747‐400 freighter aircraftand 3xBAe146 freighter aircraft (not included in the table).
Fleet at 31 December 2013
Aircraft Type 1H14 FY13 Change
A380‐800 12 12
B747‐400 9 10 (1)
B747‐400ER 6 6
A330‐200 10 10
A330‐300 10 10
B767‐300ER 15 20 (5)
B737‐400 3 6 (3)
B737‐800NG 70 66 4
Total Qantas 135 140 (5)
A320‐200 77 70 7
A321‐200 6 6
A330‐200 10 10
B787‐8 2 ‐ 2
Total Jetstar1 95 86 9
B717‐200 15 13 2
Q200/Q300 21 21
Q400 30 28 2
Total QantasLink 66 62 4
EMB120 5 7 (2)
F100 12 12
Total Network Aviation2 17 19 (2)
B737‐300SF 4 4
B767‐300SF 1 1
Total Freight3 5 5
Total Group 318 312 6
• 5 aircraft deliveries in 2H14
– 2xB787‐8, 3xB717‐200
• 8 aircraft planned for retirement in 2H14
– 1xB747‐400, 3xB737‐400, 2xB767‐300, 2xQ200
• 4xA320‐200 lease returns in 2H14
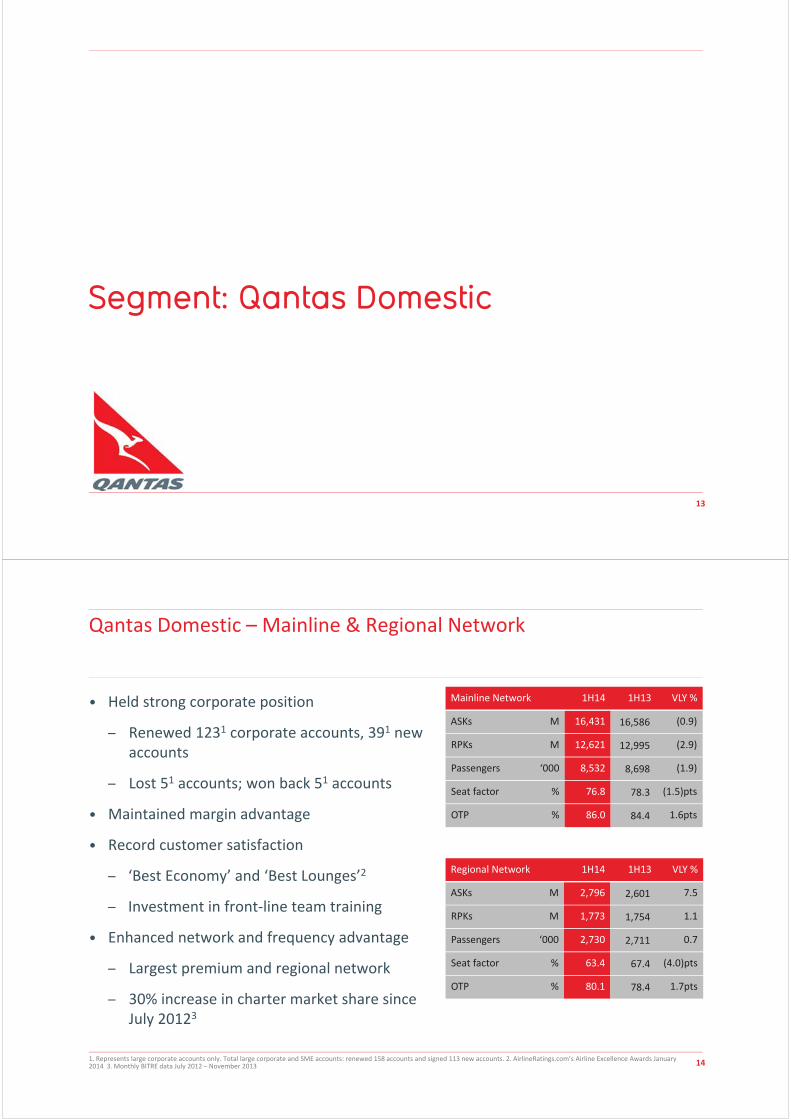
121. Best on time performance compared to main competitor. 2. Source: BITRE 2013. Data is in reference to domestic operations only. 3. Qantas excludes QantasLink operations. Virgin excludes ATRturboprop and F100 jet operations.
On Time Performance (OTP)
• Qantas Domestic on time leader1
– Superior performance with best on time departure 12 out of 12 months in 2013
– Market leading on time arrivals
– Lowest number of cancellations
ON TIME DEPARTURES2 (%) 2013 RANK
Qantas3 85.5 1
Virgin3 79.6 2
Jetstar 75.0 3
ON TIME ARRIVALS2 (%) 2013 RANK
Qantas3 84.3 1
Virgin3 77.3 2
Jetstar 75.7 3
CANCELLATIONS2 (%) 2013 RANK
Qantas3 1.5 1
Virgin3 1.6 2
Jetstar 1.9 3
13
Segment: Qantas Domestic
14
Qantas Domestic – Mainline & Regional Network
• Held strong corporate position
– Renewed 1231 corporate accounts, 391 new accounts
– Lost 51 accounts; won back 51 accounts
• Maintained margin advantage
• Record customer satisfaction
– ‘Best Economy’ and ‘Best Lounges’2
– Investment in front‐line team training
• Enhanced network and frequency advantage
– Largest premium and regional network
– 30% increase in charter market share since July 20123
2
4
Mainline Network
Regional Network 1H14 1H13 VLY %
ASKs M 2,796 2,601 7.5
RPKs M 1,773 1,754 1.1
Passengers ‘000 2,730 2,711 0.7
Seat factor % 63.4 67.4 (4.0)pts
OTP % 80.1 78.4 1.7pts
Mainline Network 1H14 1H13 VLY %
ASKs M 16,431 16,586 (0.9)
RPKs M 12,621 12,995 (2.9)
Passengers ‘000 8,532 8,698 (1.9)
Seat factor % 76.8 78.3 (1.5)pts
OTP % 86.0 84.4 1.6pts
1. Represents large corporate accounts only. Total large corporate and SME accounts: renewed 158 accounts and signed 113 new accounts. 2. AirlineRatings.com’s Airline Excellence Awards January 2014 3. Monthly BITRE data July 2012 – November 2013
15
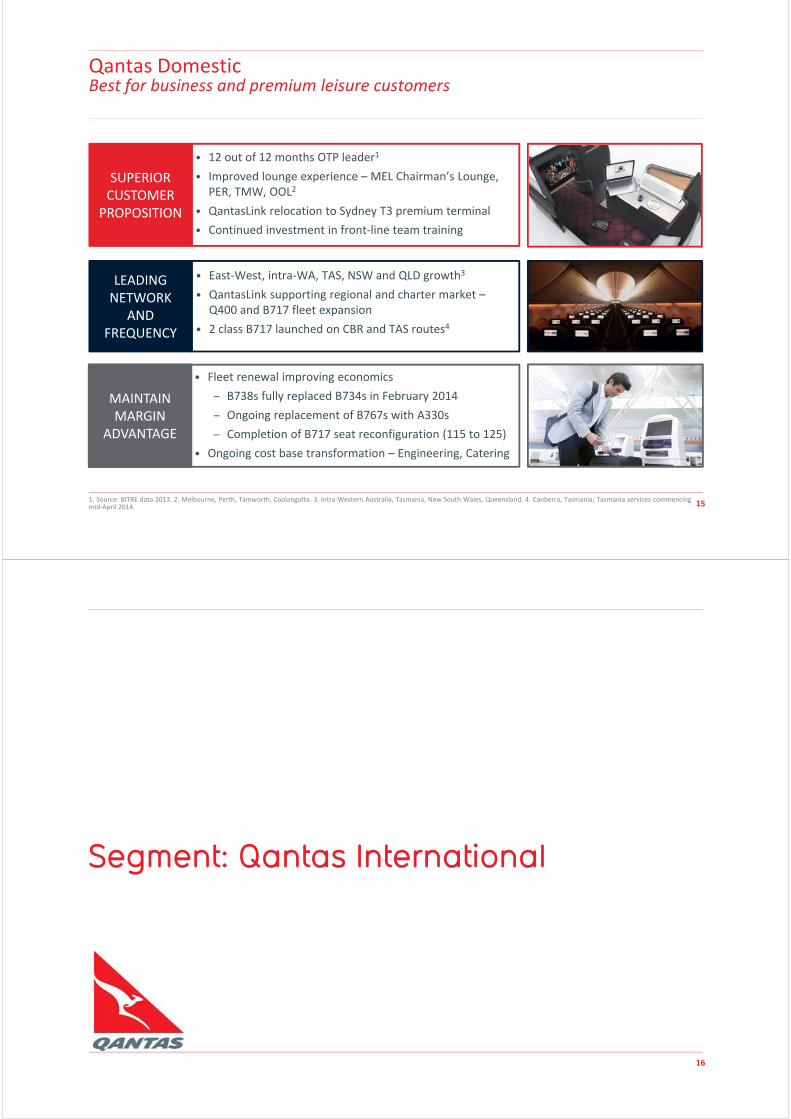
Qantas DomesticBest for business and premium leisure customers
SUPERIOR CUSTOMER
PROPOSITION
MAINTAIN MARGIN
ADVANTAGE
LEADING NETWORK
AND FREQUENCY
• East‐West, intra‐WA, TAS, NSW and QLD growth3
• QantasLink supporting regional and charter market –Q400 and B717 fleet expansion
• 2 class B717 launched on CBR and TAS routes4
• Fleet renewal improving economics
– B738s fully replaced B734s in February 2014
– Ongoing replacement of B767s with A330s
– Completion of B717 seat reconfiguration (115 to 125)
• Ongoing cost base transformation – Engineering, Catering
• 12 out of 12 months OTP leader1
• Improved lounge experience – MEL Chairman’s Lounge, PER, TMW, OOL2
• QantasLink relocation to Sydney T3 premium terminal
• Continued investment in front‐line team training
1. Source: BITRE data 2013. 2. Melbourne, Perth, Tamworth, Coolangatta. 3. Intra‐Western Australia, Tasmania, New South Wales, Queensland. 4. Canberra, Tasmania; Tasmania services commencingmid‐April 2014.
16
Segment: Qantas International
17
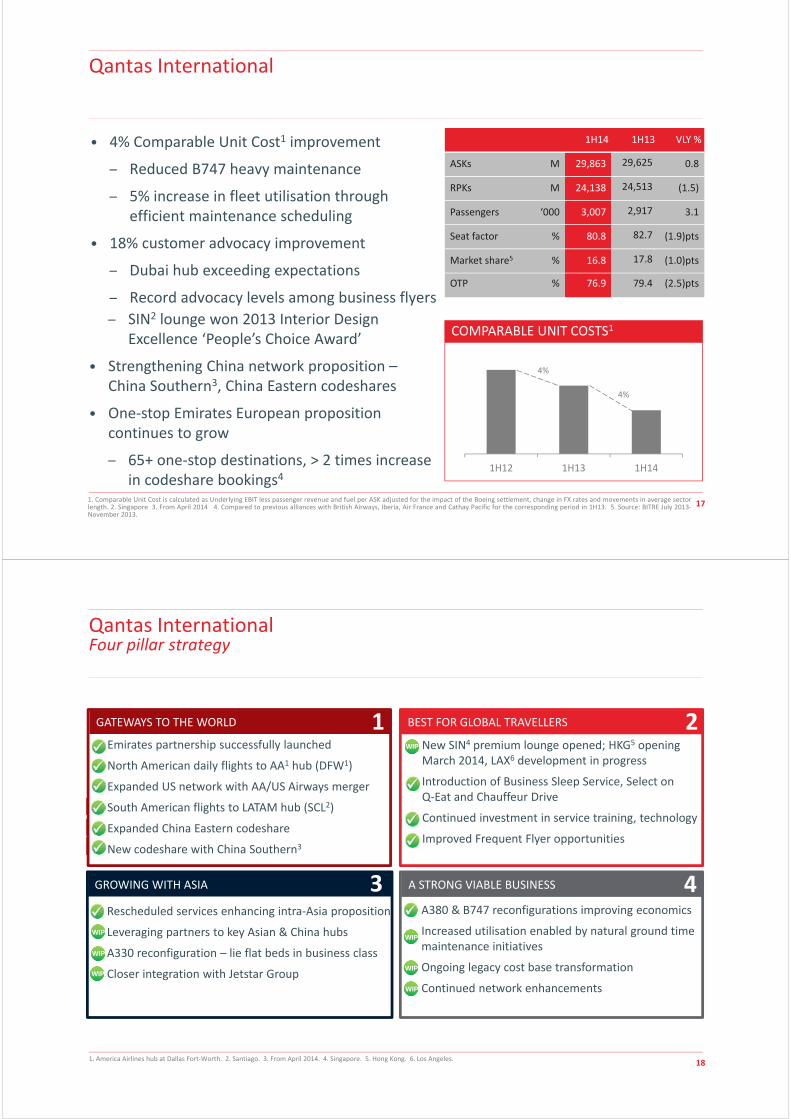
Qantas International
• 4% Comparable Unit Cost1 improvement
– Reduced B747 heavy maintenance
– 5% increase in fleet utilisation through efficient maintenance scheduling
• 18% customer advocacy improvement
– Dubai hub exceeding expectations
– Record advocacy levels among business flyers
1H12 1H13 1H14
COMPARABLE UNIT COSTS1
4%
4%
– SIN2 lounge won 2013 Interior Design Excellence ‘People’s Choice Award’
• Strengthening China network proposition –China Southern3, China Eastern codeshares
• One‐stop Emirates European proposition continues to grow
– 65+ one‐stop destinations, > 2 times increase in codeshare bookings4
1. Comparable Unit Cost is calculated as Underlying EBIT less passenger revenue and fuel per ASK adjusted for the impact of the Boeing settlement, change in FX rates and movements in average sectorlength. 2. Singapore 3. From April 2014 4. Compared to previous alliances with British Airways, Iberia, Air France and Cathay Pacific for the corresponding period in 1H13. 5. Source: BITRE July 2013‐November 2013.
1H14 1H13 VLY %
ASKs M 29,863 29,625 0.8
RPKs M 24,138 24,513 (1.5)
Passengers ‘000 3,007 2,917 3.1
Seat factor % 80.8 82.7 (1.9)pts
Market share5 % 16.8 17.8 (1.0)pts
OTP % 76.9 79.4 (2.5)pts
18
WIP
WIP
WIP
WIP
WIP
WIP
Qantas InternationalFour pillar strategy
Emirates partnership successfully launched
North American daily flights to AA1 hub (DFW1)
Expanded US network with AA/US Airways merger
South American flights to LATAM hub (SCL2)
Expanded China Eastern codeshare
New codeshare with China Southern3
New SIN4 premium lounge opened; HKG5 opening March 2014, LAX6 development in progress
Introduction of Business Sleep Service, Select on Q‐Eat and Chauffeur Drive
Continued investment in service training, technology
Improved Frequent Flyer opportunities
Rescheduled services enhancing intra‐Asia proposition
Leveraging partners to key Asian & China hubs
A330 reconfiguration – lie flat beds in business class
Closer integration with Jetstar Group
A380 & B747 reconfigurations improving economics
Increased utilisation enabled by natural ground time maintenance initiatives
Ongoing legacy cost base transformation
Continued network enhancements
BEST FOR GLOBAL TRAVELLERSGATEWAYS TO THE WORLD
GROWING WITH ASIA A STRONG VIABLE BUSINESS
2
3 4
1
WIP
1. America Airlines hub at Dallas Fort‐Worth. 2. Santiago. 3. From April 2014. 4. Singapore. 5. Hong Kong. 6. Los Angeles.
WIP
19
Segment: Jetstar
20
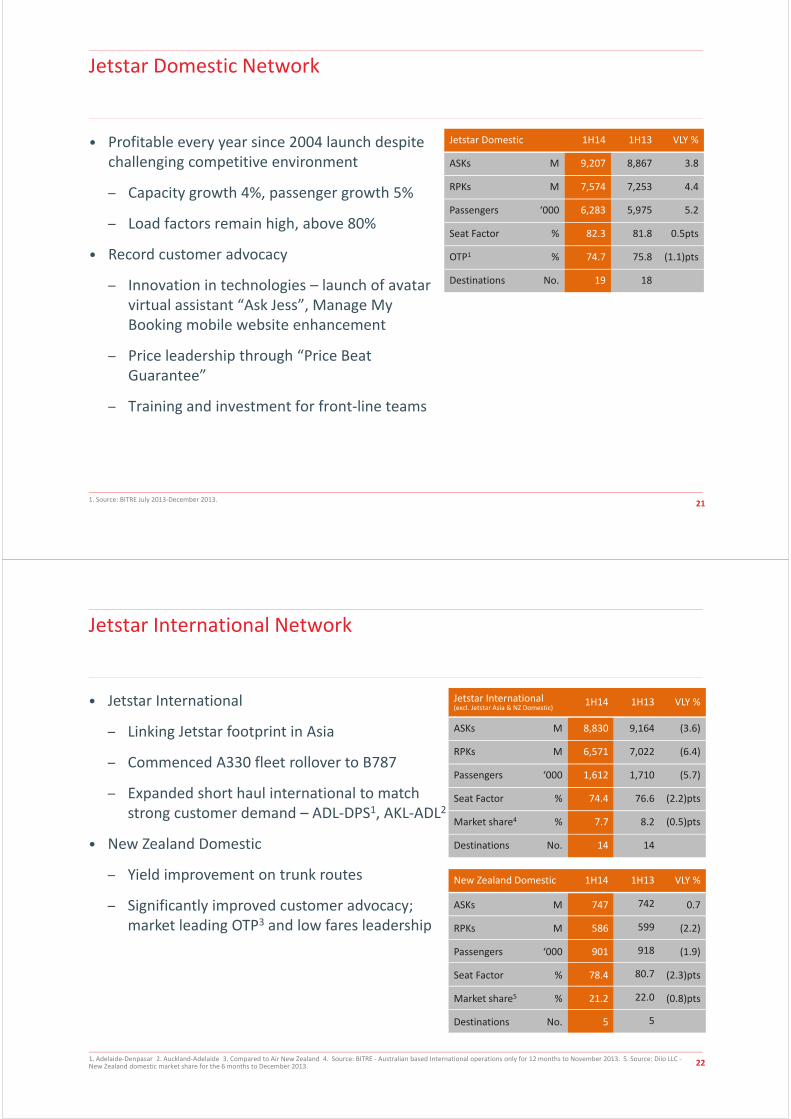
JETSTAR GROUP – GROWING NETWORK OF ROUTES1
Growing Jetstar Footprint
Route Map as at 31 Dec 2013
BUSINESS LAUNCH BASED AIRCRAFT2
Jetstar Australia 100% 2004 55xA320s/A321s
Jetstar International 100% 2006 12xA330s/787s
Jetstar NZ3 100% 2009 9xA320s
Jetstar Asia (Singapore) 49% 2004 19xA320s
Jetstar Japan 33% 2012 18xA320s
Jetstar Hong Kong4 33% – –
Jetstar Pacific (Vietnam)5 30% 2008 5xA320s
1
6
2
3
4
5
7
31 3959 67
8296 98 109 115
129 130
FY04 FY05 FY06 FY07 FY08 FY09 FY10 FY11 FY12 FY13 1H14
1
2
3
4
5
6
7
1. Including Jetstar Asia, Jetstar Pacific and Jetstar Japan. 2. As at 31 December 2013. 3. Jetstar Trans Tasman services commenced in 2005, Jetstar NZ (Domestic) services commenced in 2009.4. Subject to regulatory approval. 5. Jetstar Pacific rebranded in 2008.
OWNERSHIP2
21
Jetstar Domestic Network
• Profitable every year since 2004 launch despite challenging competitive environment
– Capacity growth 4%, passenger growth 5%
– Load factors remain high, above 80%
• Record customer advocacy
– Innovation in technologies – launch of avatar virtual assistant “Ask Jess”, Manage My Booking mobile website enhancement
– Price leadership through “Price Beat Guarantee”
– Training and investment for front‐line teams
Jetstar Domestic 1H14 1H13 VLY %
ASKs M 9,207 8,867 3.8
RPKs M 7,574 7,253 4.4
Passengers ‘000 6,283 5,975 5.2
Seat Factor % 82.3 81.8 0.5pts
OTP1 % 74.7 75.8 (1.1)pts
Destinations No. 19 18
1. Source: BITRE July 2013‐December 2013.
22
Jetstar International Network
• Jetstar International
– Linking Jetstar footprint in Asia
– Commenced A330 fleet rollover to B787
– Expanded short haul international to match strong customer demand – ADL‐DPS1, AKL‐ADL2
• New Zealand Domestic
– Yield improvement on trunk routes
– Significantly improved customer advocacy; market leading OTP3 and low fares leadership
Jetstar International(excl. Jetstar Asia & NZ Domestic)
1H14 1H13 VLY %
ASKs M 8,830 9,164 (3.6)
RPKs M 6,571 7,022 (6.4)
Passengers ‘000 1,612 1,710 (5.7)
Seat Factor % 74.4 76.6 (2.2)pts
Market share4 % 7.7 8.2 (0.5)pts
Destinations No. 14 14
1. Adelaide‐Denpasar 2. Auckland‐Adelaide 3. Compared to Air New Zealand 4. Source: BITRE ‐ Australian based International operations only for 12 months to November 2013. 5. Source: Diio LLC ‐New Zealand domestic market share for the 6 months to December 2013.
New Zealand Domestic 1H14 1H13 VLY %
ASKs M 747 742 0.7
RPKs M 586 599 (2.2)
Passengers ‘000 901 918 (1.9)
Seat Factor % 78.4 80.7 (2.3)pts
Market share5 % 21.2 22.0 (0.8)pts
Destinations No. 5 5
23
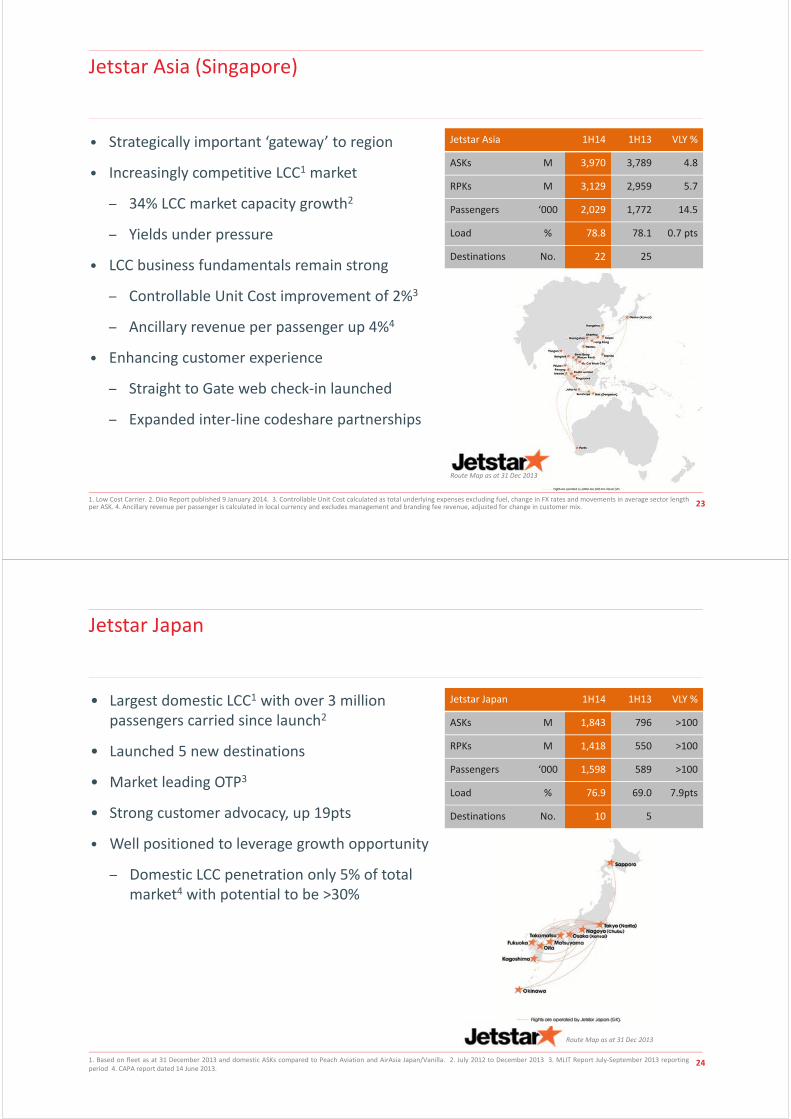
Jetstar Asia (Singapore)
• Strategically important ‘gateway’ to region
• Increasingly competitive LCC1 market
– 34% LCC market capacity growth2
– Yields under pressure
• LCC business fundamentals remain strong
– Controllable Unit Cost improvement of 2%3
– Ancillary revenue per passenger up 4%4
• Enhancing customer experience
– Straight to Gate web check‐in launched
– Expanded inter‐line codeshare partnerships
Jetstar Asia 1H14 1H13 VLY %
ASKs M 3,970 3,789 4.8
RPKs M 3,129 2,959 5.7
Passengers ‘000 2,029 1,772 14.5
Load % 78.8 78.1 0.7 pts
Destinations No. 22 25
Route Map as at 31 Dec 2013
1. Low Cost Carrier. 2. Diio Report published 9 January 2014. 3. Controllable Unit Cost calculated as total underlying expenses excluding fuel, change in FX rates and movements in average sector lengthper ASK. 4. Ancillary revenue per passenger is calculated in local currency and excludes management and branding fee revenue, adjusted for change in customer mix.
24
• Largest domestic LCC1 with over 3 million passengers carried since launch2
• Launched 5 new destinations
• Market leading OTP3
• Strong customer advocacy, up 19pts
• Well positioned to leverage growth opportunity
– Domestic LCC penetration only 5% of total market4 with potential to be >30%
Jetstar Japan
Jetstar Japan 1H14 1H13 VLY %
ASKs M 1,843 796 >100
RPKs M 1,418 550 >100
Passengers ‘000 1,598 589 >100
Load % 76.9 69.0 7.9pts
Destinations No. 10 5
Route Map as at 31 Dec 2013
1. Based on fleet as at 31 December 2013 and domestic ASKs compared to Peach Aviation and AirAsia Japan/Vanilla. 2. July 2012 to December 2013 3. MLIT Report July‐September 2013 reportingperiod 4. CAPA report dated 14 June 2013.
25
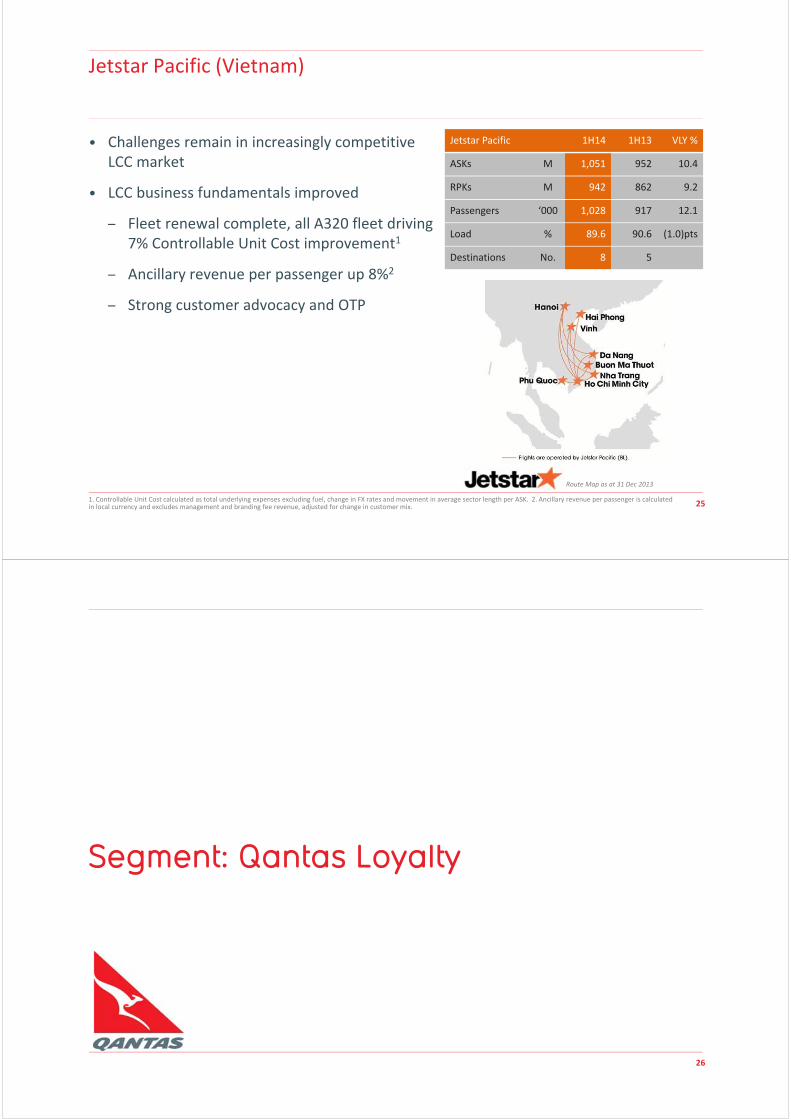
Jetstar Pacific (Vietnam)
• Challenges remain in increasingly competitive LCC market
• LCC business fundamentals improved
– Fleet renewal complete, all A320 fleet driving 7% Controllable Unit Cost improvement1
– Ancillary revenue per passenger up 8%2
– Strong customer advocacy and OTP
Route Map as at 31 Dec 2013
Jetstar Pacific 1H14 1H13 VLY %
ASKs M 1,051 952 10.4
RPKs M 942 862 9.2
Passengers ‘000 1,028 917 12.1
Load % 89.6 90.6 (1.0)pts
Destinations No. 8 5
1. Controllable Unit Cost calculated as total underlying expenses excluding fuel, change in FX rates and movement in average sector length per ASK. 2. Ancillary revenue per passenger is calculated in local currency and excludes management and branding fee revenue, adjusted for change in customer mix.
26
Segment: Qantas Loyalty
27
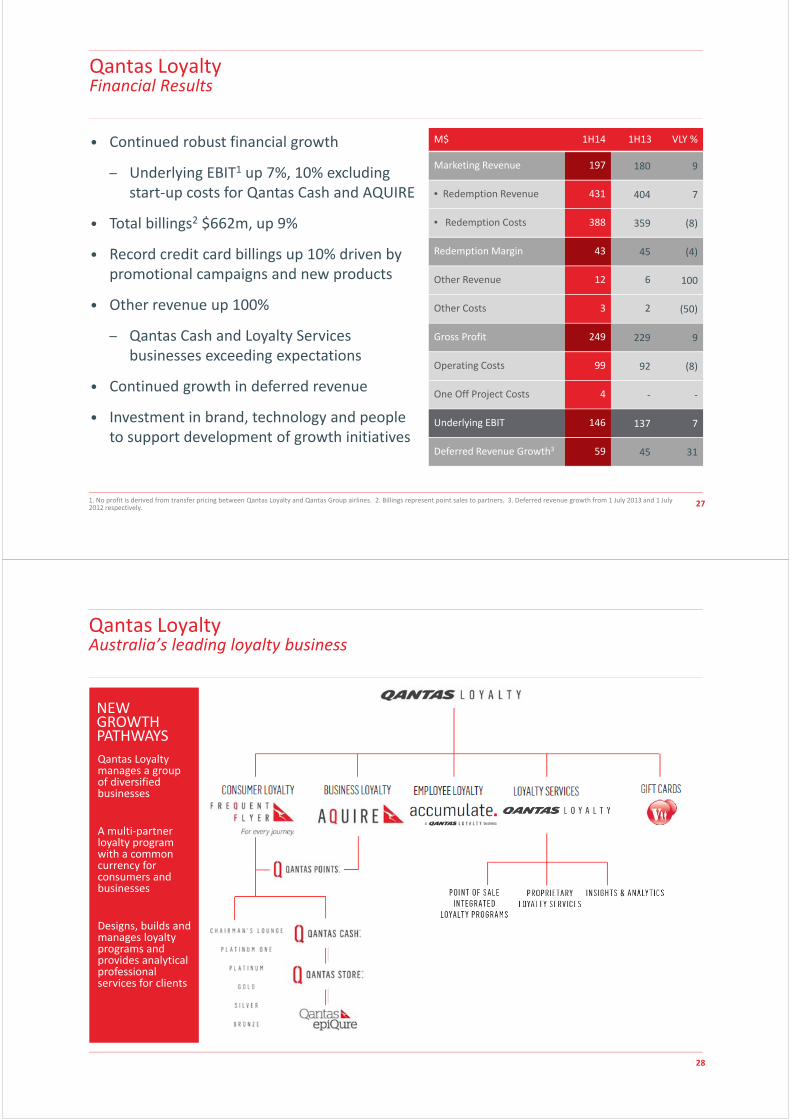
M$ 1H14 1H13 VLY %
Marketing Revenue 197 180 9
• Redemption Revenue 431 404 7
• Redemption Costs 388 359 (8)
Redemption Margin 43 45 (4)
Other Revenue 12 6 100
Other Costs 3 2 (50)
Gross Profit 249 229 9
Operating Costs 99 92 (8)
One Off Project Costs 4 ‐ ‐
Underlying EBIT 146 137 7
Deferred Revenue Growth3 59 45 31
Qantas Loyalty Financial Results
• Continued robust financial growth
– Underlying EBIT1 up 7%, 10% excluding start‐up costs for Qantas Cash and AQUIRE
• Total billings2 $662m, up 9%
• Record credit card billings up 10% driven by promotional campaigns and new products
• Other revenue up 100%
– Qantas Cash and Loyalty Services businesses exceeding expectations
• Continued growth in deferred revenue
• Investment in brand, technology and people to support development of growth initiatives
1. No profit is derived from transfer pricing between Qantas Loyalty and Qantas Group airlines. 2. Billings represent point sales to partners. 3. Deferred revenue growth from 1 July 2013 and 1 July 2012 respectively.
28
Qantas LoyaltyAustralia’s leading loyalty business
NEW GROWTH PATHWAYS
Qantas Loyalty manages a group of diversified businesses
A multi‐partner loyalty program with a common currency for consumers and businesses
Designs, builds and manages loyalty programs and provides analytical professional services for clients
29
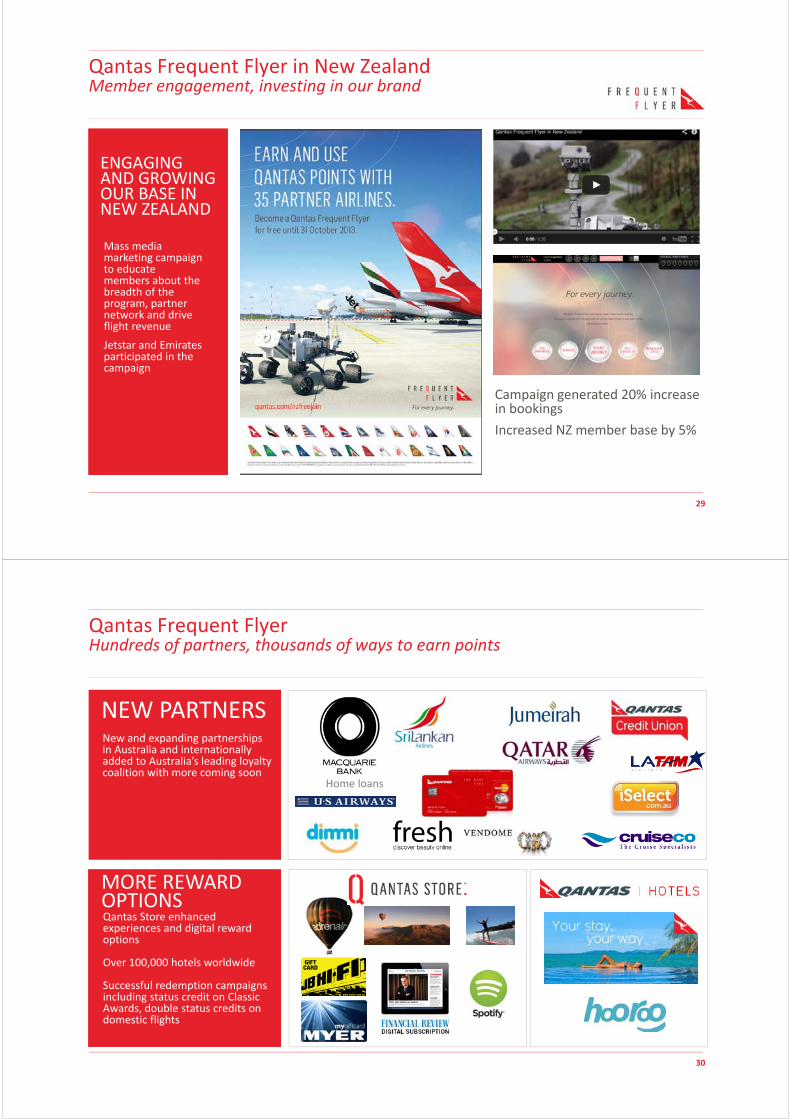
Qantas Frequent Flyer in New ZealandMember engagement, investing in our brand
ENGAGING AND GROWING OUR BASE IN NEW ZEALAND
Campaign generated 20% increase in bookings
Increased NZ member base by 5%
Mass media marketing campaign to educate members about the breadth of the program, partner network and drive flight revenue
Jetstar and Emirates participated in the campaign
30
Qantas Frequent Flyer Hundreds of partners, thousands of ways to earn points
NEW PARTNERSNew and expanding partnerships in Australia and internationally added to Australia’s leading loyalty coalition with more coming soon
With more coming soon
Home loans
MORE REWARD OPTIONSQantas Store enhanced experiences and digital reward options
Over 100,000 hotels worldwide
Successful redemption campaigns including status credit on Classic Awards, double status credits on domestic flights
31
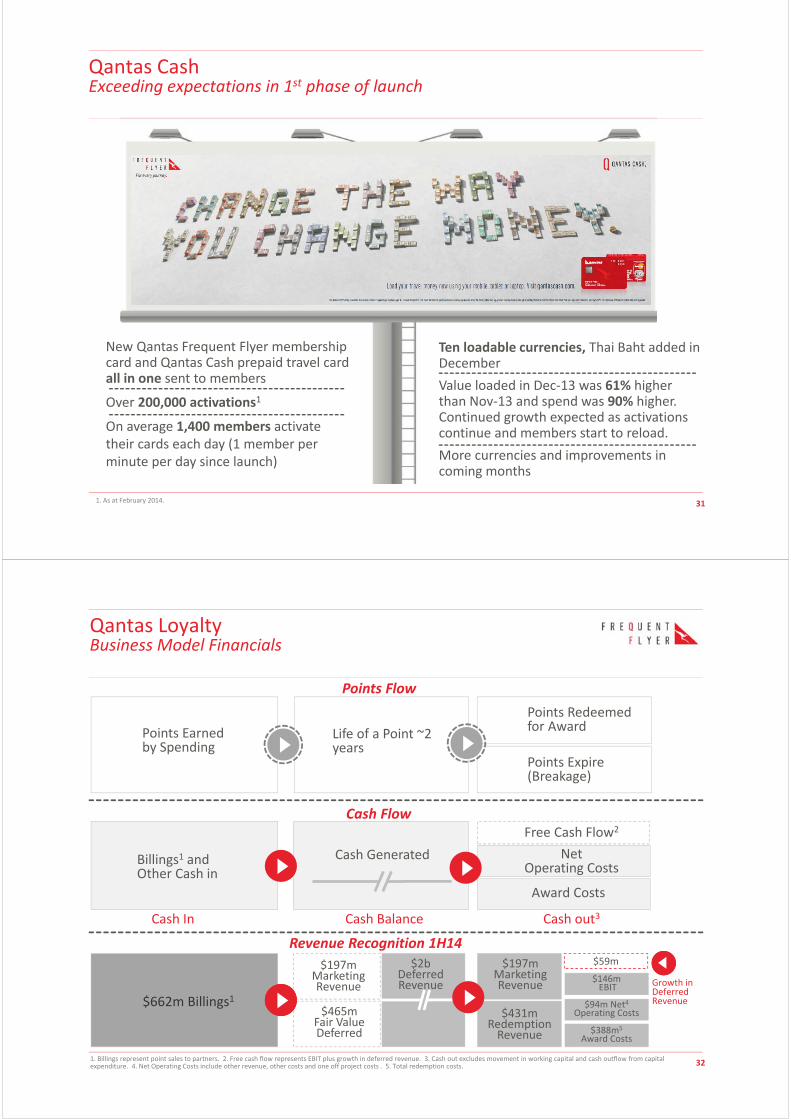
Qantas CashExceeding expectations in 1st phase of launch
New Qantas Frequent Flyer membership card and Qantas Cash prepaid travel card all in one sent to members
Over 200,000 activations1
On average 1,400 members activate their cards each day (1 member per minute per day since launch)
Ten loadable currencies, Thai Baht added in December
Value loaded in Dec‐13 was 61% higher than Nov‐13 and spend was 90% higher. Continued growth expected as activations continue and members start to reload.
More currencies and improvements in coming months
1. As at February 2014.
32
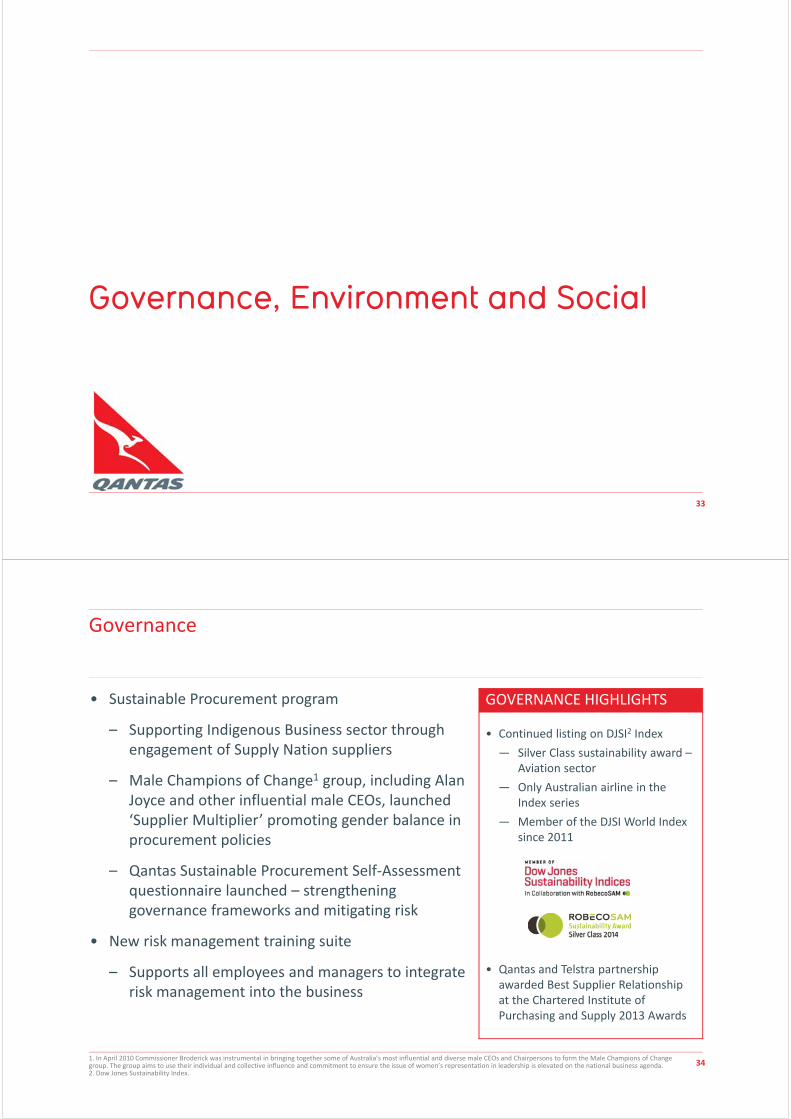
Qantas LoyaltyBusiness Model Financials
Points FlowPoints Earned by Spending
Life of a Point ~2 years
Points Redeemed for Award
Points Expire (Breakage)
Cash GeneratedBillings1 and Other Cash in
Cash In Cash out3Cash Balance
Free Cash Flow2
NetOperating Costs
Award Costs
$197mMarketing Revenue
$465mFair Value Deferred
$662m Billings1
$2b Deferred Revenue
$197mMarketing Revenue
$431mRedemption Revenue
$146m EBIT
$94m Net4Operating Costs
$388m5
Award Costs
$59m
Growth in Deferred Revenue
1. Billings represent point sales to partners. 2. Free cash flow represents EBIT plus growth in deferred revenue. 3. Cash out excludes movement in working capital and cash outflow from capital expenditure. 4. Net Operating Costs include other revenue, other costs and one off project costs . 5. Total redemption costs.
Points Flow
Cash Flow
Revenue Recognition 1H14
33
Governance, Environment and Social
34
GOVERNANCE HIGHLIGHTS
• Continued listing on DJSI2 Index
— Silver Class sustainability award –Aviation sector
— Only Australian airline in the Index series
— Member of the DJSI World Index since 2011
• Qantas and Telstra partnership awarded Best Supplier Relationship at the Chartered Institute of Purchasing and Supply 2013 Awards
Governance
1. In April 2010 Commissioner Broderick was instrumental in bringing together some of Australia’s most influential and diverse male CEOs and Chairpersons to form the Male Champions of Change group. The group aims to use their individual and collective influence and commitment to ensure the issue of women’s representation in leadership is elevated on the national business agenda. 2. Dow Jones Sustainability Index.
• Sustainable Procurement program
– Supporting Indigenous Business sector through engagement of Supply Nation suppliers
– Male Champions of Change1 group, including Alan Joyce and other influential male CEOs, launched ‘Supplier Multiplier’ promoting gender balance in procurement policies
– Qantas Sustainable Procurement Self‐Assessment questionnaire launched – strengthening governance frameworks and mitigating risk
• New risk management training suite
– Supports all employees and managers to integrate risk management into the business
35
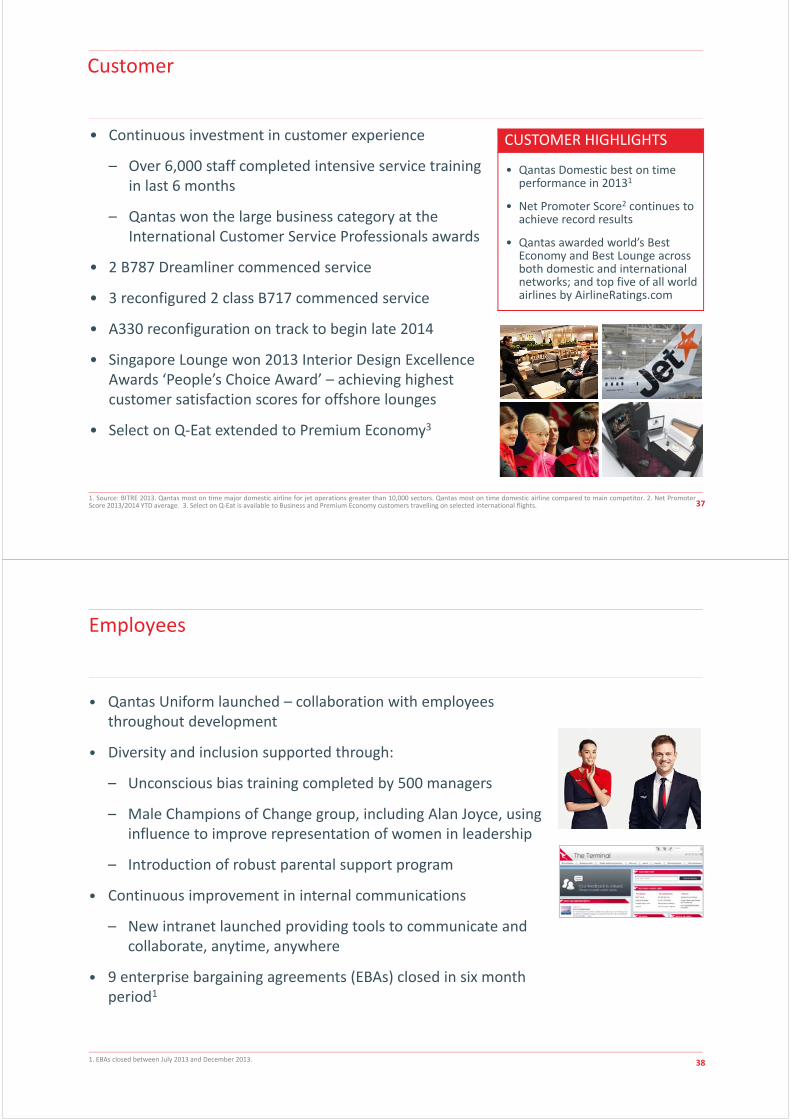
Environment
1. B787 fuel efficiency compared to B763 on a per seat basis. Source: B787 (manufacturer guidance). 2. 2013 Energy Efficiency Council of Australia awards . 3. International Civil Aviation Organisation. 4. Previous targets were electricity 10%, water 10% and waste‐to‐landfill 20% set against FY10 baseline.
• B787 Dreamliner aircraft entered service
– 20 per cent more fuel efficient than comparable aircraft1
• Group Fuel Optimisation Program targeting 1% fuel saving
• Qantas’ Mascot tri‐generation project won ‘Best Cogeneration or District Energy Project’2
• Aviation biofuel feasibility study with Shell and Australian Government completed and public report released
• ICAO3 Assembly agreed to global market‐based carbon measure for development by 2016 and implementation by 2020
• Group targets for reduction of electricity, water and direct waste‐to‐landfill refreshed to 20%, 20% and 30% respectively4
36
• Unwavering commitment to world’s best safety practices and reporting
• Successful introduction of B787 into Jetstar fleet
• Reducing workplace injuries – ongoing focus on manual handling training, introduction of mechanical working aids and early intervention programs
• Group Safety Conference held with ~500 safety professionals, managers, frontline staff and industry partners
• Qantas Group Safety Climate Survey results indicate continued improvement and maturity of the organisation’s safety culture
SAFETY HIGHLIGHTS
• Positive indicators of operational safety performance
− 1H14 YTD TRIFR1 improved 14%
− 1H14 LWCFR2 improved 20%
− 1H14 DR3 improved by 25%
1. Total Recordable Injury Frequency Rate 1H14 25.5 (FY13: 29.5). 2. Lost Work Case Frequency Rate 1H14 7.7 (FY13: 9.6). 3. Duration Rate (DR) measures the average number of days per injury wherean employee is away from work or on restricted duties 1H14 39.2 (FY13: 52.1).
Safety
37
• Continuous investment in customer experience
– Over 6,000 staff completed intensive service training in last 6 months
– Qantas won the large business category at the International Customer Service Professionals awards
• 2 B787 Dreamliner commenced service
• 3 reconfigured 2 class B717 commenced service
• A330 reconfiguration on track to begin late 2014
• Singapore Lounge won 2013 Interior Design Excellence Awards ‘People’s Choice Award’ – achieving highest customer satisfaction scores for offshore lounges
• Select on Q‐Eat extended to Premium Economy3
CUSTOMER HIGHLIGHTS
• Qantas Domestic best on time performance in 20131
• Net Promoter Score2 continues to achieve record results
• Qantas awarded world’s Best Economy and Best Lounge across both domestic and international networks; and top five of all world airlines by AirlineRatings.com
Customer
1. Source: BITRE 2013. Qantas most on time major domestic airline for jet operations greater than 10,000 sectors. Qantas most on time domestic airline compared to main competitor. 2. Net PromoterScore 2013/2014 YTD average. 3. Select on Q‐Eat is available to Business and Premium Economy customers travelling on selected international flights.
38
Employees
• Qantas Uniform launched – collaboration with employees throughout development
• Diversity and inclusion supported through:
– Unconscious bias training completed by 500 managers
– Male Champions of Change group, including Alan Joyce, using influence to improve representation of women in leadership
– Introduction of robust parental support program
• Continuous improvement in internal communications
– New intranet launched providing tools to communicate and collaborate, anytime, anywhere
• 9 enterprise bargaining agreements (EBAs) closed in six month period1
1. EBAs closed between July 2013 and December 2013.
39
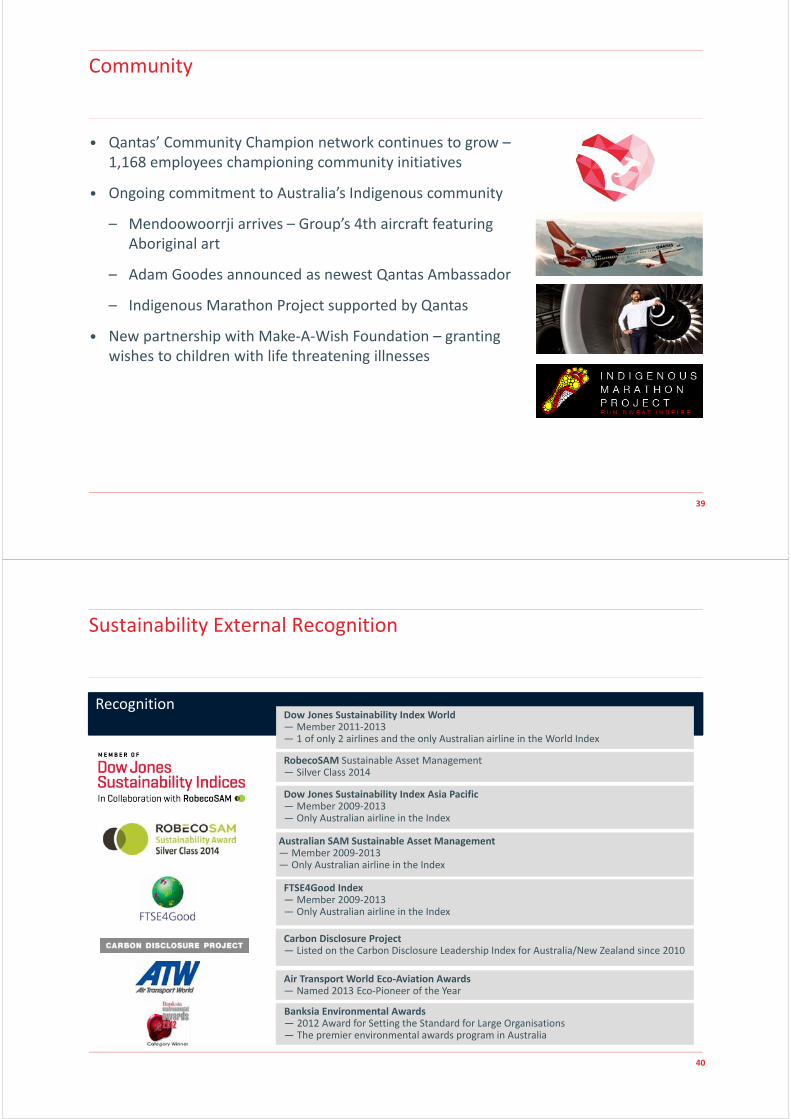
Community
• Qantas’ Community Champion network continues to grow –1,168 employees championing community initiatives
• Ongoing commitment to Australia’s Indigenous community
– Mendoowoorrji arrives – Group’s 4th aircraft featuring Aboriginal art
– Adam Goodes announced as newest Qantas Ambassador
– Indigenous Marathon Project supported by Qantas
• New partnership with Make‐A‐Wish Foundation – granting wishes to children with life threatening illnesses
40
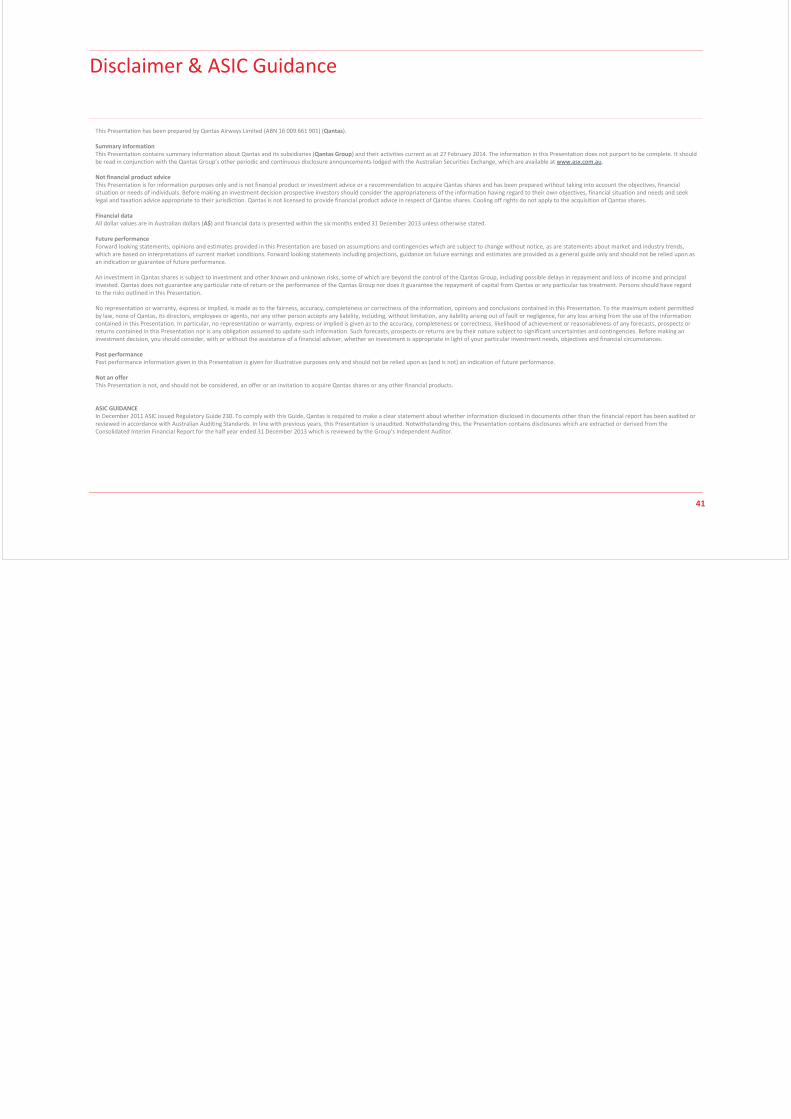
Sustainability External Recognition
RecognitionDow Jones Sustainability Index World— Member 2011‐2013— 1 of only 2 airlines and the only Australian airline in the World Index
Australian SAM Sustainable Asset Management— Member 2009‐2013— Only Australian airline in the Index
FTSE4Good Index — Member 2009‐2013— Only Australian airline in the Index
Carbon Disclosure Project — Listed on the Carbon Disclosure Leadership Index for Australia/New Zealand since 2010
Dow Jones Sustainability Index Asia Pacific— Member 2009‐2013— Only Australian airline in the Index
Air Transport World Eco‐Aviation Awards— Named 2013 Eco‐Pioneer of the Year
Banksia Environmental Awards— 2012 Award for Setting the Standard for Large Organisations— The premier environmental awards program in Australia
RobecoSAM Sustainable Asset Management — Silver Class 2014
41
Disclaimer & ASIC Guidance
This Presentation has been prepared by Qantas Airways Limited (ABN 16 009 661 901) (Qantas).
Summary information This Presentation contains summary information about Qantas and its subsidiaries (Qantas Group) and their activities current as at 27 February 2014. The information in this Presentation does not purport to be complete. It should be read in conjunction with the Qantas Group’s other periodic and continuous disclosure announcements lodged with the Australian Securities Exchange, which are available at www.asx.com.au.
Not financial product advice This Presentation is for information purposes only and is not financial product or investment advice or a recommendation to acquire Qantas shares and has been prepared without taking into account the objectives, financial situation or needs of individuals. Before making an investment decision prospective investors should consider the appropriateness of the information having regard to their own objectives, financial situation and needs and seek legal and taxation advice appropriate to their jurisdiction. Qantas is not licensed to provide financial product advice in respect of Qantas shares. Cooling off rights do not apply to the acquisition of Qantas shares.
Financial data All dollar values are in Australian dollars (A$) and financial data is presented within the six months ended 31 December 2013 unless otherwise stated.
Future performanceForward looking statements, opinions and estimates provided in this Presentation are based on assumptions and contingencies which are subject to change without notice, as are statements about market and industry trends, which are based on interpretations of current market conditions. Forward looking statements including projections, guidance on future earnings and estimates are provided as a general guide only and should not be relied upon as an indication or guarantee of future performance.
An investment in Qantas shares is subject to investment and other known and unknown risks, some of which are beyond the control of the Qantas Group, including possible delays in repayment and loss of income and principal invested. Qantas does not guarantee any particular rate of return or the performance of the Qantas Group nor does it guarantee the repayment of capital from Qantas or any particular tax treatment. Persons should have regard to the risks outlined in this Presentation.
No representation or warranty, express or implied, is made as to the fairness, accuracy, completeness or correctness of the information, opinions and conclusions contained in this Presentation. To the maximum extent permitted by law, none of Qantas, its directors, employees or agents, nor any other person accepts any liability, including, without limitation, any liability arising out of fault or negligence, for any loss arising from the use of the information contained in this Presentation. In particular, no representation or warranty, express or implied is given as to the accuracy, completeness or correctness, likelihood of achievement or reasonableness of any forecasts, prospects or returns contained in this Presentation nor is any obligation assumed to update such information. Such forecasts, prospects or returns are by their nature subject to significant uncertainties and contingencies. Before making an investment decision, you should consider, with or without the assistance of a financial adviser, whether an investment is appropriate in light of your particular investment needs, objectives and financial circumstances.
Past performance Past performance information given in this Presentation is given for illustrative purposes only and should not be relied upon as (and is not) an indication of future performance.
Not an offer This Presentation is not, and should not be considered, an offer or an invitation to acquire Qantas shares or any other financial products.
ASIC GUIDANCEIn December 2011 ASIC issued Regulatory Guide 230. To comply with this Guide, Qantas is required to make a clear statement about whether information disclosed in documents other than the financial report has been audited or reviewed in accordance with Australian Auditing Standards. In line with previous years, this Presentation is unaudited. Notwithstanding this, the Presentation contains disclosures which are extracted or derived from the Consolidated Interim Financial Report for the half year ended 31 December 2013 which is reviewed by the Group’s Independent Auditor.
Related Documents