HY 2021 results: Strong margin delivery and growth momentum Robin Watson – Chief Executive David Kemp – Chief Financial Officer August 24 th , 2021

Welcome message from author
This document is posted to help you gain knowledge. Please leave a comment to let me know what you think about it! Share it to your friends and learn new things together.
Transcript

HY 2021 results:Strong margin delivery and growth momentum
Robin Watson – Chief Executive
David Kemp – Chief Financial Officer
August 24th, 2021

2
Margin improvement, growth momentum
Strong order book growth:
• $7.7bn order book - up 18% vs.
Dec ’20
• Growth in Consulting &
Operations, improving
momentum in Projects
• $3bn revenue already secured for
H2 2021
Significant margin improvement:
• EBITDA margin of 8.3%
• Up 80 bps vs. H1 20
• Margin growth in all three
business units
Accelerating strategy at pace:
• Optimised organisational design
unlocking growth
• Future Fit delivered $20m
EBITDA benefit in H1 21
• Investing in digital & leading on
net-zero solutions
Margin improvement across all business units & order book up 18%
Results Market environment Strategic process

2016-2020:
Strategic repositioning
• Strategy to position across mega-trends
• Leading positions across energy & the
built environment
• Established a high-value, global
Consulting business
• Clear purpose underpinning strategic
direction
• Well-positioned to support IOC to IEC
• Business transformation (Future Fit) – a
simpler, more efficient, agile organisation
• Market leading position in attractive
growth markets: Hydrogen & CCUS
• Leading ESG / Sustainability platform
• Strong EBITDA margins and primed for
growth
Driving returns from a more sustainable, net-zero future
Today:
Accelerating strategy delivery
• Growth across energy transition and in
sustainable infrastructure revenue
• Continuous focus on improved, high
margin delivery
• Competitive advantage through
digitalised solutions, products & delivery
• Growing order book with more from
sustainability themes, future skills and
aligned commercial models
Future:
Unlocking sustainable growth
3
Financial performance – H1 2021
David Kemp, Chief Financial Officer
4
22.9% 14.1% 14.9%0.8% 14.4%
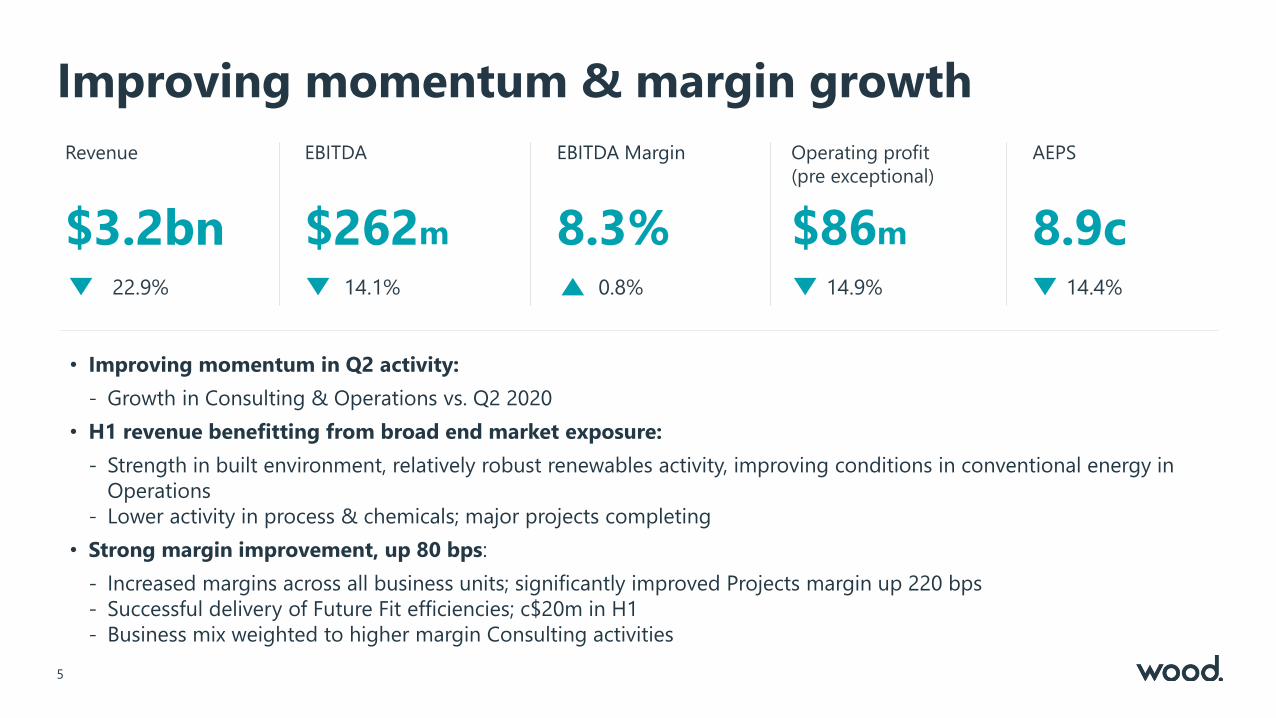
Improving momentum & margin growth
5
Revenue EBITDA
$3.2bn $262m
EBITDA Margin AEPS
8.3% 8.9c
Operating profit
(pre exceptional)
$86m
• Improving momentum in Q2 activity:
- Growth in Consulting & Operations vs. Q2 2020
• H1 revenue benefitting from broad end market exposure:
- Strength in built environment, relatively robust renewables activity, improving conditions in conventional energy in
Operations
- Lower activity in process & chemicals; major projects completing
• Strong margin improvement, up 80 bps:
- Increased margins across all business units; significantly improved Projects margin up 220 bps
- Successful delivery of Future Fit efficiencies; c$20m in H1
- Business mix weighted to higher margin Consulting activities

6
Robust activity in Consulting & Operations offset by lower Projects revenue
6
• Robust activity in Consulting: Strength in built environment, robust renewables & other energy activity.
Increased Q2 activity
• Relative resilience in Operations: Improving conditions in conventional energy & returning to growth in Q2
• Lower activity in Projects: Reduced process & chemicals activity; major projects completed

77
7.5%
EBITDA
margin
8.3%
EBITDA
margin
H1 2020
EBITDA
Disposals Volume
(gross margin)Consulting Projects IVS/Centre H1 2021
EBITDA
Operations
Margin impact
Progressing towards medium-term EBITDA margin target of 9.6%

8
• Projects leading margin improvement
across all three business units
• 220bps Projects margin improvement
driven by:
- Efficiencies
- Improved execution
- Lower risk portfolio
• Increased proportion of revenue from
high margin Consulting activities
80 bps margin improvement
8
28%
37%
32%
3%
H1 2021 Margin:
H1 2021 Revenue:
Consulting
Projects
Operations
Investment Services
24%
48%
27%
1%
H1 2020 Revenue:
Consulting
Projects
Operations
Investment Services
Consulting 12.1%
Projects 7.5%
Operations 10.7%
Group 8.3%
Consulting 11.0%
Projects 5.3%
Operations 10.2%
Group 7.5%
H1 2020 Margin:

Leveraging our flexible, asset light model
9
$230m $230m
$270m
$70m
$20m
$20m
$(70)m
0
100
200
300
FY 2020 cost savings in-year
Reversal of short-term2020 savings
FY 21 impact of 2020actions
FY 2020 run rate H1 2021 Future Fitefficiencies
H2 2021 Future Fitefficiencies
2021 exit run-rate
$m

Net debt: increase driven by working capital outflow
10
H1 2021 $m H1 2020 $m 2021 Commentary
Adjusted EBITDA (Ex IFRS 16) 194 230 Excludes IFRS 16 impact
JV EBITDA net of divs & F/x (5) (20)
Provisions (59) (75) Reduction as legacy issues resolved
Cash generated pre working capital 130 135
Working capital movements (237) (67) Timing of receipts, expected unwind of advance payments of $61m, increased payables
outflow
Cash generated from operations (pre exceptionals) (107) 68
Exceptional items (46) (62)Includes investigation settlements ($9m), costs to deliver Future Fit ($17m), onerous
leases ($16m)
Cash generated from operations (153) 6
Divestments/ (acquisitions) 19 372 Consideration for JV interest in Sulzer Wood
Capex & intangible assets (41) (57) Investment in digital & technology, ERP resumed, continued discipline in discretionary
capex
Free cash flow (175) 321
Tax, interest and other (86) (113) Reduced interest expense and FX
Net (increase)/decrease in net debt (261) 208
Net debt excluding leases (1,275) (1,216) Net debt : EBITDA 2.9x (pre IFRS 16)

Cashflow: improving performance in H2
11
H1 2021
$m Commentary
Receivables (67) Timing of receipts driving net outflow in H1 and net debt c$100m higher than anticipated
Payables (108) Activity related
Advanced payments (61) Expected unwind of advance payments
Inventory (1)
Working capital movement (237) Includes typical H1 outflow
• H1 net debt c$100m higher than guidance
- Principally driven by receipts due in June, received in July
• Cashflow & leverage in H2 benefitting from:
- Improved working capital performance; typical H2 inflow, advances build and receipt timing
- Improving activity levels & increased profitability
• More than offsetting impact of H2 exceptional items:
- Investigation settlements $60m
- Costs of Future Fit delivery c$15m
• Improving activity & order book laying foundations for cash generation & improving leverage into 2022

Momentum in awards. Order book up 18%
12
Dec 20Order book
$6.5bn
Consulting
new awards
$1.2bn
Projects
new awards
$1.2bn
Operations
new awards
$2.0bn
Order bookdelivered
$3.2bn
Jun 21
order book
$7.7bn
$3.0bn
$4.0bn
$5.0bn
$6.0bn
$7.0bn
$8.0bn
Dec-20 order book Order book delivered New awards - Consulting New awards - Projects New awards - Operations Jun-21 order book
Consulting
$1.0bn
Projects
$1.2bn
Operations
$1.0bn

Order book: improving quality and enduring nature
13
Fixed price <$100m
ReimbursableReimbursable
H1 2021 H1 2020
2021 2020
$3.0bn
$4.7bn
$3.1bn
$3.9bn2022+ 2021+
78% 74%
19% 22%
3% 4%Fixed price >$100m
Fixed Price <$100m Fixed Price <$100m
ReimbursableReimbursable
H1 2021 H1 2020
Order book: $7.7bn, up 18% year-to-date at 30 June 2021. $3.0bn to be delivered in H2
Fixed price >$100m

14
• Completion of large EPC contracts during H1
• Improving momentum in awards throughout
H1 across all energy markets
• H1 awards include:
- Early-stage concept & feasibility scopes
- EPC scopes <$100m in line with risk
appetite
- Reflecting growing investment in hydrogen
and decarbonisation & improving
conventional energy activity
• Encouraging trends in Q3 estimated awards
14
Projects: improving order book with lower risk profile
$2,786m
$1,769m$1,528m
$1,712m
Jun-20 Dec-20 May-21 Jun-21
(14.5)%12.0%(36.5)%
Projects order book
200
300
400
500
600
Q1 2021 Q2 2021 Q3 2021
Estimated awards Actual awards
Improving awards momentum ($m)

2021 Full year outlook: returning to growth in H2
15
Wood
Revenue:
$6.6bn - $6.8bn1 • Growth vs. H1 2021 and H2 20
EBITDA margin:
8.7% - 8.9%
• Progressing towards medium term target of 9.6%
• Margin improvement includes:
• Improved project execution
• Delivery of efficiencies, including $40m from Future Fit
• Business mix weighted to higher margin Consulting
Consulting Projects Operations
Revenue: $1.85bn - $1.95bn
EBITDA margin: 12.8% - 13.0%
Revenue: $2.4bn - $2.5bn
EBITDA margin: 7.4% - 7.6%
Revenue: $2.05bn - $2.15bn
EBITDA margin: 10.8% - 11.0%
1 Includes Investment Services revenue anticipated to be c$0.15bn - $0.2bn
2 Compared to 2020 which included $63m of revenue and $6m of EBITDA the nuclear business disposed in Q1 2020
3 Compared to 2020 EBITDA margin which included $13m of revenue and $10m of EBITDA from businesses disposed in 2020 and 2021, including the industrial services business in Q1 2020, our JV interest in TCT in
Q4 2020 and our JV interest in Sulzer Wood in Q1 2021
c11%
c50 bps
c4%2
c60 bps2
c30%
c180 bps
c3%3
c170 bps3

Financial summary
16
• Revenue of $3.2bn:
• Down c23%, primarily reflecting the impact of Covid-19
• Improving momentum in Q2
• Strong EBITDA margin improvement, up 80 bps to 8.3%
• Order book growth, up 18% underpinning H2 and 2022
• Net debt of $1.28bn reflecting working capital outflows
• FY 2021:
• Returning to growth with a stronger H2
• Further progress towards medium-term margin target
• Confident of delivering net debt reduction in H2
Strong margin improvement & improving momentum

Highly-skilled, differentiated, agile & primed for growth
Robin Watson, Chief Executive
17

Simplifying our
market position.
• Three global business
units:
- Consulting
- Projects
- Operations
• Green-to-green
lifecycle of solutions
across Energy & the
Built Environment
Transforming our
operating model.
• First-class operational
discipline, predictable
execution outcomes
• Superior financial
performance
• Leaner, faster, lower
carbon enterprise
Digitalising the
way we work.
• Digital solutions that
transform delivery
• Technology to deliver
efficiencies
• Commercialising
innovation for
competitive edge
• Amplified organic
growth
• Precision focus on
solutions &
capabilities to win
• Sustainable value in
non-oil and gas
markets
Unlocking
growth.
Accelerating
future skills
development.
• Talent planning &
development
• High performance
culture
• Reimagining work
and workplaces
• Inclusive & diverse
workforce
Strong progress on strategy acceleration: Future Fit
Unlocking growth, creating value, delivering efficiencies
18

Unlocking growth in priority markets
Renewables
Hydrogen
H1 highlights
• 30+ distinct hydrogen awards, 110+ opportunities in pipeline (c$600m unfactored)
• Hydrogen Council steering member, Wood shaping the debate
• Strategic partnership with Honeywell UOP to produce green aviation fuel
• 60+ years’ experience, 120+ hydrogen units licensed and designed
CCUS
• 25+ distinct CCUS awards, 80+ opportunities in pipeline (c$500m unfactored)
• Appointed on world’s largest CCS project in the US
• Defining the industry guidelines to set CO2 specifications for CCUS projects
• 145+ CCS studies, 30+ years’ experience
• Integration of renewable energy to decarbonise industrial activity (Shell Oman)
• Deployment of new standard block design and lean execution proposition
helping to secure new wins (Nevada Gold)
• Supported over 120GW of wind projects and almost 1,000 solar projects

Differentiating through digital solutions
H1 highlights
Connected Build solution delivers efficiencies and sustainability outcomes
on new-build design work
• Solutions accelerate digital transformation of industrial sectors
• Helps deliver the build accurately; first time, every time
• Sharing connected-data on project status
• Dynamic decision-making environment to improve material availability, labour
productivity, waste and cost reduction and shortening project cycles
Suite of ‘Connected Worker’ apps empowering field technicians and delivering
efficiency savings:
• Multi-year collaboration
• Fast-track deployment to 7000 field workers
• Enables technicians to access industry expertise & innovative, AI solutions in field
• Reduces the need for site mobilisations, improves collaboration and reduces
administrative support

Delivering a more sustainable future
• Spirit Energy – late-life solutions including
reducing carbon emissions across
Morecambe Bay gas fields
• LGE & KU Energy – modernising power grids
to support a low-carbon future
• ADNOC– pre-FEED work on blue ammonia
facility to build hydrogen supply across the
Middle East
• Equinor – optimising energy consumption
and reducing CO2 emissions on multiple
assets in the Norwegian North Sea
• Woodside– two offshore decommissioning
studies in a fast-developing market
• Shell Oman – solar PV to power industrial
activity, saving 25,000 tonnes of CO2 p.a.
• Luxcara – owner’s engineer on Europe’s
largest single-site onshore wind farm
• NEL Hydrogen – framework to deliver large-
scale green hydrogen plants
• Simply Blue Energy – pre-FEED work on
floating offshore wind farm in Ireland
• Summit Carbon Solutions – pre-FEED
analysis on world’s largest carbon capture and
storage projects
• Anglo-American – use of hydrogen to power
ultra-class mining trucks on site
• States of Missouri & West Virginia –
carrying out flood hazard identification
studies for large states across the US
• North London Waste Authority – the UK’s
largest energy waste recovery facility,
reducing waste sent to landfill
• US EPA – support on disaster resilience
planning for sites all across the US
• South Florida Water Management District
– construction management for new
stormwater treatment area
• York city council – developing a zero-
emissions transit strategy, including
inspections and simulation studies
Decarbonisation Energy transition Sustainable infrastructure
Contract wins in H1 highlight the growing proportion of our work linked to sustainability.
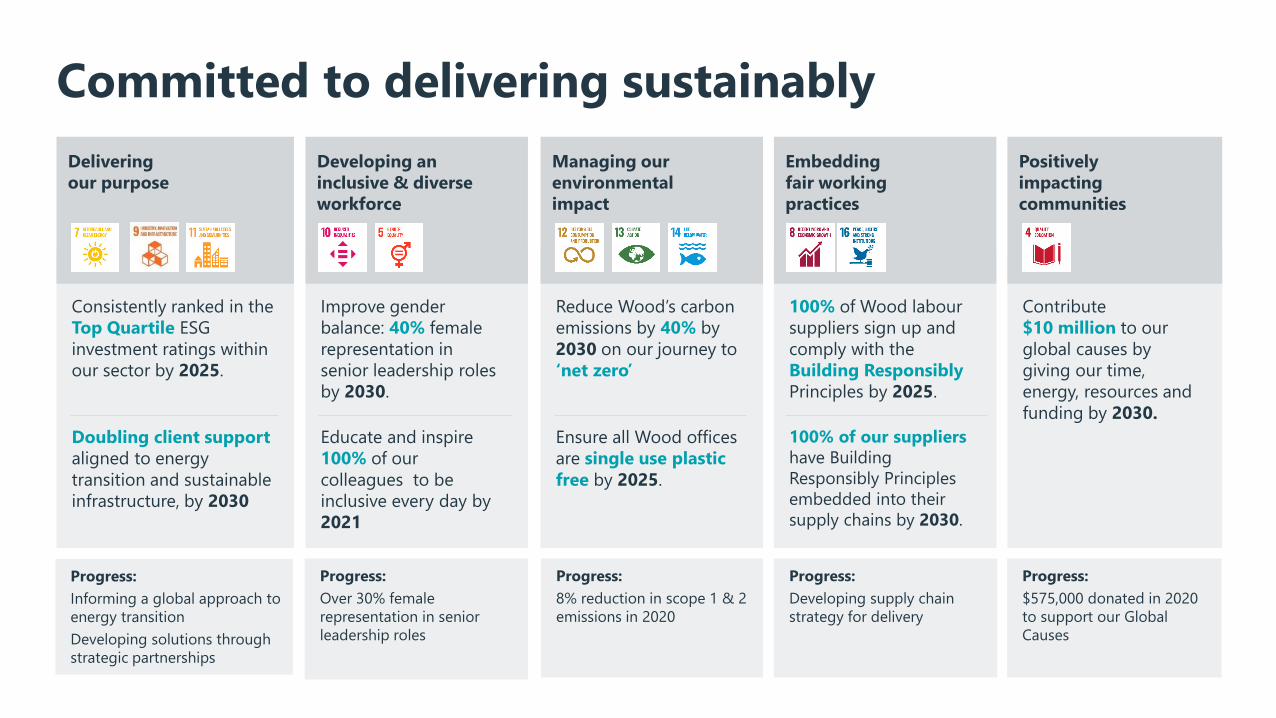
Committed to delivering sustainably
22
Delivering
our purpose
Consistently ranked in the
Top Quartile ESG
investment ratings within
our sector by 2025.
Doubling client support
aligned to energy
transition and sustainable
infrastructure, by 2030
Progress:
Informing a global approach to
energy transition
Developing solutions through
strategic partnerships
Improve gender
balance: 40% female
representation in
senior leadership roles
by 2030.
Developing an
inclusive & diverse
workforce
Educate and inspire
100% of our
colleagues to be
inclusive every day by
2021
Progress:
Over 30% female
representation in senior
leadership roles
Reduce Wood’s carbon
emissions by 40% by
2030 on our journey to
‘net zero’
Managing our
environmental
impact
Ensure all Wood offices
are single use plastic
free by 2025.
Progress:
8% reduction in scope 1 & 2
emissions in 2020
100% of Wood labour
suppliers sign up and
comply with the
Building Responsibly
Principles by 2025.
Embedding
fair working
practices
100% of our suppliers
have Building
Responsibly Principles
embedded into their
supply chains by 2030.
Progress:
Developing supply chain
strategy for delivery
Contribute
$10 million to our
global causes by
giving our time,
energy, resources and
funding by 2030.
Positively
impacting
communities
Progress:
$575,000 donated in 2020
to support our Global
Causes

A compelling growth platform across our wider business
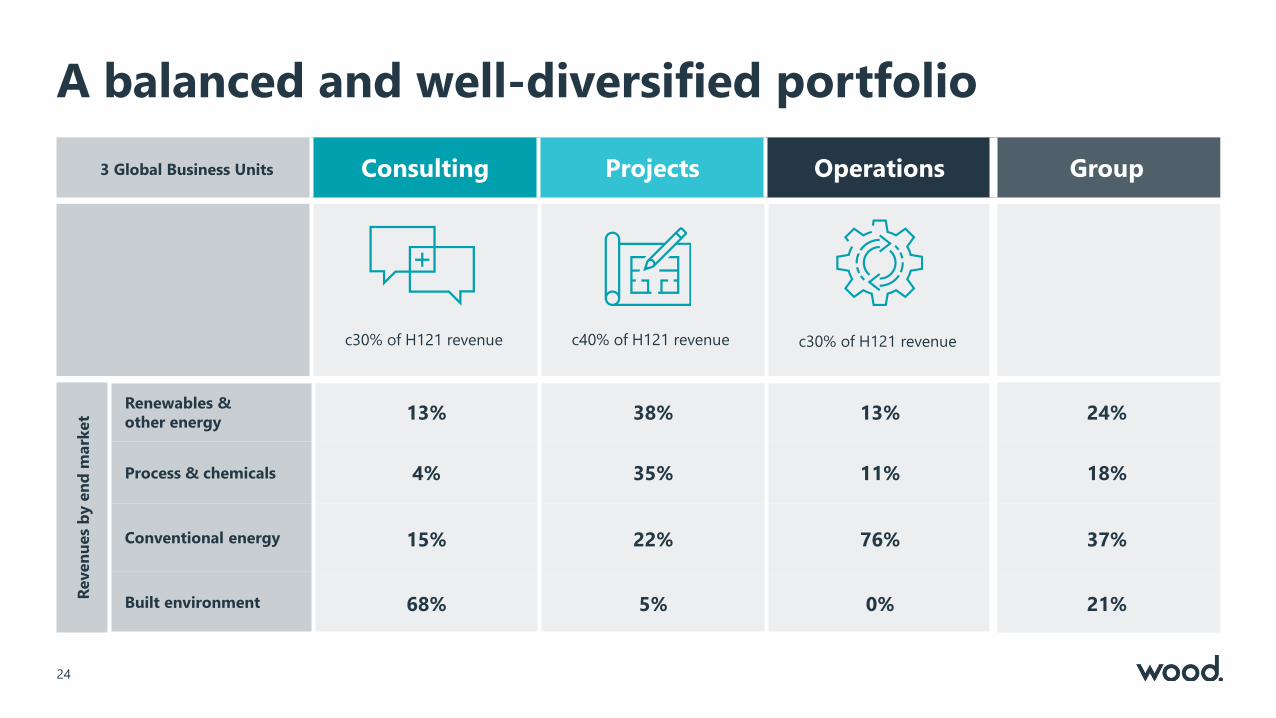
A balanced and well-diversified portfolio
24
3 Global Business Units Consulting Projects Operations Group
Reven
ues
by e
nd
mark
et
Renewables &
other energy13% 38% 13% 24%
Process & chemicals 4% 35% 11% 18%
Conventional energy 15% 22% 76% 37%
Built environment 68% 5% 0% 21%
c30% of H121 revenue c40% of H121 revenue c30% of H121 revenue

Operational highlights
• Partnering with Honeywell to jointly create a
solution to produce green aviation fuel
• Strategic appointments in growth areas:
• VP of Hydrogen
• Global Director of Decarbonisation
• SVP of Sustainability Solutions
• Influencing climate & economic policy, in
partnership with Resilience Shift, to ensure
resilience in critical infrastructure development
• Proprietary digital solutions driving new sales
e.g zero emissions simulator tool
ORDER BOOK
$2.0bn
40% vs.
Jun 2020
15% vs.
Dec 2020
BOOK TO BILL
1.30x
13% Renewables & Other Energy
4% Process
& chemicals
15%
Conventional
energy
68%
Built environment
69% North
America
16%
Europe
15% RoW
H1 2021 H1 2020
REVENUE
$0.9bn $1.0bn
EBTIDA
$106m $107m
EBITDA Margin
12.1% 11.0%
8% Renewables & Other Energy
3% Process
& chemicals
7% Conventional
energy
82% Built
environment
Consulting: global, multi sector & high value specialist consultancy
Recent strategic wins
• ADNOC – blue ammonia and carbon capture
study (Decarbonisation)
• USACE – pipeline replacement project at Dyess
air force base (Government)
• States of Missouri & West Virginia – flood
hazard identification studies (Climate resiliency)
Markets & geographiesAt a glance
Order book progression

Operational highlights
• Successful completion of the EPC scope for
YCI’s methanol plant
• Completion of five renewable (solar & wind)
projects, generating a combined capacity of
over 520 MW
• Successfully diversifying into decarbonisation
with the award of Acorn CCS FEED scope
• Delivering EPCm project in Europe to convert a
traditional diesel production unit to bio-diesel
ORDER BOOK
$2.8bn
39% vs.
Jun 2020
3% vs.
Dec 2020
BOOK TO BILL
0.95x
H1 2021 H1 2020
REVENUE
$1.2bn $2.0bn
EBTIDA
$88m $103m
EBITDA Margin
7.5% 5.3%
Projects: delivering exceptional returns on client’s capital investment
Recent strategic wins
• Humber Zero – refinery FEED phase work
(Decarbonisation)
• Nevada Gold – EPC of large solar plant to
deliver zero emissions mine (Renewables)
• Acorn CCS – FEED work on one of the first
industrial-scale carbon capture projects in the
UK (Decarbonisation)
Markets & geographiesAt a glance
Order book progression
38% Renewables
& other energy
35% Process
& chemicals22%
Conventional energy
5% Built environment
51% North America
15% Europe
6% RoW
16% Middle
East & Africa
12% Asia Pacific
34% Renewables
& other energy
28% Process &
chemicals
30% Conventional energy
8% Built environment
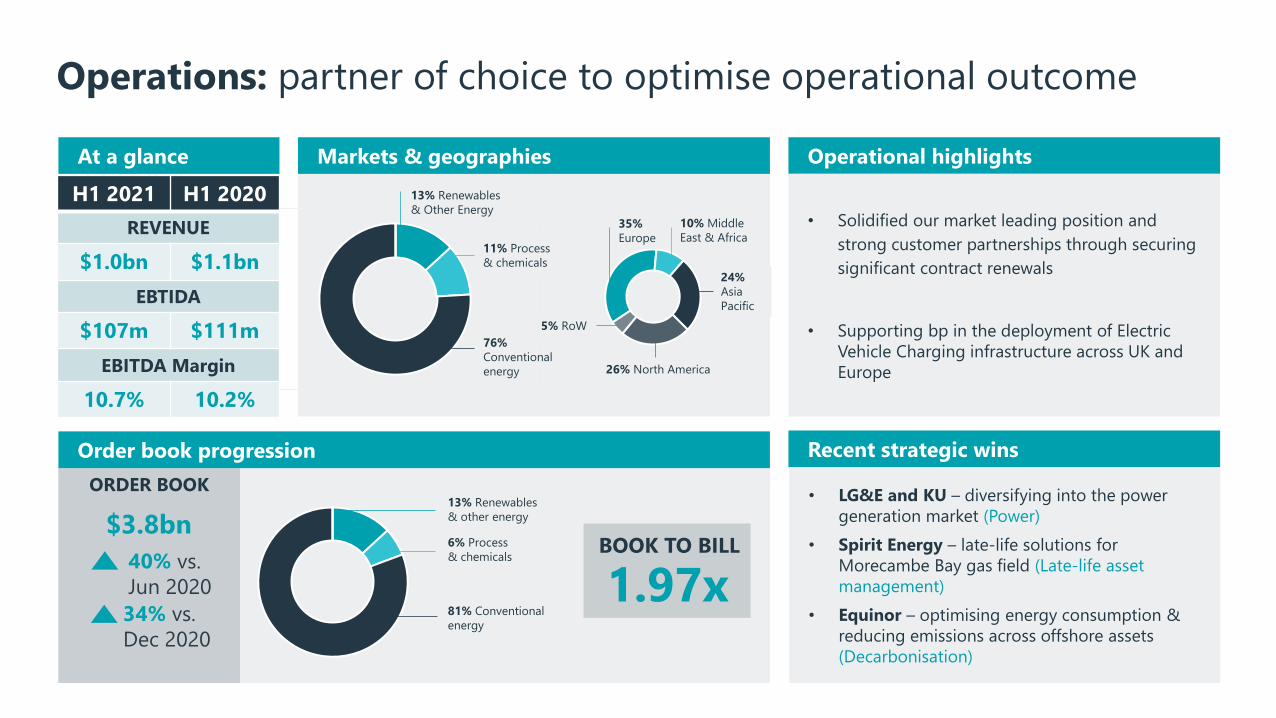
Operational highlights
• Solidified our market leading position and
strong customer partnerships through securing
significant contract renewals
• Supporting bp in the deployment of Electric
Vehicle Charging infrastructure across UK and
Europe
ORDER BOOK
$3.8bn
40% vs.
Jun 2020
34% vs.
Dec 2020
BOOK TO BILL
1.97x
13% Renewables
& Other Energy
11% Process
& chemicals
76%
Conventional
energy
H1 2021 H1 2020
REVENUE
$1.0bn $1.1bn
EBTIDA
$107m $111m
EBITDA Margin
10.7% 10.2%
Operations: partner of choice to optimise operational outcome
Recent strategic wins
• LG&E and KU – diversifying into the power
generation market (Power)
• Spirit Energy – late-life solutions for
Morecambe Bay gas field (Late-life asset
management)
• Equinor – optimising energy consumption &
reducing emissions across offshore assets
(Decarbonisation)
Markets & geographiesAt a glance
Order book progression
13% Renewables
& other energy
6% Process
& chemicals
81% Conventional
energy
26% North America
35%
Europe
5% RoW
10% Middle
East & Africa
24%
Asia
Pacific

Consulting Projects Operations
Market
themes
28
Significant growth from
stimulus spend:
• Hydrogen
• Decarbonisation of
industrial & energy assets
• Energy and infrastructure
• Government stimulus in
energy transition, climate
resilience & infrastructure
Energy transition &
decarbonisation driving
medium term growth:
• Renewables (particularly US
solar)
• Hydrogen
• Biofuels & bio-refining
• Conventional energy (linked
to economic recovery)
• Broader distribution of
capital investment across
energy and industrial markets
Strong conventional energy
& industrial markets driving
growth:
• Conventional energy:
• Asset management as
IECs divest mature
basins
• Cost optimisation &
emissions reduction
• Decommissioning &
repurposing
• Higher spend on
modernising assets
Growth plans aligned to market opportunities

Bringing our breadth of expertise together for clients
29
Nevada Gold - Renewables, Americas
• Joint win for Projects and Consulting
• EPC contract for 100MWac solar plant
and substation
• Zero-emissions mining project
• $70m+ revenue with potential for future
work
• Operations win with pull-through for
Consulting
• Core asset management brief, plus asset
integrity and decarbonisation studies
• Multi-million dollar extension
• Long-term client
Conventional energy, Asia-Pacific
• Joint win for Consulting and Projects
• Pre-FEED and design for blue ammonia
project and six chemical facilities
• CO2 capture and hydrogen
• Scope for follow-on work
ADNOC - Process & chemicals, Middle East

30
Margin improvement, momentum for growth
Strong order book growth:
• $7.7bn order book - up 18% vs.
Dec ’20
• Growth in Consulting &
Operations, improving
momentum in Projects
• $3bn revenue already secured for
H2 2021
Significant margin improvement:
• EBITDA margin of 8.3%
• Up 80 bps vs. H1 20
• Margin growth in all three
business units
Accelerating strategy at pace:
• Optimised organisational design
unlocking growth
• Future Fit delivered $20m
EBITDA benefit in H1 21
• Investing in digital & leading on
net-zero solutions
Margin improvement across all business units & order book up 18%
Results Market environment Strategic process


Appendices
32

H1 2021 ($m) H1 2020 ($m)
Revenue EBITDA Margin Revenue EBITDA Margin
Consulting 877 106 12.1% 974 107 11.0%
Projects 1,168 88 7.5% 1,954 103 5.3%
Operations 999 107 10.7% 1,093 111 10.2%
Investment Services 106 (7) N/a 64 15 22.9%
Central costs/asbestos/other - (32) N/a - (31) N/a
Total 3,150 262 8.3% 4,085 305 7.5%
Projects leading margin improvement across all BUs
33

Revenue sector analysis
34
H1 2021 H1 2020
Consulting Projects Operations
Investment
Services
Central
costs Total Consulting Projects Operations
Investment
Services
Central
costs Total
Revenue:
Renewables & other energy 116 435 128 88 - 767 122 731 49 60 - 962
Process & Chemicals 37 413 113 - - 563 47 790 150 - - 987
Conventional Energy 132 260 757 - - 1,149 162 376 852 - - 1,390
Built Environment 592 60 - 19 - 671 582 57 29 4 - 672
Disposals - - - - - - 61 - 13 - - 74
877 1,168 999 106 - 3,150 974 1,954 1,093 64 - 4,085
EBITDA 106 88 107 (7) (32) 262 107 103 111 15 (31) 305
EBITDA margin 12.1% 7.5% 10.7% (6.5)% - 8.3% 11.0% 5.3% 10.2% 22.9% - 7.5%

Cashflow reconciliation: pre/post leases and IFRS 16
35
H1 2021 $m Leases Post-Leases
Adjusted EBITDA 194 68 262 IFRS 16: $67m operating lease rentals
JV EBITDA /divs/other (5) (3) (8)
Provisions (59) - (59)
Cash generated pre working capital 130 65 195
Working capital movements (237) - (237)
Exceptional items (46) 10 (36) Onerous lease adjustment relating to IFRS 16
Cash generated from operations (153) 75 (78)
Divestments/ (acquisitions) 19 - 19
Capex & intangible assets (41) - (41)
Free cash flow (175) 75 (100)
Tax, interest, dividends and other (86) 7 (79)
Non-cash movement in leases - (40) (40) Net additions to leases in period & interest expense
Net decrease in net debt (261) 42 (219)
Opening net debt (1,014) (541) (1,555)
Closing net debt (1,275) (500) (1,775)
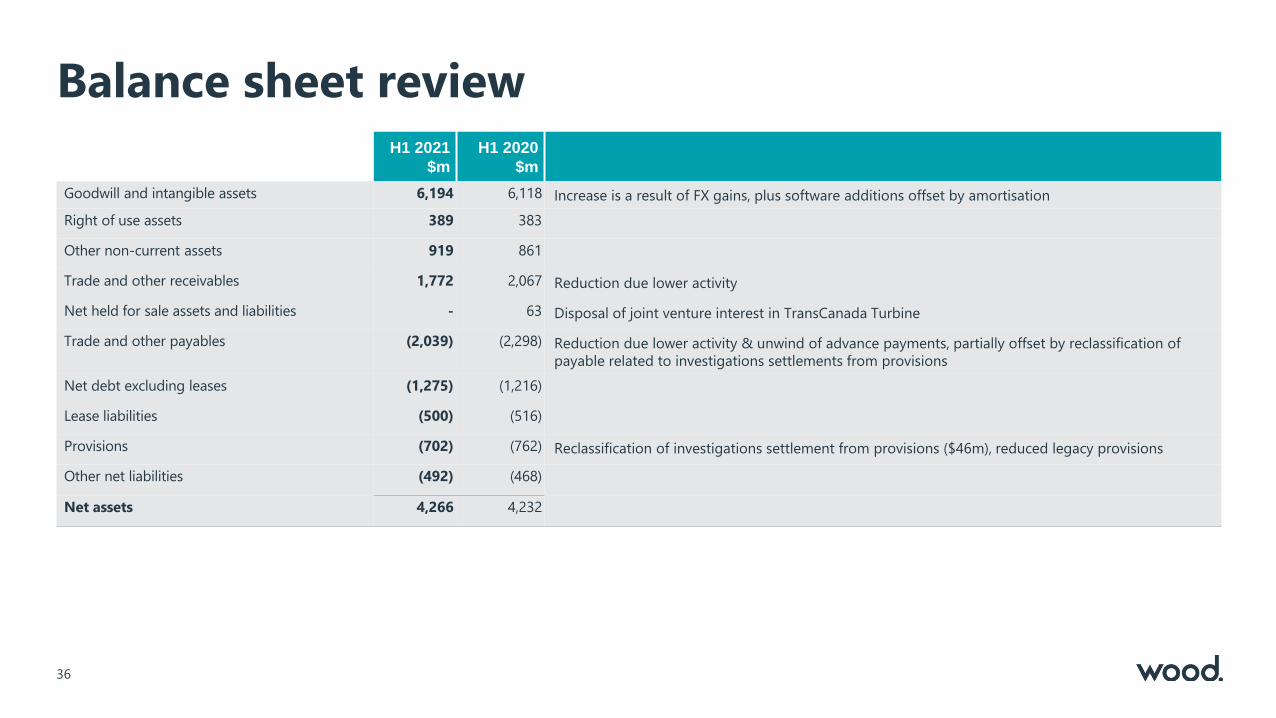
Balance sheet review
36
H1 2021
$m
H1 2020
$m
Goodwill and intangible assets 6,194 6,118 Increase is a result of FX gains, plus software additions offset by amortisation
Right of use assets 389 383
Other non-current assets 919 861
Trade and other receivables 1,772 2,067 Reduction due lower activity
Net held for sale assets and liabilities - 63 Disposal of joint venture interest in TransCanada Turbine
Trade and other payables (2,039) (2,298) Reduction due lower activity & unwind of advance payments, partially offset by reclassification of
payable related to investigations settlements from provisions
Net debt excluding leases (1,275) (1,216)
Lease liabilities (500) (516)
Provisions (702) (762) Reclassification of investigations settlement from provisions ($46m), reduced legacy provisions
Other net liabilities (492) (468)
Net assets 4,266 4,232
Related Documents