HWM & Plaza Low Yat Brand Survey Awards 2012 For 10 years now, HWM has been bringing you our annual look at brand perception trends among Malaysian consumers Since 2002, HWM & Plaza Low Yat have brought you the highly anticipated results of the longest running tech-related brand survey in the country. In 2012, the tech industry and Malaysians in general felt the effects of an uncertain global economy coupled with the after effects of the earthquake tragedy in Japan. On the home front, Malaysians have been cautious with concerns of a growing inflation rate and general elections looming. As the year draws to a close, we hope to see see some positive signs of economic recovery as we get ready to welcome 2013. So, which brands are at the top of the minds of Malaysians this year, you ask? In 2009 we revamped our survey by updating and removing categories that we felt were no longer relevant and added some new ones to keep up with the ever-changing local tech scene. It has now been four years since we divided our survey into four general categories to reflect the major product sections in the magazine: Communications, CE/AV, Computers and SMB (Small Medium Business). In 2011, we had 30 product categories in the survey. Fast forward to 2012 and we now have a total of 29 product categories. So, without further adieu we now look at all the winning brands of 2012! Malaysians have decided on the top brands of 2012! This year’s Brand Survey is the tenth time that we went out and polled Malaysians from all walks of life and strata of society to gather information with regards to their brand preferences. As in the past, our surveys have always recorded excellent responses from members of the public and this year was no different either. The 2012 Brand Survey represents the views of both, HWM readers and Malaysian consumers in general. This survey (just like in the past seven years) also sees the inclusion of respondents who participated via our online survey at www.hardwarezone.com.my. In 2011, close to 750 respondents filled-up our online survey form. This year, the number has dropped slightly to 635. In 2012, respondents participated in the survey at PIKOM PC Fair, at Plaza Low Yat and by filling-up survey forms bundled with the magazine. In all, the 2012 brand survey sees a total respondent head count of 2105 down by 102 from 2011 (2207). Although we collected close to 2300 brand survey forms this year, many had to be excluded from the final tabulation yet again due to errors, incomplete sections, a lack of proper personal details and damaged forms in general. Respondents for the survey were obtained from the following sources this year: a. Post-in responses from HWM readers / subscribers nationwide b. Plaza Low Yat c. PC Fair walk-in visitors d. The online survey at www.hardwarezone.com.my The HWM & Plaza Low Yat Brand Survey 2012 continues a tradition of providing IT companies, leading brands, advertisers and consumers in general with a neutral and objective look at what brands Malaysians identify with in 29 product categories. Over the past 10 years, this annual brand recognition survey has become a valuable tool for the tech industry in terms of tracking consumer mindset patterns/changes on an annual basis. The survey is leaner today Back in 2003, we featured a total of 28 product categories. In our 2004 survey this number was bumped-up to 34. In 2005, the category list jumped to 41 - adding six more categories along the way to accommodate new types of products that had entered the Malaysian market at the time. Among the new categories introduced in 2005 were 3G phones, Digital SLRs and cooling solutions. In 2006 the list remained the same with 41 categories. In 2007, the list was refined further - removing redundant categories and adding-in some new product categories for a total of 35 categories with 38 awards up for grabs. The 2008 survey again featured 35 product categories but with 35 awards on offer. Categories like Blu-ray Disc Player and Home Theater System were also introduced that year. 2009 saw our survey being segmented into four key areas that reflected the content in our magazine as mentioned earlier. The 2009 survey also saw the addition of 5 new award categories: Digital Photo Frame, Blu-ray / DVD Writer, Solid State Drive (SSD), Network Attached Storage or NAS and Security Solutions. In 2010, the number of categories was 33 with the exclusion of LCD TV, Digital Photo Frame, Optical Disk Drive, Inkjet Printer and Color Laser Printer. We also saw the inclusion of new categories like HDTV, HD Media Player, Desktop/AIO and Laser Printer in 2010. In 2011 we further refined the survey to 30 categories to reflect current tech trends and in 2012 the number has been reduced yet again to 29. Some considerations As in any survey, there exist gaps and weaknesses. These are appended below: • Adequate Sample Size - the sample size does not represent the actual consumer market. There are approximately 6.5 million plus households in Malaysia with some 11.5 million plus consumers in the ICT segment alone; • Accurate Positioning of Brands – the survey does not differentiate the stage of the cycle of brands; • Adequate Testing Methodology – the survey utilizes a direct questioning methodology and does not test the perception of respondents by cross referencing questions; • Sample Size Relevance – there is no set criteria for respondents. Nonetheless, this survey is able to meet the primary objective for which is to accord recognition on brand awareness on a random basis with no preset parameters of the respondent pool. Quantitative extrapolation is possible with such data to derive the results required. So, here are the results of our 2012 survey. To all leading brands…our heartiest congratulations!

Welcome message from author
This document is posted to help you gain knowledge. Please leave a comment to let me know what you think about it! Share it to your friends and learn new things together.
Transcript

HWM & Plaza Low Yat Brand Survey Awards 2012
For 10 years now, HWM has been bringing you our annual look at brand perception trends among Malaysian consumers
Since 2002, HWM & Plaza Low Yat have brought you the highly anticipated results of the longest running tech-related brand survey in the country. In 2012, the tech industry and Malaysians in general felt the effects
of an uncertain global economy coupled with the after effects of the earthquake tragedy in Japan. On the home front, Malaysians have been cautious with concerns of a growing inflation rate and general elections
looming. As the year draws to a close, we hope to see see some positive signs of economic recovery as we get ready to welcome 2013.
So, which brands are at the top of the minds of Malaysians this year, you ask? In 2009 we revamped our survey by updating and removing categories that we felt were no longer relevant and added some new ones to keep up with the ever-changing local tech scene. It has now been four years since we divided our survey into four general categories to reflect the major product sections in the magazine: Communications, CE/AV,
Computers and SMB (Small Medium Business). In 2011, we had 30 product categories in the survey. Fast forward to 2012 and we now have a total of 29 product categories. So, without further adieu we now look at
all the winning brands of 2012!
Malaysians have decided on the top brands of 2012!This year’s Brand Survey is the tenth time that we went out and polled Malaysians from all walks of life and strata of society to gather information with regards to their brand preferences. As in the past, our surveys have always recorded excellent responses from members of the public and this year was no different either. The 2012 Brand Survey represents the views of both, HWM readers and Malaysian consumers in general. This survey (just like in the past seven years) also sees the inclusion of respondents who participated via our online survey at www.hardwarezone.com.my. In 2011, close to 750 respondents filled-up our online survey form. This year, the number has dropped slightly to 635. In 2012, respondents participated in the survey at PIKOM PC Fair, at Plaza Low Yat and by filling-up survey forms bundled with the magazine. In all, the 2012 brand survey sees a total respondent head count of 2105 down by 102 from 2011 (2207). Although we collected close to 2300 brand survey forms this year, many had to be excluded from the final tabulation yet again due to errors, incomplete sections, a lack of proper personal details and damaged forms in general.
Respondents for the survey were obtained from the following sources this year:
a. Post-in responses from HWM readers / subscribers nationwide b. Plaza Low Yatc. PC Fair walk-in visitorsd. The online survey at www.hardwarezone.com.my
The HWM & Plaza Low Yat Brand Survey 2012 continues a tradition of providing IT companies, leading brands, advertisers and consumers in general with a neutral and objective look at what brands Malaysians identify with in 29 product categories. Over the past 10 years, this annual brand recognition survey has become a valuable tool for the tech industry in terms of tracking consumer mindset patterns/changes on an annual basis.
The survey is leaner today Back in 2003, we featured a total of 28 product categories. In our 2004 survey this number was bumped-up to 34. In 2005, the category list jumped to 41 - adding six more categories along the way to accommodate new types of products that had entered the Malaysian market at the time. Among the new categories introduced in 2005 were 3G phones, Digital SLRs and cooling solutions. In 2006
the list remained the same with 41 categories. In 2007, the list was refined further - removing redundant categories and adding-in some new product categories for a total of 35 categories with 38 awards up for grabs. The 2008 survey again featured 35 product categories but with 35 awards on offer. Categories like Blu-ray Disc Player and Home Theater System were also introduced that year. 2009 saw our survey being segmented into four key areas that reflected the content in our magazine as mentioned earlier. The 2009 survey also saw the addition of 5 new award categories: Digital Photo Frame, Blu-ray / DVD Writer, Solid State Drive (SSD), Network Attached Storage or NAS and Security Solutions. In 2010, the number of categories was 33 with the exclusion of LCD TV, Digital Photo Frame, Optical Disk Drive, Inkjet Printer and Color Laser Printer. We also saw the inclusion of new categories like HDTV, HD Media Player, Desktop/AIO and Laser Printer in 2010. In 2011 we further refined the survey to 30 categories to reflect current tech trends and in 2012 the number has been reduced yet again to 29.
Some considerationsAs in any survey, there exist gaps and weaknesses. These are appended below:
• Adequate Sample Size - the sample size does not represent the actual consumer market. There are approximately 6.5 million plus households in Malaysia with some 11.5 million plus consumers in the ICT segment alone;
• Accurate Positioning of Brands – the survey does not differentiate the stage of the cycle of brands;
• Adequate Testing Methodology – the survey utilizes a direct questioning methodology and does not test the perception of respondents by cross referencing questions;
• Sample Size Relevance – there is no set criteria for respondents.
Nonetheless, this survey is able to meet the primary objective for which is to accord recognition on brand awareness on a random basis with no preset parameters of the respondent pool. Quantitative extrapolation is possible with such data to derive the results required.
So, here are the results of our 2012 survey. To all leading brands…our heartiest
congratulations!

GenderAs always, since our very fi rst survey 10 years ago, there are still more male respondents as opposed to females in our poll. Females accounted for 24% of the 2012 poll (25% in 2011), a slight decrease from what we recorded in 2011. Considering the slightly smaller sample this year, we believe the number of female tech enthusiasts has been growing steadily albeit slowly over the past 10 years.
0
200
400
600
800
1000
Income
Freq
uenc
y
RM1000 and below RM1001-RM2000 RM2001-RM3000
RM3001-RM4000 RM4001-RM5000 RM5001 and above
105
393
571 557
229250
10.88%
11.88% 4.99%
26.46%27.12%
18.67%RM
1000
and
bel
ow
RM10
01-R
M20
00
RM20
01-R
M30
00
RM30
01-R
M40
00
RM40
01-R
M50
00
RM50
01 a
nd a
bove
Gender
Freq
uenc
y
Female Male
496
1609
23.56%
76.44%
0
500
1000
1500
2000
2500
Fem
ale
Mal
e
Income Total Percentage (%)RM1000 and below 105 4.99%RM1001-RM2000 393 18.67%RM2001-RM3000 571 27.13%RM3001-RM4000 557 26.46%RM4001-RM5000 229 10.88%RM5001 and above 250 11.88%Total 2105 100.00%
Gender Total PercentageFemale 496 23.56%Male 1609 76.44%Total 2105 100.00%
GenderFemale
Male
Total
Total496
1609
2105
Percentage (%)23.56
76.44
100
Age GroupAs in 2003 to 2011 - the most respondents in our 2012 Brand Survey fall into the 20 - 29 years’ age group (47%). In 2005, the 30-39 years’ age group stormed into second place, retaining it in 2006 and cementing its spot yet again in 2007, 2008 and 2009 respectively. 2010 was pretty much the same story with the 30-39 age group coming in second (26%) again. 2011 stayed true to this trend with 27% of our sample. And in 2012, the segment accounted for 27% of the sample.
0.52% 0.90%
Location
Freq
uenc
y
Johor Kedah Kelantan Melaka Negeri Sembilan
Pahang Perak Perlis Pulau Pinang Putrajaya
Sabah Sarawak Selangor Terengganu Wilayah Persekutuan
Others
8742 22 28 42 37
0
187144
11 19 39
101
603
41
737
4
4.13%
0.00% (Others)2.00%
1.05%1.33%
2.00%1.76%
8.88%
28.65%
1.95%
35.00%
4.80%
0.19% (Perlis)
6.84%
0
200
400
600
800
1000
Joho
r
Neg
eri S
embi
lan
Paha
ng
Keda
h
Kela
ntan
Mel
aka
Pera
k
Perli
s
Pula
u Pi
nang
Putr
ajay
a
Saba
h
Sara
wak
Sela
ngor
Tere
ngga
nu
Wila
yah
Pers
ekut
uan
Oth
ers
Age Group
Freq
uenc
y
14 yrs & below 15-19 years 20-29 years 30-39 years 40-49 years
50 & above
24
364
991
14
143
569
1.14%6.79%
0.67%
17.29%
47.08%
27.03%
0
500
1000
1500
2000
2500
14 y
rs a
nd b
elow
40-4
9 ye
ars
50 a
nd a
bove
15-1
9 ye
ars
20-2
9 ye
ars
30-3
9 ye
ars
Location Total Percentage (%)Johor 87 4.13%Kedah 42 2.00%Kelantan 22 1.05%Melaka 28 1.33%Negeri Sembilan 42 2.00%Pahang 37 1.76%Perak 187 8.88%Perlis 4 0.19%Pulau Pinang 144 6.84%Putrajaya 11 0.52%Sabah 19 0.90%Sarawak 101 4.80%Selangor 603 28.65%Terengganu 41 1.95%Wilayah Persekutuan 737 35.01%Others 0 0.00%Total 2105 100.00%
Age Group Total Percentage14 yrs and below 24 1.14%15-19 years 364 17.29%20-29 years 991 47.08%30-39 years 569 27.03%40-49 years 143 6.79%50 and above 14 0.67%Total 2105 100.00%
Age Group14 years and below
15 years - 19 years
20 years - 29 years
30 years - 39 years
40 years - 49 years
50 years and above
Total
Total24
364
991
569
143
14
2105
Percentage (%)1.14
17.29
47.08
27.03
6.79
0.67
100
0.52% 0.90%
Location
Freq
uenc
y
Johor Kedah Kelantan Melaka Negeri Sembilan
Pahang Perak Perlis Pulau Pinang Putrajaya
Sabah Sarawak Selangor Terengganu Wilayah Persekutuan
Others
8742 22 28 42 37
0
187144
11 19 39
101
603
41
737
4
4.13%
0.00% (Others)2.00%
1.05%1.33%
2.00%1.76%
8.88%
28.65%
1.95%
35.00%
4.80%
0.19% (Perlis)
6.84%
0
200
400
600
800
1000
Joho
r
Neg
eri S
embi
lan
Paha
ng
Keda
h
Kela
ntan
Mel
aka
Pera
k
Perli
s
Pula
u Pi
nang
Putr
ajay
a
Saba
h
Sara
wak
Sela
ngor
Tere
ngga
nu
Wila
yah
Pers
ekut
uan
Oth
ers
Age Group
Freq
uenc
y
14 yrs & below 15-19 years 20-29 years 30-39 years 40-49 years
50 & above
24
364
991
14
143
569
1.14%6.79%
0.67%
17.29%
47.08%
27.03%
0
500
1000
1500
2000
2500
14 y
rs a
nd b
elow
40-4
9 ye
ars
50 a
nd a
bove
15-1
9 ye
ars
20-2
9 ye
ars
30-3
9 ye
ars
Location Total Percentage (%)Johor 87 4.13%Kedah 42 2.00%Kelantan 22 1.05%Melaka 28 1.33%Negeri Sembilan 42 2.00%Pahang 37 1.76%Perak 187 8.88%Perlis 4 0.19%Pulau Pinang 144 6.84%Putrajaya 11 0.52%Sabah 19 0.90%Sarawak 101 4.80%Selangor 603 28.65%Terengganu 41 1.95%Wilayah Persekutuan 737 35.01%Others 0 0.00%Total 2105 100.00%
Age Group Total Percentage14 yrs and below 24 1.14%15-19 years 364 17.29%20-29 years 991 47.08%30-39 years 569 27.03%40-49 years 143 6.79%50 and above 14 0.67%Total 2105 100.00%
0
200
400
600
800
1000
Income
Freq
uenc
y
RM1000 and below RM1001-RM2000 RM2001-RM3000
RM3001-RM4000 RM4001-RM5000 RM5001 and above
105
393
571 557
229250
10.88%
11.88% 4.99%
26.46%27.12%
18.67%
RM10
00 a
nd b
elow
RM10
01-R
M20
00
RM20
01-R
M30
00
RM30
01-R
M40
00
RM40
01-R
M50
00
RM50
01 a
nd a
bove
Gender
Freq
uenc
y
Female Male
496
1609
23.56%
76.44%
0
500
1000
1500
2000
2500
Fem
ale
Mal
e
Income Total Percentage (%)RM1000 and below 105 4.99%RM1001-RM2000 393 18.67%RM2001-RM3000 571 27.13%RM3001-RM4000 557 26.46%RM4001-RM5000 229 10.88%RM5001 and above 250 11.88%Total 2105 100.00%
Gender Total PercentageFemale 496 23.56%Male 1609 76.44%Total 2105 100.00%
Income RM1000 and below
RM1001 - RM2000
RM2001 - RM3000
RM3001 - RM4000
RM4001 - RM5000
RM5001 and above
Total
Total105
393
571
557
229
250
2105
Percentage (%)4.99
18.67
27.12
26.46
10.88
11.88
100
NOTE: * This is a random survey. Figures in no way represent actual market share of featured brands.* This poll represents the brand perception that respondents have with regards to product categories. It does not necessarily indicate what consumers in Malaysia are actually buying.
LocationAs in 2007 (39%), 2008 (38%), 2009 (37%), 2010 (39%) and 2011 (39%), Wilayah Persekutuan or Kuala Lumpur respondents dominate the largest portion of our 2012 sample with 35% of the poll followed closely by pollsters from Selangor with 28% (28% in 2011). Again, we recorded a general increase in the number of respondents from the Northern, Southern and East Malaysia regions, resulting in a well distributed geographic sample for the 2012 survey. Income
For eight years in a row, (2011, 2010, 2009, 2008, 2007, 2006, 2005 and 2004), the most number of respondents in our survey fell into the RM2001 - RM3000 salary bracket and this continues in 2012 (27%). The number of respondents in the RM3001 to RM4000 segment maintains second spot with 26% (28% in 2011) this year, thus giving us a much better understanding of what people with higher incomes prefer in terms of brand.
StateJohorKedahKelantanMelakaNegeri SembilanOthersPahangPerakPerlisPulau PinangPutrajayaSabahSarawakSelangorTerengganuWilayah PersekutuanTotal
Total87422228420
37187
41441119
10160341
7372105
Percentage (%)4.132.001.051.332.000.001.768.880.196.840.520.904.80
28.651.95
35.00100

COMMUNICATIONSSmartphone
0
100
200
300
400
500
600
Smartphone
Freq
uenc
y
Acer BlackBerry CSL HTC Huawei
I-Mobile LG Motorola Nokia Samsung
Sony Others
29
384
12
398
5537
101114
213
552
205
5
18.24%
0.57%
18.91%
2.61%1.76%
4.80%5.42%
10.12%
1.38%0.24% (Others)
26.21%
9.74%
Ace
r
Hua
wei
I-Mob
ile LG
Blac
kBer
ry
CSL
HTC
Mot
orol
a
Nok
ia
Sam
sung
Sony
Oth
ers
Smartphone Total Percentage (%)Acer 29 1.38%BlackBerry 384 18.24%CSL 12 0.57%HTC 398 18.91%Huawei 55 2.61%I-Mobile 37 1.76%LG 101 4.80%Motorola 114 5.42%Nokia 213 10.12%Samsung 552 26.22%Sony 205 9.74%Others 5 0.24%Total 2105 100.00%
Top 3 BrandsSamsung | HTC | BlackBerry
As in 2011, popular brands like HTC and Samsung continue to dominate this segment
with the release of new models like the One X and GALAXY SIII, off ering more powerful
processors, snappier graphics and sharper displays. While in 2009, 2010 and 2011, HTC
took top honors, this year’s Brand Survey sees Samsung turning the tables on them. The
Korean powerhouse breaks the monopoly and takes top honors this year with 26% of the
sample. HTC has to be satisfi ed with second spot (19%) while BlackBerry picks up third
place with 18% of the vote in 2012.
SmartphoneAcerBlackBerryCSLHTCHuaweiI-MobileLGMotorolaNokiaSamsungSonyOthersTotal
Total29
38412
3985537
101114213552205
52105
Percentage (%)1.38
18.240.57
18.912.611.764.805.42
10.1226.219.740.24100
0
100
200
300
400
500
600
Smartphone
Freq
uenc
y
Acer BlackBerry CSL HTC Huawei
I-Mobile LG Motorola Nokia Samsung
Sony Others
29
384
12
398
5537
101114
213
552
205
5
18.24%
0.57%
18.91%
2.61%1.76%
4.80%5.42%
10.12%
1.38%0.24% (Others)
26.21%
9.74%
Ace
r
Hua
wei
I-Mob
ile LG
Blac
kBer
ry
CSL
HTC
Mot
orol
a
Nok
ia
Sam
sung
Sony
Oth
ers
Smartphone Total Percentage (%)Acer 29 1.38%BlackBerry 384 18.24%CSL 12 0.57%HTC 398 18.91%Huawei 55 2.61%I-Mobile 37 1.76%LG 101 4.80%Motorola 114 5.42%Nokia 213 10.12%Samsung 552 26.22%Sony 205 9.74%Others 5 0.24%Total 2105 100.00%
CE / AVMirrorless Interchangeable Lens Camera
Mirrorless Interchangeable Lens Camera
Freq
uenc
y
Olympus Panasonic Pentax Ricoh Nikon
Samsung Sony Others
25.32%
3.66%2.71%
6.13%
5.56%
29.59%
0.14% (Others)
26.89%
0
200
400
600
800
1000
Oly
mpu
s
Pana
soni
c
Pent
ax
Rico
h
Nik
on
Sam
sung
Sony
Oth
ers
533566
7757
129 117
623
3
Mirrorless Interchangeable Lens Camera Total PercentageOlympus 566 26.89%Panasonic 533 25.32%Pentax 77 3.66%Ricoh 57 2.71%Nikon 129 6.13%Samsung 117 5.56%Sony 623 29.60%Others 3 0.14%Total 2105 100.00%
Compact Digital Camera Total PercentageCanon 478 22.71%FUJIFILM 199 9.45%Nikon 339 16.10%Olympus 241 11.45%Panasonic 276 13.11%Pentax 21 1.00%Ricoh 42 2.00%Samsung 196 9.31%Sony 313 14.87%Others 0 0.00%Total 2105 100.00%
0
100
200
300
400
500
600
Compact Digital Camera
Freq
uenc
y
Canon FUJIFILM Nikon Olympus Panasonic
Pentax Ricoh Samsung Sony Others
11.45%
13.11%
1.00%
2.00%
9.31%
14.87%
0.00% (others)
16.10%
22.71%
9.45%
Cano
n
Pana
soni
c
Pent
ax
FUJI
FILM
Nik
on
Oly
mpu
s
Rico
h
Sam
sung
Sony
Oth
ers
478
199
339
241
276
2142
196
313
0
Top 3 BrandsSony | Olympus | Panasonic
Introduced in our survey in 2011, mirrorless interchangeable lens cameras have grown into a mainstream phenomenon in just two years and accounts for many of the cameras sold in Malaysia. The main selling point is that these cameras off er DSLR-like quality photos without the accompanying bulk and complexity. This year Sony picks up top spot (29%), pushing Olympus (27%) into second place. Panasonic captures third with 25% of the poll with Nikon coming in fourth (6%).
Mirrorless Interchangeable Lens CameraOlympusPanasonicPentaxRicohNikonSamsungSonyOthers Total
Total5665337757
129117623
32105
Percentage (%)26.8925.323.662.716.135.56
29.590.14100
Mirrorless Interchangeable Lens Camera
Freq
uenc
y
Olympus Panasonic Pentax Ricoh Nikon
Samsung Sony Others
25.32%
3.66%2.71%
6.13%
5.56%
29.59%
0.14% (Others)
26.89%
0
200
400
600
800
1000
Oly
mpu
s
Pana
soni
c
Pent
ax
Rico
h
Nik
on
Sam
sung
Sony
Oth
ers
533566
7757
129 117
623
3
Mirrorless Interchangeable Lens Camera Total PercentageOlympus 566 26.89%Panasonic 533 25.32%Pentax 77 3.66%Ricoh 57 2.71%Nikon 129 6.13%Samsung 117 5.56%Sony 623 29.60%Others 3 0.14%Total 2105 100.00%
Compact Digital Camera Total PercentageCanon 478 22.71%FUJIFILM 199 9.45%Nikon 339 16.10%Olympus 241 11.45%Panasonic 276 13.11%Pentax 21 1.00%Ricoh 42 2.00%Samsung 196 9.31%Sony 313 14.87%Others 0 0.00%Total 2105 100.00%
0
100
200
300
400
500
600
Compact Digital Camera
Freq
uenc
y
Canon FUJIFILM Nikon Olympus Panasonic
Pentax Ricoh Samsung Sony Others
11.45%
13.11%
1.00%
2.00%
9.31%
14.87%
0.00% (others)
16.10%
22.71%
9.45%
Cano
n
Pana
soni
c
Pent
ax
FUJI
FILM
Nik
on
Oly
mpu
s
Rico
h
Sam
sung
Sony
Oth
ers
478
199
339
241
276
2142
196
313
0

Compact Digital Camera
Mirrorless Interchangeable Lens Camera
Freq
uenc
y
Olympus Panasonic Pentax Ricoh Nikon
Samsung Sony Others
25.32%
3.66%2.71%
6.13%
5.56%
29.59%
0.14% (Others)
26.89%
0
200
400
600
800
1000
Oly
mpu
s
Pana
soni
c
Pent
ax
Rico
h
Nik
on
Sam
sung
Sony
Oth
ers
533566
7757
129 117
623
3
Mirrorless Interchangeable Lens Camera Total PercentageOlympus 566 26.89%Panasonic 533 25.32%Pentax 77 3.66%Ricoh 57 2.71%Nikon 129 6.13%Samsung 117 5.56%Sony 623 29.60%Others 3 0.14%Total 2105 100.00%
Compact Digital Camera Total PercentageCanon 478 22.71%FUJIFILM 199 9.45%Nikon 339 16.10%Olympus 241 11.45%Panasonic 276 13.11%Pentax 21 1.00%Ricoh 42 2.00%Samsung 196 9.31%Sony 313 14.87%Others 0 0.00%Total 2105 100.00%
0
100
200
300
400
500
600
Compact Digital Camera
Freq
uenc
y
Canon FUJIFILM Nikon Olympus Panasonic
Pentax Ricoh Samsung Sony Others
11.45%
13.11%
1.00%
2.00%
9.31%
14.87%
0.00% (others)
16.10%
22.71%
9.45%
Cano
n
Pana
soni
c
Pent
ax
FUJI
FILM
Nik
on
Oly
mpu
s
Rico
h
Sam
sung
Sony
Oth
ers
478
199
339
241
276
2142
196
313
0Mirrorless Interchangeable Lens CameraFr
eque
ncy
Olympus Panasonic Pentax Ricoh Nikon
Samsung Sony Others
25.32%
3.66%2.71%
6.13%
5.56%
29.59%
0.14% (Others)
26.89%
0
200
400
600
800
1000
Oly
mpu
s
Pana
soni
c
Pent
ax
Rico
h
Nik
on
Sam
sung
Sony
Oth
ers
533566
7757
129 117
623
3
Mirrorless Interchangeable Lens Camera Total PercentageOlympus 566 26.89%Panasonic 533 25.32%Pentax 77 3.66%Ricoh 57 2.71%Nikon 129 6.13%Samsung 117 5.56%Sony 623 29.60%Others 3 0.14%Total 2105 100.00%
Compact Digital Camera Total PercentageCanon 478 22.71%FUJIFILM 199 9.45%Nikon 339 16.10%Olympus 241 11.45%Panasonic 276 13.11%Pentax 21 1.00%Ricoh 42 2.00%Samsung 196 9.31%Sony 313 14.87%Others 0 0.00%Total 2105 100.00%
0
100
200
300
400
500
600
Compact Digital Camera
Freq
uenc
y
Canon FUJIFILM Nikon Olympus Panasonic
Pentax Ricoh Samsung Sony Others
11.45%
13.11%
1.00%
2.00%
9.31%
14.87%
0.00% (others)
16.10%
22.71%
9.45%
Cano
n
Pana
soni
c
Pent
ax
FUJI
FILM
Nik
on
Oly
mpu
s
Rico
h
Sam
sung
Sony
Oth
ers
478
199
339
241
276
2142
196
313
0
Digital SLR
Sony ViewSonic Toshiba Others
0
200
400
600
800
1000
Digital SLR
Freq
uenc
y
Canon Nikon Olympus Panasonic Pentax
Ricoh Sony Others
691
512
291
129
4123
418
0
32.83%
24.32%
13.82%
6.13%
1.95%
19.86%
0.00% (Others)
Cano
n
Pana
soni
c
Pent
ax
Nik
on
Oly
mpu
s
Rico
h
Sony
Oth
ers
Tablet
Freq
uenc
y
Acer Apple Archos ASUS BlackBerry
CSL HTC I-Mobile Motorola Samsung
11.54%
7.17%4.37%
2.33%6.60%
14.96%
10.40%
3.42%
0.00% (Others)
5.56%5.46%
24.01%
2.90%
0
120
240
360
480
600
Ace
r
App
le
Arc
hos
ASU
S
Blac
kBer
ry
CSL
HTC
I-Mob
ile
Mot
orol
a
Sam
sung
Sony
View
Soni
c
Tosh
iba
Oth
ers
505
243
117
61
151
92
315
139
4927
219
72
115
0
Digital SLR Total PercentageCanon 691 32.83%Nikon 512 24.32%Olympus 291 13.82%Panasonic 129 6.13%Pentax 41 1.95%Ricoh 23 1.09%Sony 418 19.86%Others 0 0.00%Total 2105 100.00%
Tablet Total Percentage Acer 117 5.56%Apple 505 23.99%Archos 61 2.90%ASUS 243 11.54%BlackBerry 151 7.17%CSL 92 4.37%HTC 139 6.60%I-Mobile 49 2.33%Motorola 27 1.28%Samsung 315 14.96%Sony 219 10.40%ViewSonic 72 3.42%Toshiba 115 5.46%Others 0 0.00%Total 2105 100.00%
1.09%
1.28%
Top 3 BrandsCanon | Nikon | Sony
2012 has not been a very good year for the compact digital camera market as more and
more Malaysians are now opting for a smartphone to take care of their casual photo-
taking duties. Still, this has not stopped compact camera manufacturers from off ering
better models with more powerful sensors and a host of user-friendly features. Canon
picks up top spot in our survey yet again with 23% of the vote. Second place goes to
Nikon with 16% of the poll while Sony has to make do with third place with 15% of the
total sample.
Top 3 BrandsCanon | Nikon | Sony
For the fi fth year running, Canon picks-up top spot for DSLRs in the survey. 2012 sees more entry-level DSLR models entering the market, touting features that usually can only be found on mid to high-end models. The introduction of full-frame sensors in more aff ordable bodies recently has also made DSLRs more attractive compared to mirrorless models that are hot on their heels. Our 2012 survey results show that if our respondents were to purchase a DSLR they would look at the following three brands again: Canon 33% , Nikon 24% and Sony 20% . Olympus takes fourth spot yet again with 14% of the sample.
Compact Digital CameraCanonFUJIFILMNikonOlympusPanasonicPentaxRicohSamsungSonyOthersTotal
Total4781993392412762142
196313
02105
Percentage (%)22.719.45
16.1011.4513.111.002.009.31
14.870.00100
Digital SLRCanonNikonOlympusPanasonicPentaxRicohSonyOthersTotal
Total6915122911294123
4180
2105
Percentage (%)32.8324.3213.826.131.951.09
19.860.00100

HDTV
Others
0
100
200
300
400
500
HDTV
Freq
uenc
y
Haier Hitachi JVC LG Panasonic
Philips Samsung Sharp Sony Toshiba
3.42%
5.46%
3.33%
8.65%
9.17%
7.98%
20.89%
9.93%
19.67%
11.50%
0.00% (Others)
Hai
er
Hita
chi
LG
Pana
soni
c
Phili
ps
Sam
sung
Sony
Shar
p
JVC
Tosh
iba
Oth
ers
72
115
70
182193
168
440
209
414
242
0
0
100
200
300
400
500
600
ADATA KINGMAX Kingston Lexar Panasonic
PenDrive PNY SanDisk Silicon Power Sony
Memory Card
Freq
uenc
y
0.09% (Others)2.09%
5.61%
26.26%
4.61%
3.14%
5.37%21.57%
0.71%
1.90%
13.06%
13.35%
2.33%
AD
ATA
PenD
rive
PNY
SanD
isk
KIN
GM
AX
King
ston
Lexa
r
Pana
soni
c
Sony
Tosh
iba
Tran
scen
d
Silic
on P
ower
Oth
ers
44
118
553
97113
66
454
40
15
275 281
49
0
Toshiba Transcend Others
HDTV Total PercentageHaier 72 3.42%Hitachi 115 5.46%JVC 70 3.33%LG 182 8.65%Panasonic 193 9.17%Philips 168 7.98%Samsung 440 20.90%Sharp 209 9.93%Sony 414 19.67%Toshiba 242 11.50%Others 0 0.00%Total 2105 100.00%
Memory Card Total PercentageA-DATA 44 2.09%KINGMAX 118 5.61%Kingston 553 26.27%Lexar 97 4.61%Panasonic 66 3.14%PenDrive 113 5.37%PNY 15 0.71%SanDisk 454 21.57%Silicon Power 40 1.90%Sony 275 13.06%Toshiba 281 13.35%Transcend 49 2.33%Others 0 0.00%Total 2105 100.00%
Top 3 BrandsSamsung | Sony | Toshiba
2012 has been an interesting year for the HDTV. This year we saw the TV slim down, get Smart,
sport more apps and prefer LED technology for back-lighting duties. 3D too has moved from
gimmick to “must-have” in the minds of consumers as more 3D content becomes readily
available. Plasma still lingers on but many have started to write its obituary. Expect prices to
keep getting more aff ordable as screen sizes continue to grow to accommodate the advent
of UD. Just as in 2009, 2010 and 2011, Samsung picks up top spot again in 2012 with 21% of
the vote ahead of Sony in close second spot with 19% of the sample. Toshiba (11%) is still the
third most popular brand for HDTVs for the fi fth year running.
Others
0
100
200
300
400
500
HDTV
Freq
uenc
y
Haier Hitachi JVC LG Panasonic
Philips Samsung Sharp Sony Toshiba
3.42%
5.46%
3.33%
8.65%
9.17%
7.98%
20.89%
9.93%
19.67%
11.50%
0.00% (Others)
Hai
er
Hita
chi
LG
Pana
soni
c
Phili
ps
Sam
sung
Sony
Shar
p
JVC
Tosh
iba
Oth
ers
72
115
70
182193
168
440
209
414
242
0
0
100
200
300
400
500
600
ADATA KINGMAX Kingston Lexar Panasonic
PenDrive PNY SanDisk Silicon Power Sony
Memory Card
Freq
uenc
y
0.09% (Others)2.09%
5.61%
26.26%
4.61%
3.14%
5.37%21.57%
0.71%
1.90%
13.06%
13.35%
2.33%
AD
ATA
PenD
rive
PNY
SanD
isk
KIN
GM
AX
King
ston
Lexa
r
Pana
soni
c
Sony
Tosh
iba
Tran
scen
d
Silic
on P
ower
Oth
ers
44
118
553
97113
66
454
40
15
275 281
49
0
Toshiba Transcend Others
HDTV Total PercentageHaier 72 3.42%Hitachi 115 5.46%JVC 70 3.33%LG 182 8.65%Panasonic 193 9.17%Philips 168 7.98%Samsung 440 20.90%Sharp 209 9.93%Sony 414 19.67%Toshiba 242 11.50%Others 0 0.00%Total 2105 100.00%
Memory Card Total PercentageA-DATA 44 2.09%KINGMAX 118 5.61%Kingston 553 26.27%Lexar 97 4.61%Panasonic 66 3.14%PenDrive 113 5.37%PNY 15 0.71%SanDisk 454 21.57%Silicon Power 40 1.90%Sony 275 13.06%Toshiba 281 13.35%Transcend 49 2.33%Others 0 0.00%Total 2105 100.00%
Tablet
Sony ViewSonic Toshiba Others
0
200
400
600
800
1000
Digital SLR
Freq
uenc
y
Canon Nikon Olympus Panasonic Pentax
Ricoh Sony Others
691
512
291
129
4123
418
0
32.83%
24.32%
13.82%
6.13%
1.95%
19.86%
0.00% (Others)
Cano
n
Pana
soni
c
Pent
ax
Nik
on
Oly
mpu
s
Rico
h
Sony
Oth
ers
Tablet
Freq
uenc
y
Acer Apple Archos ASUS BlackBerry
CSL HTC I-Mobile Motorola Samsung
11.54%
7.17%4.37%
2.33%6.60%
14.96%
10.40%
3.42%
0.00% (Others)
5.56%5.46%
24.01%
2.90%
0
120
240
360
480
600
Ace
r
App
le
Arc
hos
ASU
S
Blac
kBer
ry
CSL
HTC
I-Mob
ile
Mot
orol
a
Sam
sung
Sony
View
Soni
c
Tosh
iba
Oth
ers
505
243
117
61
151
92
315
139
4927
219
72
115
0
Digital SLR Total PercentageCanon 691 32.83%Nikon 512 24.32%Olympus 291 13.82%Panasonic 129 6.13%Pentax 41 1.95%Ricoh 23 1.09%Sony 418 19.86%Others 0 0.00%Total 2105 100.00%
Tablet Total Percentage Acer 117 5.56%Apple 505 23.99%Archos 61 2.90%ASUS 243 11.54%BlackBerry 151 7.17%CSL 92 4.37%HTC 139 6.60%I-Mobile 49 2.33%Motorola 27 1.28%Samsung 315 14.96%Sony 219 10.40%ViewSonic 72 3.42%Toshiba 115 5.46%Others 0 0.00%Total 2105 100.00%
1.09%
1.28%
Top 3 BrandsApple | Samsung | ASUS
Another category that entered our survey in 2011, the tablet is enjoying an all-time high
in terms of popularity and sales. While more and more manufacturers are off ering models
with diff erent screen sizes, the 7” tablet seems to be the size of choice with consumers
opting for a nice compromise of screen size and portability. Products from Apple and
Samsung are the most sought after currently but watch this space in 2013 as more players
enter the fray. When our 2012 survey respondents think of a tablet brand, they think of
Apple (24%), Samsung (15%) and ASUS (11%).
Sony ViewSonic Toshiba Others
0
200
400
600
800
1000
Digital SLRFr
eque
ncy
Canon Nikon Olympus Panasonic Pentax
Ricoh Sony Others
691
512
291
129
4123
418
0
32.83%
24.32%
13.82%
6.13%
1.95%
19.86%
0.00% (Others)
Cano
n
Pana
soni
c
Pent
ax
Nik
on
Oly
mpu
s
Rico
h
Sony
Oth
ers
Tablet
Freq
uenc
y
Acer Apple Archos ASUS BlackBerry
CSL HTC I-Mobile Motorola Samsung
11.54%
7.17%4.37%
2.33%6.60%
14.96%
10.40%
3.42%
0.00% (Others)
5.56%5.46%
24.01%
2.90%
0
120
240
360
480
600
Ace
r
App
le
Arc
hos
ASU
S
Blac
kBer
ry
CSL
HTC
I-Mob
ile
Mot
orol
a
Sam
sung
Sony
View
Soni
c
Tosh
iba
Oth
ers
505
243
117
61
151
92
315
139
4927
219
72
115
0
Digital SLR Total PercentageCanon 691 32.83%Nikon 512 24.32%Olympus 291 13.82%Panasonic 129 6.13%Pentax 41 1.95%Ricoh 23 1.09%Sony 418 19.86%Others 0 0.00%Total 2105 100.00%
Tablet Total Percentage Acer 117 5.56%Apple 505 23.99%Archos 61 2.90%ASUS 243 11.54%BlackBerry 151 7.17%CSL 92 4.37%HTC 139 6.60%I-Mobile 49 2.33%Motorola 27 1.28%Samsung 315 14.96%Sony 219 10.40%ViewSonic 72 3.42%Toshiba 115 5.46%Others 0 0.00%Total 2105 100.00%
1.09%
1.28%
TabletAcerAppleArchosASUSBlackBerry CSLHTCI-MobileMotorolaSamsungSonyViewSonicToshibaOthersTotal
Total11750561
24315192
1394927
31521972
1150
2105
Percentage (%)5.56
24.012.90
11.547.174.376.602.331.28
14.9610.403.425.460.00100
HDTVHaierHitachiJVCLGPanasonicPhilipsSamsungSharpSonyToshibaOthersTotal
Total72
11570
182193168440209414242
02105
Percentage (%)3.425.463.338.659.177.98
20.899.93
19.6711.500.00100

Memory Card
Others
0
100
200
300
400
500
HDTV
Freq
uenc
y
Haier Hitachi JVC LG Panasonic
Philips Samsung Sharp Sony Toshiba
3.42%
5.46%
3.33%
8.65%
9.17%
7.98%
20.89%
9.93%
19.67%
11.50%
0.00% (Others)
Hai
er
Hita
chi
LG
Pana
soni
c
Phili
ps
Sam
sung
Sony
Shar
p
JVC
Tosh
iba
Oth
ers
72
115
70
182193
168
440
209
414
242
0
0
100
200
300
400
500
600
ADATA KINGMAX Kingston Lexar Panasonic
PenDrive PNY SanDisk Silicon Power Sony
Memory Card
Freq
uenc
y
0.09% (Others)2.09%
5.61%
26.26%
4.61%
3.14%
5.37%21.57%
0.71%
1.90%
13.06%
13.35%
2.33%
AD
ATA
PenD
rive
PNY
SanD
isk
KIN
GM
AX
King
ston
Lexa
r
Pana
soni
c
Sony
Tosh
iba
Tran
scen
d
Silic
on P
ower
Oth
ers
44
118
553
97113
66
454
40
15
275 281
49
0
Toshiba Transcend Others
HDTV Total PercentageHaier 72 3.42%Hitachi 115 5.46%JVC 70 3.33%LG 182 8.65%Panasonic 193 9.17%Philips 168 7.98%Samsung 440 20.90%Sharp 209 9.93%Sony 414 19.67%Toshiba 242 11.50%Others 0 0.00%Total 2105 100.00%
Memory Card Total PercentageA-DATA 44 2.09%KINGMAX 118 5.61%Kingston 553 26.27%Lexar 97 4.61%Panasonic 66 3.14%PenDrive 113 5.37%PNY 15 0.71%SanDisk 454 21.57%Silicon Power 40 1.90%Sony 275 13.06%Toshiba 281 13.35%Transcend 49 2.33%Others 0 0.00%Total 2105 100.00%
Top 3 BrandsKingston | SanDisk | Toshiba
One of the more “elder” categories in our brand survey, the memory card has been a
mainstay since 2006. In 2012, memory cards have gotten faster, more durable and relatively
cheaper. They still are a quick, fast and convenient way to store data; especially when it
comes to cameras and smartphones. We expect capacities to grow and speeds to get faster
still in 2013. Meanwhile, in our 2012 survey, consumers once again have chosen Kingston
(26%), SanDisk (21%) and Toshiba (13%) as their favorite brands for memory cards.
Others
0
100
200
300
400
500
HDTV
Freq
uenc
y
Haier Hitachi JVC LG Panasonic
Philips Samsung Sharp Sony Toshiba
3.42%
5.46%
3.33%
8.65%
9.17%
7.98%
20.89%
9.93%
19.67%
11.50%
0.00% (Others)
Hai
er
Hita
chi
LG
Pana
soni
c
Phili
ps
Sam
sung
Sony
Shar
p
JVC
Tosh
iba
Oth
ers
72
115
70
182193
168
440
209
414
242
0
0
100
200
300
400
500
600
ADATA KINGMAX Kingston Lexar Panasonic
PenDrive PNY SanDisk Silicon Power Sony
Memory Card
Freq
uenc
y
0.09% (Others)2.09%
5.61%
26.26%
4.61%
3.14%
5.37%21.57%
0.71%
1.90%
13.06%
13.35%
2.33%
AD
ATA
PenD
rive
PNY
SanD
isk
KIN
GM
AX
King
ston
Lexa
r
Pana
soni
c
Sony
Tosh
iba
Tran
scen
d
Silic
on P
ower
Oth
ers
44
118
553
97113
66
454
40
15
275 281
49
0
Toshiba Transcend Others
HDTV Total PercentageHaier 72 3.42%Hitachi 115 5.46%JVC 70 3.33%LG 182 8.65%Panasonic 193 9.17%Philips 168 7.98%Samsung 440 20.90%Sharp 209 9.93%Sony 414 19.67%Toshiba 242 11.50%Others 0 0.00%Total 2105 100.00%
Memory Card Total PercentageA-DATA 44 2.09%KINGMAX 118 5.61%Kingston 553 26.27%Lexar 97 4.61%Panasonic 66 3.14%PenDrive 113 5.37%PNY 15 0.71%SanDisk 454 21.57%Silicon Power 40 1.90%Sony 275 13.06%Toshiba 281 13.35%Transcend 49 2.33%Others 0 0.00%Total 2105 100.00%
COMPUTERSMotherboard - Intel Chipset
0
100
200
300
400
500
600
700
800
0
100
200
300
400
500
600
Motherboard-Intel Chipset
Freq
uenc
y
ASRock ASUS ECS Gigabyte Intel
MSI Others
178
548
195
528
227
429
0
0.00% (Others)
8.46%
26.04%
9.26%25.08%
10.78%
20.38%
ASR
ock
ASU
S
ECS
Gig
abyt
e
Inte
l
MSI
Oth
ers
Motherboard-AMD Chipset
Freq
uenc
y
ASRock ASUS ECS Gigabyte MSI
Others
153
654
93
575
630
0
0.00% (Others)7.27%
31.06%
4.42%27.32%
29.93%
ASR
ock
ASU
S
ECS
Gig
abyt
e
MSI
Oth
ers
Motherboard - Intel Chipset Total Percentage ASRock 178 8.46%ASUS 548 26.03%ECS 195 9.26%Gigabyte 528 25.08%Intel 227 10.78%MSI 429 20.38%Others 0 0.00%Total 2105 100.00%
Motherboard - AMD Chipset Total PercentageASRock 153 7.27%ASUS 654 31.07%ECS 93 4.42%Gigabyte 575 27.32%MSI 630 29.93%Others 0 0.00%Total 2105 100.00%
Top 3 BrandsASUS | Gigabyte | MSI
Since 2007, ASUS has held on to pole position in our survey when it comes to Intel-based motherboards. Its no diff erent in 2012 as the popular Taiwanese brand secures fi rst place yet again with 26% of our respondents voting for the brand. Gigabyte picks up second spot again with 25% of the vote with MSI again coming in third with 20% of the sample. Intel picks up fourth position again as in 2011 with 10% of the sample.
0
100
200
300
400
500
600
700
800
0
100
200
300
400
500
600
Motherboard-Intel Chipset
Freq
uenc
y
ASRock ASUS ECS Gigabyte Intel
MSI Others
178
548
195
528
227
429
0
0.00% (Others)
8.46%
26.04%
9.26%25.08%
10.78%
20.38%
ASR
ock
ASU
S
ECS
Gig
abyt
e
Inte
l
MSI
Oth
ers
Motherboard-AMD Chipset
Freq
uenc
y
ASRock ASUS ECS Gigabyte MSI
Others
153
654
93
575
630
0
0.00% (Others)7.27%
31.06%
4.42%27.32%
29.93%
ASR
ock
ASU
S
ECS
Gig
abyt
e
MSI
Oth
ers
Motherboard - Intel Chipset Total Percentage ASRock 178 8.46%ASUS 548 26.03%ECS 195 9.26%Gigabyte 528 25.08%Intel 227 10.78%MSI 429 20.38%Others 0 0.00%Total 2105 100.00%
Motherboard - AMD Chipset Total PercentageASRock 153 7.27%ASUS 654 31.07%ECS 93 4.42%Gigabyte 575 27.32%MSI 630 29.93%Others 0 0.00%Total 2105 100.00%
Memory CardADATAKINGMAXKingstonLexarPanasonicPenDrivePNYSanDiskSilicon PowerSonyToshibaTranscendOthersTotal
Total44
1185539766
11315
45440
275281490
2105
Percentage (%)2.095.61
26.264.613.145.370.71
21.571.90
13.0613.352.330.00100
Motherboard - Intel ChipsetASRockASUSECSGigabyteIntelMSIOthersTotal
Total178548195528227429
02105
Percentage (%)8.46
26.049.26
25.0810.7820.380.00100

Top 3 BrandsASUS | MSI | Gigabyte
ASUS is on a roll in the motherboard categories of our 2012 survey. The popular brand
holds on to top spot for the third year running for AMD chipset mobos. 2012 has
seen AMD introduce its latest APUs and Trinity products to spice up the entry-level
and enthusiasts segments here in Malaysia. Consumers still look to AMD for value
motherboards and for the most bang for their buck. For three years now, Malaysians have
voted ASUS (31%), MSI (30%) and Gigabyte (27%) as their top 3 brands .
Motherboard - AMD Chipset
0
100
200
300
400
500
600
700
800
0
100
200
300
400
500
600
Motherboard-Intel Chipset
Freq
uenc
y
ASRock ASUS ECS Gigabyte Intel
MSI Others
178
548
195
528
227
429
0
0.00% (Others)
8.46%
26.04%
9.26%25.08%
10.78%
20.38%
ASR
ock
ASU
S
ECS
Gig
abyt
e
Inte
l
MSI
Oth
ers
Motherboard-AMD Chipset
Freq
uenc
y
ASRock ASUS ECS Gigabyte MSI
Others
153
654
93
575
630
0
0.00% (Others)7.27%
31.06%
4.42%27.32%
29.93%
ASR
ock
ASU
S
ECS
Gig
abyt
e
MSI
Oth
ers
Motherboard - Intel Chipset Total Percentage ASRock 178 8.46%ASUS 548 26.03%ECS 195 9.26%Gigabyte 528 25.08%Intel 227 10.78%MSI 429 20.38%Others 0 0.00%Total 2105 100.00%
Motherboard - AMD Chipset Total PercentageASRock 153 7.27%ASUS 654 31.07%ECS 93 4.42%Gigabyte 575 27.32%MSI 630 29.93%Others 0 0.00%Total 2105 100.00%
0
100
200
300
400
500
600
700
800
0
100
200
300
400
500
600
Motherboard-Intel ChipsetFr
eque
ncy
ASRock ASUS ECS Gigabyte Intel
MSI Others
178
548
195
528
227
429
0
0.00% (Others)
8.46%
26.04%
9.26%25.08%
10.78%
20.38%
ASR
ock
ASU
S
ECS
Gig
abyt
e
Inte
l
MSI
Oth
ers
Motherboard-AMD Chipset
Freq
uenc
y
ASRock ASUS ECS Gigabyte MSI
Others
153
654
93
575
630
0
0.00% (Others)7.27%
31.06%
4.42%27.32%
29.93%
ASR
ock
ASU
S
ECS
Gig
abyt
e
MSI
Oth
ers
Motherboard - Intel Chipset Total Percentage ASRock 178 8.46%ASUS 548 26.03%ECS 195 9.26%Gigabyte 528 25.08%Intel 227 10.78%MSI 429 20.38%Others 0 0.00%Total 2105 100.00%
Motherboard - AMD Chipset Total PercentageASRock 153 7.27%ASUS 654 31.07%ECS 93 4.42%Gigabyte 575 27.32%MSI 630 29.93%Others 0 0.00%Total 2105 100.00%
Motherboard - AMD ChipsetASRockASUSECSGigabyteMSIOthersTotal
Total15365493
575630
02105
Percentage (%)7.27
31.064.42
27.3229.930.00100
Processor
2.23%
2.71%
2.52%
0
100
200
300
400
500
600
700
800
900
1000
0
360
720
1080
1440
1800
Processor
Freq
uenc
y
AMD Intel
564
1541
73.21%
26.79%
AM
D
Inte
l
Memory (RAM)
Freq
uenc
y
ADATA APOGEE Corsair KINGMAX Kingston
OCZ
Others
StrontiumSilicon Power Transcend Winova
9059
442414
725
8553 57
133
47
0
4.28%
0.00% (Others)
2.8%
21.00%
19.67%34.43%
4.04%
AD
ATA
APO
GEE
Cors
air
KIN
GM
AX
King
ston
OCZ
Silic
on P
ower
Stro
ntiu
m
Tran
scen
d
Win
ova
Oth
ers
6.32%
Processor Total PercentageAMD 564 26.79%Intel 1541 73.21%Total 2105 100.00%
Memory (RAM) Total PercentageADATA 90 4.28%APOGEE 59 2.80%Corsair 442 21.00%KINGMAX 414 19.67%Kingston 725 34.44%OCZ 85 4.04%Silicon Power 53 2.52%Strontium 57 2.71%Transcend 133 6.32%Winova 47 2.23%Others 0 0.00%Total 2105 100.00%
Top BrandIntel
Ever since our fi rst poll back in 2003, Intel and AMD have been slugging it out in our Processor category. For 10 years now Intel has been emerging as outright winner, commanding two thirds of the poll’s sample, every single year. Intel has indeed been one of the most impressive brands in our survey and caps off a decade of excellence with 73% of the 2012 poll. AMD, as always has to settle for second spot with 27% of our respondents returning them as runners-up.
ProcessorAMDIntelTotal
Total564
15412105
Percentage (%)26.7973.21100
2.23%
2.71%
2.52%
0
100
200
300
400
500
600
700
800
900
1000
0
360
720
1080
1440
1800
Processor
Freq
uenc
y
AMD Intel
564
1541
73.21%
26.79%
AM
D
Inte
l
Memory (RAM)
Freq
uenc
y
ADATA APOGEE Corsair KINGMAX Kingston
OCZ
Others
StrontiumSilicon Power Transcend Winova
9059
442414
725
8553 57
133
47
0
4.28%
0.00% (Others)
2.8%
21.00%
19.67%34.43%
4.04%
AD
ATA
APO
GEE
Cors
air
KIN
GM
AX
King
ston
OCZ
Silic
on P
ower
Stro
ntiu
m
Tran
scen
d
Win
ova
Oth
ers
6.32%
Processor Total PercentageAMD 564 26.79%Intel 1541 73.21%Total 2105 100.00%
Memory (RAM) Total PercentageADATA 90 4.28%APOGEE 59 2.80%Corsair 442 21.00%KINGMAX 414 19.67%Kingston 725 34.44%OCZ 85 4.04%Silicon Power 53 2.52%Strontium 57 2.71%Transcend 133 6.32%Winova 47 2.23%Others 0 0.00%Total 2105 100.00%

Top 3 BrandsKingston | Corsair | KINGMAX
Just like Intel, popular memory maker, Kingston continues to rewrite the history books
in the Memory category of our brand survey. It has been 10 years now that Kingston has
proven to be the most popular memory maker in the land. The 2012 survey sees them
securing 34% of the vote with Corsair (21%) and KINGMAX (19%) retaining second and
third spots again.
Graphics Card - AMD Radeon Chipset
0.00% (Others)
0
100
200
300
400
500
600
700
800
0
100
200
300
400
500
600
700
800
Graphics Card-AMD Radeon Chipset
Freq
uenc
y
ASUS AXLE Gigabyte MSI PALIT
PowerColor Sapphire XFX Others
367
86
0
17.43%
4.09%
25.9%
18.76%
4.70%
4.13%
23.61%
1.38%0.00% (Others)
ASU
S
AXL
E
545
Gig
abyt
e
395
99
MSI
87
PALI
T
Pow
erC
olo
r
497
Sap
ph
ire
29
XFX
Oth
ers
Graphics Card-NVIDIA Chipset
Freq
uenc
y
ASUS Gainward Gigabyte Leadtek MSI
PALIT XFX Zotac Others
396
73
436
124
406
501
51
118
0
18.81%
3.47%
20.71%
19.29%
23.80%
5.89%
2.42% 5.61%
ASU
S
Gai
nwar
d
Gig
abyt
e
Lead
tek
MSI
PALI
T
XFX
Zota
c
Oth
ers
Graphics Card – AMD Radeon Chipset Total PercentageASUS 367 17.43%AXLE 86 4.09%Gigabyte 545 25.89%MSI 395 18.76%PALIT 99 4.70%PowerColor 87 4.13%Sapphire 497 23.61%XFX 29 1.38%Others 0 0.00%Total 2105 100.00%
Graphics Card - NVIDIA Chipset Total PercentageASUS 396 18.81%Gainward 73 3.47%Gigabyte 436 20.71%Leadtek 406 19.29%MSI 501 23.80%PALIT 124 5.89%XFX 51 2.42%Zotac 118 5.61%Others 0 0.00%Total 2105 100.00%
Top BrandsGigabyte | Sapphire | MSI
Gigabyte has bucked the trend this year and risen to top spot for AMD Radeon graphics
cards in our survey for the fi rst time. The popular Taiwanese brand secures top spot with
26% of our respondents nodding in their favor. Well known brand, Sapphire holds on to
second spot again this year by picking up 24% of the 2012 sample. Third spot in this year’s
survey goes to MSI with 19% of our pollsters voting for them.
0.00% (Others)
0
100
200
300
400
500
600
700
800
0
100
200
300
400
500
600
700
800
Graphics Card-AMD Radeon Chipset
Freq
uenc
y
ASUS AXLE Gigabyte MSI PALIT
PowerColor Sapphire XFX Others
367
86
0
17.43%
4.09%
25.9%
18.76%
4.70%
4.13%
23.61%
1.38%0.00% (Others)
ASU
S
AXL
E
545
Gig
abyt
e
395
99
MSI
87
PALI
T
Pow
erC
olo
r
497
Sap
ph
ire
29
XFX
Oth
ers
Graphics Card-NVIDIA Chipset
Freq
uenc
y
ASUS Gainward Gigabyte Leadtek MSI
PALIT XFX Zotac Others
396
73
436
124
406
501
51
118
0
18.81%
3.47%
20.71%
19.29%
23.80%
5.89%
2.42% 5.61%
ASU
S
Gai
nwar
d
Gig
abyt
e
Lead
tek
MSI
PALI
T
XFX
Zota
c
Oth
ers
Graphics Card – AMD Radeon Chipset Total PercentageASUS 367 17.43%AXLE 86 4.09%Gigabyte 545 25.89%MSI 395 18.76%PALIT 99 4.70%PowerColor 87 4.13%Sapphire 497 23.61%XFX 29 1.38%Others 0 0.00%Total 2105 100.00%
Graphics Card - NVIDIA Chipset Total PercentageASUS 396 18.81%Gainward 73 3.47%Gigabyte 436 20.71%Leadtek 406 19.29%MSI 501 23.80%PALIT 124 5.89%XFX 51 2.42%Zotac 118 5.61%Others 0 0.00%Total 2105 100.00%
Memory (RAM) 2.23%
2.71%
2.52%
0
100
200
300
400
500
600
700
800
900
1000
0
360
720
1080
1440
1800
Processor
Freq
uenc
y
AMD Intel
564
1541
73.21%
26.79%
AM
D
Inte
l
Memory (RAM)
Freq
uenc
y
ADATA APOGEE Corsair KINGMAX Kingston
OCZ
Others
StrontiumSilicon Power Transcend Winova
9059
442414
725
8553 57
133
47
0
4.28%
0.00% (Others)
2.8%
21.00%
19.67%34.43%
4.04%
AD
ATA
APO
GEE
Cors
air
KIN
GM
AX
King
ston
OCZ
Silic
on P
ower
Stro
ntiu
m
Tran
scen
d
Win
ova
Oth
ers
6.32%
Processor Total PercentageAMD 564 26.79%Intel 1541 73.21%Total 2105 100.00%
Memory (RAM) Total PercentageADATA 90 4.28%APOGEE 59 2.80%Corsair 442 21.00%KINGMAX 414 19.67%Kingston 725 34.44%OCZ 85 4.04%Silicon Power 53 2.52%Strontium 57 2.71%Transcend 133 6.32%Winova 47 2.23%Others 0 0.00%Total 2105 100.00%
2.23%
2.71%
2.52%
0
100
200
300
400
500
600
700
800
900
1000
0
360
720
1080
1440
1800
ProcessorFr
eque
ncy
AMD Intel
564
1541
73.21%
26.79%
AM
D
Inte
l
Memory (RAM)
Freq
uenc
y
ADATA APOGEE Corsair KINGMAX Kingston
OCZ
Others
StrontiumSilicon Power Transcend Winova
9059
442414
725
8553 57
133
47
0
4.28%
0.00% (Others)
2.8%
21.00%
19.67%34.43%
4.04%
AD
ATA
APO
GEE
Cors
air
KIN
GM
AX
King
ston
OCZ
Silic
on P
ower
Stro
ntiu
m
Tran
scen
d
Win
ova
Oth
ers
6.32%
Processor Total PercentageAMD 564 26.79%Intel 1541 73.21%Total 2105 100.00%
Memory (RAM) Total PercentageADATA 90 4.28%APOGEE 59 2.80%Corsair 442 21.00%KINGMAX 414 19.67%Kingston 725 34.44%OCZ 85 4.04%Silicon Power 53 2.52%Strontium 57 2.71%Transcend 133 6.32%Winova 47 2.23%Others 0 0.00%Total 2105 100.00%
Memory (RAM)ADATAAPOGEECorsairKINGMAXKingstonOCZSilicon PowerStrontiumTranscendWinovaOthersTotal
Total9059
442414725855357
133470
2105
Percentage (%)4.282.80
21.0019.6734.434.042.522.716.322.230.00100
Graphics Card – AMD Radeon ChipsetASUSAXLEGigabyteMSIPALITPowerColorSapphireXFXOthersTotal
Total36786
5453959987
497290
2105
Percentage (%)17.434.0925.9
18.764.704.13
23.611.380.00100

Hard Disk Drive (Internal)
0
200
400
600
800
1000
Hard Disk Drive (Internal)
Freq
uenc
y
Samsung Seagate Western Digital Others
627
0
0.00% (Others)
29.79%
38.71%
31.50%815
Sam
sung
663
Seag
ate
Wes
tern
Dig
ital
Oth
ers
0.00% (Others)
7.55%
3.23%
13.82%
4.51%
2.42%
5.42%
8.60%
1.62%5.51%
15.15%
3.04%
3.28%
8.31%
17.54%
0
80
160
240
320
400
Hard Disk Drive (External / Portable)
Freq
uenc
y
ADATA Apacer Bu�alo Imation Freecom
IO Data KINGMAX Memorex Samsung Seagate
Silicon Toshiba Transcend Western Digital Others
68
159
291
95
51
114
181
34
116
319
64 69
175
369
0
AD
ATA
Imat
ion
Free
com
IO D
ata
KIN
GM
AX
Mem
orex
Sam
sung
Seag
ate
Silic
on P
ower
Tosh
iba
Tran
scen
d
Wes
tern
Dig
ital
Apa
cer
Bu�a
lo
Oth
ers
Hard Disk Drive (Internal) Total PercentageSamsung 627 29.79%Seagate 815 38.72%Western Digital 663 31.50%Others 0 0.00%Total 2105 100.00%
Hard Disk Drive (External / Portable) Total PercentageADATA 68 3.23%Apacer 159 7.55%Buffalo 291 13.82%Imation 95 4.51%Freecom 51 2.42%IO Data 114 5.42%KINGMAX 181 8.60%Memorex 34 1.62%Samsung 116 5.51%Seagate 319 15.15%Silicon Power 64 3.04%Toshiba 69 3.28%Transcend 175 8.31%Western Digital 369 17.53%Others 0 0.00%Total 2105 100.00%
Top 3 BrandsSeagate | Western Digital | Samsung
With last year’s fl ooding in Thailand now a distant memory, HDD prices the world over
are more stable today. One thing hasn’t changed though; Malaysians are still gobbling
up storage like there’s no tomorrow for their digital media. In our 2012 survey, Malaysians
have voted for Seagate (39%), Western Digital (31%) and Samsung (30%) as their top three
brands for HDDs.
0
200
400
600
800
1000
Hard Disk Drive (Internal)
Freq
uenc
y
Samsung Seagate Western Digital Others
627
0
0.00% (Others)
29.79%
38.71%
31.50%815
Sam
sung
663
Seag
ate
Wes
tern
Dig
ital
Oth
ers
0.00% (Others)
7.55%
3.23%
13.82%
4.51%
2.42%
5.42%
8.60%
1.62%5.51%
15.15%
3.04%
3.28%
8.31%
17.54%
0
80
160
240
320
400
Hard Disk Drive (External / Portable)
Freq
uenc
y
ADATA Apacer Bu�alo Imation Freecom
IO Data KINGMAX Memorex Samsung Seagate
Silicon Toshiba Transcend Western Digital Others
68
159
291
95
51
114
181
34
116
319
64 69
175
369
0
AD
ATA
Imat
ion
Free
com
IO D
ata
KIN
GM
AX
Mem
orex
Sam
sung
Seag
ate
Silic
on P
ower
Tosh
iba
Tran
scen
d
Wes
tern
Dig
ital
Apa
cer
Bu�a
lo
Oth
ers
Hard Disk Drive (Internal) Total PercentageSamsung 627 29.79%Seagate 815 38.72%Western Digital 663 31.50%Others 0 0.00%Total 2105 100.00%
Hard Disk Drive (External / Portable) Total PercentageADATA 68 3.23%Apacer 159 7.55%Buffalo 291 13.82%Imation 95 4.51%Freecom 51 2.42%IO Data 114 5.42%KINGMAX 181 8.60%Memorex 34 1.62%Samsung 116 5.51%Seagate 319 15.15%Silicon Power 64 3.04%Toshiba 69 3.28%Transcend 175 8.31%Western Digital 369 17.53%Others 0 0.00%Total 2105 100.00%
Hard Disk Drive (Internal) SamsungSeagateWestern DigitalOthersTotal
Total627815663
02105
Percentage (%)29.7938.7131.500.00100
Graphics Card - NVIDIA Chipset 0.00% (Others)
0
100
200
300
400
500
600
700
800
0
100
200
300
400
500
600
700
800
Graphics Card-AMD Radeon Chipset
Freq
uenc
y
ASUS AXLE Gigabyte MSI PALIT
PowerColor Sapphire XFX Others
367
86
0
17.43%
4.09%
25.9%
18.76%
4.70%
4.13%
23.61%
1.38%0.00% (Others)
ASU
S
AXL
E
545
Gig
abyt
e
395
99
MSI
87
PALI
T
Pow
erC
olo
r
497
Sap
ph
ire
29
XFX
Oth
ers
Graphics Card-NVIDIA Chipset
Freq
uenc
y
ASUS Gainward Gigabyte Leadtek MSI
PALIT XFX Zotac Others
396
73
436
124
406
501
51
118
0
18.81%
3.47%
20.71%
19.29%
23.80%
5.89%
2.42% 5.61%
ASU
S
Gai
nwar
d
Gig
abyt
e
Lead
tek
MSI
PALI
T
XFX
Zota
c
Oth
ers
Graphics Card – AMD Radeon Chipset Total PercentageASUS 367 17.43%AXLE 86 4.09%Gigabyte 545 25.89%MSI 395 18.76%PALIT 99 4.70%PowerColor 87 4.13%Sapphire 497 23.61%XFX 29 1.38%Others 0 0.00%Total 2105 100.00%
Graphics Card - NVIDIA Chipset Total PercentageASUS 396 18.81%Gainward 73 3.47%Gigabyte 436 20.71%Leadtek 406 19.29%MSI 501 23.80%PALIT 124 5.89%XFX 51 2.42%Zotac 118 5.61%Others 0 0.00%Total 2105 100.00%
Top 3 BrandsMSI | Gigabyte | Leadtek
The GeForce brand is synonymous with leading tech and gaming graphics here
in Malaysia. 2012 has seen NVIDIA move ahead of the pack even further with their
revolutionary Kepler GPUs and Tegra mobile graphics chipsets. In the 2012 survey,
Malaysians have once again voted for MSI (24%) as their brand of choice for NVIDIA
chipset graphic cards while Gigabyte moves into second spot with 21% of the sample
nodding in their favor. Leadtek surprises everyone and picks up third place with 19% of
the sample; beating off traditional heavyweights ASUS in the process.
0.00% (Others)
0
100
200
300
400
500
600
700
800
0
100
200
300
400
500
600
700
800
Graphics Card-AMD Radeon ChipsetFr
eque
ncy
ASUS AXLE Gigabyte MSI PALIT
PowerColor Sapphire XFX Others
367
86
0
17.43%
4.09%
25.9%
18.76%
4.70%
4.13%
23.61%
1.38%0.00% (Others)
ASU
S
AXL
E
545
Gig
abyt
e
395
99
MSI
87
PALI
T
Pow
erC
olo
r
497
Sap
ph
ire
29
XFX
Oth
ers
Graphics Card-NVIDIA Chipset
Freq
uenc
y
ASUS Gainward Gigabyte Leadtek MSI
PALIT XFX Zotac Others
396
73
436
124
406
501
51
118
0
18.81%
3.47%
20.71%
19.29%
23.80%
5.89%
2.42% 5.61%
ASU
S
Gai
nwar
d
Gig
abyt
e
Lead
tek
MSI
PALI
T
XFX
Zota
c
Oth
ers
Graphics Card – AMD Radeon Chipset Total PercentageASUS 367 17.43%AXLE 86 4.09%Gigabyte 545 25.89%MSI 395 18.76%PALIT 99 4.70%PowerColor 87 4.13%Sapphire 497 23.61%XFX 29 1.38%Others 0 0.00%Total 2105 100.00%
Graphics Card - NVIDIA Chipset Total PercentageASUS 396 18.81%Gainward 73 3.47%Gigabyte 436 20.71%Leadtek 406 19.29%MSI 501 23.80%PALIT 124 5.89%XFX 51 2.42%Zotac 118 5.61%Others 0 0.00%Total 2105 100.00%
Graphics Card - NVIDIA ChipsetASUSGainwardGigabyteLeadtek MSIPALITXFXZotacOthersTotal
Total39673
43640650112451
1180
2105
Percentage (%)18.813.47
20.7119.2923.805.892.425.610.00100

Hard Disk Drive (External / Portable)
0
200
400
600
800
1000
Hard Disk Drive (Internal)
Freq
uenc
y
Samsung Seagate Western Digital Others
627
0
0.00% (Others)
29.79%
38.71%
31.50%815
Sam
sung
663
Seag
ate
Wes
tern
Dig
ital
Oth
ers
0.00% (Others)
7.55%
3.23%
13.82%
4.51%
2.42%
5.42%
8.60%
1.62%5.51%
15.15%
3.04%
3.28%
8.31%
17.54%
0
80
160
240
320
400
Hard Disk Drive (External / Portable)
Freq
uenc
y
ADATA Apacer Bu�alo Imation Freecom
IO Data KINGMAX Memorex Samsung Seagate
Silicon Toshiba Transcend Western Digital Others
68
159
291
95
51
114
181
34
116
319
64 69
175
369
0
AD
ATA
Imat
ion
Free
com
IO D
ata
KIN
GM
AX
Mem
orex
Sam
sung
Seag
ate
Silic
on P
ower
Tosh
iba
Tran
scen
d
Wes
tern
Dig
ital
Apa
cer
Bu�a
lo
Oth
ers
Hard Disk Drive (Internal) Total PercentageSamsung 627 29.79%Seagate 815 38.72%Western Digital 663 31.50%Others 0 0.00%Total 2105 100.00%
Hard Disk Drive (External / Portable) Total PercentageADATA 68 3.23%Apacer 159 7.55%Buffalo 291 13.82%Imation 95 4.51%Freecom 51 2.42%IO Data 114 5.42%KINGMAX 181 8.60%Memorex 34 1.62%Samsung 116 5.51%Seagate 319 15.15%Silicon Power 64 3.04%Toshiba 69 3.28%Transcend 175 8.31%Western Digital 369 17.53%Others 0 0.00%Total 2105 100.00%
Top 3 BrandsWestern Digital | Seagate | Buff alo
External/portable HDDs are becoming more popular with consumers who want to take
their videos, photos and data everywhere they go. As prices for these drives become more
aff ordable and capacities move to the Terabyte, Malaysians today know which brands they
want most. Just as in the 2011 survey, our pollsters have once again voted for the same
three brands in 2012: Western Digital (17%), Seagate (15%) and Buff alo (14%).
0
200
400
600
800
1000
Hard Disk Drive (Internal)Fr
eque
ncy
Samsung Seagate Western Digital Others
627
0
0.00% (Others)
29.79%
38.71%
31.50%815
Sam
sung
663
Seag
ate
Wes
tern
Dig
ital
Oth
ers
0.00% (Others)
7.55%
3.23%
13.82%
4.51%
2.42%
5.42%
8.60%
1.62%5.51%
15.15%
3.04%
3.28%
8.31%
17.54%
0
80
160
240
320
400
Hard Disk Drive (External / Portable)
Freq
uenc
y
ADATA Apacer Bu�alo Imation Freecom
IO Data KINGMAX Memorex Samsung Seagate
Silicon Toshiba Transcend Western Digital Others
68
159
291
95
51
114
181
34
116
319
64 69
175
369
0
AD
ATA
Imat
ion
Free
com
IO D
ata
KIN
GM
AX
Mem
orex
Sam
sung
Seag
ate
Silic
on P
ower
Tosh
iba
Tran
scen
d
Wes
tern
Dig
ital
Apa
cer
Bu�a
lo
Oth
ers
Hard Disk Drive (Internal) Total PercentageSamsung 627 29.79%Seagate 815 38.72%Western Digital 663 31.50%Others 0 0.00%Total 2105 100.00%
Hard Disk Drive (External / Portable) Total PercentageADATA 68 3.23%Apacer 159 7.55%Buffalo 291 13.82%Imation 95 4.51%Freecom 51 2.42%IO Data 114 5.42%KINGMAX 181 8.60%Memorex 34 1.62%Samsung 116 5.51%Seagate 319 15.15%Silicon Power 64 3.04%Toshiba 69 3.28%Transcend 175 8.31%Western Digital 369 17.53%Others 0 0.00%Total 2105 100.00%
LCD Monitor
Top 3 BrandsSamsung | LG | AOC
2012 continues to see more 3D and LED backlit monitors entering the local market and
the models we are seeing are getting larger but slimmer too. Large widescreen models
that are over 23” have started to become the current sweetspot for displays while more
and more models are coming fi tted with HDMI and DisplayPort connectors. For a decade
now, Samsung has been picking up top spot in this category. 2012 is no diff erent as the
Korean giant places fi rst with 21% of the sample. LG leaps into second place with 15% of
the overall vote and AOC settles for third spot again with 10%.
LCD Monitor AcerAlienwareAOCASUSBenQDellEnvisionFujitsuHPLGPhilipsSamsungOthersTotal
Total19176
2241181221998367
125317129451
32105
Percentage (%)9.073.61
10.645.615.809.453.943.185.94
15.066.13
21.430.14100
0
120
240
360
480
600
LCD Monitor
Freq
uenc
y
Philips Samsung Others
Dell Envision Fujitsu HP LG
Acer Alienware AOC ASUS BenQ
3
0.14% (Others)
9.07%
3.61%
10.64%
5.61%
5.80%
9.45%
3.94%3.18%
5.94%
15.06%
6.13%
21.43%
Ace
r
191
224
118 122
199
8367
125
317
129
451
76
Alie
nwar
e
AO
C
ASU
S
BenQ Del
l
Envi
sion
Fujit
su HP LG
Phili
ps
Sam
sung
Oth
ers
LCD Monitor Total PercentageAcer 191 9.07%Alienware 76 3.61%AOC 224 10.64%ASUS 118 5.61%BenQ 122 5.80%Dell 199 9.45%Envision 83 3.94%Fujitsu 67 3.18%HP 125 5.94%LG 317 15.06%Philips 129 6.13%Samsung 451 21.43%Others 3 0.14%Total 2105 100.00%
Hard Disk Drive (External / Portable) ADATAApacerBuff aloImationFreecomIO DataKINGMAXMemorexSamsungSeagateSilicon PowerToshibaTranscendWestern DigitalOthersTotal
Total68
1592919551
11418134
1163196469
175369
02105
Percentage (%)3.237.55
13.824.512.425.428.601.625.51
15.153.043.288.31
17.540.00100

Desktop / AIO0.57%
27.36%
8.79%
28.12%
4.37%
29.50%
1.28%
0.00% (others)
7.13%
18.86%
7.55%
9.41%
20.14%
4.37%
4.09%
13.25%
2.14%
2.80%
10.26%
0
100
200
300
400
500
Desktop/AIO
Laser MFP
Freq
uenc
y
150
397
159
198
424
92 86
279
4559
216
0
0
160
320
480
640
800
Freq
u en c
y
Ace
r
Alie
nwar
e
Del
l
Nat
sys
HP
Shut
tle
Oth
ers
576
185
592621
27 12
92
Brot
her
Cano
n
Epso
n
Fuji
Xero
x
HP
Koni
ca M
inol
ta
Lexm
ark
OKI
Pana
soni
c
Rico
h
Sam
sung
Oth
ers
Acer Alienware
Shuttle Others
Dell Natsys HP
Brother Canon Epson Fuji Xerox HP
Konica Minolta
Samsung Others
Lexmark OKI Panasonic Ricoh
Top 3 BrandsHP | Dell | Acer
Its been three years since we merged our desktop and AIO results into a single category.
While desktops still account for a sizable number of PCs sold, we foresee more and more
Malaysians opting for AIOs over their desktop counterparts in the coming months. Part of
this is because of Windows 8 but other factors like design and functionality also account
for the exodus. Just as in 2011, this year’s poll sees HP (29%), Dell (28%) and Acer (27%)
walking away with the top three spots in our survey.
0.57%
27.36%
8.79%
28.12%
4.37%
29.50%
1.28%
0.00% (others)
7.13%
18.86%
7.55%
9.41%
20.14%
4.37%
4.09%
13.25%
2.14%
2.80%
10.26%
0
100
200
300
400
500
Desktop/AIO
Laser MFP
Freq
uenc
y
150
397
159
198
424
92 86
279
4559
216
0
0
160
320
480
640
800
Freq
u en c
y
Ace
r
Alie
nwar
e
Del
l
Nat
sys
HP
Shut
tle
Oth
ers
576
185
592621
27 12
92
Brot
her
Cano
n
Epso
n
Fuji
Xero
x
HP
Koni
ca M
inol
ta
Lexm
ark
OKI
Pana
soni
c
Rico
h
Sam
sung
Oth
ers
Acer Alienware
Shuttle Others
Dell Natsys HP
Brother Canon Epson Fuji Xerox HP
Konica Minolta
Samsung Others
Lexmark OKI Panasonic Ricoh
Desktop / AIO AcerAlienwareDellNatsysHPShuttleOthersTotal
Total57618559292
6212712
2105
Percentage (%) 27.368.79
28.124.37
29.501.280.57100
Notebook0.10%
15.77%
5.37%
8.36%
6.27%
9.12%
7.22%11.54%
7.93%
4.42%
5.08%
8.69%
10.12%
Notebook
0
80
160
240
320
400
Freq
u en c
y
Ace
r
332
Alie
nwar
e
113
App
le
176
ASU
S
132
Del
l
192
Fujit
su
152
HP
243
Leno
vo
167
MSI
93
Sam
sung
107
Sony
183
Tosh
iba
213O
ther
s
2
Acer Alienware
HP Lenovo SamsungMSIFujitsu
Toshiba OthersSony
Apple ASUS Dell
Top 3 BrandsAcer | HP | Toshiba
2012 has seen tablets and Ultrabooks stealing some of the thunder from notebooks. Still,
with new processors from Intel, better displays and battery life as well as more aff ordable
SSDs adding a little zip to them, notebooks are still very popular among consumers and
the mobile workforce. This year we have 12 brands in this hotly contested category but for
the seventh year running, our respondents have named Acer (16%), HP (11%) and Toshiba
(10%) as their Top 3 Brands. Popular brands Dell, Sony and Apple pick up fourth, fi fth and
sixth placings, respectively.
0.10%
15.77%
5.37%
8.36%
6.27%
9.12%
7.22%11.54%
7.93%
4.42%
5.08%
8.69%
10.12%
Notebook
0
80
160
240
320
400
Freq
u en c
y
Ace
r
332
Alie
nwar
e
113
App
le
176
ASU
S
132
Del
l
192
Fujit
su
152
HP
243
Leno
vo
167
MSI
93
Sam
sung
107
Sony
183
Tosh
iba
213
Oth
ers
2
Acer Alienware
HP Lenovo SamsungMSIFujitsu
Toshiba OthersSony
Apple ASUS Dell
NotebookAcerAlienwareAppleASUSDellFujitsuHPLenovoMSISamsungSonyToshibaOthersTotal
Total33211317613219215224316793
107183213
22105
Percentage (%) 15.775.378.366.279.127.22
11.547.934.425.088.69
10.120.10100
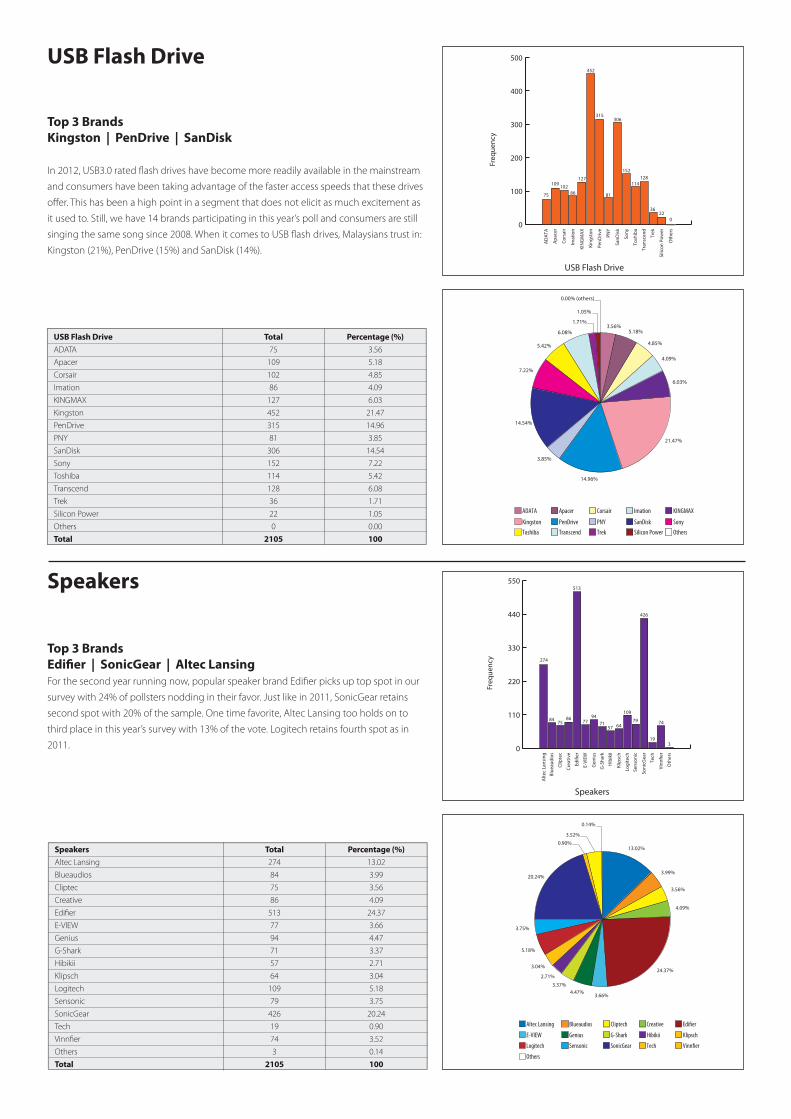
USB Flash Drive
0.00%
14.63%
8.36%
11.21%
9.31%
12.78%
13.54%
7.17%
10.78%
12.21%
Ultrabook
0
80
160
240
320
400
Freq
u en c
y
Ace
r
308
ASU
S
176
Del
l
236
Fujit
su
196
HP
269
Leno
vo
285
Sam
sung
151
Sony
227
Tosh
iba
257
Tosh
iba
0
Acer ASUS
Samsung Sony OthersToshibaLenovo
Dell Fujitsu HP
0.00% (others)
3.56%5.18%
4.85%
4.09%
6.03%
21.47%
14.96%
3.85%
14.54%
7.22%
5.42%
6.08%
1.05%
1.71%
USB Flash Drive
0
100
200
300
400
500
Freq
u en c
y
AD
ATA
75
Apa
cer
109
Cors
air
102
Imat
ion
86
KIN
GM
AX
127
King
ston
452
PenD
rive
315
PNY
81
SanD
isk
306
Sony
152
Tosh
iba
114
Tran
scen
d
128
Trek
36
Silic
on P
ower
22
Oth
ers
0
ADATA Apacer
PenDrive PNY SonySanDiskOthersSilicon Power
Kingston
Corsair Imation KINGMAX
Toshiba Transcend Trek
Top 3 BrandsKingston | PenDrive | SanDisk
In 2012, USB3.0 rated fl ash drives have become more readily available in the mainstream
and consumers have been taking advantage of the faster access speeds that these drives
off er. This has been a high point in a segment that does not elicit as much excitement as
it used to. Still, we have 14 brands participating in this year’s poll and consumers are still
singing the same song since 2008. When it comes to USB fl ash drives, Malaysians trust in:
Kingston (21%), PenDrive (15%) and SanDisk (14%).
0.00%
14.63%
8.36%
11.21%
9.31%
12.78%
13.54%
7.17%
10.78%
12.21%
Ultrabook
0
80
160
240
320
400
Freq
u en c
y
Ace
r
308
ASU
S
176
Del
l
236
Fujit
su
196
HP
269
Leno
vo
285
Sam
sung
151
Sony
227
Tosh
iba
257
Tosh
iba
0
Acer ASUS
Samsung Sony OthersToshibaLenovo
Dell Fujitsu HP
0.00% (others)
3.56%5.18%
4.85%
4.09%
6.03%
21.47%
14.96%
3.85%
14.54%
7.22%
5.42%
6.08%
1.05%
1.71%
USB Flash Drive
0
100
200
300
400
500
Freq
u en c
y
AD
ATA
75
Apa
cer
109
Cors
air
102
Imat
ion
86
KIN
GM
AX
127
King
ston
452Pe
nDriv
e
315
PNY
81
SanD
isk
306
Sony
152
Tosh
iba
114
Tran
scen
d
128
Trek
36
Silic
on P
ower
22
Oth
ers
0
ADATA Apacer
PenDrive PNY SonySanDiskOthersSilicon Power
Kingston
Corsair Imation KINGMAX
Toshiba Transcend Trek
USB Flash DriveADATAApacerCorsairImationKINGMAXKingstonPenDrivePNYSanDiskSonyToshibaTranscendTrekSilicon Power OthersTotal
Total75
10910286
12745231581
30615211412836220
2105
Percentage (%)3.565.184.854.096.03
21.4714.963.85
14.547.225.426.081.711.050.00100
SpeakersAltec LansingBlueaudiosCliptecCreativeEdifi erE-VIEWGeniusG-SharkHibikiiKlipschLogitechSensonicSonicGearTechVinnfi erOthersTotal
Total274847586
5137794715764
10979
42619743
2105
Percentage (%)13.023.993.564.09
24.373.664.473.372.713.045.183.75
20.240.903.520.14100
Speakers0.14%
13.02%
3.99%
3.56%
4.09%
24.37%
3.66%4.47%
3.37%
2.71%
3.04%
5.18%
3.75%
20.24%
0.90%3.52%
Speakers
0
110
220
330
440
550
Freq
u en c
y
Alte
c La
nsin
g
274
Blue
audi
os
84
Clip
tec
75
Crea
tive
86
Edi�
er
513E-
VIEW
77
Gen
ius
94
G-S
hark
71
Hib
ikii
57
Klip
sch
64
Logi
tech
109
Sens
onic
79
Soni
cGea
r
426
Tech
19
Vinn
�er
74
Oth
ers
3
Altec Lansing Blueaudios
Genius G-Shark KlipschHibikiiE-VIEW
Cliptech Creative Edi�er
Logitech Sensonic
Others
SonicGear Tech Vinn�er
0.33%
19.90%
16.20%
0.90%
5.56%
6.13%5.99%
11.78%
15.15%
5.61%
5.80%
2.42%4.23%
Chassis (Casings)
0
100
200
300
400
500
Freq
u en c
y
AVF
341
Cool
er M
aste
r
274
Coug
ar
19
E-VI
EW
117
Gig
abyt
e
129
iCut
e
126
Pow
erLo
gic
248
Silv
erst
one
319
Ther
mal
take
118
Tren
dSon
ic
274
X-Fi
ve
51
Zalm
an
89
Oth
ers
7
AVF Cooler Master
PowerLogic Silverstone TrendSonicThermaltakeiCute
Cougar E-VIEW Gigabyte
X-Five Zalman Others
Top 3 BrandsEdifi er | SonicGear | Altec LansingFor the second year running now, popular speaker brand Edifi er picks up top spot in our
survey with 24% of pollsters nodding in their favor. Just like in 2011, SonicGear retains
second spot with 20% of the sample. One time favorite, Altec Lansing too holds on to
third place in this year’s survey with 13% of the vote. Logitech retains fourth spot as in
2011.
0.14%
13.02%
3.99%
3.56%
4.09%
24.37%
3.66%4.47%
3.37%
2.71%
3.04%
5.18%
3.75%
20.24%
0.90%3.52%
Speakers
0
110
220
330
440
550
Freq
u en c
y
Alte
c La
nsin
g
274
Blue
audi
os
84
Clip
tec
75
Crea
tive
86
Edi�
er
513
E-VI
EW
77
Gen
ius
94
G-S
hark
71
Hib
ikii
57
Klip
sch
64
Logi
tech
109
Sens
onic
79
Soni
cGea
r
426
Tech
19
Vinn
�er
74
Oth
ers
3
Altec Lansing Blueaudios
Genius G-Shark KlipschHibikiiE-VIEW
Cliptech Creative Edi�er
Logitech Sensonic
Others
SonicGear Tech Vinn�er
0.33%
19.90%
16.20%
0.90%
5.56%
6.13%5.99%
11.78%
15.15%
5.61%
5.80%
2.42%4.23%
Chassis (Casings)
0
100
200
300
400
500
Freq
u en c
y
AVF
341
Cool
er M
aste
r
274
Coug
ar
19
E-VI
EW
117
Gig
abyt
e
129
iCut
e
126
Pow
erLo
gic
248
Silv
erst
one
319
Ther
mal
take
118
Tren
dSon
ic
274
X-Fi
ve
51
Zalm
an
89
Oth
ers
7
AVF Cooler Master
PowerLogic Silverstone TrendSonicThermaltakeiCute
Cougar E-VIEW Gigabyte
X-Five Zalman Others

Chassis (Casings)
0.14%
13.02%
3.99%
3.56%
4.09%
24.37%
3.66%4.47%
3.37%
2.71%
3.04%
5.18%
3.75%
20.24%
0.90%3.52%
Speakers
0
110
220
330
440
550
Freq
u en c
y
Alte
c La
nsin
g
274
Blue
audi
os
84
Clip
tec
75
Crea
tive
86
Edi�
er
513
E-VI
EW
77
Gen
ius
94
G-S
hark
71
Hib
ikii
57
Klip
sch
64
Logi
tech
109
Sens
onic
79
Soni
cGea
r
426
Tech
19
Vinn
�er
74
Oth
ers
3
Altec Lansing Blueaudios
Genius G-Shark KlipschHibikiiE-VIEW
Cliptech Creative Edi�er
Logitech Sensonic
Others
SonicGear Tech Vinn�er
0.33%
19.90%
16.20%
0.90%
5.56%
6.13%5.99%
11.78%
15.15%
5.61%
5.80%
2.42%4.23%
Chassis (Casings)
0
100
200
300
400
500
Freq
u en c
y
AVF
341
Cool
er M
aste
r
274
Coug
ar
19
E-VI
EW
117
Gig
abyt
e
129
iCut
e
126
Pow
erLo
gic
248
Silv
erst
one
319
Ther
mal
take
118
Tren
dSon
ic
274
X-Fi
ve
51
Zalm
an
89
Oth
ers
7
AVF Cooler Master
PowerLogic Silverstone TrendSonicThermaltakeiCute
Cougar E-VIEW Gigabyte
X-Five Zalman Others
Top 3 BrandsCooler Master | AVF | Silverstone
While some quarters believe that the traditional desktop PC is on the wane, we can assure
you that casings manufacturers continue to be actively churning out newer and better
designs. Off ering better component management and effi cient airfl ow, today’s casings are
works of beauty as well as feats of engineering excellence. As always, popular Taiwanese
brand Cooler Master continues to sit on top of the honors list for fi ve years now with 20%
of the vote. AVF hangs on to second spot again with 16% while Silverstone moves up to
claim third place with 15% of the sample.
0.14%
13.02%
3.99%
3.56%
4.09%
24.37%
3.66%4.47%
3.37%
2.71%
3.04%
5.18%
3.75%
20.24%
0.90%3.52%
Speakers
0
110
220
330
440
550
Freq
u en c
y
Alte
c La
nsin
g
274
Blue
audi
os
84
Clip
tec
75
Crea
tive
86
Edi�
er
513
E-VI
EW
77
Gen
ius
94
G-S
hark
71
Hib
ikii
57
Klip
sch
64
Logi
tech
109
Sens
onic
79
Soni
cGea
r
426
Tech
19
Vinn
�er
74
Oth
ers
3
Altec Lansing Blueaudios
Genius G-Shark KlipschHibikiiE-VIEW
Cliptech Creative Edi�er
Logitech Sensonic
Others
SonicGear Tech Vinn�er
0.33%
19.90%
16.20%
0.90%
5.56%
6.13%5.99%
11.78%
15.15%
5.61%
5.80%
2.42%4.23%
Chassis (Casings)
0
100
200
300
400
500
Freq
u en c
y
AVF
341
Cool
er M
aste
r
274
Coug
ar
19
E-VI
EW
117
Gig
abyt
e
129
iCut
e
126
Pow
erLo
gic
248
Silv
erst
one
319
Ther
mal
take
118
Tren
dSon
ic
274
X-Fi
ve
51
Zalm
an
89
Oth
ers
7
AVF Cooler Master
PowerLogic Silverstone TrendSonicThermaltakeiCute
Cougar E-VIEW Gigabyte
X-Five Zalman Others
Chassis (Casings)AVFCooler Master CougarE-VIEWGigabyteiCutePowerLogicSilverstoneThermaltakeTrendSonicX-FiveZalmanOthersTotal
Total34141919
11712912624831911812251897
2105
Percentage (%) 16.2019.900.905.566.135.99
11.7815.155.615.802.424.230.33100
Input Devices (i.e. Keyboard & Mouse)0.10%
3.47%6.13%
4.85%
3.23%
2.42%
5.37%
2.09%
2.99%
1.52%
2.61%
1.95%
2.33%
17.48%
13.82%
2.23%
1.52%
14.96%
2.71%3.37%
2.33%
2.52%
Input Devices
0
80
160
240
320
400
Freq
u en c
y
A4T
ech
73
Alie
nwar
e
129
Arm
aged
don
102
AVF
68
Clip
tec
51
Cool
er M
aste
r
113
E-VI
EW
44
Gen
ius
63
Gig
abyt
e
32
G-S
hark
55
Kens
ingt
on
41
Lexm
a
49
Rocc
at
57
Sens
onic
71
Stee
lSer
ies
49
Ther
mal
take
53
Oth
ers
2
Pow
erLo
gic
47
Rapo
o
32
Logi
tech
368
Raze
r
315M
icro
soft
Har
dwar
e
291
A4Tech Alienware
E-VIEW Genius G-SharkGigabyteCooler Master
Armaggeddon AVF Cliptec
Kensingston Lexma
Rapoo
Logitech Microsoft Hardware PowerLogic
Razer
OthersThermaltake
Roccat Sensonic SteelSeries
0.38%
14.92%
5.61%
23.42%
13.82%
3.42%
3.94%
4.66%
4.61%
4.42%
12.68%
3.61%
1.52%2.92%
Power Supply
0
104
208
312
416
520
Freq
u en c
y
AcB
el
314
AVF
118
Cool
er M
aste
r
493
Cors
air
291
Ener
max
72
FSP
83
iCut
e
98
Pow
erLo
gic
97
Seas
onic
93
Silv
erst
one
267
Ther
mal
take
76
XFX
32
Zalm
an
63
Oth
ers
8
AcBel AVF
iCute PowerLogic SilverstoneSeasonicFSP
Cooler Master Corsair Enermax
Thermaltake XFX Zalman Others
Top 3 BrandsLogitech | Razer | Microsoft Hardware
For the past 7 years now in our survey, Logitech has been the undisputed king of
input devices. The 2012 edition confi rms this with the Swiss brand clocking 17% of the
poll. Gaming peripherals specialists, Razer moves up to second spot with 15% of our
respondents saying yes to them. Microsoft Hardware drops to third this year with 14% of
the sample nodding in their favor. Alienware stays in fourth spot again with 6%.
0.10%
3.47%6.13%
4.85%
3.23%
2.42%
5.37%
2.09%
2.99%
1.52%
2.61%
1.95%
2.33%
17.48%
13.82%
2.23%
1.52%
14.96%
2.71%3.37%
2.33%
2.52%
Input Devices
0
80
160
240
320
400
Freq
u en c
y
A4T
ech
73
Alie
nwar
e
129
Arm
aged
don
102
AVF
68
Clip
tec
51
Cool
er M
aste
r
113
E-VI
EW
44
Gen
ius
63
Gig
abyt
e
32
G-S
hark
55
Kens
ingt
on
41
Lexm
a
49
Rocc
at
57
Sens
onic
71
Stee
lSer
ies
49
Ther
mal
take
53
Oth
ers
2
Pow
erLo
gic
47
Rapo
o
32
Logi
tech
368
Raze
r
315
Mic
roso
ft H
ardw
are
291
A4Tech Alienware
E-VIEW Genius G-SharkGigabyteCooler Master
Armaggeddon AVF Cliptec
Kensingston Lexma
Rapoo
Logitech Microsoft Hardware PowerLogic
Razer
OthersThermaltake
Roccat Sensonic SteelSeries
0.38%
14.92%
5.61%
23.42%
13.82%
3.42%
3.94%
4.66%
4.61%
4.42%
12.68%
3.61%
1.52%2.92%
Power Supply
0
104
208
312
416
520
Freq
u en c
y
AcB
el
314
AVF
118
Cool
er M
aste
r
493
Cors
air
291
Ener
max
72
FSP
83
iCut
e
98
Pow
erLo
gic
97
Seas
onic
93
Silv
erst
one
267
Ther
mal
take
76
XFX
32
Zalm
an
63
Oth
ers
8
AcBel AVF
iCute PowerLogic SilverstoneSeasonicFSP
Cooler Master Corsair Enermax
Thermaltake XFX Zalman Others
Input DevicesA4TechAlienwareArmaggeddonAVFCliptecCooler Master E-VIEWGeniusGigabyteG-SharkKensingtonLexmaLogitechMicrosoft HardwarePowerLogicRapooRazerRoccatSensonicSteelSeriesThermaltakeOthersTotal
Total73
1291026851
113446332554149
3682914732
315577149532
2105
Percentage (%)3.476.134.853.232.425.372.092.991.522.611.952.33
17.4813.822.231.52
14.962.713.372.332.520.10100

Power Supply
0.10%
3.47%6.13%
4.85%
3.23%
2.42%
5.37%
2.09%
2.99%
1.52%
2.61%
1.95%
2.33%
17.48%
13.82%
2.23%
1.52%
14.96%
2.71%3.37%
2.33%
2.52%
Input Devices
0
80
160
240
320
400
Freq
u en c
y
A4T
ech
73
Alie
nwar
e
129
Arm
aged
don
102
AVF
68
Clip
tec
51
Cool
er M
aste
r
113
E-VI
EW
44
Gen
ius
63
Gig
abyt
e
32
G-S
hark
55
Kens
ingt
on
41
Lexm
a
49
Rocc
at
57
Sens
onic
71
Stee
lSer
ies
49
Ther
mal
take
53
Oth
ers
2
Pow
erLo
gic
47
Rapo
o
32
Logi
tech
368
Raze
r
315
Mic
roso
ft H
ardw
are
291
A4Tech Alienware
E-VIEW Genius G-SharkGigabyteCooler Master
Armaggeddon AVF Cliptec
Kensingston Lexma
Rapoo
Logitech Microsoft Hardware PowerLogic
Razer
OthersThermaltake
Roccat Sensonic SteelSeries
0.38%
14.92%
5.61%
23.42%
13.82%
3.42%
3.94%
4.66%
4.61%
4.42%
12.68%
3.61%
1.52%2.92%
Power Supply
0
104
208
312
416
520
Freq
u en c
y
AcB
el
314
AVF
118
Cool
er M
aste
r
493
Cors
air
291
Ener
max
72
FSP
83
iCut
e
98
Pow
erLo
gic
97
Seas
onic
93
Silv
erst
one
267
Ther
mal
take
76
XFX
32
Zalm
an
63
Oth
ers
8
AcBel AVF
iCute PowerLogic SilverstoneSeasonicFSP
Cooler Master Corsair Enermax
Thermaltake XFX Zalman Others
Top 3 BrandsCooler Master | AcBel | Corsair
By now, most consumers know all about the advantages of investing in a good power
supply. Not only will a good PSU ensure stable power and maximum performance, it will
also protect your hardware components and increase their lifespan. Newer PSUs are green
and mean at the same time, meaning that while they save on electricity, they don’t skimp
on performance either. Cooler Master makes this category their own and pick up top spot
for 8 years in a row now with 23% of the poll. AcBel stays in second spot again (15%) while
Corsair moves up the ladder and grabs third with 14% of the sample. Fourth place goes to
Silverstone (13%).
0.10%
3.47%6.13%
4.85%
3.23%
2.42%
5.37%
2.09%
2.99%
1.52%
2.61%
1.95%
2.33%
17.48%
13.82%
2.23%
1.52%
14.96%
2.71%3.37%
2.33%
2.52%
Input Devices
0
80
160
240
320
400
Freq
u en c
y
A4T
ech
73
Alie
nwar
e
129
Arm
aged
don
102
AVF
68
Clip
tec
51
Cool
er M
aste
r
113
E-VI
EW
44
Gen
ius
63
Gig
abyt
e
32
G-S
hark
55
Kens
ingt
on
41
Lexm
a
49
Rocc
at
57
Sens
onic
71
Stee
lSer
ies
49
Ther
mal
take
53
Oth
ers
2
Pow
erLo
gic
47
Rapo
o
32
Logi
tech
368
Raze
r
315
Mic
roso
ft H
ardw
are
291
A4Tech Alienware
E-VIEW Genius G-SharkGigabyteCooler Master
Armaggeddon AVF Cliptec
Kensingston Lexma
Rapoo
Logitech Microsoft Hardware PowerLogic
Razer
OthersThermaltake
Roccat Sensonic SteelSeries
0.38%
14.92%
5.61%
23.42%
13.82%
3.42%
3.94%
4.66%
4.61%
4.42%
12.68%
3.61%
1.52%2.92%
Power Supply
0
104
208
312
416
520
Freq
u en c
y
AcB
el
314
AVF
118
Cool
er M
aste
r
493
Cors
air
291
Ener
max
72
FSP
83
iCut
e
98
Pow
erLo
gic
97
Seas
onic
93
Silv
erst
one
267
Ther
mal
take
76
XFX
32
Zalm
an
63
Oth
ers
8
AcBel AVF
iCute PowerLogic SilverstoneSeasonicFSP
Cooler Master Corsair Enermax
Thermaltake XFX Zalman Others
Power SupplyAcBelAVFCooler Master CorsairEnermaxFSPiCutePowerLogicSeasonicSilverstoneThermaltakeXFXZalmanOthersTotal
Total3141184932917283989793
2677632638
2105
Percentage (%)14.925.61
23.4213.823.423.944.664.614.42
12.683.611.522.990.38100
Wireless Networking0.19%
6.32%
18.72%
12.26%
9.07%21.00%
3.04%
3.85%
18.48%
4.04%3.04%
Wireless Networking
0
100
200
300
400
500
Freq
u en c
y
ASU
S
133
Azt
ech
394
Belk
in
258
Bu�a
lo
191
D-L
ink
442Ed
imax
64
Leve
lOne
81
TP-L
ink
389
Tren
dnet
85
ZyXE
l
64
Oth
ers
4
ASUS Aztech Belkin Bu�alo D-Link
EdimaxOthers
LevelOne TP-Link Trendnet ZyXEL
Top 3 BrandsD-Link | Aztech | TP-Link
With most of us owning smartphones and tablets these days, wireless networking is no
longer a luxury but an indispensable necessity. Wireless-N networking devices are very
aff ordable these days and most homes in urban areas are already running some form of
wireless network thanks to UniFi. 10 brands competed for honors in the 2012 survey and
our respondents selected D-Link (21%) for the sixth year running as the No.1 brand for
wireless networking products. Aztech secures second spot yet again with 19% of the vote
and popular value brand, TP-Link snatches third spot with 18% of the sample.
0.19%
6.32%
18.72%
12.26%
9.07%21.00%
3.04%
3.85%
18.48%
4.04%3.04%
Wireless Networking
0
100
200
300
400
500
Freq
u en c
y
ASU
S
133
Azt
ech
394
Belk
in
258
Bu�a
lo
191
D-L
ink
442
Edim
ax
64
Leve
lOne
81
TP-L
ink
389
Tren
dnet
85
ZyXE
l
64
Oth
ers
4
ASUS Aztech Belkin Bu�alo D-Link
EdimaxOthers
LevelOne TP-Link Trendnet ZyXEL
Wireless NetworkingASUSAztechBelkinBuff aloD-LinkEdimaxLevelOneTP-LinkTrendnetZyXELOthersTotal
Total1333942581914426481
38985644
2105
Percentage (%)6.32
18.7212.269.07
21.003.043.85
18.484.043.040.19100

SMB (SMALL MEDIUM BUSINESS)Laser MFP
0.57%
27.36%
8.79%
28.12%
4.37%
29.50%
1.28%
0.00% (others)
7.13%
18.86%
7.55%
9.41%
20.14%
4.37%
4.09%
13.25%
2.14%
2.80%
10.26%
0
100
200
300
400
500
Desktop/AIO
Laser MFP
Freq
uenc
y
150
397
159
198
424
92 86
279
4559
216
0
0
160
320
480
640
800
Freq
u en c
y
Ace
r
Alie
nwar
e
Del
l
Nat
sys
HP
Shut
tle
Oth
ers
576
185
592621
27 12
92
Brot
her
Cano
n
Epso
n
Fuji
Xero
x
HP
Koni
ca M
inol
ta
Lexm
ark
OKI
Pana
soni
c
Rico
h
Sam
sung
Oth
ers
Acer Alienware
Shuttle Others
Dell Natsys HP
Brother Canon Epson Fuji Xerox HP
Konica Minolta
Samsung Others
Lexmark OKI Panasonic Ricoh
Top 3 BrandsHP | Canon | OKI
In 2012, laser MFPs, regardless of whether they are monochrome or color, continue to get
more aff ordable while off ering better features and fl exibility. This is indeed good news for
consumers with high print requirements looking to invest in a printer that does more than
just print. In the 2012 poll, popular brand HP (20%) rises to the top of the charts, displacing
Canon (19%) in the process. OKI (13%) snaps up third place in our survey, with Samsung
(10%) picking up fourth spot.
0.57%
27.36%
8.79%
28.12%
4.37%
29.50%
1.28%
0.00% (others)
7.13%
18.86%
7.55%
9.41%
20.14%
4.37%
4.09%
13.25%
2.14%
2.80%
10.26%
0
100
200
300
400
500
Desktop/AIO
Laser MFP
Freq
uenc
y
150
397
159
198
424
92 86
279
4559
216
0
0
160
320
480
640
800
Freq
u en c
y
Ace
r
Alie
nwar
e
Del
l
Nat
sys
HP
Shut
tle
Oth
ers
576
185
592621
27 12
92
Brot
her
Cano
n
Epso
n
Fuji
Xero
x
HP
Koni
ca M
inol
ta
Lexm
ark
OKI
Pana
soni
c
Rico
h
Sam
sung
Oth
ers
Acer Alienware
Shuttle Others
Dell Natsys HP
Brother Canon Epson Fuji Xerox HP
Konica Minolta
Samsung Others
Lexmark OKI Panasonic Ricoh
Laser MFPBrotherCanonEpsonFuji XeroxHPKonica MinoltaLexmarkOKIPanasonicRicohSamsungOthersTotal
Total1503971591984249286
2794559
2160
2105
Percentage (%)7.13
18.867.559.41
20.144.374.09
13.252.142.80
10.260.00100
Inkjet MFP 0.00% (others)
16.48%
27.98%
12.21%
25.61%
11.69%
6.03%
0.14% (others)
8.60%
9.17%
5.56%
6.98%
7.27%
3.18%
20.57%
1.66%
17.53%
19.33%
0
100
200
300
400
500
Inkjet MFP
NAS
Freq
uenc
y
181
0
120
240
360
480
600
Freq
u en c
y
Brot
her
347
Cano
n
589Ep
son
257
HP
539
Lexm
ark
246
Sam
sung
127
Sam
sung
0
Bu�a
lo
193
D-L
ink
117
Dat
aTal
e
147
Dro
bo
153
NET
GEA
R
67
Pega
sus
433
Syno
logy
35
Terr
a M
aste
r
369
Thec
us
407
QN
AP
3
Oth
ers
Brother Canon
OthersSamsung
Epson HP Lexmark
Bu�alo D-Link DataTale Drobo NETGEAR Pegasus
QNAP OthersSynology Terra Master Thecus
Top 3 BrandsCanon | HP | Brother
The inkjet MFP printer is the workhorse of the SOHO and home user. Those looking for
fl exibility, features and value in a small footprint printer normally end up with one of these
printers. Even more aff ordable in 2012, these devices now add performance and features
to their long list of accolades. This year, our respondents voted Canon (28%), HP (25%) and
Brother (16%) as their inkjet MFP brands of choice.
Inkjet MFPBrotherCanonEPSONHPLexmarkSamsungOthersTotal
Total347589257539246127
02105
Percentage (%)16.4827.9812.2125.6111.696.030.00100
0.00% (others)
16.48%
27.98%
12.21%
25.61%
11.69%
6.03%
0.14% (others)
8.60%
9.17%
5.56%
6.98%
7.27%
3.18%
20.57%
1.66%
17.53%
19.33%
0
100
200
300
400
500
Inkjet MFP
NAS
Freq
uenc
y
181
0
120
240
360
480
600
Freq
u en c
y
Brot
her
347
Cano
n
589
Epso
n
257
HP
539
Lexm
ark
246
Sam
sung
127
Sam
sung
0
Bu�a
lo
193
D-L
ink
117
Dat
aTal
e
147
Dro
bo
153
NET
GEA
R
67
Pega
sus
433
Syno
logy
35
Terr
a M
aste
r
369
Thec
us
407
QN
AP
3
Oth
ers
Brother Canon
OthersSamsung
Epson HP Lexmark
Bu�alo D-Link DataTale Drobo NETGEAR Pegasus
QNAP OthersSynology Terra Master Thecus

NAS
0.00% (others)
16.48%
27.98%
12.21%
25.61%
11.69%
6.03%
0.14% (others)
8.60%
9.17%
5.56%
6.98%
7.27%
3.18%
20.57%
1.66%
17.53%
19.33%
0
100
200
300
400
500
Inkjet MFP
NAS
Freq
uenc
y
181
0
120
240
360
480
600
Freq
u en c
y
Brot
her
347
Cano
n
589
Epso
n
257
HP
539
Lexm
ark
246
Sam
sung
127
Sam
sung
0
Bu�a
lo
193
D-L
ink
117
Dat
aTal
e
147
Dro
bo
153
NET
GEA
R
67
Pega
sus
433
Syno
logy
35
Terr
a M
aste
r
369
Thec
us
407
QN
AP
3
Oth
ers
Brother Canon
OthersSamsung
Epson HP Lexmark
Bu�alo D-Link DataTale Drobo NETGEAR Pegasus
QNAP OthersSynology Terra Master Thecus
Top 3 BrandsSynology | QNAP | Thecus
Although NAS or Network Attached Storage fi rst entered our survey in 2009, we are
seeing these nifty storage devices becoming more and more popular among Malaysians
in general. Handy for storing tons of media and data, today’s NAS devices are easy to
setup and use thanks to their user-friendly GUIs. As in 2011, Synology (20%) still rules the
roost, while QNAP (19%) and Thecus (17%) pick up second and third spots, respectively in
our survey.
NASBuff aloD-LinkDataTaleDroboNETGEARPegasusSynologyTerra MasterThecusQNAPOthersTotal
Total18119311714715367
43335
369407
32105
Percentage (%)8.609.175.566.987.273.18
20.571.66
17.5319.330.14100
0.00% (others)
16.48%
27.98%
12.21%
25.61%
11.69%
6.03%
0.14% (others)
8.60%
9.17%
5.56%
6.98%
7.27%
3.18%
20.57%
1.66%
17.53%
19.33%
0
100
200
300
400
500
Inkjet MFP
NAS
Freq
uenc
y
181
0
120
240
360
480
600
Freq
u en c
y
Brot
her
347
Cano
n
589
Epso
n
257
HP
539
Lexm
ark
246
Sam
sung
127
Sam
sung
0
Bu�a
lo
193
D-L
ink
117
Dat
aTal
e
147
Dro
bo
153
NET
GEA
R
67
Pega
sus
433Sy
nolo
gy
35
Terr
a M
aste
r
369Th
ecus
407
QN
AP
3
Oth
ers
Brother Canon
OthersSamsung
Epson HP Lexmark
Bu�alo D-Link DataTale Drobo NETGEAR Pegasus
QNAP OthersSynology Terra Master Thecus
Security Solutions0.00% (others)
13.82%
3.66%
14.82%
5.75%
24.28%
11.64%
18.86%
7.17%
Secutiry Solutions
0
110
220
330
440
550
Freq
u en c
y
Avi
ra
291
Ava
st
77
eSca
n
312
Eset
121
Kasp
ersk
y
511
Tren
d M
icro
245
Trus
tpor
t
397
Sym
ante
c
Oth
ers
151
0
Avira Avast
Trustport Symantec OthersTrend Micro
eScan Eset Kaspersky
Top 3 BrandsKaspersky | Trustport | eScan
Every year, the number of malware, virus and security threats seems to be increasing at an
alarming rate. A top notch security solution is a must for anyone who spends a lot of time
online. When asked, our 2012 respondents said that their favorite security solutions brands
are: Kaspersky (24%), Trustport (19%) and eScan (15%).
0.00% (others)
13.82%
3.66%
14.82%
5.75%
24.28%
11.64%
18.86%
7.17%
Secutiry Solutions
0
110
220
330
440
550
Freq
u en c
y
Avi
ra
291
Ava
st
77
eSca
n
312
Eset
121
Kasp
ersk
y
511
Tren
d M
icro
245
Trus
tpor
t
397
Sym
ante
c
Oth
ers
151
0
Avira Avast
Trustport Symantec OthersTrend Micro
eScan Eset Kaspersky
Security SolutionsAviraAvasteScanEsetKasperskyTrend MicroTrustportSymantecOthersTotal
Total29177
312121511245397151
02105
Percentage (%)13.823.66
14.825.75
24.2811.6418.867.170.00100

Conclusion
It’s for the tenth time that we bring you the tech publishing industry’s longest running brand recognition survey - the HWM & Plaza Low Yat Brand Survey! The 2012 survey did not see any major upsets or radical changes in polling trends, just as in 2011. Most of last year’s winners
continue to dominate the winners circle and have returned to pick up awards in their respective categories. As we commented for the past two years, this may be a sign of maturing consumers who are now quite discerning and know their brands better.
For the past 10 years now, super brands like Canon, Samsung, HP and Sony have made our survey their very own while popular brands like Gigabyte and Cooler Master have also carved a place in our respondents’ mindsets. As always, things get more exciting and unpredictable
when we look at the fight for second and third place spots. So, there’s always something to discuss and ponder on.
The 2012 brand survey offers invaluable insight into general brand perception and consumer product association trends. Although we have seen the addition and removal of categories over the past 10 years for consolidation and relevance, the survey still provides brand owners
with valuable feedback on the success of their branding strategies or otherwise.
Finally, HWM Malaysia & Plaza Low Yat would like to take this opportunity to congratulate all our Top Brands in 2012 and to thank all parties who made this year’s survey a success. See you in 2013!
Related Documents