10 STATISTICS AND PROBABILITY TASK 10.1 Give answers to 1 decimal place when appropriate. 1. When they last recycled something, 600 children were asked if they recycled paper, bottles or cans. The information is shown in the two-way table below. paper bottles cans total boys 73 89 girls 352 total 306 131 600 a Copy and complete the two-way table. b How many girls recycled paper last time they recycled something? c What percentage of the children recycled cans? 2. Some people were asked if they would rather watch a film on a DVD, at the cinema or go to the theatre. The results are shown below: M = Male, F = Female d = DVD, c = cinema, t = theatre M, c M, c F, c F, d F, c F, d F, t F, d M, t M, c M, c F, c M, c F, t F, d F, d F, d M, t M, d F, c a Put these results into a two-way table. b What percentage of the males chose the theatre? 3. 500 students in an international high school were asked what they planned to do after their IGCSEs. The results are shown in the two-way table below. stay in school go to college leave education total Year 10 26 Year 11 120 109 31 total 206 500 a Copy and complete the two-way table. 1 Ó OUP: this may be reproduced for class use solely for the purchaser’s institute

HW Chapter 10
Oct 25, 2015
Oxford Math IGCSE CD Chap 10
Welcome message from author
This document is posted to help you gain knowledge. Please leave a comment to let me know what you think about it! Share it to your friends and learn new things together.
Transcript
10 STATISTICS AND PROBABILITY
TASK 10.1
Give answers to 1 decimal place when appropriate.
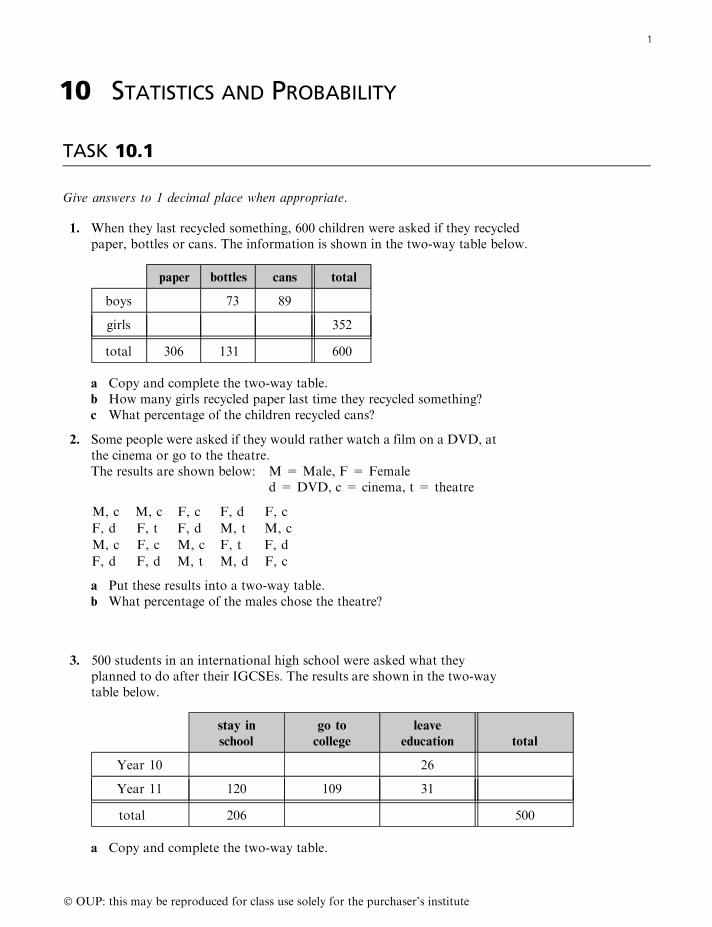
1. When they last recycled something, 600 children were asked if they recycledpaper, bottles or cans. The information is shown in the two-way table below.
paper bottles cans total
boys 73 89
girls 352
total 306 131 600
a Copy and complete the two-way table.b How many girls recycled paper last time they recycled something?c What percentage of the children recycled cans?
2. Some people were asked if they would rather watch a film on a DVD, atthe cinema or go to the theatre.The results are shown below: M = Male, F = Female
d = DVD, c = cinema, t = theatre
M, c M, c F, c F, d F, c
F, d F, t F, d M, t M, c
M, c F, c M, c F, t F, d
F, d F, d M, t M, d F, c
a Put these results into a two-way table.b What percentage of the males chose the theatre?
3. 500 students in an international high school were asked what theyplanned to do after their IGCSEs. The results are shown in the two-waytable below.
stay in
school
go to
college
leave
education total
Year 10 26
Year 11 120 109 31
total 206 500
a Copy and complete the two-way table.
1
� OUP: this may be reproduced for class use solely for the purchaser’s institute
b One of these students is picked at random.Write down the probabilitythat the student is in Year 10.
c One of these students is picked at random.Write down the probabilitythat the student plans to go to college.
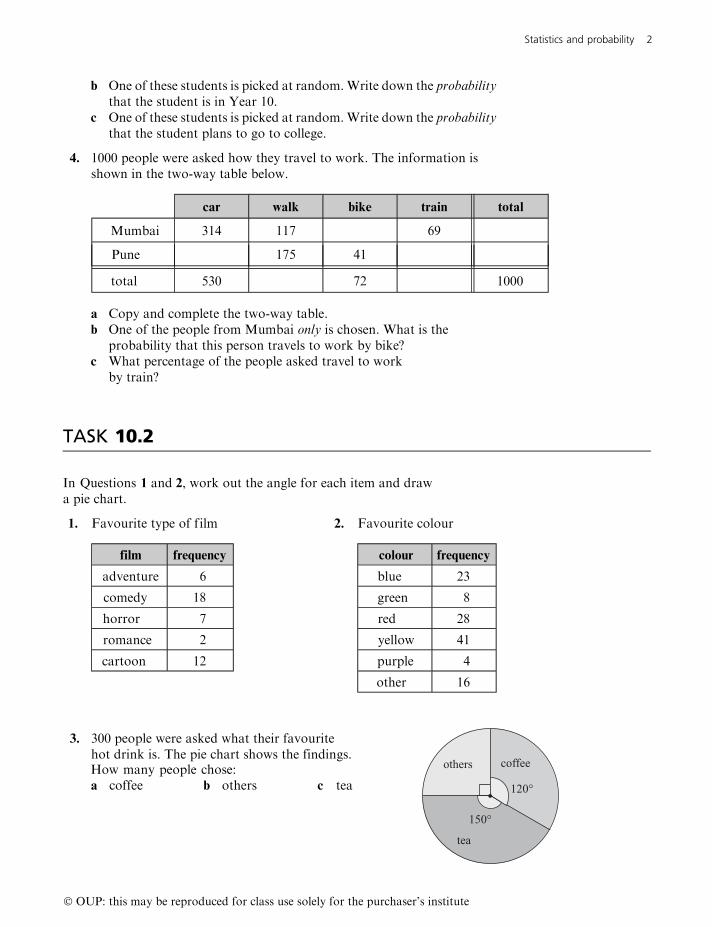
4. 1000 people were asked how they travel to work. The information isshown in the two-way table below.
car walk bike train total
Mumbai 314 117 69
Pune 175 41
total 530 72 1000
a Copy and complete the two-way table.b One of the people from Mumbai only is chosen. What is the
probability that this person travels to work by bike?c What percentage of the people asked travel to work
by train?
TASK 10.2
In Questions�1 and�2, work out the angle for each item and drawa pie chart.�1. Favourite type of film
film frequency
adventure 6
comedy 18
horror 7
romance 2
cartoon 12
�2. Favourite colour
colour frequency
blue 23
green 8
red 28
yellow 41
purple 4
other 16
3. 300 people were asked what their favouritehot drink is. The pie chart shows the findings.
others coffee
tea
120°
150°
How many people chose:a coffee b others c tea
Statistics and probability 2
� OUP: this may be reproduced for class use solely for the purchaser’s institute
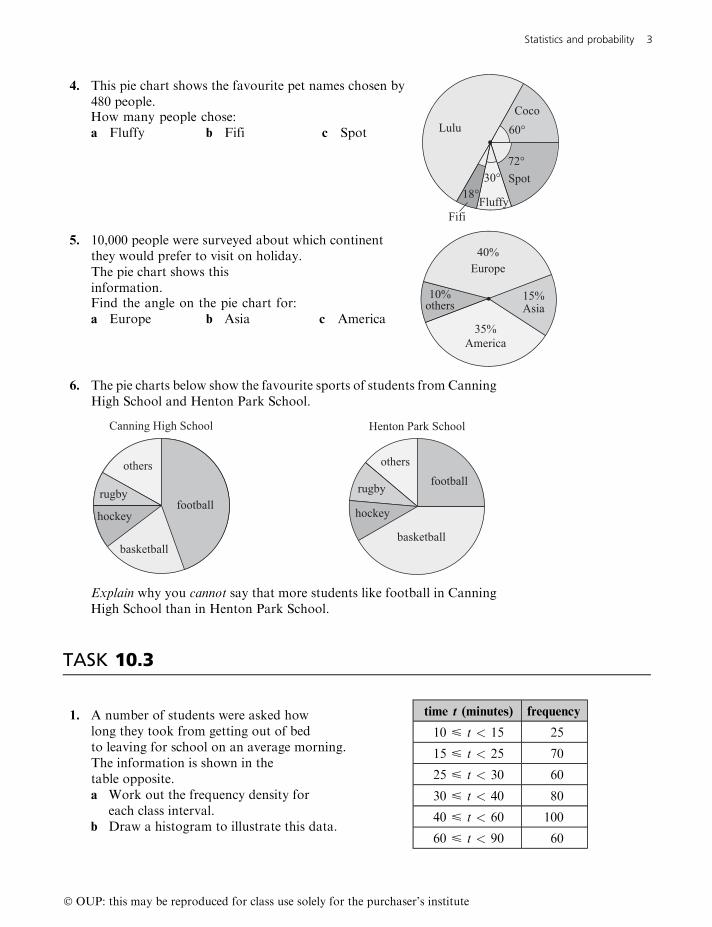
4. This pie chart shows the favourite pet names chosen by480 people.
Coco
Spot
Fluffy
Lulu
Fifi
60°
72° 30°
18°
How many people chose:a Fluffy b Fifi c Spot
5. 10,000 people were surveyed about which continentthey would prefer to visit on holiday.The pie chart shows thisinformation.
others
America
Europe
Asia 10%
40%
15%
35%
Find the angle on the pie chart for:a Europe b Asia c America
6. The pie charts below show the favourite sports of students from CanningHigh School and Henton Park School.
football
basketball
hockey
rugby
others
Canning High School
football
basketball
hockey
rugby
others
Henton Park School
Explain why you cannot say that more students like football in CanningHigh School than in Henton Park School.
TASK 10.3
1. A number of students were asked howlong they took from getting out of bedto leaving for school on an average morning.The information is shown in thetable opposite.a Work out the frequency density for
each class interval.b Draw a histogram to illustrate this data.
time t (minutes) frequency
10 < t < 15 25
15 < t < 25 70
25 < t < 30 60
30 < t < 40 80
40 < t < 60 100
60 < t < 90 60
Statistics and probability 3
� OUP: this may be reproduced for class use solely for the purchaser’s institute

2. The table below shows the ages at which a number of people living ina village got married.
age (years) 20–24 25–34 35–39 40–44 45–59 60–69
frequency 22 32 28 49 99 37
a Explain why the ‘25–34’ class when written as an inequality is25 < A < 35 where A is the age.
b Explain why the frequency density for the ‘25–34’ class is 3·2.c Draw a histogram to illustrate this data.
3. The heights of a number of students in a school are recorded (to thenearest cm). The information is shown below.
height (cm) 140–149 150–153 154–159 160–163 164–171 172–181 182–199
frequency 33 6 27 26 68 57 36
a Explain why the ‘154–159’ class when written as an inequality is153·5 < h < 159·5 where h is the height.
b Explain why the frequency density for the ‘154–159’ class is 4·5.c Draw a histogram.
TASK 10.4
1. This histogram shows the numberof hours of exercise taken by agroup of people each week.
0 2 4 6 8 10 12 0 1 2 3 4 5 6 7 8 9
frequency density
hours of exercise
a Copy and complete thefrequency table below.
hours of
exercise (h) frequency
0 < h < 2
2 < h < 3
3 < h < 5
5 < h < 8
8 < h < 12
b What is the total frequency?
Statistics and probability 4
� OUP: this may be reproduced for class use solely for the purchaser’s institute

2. This histogram shows the ages of somemembers of a drama group. Copy and completethe frequency table below.
10 20 30 40 50 60 70 80
frequencydensity
age (years)
age A (years) frequency
10 < A < 15
15 < A < 30
30 < A < 40
40 < A < 60 42
60 < A < 80
3. This histogram shows the percentage ofrubbish which is recycled by householdsin a village.
0 10 20 30 40 50 60
frequencydensity
% recycled
a Copy and complete the frequency tablebelow.
% recycled R frequency
0 < R < 6
6 < R < 10
10 < R < 15 31
15 < R < 30
30 < R < 42
42 < R < 60
b What is the total frequency?c What percentage of the houses recycle between
10% and 30% of their rubbish (give youranswer to 1 d.p.)?
4. The unfinished histogram and table belowshow the annual salaries of the employeesof a particular company.
5 15 25 35 45 55 65 75
frequency density
Statistics and probability 5
� OUP: this may be reproduced for class use solely for the purchaser’s institute

salary s($1000’s) frequency
5 < s < 15 175
15 < s < 20
20 < s < 25 110
25 < s < 40 285
40 < s < 70
a Use the information shown on the histogram to copy and complete the table.b Use the information shown in the table to copy and complete the histogram.c What percentage of the employees earn more than $25 000?
(Give your answer to 1 d.p.)
TASK 10.5
1. Write down what X and Y might be togive this scatter graph.
X
Y
2. The table below shows the heights and neck lengths of 14 people.
height (cm) 177 187 195 162 200 175 192 186 165 200 172 198 181 190
neck length
(cm)6·9 7·5 7·5 5·5 8·5 6·1 6·8 6·8 6 8 5·7 7·7 6·9 7·8
a Copy and complete this scatter graph to showthe data in the table.
b Describe the correlation.c Draw the line of best fit.d A person is 184 cm tall. Use your line of
best fit to find out the person’s likely neck length.e Another person has a neck length of 7·7 cm.
How tall is that person likely to be?
170 160
5
4
6
7
8
9
180 190 200 Height (cm)
Necklength (cm)
Statistics and probability 6
� OUP: this may be reproduced for class use solely for the purchaser’s institute

3. This scatter graph shows information about cars.Write down what you think Y might be.
Age
Y
4. A golfer records his weekly average score and how many hours bepractises each week (in golf a score of 70 is better than a score of 80!). Theinformation is shown in the table below.
weekly average
score79 75 87 81 84 73 77 88 72 78 84 76
weekly hours
practising22 24 19 21 22 23 24 17 26 22 19 21
a Draw a scatter graph to show this data.Use the x-axis for the weekly averagescore from 70 to 90. Use the y-axis forthe weekly hours practising from 0 to 30.
b Describe the correlation in thisscatter graph.
c Draw the line of best fit.d If the golfer practised for 25 hours
one week, what average score wouldyou expect the golfer to get that week?
TASK 10.6
You may use a calculator for this task.
1. For each set of numbers below, findi the mean ii the median iii the mode iv the rangea 6 10 9 3 16 10 2b 8 11 4 8 15 4 16 5 10
2. The ages of the members of a football team are:19 27 22 21 24 33 29 26 22 18 31Two players are ‘sent off’ in a match. They are the 29 year-old and the 18year-old. Find the mean age of the players left on the pitch.
3. Seven people score the following marks in a test:30 40 40 40 45 45 96Find a the mean b the median c Which average best describesthese marks? Explain why.
Statistics and probability 7
� OUP: this may be reproduced for class use solely for the purchaser’s institute

4. In an archery match, Harpal scores:8 9 9 9 10 9 9 9 9 10Find a The mode
b The meanc Which average best describes these scores, the mode or the
mean? Explain why.
5. 4 9 Ziggy has 5 cards. The 5 cards have a
mean of 7, amedian of 7 and a range of 13.What are the 5 numbers on the
cards?
6. The mean average age of 6 people is 37. What is the total of all theirages?
7. The mean weight of 11 people is 63 kg.a What is the total weight of all 11 people?b One person of weight 83 kg leaves the group.
Find the mean weight of the remaining 10 people.
8. The mean average salary of 7 people is $26 500. Eriko joins the group. Ifshe earns $32 100, what is the mean average salary of all 8 people?
9. The mean amount of weekly pocket money for 36 boys is $4·50.The mean amount of weekly pocket money for 14 girls is $5·50.Find the mean amount of weekly pocket money for all 50 children.
10. 100 people are surveyed about their weekly pay. 50 people fromCompany A have mean average pay of $460. 30 people from Company Bhave mean average pay of $340. 20 people from Company C have meanaverage pay equal to the mean average pay of all 100 people. Find themean average pay of all 100 people.
TASK 10.7
1. The table below shows the number of drinks some children had duringone day.
number of drinks 1 2 3 4 5
frequency 7 12 8 23 29
Find a the modal number of drinksb the median number of drinks
Statistics and probability 8
� OUP: this may be reproduced for class use solely for the purchaser’s institute

2. The 2 tables below show the number of IGCSE grade C’s obtained bysome students.
number of
C grades1 2 3 4 5
frequency 20 38 18 27 24
boys
number of
C grades1 2 3 4 5
frequency 26 20 41 39 67
girls
a Find the median number of C grades for the boys.b Find the median number of C grades for the girls.c Which group has the higher median number of C grades?
3. The table below shows how many portions of vegetables some peopleate during one week.
number of times
meat eaten0 to 1 2 to 5 6 to 8 over 8
frequency 75 51 104 17
Find a the modal intervalb the interval which contains the median
4. Some students from nearby schools are asked how often they go eachmonth to a local skateboard park. The information is shown inthe tables below.
Istituto Salesiano
park visits frequency
0 to 1 27
2 to 5 21
6 to 9 15
10 or more 8
Istituto Galileo Galilei
park visits frequency
0 to 1 19
2 to 5 23
6 to 9 34
10 or more 17
a For each school, find the interval which contains the median.b From which school do students generally go to the skateboard park
more often? Explain why you think this.
Statistics and probability 9
� OUP: this may be reproduced for class use solely for the purchaser’s institute

TASK 10.8
Use a calculator if you need to.
1. Some young people were asked how many different mobile phones theyhad owned during the last 6 years. The information is shown in the tablebelow.
number of
phones0 1 2 3 4
frequency 7 4 12 14 3
a Find the total number of phones.b Find the mean average number of phones.
2. Some people were asked how many computers theyhad in total in their houses.a Find the total number of computers.b Find the mean average number of computers
per house (give your answer to 1 d.p.)
number of
computers frequency
0 16
1 26
2 37
3 20
4 5
3. Some teenagers in 2 areas of a city were asked how many pairs of shoesthey owned. The results are shown in the tables below.
Area A
number of
pairs of shoes1 2 3 4 5 6
frequency 5 11 28 24 8 3
Area B
number of
pairs of shoes1 2 3 4 5 6
frequency 1 6 23 61 42 24
a Work out the mean number of pairs of shoes for each area, givingyour answers to 1 d.p.
b In which area do your results suggest that teenagers ownmore pairs ofshoes per person?
Statistics and probability 10
� OUP: this may be reproduced for class use solely for the purchaser’s institute

TASK 10.9
1. Some people were asked how many times they ate out in a restaurantduring one month. The information is shown below.
number of
meals (m)0 < m < 2 2 < m < 5 5 < m < 10 10 < m < 20
frequency 24 39 16 12
a Estimate the total number of meals.b Estimate the mean average (give your answer to the nearest whole number)c Explain why your answer is an estimate.
2. The number of goals scored by two hockey teams over the last 15 years isshown in the tables below.
Batton City
number of
goals (g) frequency
20 < g < 30 2
30 < g < 40 3
40 < g < 50 5
50 < g < 60 4
60 < g < 70 1
Annville
number of
goals (g) frequency
20 < g < 30 2
30 < g < 40 6
40 < g < 50 4
50 < g < 60 3
60 < g < 70 0
a Which team has scored the higher mean average number of goals?b Write down the value of the higher mean average (give your answer to
1 decimal place).c What is the difference between the mean average number of goals
scored by each team?
3. The weights of rugby players in 2 teams are shown in the tables below.
weight
w (kg) 75 < w < 85 85 < w < 95 95 < w < 100 100 < w < 110 110 < w < 120
frequency 2 2 3 5 3
Callum Hornets
weight
w (kg) 75 < w < 85 85 < w < 95 95 < w < 100 100 < w < 110 110 < w < 120
frequency 1 5 2 6 1
Eastham Sharks
a Estimate the mean weight for each rugby team (give your answer to 1 d.p.)b Which team is the heavier?
Statistics and probability 11
� OUP: this may be reproduced for class use solely for the purchaser’s institute

TASK 10.10
1. Theonie throws a coin 120 times. The coin lands on ‘tails’ 58 times.a From Theonie’s results, find the relative frequency of getting ‘tails’.
relative frequency =number of times event happens
total number of trials
� �b Do you think the coin is fair? Explain the answer you give.
2. Sylvaine is throwing an 8-sided dice. She throws the dice 240 times.The table below shows her results.
score 1 2 3 4 5 6 7 8
frequency 27 24 36 27 30 27 33 36
a How many times should each number come up if the dice is fair?b From Sylvaine’s results, use a calculator to find the relative frequency
of getting each score (1 up to 8).c Do you think the dice is fair? Explain the answer you give.
3. Tumelo keeps throwing a drawing pin to find out how many times itwill land ‘point down’. The table below shows the total number of timesthe drawing pin has landed ‘point down’ after every 20 throws.
number of throws 20 40 60 80 100 120 140 160 180 200
number of ‘point down’ 5 13 21 26 36 47 53 59 68 76
a Work out the relative frequency of the drawing pin landing ‘point down’after every 20 throws (round off to 2 d.p. if necessary).
b Plot a graph of the relative frequency of ‘point down’ against thetotal number of throws.
c Write down the number around which the relative frequency of‘point down’ is settling.
4. Five people throw a biased dice several times. They record how manytimes the dice lands on a ‘2’.
name
number
of throws
number
of 2’s
relative
frequency
Helena 100 41 0·41
Sandeep 200 83 0·415
Xiao Ping 150 60 0·4
Grigor 450 99 0·22
Carli 700 273 0·39
One of these five people made a mistake when recording the number of2’s. Who do you think this was? Give a reason for your answer.
Statistics and probability 12
� OUP: this may be reproduced for class use solely for the purchaser’s institute
TASK 10.11
For each set of data below, work out the:a median b lower quartile c upper quartile d interquartile range
1. 3 6 6 7 9 9 9 10 11 12 14 14 16 17 17
2. 0·8 0·9 0·4 0·8 0·5 0·4 0·9 1·3 1·2 0·6 0·9
3. 13
78
12
110
14
34
23
4. The cost of the last seven garments of clothing bought by Adhik are (in dollars):32 7 12 65 28 13 23The cost of the last eleven garments of clothing bought by Bron are (in dollars):24 6 14 13 29 19 4 81 12 25 17a Find the median cost for each person.b Find the interquartile range for each person.c Use the medians and the interquartile ranges to compare the costs of
the garments of clothing bought by Adhik and Bron.
TASK 10.12
1. Two hundred 17–19 year-olds are askedhow many hours of driving practicethey have had.a Copy the table, adding a cumulative
frequency column.b Draw a cumulative frequency graph.c Use the graph to estimate
i the median andii the interquartile range.
d What percentage of these people havehad 43 or more hours of driving?
hours of
driving (h) frequency
0 < h < 10 12
10 < h < 20 31
20 < h < 30 59
30 < h < 40 45
40 < h < 50 27
50 < h < 60 18
60 < h < 70 8
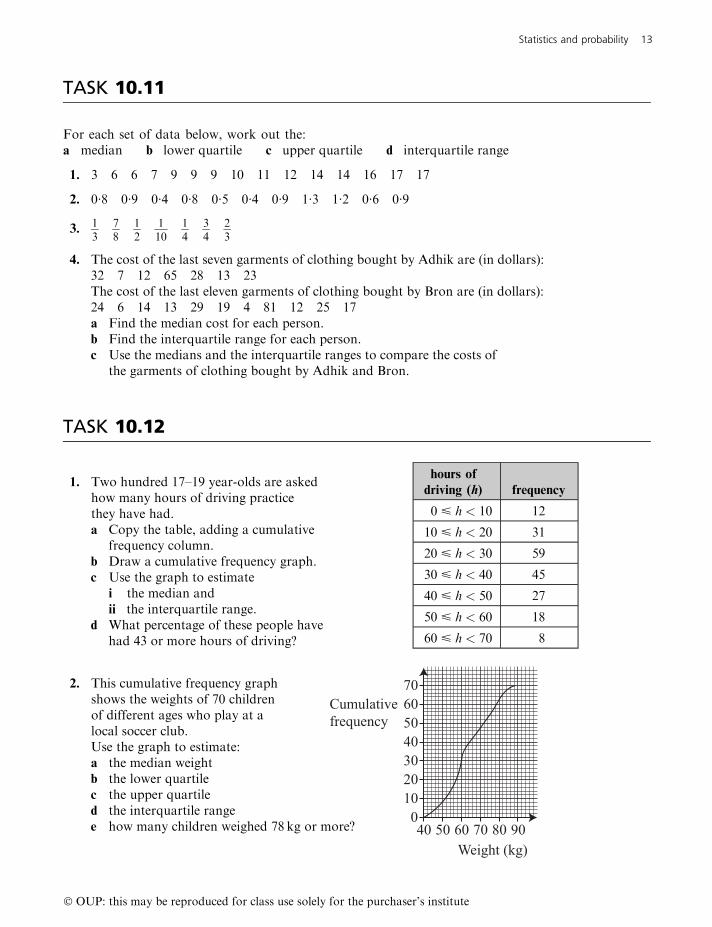
2. This cumulative frequency graphshows the weights of 70 childrenof different ages who play at alocal soccer club.
40 50 60 70 80 900
10203040506070
Cumulativefrequency
Weight (kg)
Use the graph to estimate:a the median weightb the lower quartilec the upper quartiled the interquartile rangee how many children weighed 78 kg or more?
Statistics and probability 13
� OUP: this may be reproduced for class use solely for the purchaser’s institute

3. Some 18 year-olds who are planning to go to university are asked if theyhave saved any money and if so, how much. The information is shown inthe table below:
money
saved m ($) frequency
0 < m < 500 34
500 < m < 1000 27
1000 < m < 1500 45
1500 < m < 2000 31
2000 < m < 2500 15
2500 < m < 3000 8
3000 < m < 3500 7
3500 < m < 4000 5
a Copy the table, adding a cumulative frequency column.b Draw a cumulative frequency graph.c Use the graph to estimate
i the median andii the interquartile range.
d What percentage of these 18 year-olds have saved more than $2400?
TASK 10.13
1. Some 8 year-olds and some 18 year-olds areasked how many books they read last year.
8 year-olds
0 to 8 6
9 to 16 31
17 to 24 48
25 to 32 10
33 to 40 3
41 to 48 2
18 year-olds
0 to 8 34
9 to 16 26
17 to 24 9
25 to 32 5
33 to 40 1
41 to 48 0
a Estimate the mean average for the8 year-olds.
b Estimate the mean average for the18 year-olds.
c Compare the number of booksread by the 8 year-olds and the18 year-olds.
Statistics and probability 14
� OUP: this may be reproduced for class use solely for the purchaser’s institute

2. The histogram below shows the ages in country A at which a sample ofwomen gave birth to their first child.
15 20 25 30 35 40 45
Frequencydensity
Age (years)
050
100150200250
The table below shows the ages in country B at which a sample of womengave birth to their first child.
age A (years) 15 < A < 18 18 < A < 20 20 < A < 21 21 < A < 23 23 < A < 28 28 < A < 35
frequency 240 320 240 460 500 140
a Using the same scale as the above histogram, draw a histogram toillustrate the data for country B.
b Compare the distribution of the ages at which women gave birth totheir first child in countries A and B.
TASK 10.14
1. Shada has 15 cards as shown below:
T E L E V I I S O N S C A L L
Shada picks a card at random.What is the probability that she picks the letter:a C b E c L d S
2. Angus has a bag which contains 7 toffees, 4 mints and 2 chocolates.Angus picks one of these sweets.What is the probability that he chooses a:a mint b mint or toffee c mint or chocolate
3. A bag contains 10 beads. There are 6 blue,3 red and 1 green.
B B
B
G B
R
B R B
R a Find the probability of selecting a red bead.b 2 more blue beads are put in the bag.
Find the probability of selecting a blue bead.
Statistics and probability 15
� OUP: this may be reproduced for class use solely for the purchaser’s institute

4. 24 people come for a job interview. 9 of these people wear glasses and 4 ofthem have contact lenses.Find the probability that the person chosen for the job:a has contact lensesb wears glassesc does not wear glasses or contact lenses
5. Yalda has six $5 notes, ten $10 notes and four $20 notes in her purse. Ifshe takes out one note, what is the probability that it will be:a a $20 note b a $5 or $10 note c a $50 note
d She buys a new toaster with a $20 note and a $10 note.If she now took out a note, what is the probability thatit would be a $10 note?
6. Reuben throws an 8-sided dice (faces numbered from 1 to 8) once. Whatis the probability of getting:a a multiple of 2 b a prime number c a factor of 8
Another owner arrives. What is the probability that if the owner hascome to pick up one pet only, it will be a cat?
7. One ball is selected from a bag containing x red balls, y blue ballsand z yellow balls. What is the probability of selecting a blue ball?
8. A box contains n beads. 8 beads are blue, m beads are green and theremaining beads are yellow. If one bead is removed, what is theprobability that it will be yellow?
9. A bag contains x balls. y balls are removed and z balls are added. 6 ballsare white. If one white ball is removed, what is the probability that thenext ball to be removed will not be white?
TASK 10.15
1. A fair coin is thrown 48 times. How many times would you expect it toland on ‘heads’?
2. A fair dice is thrown 120 times.How many times would you expect to get a:a 3 b 5 c 4 or 5 d square number
3. This spinner is fair. It is spun 80 times.
1
0
0 0
0
How many times should the spinnerland on a ‘0’?
Statistics and probability 16
� OUP: this may be reproduced for class use solely for the purchaser’s institute

4. The probability of Moroka Swallows winning a football match is 23.
If they play 42 matches in a season, how many matches are they likely towin?
5. The probability of Minh going to the cinema on any one day is 27. How
many times is he likely to go to the cinema in the next fortnight?
6. A bag contains 5 blue balls, 4 red balls and 1 yellow ball.
R R R
B B B
Y
B
R
B
Lora takes out one ball at random and then puts it back.If she does this 70 times, how many times would she take out:a a yellow ball b a blue ball c a blue or red ball.
7. The probability of Manchester United winning the Premiership duringa season is 0·17 (there is one soccer season per year). How many timesare Manchester United likely to win the Premiership during the 21st
century?
8. Abag has only red and blue discs in it. The probability of picking red is 25.
a What is the probability of picking a blue disc?b Javier picks out 4 red discs without replacing them. What is the
smallest number of blue discs that could have been in the bag?c If Javier picks out a total of 6 red discs without replacing them,
what is the smallest number of blue discs that could have beenin the bag?
TASK 10.16
1. Here are 2 spinners. If I spin both spinners, I could get a‘1’ and a ‘4’ (1, 4).
8 1 27
4 12 9 2 a List all the possible outcomes.
b How many possible outcomes are there?
2. Three babies are born. List all the boy/girl mixes (example: B G Bboy, girl, boy).
3. Odval has 4 films (Antz, King Kong, Jungle Book and The Terminator).He only has time to watch two of the films. List all the possible pairsof films that he could watch.
Statistics and probability 17
� OUP: this may be reproduced for class use solely for the purchaser’s institute

4. Nayana has 2 spinners. She spins both spinners andmultiplies the numbers. For example a ‘3’ and a‘4’ give 12.
1 4 3 2
1 4 3 2
a Copy and complete this grid to show allthe possible outcomes.
Find the probability of getting a product which is:b an odd numberc less than 3 X 1 2 3
4
1
2
3
4
12
d a prime number
5.
4
2
35
1
Ita and Joska play a gameinvolving a spinnerand a dice.
Ita wins if the spinner gives a square number and the dice gives a multipleof 3.Joska wins if the spinner gives an even number and the dice gives a factorof 15.Any other outcome is a draw.Is this game fair to both players? Give reasons for your answer.
TASK 10.17
1. The probability of Korfa getting up before 11 a.m. on a Saturday
morning is 14. What is the probability of Korfa not getting up before
11 a.m. on a Saturday morning?
Statistics and probability 18
� OUP: this may be reproduced for class use solely for the purchaser’s institute

2. The players in an amateur football team have the jobs shown below:
team position job
goalkeeper plumber
defenders teacher, farmer, mechanic, artist
midfielders farmer, fireman, insurance salesman
forwards electrician, teacher, bus driver
Which of the following pairs are mutually exclusive?a a teacher and a midfielderb a farmer and a defenderc an electrician and a forward
3. The probability of Ko playing certain sports is shown in the table below.
hockey football badminton netball
0·5 0·1 x 0·2
a What is the probability of Ko playing hockey or netball?b What is the probability of Ko playing badminton?
4. If the probability of Cameroon winning the next football World Cup is0·15, what is the probability of Cameroon not winning the nextWorld Cup?
5. Mads gets to work by either car, bus, tube or bike. The table shows theprobability of each being used.
car bus tube bike
0·25 0·4 0·2
a What is the probability of Mads going to work by bus.b What is the probability of Mads going to work by car or bus.c On his 20 working days in March, how many days would you expect
Mads to take the tube?
6. There are 4 people in a car. One person is wearing glasses. 2 people arewearing hats. Explain why the probability of a person in the car
wearing glasses or a hat is not necessarily 34.
7. Parirow has some coins in his pocket. He has 5c, 10c and 50c coins. Theprobability of choosing a 5c coin is 0·65. The probability of choosinga 10c coin is 0·2.a What is the probability of choosing a 50c coin?b What is the probability of choosing a 10c coin or a 50c coin?
Statistics and probability 19
� OUP: this may be reproduced for class use solely for the purchaser’s institute

TASK 10.18
1. A coin is thrown twice. What is the probability of getting 2 heads?
2. A dice is thrown twice. What is the probability of getting a ‘3’ followed bya ‘4’?
3. A bag contains 6 yellow beads, 3 blue beadsand 2 green beads.I remove one bead at random, replace it thentake another bead.What is the probability that:
B B B
Y Y
Y Y Y Y
G G
a both beads are blue?b both beads are green?
4. The probability that Hiram takes an umbrella to work is 0·4.The probability that it rains is 0·7.What is the probability that:a Will takes his umbrella and it rains?b Will does not take his umbrella and it rains?c Will does not take his umbrella and it does not rain?
5. 2 darts are thrown at this board.Assuming each dart hits the board,what is the probability that:
1 2
3
4 5 6
7
8
9 10
a Both darts hit an even number?b Both darts hit a square number?c Both darts hit a prime number?
6. If a dice is thrown four times, what is the probability of obtainingfour sixes?
7. The probability that Ekaterina works on a Saturday is 34. The probability
that she goes to the cinema on a Saturday evening is 47.
On any Saturday what is the probability that:a Ekaterina does not work but goes to the cinema?b Ekaterina works and goes to the cinema?
Statistics and probability 20
� OUP: this may be reproduced for class use solely for the purchaser’s institute

TASK 10.19
1. A bag contains 8 blue discs and 3 green discs.One disc is removed at random then replaced.Another disc is then removed.
B
B
G
8 11
8 11
1st disc 2nd disc
a Copy and complete the tree diagram to showall the outcomes.
Find the probability that:b Both discs are blue.c Both discs are green.d One disc is blue and one disc is green
(in any order).
2. The probability of Igme swimming on any one day is 0·3.a Copy and complete the tree diagram showing
whether he swims or not on a Thursdayand Friday.
swims
swims
not
not
0·3
0·3
Thursday Friday
b Find the probability that:i Igme does not swim on either day.ii Igme swims on one day only.
3. A spinner is spun three times.a Copy and complete the tree diagram to show
the probability of getting a ‘two’.
4 3 2 1
two
not
two
not
two
not
two
two
not
1 4
1 4
1 4
3 4
1st spin 2nd spin 3rd spin
Statistics and probability 21
� OUP: this may be reproduced for class use solely for the purchaser’s institute

b Find the probability that the spinner lands on:i 3 two’sii no two’siii at least one ‘two’
4. A dice is thrown three times. Find the probability that the dice lands on:a exactly two 3’sb at least one 3
5. The probability of Yuka eating a curry on any day is 0·2.Draw a tree diagram to help you find the probability that on a Friday,Saturday and Sunday:a Yuka has a curry each dayb Yuka has a curry on exactly one day onlyc Yuka has a curry on at least one day
TASK 10.20
1. There are 3 males and 5 females in a family of8 people. Two of the family members arechosen at random.a Copy and complete the tree diagram.
male
male
female
female
male
female 5 8
3 7
2 7
3 8
1st person 2nd person
Find the probability that:b Both people are female.c Exactly one person is female.
2. Rieger has 7 cola cubes and 2 jelly beans. He eats 2 sweets randomly.a Draw a tree diagram to show all outcomes.Find the probability that:b Rieger eats 2 cola cubes.c Rieger eats 1 cola cube and 1 jelly bean.d Rieger eats 2 sweets of the same type.
3. There are 12 beads in a bag. 5 beads are red and the rest are blue.Three beads are taken out at random, one at a time, without replacement.a Draw a tree to show all outcomes.Find the probability that:b All three beads are blue.c At least one bead is red.d Exactly one bead is blue and two beads are red.
4. A box contains 15 counters. x counters are red and the remainderare blue. Two counters are removed at random. What is the probability,in terms of x, of removing:a Two blue counters?b At least one blue counter?c One counter of each colour?
Statistics and probability 22
� OUP: this may be reproduced for class use solely for the purchaser’s institute

TASK 10.21
1. The probability of a gate being left open is 0·15. If the gateis left open, the probability of a cow getting out of the field is 0·8.If the gate is shut, the probability of the cow getting out of the fieldis 0·3.a Copy and complete the tree diagram.b Find the probability that the cow gets out of the garden.
gateopen
cow out
gateshut
cow in
cow out
cow in
0·8
0·15
2. The probability of Soomin doing more than 2 hours homework on aThursday evening is 0·6. If she does more than 2 hours homework, theprobability of seeing friends later that evening is 0·25. If she does 2 hoursor less homework, the probability of seeing friends later that evening is0·7.a Draw a tree diagram to represent the above information.b Find the probability that Soomin will see friends later
that evening.
3. 65% of properties for sale in a town are over-priced. If a property is over-priced, the probability of getting the asking price is 0·3. If the property isnot over-priced, the probability of getting the asking price is 0·85.a Draw a tree diagram to represent the above information.b Find the probability of not receiving the asking price.
4. A rugby team plays 40% of its matches at home. They win 75% of theirhome matches but only 55% of their away matches.a Draw a tree diagram to represent the above information.b Find the probability that the team wins a match.
Statistics and probability 23
� OUP: this may be reproduced for class use solely for the purchaser’s institute

5. If a car salesperson sells more than 3 cars during the week, the probability
of taking the next weekend off is 78. If 3 or less cars are sold
during the week, the probability of taking the next weekend off is 25.
If the probability of selling more than 3 cars during the week is 15,
find the probability that the car salesperson will take the nextweekend off.
6. A bag contains n counters. Seven of these counters are green and the restare yellow. Two counters are chosen at random. The probability that the
two counters are green is 15.
a Form an equation involving n and show that it simplifies ton2 � n� 210 = 0:
b Find how many counters were in the bag originally.
Statistics and probability 24
� OUP: this may be reproduced for class use solely for the purchaser’s institute
Related Documents