ORIGINAL PAPER HvNax3—a locus controlling shoot sodium exclusion derived from wild barley (Hordeum vulgare ssp. spontaneum) Yuri Shavrukov & Narendra K. Gupta & Junji Miyazaki & Manahil N. Baho & Kenneth J. Chalmers & Mark Tester & Peter Langridge & Nicholas C. Collins Received: 24 September 2009 / Revised: 3 December 2009 / Accepted: 13 December 2009 / Published online: 14 January 2010 # Springer-Verlag 2010 Abstract Previous work identified the wild barley (Hordeum vulgare ssp. spontaneum) accession CPI-71284-48 as being capable of limiting sodium (Na + ) accumulation in the shoots under saline hydroponic growth conditions. Quantitative trait locus (QTL) analysis using a cross between CPI-71284-48 and a selection of the cultivated barley (H. vulgare ssp. vulgare) cultivar Barque (Barque-73, a moderate Na + excluder) attributed the control of the Na + exclusion trait from CPI-71284-48 to a single locus on the short arm of chromosome 7H, which was named HvNax3. The locus reduced shoot Na + accumulation by 10–25% in plants grown in 150 mM NaCl. Markers generated using colinearity with rice and Brachypodium, together with the analysis of introgression lines and F 2 and F 3 families, enabled HvNax3 to be mapped to a 1.3-cM interval. Genes from the corresponding rice and Brachypodium intervals encode 16 different classes of proteins and include several plausible candidates for HvNax3. The potential of HvNax3 to provide a useful trait contributing to salinity tolerance in cultivated barley is discussed. Keywords Sodium transport . Barley . H. vulgare ssp. spontaneum . Salinity tolerance . Pyrophosphatase Introduction A high content of soluble salts in the soil (salinity) affects approximately 5% of the world’ s cultivated land, including a third of the irrigated land, and represents a major limitation to agricultural production (Tester and Davenport 2003; Rengasamy 2006). In the cereals, sodium (Na + ) is regarded as the major source of toxicity, with the leaves being the principal site of accumulation and damage due to the delivery of Na + over time via the transpiration stream (Tester and Davenport 2003; Munns and Tester 2008). High concentrations of Na + in the apoplast can cause cellular dehydration, while in the cytoplasm Na + can interfere with metabolic functions by competing with K + for binding to many enzymes that require K + as a cofactor (Tester and Davenport 2003). Plants can avoid Na + toxicity by seques- tering excess Na + in the vacuole or by reducing net Na + entry into the transpiration stream and subsequent accumu- lation in vegetative tissues. Therefore, an ability to maintain a low Na + concentration or a high K + /Na + ratio in the leaves is considered as an indicator of potential salinity tolerance. In studies comparing genotypes within some cereal species, these traits have been found to be correlated with salinity tolerance (Yeo and Flowers 1986; Chhipa and Lal 1995; Munns and James 2003; Poustini and Siosemardeh 2004; Chen et al. 2007). However, in other studies, no Y. Shavrukov (*) : J. Miyazaki : M. Tester : P. Langridge : N. C. Collins Australian Center for Plant Functional Genomics, School of Agriculture, Food and Wine, University of Adelaide, Urrbrae, Adelaide, South Australia 5064, Australia e-mail: [email protected] N. K. Gupta Department of Plant Physiology, Rajasthan Agricultural University, SKN College of Agriculture, Jobner, Jaipur 303-329, India M. N. Baho Department of Biology, College of Science, Al-Mustansiriya University, Baghdad, Iraq K. J. Chalmers Molecular Plant Breeding Cooperative Research Center, University of Adelaide, Urrbrae, SA 5064, Australia Funct Integr Genomics (2010) 10:277–291 DOI 10.1007/s10142-009-0153-8

Welcome message from author
This document is posted to help you gain knowledge. Please leave a comment to let me know what you think about it! Share it to your friends and learn new things together.
Transcript

ORIGINAL PAPER
HvNax3—a locus controlling shoot sodium exclusion derivedfrom wild barley (Hordeum vulgare ssp. spontaneum)
Yuri Shavrukov & Narendra K. Gupta & Junji Miyazaki &Manahil N. Baho & Kenneth J. Chalmers & Mark Tester &
Peter Langridge & Nicholas C. Collins
Received: 24 September 2009 /Revised: 3 December 2009 /Accepted: 13 December 2009 /Published online: 14 January 2010# Springer-Verlag 2010
Abstract Previous work identified the wild barley (Hordeumvulgare ssp. spontaneum) accession CPI-71284-48 as beingcapable of limiting sodium (Na+) accumulation in the shootsunder saline hydroponic growth conditions. Quantitative traitlocus (QTL) analysis using a cross between CPI-71284-48and a selection of the cultivated barley (H. vulgare ssp.vulgare) cultivar Barque (Barque-73, a moderate Na+
excluder) attributed the control of the Na+ exclusion traitfrom CPI-71284-48 to a single locus on the short arm ofchromosome 7H, which was named HvNax3. The locusreduced shoot Na+ accumulation by 10–25% in plants grownin 150 mM NaCl. Markers generated using colinearity withrice and Brachypodium, together with the analysis ofintrogression lines and F2 and F3 families, enabled HvNax3to be mapped to a 1.3-cM interval. Genes from thecorresponding rice and Brachypodium intervals encode 16
different classes of proteins and include several plausiblecandidates for HvNax3. The potential of HvNax3 to providea useful trait contributing to salinity tolerance in cultivatedbarley is discussed.
Keywords Sodium transport . Barley .H. vulgare ssp.spontaneum . Salinity tolerance . Pyrophosphatase
Introduction
A high content of soluble salts in the soil (salinity) affectsapproximately 5% of the world’s cultivated land, includinga third of the irrigated land, and represents a majorlimitation to agricultural production (Tester and Davenport2003; Rengasamy 2006). In the cereals, sodium (Na+) isregarded as the major source of toxicity, with the leavesbeing the principal site of accumulation and damage due tothe delivery of Na+ over time via the transpiration stream(Tester and Davenport 2003; Munns and Tester 2008). Highconcentrations of Na+ in the apoplast can cause cellulardehydration, while in the cytoplasm Na+ can interfere withmetabolic functions by competing with K+ for binding tomany enzymes that require K+ as a cofactor (Tester andDavenport 2003). Plants can avoid Na+ toxicity by seques-tering excess Na+ in the vacuole or by reducing net Na+
entry into the transpiration stream and subsequent accumu-lation in vegetative tissues. Therefore, an ability to maintaina low Na+ concentration or a high K+/Na+ ratio in the leavesis considered as an indicator of potential salinity tolerance.In studies comparing genotypes within some cereal species,these traits have been found to be correlated with salinitytolerance (Yeo and Flowers 1986; Chhipa and Lal 1995;Munns and James 2003; Poustini and Siosemardeh2004; Chen et al. 2007). However, in other studies, no
Y. Shavrukov (*) : J. Miyazaki :M. Tester : P. Langridge :N. C. CollinsAustralian Center for Plant Functional Genomics,School of Agriculture, Food and Wine, University of Adelaide,Urrbrae, Adelaide, South Australia 5064, Australiae-mail: [email protected]
N. K. GuptaDepartment of Plant Physiology,Rajasthan Agricultural University, SKN College of Agriculture,Jobner, Jaipur 303-329, India
M. N. BahoDepartment of Biology, College of Science,Al-Mustansiriya University,Baghdad, Iraq
K. J. ChalmersMolecular Plant Breeding Cooperative Research Center,University of Adelaide,Urrbrae, SA 5064, Australia
Funct Integr Genomics (2010) 10:277–291DOI 10.1007/s10142-009-0153-8

such correlation was detected (Gorham et al. 1990; Isla etal. 1997; Royo and Aragüés 1999; Munns and James 2003;Genc et al. 2007), which may reflect the occurrence of tissueNa+ accumulation levels insufficient to cause toxicity(Munns and Tester 2008) or variation for other tolerancemechanisms within the evaluated germplasm. As a species,barley exhibits poorer Na+ exclusion and K+/Na+ selectivitythan bread wheat but possesses a comparable or superiorlevel of salinity tolerance, suggesting that it has relativelyeffective mechanisms to tolerate Na+ in tissues (Gorham etal. 1990; Munns and James 2003; Colmer et al. 2005).Therefore, improvement of Na+ exclusion or K+/Na+
selectivity might represent a good opportunity for furtherenhancing the salinity tolerance of barley.
Salinity tolerance is a difficult trait to score in the fieldand is often genetically complex. Hence, identification ofsalinity tolerance loci and their selection using molecularmarkers is needed to assist in the breeding of salt-tolerantcrops. Some progress has been made in identifying locicontrolling salinity tolerance in the cultivated Triticeaecereals (wheat and barley). Quantitative trait loci (QTL)have been identified on all barley chromosomes, forgermination in saline solution and various growth param-eters measured in saline hydroponic culture (Mano andTakeda 1997; Ellis et al. 1997, 2002) or for yieldcomponents, growth traits, and Na+ or K+ accumulation inplants grown in salt-treated soil in the field (Xue et al.2009). In a pot experiment, a major QTL for shoot Na+
accumulation was identified on barley 1HL (Lonergan et al.2009). Using wheat–Hordeum spp. disomic chromosomeaddition lines, Forster et al. (1990) was able to attributecontrol of growth and yield traits in saline hydroponics tobarley chromosomes 4H and 5H of Hordeum vulgare andchromosomes 1Hch, 4Hch, and 5Hch of Hordeum chilense.As pointed out by Colmer et al. (2006), results of a studyby Gorham et al. (1990) also suggested that barleychromosomes 6H and 7H could enhance Na+ exclusion orK+/Na+ ratios in a wheat background. Mutations at thebarley Eri-e locus on chromosome 5H which result in asemidwarf growth habit were also correlated with low shootNa+ accumulation (Pakniyat et al. 1997a, b; Forster 2001).In wheat, QTL for growth traits in saline hydroponics werelocated on several chromosomes (Ma et al. 2007), whileloci on chromosomes 5B and 5D were reported to affectyield primarily in field sites under saline irrigation (Quarrieet al. 2005). Compared to cultivated tetraploid wheat(durum wheat; Triticum turgidum ssp. durum; genomeAABB), hexaploid wheat (Triticum aestivum; genomeAABBDD) accumulates less Na+ in the shoot relative toK+, and this trait has been attributed mainly to the Kna1gene on chromosome 4D (Gorham et al. 1987; Dubcovskyet al. 1996; Luo et al. 1996). The Nax1 gene onchromosome 2A and the Nax2 gene on chromosome 5A,
which have been introgressed from Triticum monococcuminto durum wheat, enable lower Na+ concentrations to bemaintained in the shoot or leaf blades (Lindsay et al. 2004;James et al. 2006). Genes encoding members of the HKTclass of Na+ and K+ transporters colocate with Nax1, Nax2,and Kna1 and are regarded as strong candidates for thegenes controlling the Na+ accumulation traits at these loci(Huang et al. 2006; Byrt et al. 2007). Members of thistransporter family also appear to control some naturalvariation in Na+ accumulation in rice (Ren et al. 2005) andArabidopsis (Rus et al. 2006). During efforts to transfersalinity tolerance from wild relatives into wheat, salinitytolerance or shoot Na+ exclusion traits were found to beassociated with additions of chromosomes 2Eb and 5Ebfrom Thinopyrum bessarabicum (formerly Agropyron jun-ceum; Forster et al. 1988; Mahmood and Quarrie 2006),chromosome 5A of Thinopyrum ponticum (Wang et al.2008) and several chromosomes of Lophopyrum elongatum(Elytrigia elongata), especially 3E (Omielan et al. 1991;Zhong and Dvorak 1995; Mullan et al. 2007).
The domestication process resulted in a significantnarrowing of the genetic base of cultivated barley (H.vulgare) relative to its closest wild progenitor (H. vulgaressp. spontaneum), as demonstrated by molecular markerdiversity studies (Russell et al. 2004; Caldwell et al. 2006).Consequently, wild barley offers a valuable repository ofvariation that can be utilized for barley improvement, and anumber of studies have demonstrated variation for shootNa+ accumulation and other salinity tolerance traits amongH. vulgare ssp. spontaneum accessions (Forster et al. 1997;Pakniyat et al. 1997c; Mano and Takeda 1998; Ellis et al.2000; Shavrukov et al. 2006; Yan et al. 2008). OtherHordeum species, such as Hordeum marinum, possessextreme levels of salinity tolerance (Garthwaite et al.2005; Colmer et al. 2006). However, while H. vulgaressp. spontaneum can readily form fertile hybrids with H.vulgare, crossability barriers prevent exploitation of thesehalophytic Hordeum species for barley improvementthrough common breeding methods (Pickering and Johnson2005). At the University of Adelaide, over 92 diversebarley genotypes have been tested in a variety ofindependent experiments in saline hydroponic culture.These lines included both wild and cultivated barleys,parents of mapping populations, and some reportedly salt-tolerant accessions. The H. vulgare ssp. spontaneumaccession CPI-71284-48 was found to be one of the bestshoot Na+ excluders (based on measurement in the thirdleaf), while Barque-73 was intermediate (Shavrukov,Coventry, and Tester, unpublished data). In the currentstudy, genetic analysis of Barque-73×CPI-71284-48crosses showed that control of the Na+ exclusion trait fromCPI-71284-48 could be attributed to a single QTL onchromosome 7H, which we name HvNax3. We fine-map
278 Funct Integr Genomics (2010) 10:277–291
the locus and identify candidates for the HvNax3 genethrough comparisons to the sequenced rice and Brachypo-dium genomes. We discuss validation of the CPI-71284-48-derived HvNax3 allele as a potential source of salinitytolerance for use in barley breeding.
Materials and methods
Mapping populations
Mapping populations were derived from crosses betweenH. vulgare line Barque-73 and H. vulgare ssp. spontaneumaccession CPI-71284-48. Barque-73 is a selection from thehigh-yielding South Australian feed cultivar Barque. TheF1-derived doubled-haploid (DH) population of 72 lines hasbeen described (Hearnden et al. 2007). The population of325 BC2F1-derived DH lines (AB-QTL population) hasbeen described by Eglinton et al. (2004). These lines carrychromosome segments from CPI-71284-48 introgressedinto the Barque-73 background. The initial choice ofparents of the DH populations was partly based on inferreddifferences in osmotic adjustment mechanisms (Eglinton etal. 2000). Two F2 populations, of 192 plants and 960 plants,were also produced from the Barque-73×CPI-71284-48cross. Heads of marker-selected F2 recombinants for theHvNax3 chromosome region were bagged to prevent crosspollination and used to produce F3 family seed forphenotype analysis. Seeds of the parents, F2 family, andDH lines were provided by the Molecular Plant BreedingCRC (MPB-CRC), Adelaide, Australia.
DNA extraction
DNA extraction was carried out in racks of 96×1.1-mlMicroTubes (National Scientific, USA). Per sample, twosections of a fourth leaf (approximately 30 mm long) from a4-week-old seedling were used. Samples were frozen at−80°C for 1 h and freeze-dried overnight at −60°C undervacuum in a freeze-drier (Model Alpha 1-2/LD, Christ,Germany). One stainless steel 4-mm ball bearing was addedto each well and the tissue ground in a mixer mill (ModelMM 300, Retsch Mill, Germany) for 5 min using afrequency of 25 oscillations per second. After removing theball bearings with a magnet, 600 μl of extraction buffer(0.1 M Tris–HCl, pH 7.5; 0.05 M EDTA, pH 8.0; 1.25%sodium dodecyl sulfate) was added to each tube beforesealing the plates with caps and shaking thoroughly. Sampleswere incubated at 65°C for 30 min, then at 15 min at 4°C,before adding 300 μl of cold (4°C) 6 M ammonium acetate.Tubes were shaken vigorously, incubated for a further15 min at 4°C, centrifuged for 15 min at 4,000 rpm(centrifuge Model 2–5, Sigma, USA), and 600 μl superna-
tant was transferred to new tubes. Samples were combinedwith 360 μl isopropanol, incubated at room temperature for15 min, and centrifuged for 15 min at 4,000 rpm. Thesupernatant was discarded, and the remaining fluid drainedfrom the DNA pellet by inversion on paper towel. Pelletswere washed in 400 μl of 70% ethanol before spinning for15 min at 4,000 rpm and removing the supernatant. Pelletswere resuspended in 400 μl of milli-Q water by incubationovernight at 4°C and vortexing. Samples were centrifugedfor 20 min at 4,000 rpm to remove insoluble material, and300 μl of the supernatant was transferred to a 96-wellmicrotiter plate. These samples were used directly astemplates in polymerase chain reactions (PCRs).
SSR and DArT markers
The F1-derived DH population had been scored for 1,000SSR and DArT markers (Hearnden et al. 2007). The AB-QTL population was scored for 180 SSR markers (MPB-CRC, unpublished). SSR markers Bmag914, GBM-1519,EBmatc16, and Bmag359 were rescored in the selected AB-QTL recombinant DH lines, using PCR reactions of 14 μlcontaining 6 μl of DNA, 2 mM MgCl2, 0.2 mM each ofdNTPs, 0.25 μM of each primer, 0.75 units of Platinum TaqDNA polymerase (Invitrogen), and 1× buffer supplied withthe enzyme. Amplification was carried out in a PTC-100thermal cycler (MJ Research) with the following program:93°C for 2 min; 40 cycles of 93°C for 10 s, 55°C for 30 s,and 72°C for 30 s; 72°C for 10 min. PCR products wereseparated by electrophoresis in 2% agarose gels andvisualized under UV light with ethidium bromide staining.
Rice and Brachypodium colinearity and CAPS markers
SSR and DArT markers from the barley QTL interval wereused to establish links to the rice genome. For the HvPLASC1and HvSS1 SSR markers, sequences of barley plastocyaninand sucrose synthase genes on which these markers werebased (accessions Z28347 and X73221, respectively) wereused in BLASTn searches at the National Center forBiotechnology Information (NCBI; http://www.ncbi.nlm.nih.gov/) to locate regions of sequence similarity in the ricegenome. For the remaining SSRs, primer sequences wereobtained from GrainGenes (http://wheat.pw.usda.gov/GG2/)or from Ramsay et al. (2000; Supplemental material) andused in BLASTn searches at NCBI to identify matchingbarley expressed sequence tags (ESTs) which could be usedto perform searches against rice. SSR marker Bmag914 waslinked to rice via an EST that matched only one of the twoprimers. For all other SSRs linked to rice chromosome 6, thebarley EST used to search rice perfectly matched both SSRprimers in opposing directions. Sequences of DArT probeswere provided by Diversity Arrays Technology Pty. Ltd.
Funct Integr Genomics (2010) 10:277–291 279
(http://www.diversityarrays.com/sequences.html) and werealso used to search the rice genome.
Cleaved amplified polymorphic sequence (CAPS)markers were developed using colinearity with rice,following the methods of Chen et al. (2009). Thecorresponding rice chromosome 6 interval forms part ofan ancient duplication present in both rice and the Triticeae(“block 7”; Salse et al. 2008). Consequently, BLASTnsearches revealed that many of the genes from this regionalso had close homologs on rice chromosome 2. For genesADA and ABD with homologs on rice chromosome 6 and 2,primers were designed to be specific for the barley ESTsequences that most closely matched the chromosome 6gene copy. Genes with a copy on chromosome 6 but notelsewhere in the rice genome were chosen for generation ofall the other markers. Primers were located in exons andwere placed so as to amplify gene fragments containingmostly intron. The CAPS markers (Table 1) were amplifiedin 10-μl reactions containing 2 μl of genomic DNA, 2 mMMgCl2, 0.2 mM each of dNTPs, 0.25 μM each primer, 0.75units of Platinum Taq DNA polymerase, and 1× buffer
supplied with the enzyme. The following PCR program wasused, in a PTC-100 thermal cycler: 94°C for 2 min; 40cycles of 94°C for 10 s, 55°C for 30 s, and 68°C for 2 min;68°C for 10 min. The entire 10 μl of PCR product wassubjected to restriction enzyme digestion for 4 h in a volumeof 15 μl, under conditions recommended by the enzymemanufacturers (New England BioLabs, UK; Fermentas,Lithuania). Products were separated by electrophoresis on0.8–2% agarose gels.
BLAST searches against the Brachypodium 8× coveragegenome sequence release were performed at http://www.brachybase.org/blast/.
Determination of leaf Na+ and K+ concentrations
Seeds were germinated for 4 days at room temperature onmoist filter paper before being transplanted into tubs filledwith 3-mm-diameter polycarbonate fragments (PlasticsGranulating Services, Adelaide, Australia). Tubs wereirrigated with the growth solution (Genc et al. 2007)maintained at pH 6.5–7.0, using a 20-min flood/20-min
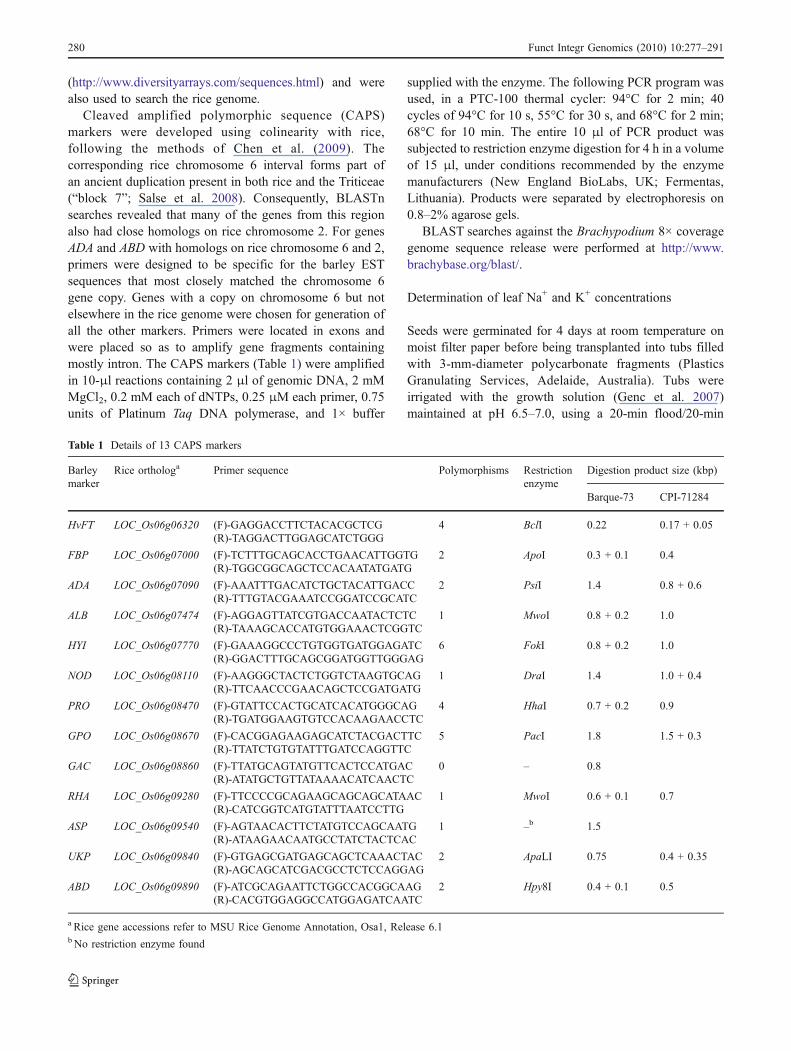
Table 1 Details of 13 CAPS markers
Barleymarker
Rice orthologa Primer sequence Polymorphisms Restrictionenzyme
Digestion product size (kbp)
Barque-73 CPI-71284
HvFT LOC_Os06g06320 (F)-GAGGACCTTCTACACGCTCG 4 BclI 0.22 0.17 + 0.05(R)-TAGGACTTGGAGCATCTGGG
FBP LOC_Os06g07000 (F)-TCTTTGCAGCACCTGAACATTGGTG 2 ApoI 0.3 + 0.1 0.4(R)-TGGCGGCAGCTCCACAATATGATG
ADA LOC_Os06g07090 (F)-AAATTTGACATCTGCTACATTGACC 2 PsiI 1.4 0.8 + 0.6(R)-TTTGTACGAAATCCGGATCCGCATC
ALB LOC_Os06g07474 (F)-AGGAGTTATCGTGACCAATACTCTC 1 MwoI 0.8 + 0.2 1.0(R)-TAAAGCACCATGTGGAAACTCGGTC
HYI LOC_Os06g07770 (F)-GAAAGGCCCTGTGGTGATGGAGATC 6 FokI 0.8 + 0.2 1.0(R)-GGACTTTGCAGCGGATGGTTGGGAG
NOD LOC_Os06g08110 (F)-AAGGGCTACTCTGGTCTAAGTGCAG 1 DraI 1.4 1.0 + 0.4(R)-TTCAACCCGAACAGCTCCGATGATG
PRO LOC_Os06g08470 (F)-GTATTCCACTGCATCACATGGGCAG 4 HhaI 0.7 + 0.2 0.9(R)-TGATGGAAGTGTCCACAAGAACCTC
GPO LOC_Os06g08670 (F)-CACGGAGAAGAGCATCTACGACTTC 5 PacI 1.8 1.5 + 0.3(R)-TTATCTGTGTATTTGATCCAGGTTC
GAC LOC_Os06g08860 (F)-TTATGCAGTATGTTCACTCCATGAC 0 – 0.8(R)-ATATGCTGTTATAAAACATCAACTC
RHA LOC_Os06g09280 (F)-TTCCCCGCAGAAGCAGCAGCATAAC 1 MwoI 0.6 + 0.1 0.7(R)-CATCGGTCATGTATTTAATCCTTG
ASP LOC_Os06g09540 (F)-AGTAACACTTCTATGTCCAGCAATG 1 –b 1.5(R)-ATAAGAACAATGCCTATCTACTCAC
UKP LOC_Os06g09840 (F)-GTGAGCGATGAGCAGCTCAAACTAC 2 ApaLI 0.75 0.4 + 0.35(R)-AGCAGCATCGACGCCTCTCCAGGAG
ABD LOC_Os06g09890 (F)-ATCGCAGAATTCTGGCCACGGCAAG 2 Hpy8I 0.4 + 0.1 0.5(R)-CACGTGGAGGCCATGGAGATCAATC
a Rice gene accessions refer to MSU Rice Genome Annotation, Osa1, Release 6.1b No restriction enzyme found
280 Funct Integr Genomics (2010) 10:277–291
drain cycle in a greenhouse at 15–25°C under naturaldaylight with a photoperiod 16 h. The roots under theseconditions are well oxygenated, due to the long breaksbetween flooding cycles and aeration of the hydroponicsolution resulting from the flood/drain process. When thethird leaf had emerged (approximately tenth day inhydroponics), NaCl was added twice daily in 25-mM stepsuntil a final concentration of 150 mM NaCl was reached.Calcium activity was calculated using the Visual MINTEQcomputer program (Department of Land and Water Resour-ces Engineering, Stockholm, Sweden). This was 0.98 mMin the initial growth solution, and it was maintained at thislevel by providing additional CaCl2 as needed with theNaCl treatments. Ten days after first adding additionalNaCl, the third leaf was harvested (cut just above theauricle; sheath excluded), and fresh and dry weights wererecorded before the leaf was digested in 10 ml of 1% HNO3
at 85°C for 4 h using a Teflon hot-block (EnvironmentalExpress, USA). Concentrations of Na+ and K+ weredetermined by flame photometry (Sherwood, UK, model420, with a model 860 autosampler) and mainly expressedas concentration in the plant sap (tissue water basis), i.e.,concentration in digest based on comparison to knownstandards × [(total volume of digest) ÷ (fresh − dry weightof leaf sample)]. This measure enables direct comparisonsto be made between concentrations in the leaf and theexternal solution.
F1-derived DH lines, selected recombinant AB-QTL DHlines, and parental genotypes were assessed by determiningaverage Na+ and K+ concentrations in the third leaf of fourindividuals per genotype. Replicate plants of each genotypewere arranged in rows (plots), while genotypes wereordered randomly. For the AB-QTL lines, plants weregrown in two hydroponics tubs fed by a common reservoirof nutrient solution, and data were analyzed using arestricted maximum likelihood (REML) linear mixedmodel, with genotype, plot, and tub set as random effects.For this experiment, duplicate plots of each parentalgenotype were included (one per tub).
HvNax3 genotype of each marker-selected F2 recombi-nant was determined by measuring Na+ accumulation in 96F3 progeny individuals. Each family was grown in aseparate hydroponic tub. In each F3 family, the inheritanceof the recombinant and nonrecombinant chromosomes wasfollowed by scoring each F3 plant for CAPS markers FBPand ALB (family 191) or ALB and ABD (remainingfamilies), enabling background phenotypic variation to bedistinguished from variation controlled by HvNax3 segre-gation. Marker analyses were performed after transplanting,so F3 individuals of contrasting marker genotypes werearranged randomly in the tubs. Within each F3 family,means of Na+ content in F3 plants of the contrastinghomozygous marker genotype classes (20 to 30 of each
type per family) were compared by Student’s t test (unpaired,equal variance assumed). Significant or nonsignificant differ-ences were taken to indicate that HvNax3 was heterozygousor homozygous in the parent F2 recombinant plant, respec-tively. F3 families were analyzed in the greenhouse at varioustimes of the year. Temperatures in the greenhouse rangedfrom 18–29°C in summer to 12–22°C in winter, while daylength was 16 h in summer and 10 h (including 2-h extensionusing supplemental lighting) in winter.
Genetic mapping
Analysis of Na+ and K+ accumulation QTLs in the F1-derived DH population was performed using MapManagerQTX (Manly et al. 2001). The QTL plot (Fig. 1) wasobtained using the Q-Gene computer program, version 4(http://www.qgene.org).
For genetic map construction, locus order was determinedmanually by inspecting graphical genotypes and ordering theloci in such a way as to minimize double recombinants.Recombination fractions were converted to centiMorgandistances using the Kosambi mapping function.
The rice chromosome 6 centromere location wasobtained from http://rgp.dna.affrc.go.jp/cgi-bin/statusdb/irgsp-status.cgi. Centromere locations in barley wereinferred by links of barley markers to wheat EST deletionmapping data (Qi et al. 2004; http://wheat.pw.usda.gov/cgi-bin/westsql/map_locus.cgi). Barley markers were allocatedto chromosome arms by direct homology to mapped wheatESTs or because they showed homology to rice chromo-some 6 regions with matches to mapped wheat ESTs (asidentified using the NSF Rice Genome Browser at http://rice.plantbiology.msu.edu/cgi-bin/gbrowse/rice/). Thisapproach for inferring the location of barley centromeresrequires that centromere positions are conserved betweenwheat and barley, and available data (e.g., Bilgic et al.2007) indicate this is the case.
Results
QTL mapping in the F1-derived DH population
In hydroponics solution containing 150 mM NaCl, the thirdleaves of parental lines Barque-73 and CPI-71284-48accumulated 252±7.9 and 187±6.6 mM Na+, respectively,and 117±6.2 and 130±8.3 mM K+, respectively. When theBarque-73×CPI-71284-48 F1-derived DH population wasassessed for K+ accumulation, no QTL were found.However, a single strong Na+ accumulation QTL wasrevealed near the middle of the chromosome 7H geneticmap, in the 13.9-cM interval between markers Bmag914and HvSS1, where it was most closely associated with the
Funct Integr Genomics (2010) 10:277–291 281

DArT marker bPb-1209 and the microsatellite markerGBM1519 (Fig. 1). This does not correspond to the locationof the named Na+ exclusion loci Nax1, Nax2, or Kna1 inwheat, so we named the barley locus HvNax3. The wildparent (CPI-71284-48) conferred low Na+ accumulation.The QTL showed a maximum logarithm of the odds (LOD)score of 9.9 (LRS 45.6) and accounted for 51% of thephenotypic variation. A nearby QTL peak of lowersignificance located nearby suggested that there may be asecond QTL on chromosome 7H (Fig. 1). No other Na+
accumulation QTL was detected, even at the “suggestive”level (LOD>1.6). QTL analysis was also performed on Na+
content of the third leaf expressed as millimoles per gramdry weight or fresh weight. The QTL plots on chromosome7H were practically identical to those produced by Na+
concentration based on tissue water (not shown). Further-more, no significant QTL for dry or fresh weight of thethird leaf was observed in this chromosome region (notshown). Therefore, the HvNax3 QTL effect on chromosome7H appeared to be unrelated to any potential differences intissue water content or growth rate.
Colinearity with rice and CAPS marker generation
SSR and DArT markers located throughout the 0–114.9-cMregion of the Barque-73×CPI-71284-48 chromosome 7Hmap (Hearnden et al. 2007) containing HvNax3 QTL(Fig. 2a) were used in sequence similarity searches of therice genome. Similarity to rice sequences could beestablished with 16 of the markers. bPb-366, bPb-1209,
Fig. 1 Chromosome 7H QTLfor sodium exclusion mapped inthe F1-derived DH population.Dotted line indicates the highlysignificant LOD level (3.0). Thecentromere (Cen.) location isinferred by links to wheatdeletion mapping data
282 Funct Integr Genomics (2010) 10:277–291
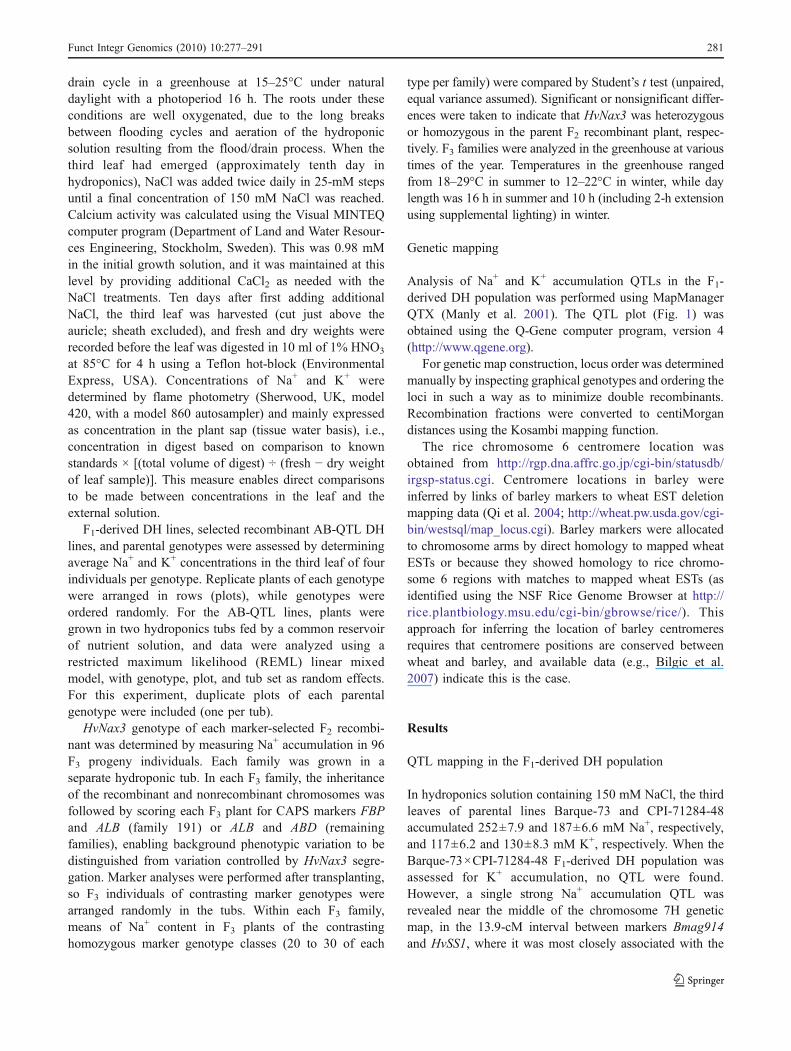
GBM1319, GBM1452, scind149, and GBM1334 identifiedhomologous sequences on a variety of chromosomes,revealing no consistent relationship to any one region.However, the remaining ten markers identified relatedsequences on rice chromosome 6, between nucleotidepositions 0.15 and 28.6 Mb (AP008212.1). These occurredin the same order as the markers in barley, except forGBM1519, which had a location on rice chromosome 6 thatwas displaced relative its mapped location in barley(Fig. 2a, b). The HvPLASC1 gene, representing the mostdistal marker on the short arm of the 7H map of Hearndenet al. (2007), identified a homolog located only 150 kbfrom the end of the short arm of rice chromosome 6,suggesting that the location of this telomere relative to othersequences was conserved between barley and rice. Triticeaegroup 7 chromosomes are reported to be colinear with ricechromosome 6, except for a genetically small region nearthe centromere which is related to rice chromosome8 (Hossein et al. 2004; Stein et al. 2007; Salse et al.2008). Our findings are generally consistent with theseknown relationships. Presumably, the failure to detectsimilarity to rice chromosome 8 was because an insufficientnumber of markers were examined from that chromosomesegment.
The rice chromosome 6 interval containing the HvNax3QTL (Bmag914 to HvSS1) showed similarity to wheat ESTsthat had been located to the short arms of wheat group 7chromosomes by deletion mapping, including ESTBF474552 with similarity to HvSS1. From this, it wasinferred that the Na+ accumulation QTL interval waslocated on the short arm of barley chromosome 7H(Fig. 2a). GBM1102, which is the next marker belowHvSS1 with a link to rice, was located in a region of ricechromosome 6 showing similarity to wheat ESTs located tothe long arms of wheat group 7 chromosomes, placing thecentromere on barley chromosome 7H between HvSS1 andGBM1102 (Fig. 2a).
To increase the marker density in the HvNax3 region,CAPS markers were generated from barley homologs ofrice genes located in the corresponding region in ricechromosome 6 (Table 1). All 13 primer pairs producedsingle PCR products from genomic DNA of both mappingparents, ranging in size from 0.22 to 1.8 kb. Sequencing ofthe products totalling 12.37 kb from each parent revealed31 sequence polymorphisms, giving an average frequencyof one polymorphism per 399 bp (Table 1). Genes ABD,GPO, and UKP showed insertion/deletion polymorphismsof four, three, and ten nucleotides, respectively, while the
Fig. 2 Barley and ricecomparative maps. a Barleygenetic map made using the F1-derived DH population, includ-ing SSR and DArT (bPb)markers and the HvNax3 QTLinterval (vertical bar). bCorresponding interval on ricechromosome 6 genomicsequence (AP008212.1). cExpanded view of rice intervalcorresponding to the HvNax3QTL region. d Barley compositegenetic map constructed usingAB-QTL and F2 populations.Locations of putative orthologson the rice and barley maps arejoined by dotted lines.Centromere (Cen.) locations areindicated, with those in barleybeing inferred by links to wheatdeletion mapping data
Funct Integr Genomics (2010) 10:277–291 283
other 28 polymorphisms were single-nucleotide substitutions.The GAC gene fragment showed no polymorphisms, whilethe single polymorphism in the ASP fragment was notlocated in any restriction enzyme recognition site and wasnot used to make a marker. Polymorphisms in the remaining11 genes were used to generate CAPS markers (Table 1).
AB-QTL population
A total of 22 lines from the AB-QTL population werechosen for analysis, representing a subset of lines carryingjunctions of introgression segments in the marker interval
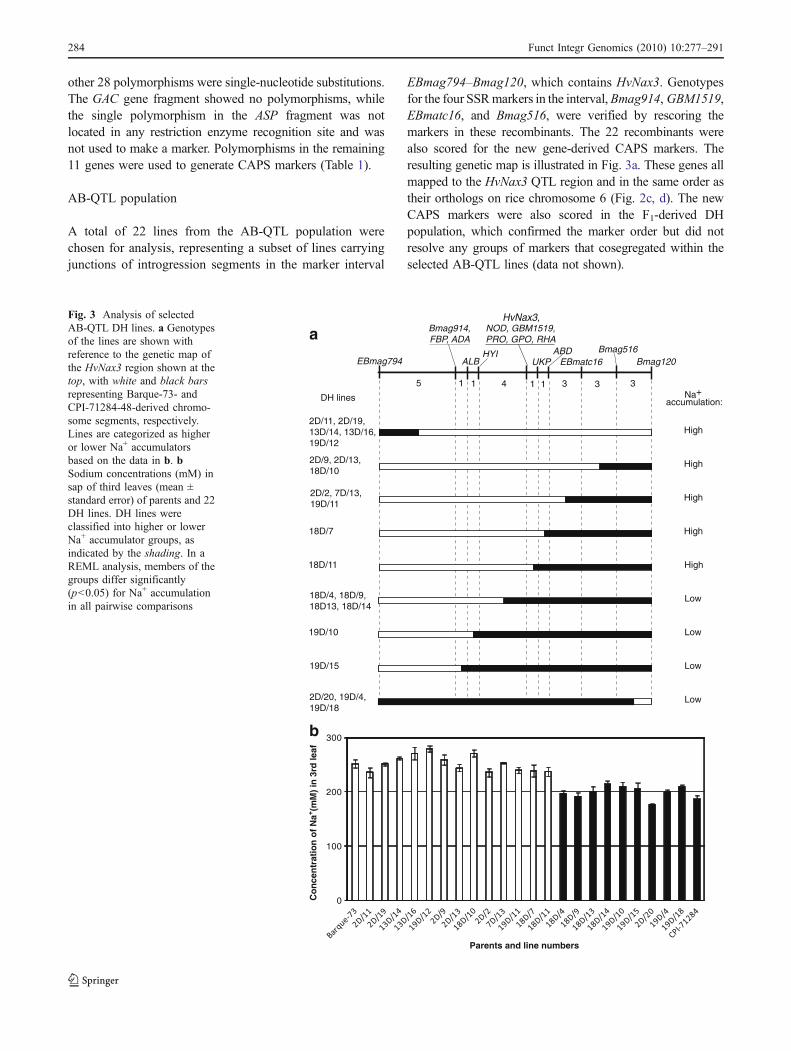
EBmag794–Bmag120, which contains HvNax3. Genotypesfor the four SSRmarkers in the interval,Bmag914, GBM1519,EBmatc16, and Bmag516, were verified by rescoring themarkers in these recombinants. The 22 recombinants werealso scored for the new gene-derived CAPS markers. Theresulting genetic map is illustrated in Fig. 3a. These genes allmapped to the HvNax3 QTL region and in the same order astheir orthologs on rice chromosome 6 (Fig. 2c, d). The newCAPS markers were also scored in the F1-derived DHpopulation, which confirmed the marker order but did notresolve any groups of markers that cosegregated within theselected AB-QTL lines (data not shown).
18D/11
19D/15
2D/20, 19D/4,19D/18
19D/10
18D/4, 18D/9,18D13, 18D/14
18D/7
2D/2, 7D/13,19D/11
2D/9, 2D/13,18D/10
2D/11, 2D/19,13D/14, 13D/16,19D/12
ALBHYI
UKP
DH lines
HvNax3, Bmag914,FBP, ADA
ABDEBmatc16
Bmag516
NOD, GBM1519,PRO, GPO, RHAa
Na+ accumulation:
High
High
High
High
High
Low
Low
Low
Low
1 1 4 1 1 3 3 3
Bmag120EBmag794
5
0
100
200
300
Co
nce
ntr
atio
n o
f N
a+ (mM
) in
3rd
leaf
Parents and line numbers
b
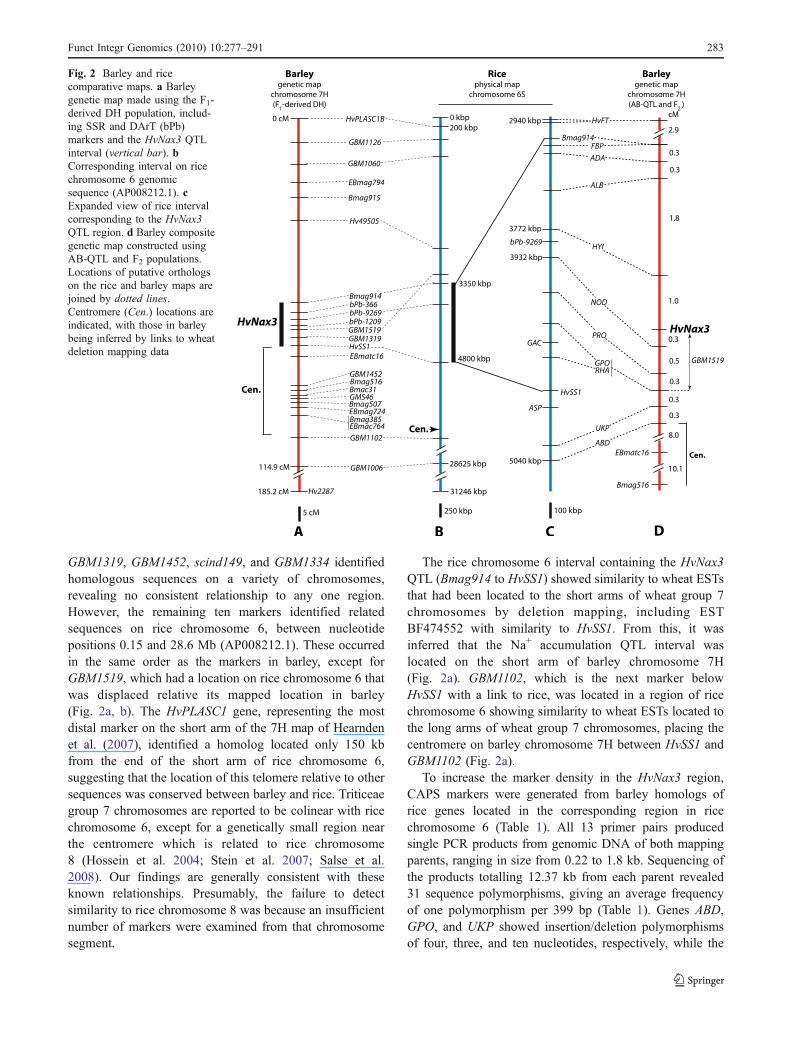
Fig. 3 Analysis of selectedAB-QTL DH lines. a Genotypesof the lines are shown withreference to the genetic map ofthe HvNax3 region shown at thetop, with white and black barsrepresenting Barque-73- andCPI-71284-48-derived chromo-some segments, respectively.Lines are categorized as higheror lower Na+ accumulatorsbased on the data in b. bSodium concentrations (mM) insap of third leaves (mean ±standard error) of parents and 22DH lines. DH lines wereclassified into higher or lowerNa+ accumulator groups, asindicated by the shading. In aREML analysis, members of thegroups differ significantly(p<0.05) for Na+ accumulationin all pairwise comparisons
284 Funct Integr Genomics (2010) 10:277–291
The 22 AB-QTL DH lines were grown in a hydroponicsolution containing 150 mMNaCl, and Na+ concentrations inthe third leaves were measured. The lines could becategorized into two groups, showing either higher accumu-lation (>236 mM; average 251±8.5 mM), similar to Barque-73 (252±7.9 mM), or lower Na+ accumulation (<214 mMsodium; average 197±8.4 mM), similar to CPI-71284-48(187±6.6 mM; Fig. 3b). This assignment of lines to the CPI-71284-48 or Barque-73 HvNax3 allele type enabled theHvNax3 locus to be placed on the map, between the CAPSmarkers HYI and UKP, and cosegregating with the markersNOD, PRO, GPO, RHA, and GBM1519 (Fig. 3a).
F2 populations
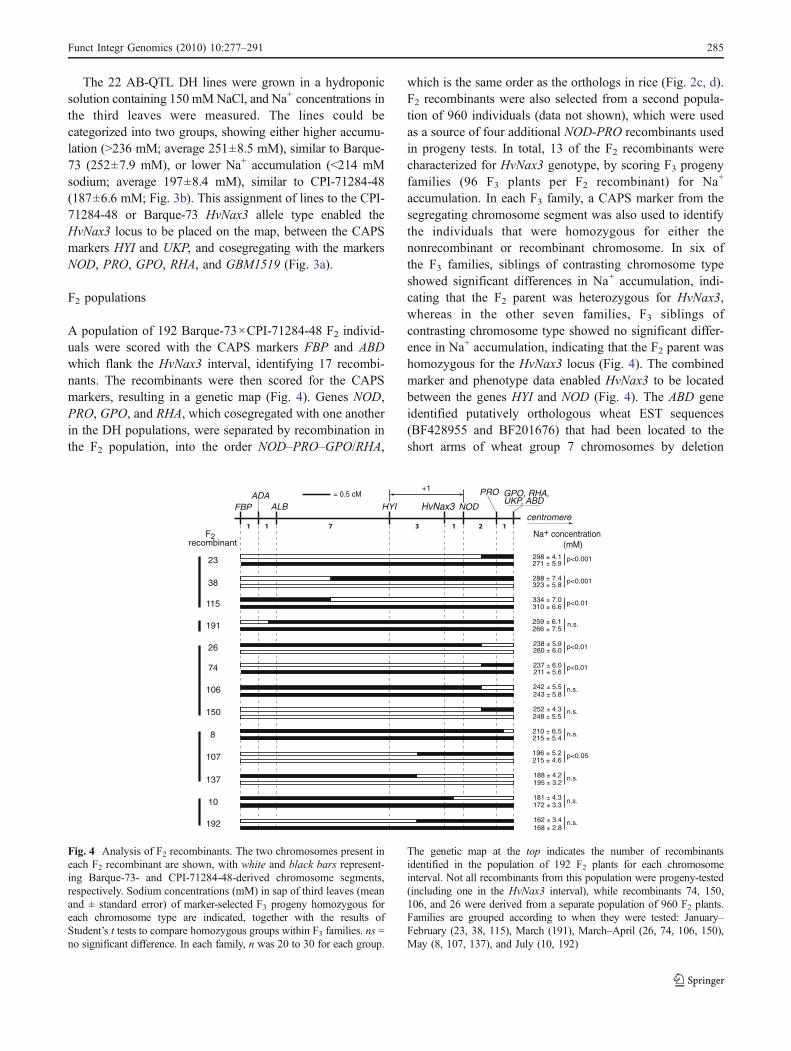
A population of 192 Barque-73×CPI-71284-48 F2 individ-uals were scored with the CAPS markers FBP and ABDwhich flank the HvNax3 interval, identifying 17 recombi-nants. The recombinants were then scored for the CAPSmarkers, resulting in a genetic map (Fig. 4). Genes NOD,PRO, GPO, and RHA, which cosegregated with one anotherin the DH populations, were separated by recombination inthe F2 population, into the order NOD–PRO–GPO/RHA,
which is the same order as the orthologs in rice (Fig. 2c, d).F2 recombinants were also selected from a second popula-tion of 960 individuals (data not shown), which were usedas a source of four additional NOD-PRO recombinants usedin progeny tests. In total, 13 of the F2 recombinants werecharacterized for HvNax3 genotype, by scoring F3 progenyfamilies (96 F3 plants per F2 recombinant) for Na+
accumulation. In each F3 family, a CAPS marker from thesegregating chromosome segment was also used to identifythe individuals that were homozygous for either thenonrecombinant or recombinant chromosome. In six ofthe F3 families, siblings of contrasting chromosome typeshowed significant differences in Na+ accumulation, indi-cating that the F2 parent was heterozygous for HvNax3,whereas in the other seven families, F3 siblings ofcontrasting chromosome type showed no significant differ-ence in Na+ accumulation, indicating that the F2 parent washomozygous for the HvNax3 locus (Fig. 4). The combinedmarker and phenotype data enabled HvNax3 to be locatedbetween the genes HYI and NOD (Fig. 4). The ABD geneidentified putatively orthologous wheat EST sequences(BF428955 and BF201676) that had been located to theshort arms of wheat group 7 chromosomes by deletion
F2 recombinant
Na+ concentration (mM)
FBP ALB HYI
PRO GPO, RHA,UKP, ABD
NODADA = 0.5 cM
HvNax3centromere
+1
23 298 ± 4.1271 ± 5.9
p<0.001
237 ± 6.0211 ± 5.6
p<0.0174
252 ± 4.3248 ± 5.5
n.s.150
106 242 ± 5.5243 ± 5.8
n.s.
238 ± 5.9260 ± 6.0 p<0.0126
10181 ± 4.3172 ± 3.3
n.s.
196 ± 5.2215 ± 4.6
p<0.05107
188 ± 4.2195 ± 3.2
n.s.137
162 ± 3.4168 ± 2.8
n.s.192
115 334 ± 7.0310 ± 6.6 p<0.01
38288 ± 7.4323 ± 5.8 p<0.001
191 259 ± 6.1266 ± 7.5
n.s.
8 210 ± 6.5215 ± 5.4
n.s.
Fig. 4 Analysis of F2 recombinants. The two chromosomes present ineach F2 recombinant are shown, with white and black bars represent-ing Barque-73- and CPI-71284-48-derived chromosome segments,respectively. Sodium concentrations (mM) in sap of third leaves (meanand ± standard error) of marker-selected F3 progeny homozygous foreach chromosome type are indicated, together with the results ofStudent’s t tests to compare homozygous groups within F3 families. ns =no significant difference. In each family, n was 20 to 30 for each group.
The genetic map at the top indicates the number of recombinantsidentified in the population of 192 F2 plants for each chromosomeinterval. Not all recombinants from this population were progeny-tested(including one in the HvNax3 interval), while recombinants 74, 150,106, and 26 were derived from a separate population of 960 F2 plants.Families are grouped according to when they were tested: January–February (23, 38, 115), March (191), March–April (26, 74, 106, 150),May (8, 107, 137), and July (10, 192)
Funct Integr Genomics (2010) 10:277–291 285

mapping, suggesting that the centromere was locatedproximal of ABD (and HvNax3) on barley chromosome7H (Fig. 2d). The 192 F2 individuals were also scored forthe CAPS marker made from the HvFT gene (= Vrn-H3;Yan et al. 2006), enabling HvFT to be mapped, 2.9 cMdistal of FBP (Fig. 2d).
Gene content of rice and Brachypodium intervals
Rice genes used for designing CAPS markers (HvFT toABD; Table 1) were used in BLASTn searches of the 8×coverage Brachypodium genome sequence release (http://www.brachybase.org/blast/), identifying a related chromo-some interval between 45.1 and 47.5 Mb on chromosomeBd1 (reverse orientation relative to rice and barley). Everyhomolog was located in this interval and in the same orderas in rice, indicating a high level of conservation betweenrice, Brachypodium, and barley in this chromosome region.
The 1.3-cM HvNax3 genetic interval in barley betweengenes HYI and NOD corresponds to intervals of 160 kb inrice and 132 kb in Brachypodium. The MSU Rice GenomeAnnotation (Osa1) annotation database (Yuan et al. 2005;Release 6.1, http://rice.plantbiology.msu.edu/cgi-bin/gbrowse/rice/) suggested that there were 30 genes in therice interval (Table 2). In an annotation of the Brachypo-dium interval (http://www.brachybase.org/cgi-bin/gbrowse/brachy8/), one additional gene was identified (encoding atranscription factor of the GAI, RGA, and SCR (GRAS)class; Table 2) which was not present in the rice interval. Therice interval contains a large tandem duplication, encompass-ing genes LOC_Os06g07860 to LOC_Os06g07941 andLOC_Os06g07960 to LOC_Os06g08060. In Brachypodium,this segment was present as a single (nonduplicated) copy.One class of gene (encoding 2-oxoglutarate-Fe (II) oxygen-ase) itself had four to five copies on each rice segment.Hence, while 31 genes were identified in the rice andBrachypodium intervals, these encode only 16 differentclasses of protein products. Of the genes listed in Table 2,several have predicted roles in solute transport or salinitytolerance and therefore represent potential candidates for thegene controlling the HvNax3 phenotype.
Discussion
Here, we show that a single locus (HvNax3) can account fora large proportion of this superior Na+ excluding ability ofCPI-71284-48 relative to cv. Barque. There are few reportsof loci that might correspond to HvNax3. In a populationderived from a cross between barley cultivars CM72 andGairdner, grown in the field in salt-treated soil, Xue et al.(2009) described a QTL for spike number per line(qSPL7s), closely associated with the DArT markers bPb-
1209 and pPb-366, which are in the vicinity of HvNax3(Fig. 2a). However, this QTL controlled only 7.52% of thevariation for this trait and had no detectable effect on Na+
accumulation. As pointed out by Colmer et al. (2006),when Gorham et al. (1990) assessed disomic chromosomeaddition lines of Chinese Spring wheat containing specificchromosomes of the barley cv. Betzes, in hydroponicsolution containing 60 mM NaCl, the chromosome 7Haddition line showed a reduced Na+ level and elevated K+
level in the shoots, suggesting that barley possesses one ormore genes on this chromosome that can improve K+/Na+
selectivity of wheat. Other studies reported no loci forsalinity tolerance or Na+ accumulation in the HvNax3region in barley (Ellis et al. 1997; Mano and Takeda 1997;Forster 2001; Ellis et al. 2002; Lonergan et al. 2009), or inthe equivalent chromosome locations in wheat or its wildrelatives (Forster et al. 1988; Dubcovsky et al. 1996; Luo etal. 1996; Quarrie et al. 2005; Huang et al. 2006; Mahmoodand Quarrie 2006; Byrt et al. 2007; Ma et al. 2007).
Na+ exclusion alleles of the wheat Kna1, Nax1, andNax2 loci also elevate shoot K+ content (Dubcovsky et al.1996; James et al. 2006). In contrast, HvNax3 had nodetectable effect on shoot K+ concentration. However, theeffect of the wheat genes on K+ is proportionately muchsmaller than on Na+, and the overall effect of these genes onNa+ accumulation is greater than that of HvNax3 (twofold tofivefold reduction, versus 10–25% reduction for HvNax3,relative to the nonexcluding alleles; Figs. 3 and 4).Therefore, any effect of HvNax3 on K+ may have beensimply too small to detect. Alternatively, HvNax3 may notinfluence K+ at all because its mode of action may befundamentally different from that of Kna1, Nax1, and Nax2.
Na+ concentrations observed in F3 families variedaccording to the time of year when families were tested,decreasing from the warmest period (January–February) tothe coolest period (July; Fig. 4). This relationship may arisebecause warmer temperatures can increase transpiration,which would result in an increased rate of Na+ delivery tothe leaves. In F3 families tested at the same times, the rangeof Na+ contents in plants of opposite HvNax3 genotypepartially overlapped (Fig. 4). However, in the AB-QTLlines, which were all tested at the same time, the Na+
distributions for lines of opposite HvNax3 genotype werenonoverlapping (Fig. 3b). This contrast between the F3 andAB-QTL derived data may reflect differences in minor Na+
exclusion genes between the backgrounds of the F3 familiesand, additionally, may be due to the relative uniformity ofthe genetic backgrounds of the backcross-derived AB-QTLlines. The background variation between the F3 families didnot interfere with our ability to determine HvNax3genotypes of the F2 recombinants, since our approach wasto compare averages for the contrasting chromosome 7Hsibling classes within each F3 family.
286 Funct Integr Genomics (2010) 10:277–291

Table 2 Genes in the HvNax3 intervals of rice and Brachypodium
Rice or Brachypodium orthologa (barley marker) Homology/inferred function
LOC_Os06g07770 (HYI) Contains DCD domain. DCD proteins are a plant-specific group ofproteins and presently have no ascribed function (Tenhaken et al. 2005)
LOC_Os06g07780 R-SNARE. Facilitate membrane fusion. Most similar to the threeR-VAMP71 subfamily members of Arabidopsis (http://www.tc.umn.edu/~sande099/atsnare.htm), which mediate vesicle fusion with thetonoplast (Uemura et al. 2004; Carter et al. 2004). Vesicle trafficking
LOC_Os06g07800 Hypothetical protein
LOC_Os06g07820 BSD-domain-containing protein (Doerks et al. 2002). BSD1(At1g10720) is among the most similar proteins in Arabidopsis andhas been shown to have transcription-factor-like properties(Park et al. 2009). Unknown biological function
LOC_Os06g07830 AP180 N-terminal homology (ANTH)-domain-containing protein.Most similar to ANTH proteins of Arabidopsis (Holstein andOliviusson 2005). Facilitate clathrin assembly inclathrin-dependent vesicle trafficking
LOC_Os06g07840 Hypothetical protein
LOC_Os06g07860, LOC_Os06g07960 Cystathionine beta-lyase. Most similar to a CBL protein in Arabidopsis(At5g57050) required for methionine biosynthesis (Levin et al. 2000)
Bradi1g47900 GRAS family transcription factor. Shows most similarity to the fivemembers of the DELLA subgroup in Arabidopsis (Bolle 2004)involved in gibberellins signaling (Cheng et al. 2004;Achard et al. 2006). Regulation of plant stature and development
LOC_Os06g07869, LOC_Os06g07969 Ubiquinol-cytochrome C reductase complex ubiquinone-binding protein.This complex is a component of the mitochondrial respiratory chain
LOC_Os06g07878, LOC_Os06g07978 26S proteasome α-3 subunit. Corresponds to PAC1 in Arabidopsis(At3G22110; Fu et al. 1999). Ubiquitin-mediated protein degradation
LOC_Os06g07887, LOC_Os06g07987 CAZy glycosyltransferase family 47, subgroup C2 (Li et al. 2004;http://www.cazy.org/), which includes the Arabidopsis XGD1xylogalacturonan xylosyltransferase (At5g332290; Jensen et al. 2008).Polysaccharide metabolism
LOC_Os06g07905, LOC_Os06g08005 CAZy glycosyltransferase family 31 (http://www.cazy.org/). Most similarto members of subgroup A-III in Arabidopsis, which include memberswith β-(1,3)-GalT activity (Qu et al. 2008). Polysaccharide metabolism
LOC_Os06g07896, LOC_Os06g07996 S15 type ribosomal protein. Protein translation
LOC_Os06g07914, LOC_Os06g07923, LOC_Os06g07932,LOC_Os06g07941, LOC_Os06g08014, LOC_Os06g08023,LOC_Os06g08032, LOC_Os06g08041, LOC_Os06g08060
2-oxoglutarate-Fe (II) oxygenase. Oxidoreductases of this type have arange of substrates. One of the closest matches in Arabidopsis is theLDOX leucoanthocyanidin dioxygenase (At4G22880), whichcontributes to the synthesis of flavonol glycosides (Stracke et al. 2009)
LOC_Os06g08080 (HVP10) Pyrophosphate-energized vacuolar membrane proton pump,H+-pyrophosphatase. Most similar to AVP1 (At1G15690) inArabidopsis, responsible for establishing a difference in electrochemicalpotential for H+ across the tonoplast. Corresponds to HVP10 in barley(Fukuda et al. 2004)
LOC_Os06g08090 Beta-glucuronidase (GUS). Most homologous to the three CAZyglycoside hydrolase family 79 members of Arabidopsis (Woo et al.2007; http://www.cazy.org/), at least one of which has been shown tohave GUS activity (Eudes et al. 2008). Polysaccharide metabolism
LOC_Os06g08100 Hypothetical protein
LOC_Os06g08110 (NOD) Similar to nodulins and the major facilitator superfamily (MFS) ofproteins. MFS proteins are transporters for various solutes (Pao et al. 1998)
a Rice gene accessions refer to MSU Rice Genome Annotation, Osa1, Release 6.1, except where a gene was present in the Brachypodium intervaland absent from the rice interval (Bradi1g47900, Brachypodium 8× assembly, http://www.brachybase.org/cgi-bin/gbrowse/brachy8/). Predictedgenes with similarity to retrotransposons were not included
Funct Integr Genomics (2010) 10:277–291 287
While an ability to exclude Na+ is often positivelyassociated with salinity tolerance, some studies have failedto identify such a relationship, suggesting that growthconditions or other factors may determine whether this is atrait that contributes to salinity tolerance (see “Introduction”).Therefore, HvNax3 needs to be tested to see if it canenhance yield under saline field conditions before it can beconsidered as a useful source of salinity tolerance forbarley breeding. DH lines from the AB-QTL populationwould be well suited to such an exercise because theycontain chromosome segments from the CPI-71284-48genome inserted into the background of the locallyadapted South Australian cultivar Barque and will mostlylack agronomically undesirable traits from the wild parentthat might otherwise confound such an analysis. Severalof the F2 recombinants identified in the fine mappingcould also be crossed to derive lines with only very smallintrogressions. These could be compared to the parentalline Barque-73 at a range of salt prone sites to obtain aclear indication of the value of the CPI-71284-48 allele.
A high level of conservation in gene order and contentwas observed between rice and Brachypodium and thechromosome 7H region containing HvNax3 (Fig. 2c, d, anddata not shown). High levels of rice–barley colinearity werealso recently described in detail for the region immediatelydistal of the HYI gene (Drader et al. 2009). Therefore, riceand Brachypodium should provide a good predictor of genecontent in the barley HvNax3 marker interval (HYI-NOD).Among the 16 protein types encoded by the genes from therice and Brachypodium intervals (Table 2), several havebeen reported to play roles in salinity tolerance.
H+-pyrophosphatase (H+-PPase; e.g., LOC_Os06g08080product) and the vacuolar H+-ATPase are two types of plantenzymes that maintain differences in electrochemicalpotential for H+ across the tonoplast. These differences inelectrochemical potential for H+ energize the transport ofNa+ into the vacuole via the tonoplast Na+/H+ antiporterNHX1, thereby protecting the cytosol from Na+ toxicity.Accordingly, overexpression of H+-PPase has been found toconfer salinity tolerance in various plant species (Gaxiola etal. 2001; Gao et al. 2006; Guo et al. 2006; Zhao et al. 2006;Brini et al. 2007; Bao et al. 2009). In these studies,tolerance conferred by the 35S promoter-driven H+-PPasetransgenes was accompanied by greater Na+ accumulationin the shoots. However, transformation with Na+ trans-porters may result in more or less Na+ accumulation,depending on the tissue specificity of the promoter (Mølleret al. 2009), indicating that transgenic data may not alwaysaccurately reflect functions of endogenous transportergenes. Another gene product from the interval (fromLOC_Os06g07780) belongs to the SNARE superfamily ofproteins that facilitate membrane fusion (Jahn et al. 2003)and shows closest similarity to the R-VAMP71 subgroup in
Arabidopsis (http://www.tc.umn.edu/~sande099/atsnare.htm) that are located on the tonoplast and mediate fusionof vesicles with the tonoplast (Carter et al. 2004; Uemura etal. 2004). Silencing or insertion mutagenesis of the VAMP71members increased salinity tolerance in Arabidopsis (Leshemet al. 2006). In wild-type plants, an abrupt and severe (0.2 MNaCl) salt stress triggered the appearance of cytoplasmicvesicles containing reactive oxygen species (ROS) whichfused with the tonoplast. However, impairment of VAMP71function in the silenced plants resulted in accumulation ofthese vesicles in the cytoplasm. Leshem et al. (2006)suggested that this lead to salinity tolerance because theROS damage otherwise sustained to the vacuolar H+-PPaseand H+-ATPase in wild-type plants due to fusion of thevesicles with the tonoplast was reduced in the silencedplants. mRNA expression of the endogenous VAMP71 geneswas also found to decrease upon exposure to salinity stress,suggesting that regulation of these genes may represent partof a natural salinity tolerance mechanism (Leshem et al.2006).
The product of the LOC_Os06g07830 gene from theHvNax3 interval belongs to the ANTH group of proteinsrequired for clathrin-mediated vesicle budding (Holsteinand Oliviusson 2005). In a functional screen of a cDNAexpression library, an ANTH gene from the mangrove plantBruguiera gymnorhiza was found to confer upon Agro-bacterium tumefaciens bacteria the ability to grow on mediacontaining high levels (350 mM) of NaCl (Ezawa and Tada2009). However, A. tumefaciens and barley are verydifferent organisms, and a role for ANTH proteins inproviding salinity tolerance in plants needs to be showndirectly. The product of the Bradi1g47900 gene from theBrachypodium HvNax3 interval shows most similarity tothe five DELLA transcription factors of Arabidopsis, whichare involved in hormone regulation of growth (Bolle 2004;Cheng et al. 2004; Achard et al. 2006). Achard et al. (2006)showed that these factors mediate salinity-induced growthinhibition and affect survival in saline conditions, althougheffects on shoot sodium concentrations were not reported.The NOD gene, located at the boundary of the HvNax3interval, encodes a member of the major facilitatorsuperfamily (MFS) group of proteins. These proteinsfunction as transporters for a range of solutes and includesolute/Na+ symporters (Pao et al. 1998). While the NODgene marker was separated from HvNax3 by a recombina-tion event (Fig. 4), it is possible (albeit remotely) that thisgene represents HvNax3, if the recombination event waslocated between the marker polymorphism and a functionalpolymorphism in the gene. Characterized MFS membersfrom plants include soybean GmN70 and Lotus japonicasLjN70 nodulins that have been shown to function as nitrateand chloride anion transporters (Vincill et al. 2005).However, neither of these plant proteins appears to
288 Funct Integr Genomics (2010) 10:277–291
represent a direct ortholog of NOD (data not shown).Therefore, more information is required to determinewhether the NOD gene product could be involved in Na+
transport.Because colinearity is often imperfect, it is possible that
the barley HvNax3 region contains genes that are absentfrom the corresponding rice or Brachypodium intervals.HKT, SOS1, and NHX genes have been proven orimplicated to contribute to salinity tolerance in wheat, rice,and Arabidopsis (Shi et al. 2000; Ren et al. 2005; Huang etal. 2006; Rus et al. 2006; Byrt et al. 2007). Members ofthese gene families have been mapped directly in wheat orbarley, but none of them were located to the short arms ofgroup 7 chromosomes (Mullan et al. 2007; Huang et al.2008). Therefore, these studies provide no evidence of anyother candidate genes in the HvNax3 interval which werenot already predicted from the rice/Brachypodium colinear-ity. Further work will be required to establish which, if any,of the aforementioned candidates identified using rice andBrachypodium represent the HvNax3 gene.
Acknowledgments We thank Jason Eglinton, Stewart Coventry, andJulie Hayes for helpful discussions, Nilmini Dharmathilake and AnitaLapina for technical assistance, Jason Eglinton and Stewart Coventryfor sharing unpublished data, the MPB-CRC for genetic resources,and codirectors of the Brachypodium Genome Sequencing Project forpermission to use unpublished genomic sequence. This project wassupported by a GRDC grant UA00090 to MT, a DBT grant (India) toNKG, research grant of the Institute of International Education (USA)to MNB, and by ARC, GRDC, and South Australian Governmentfunding to ACPFG.
References
Achard P, Cheng H, De Grauwe L, Decat J, Schoutteten H, Moritz T,Van Der Straeten D, Peng J, Harberd NP (2006) Integration ofplant responses to environmentally activated phytohormonalsignals. Science 311:91–94
Bao AK, Wang SM, Wu GQ, Xi JJ, Zhang JL, Wang CM (2009)Overexpression of the Arabidopsis H+-PPase enhanced resistanceto salt and drought stress in transgenic alfalfa (Medicago sativaL.). Plant Sci 176:232–240
Bilgic H, Cho S, Garvin DF, Muehlbauer GJ (2007) Mapping barleygenes to chromosome arms by transcript profiling of wheat–barleyditelosomic chromosome addition lines. Genome 50:898–906
Bolle C (2004) The role of GRAS proteins in plant signal transductionand development. Planta 218:683–692
Brini F, Hanin M, Mezghani I, Berkowitz GA, Masmoudi K (2007)Overexpression of wheat Na+/H+ antiporter TNHX1 and H+-pyrophosphatase TVP1 improve salt- and drought-stress tolerancein Arabidopsis thaliana plants. J Exp Bot 58:301–308
Byrt CS, Platten JD, Spielmeyer W, James RA, Lagudah ES, DennisES, Tester M, Munns R (2007) HKT1;5-like cation transporterslinked to Na+ exclusion loci in wheat, Nax2 and Kna1. PlantPhysiol 143:1918–1928
Caldwell KS, Russell J, Langridge P, Powell W (2006) Extremepopulation-dependent linkage disequilibrium detected in an inbreed-ing plant species, Hordeum vulgare. Genetics 172:557–567
Carter C, Pan S, Zouhar J, Avila EL, Girke T, Raikhel NV (2004) Thevegetative vacuole proteome of Arabidopsis thaliana revealspredicted and unexpressed proteins. Plant Cell 16:3285–3303
Chen Z, Zhou M, Newman IA, Mendham NJ, Zhang G, Shabala S(2007) Potassium and sodium relations in salinised barley tissuesas a basis of different salt tolerance. Funct Plant Biol 34:150–162
Chen A, Baumann U, Fincher GB, Collins NC (2009) Flt-2L, a locusin barley controlling flowering time, spike density, and plantheight. Funct Integr Genomics 9:243–254
Cheng H, Qin L, Lee S, Fu X, Richards DE, Cao D, Luo D, HarberdNP, Peng J (2004) Gibberellin regulated Arabidopsis floraldevelopment via suppression of DELLA protein function.Development 131:1055–1064
Chhipa BR, Lal P (1995) Na/K ratios as the basis of salt tolerance inwheat. Aust J Agric Res 46:533–539
Colmer TD, Munns R, Flowers TJ (2005) Improving salt tolerance ofwheat and barley: future prospects. Aust J Agric Res 45:1425–1443
Colmer TD, Flowers TJ, Munns R (2006) Use of wild relatives toimprove salt tolerance in wheat. J Exp Bot 57:1059–1078
Doerks T, Huber S, Buchner E, Bork P (2002) BSD: a novel domainin transcription factors and synapse-associated proteins. TrendsBiochem Sci 27:168–170
Drader T, Johnson K, Brueggeman R, Kudrna D, Kleinhofs A (2009)Genetic and physical mapping of a high recombination region onchromosome 7H(1) in barley. Theor Appl Genet 118:811–820
Dubcovsky J, Santa Maria G, Epstein E, Luo MC, Dvořák J (1996)Mapping of the K+/Na+ discrimination locus Kna1 in wheat.Theor Appl Genet 92:448–454
Eglinton JK, Jefferies SP, Ceccarelli S, Grando S, McDonald G, BarrAR (2000) A comparative assessment of osmotic adjustment andoxidative stress responses in Hordeum vulgare ssp. spontaneum.In: Proceedings of the 8th International Barley GeneticsSymposium, Adelaide, pp 267–269
Eglinton JK, Coventry SJ, Mather DE, Kretschmer J, McMichael GL,Chalmers KJ (2004) Advanced backcross QTL analysis in barley.In: Proceedings of the 9th International Barley GeneticsSymposium, Brno, Czech Republic, p 65, http://www.ibgs.cz/
Ellis RP, Forster BP, Waugh R, Bonar N, Handley LL, Robinson D,Gordon DC, Powell W (1997) Mapping physiological traits inbarley. New Phytol 137:149–157
Ellis RP, Forster BP, Robinson D, Handley LL, Gordon DC, RussellJR, Powell W (2000) Wild barley: a source of genes for cropimprovement in the 21st century? J Exp Bot 51:9–17
Ellis RP, Forster BP, Gordon DC, Handley LL, Keith RP, Lawrence P,Meyer R, Powell W, Robinson D, Scrimgeour CM, Young G,Thomas WTB (2002) Phenotype/genotype association for yieldand salt tolerance in an barley mapping population segregatingfor two dwarfing genes. J Exp Bot 53:1163–1176
Eudes A, Mouille G, Thévenin J, Goyallon A, Minic Z, Jouanin L(2008) Purification, cloning and functional characterization of anendogenous beta-glucuronidase in Arabidopsis thaliana. PlantCell Physiol 49:1331–1341
Ezawa S, Tada Y (2009) Identification of salt tolerance genes from themangrove plant Bruguiera gymnorhiza using Agrobacteriumfunctional screening. Plant Sci 176:272–278
Forster BP (2001) Mutation genetics of salt tolerance in barley: anassessment of Golden Promise and other semi-dwarf mutants.Euphytica 120:317–328
Forster BP, Miller TE, Law CN (1988) Salt tolerance of two wheat—Agropyron junceum disomic addition lines. Genome 30:559–564
Forster BP, Phillips MS, Miller TE, Baird E, Powell W (1990)Chromosome location of genes controlling tolerance to salt(NaCl) and vigour in Hordeum vulgare and H. chilense. Heredity65:99–107
Forster BP, Russell JR, Ellis RP, Handley LL, Robinson D, HackettCA, Nevo E, Waugh R, Gordon DC, Keith R, Powell W (1997)
Funct Integr Genomics (2010) 10:277–291 289
Locating genotypes and genes for abiotic stress tolerance inbarley: a strategy using maps, markers and the wild species. NewPhytol 137:141–147
Fu H, Girod PA, Doelling JH, van Nocker S, Hochstrasser M, Finley D,Vierstra RD (1999) Structure and functional analyses of the 26Sproteasome subunits from plants. Mol Biol Reports 26:137–146
Fukuda A, Chiba K, Maeda M, Nakamura A, Maeshima M, Tanaka Y(2004) Effect of salt and osmotic stresses on the expression ofgenes for the vacuolar H+-pyrophosphatase, H+-ATPase subunitA, and Na+/H+ antiporter from barley. J Exp Bot 55:585–594
Gao F, Gao Q, Duan XG, Yue GD, Yang AF, Zhang JR (2006)Cloning of an H+-PPase gene from Thellungiella halophila andits heterologous expression to improve tobacco salt tolerance. JExp Bot 57:3259–3270
Garthwaite AJ, von Bothmer R, Colmer TD (2005) Salt tolerance inwild Hordeum species is associated with restricted entry of Na+
and Cl− into the shoots. J Exp Bot 56:2365–2378Gaxiola RA, Li J, Undurraga S, Dang LM, Allen GJ, Alper SL, Fink
GR (2001) Drought- and salt-tolerant plants results from over-expression of the AVP1 H+-pump. Proc Natl Acad Sci USA98:11444–11449
Genc Y, McDonald G, Tester M (2007) Reassessment of tissue Na+
concentration as a criterion for salinity tolerance in bread wheat.Plant Cell Environ 30:1486–1498
Gorham J, Hardy C, Wyn Jones RG, Joppa LR, Law CN (1987)Chromosomal localisation of a K/Na discrimination character inthe D genome of wheat. Theor Appl Genet 74:584–588
Gorham J, Bristol A, Young EM, Wyn Jones RG, Kashour G (1990)Salt tolerance in the Triticeae: K/Na discrimination in barley. JExp Bot 41:1095–1101
Guo S, Yin H, Zhang X, Zhao F, Li P, Chen S, Zhao Y, Zhang H(2006) Molecular cloning and characterization of a vacuolar H+-pyrophosphatase gene, SsVP, from the halophyte Suaeda salsaand its overexpression increases salt and drought tolerance ofArabidopsis. Plant Mol Biol 60:41–50
Hearnden PR, Eckermann PJ, McMichael GL, Hayden MJ, EglintonJK, Chalmers KJ (2007) A genetic map of 1, 000 SSR and DArTmarkers in a wide barley cross. Theor Appl Genet 115:383–391
Holstein SHE, Oliviusson P (2005) Sequence analysis of Arabidopsisthaliana E/ANTH-domain-containing proteins: membrane tethersof the clathrin-dependent vesicle budding machinery. Proto-plasma 226:13–21
Hossein KG, Kalavacharla V, Lazo GR, Hegstad J et al (2004) Achromosome bin map of 2148 expressed sequence tag loci ofwheat homoelogous group 7. Genetics 168:687–699
Huang S, Spielmeyer W, Lagudah ES, James RA, Platten JD, DennisES, Munns R (2006) A sodium transporter (HKT7) is a candidatefor Nax1, a gene for salt tolerance in durum wheat. Plant Physiol142:1718–1727
Huang S, Spielmeyer W, Lagudah ES, Munns R (2008) Comparativemapping of HKT genes in wheat, barley, and rice, keydeterminants of Na+ transport, and salt tolerance. J Exp Bot59:927–937
Isla R, Royo A, Aragüés R (1997) Field screening of barley cultivarsto soil salinity using a sprinkler and drip irrigation system. PlantSoil 197:105–117
Jahn R, Lang T, Südhof TC (2003) Membrane fusion. Cell 112:519–533
James RA, Davenport RJ, Munns R (2006) Physiological character-ization of two genes for Na+ exclusion in durum wheat, Nax1 andNax2. Plant Physiol 142:1537–1547
Jensen JK, Sørensen SO, Harholt J, Geshi N, Sakuragi Y, Møller I,Zandleven J, Bernal AJ, Jensen NB, Sørensen C, Pauly M,Beldman G, Willats WGT, Scheller HV (2008) Identification of axylogalacturonan xylosyltransferase involved in pectin biosyn-thesis in Arabidopsis. Plant Cell 20:1289–1302
Leshem Y, Melamed-Book N, Cagnac O, Ronen G, Nishri Y, SolomonM, Cohen G, Levine A (2006) Suppression of Arabidopsisvesicle-SNARE expression inhibited fusion of H2O2-containingvesicles with tonoplast and increased salt tolerance. Proc NatlAcad Sci USA 103:18008–18013
Levin JZ, de Framond AJ, Tuttle A, Bauer MW, Heifetz PB (2000)Methods of double-stranded RNA-mediated gene inactivation inArabidopsis and their use to define an essential gene inmethionine biosynthesis. Plant Mol Biol 44:759–775
Li X, Cordero I, Caplan J, Mølhøj M, Reiter WD (2004) Molecularanalysis of 10 coding regions from Arabidopsis that arehomologous to the MUR3 xyloglucan galactosyltransferase.Plant Physiol 134:940–950
Lindsay MP, Lagudah ES, Hare RA, Munns R (2004) A locus forsodium exclusion (Nax1), a trait for salt tolerance, mapped indurum wheat. Funct Plant Biol 31:1105–1114
Lonergan PF, Pallotta MA, Lorimer M, Paull JG, Barker SJ, GrahamRD (2009) Multiple genetic loci for zinc uptake and distributionin barley (Hordeum vulgare). New Phytol 184:168–179
Luo MC, Dubcovsky J, Goyal S, Dvořák J (1996) Engineering ofinterstitial foreign chromosome segments containing the K+/Na+
selectivity gene Kna1 by sequential homoeologous recombina-tion in durum wheat. Theor Appl Genet 93:1180–1184
Ma L, Zhou E, Huo N, Zhou R, Wang G, Jia J (2007) Genetic analysisof salt tolerance in a recombinant inbred population of wheat(Triticum aestivum L.). Euphytica 153:109–117
Mahmood A, Quarrie SA (2006) Effects of salinity on growth, ionicrelations and physiological traits of wheat, disomic addition linesfrom Thinopyrum bessarabicum, and two amphiploids. PlantBreed 110:265–276
Manly KF, Cudmore JRH, Meer JM (2001) MapManager QTX cross-platform software for genetic mapping. Mammal Genome12:930–932
Mano Y, Takeda K (1997) Mapping quantitative trait loci for salttolerance at germination and the seedling stage in barley(Hordeum vulgare L.). Euphytica 94:263–272
Mano Y, Takeda K (1998) Genetic resources of salt tolerance in wildHordeum species. Euphytica 103:137–141
Møller IS, Gilliham M, Jha D, Mayo GM, Roy SJ, Coates JC,Haseloff J, Tester M (2009) Shoot Na+ exclusion and increasedsalinity tolerance engineering by cell type-specific alteration ofNa+ transport in Arabidopsis. Plant Cell. doi:10.1105/tpc.108.064568
Mullan DJ, Colmer TD, Francki MG (2007) Arabidopsis–rice–wheatgene orthologues of Na+ transport and transcript analysis inwheat–L. elongatum aneuploids under salt stress. Mol GenetGenomics 277:199–212
Munns R, James RA (2003) Screening methods for salinity tolerance:a case study with tetraploid wheat. Plant Soil 253:201–218
Munns R, Tester M (2008) Mechanisms of salinity tolerance. Ann RevPlant Biol 59:651–681
Omielan JA, Epstein E, Dvořák J (1991) Salt tolerance and ionicrelations of wheat as affected by individual chromosomes of salt-tolerant Lophopyrum elongatum. Genome 34:961–974
Pakniyat H, Handley LL, Thomas WTB, Connolly T, Macaulay M,Caligari PDS, Forster BP (1997a) Comparison of shoot dryweight, Na+ content and δ13C values of ari-e and other semi-dwarf barley mutants under salt-stress. Euphytica 94:7–14
Pakniyat H, Thomas WTB, Caligari PDS, Forster BP (1997b)Comparison of salt tolerance of GPert and non-GPert barleys.Plant Breed 116:189–191
Pakniyat H, Powell W, Baird E, Handley LL, Robinson D, ScrimgeourCM, Hackett CA, Forster BP, Nevo E, Caligari PDS (1997c)AFLP variation in wild barley (Hordeum spontaneum C. Koch)with reference to salt tolerance and associated ecogeography.Genome 40:332–341
290 Funct Integr Genomics (2010) 10:277–291
Pao SS, Paulsen IT, Saier MH (1998) Major facilitator superfamily.Microbiol Mol Biol Rev 62:1–34
Park J, Kim MJ, Jung SJ, Suh MC (2009) Identification of a noveltranscription factor, AtBSD1, containing a BSD domain inArabidopsis thaliana. J Plant Biol 52:141–146
Pickering R, Johnson PA (2005) Recent progress in barley improve-ment using wild species of Hordeum. Cytogenet Genome Res109:344–349
Poustini K, Siosemardeh A (2004) Ion distribution in wheat cultivarsin response to salinity stress. Field Crops Res 85:125–133
Qi LL, Echalier B, Chao S, Lazo GR et al (2004) A chromosome binmap of 16, 000 expressed sequence tag loci and distribution ofgenes among the three genomes of polyploid wheat. Genetics168:701–712
Qu Y, Egelund J, Gilson PR, Houghton F, Gleeson PA, Schultz CJ,Bacic A (2008) Identification of a novel group of putativeArabidopsis thaliana β-(1, 3)-galactosyltransferases. Plant MolBiol 68:43–59
Quarrie SA, Steed A, Calestani C, Semikhodskii A, Lebreton C,Chinoy C, Steele N, Pljevjakusić W, Weyen J, Schondelmaier J,Habash DZ, Farmer P, Saker L, Clarkson DT, Abugalieva A,Yessimbekova M, Turuspekov Y, Abugalieva S, Tuberosa R,Sanguineti MC, Hollington PA, Aragués R, Royo A, Dodig D(2005) A high-density genetic map of hexaploid wheat (Triticumaestivum L.) from the cross Chinese Spring × SQ1 and its use tocompare QTLs for grain yield across a range of environments.Theor Appl Genet 110:865–880
Ramsay L, Macaulay M, degli Ivanissevich S, MacLean K, Cardle L,Fuller J, Edwards KJ, Tuvesson S, Morgante M, Massari A,Maestri E, Marmiroli N, Sjakste T, Ganal M, Powell W, Waugh R(2000) A simple sequence repeat-based linkage map of barley.Genetics 156:1997–2005
Ren ZH,Gao JP, Li LG, Cai XL, HuangW, ChaoDY, ZhuMZ,Wang ZY,Luan S, Lin HX (2005) A rice quantitative trait locus for salttolerance encodes a sodium transporter. Nature Genet 17:1141–1146
Rengasamy P (2006) World salinization with emphasis on Australia. JExp Bot 57:1017–1023
Royo A, Aragüés R (1999) Salinity-yield response functions of barleygenotypes assessed with a triple line source sprinkler system.Plant Soil 209:9–20
Rus A, Baxter I, Muthukumar B, Gustin J, Lahner B, Yakubova E,Salt DE (2006) Natural variants of AtHKT1 enhance Na+
accumulation in two wild populations of Arabidopsis. PLoSGenet 2:1964–1973
Russell J, Booth A, Fuller J, Harrower B, Hedley P, Machray G,Powell W (2004) A comparison of sequence-based polymor-phism and haplotype content in transcribed and anonymousregions of the barley genome. Genome 47:389–398
Salse J, Bolot S, Throude M, Jouffe V, Piegu B, Quraischi UM,Calcagno T, Cooke R, Delseny M, Feuillet C (2008) Identifica-tion and characterization of shared duplications between rice andwheat provide new insight into grass genome evolution. PlantCell 20:11–24
ShavrukovY, Bowne J, Langridge P, TesterM (2006) Screening for sodiumexclusion in wheat and barley. In: Proceedings of the 13th AustralianSociety of Agronomy Conference, Perth, http://www.regional.org.au/au/asa/2006/concurrent/environment/4581_shavrukoky.htm.Accessed 10 Sep 2006
Shi H, Ishitani M, Kim C, Zhu JK (2000) The Arabidopsis thalianasalt tolerance gene SOS1 encodes a putative Na+/H+ antiporter.Proc Natl Acad Sci USA 97:6896–6901
Stein N, Prasad M, Scholz U, Thiel T, Zhang H, Wolf M, Kota R,Varshney RK, Perovic D, Grosse I, Graner A (2007) A 1,000-locitranscript map of the barley genome: new anchoring points forintegrative grass genomics. Theor Appl Genet 114:823–839
Stracke R, de Vos RCH, Bartelniewoehner L, Ishihara H, Sagasser M,Martens S, Weisshaar B (2009) Metabolomic and geneticanalyses of flavonol synthesis in Arabidopsis thaliana supportthe in vivo involvement of leucoanthocyanidin dioxygenase.Planta 229:427–445
Tenhaken R, Doerks T, Bork P (2005) DCD—a novel plant specificdomain in proteins involved in development and programmedcell death. BMC Bioinformatics 6:169. doi:10.1186/1471-2105-6-169
Tester M, Davenport R (2003) Na+ tolerance and Na+ transport inhigher plants. Ann Bot 91:503–527
Uemura T, Ueda T, Ohniwa RL, Nakano A, Takeyasu K, Sato MH(2004) Systematic analysis of SNARE molecules in Arabidopsis:dissection of the post-Golgi network in plant cells. Cell StructFunct 29:49–65
Vincill ED, Szczyglowski K, Roberts DM (2005) GmN70 and LjN70.Anion transporters of the symbiosome membrane of nodules witha transport preference for nitrate. Plant Physiol 137:1435–1444
Wang MC, Peng ZY, Li CL, Li F, Liu C, Xia GM (2008) Proteomicanalysis on a high salt tolerance introgression strain of Triticumaestivum/Thinopyrum ponticum. Proteomics 8:1470–1489
Woo HH, Jeong BR, Hirsch AM, Hawes MC (2007) Characterizationof Arabidopsis AtUGT85A and AtGUS gene families and theirexpression in rapidly dividing tissues. Genomics 90:143–153
Xue D, Huang Y, Zhang X, Wei K, Westcott S, Li C, Chen M, ZhangG, Lance R (2009) Identification of QTLs associated withsalinity tolerance at late growth stage in barley. Euphytica169:187–196
Yan L, Fu D, Li C, Blechl A, Tranquilli G, Bonafede M, Sanchez A,Valarik M, Yasuda S, Dubcovsky J (2006) The wheat and barleyvernalization gene VRN3 is an orthologue of FT. Proc Natl AcadSci U S A 103:19581–19586
Yan J, Chen G, Cheng J, Nevo E, Gutterman Y (2008) Phenotypicvariation in caryopsis dormancy and seedling salt tolerance inwild barley, Hordeum spontaneum, from different habitats inIsrael. Genet Resour Crop Evol 55:995–1005
Yeo AR, Flowers TJ (1986) Salinity resistance in rice (Oryza sativaL.) and a pyramiding approach to breeding varieties for salinesoils. Aust J Plant Physiol 13:161–173
Yuan Q, Ouyang S, Wang A, Zhu W, Maiti R, Lin H, Hamilton J,Haas B, Sultana R, Cheung F, Wortman J, Buell CR (2005) TheInstitute for Genomic Research Osa1 rice genome annotationdatabase. Plant Physiol 138:18–26
Zhao FY, Zhang XJ, Li PH, Zhao YX, Zhang H (2006) Co-expressionof the Suaeda salsa SsNHX1 and Arabidopsis AVP1 confergreater salt tolerance to transgenic rice than the single SsNHX1.Mol Breed. doi:10.1007/s11032-006-9005-6
Zhong GY, Dvorak J (1995) Chromosomal control of the tolerance ofgradually and suddenly imposed salt stress in the Lophopyrumelongatum and wheat, Triticum aestivum L., genomes. TheorAppl Genet 90:229–236
Funct Integr Genomics (2010) 10:277–291 291
Related Documents