© Mark Bartosik, www.bugbrowser.com 1 © Mark Bartosik www.bugbrowser.com (Windows Native code specific talk) Hunting for Hunting for Bugs Bugs Project Saving Project Saving Debugging Debugging Techniques Techniques © Mark Bartosik, www.bugbrowser.com 2 Not about what we already know… • Be more defensive – /analyze (PREfast) – Lint – /RTC compiler flags VS runtime checks • Uninitialized variable • Smaller type checks (conversion to) • Stack frames • Security checks – ASSERT / VERIFY macros – Pre/Post condition checks – Debug builds, _SECURE_SCL – /GS (security buffer checking) – Unit tests

Welcome message from author
This document is posted to help you gain knowledge. Please leave a comment to let me know what you think about it! Share it to your friends and learn new things together.
Transcript
© Mark Bartosik, www.bugbrowser.com 1
© Mark Bartosik
www.bugbrowser.com
(Windows Native code specific talk)
Hunting forHunting for
BugsBugs
Project SavingProject Saving
Debugging Debugging
TechniquesTechniques
© Mark Bartosik, www.bugbrowser.com 2
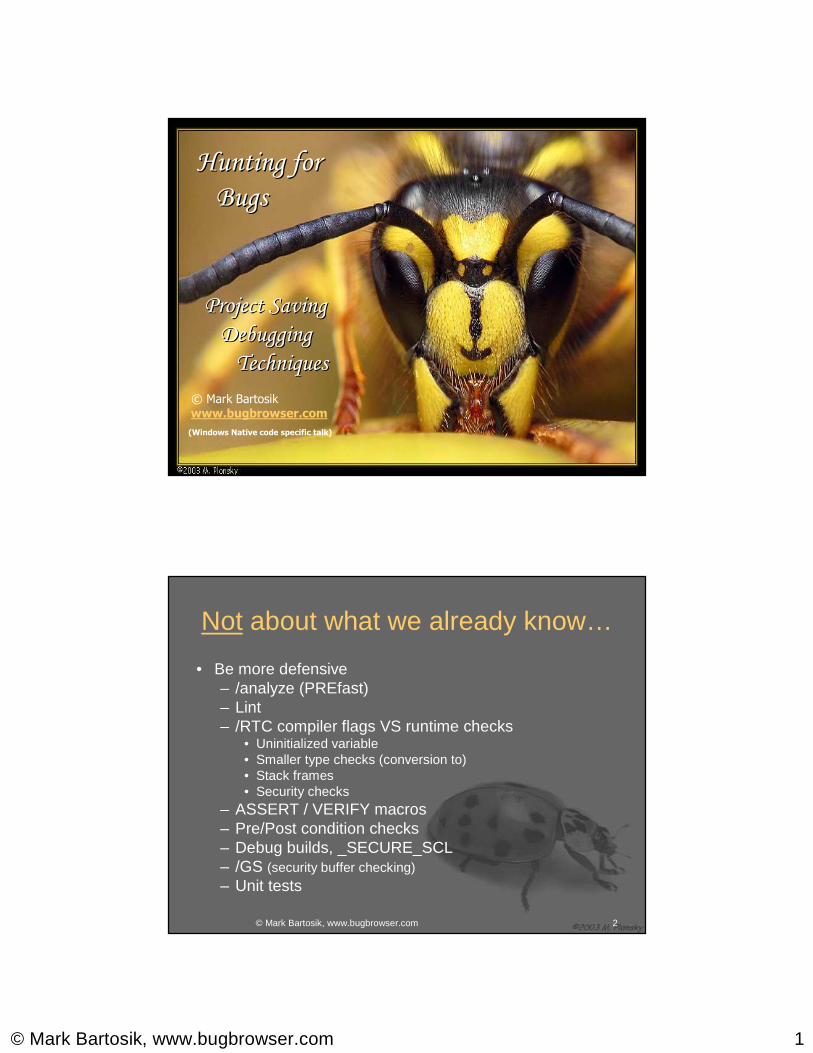
Not about what we already know…
• Be more defensive– /analyze (PREfast)– Lint– /RTC compiler flags VS runtime checks
• Uninitialized variable• Smaller type checks (conversion to) • Stack frames• Security checks
– ASSERT / VERIFY macros– Pre/Post condition checks– Debug builds, _SECURE_SCL – /GS (security buffer checking)
– Unit tests
© Mark Bartosik, www.bugbrowser.com 2
© Mark Bartosik, www.bugbrowser.com 3
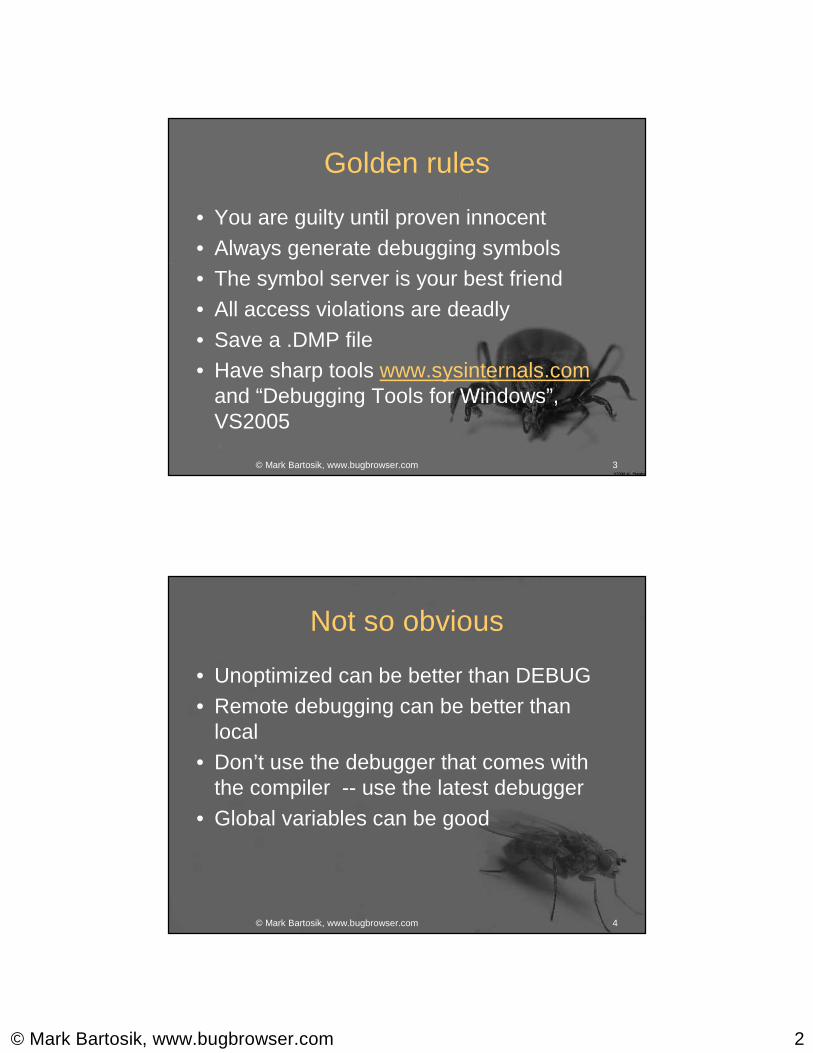
Golden rules
• You are guilty until proven innocent• Always generate debugging symbols• The symbol server is your best friend• All access violations are deadly• Save a .DMP file• Have sharp tools www.sysinternals.com
and “Debugging Tools for Windows”, VS2005
© Mark Bartosik, www.bugbrowser.com 4
Not so obvious
• Unoptimized can be better than DEBUG• Remote debugging can be better than
local• Don’t use the debugger that comes with
the compiler -- use the latest debugger• Global variables can be good
© Mark Bartosik, www.bugbrowser.com 3
© Mark Bartosik, www.bugbrowser.com 5
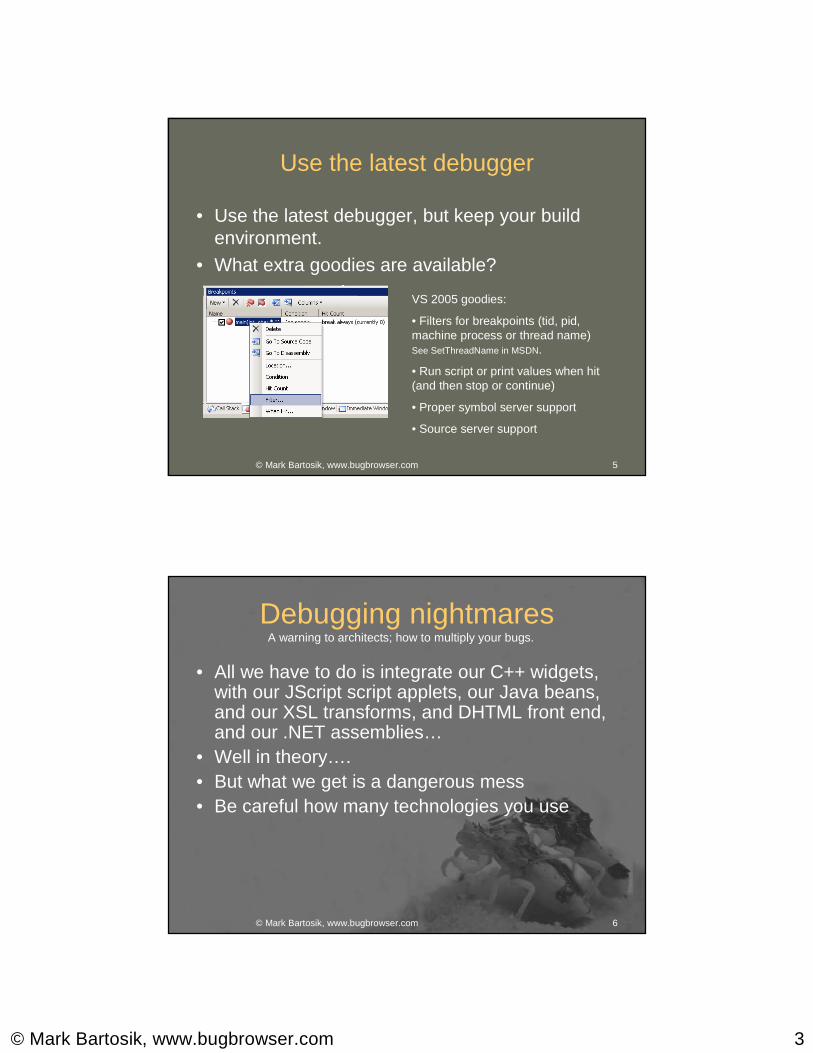
Use the latest debugger
• Use the latest debugger, but keep your build environment.
• What extra goodies are available?
VS 2005 goodies:
• Filters for breakpoints (tid, pid, machine process or thread name)See SetThreadName in MSDN.
• Run script or print values when hit (and then stop or continue)
• Proper symbol server support
• Source server support
© Mark Bartosik, www.bugbrowser.com 6
Debugging nightmares
• All we have to do is integrate our C++ widgets, with our JScript script applets, our Java beans, and our XSL transforms, and DHTML front end, and our .NET assemblies…
• Well in theory….• But what we get is a dangerous mess• Be careful how many technologies you use
A warning to architects; how to multiply your bugs.

© Mark Bartosik, www.bugbrowser.com 4
© Mark Bartosik, www.bugbrowser.com 7
How do I …
1. Debug what corrupted my ‘this’ pointer2. Debug service startup code3. Find what’s eating all that CPU time4. Debug a deadlock5. Find what corrupted my heap6. Find the cause of leaks7. Gather .DMP files
© Mark Bartosik, www.bugbrowser.com 8
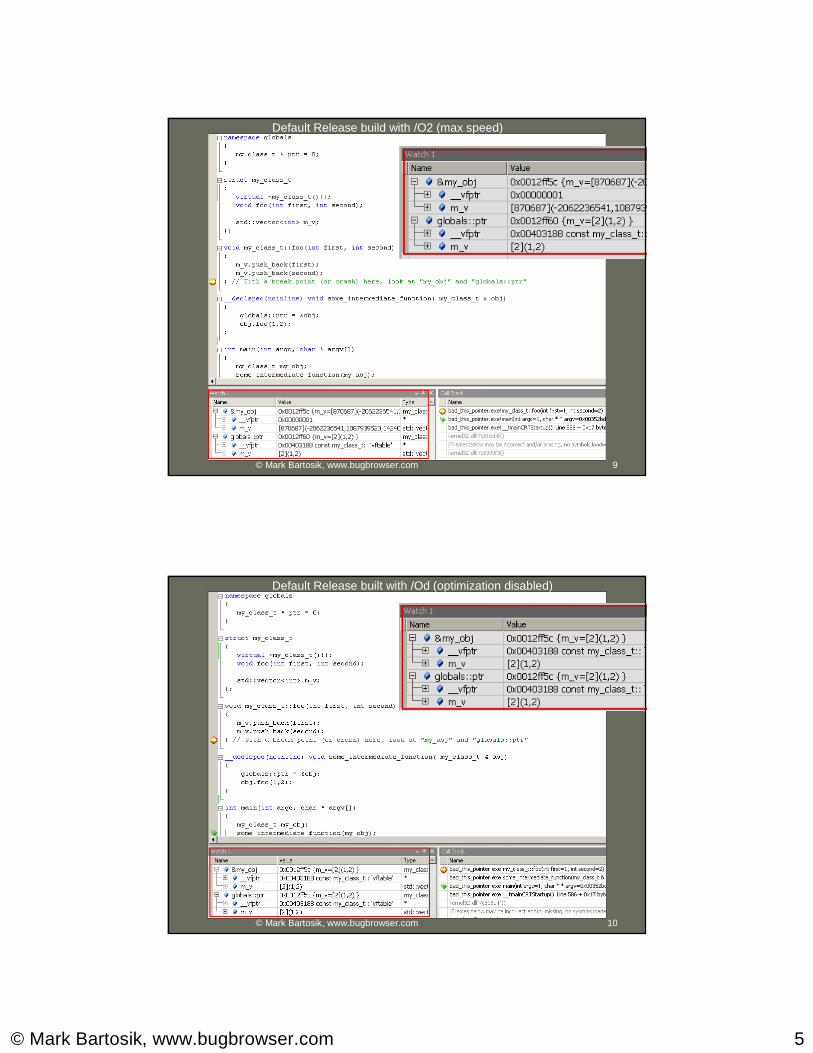
How do I debug an invalid this ?
• What zapped my ‘this pointer’?• What corrupted my object?• Or is my debugger a liar?
class my_class_t{
void foo(int first, int second);};
callee
push ebp
mov ebp, esp
mov esi, ecx
xor ebx, ebx
mov ecx, ebx � ZAP
caller
push secondpush firstmov ecx, thiscall my_class_t::foo
© Mark Bartosik, www.bugbrowser.com 5
© Mark Bartosik, www.bugbrowser.com 9
Default Release build with /O2 (max speed)
© Mark Bartosik, www.bugbrowser.com 10
Default Release built with /Od (optimization disabled)

© Mark Bartosik, www.bugbrowser.com 6
© Mark Bartosik, www.bugbrowser.com 11
How do I debug a service?• Debug startup code in a service?::MessageBox(NULL, “Service”, “Debug Me”,
MB_SERVICE_NOTIFICATION | MB_OK );
You’ve got 30 seconds!Before the service control manager terminates a non responsive process
Magic registry entry: ServicesPipeTimeoutsymchk /ip 612 –s SRV*c:\websymbols*http://msdl.microsoft.com/down load/symbols
cdb –pv –pn services.exe –c ".dump /ma c:\services.dmp; .detach; q”
cdb –z c:\services.dmp –c "x services!*timeout*; q"
cdb –pv –pn services.exe -y SRV*c:\websymbols -c ".symopt+ 0x400; ed services!g_dwScPipeTransactT imeout 0n60000 ; .detach; q"
NT_SYMBOL_PATH=SRV*c:\websymbols*http://msdl.micros oft.com/download/symbols
Alternatively call: SetServiceStatus with SERVICE_START_PENDINGand a hint of 60000 and incremented
checkpoint value.
© Mark Bartosik, www.bugbrowser.com 12
Non invasive debugging
TIP: -pv == Non invasive debugging
• Only one debugger can be attached at a time, right?• If the debugger dies the process dies, right?• WinDbg and CDB support limited debugging without
attaching as a debugger.• Can use WinDbg in conjunction with Visual Studio• Can probe critical applications safely• If the application is completely frozen and the debugger
cannot launch a break thread necessary for a true attach. In this case typically the loader lock is held.
• Does not affect timings and hide bugs.
© Mark Bartosik, www.bugbrowser.com 7
© Mark Bartosik, www.bugbrowser.com 13
But, it works under the Debugger!! #$%�
• Problems– Program timing is affected:
• Thread start / stop• Module load / unload• OutputDebugString• Exceptions (and there are many that your don’t see)
– Program heap layout is affected:• Debug heap in OS gets enabled only if launch under debugger
– GUI Focus changes when breakpoint hit
• Solutions:– Attach instead of launch– Attach and detach when not required (XP and above)– Remote debugging – Non invasive WinDbg or CDB (but no break points available)
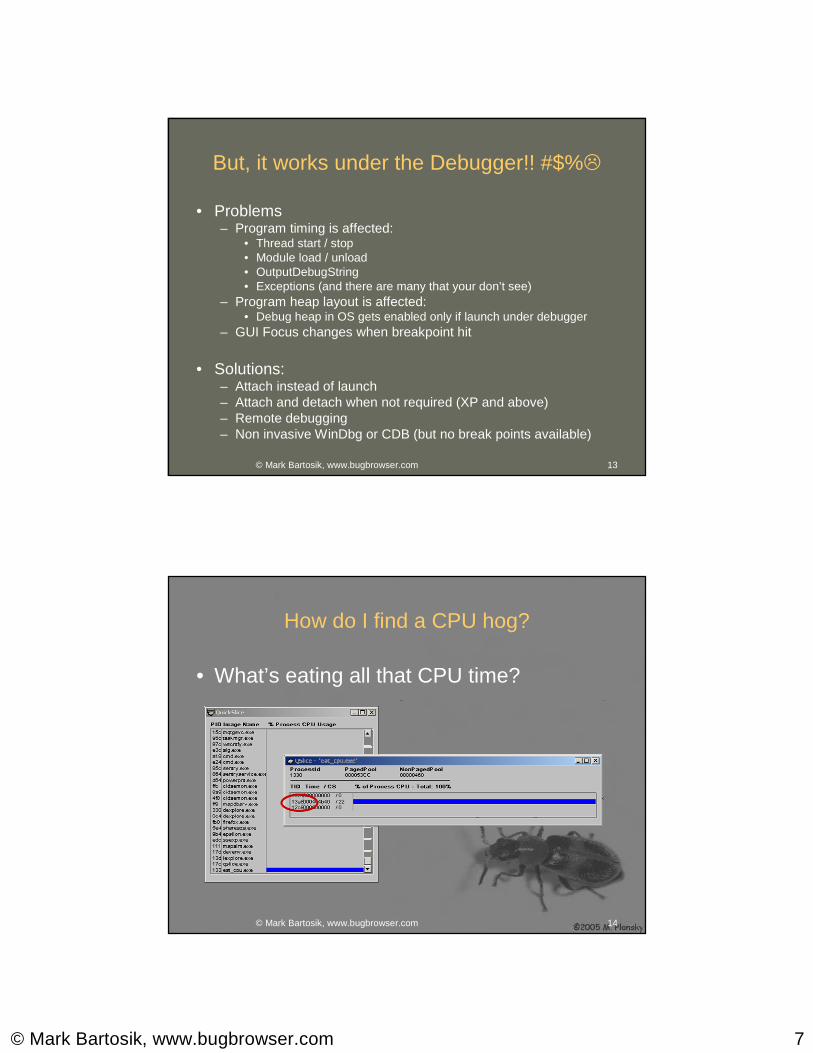
© Mark Bartosik, www.bugbrowser.com 14
How do I find a CPU hog?
• What’s eating all that CPU time?
© Mark Bartosik, www.bugbrowser.com 8
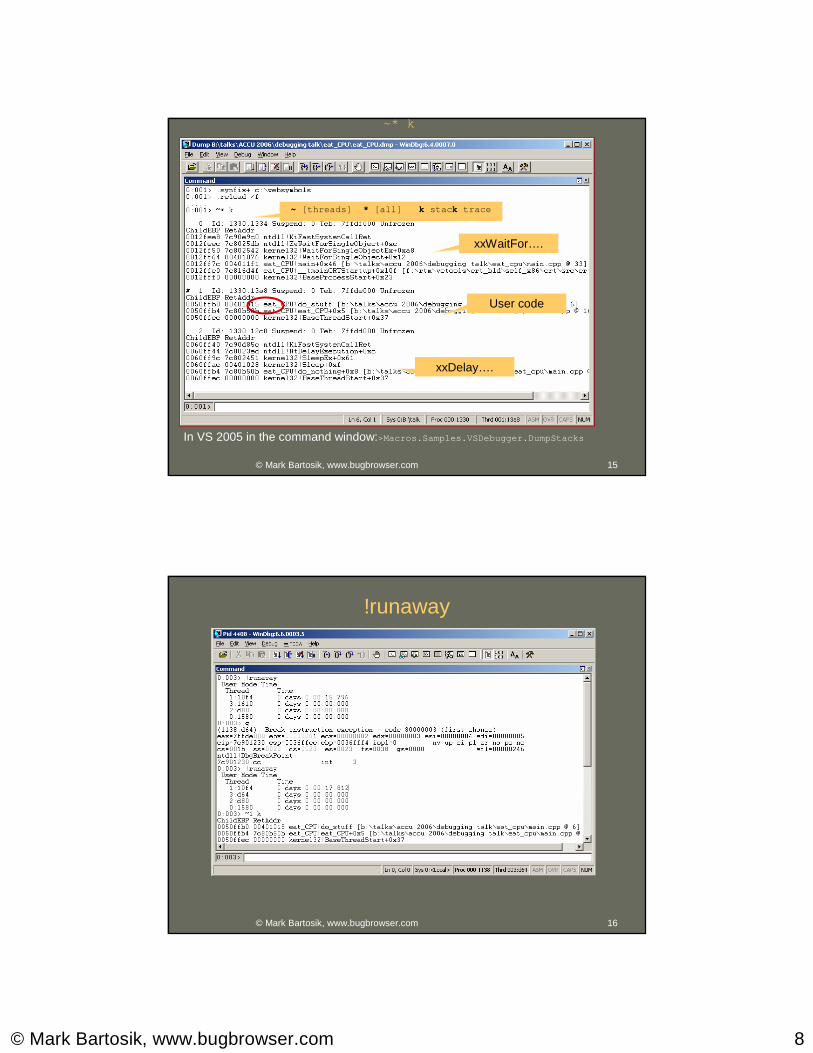
© Mark Bartosik, www.bugbrowser.com 15
~* k
xxWaitFor….
xxDelay….
User code
~ [threads] * [all] k stac k trace
In VS 2005 in the command window:>Macros.Samples.VSDebugger.DumpStacks
© Mark Bartosik, www.bugbrowser.com 16
!runaway

© Mark Bartosik, www.bugbrowser.com 9
© Mark Bartosik, www.bugbrowser.com 17
How do I debug a deadlock?
0:002> !locksCritSec dead_lock! critsec_a+0 at 00405748LockCount 1RecursionCount 1OwningThread 16f4EntryCount 1ContentionCount 1*** Locked
CritSec dead_lock! critsec_b+0 at 00405778LockCount 1RecursionCount 1OwningThread 1214EntryCount 1ContentionCount 1*** Locked
TID 16f4 critsec_a 00405748TID 1214 critsec_b 00405778
© Mark Bartosik, www.bugbrowser.com 18
0:002> ~* kv0 Id: 1684.af8 Suspend: 2 Teb: 7ffdf000 Unfrozen
ChildEBP RetAddr Args to Child 0012fee8 7c90e9c0 7c8025db ntdll!KiFastSystemCallR et0012feec 7c8025db 000017f4 ntdll!ZwWaitForSingleOb ject0012ff50 7c802542 000017f4 kernel32!WaitForSingleO bjectEx0012ff64 004011f6 000017f4 kernel32!WaitForSingleO bject0012ff7c 0040182d 00000001 dead_lock!main0012ffc0 7c816d4f 00000000 dead_lock!__tmainCRTSta rtup0012fff0 00000000 00401976 kernel32!BaseProcessSta rt
1 Id: 1684. 16f4 Suspend UnfrozenChildEBP RetAddr Args to Child0050fef0 7c90e9c0 7c91901b ntdll!KiFastSystemCallR et0050fef4 7c91901b 000017d8 ntdll!ZwWaitForSingleOb ject0050ff7c 7c90104b 00405778 ntdll!RtlpWaitForCritic alSection0050ff84 0040109d 00405778 ntdll!RtlEnterCriticalSection0050ff8c 00401130 4ad50ce7 dead_lock!function20050ffb4 7c80b50b 00000000 dead_lock!thread_a0050ffec 00000000 004010d0 kernel32!BaseThreadStar t
# 2 Id: 1684. 1214 Suspend UnfrozenChildEBP RetAddr Args to Child 0060fedc 7c90e9c0 7c91901b ntdll!KiFastSystemCallR et0060fee0 7c91901b 000017d4 ntdll!ZwWaitForSingleOb ject0060ff68 7c90104b 00405748 ntdll!RtlpWaitForCritic alSection0060ff70 00401034 00405748 ntdll!RtlEnterCriticalSection0060ff8c 004011a0 4ae50ce7 dead_lock!function30060ffb4 7c80b50b 00000000 dead_lock!thread_b0060ffec 00000000 00401140 kernel32!BaseThreadStar t
TID 16f4 critsec_a 00405748TID 1214 critsec_b 00405778
This thread already owns critsec_a
and is attempting to acquire 00405778
This thread already owns critsec_b
and is attempting to acquire 00405748
~* k
© Mark Bartosik, www.bugbrowser.com 10
© Mark Bartosik, www.bugbrowser.com 19
Typical deadlock causes
1. “Upward” calls while holding a lock:Observer pattern / publish subscribe, or any synchronous generic callback mechanism
2. Order of locking thread 1: locks a, b thread 2: locks b, a
3. Lack of RAII 4. Exception with lock acquired (even causing
thread to exit)5. Double acquire on non recursive locks
e.g. spinlocks, and mutexs6. Priority inversion – very rare
© Mark Bartosik, www.bugbrowser.com 20
How do I find memory corruptions?
• Debug build?• Bounds checker?• Purify?• Debugging suit de jour?• Application verifier, gflags• Custom allocators
Using VirtualAlloc , VirtualProtect , and VirtualFree
• Data break points• Custom break point control
http://www.morearty.com/code/breakpoint/

© Mark Bartosik, www.bugbrowser.com 11
© Mark Bartosik, www.bugbrowser.com 21
gflagsPart of
Debugging Tools for Windows
Do not enable both heap tail
checking and page heap
© Mark Bartosik, www.bugbrowser.com 22
gflagsPart of
Debugging Tools for Windows
Consider unaligned if you can, otherwise
alignment is 16 bytes
Documentation is woefully lacking
© Mark Bartosik, www.bugbrowser.com 12
© Mark Bartosik, www.bugbrowser.com 23
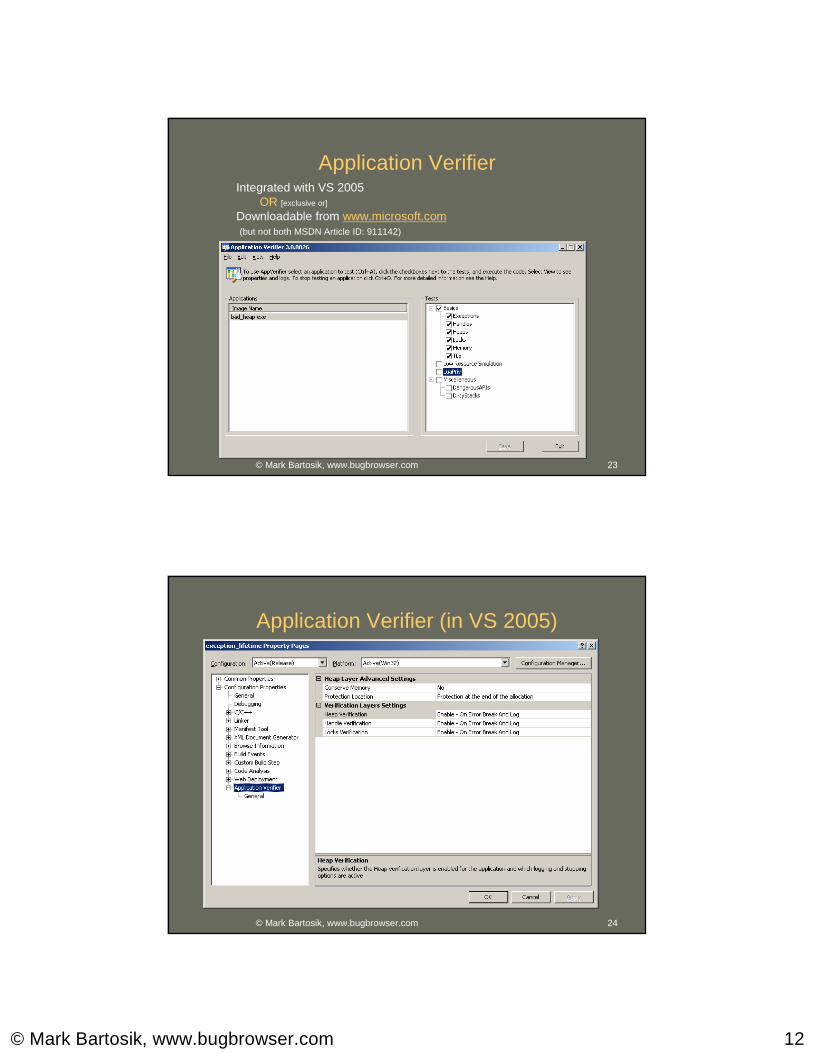
Application VerifierIntegrated with VS 2005
OR [exclusive or]
Downloadable from www.microsoft.com(but not both MSDN Article ID: 911142)
© Mark Bartosik, www.bugbrowser.com 24
Application Verifier (in VS 2005)
© Mark Bartosik, www.bugbrowser.com 13
© Mark Bartosik, www.bugbrowser.com 25
How do I find leaks?
• Find what’s leaking all my memory?• Leak definition:
Over time your program continues to consume more resources.
• PerfmonProcess\Private Bytes (committed memory)Process\Handle CountProcess\Virtual Bytes (address space)
© Mark Bartosik, www.bugbrowser.com 26
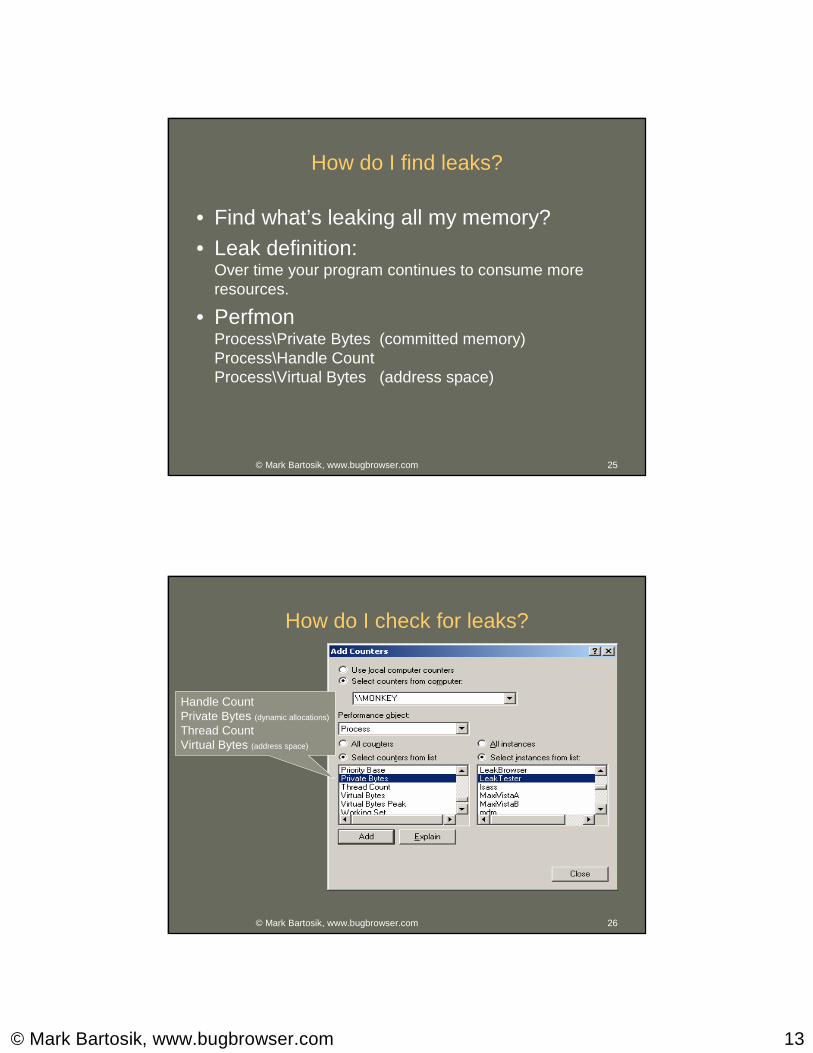
How do I check for leaks?
Handle CountPrivate Bytes (dynamic allocations)
Thread CountVirtual Bytes (address space)
© Mark Bartosik, www.bugbrowser.com 14
© Mark Bartosik, www.bugbrowser.com 27
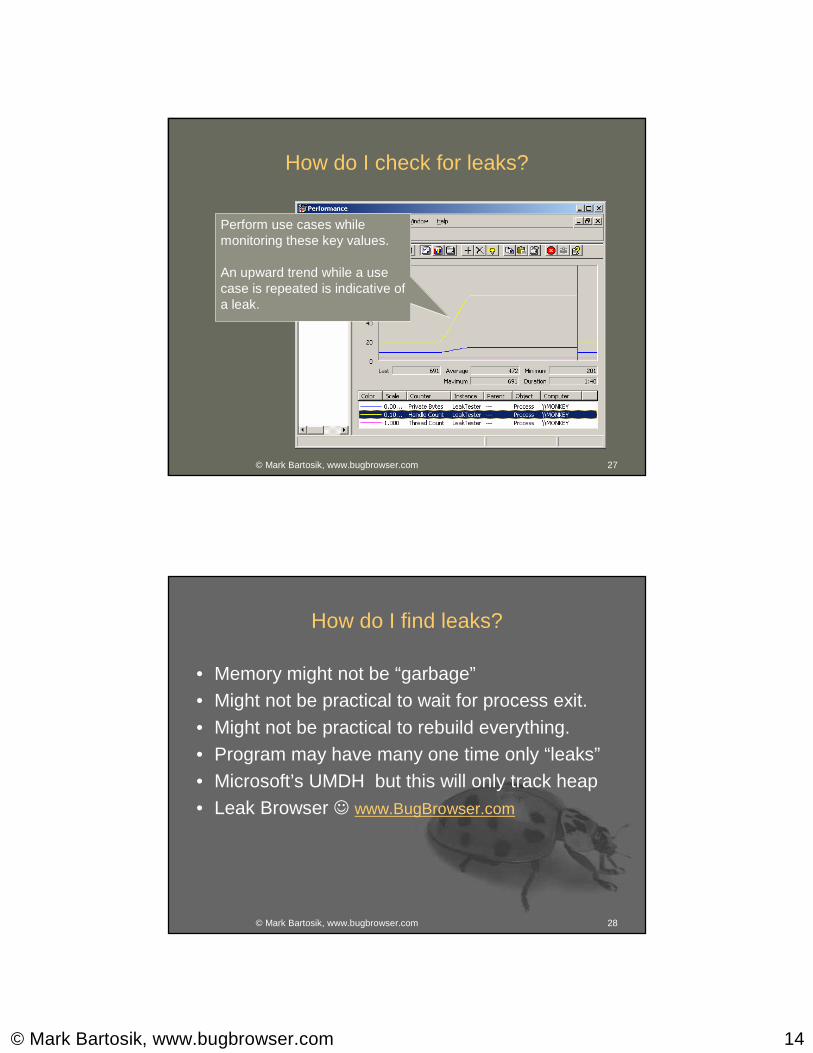
How do I check for leaks?
Perform use cases while monitoring these key values.
An upward trend while a use case is repeated is indicative of a leak.
© Mark Bartosik, www.bugbrowser.com 28
How do I find leaks?
• Memory might not be “garbage”• Might not be practical to wait for process exit.• Might not be practical to rebuild everything.• Program may have many one time only “leaks”• Microsoft’s UMDH but this will only track heap• Leak Browser ☺ www.BugBrowser.com
© Mark Bartosik, www.bugbrowser.com 15
© Mark Bartosik, www.bugbrowser.com 29
.dmp files
• Being able to capture an exception, a crash, or broken state in a .dmp file is the sharpest weapon against bugs.
• WinDbg, CDB, AdsPlusnon redistributable
• Windows Error Reporting (WER)Requires WinQual membership, issues with configuration
• DumpWriterwww.bugbrowser.com/dumpwriter
• CodeProject, look for CrashRpt and XCrashReport
• Debugging Applications, John Robins, see SnapCurrentProcessMiniDump API
• The trick is knowing when to create a .dmp file
© Mark Bartosik, www.bugbrowser.com 30
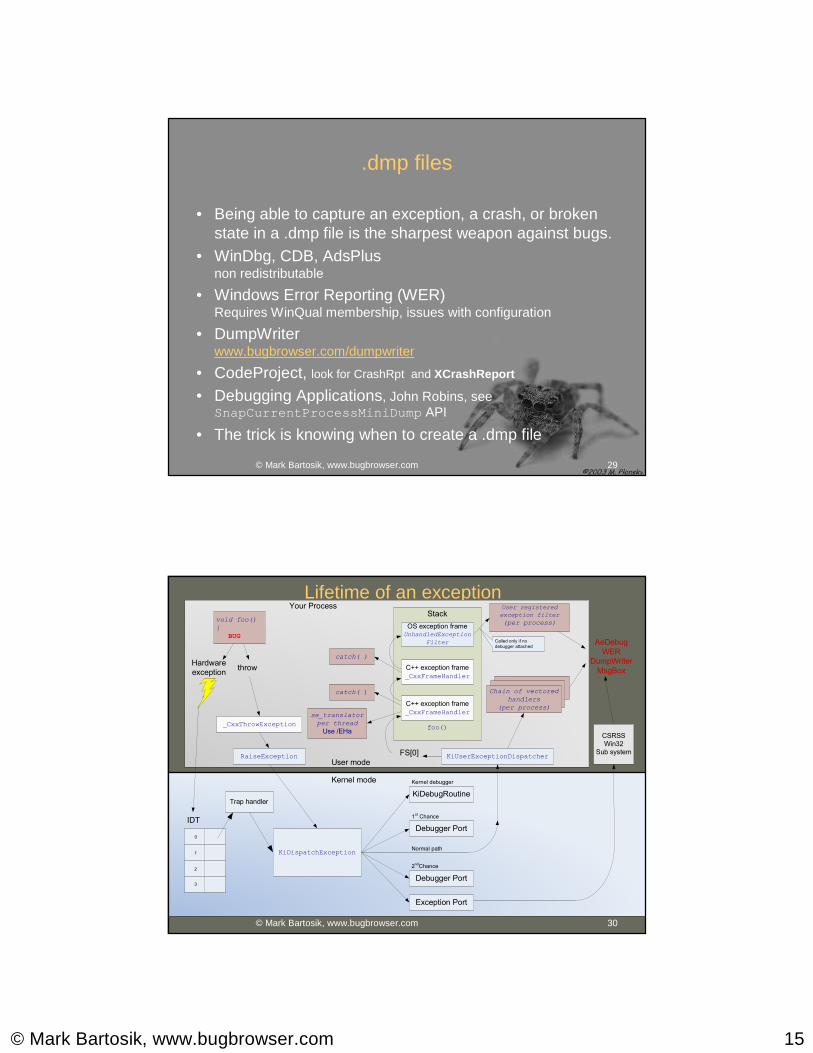
Lifetime of an exceptionStack
foo()
Hardware
exception
User mode
Kernel mode
Trap handler
IDT
0
1
2
3
KiDispatchException
KiDebugRoutine
Debugger Port
Debugger Port
Exception Port
CSRSS
Win32
Sub systemKiUserExceptionDispatcherFS[0]
catch( )
C++ exception frame
_CxxFrameHandler
C++ exception frame
_CxxFrameHandler
catch( )
User registered
exception filter
(per process)OS exception frameUnhandledException
Filter
RaiseException
throw
_CxxThrowException
Chain of vectored
handlers
(per process)
AeDebug
WER
DumpWriter
MsgBox
Your Process
1st Chance
2ndChance
Kernel debugger
se_translator
per thread
Use /EHa
void foo()
{
BUG
Normal path
Called only if no
debugger attached
© Mark Bartosik, www.bugbrowser.com 16
© Mark Bartosik, www.bugbrowser.com 31
Lifetime of an exception
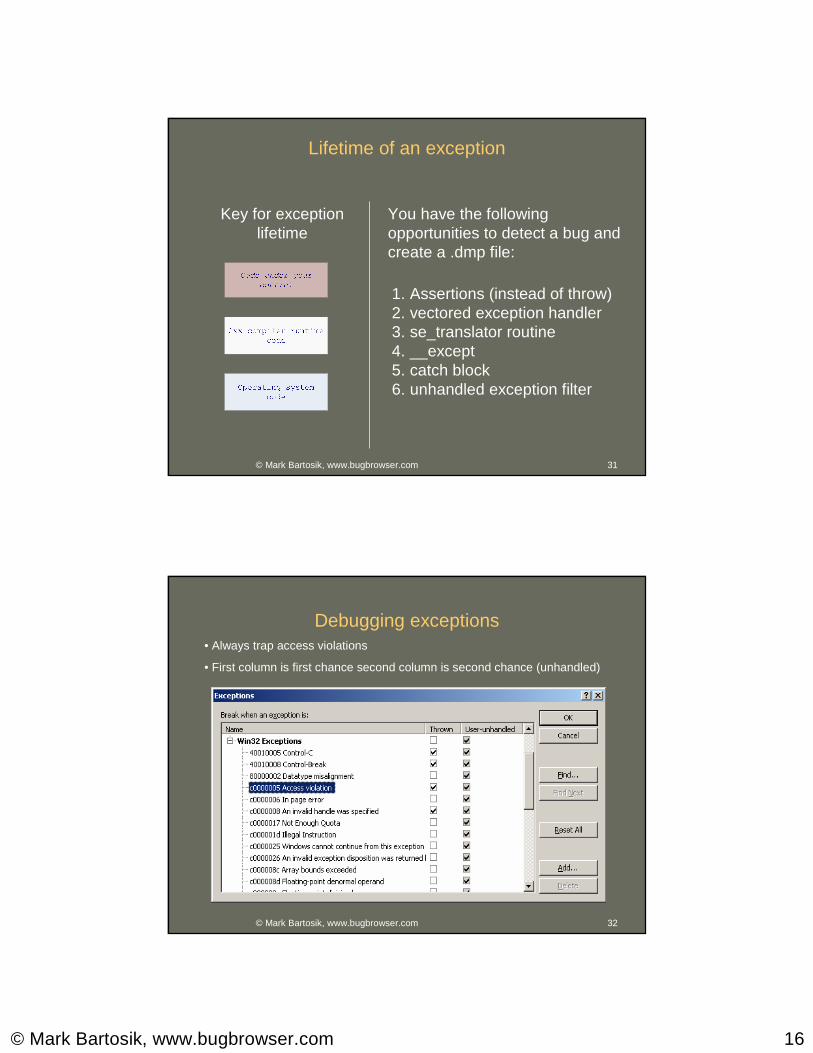
1. Assertions (instead of throw)2. vectored exception handler3. se_translator routine4. __except5. catch block6. unhandled exception filter
You have the following opportunities to detect a bug and create a .dmp file:
Key for exception lifetime
© Mark Bartosik, www.bugbrowser.com 32
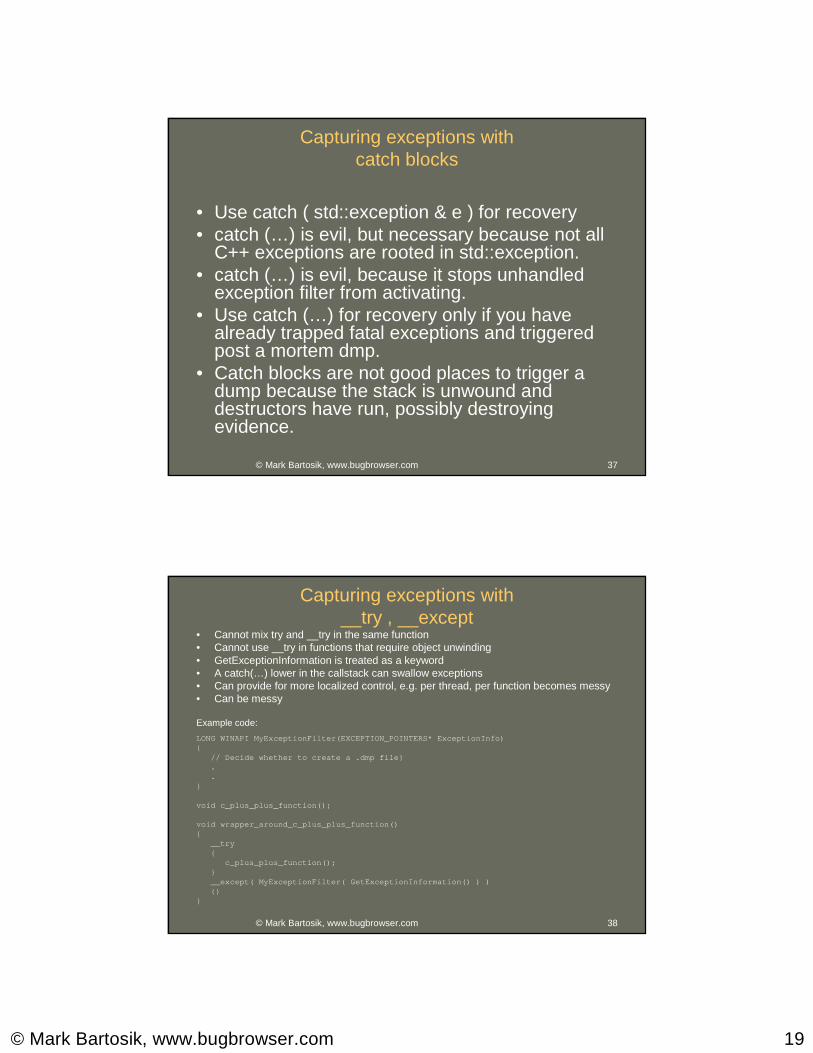
Debugging exceptions• Always trap access violations
• First column is first chance second column is second chance (unhandled)

© Mark Bartosik, www.bugbrowser.com 17
© Mark Bartosik, www.bugbrowser.com 33
Magic values
• Values to look for0xFDFDFDFD - No man’s land
0xDDDDDDDD - freed memory / deleted
0xCDCDCDCD - uninitialized0xCCCCCCCC - uninitialized locals
0xBAADF00D - value no longer valid
0xDEADBEEF – value no longer valid
???????? – uncommitted memory
© Mark Bartosik, www.bugbrowser.com 34
• Windows XP and beyond_WIN32_WINNT 0x0501
• AddVectoredExceptionHandler
• This installs a per process routine that is called whenever a structured exception occurs.
• There is a chain of these routines.• It is the first place in user mode code to trap all
exceptions. (First supported place) • It is suitable for CONDITIONALLY creating a
dump file.
Capturing exceptions with vectored exception handlers

© Mark Bartosik, www.bugbrowser.com 18
© Mark Bartosik, www.bugbrowser.com 35
• The compiler provides a way to map structured exceptions (like 0xC0000005) to a C++ exception like std::runtime_error(“FATAL!”).
• _set_se_translator• For VS 7.1 and greater requires /EHa, which has more
overhead• Is installed per thread per CRT• Do you have control of all threads?• Do you have multiple C++ runtimes loaded in your
process?• Can you require /EHa ?• Good for component writers linking with static CRT.
Capturing exceptions with se_translator
© Mark Bartosik, www.bugbrowser.com 36
• Exceptions often swallowed by catch(…) before they reach the unhandled exception filter.
• Vulnerable to stack corruption, because it is called at the end of a linked list of filters which is stored on the stack.
• Per process filter installed by SetUnhandledExceptionFilter
• Trigger your own post mortem or leave it to Microsoft.• The OS installs a default handler
Default handler looks as AeDebug registry key, runs debugger if configured.Win2K: MessageBox or DrWtsn32XP, 2003: if no debugger is installed (or Drwtsn32) loads faultrep.dll and calls ReportFault
Capturing exceptions with unhandled exception filter
© Mark Bartosik, www.bugbrowser.com 19
© Mark Bartosik, www.bugbrowser.com 37
• Use catch ( std::exception & e ) for recovery• catch (…) is evil, but necessary because not all
C++ exceptions are rooted in std::exception.• catch (…) is evil, because it stops unhandled
exception filter from activating.• Use catch (…) for recovery only if you have
already trapped fatal exceptions and triggered post a mortem dmp.
• Catch blocks are not good places to trigger a dump because the stack is unwound and destructors have run, possibly destroying evidence.
Capturing exceptions with catch blocks
© Mark Bartosik, www.bugbrowser.com 38
Capturing exceptions with __try , __except
• Cannot mix try and __try in the same function• Cannot use __try in functions that require object unwinding• GetExceptionInformation is treated as a keyword• A catch(…) lower in the callstack can swallow exceptions• Can provide for more localized control, e.g. per thread, per function becomes messy• Can be messy
Example code:
LONG WINAPI MyExceptionFilter(EXCEPTION_POINTERS* ExceptionInfo){
// Decide whether to create a .dmp file}..
}
void c_plus_plus_function();
void wrapper_around_c_plus_plus_function(){
__try{
c_plus_plus_function();}__except( MyExceptionFilter( GetExceptionInformatio n() ) ){}
}

© Mark Bartosik, www.bugbrowser.com 20
© Mark Bartosik, www.bugbrowser.com 39
Capturing post mortem files programmatically
• Implement a vectored exception handler,not simple, catches almost everything.
• Implement an unhandled exception filter, easy but does not catch everything.
• Implement an se_translator functioneasy but not suitable for all projects.
• Implement an exception filter with __except, can be messy, scoped, easy for per thread, does not catch everything.
• Implement catch(…), not recommended.
• Whatever the mechanism used to intercept exceptions, we need a process to create the dumpfile (doing this in-proc is not recommended).
• A typical implementation will CreateProcess with a command line of “dumpcapture-program –p pid”.
© Mark Bartosik, www.bugbrowser.com 40
Capturing post mortem files
• PER MACHINE configuration. Controlled by machine administrator.The OS installed unhandled exception filter looks at the AeDebug registry key will automatically launch the debugger registered by this key. This is done by an internal kernel32 function called UnhandledExceptionFilter .
HKEY_LOCAL_MACHINE\Software\Microsoft\Windows NT\CurrentVersion\AeDebugValues are Auto (DWORD set to 1)and Debugger (String command line for debugger)
– drwtsn32 -p %ld (will use WER instead under XP and later)– pathto\ntsd -p %ld -e %ld -g -c “.dump /ma /u c:\T EMP\new.dmp; q”
– pathto\cdb -p %ld -e %ld -g -c “.dump /ma /u c:\TE MP\new.dmp; q”
– pathto\windbg -p %ld -e %ld -g -c “.dump /ma /u c: \TEMP\new.dmp; q”
– pathto\dumpwriter -p %ld -e %ld
• PER APPLICATION configuration. Controlled by application developer.– Call CreateProcess or system or similar to launch a process like those above. This can be
done from within your chosen exception interception routine, you can control where dump file is written and how much information is included. This gives the developer much finer grain control.
– Call ReportFault . This reports to Microsoft via WER (XP and above).
© Mark Bartosik, www.bugbrowser.com 21
© Mark Bartosik, www.bugbrowser.com 41
Configuring DrWtsn32Dr. Watson
DrWatson has retired!(Still used on NT4 and 2000)
DrWtsn32 /? to configure
DrWtsn32 –p pid To create a dump file, and add to the logs, but only ONE dump file is created.Not recommended.
DrWtsn32 –i To install a post mortem debugger.Not recommended
© Mark Bartosik, www.bugbrowser.com 42
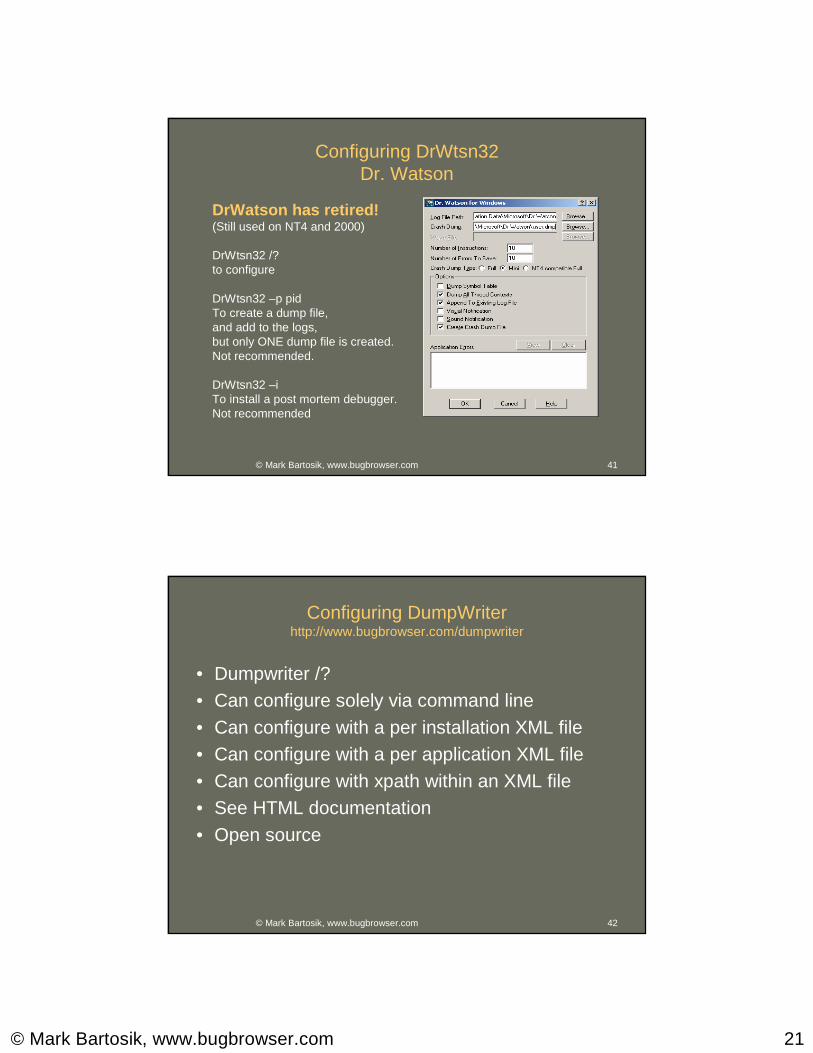
Configuring DumpWriterhttp://www.bugbrowser.com/dumpwriter
• Dumpwriter /?• Can configure solely via command line• Can configure with a per installation XML file• Can configure with a per application XML file• Can configure with xpath within an XML file• See HTML documentation• Open source

© Mark Bartosik, www.bugbrowser.com 22
© Mark Bartosik, www.bugbrowser.com 43
Using WERhttps://winqual.microsoft.com must use IE
• WER is configured via Group Policy editor GPEDIT.MSCPath in GPEDIT is \Computer Configuration\Administrative Templates\System\Error Reporting
– Enable / disable.– Enable a corporate upload path (UNC path)
This can be a network path for your test lab, or a local path.– Cannot redirect to a different web address �
• Basic requirements– Class 3 Verisign code signing certificate ($500).– Free once you have the Verisign cert.
(billing is only for other WinQual services, not WER)
– Sign the legal agreement (privacy of user data etc.)– You submit your products’ released modules to Microsoft to create a
mapping. (1 business day to process, 1 week to be reflected on web site planned to reduce 24 hours).
• You can download .cab files with the .dmp files and a little more info.• Currently have to have 3 crash reports per bucket to display crash
reports (a bucket is a crash at a unique RVA in a module).(Hope to use stripped symbols to allow buckets to use function names rather than RVA)
© Mark Bartosik, www.bugbrowser.com 44
Using WER
© Mark Bartosik, www.bugbrowser.com 23
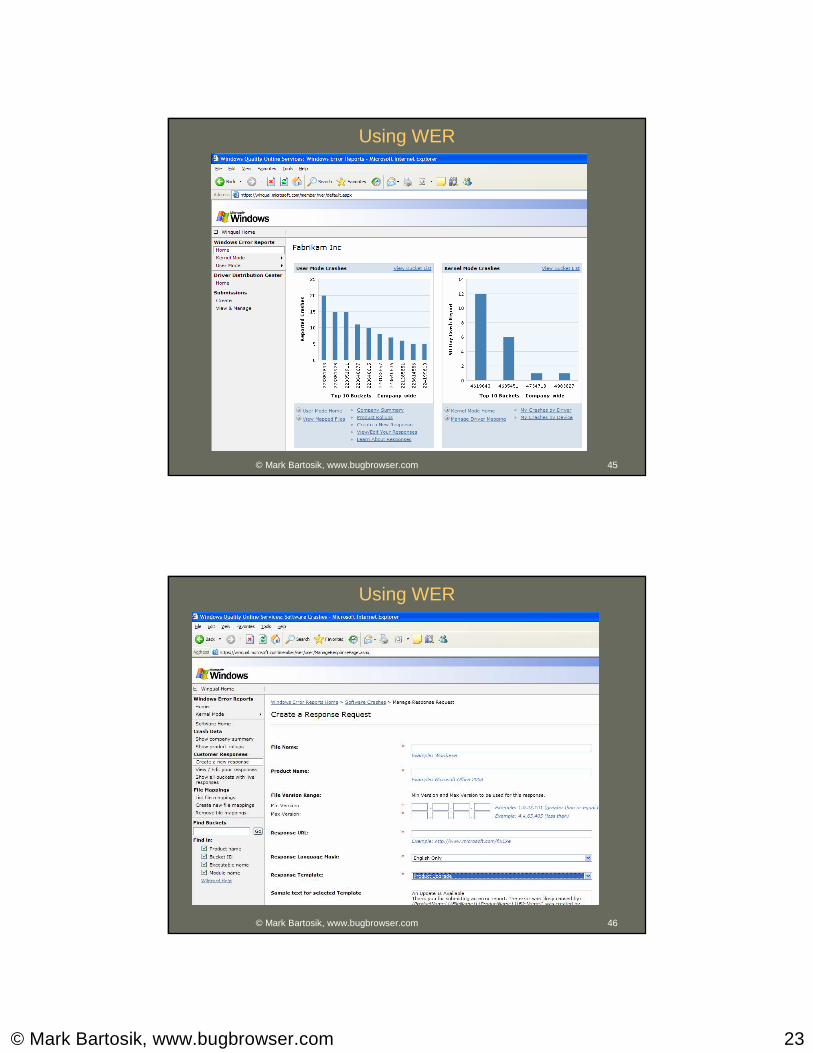
© Mark Bartosik, www.bugbrowser.com 45
Using WER
© Mark Bartosik, www.bugbrowser.com 46
Using WER

© Mark Bartosik, www.bugbrowser.com 24
© Mark Bartosik, www.bugbrowser.com 47
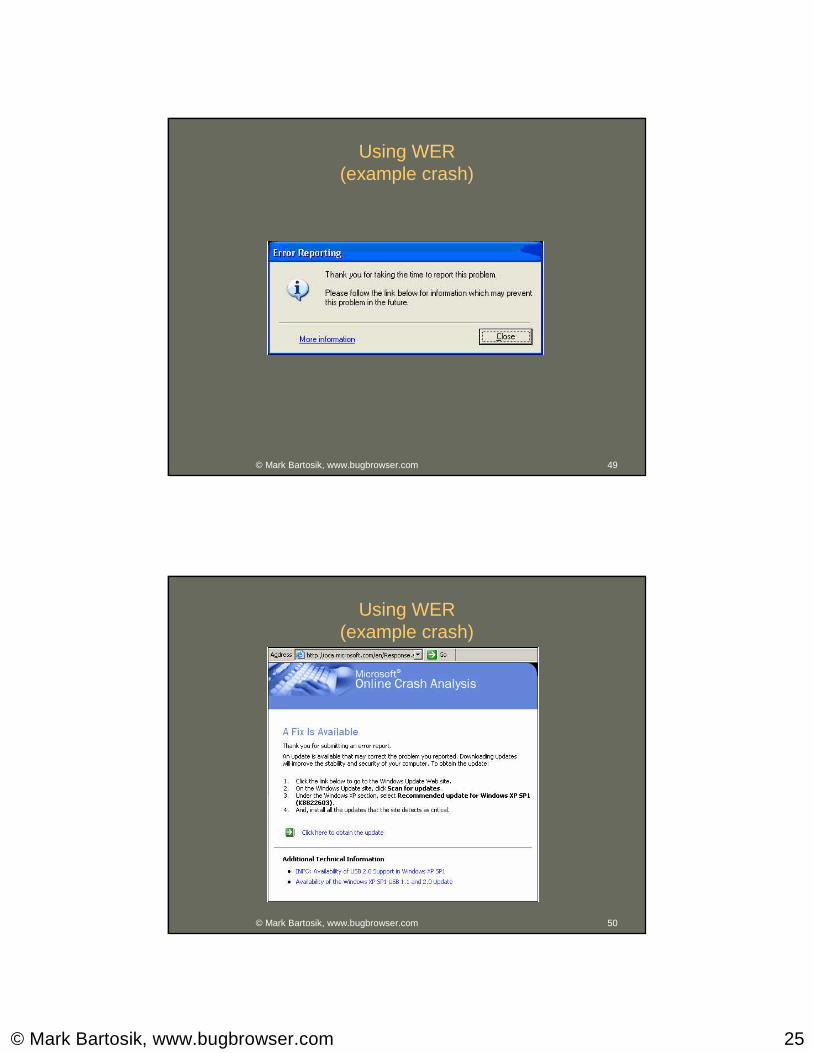
Using WER(example crash)
• WER will report Shell detected hangs “Application not responding”
• WER will report unhandled exceptions
© Mark Bartosik, www.bugbrowser.com 48
Using WER(example crash)
© Mark Bartosik, www.bugbrowser.com 25
© Mark Bartosik, www.bugbrowser.com 49
Using WER(example crash)
© Mark Bartosik, www.bugbrowser.com 50
Using WER(example crash)

© Mark Bartosik, www.bugbrowser.com 26
© Mark Bartosik, www.bugbrowser.com 51
Reading .dmp files with VS 2005
• View the dump file in both WinDbg and Visual Studio.
• VS 2005:
– Open the .dmp file using File, Open, Project/Solution– Set MODPATHto point to where binaries are
– Set symbol path to include Microsoft symbol server
– Select Debug, Start Debugging
© Mark Bartosik, www.bugbrowser.com 52
Reading .dmp files with VS 2005• Always include the Microsoft symbol server on the path (Menu option: Tools, Options)
• Or set _NT_SYMBOL_PATHenvironment variable to includeSRV*c:\websymbols*http://msdl.microsoft.com/downloa d/symbols
© Mark Bartosik, www.bugbrowser.com 27
© Mark Bartosik, www.bugbrowser.com 53
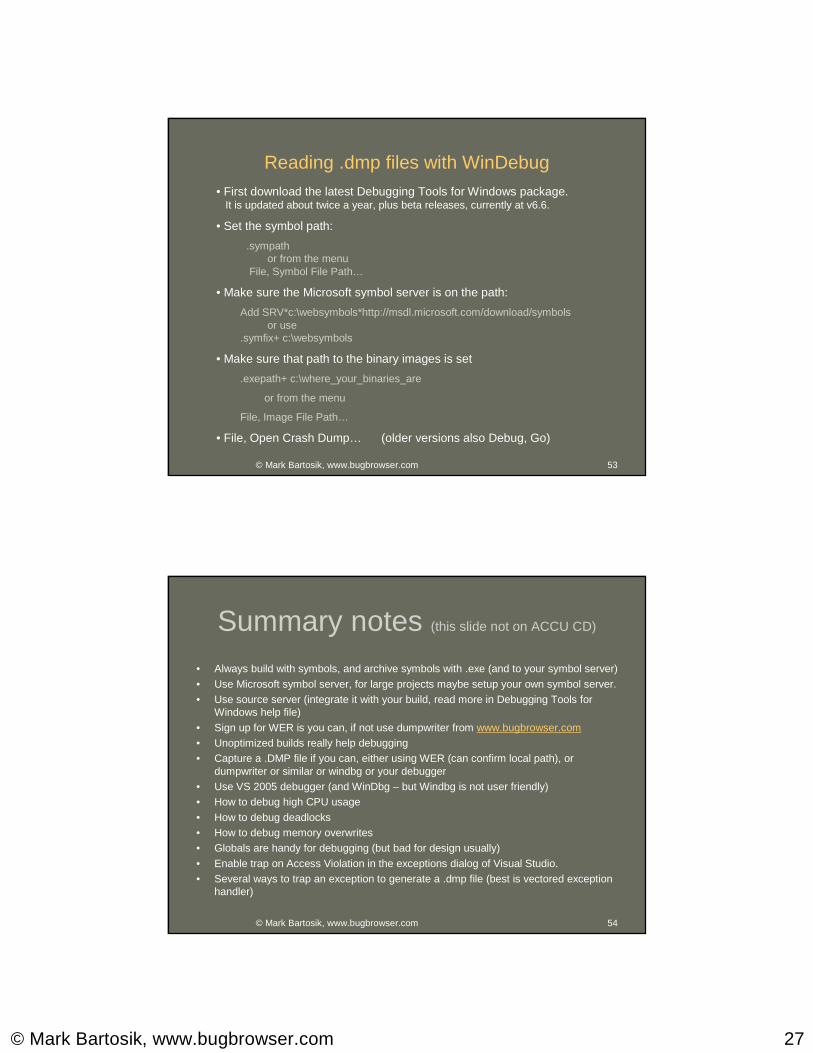
Reading .dmp files with WinDebug• First download the latest Debugging Tools for Windows package.
It is updated about twice a year, plus beta releases, currently at v6.6.
• Set the symbol path:
.sympathor from the menu
File, Symbol File Path…
• Make sure the Microsoft symbol server is on the path:
Add SRV*c:\websymbols*http://msdl.microsoft.com/download/symbolsor use
.symfix+ c:\websymbols
• Make sure that path to the binary images is set
.exepath+ c:\where_your_binaries_are
or from the menu
File, Image File Path…
• File, Open Crash Dump… (older versions also Debug, Go)
© Mark Bartosik, www.bugbrowser.com 54
Summary notes (this slide not on ACCU CD)
• Always build with symbols, and archive symbols with .exe (and to your symbol server)
• Use Microsoft symbol server, for large projects maybe setup your own symbol server.• Use source server (integrate it with your build, read more in Debugging Tools for
Windows help file)
• Sign up for WER is you can, if not use dumpwriter from www.bugbrowser.com• Unoptimized builds really help debugging• Capture a .DMP file if you can, either using WER (can confirm local path), or
dumpwriter or similar or windbg or your debugger• Use VS 2005 debugger (and WinDbg – but Windbg is not user friendly)• How to debug high CPU usage
• How to debug deadlocks• How to debug memory overwrites• Globals are handy for debugging (but bad for design usually)
• Enable trap on Access Violation in the exceptions dialog of Visual Studio.• Several ways to trap an exception to generate a .dmp file (best is vectored exception
handler)

© Mark Bartosik, www.bugbrowser.com 28
Links and referencesLinks• Latest slides, DumpWriter, Leak Browser: www.bugbrowser.com• Insect photos thanks to: www.mplonsky.com• WinDbg help: news://microsoft.pubic.windbg• Debugging Tools for Windows: http://www.microsoft.com/whdc/devtools/debugging/default.mspx• Programmed breakpoint control: http://www.morearty.com/code/breakpoint• Windows Error Reporting (WER):
http://winqual.microsoft.com (must use IE for this site)http://microsoft.sitestream.com/PDC05/FUN/FUN313.ziphttp://microsoft.sitestream.com/PDC05/FUN/FUN313_files/Botto_files/FUN313_Hardester.ppt
• Code Project:http://www.codeproject.com/debug/postmortemdebug_standalone1.asphttp://www.codeproject.com/debug/crash_report.asphttp://www.codeproject.com/debug/XCrashReportPt1.asp
Books• Debugging Applications for Microsoft .NET and Microsoft Windows, ISBN:0735615365
(I disagree with a lot of advice in this book – like recommendations not to use STL and even some debugging aspects, nevertheless it presents useful techniques)
• Microsoft Windows Internals, ISBN:0735619174 (currently 4th Edition)• How Debuggers Work, ISBN 0-471-14966-8
Related Documents


![Debugging with gdb - USTC...Richard Stallman, Roland Pesch, Stan Shebs, et al. (Send bugs and comments on gdb to Intel’s Debug Solutions User Forum.) See Chapter 32 [GDB Bugs], page](https://static.cupdf.com/doc/110x72/5ea39617c18d7a524e5ea8e7/debugging-with-gdb-ustc-richard-stallman-roland-pesch-stan-shebs-et-al.jpg)