Hunger Doesn’t Take a Vacation: Summer Nutrition Status Report June 2018 n www.FRAC.org

Welcome message from author
This document is posted to help you gain knowledge. Please leave a comment to let me know what you think about it! Share it to your friends and learn new things together.
Transcript
1 FRAC n Title of the Report Here n www.FRAC.org n twitter@fractweets
Hunger Doesn’t Take a Vacation:Summer Nutrition Status Report
June 2018 n www.FRAC.org

2 FRAC n Title of the Report Here n www.FRAC.org n twitter@fractweets
Hunger Doesn’t Take a Vacation:Summer Nutrition Status Report
Acknowledgments This report was prepared by Signe Anderson,
Randy Rosso, Alex Boyd, and Crystal FitzSimons
of the Food Research & Action Center (FRAC).
The Food Research & Action Center (FRAC) gratefully
acknowledges the following for supporting its work to
expand and improve the Summer Nutrition Programs
in 2017–2018:
n The California Endowment;
n Kellogg Company Fund;
n National League of Cities Institute;
n Tyson Foods, Inc.;
n Walmart Foundation; and
n YMCA of the USA.
Support of FRAC’s work to expand and improve the child
nutrition programs has been provided by the following:
n Annie E. Casey Foundation;
n Anonymous Donor;
n Eos Foundation;
n Evangelical Lutheran Church in America;
n General Mills Foundation;
n Hunger Is, a joint program of the Albertsons
Companies Foundation and the Entertainment
Industry Foundation;
n The JPB Foundation;
n Menemsha Family Fund;
n National Dairy Council/Dairy Management, Inc.;
n Robert Wood Johnson Foundation; and
n Turrell Fund.
About FRAC The Food Research & Action Center (FRAC) is the
leading national organization working for more effective
public and private policies to eradicate domestic hunger
and undernutrition. For more information about FRAC,
Summer Nutrition Programs, or to sign up for FRAC’s
Weekly News Digest, visit frac.org.
3 FRAC n Title of the Report Here n www.FRAC.org n twitter@fractweets
When the school bell rings to mark the
beginning of the long summer recess,
millions of low-income children lose access
to the school breakfasts and lunches they rely on
during the school year. The federal Summer Nutrition
Programs1 are designed to replace school breakfast
and lunch. The programs ensure that low-income
children have access to healthy meals, which is critical
for their health and well-being. In addition to nutritious
meals, many Summer Nutrition Programs sites offer
educational, enrichment, physical, and recreational
activities; keep children safe and out of trouble; and
provide crucial child care for working parents.
The Summer Nutrition Programs consistently have
struggled to meet the need, serving only a modest
fraction of the low-income children who rely on free
and reduced-price school lunch during the school year.
In July 2017, just over 3 million children participated,
a small decrease of 14,000 from July 2016. Only
one child out of seven received a nutritious summer
lunch through the Summer Nutrition Programs when
compared to the 20 million children who participated in
free and reduced-price school lunch during the 2016–
2017 school year.
The 2017 drop in participation follows a concentrated
and successful multi-year effort to increase
participation, which resulted in 13,000 additional
children participating in 2012; 161,000 additional
children in 2013; 215,000 additional children in 2014;
and 11,000 additional children in 2015. However, in the
summers of 2016 (153,000 fewer children) and
2017 (14,000 fewer children), the program began
to lose ground.
One of the primary reasons for the low participation
and the ongoing struggle to increase it is that there
is not enough public and private funding for summer
programs that provide educational and enrichment
activities for low-income children. These programs also
provide the platform for serving summer meals. The
programming combined with the meals gives children
what they need: enrichment activities in a safe and
supervised environment, and the nutrition necessary
to return in the fall healthy and ready to learn. The
21st Century Community Learning Centers program,
the largest source of federal funding for summer and
afterschool programs, serves just 1.7 million children.
More funding at the federal, state, and local levels for
summer programs that do not price out low-income
families from participating is needed to increase
participation in the Summer Nutrition Programs.
Additionally, there are ways to strengthen through
federal legislation the Summer Nutrition Programs
and overcome common barriers. One key strategy
is making more low-income communities eligible to
participate. The current area eligibility test requires that
at least half of the children in the area are low-income,
which makes it difficult for communities with substantial
but less concentrated poverty, such as rural areas, to
provide summer meals. Rural areas also would benefit
from targeted funding for transportation costs.
Introduction
FRAC n Hunger Doesn’t Take a Vacation: Summer Nutrition Status Report n www.FRAC.org n @fractweets 3
1 The federal Summer Nutrition Programs include the Summer Food Service Program and the National School Lunch Program, which includes the Seamless Summer Option.

FRAC n Hunger Doesn’t Take a Vacation: Summer Nutrition Status Report n www.FRAC.org n @fractweets 4
This report measures the reach of the Summer Nutrition
Programs in July 2017, nationally and in each state. It is
based on a variety of metrics and examines the impact
of trends and policies on program participation.
First, this report looks at lunch participation in the
Summer Nutrition Programs — the combined lunch
participation in the Summer Food Service Program
(SFSP) and the National School Lunch Program (NSLP),
which includes children participating through the
NSLP Seamless Summer Option and those certified
for free and reduced-price meals — and uses free and
reduced-price participation in NSLP in the prior regular
school year as a benchmark against which to compare
summer. Because there is broad participation in the
regular school year lunch program by low-income
students across the states, it is a useful comparison by
which to measure how many students could and should
be benefiting from the Summer Nutrition Programs.
Second, this report looks at the number of sponsors
and sites operating SFSP, as this is an important
indicator of access to the program for low-income
children in the states.
Finally, this report sets an ambitious, but achievable,
goal of reaching 40 children with the Summer Nutrition
Programs for every 100 participating in school lunch
and calculates the number of unserved children and
the federal dollars lost in each state that is not meeting
this goal.
Last summer’s small drop in participation further
compounds the large drop in 2016, highlighting the
need to redouble efforts to increase participation in
the Summer Nutrition Programs. Outreach, promotion,
and planning all contributed to the earlier growth in
program participation. These earlier efforts focused
solely on increasing participation in the Summer
Nutrition Programs. Expanding these efforts to include
afterschool nutrition programs during the regular school
year through the Child and Adult Care Food Program
would create stronger, more sustainable out-of-school-
time programs that operate from year to year. Together,
the U.S. Department of Agriculture, state child nutrition
agencies, sponsors, summer programs, anti-hunger
and child advocates, and communities can take these
steps to reverse the drop and expand the reach of the
Summer Nutrition Programs.
About This Summer Food Report
5 FRAC n Title of the Report Here n www.FRAC.org n twitter@fractweets
State Findings for 2017The reach of the Summer Nutrition Programs varied
throughout the country, with the lowest-performing
state serving one child for every 21 low-income children
who participated in school lunch during the regular
school year, and the highest-performing state serving
nearly half of such children. Only 15 states increased
participation in July 2017.
n The four top-performing states and the District of
Columbia reached at least one child for every four
low-income children in July 2017, when comparing
Summer Nutrition Programs participation to the
regular school-year free and reduced-price National
School Lunch Program (NSLP) numbers. The top
performers included the District of Columbia (47.9 to
100), Vermont (30.7 to 100), New York (30.4 to 100),
New Mexico (28.4 to 100), and Maine (27.4 to 100).
n There were four additional states that reached one
child with summer lunches for every five low-income
children who participated in school lunch: New
Jersey (23.7 to 100), Georgia (22.4 to 100), Maryland
(21.6 to 100), and Connecticut (21.3 to 100).
n Twelve states provided summer lunch to fewer than
one child for every 10 children who participated in
school lunch: Oklahoma (4.7 to 100), Nevada (4.9 to
100), Louisiana (6.8 to 100), Nebraska (6.9 to 100),
Mississippi (7.7 to 100), Kentucky (7.8 to 100), Texas
(8.2 to 100), West Virginia (8.2 to 100), Colorado (8.7
to 100), Missouri (8.8 to 100), Hawaii (9.6 to 100), and
Kansas (9.6 to 100).
n Three states increased the number of participants
in the Summer Nutrition Programs by more than
10 percent: Georgia (37.7 percent), New Jersey (25
percent), and Indiana (16.3 percent).
n While this report focuses on participation in NSLP
and the Summer Food Service Program (SFSP)
FRAC n Hunger Doesn’t Take a Vacation: Summer Nutrition Status Report n www.FRAC.org n @fractweets 5
National Findings for 2017National participation in the Summer Nutrition Programs
decreased slightly in 2017, marking a second year of
diminished participation. The Summer Food Service
Program (SFSP) saw a decrease, while the National
School Lunch Program (NSLP) saw an increase in the
average daily participation; however, the increased
participation in NSLP was not enough to make up for the
decline in SFSP participation.
n In July 2017, on an average weekday, the Summer
Nutrition Programs served lunch to more than 3
million children, a decrease of just over 14,000
children, or 0.5 percent, from July 2016.
n The drop in participation was driven by SFSP, which
served approximately 71,000 fewer children. July
NSLP participation increased by nearly 57,000
children.
n In July 2017, only 15 children received summer lunch
for every 100 low-income children who received
lunch in the 2016–2017 school year.
n The ratio of 15 to 100 remained unchanged from July
2016. The small drop in participation in the Summer
Nutrition Programs — combined with a decrease of
131,000 low-income children participating in school
lunch during the 2016–2017 regular school year
from the previous school year — meant that the ratio
remained static.
n The number of SFSP sponsors decreased while the
number of sites increased from July 2016 to July
2017. Nationally, 5,512 sponsors (an increase by one
sponsor) and 48,798 sites (an increase by 150 sites)
participated in July 2017.
n The Summer Nutrition Programs are designed to
provide meals to children throughout the entire
summer, but more work is needed to ensure that sites
are open all summer long. In June 2017, the number
of SFSP lunches increased compared to the previous
summer by 4.2 percent (nearly 1.3 million), while that
number decreased by 3.5 percent (a little more than
527,000) in August 2017.

FRAC n Hunger Doesn’t Take a Vacation: Summer Nutrition Status Report n www.FRAC.org n @fractweets 6
combined during the month of July, it is important
to note that 27 states served more lunches through
SFSP during the month of June. Five states served
more than twice as many lunches through SFSP in
June than in July – Arizona, Mississippi, Missouri,
Nebraska, and Oklahoma.
n In 2017, several states continued to address the
gaps that often exist at the beginning and end of
summer by increasing the number of SFSP lunches
provided. Twenty-one states increased the number
of SFSP lunches served in the months of June and
August. Nine of those states increased the number
of summer lunches served during all three summer
months — Delaware, Hawaii, Illinois, Kentucky,
Minnesota, Missouri, New Jersey, North Dakota,
and South Dakota.
Top 10 Performing States
StateRatio of Summer Nutrition to NSLP
Rank
District of Columbia 47.9 1
Vermont 30.7 2
New York 30.4 3
New Mexico 28.4 4
Maine 27.4 5
New Jersey 23.7 6
Georgia 22.4 7
Maryland 21.6 8
Connecticut 21.3 9
Idaho 19.7 10
Bottom 10 Performing States
StateRatio of Summer Nutrition to NSLP
Rank
Missouri 8.8 42
Colorado 8.7 43
West Virginia 8.2 44
Texas 8.2 45
Kentucky 7.8 46
Mississippi 7.7 47
Nebraska 6.9 48
Louisiana 6.8 49
Nevada 4.9 50
Oklahoma 4.7 51
Missed OpportunitiesThe Summer Nutrition Programs provide federal funding
to states so they can provide healthy summer meals that
help reduce childhood hunger and improve nutrition.
In addition, states have the opportunity to bring in
additional federal dollars by serving more meals. These
dollars provide a sustainable funding source to summer
programs and support summer employment.
The Summer Nutrition Programs can bring millions of
dollars to states. For every lunch that an eligible child
did not receive in 2017, the state and community missed
out on $3.77 per child in federal Summer Food Service
Program funding. That means many millions of dollars
were left on the table.
If every state had reached the goal of 40 children
participating in the Summer Nutrition Programs in July
2017 for every 100 receiving free or reduced-price
lunch during the 2016–2017 school year, an additional 5
million children would have been fed each day. States
would have collected an additional $379 million in child
nutrition funding in July alone (assuming the program
operated 20 days).
The six states that missed out on the most federal
funding and failed to feed the most children by falling
short of the 40 to 100 goal were Texas ($57.9 million;
767,801 children), California ($39.5 million; 523,471
children), Florida ($24.2 million; 321,493 children), Illinois
($16.4 million; 218,092 children), Ohio ($13.9 million;
184,010 children) and Pennsylvania ($12 million;
158,789 children).
7 FRAC n Title of the Report Here n www.FRAC.org n twitter@fractweets FRAC n Hunger Doesn’t Take a Vacation: Summer Nutrition Status Report n www.FRAC.org n @fractweets 7
OpportunitiesSummer Electronic Benefits Transfer for Children Program: An Important Strategy to Meet the Nutrition Gap
In 2011, the U.S. Department of Agriculture began
the Summer Electronic Benefits Transfer for Children
(SEBTC) program, providing the families of 12,500 low-
income children a debit card with a fixed dollar amount
to purchase groceries during the summer months.
Participation in SEBTC is not captured in this report’s
analysis of the reach of the Summer Nutrition Programs,
but approximately 240,000 children across seven states
(Connecticut, Delaware, Michigan, Missouri, Nevada,
Oregon, Virginia) and the Cherokee and Chickasaw
Nations participated in summer 2017. This was an
increase from 2016 when approximately 209,000
children participated.
Children need both the food and the academic and
enrichment activities provided at summer meal sites in
order to return to school at the end of the summer ready
to learn. However, SEBTC offers a way to ensure that
children in communities with limited summer meal sites,
due to transportation or other barriers, still have access
to nutrition during the summer, a time when states with
low participation in the Summer Nutrition Programs have
the largest seasonal increases in food insecurity.2
A 2016 report3 assessed the two different levels of
monthly summer benefits ($30 and $60) as well as the
different distribution models: benefits tied to specific
food items, similar to the Special Supplemental Nutrition
Program for Women, Infants, and Children (WIC), versus
a specific monetary value available for food purchases
similar to the Supplemental Nutrition Assistance
Program (SNAP). In that report, participation in SEBTC
led to several positive results:
n Reduced food insecurity. By providing low-income
households with a $30 or $60 per month per child
benefit, the most severe type of food insecurity (very
low food security) was reduced by one-third, and food
insecurity was reduced by one-fifth.
n Improved nutrition. Both the $30 and $60 monthly
benefit levels led to an improvement in children’s
summertime nutritional intake, but children in
households that received the $60 benefit ate slightly
more nutritious foods (fruits, vegetables, and whole
grains) than those in the $30 group.
n High rates of participation. More than 75 percent of
households redeemed some or all of their benefits.
While both models were efficient in reaching families,
those who participated in the project modeled after
SNAP redeemed benefits at higher rates than those
who were in the project that was based on the WIC
model (95 percent versus 83 percent). This is likely
due to the more limited availability of WIC retailers
and the higher administrative costs to provide the
benefit through WIC.
Recognizing the impact SEBTC has on reducing
food insecurity, Congress has continued to invest
in and expand SEBTC’s reach through the annual
appropriations process. Over the last few years, there
have been a number of proposals and legislation
introduced that would have made even larger
investments in SEBTC, including the Stop Summer
Hunger Child Nutrition Act (S. 1539/H.R. 2715),
introduced by Senator Patty Murray (D-WA) and
Representative Susan Davis (D-CA).
As too many children continue to miss out on summer
meals, it is crucial to intensify efforts to invest in and
expand both the SEBTC and the Summer Nutrition
Programs. By providing greater nutritional support to
families in underserved and hard-to-reach areas, while
simultaneously strengthening the Summer Nutrition
Programs to ensure that low-income children have
access to the food and programming they need over
2 Nord, M. & Romig, K. (2006). Hunger in the summer: seasonal food insecurity and the National School Lunch and Summer Food Service programs. Journal of Children and Poverty, 12(2), 141-158.
3 Abt Associates Inc. (2016). Summer Electronic Benefit Transfer for Children (SEBTC) Demonstration: Summary Report. Available at: https://fns-prod.azureedge.net/sites/default/files/ops/sebtcfinalreport.pdf. Accessed on May 10, 2018.

FRAC n Hunger Doesn’t Take a Vacation: Summer Nutrition Status Report n www.FRAC.org n @fractweets 8
the summer, more children will return to school in the fall
healthy, nourished, and ready to learn.
Summer Programming
Summer Learning Loss
Many of the children who face a nutrition gap when the
school year ends also are affected disproportionately by
summer learning loss. Also known as the “summer
slide,” this refers to the loss of academic skills and
knowledge over the summer. Quality summer programs
can help reduce summer learning loss, but are either
non-existent or unaffordable for many low-income
families. This means such children return to school in the
fall academically behind their higher-income peers and
struggling to catch up before classes even begin.
Structured summer enrichment and educational
activities provide an important foundation on which
strong summer meals programs can be built. Therefore,
it is important that there are enough summer programs
available, and that families are not priced out of
participating in these programs. Increased investments
in summer programs for low-income children at federal,
state, and local levels would ensure children have
access to the learning opportunities and meals they
need to succeed.
The 21st Century Community Learning Centers
program, the largest federal funding source for summer
and afterschool programming, demonstrates the positive
impact federal funding can have on supporting students’
academic achievement. Despite proposals by the
current administration to eliminate funding for the
program completely in both fiscal year (FY) 2018 and FY
2019, Congress recently approved $1.21 billion in funding
for the 21st Century Community Learning Centers
program for FY 2018 — $20 million above the previous
year. Twenty-thousand additional children will join the 1.6
million already benefiting from the program. However,
millions more remain unserved, and the program
remains vulnerable to future funding cuts. With clear
evidence of the detrimental impact that summer learning
loss has on students — and ultimately, on the future
workforce — Congress should continue investing more
resources into the 21st Century Community Learning
Centers as well as other summer enrichment
opportunities, not cut them.
In addition to federal investments, more efforts to
establish stable summer funding opportunities on a state
level are needed. A number of states, such as
Massachusetts and California, have prioritized summer
learning by allocating funding to support such programs,
and many states are moving in the right direction. For
example, Nevada recently passed legislation that would
designate certain tax revenue to support summer
learning programs in low-income areas. Learn more
about state level opportunities for increasing access to
summer learning and enrichment activities with the
National Summer Learning Association’s Funding
Resource Guide.
Additionally, the Every Student Succeeds Act (ESSA)
creates an opportunity for states to prioritize summer
programs that counter summer learning loss. ESSA, the
most recent iteration of the Elementary and Secondary
Education Act, requires each state to develop a plan for
how they will close educational achievement gaps.
Tennessee, for example, included more funding for
summer programs to support students reading at
grade-level in their ESSA plan.
The most successful summer meal programs are those
that offer educational or enrichment activities and meals.
Investing in summer programming pays off — for
children, their families, and communities.
9 FRAC n Title of the Report Here n www.FRAC.org n twitter@fractweets FRAC n Hunger Doesn’t Take a Vacation: Summer Nutrition Status Report n www.FRAC.org n @fractweets 9
Every Student Succeeds Act
The Every Student Succeeds Act (ESSA) reauthorizes
the Elementary and Secondary Education Act and
replaces No Child Left Behind. ESSA brings more
decision-making back to state education agencies
and local education agencies (LEAs — commonly
referred to as school districts) and offers an
opportunity to increase participation in summer meals.
ESSA focuses on ensuring that students succeed
academically, but acknowledges the need to support
the whole child through collaboration, engagement,
and evidence-based programs. The large body of
research on the negative impact of hunger on
children’s academic outcomes; the role of the federal
child nutrition programs in combating childhood
hunger; and the positive impact of summer programs
on academic achievement highlight the ways that
increasing access to summer meals and summer
programs can help states and school districts meet
the goals of ESSA.
All states were required to submit an ESSA plan to the
U.S. Department of Education, and school districts
must develop a plan based upon their state’s plan.
States and LEAs also must develop a report card,
which creates and implements new accountability
systems and needs assessments for schools. The
state and local report cards can include participation
in the child nutrition programs. States and school
districts are required to have meaningful engagement
from community members on the plan’s development
and the report cards, creating the opportunity to
inform educators about the positive impact of the
child nutrition programs.
As of May 2018, not all state plans have been
approved, but all states are working on implementation
and LEAs are working on their plans and
implementation as well. Some states have incorporated
increased access to the child nutrition programs and
expanded summer learning opportunities. For
example, Oklahoma’s plan includes efforts to combat
hunger, setting a goal to increase the number of meals
served through the Summer Food Service Program
by 30 percent by 2025, and supports offering
summer programs.
To see how your state is doing with implementing
ESSA, refer to the National Education Association’s
interactive map. For more information on opportunities
to increase access to the Summer Nutrition Programs
and other child nutrition programs through ESSA, visit
the Food Research & Action Center’s website.

FRAC n Hunger Doesn’t Take a Vacation: Summer Nutrition Status Report n www.FRAC.org n @fractweets 10
Meal QualityNutritious and appealing summer meals draw children
to sites and keep them coming back throughout the
summer. The meals provided through the Summer
Nutrition Programs must meet the federal nutrition
standards, with a lunch including milk, two servings of
fruits and vegetables, a grain, and a protein, but many
sponsors are going above and beyond the standards
to provide fresh and local produce, increase whole
grain options, serve lean meats, and provide low or
non-fat milk.
To encourage sponsors to focus on improving nutrition
quality, the U.S. Department of Agriculture (USDA),
launched Turnip the Beet in 2016. The initiative gives
awards to sponsors that provide high-quality meals,
offers resources on improving nutritional quality, and
highlights best practices. USDA’s Team Nutrition also
has provided numerous resources to improve summer
meals and incorporate nutrition education. The Food
Research & Action Center also has focused on
improving nutrition quality by developing the Summer
Food Standards of Excellence. The Standards of
Excellence, modeled after USDA’s HealthierUS School
Challenge, provides criteria for meeting gold, silver, or
bronze standards for food quality, the site environment,
and outreach efforts. State agencies and anti-hunger
organizations have used the Standards to highlight and
promote best practices.
In addition, USDA is working closely with state agencies
to promote the use of local foods in summer meals,
known as “farm to summer.” USDA allows its Farm to
School grants to support incorporating local foods into
summer meals. Many state child nutrition agencies,
including those in Iowa, Kentucky, Massachusetts,
Texas, and Wyoming, reported promoting farm to
summer through trainings, technical assistance, and
partnerships. FRAC’s Fresh From the Farm Guide:
Using Local Foods in the Afterschool and Summer
Nutrition Programs provides ideas and resources for
incorporating local foods into summer and afterschool
meal sites and can help support these efforts.
Excellence in Summer Meals Campaign
The Texas Hunger Initiative (THI) created its
Excellence in Summer Meals Campaign (based on
FRAC’s Summer Food Standards of Excellence)
to encourage sponsors to serve high-quality meals.
Each year, THI hosts an event to recognize and
give awards to sponsors that exceed expectations
during the summer. Eighteen sponsors were
honored in 2017. The Excellence in Summer
Meals Campaign initially focused on Dallas,
but has expanded to include Austin, and will
expand further in 2018 to include Fort Worth
and additional counties.
Strategies to Improve Quality in Vermont
Hunger Free Vermont works with sponsors to
improve nutrition quality. It created a food quality
and cost control resource hub to provide
information and best practices related to nutritional
quality for sponsors to guide their efforts in
improving meal quality. Hunger Free Vermont also
works with a robust network of partners to help
sponsors source local foods.

11 FRAC n Title of the Report Here n www.FRAC.org n twitter@fractweets FRAC n Hunger Doesn’t Take a Vacation: Summer Nutrition Status Report n www.FRAC.org n @fractweets 11
ConclusionChildren need healthy meals throughout the long
summer break, the time when childhood hunger
increases. But the Summer Nutrition Programs are not
meeting enough of the need, serving only one child for
every seven low-income children who participated in
school lunch during the regular school year. The small
decrease in Summer Nutrition Programs participation in
2017, combined with the larger decrease in 2016,
highlights the need to redouble efforts to ensure that
children have access to healthy meals in the summer.
In order to expand access, federal, state, and local
government and private funders need to provide more
funding for summer programming to help low-income
children. Congress also needs to make improvements to
the Summer Nutrition Programs that increase the
number of communities eligible to participate and ease
the paperwork requirements of providing meals to
children year-round at summer and afterschool
programs. The U.S. Department of Agriculture, state
child nutrition agencies, and anti-hunger partners need
to maintain and expand efforts to increase participation
through promotion, outreach, and planning. There is
much work to be done to increase the reach of the
Summer Nutrition Programs, but through additional
investments and focused expansion efforts at the
national, state, and local levels, more children who need
summer meals will have access to them.
Technical Notes The data in this report are collected from the U.S.
Department of Agriculture (USDA) and from an annual
survey of state child nutrition officials conducted by the
Food Research & Action Center (FRAC).
This report does not include the Summer Nutrition
Programs in Puerto Rico, Guam, the Virgin Islands, or
Department of Defense schools.
Due to rounding, totals in the tables may not add up to
100 percent.
Summer Food Service Program (SFSP)
USDA provided to FRAC the number of SFSP lunches
served in each state. FRAC calculated each state’s July
average daily lunch participation in SFSP by dividing
the total number of SFSP lunches served in July by
the total number of weekdays in July (excluding the
Independence Day holiday).
The average daily lunch participation numbers for July
reported in FRAC’s analysis are slightly different from
USDA’s average daily participation numbers. FRAC’s
revised measure allows consistent comparisons from
state to state and year to year. This measure is also
more in line with the average daily lunch participation
numbers in the school year National School Lunch
Program (NSLP), as described below.
FRAC uses July data because it is impossible to
determine for June and August how many days were
regular school days, and how many were summer
vacation days. Due to limitations in USDA’s data, it
also is not possible in those months to separate NSLP
data to determine if meals were served as part of the
summer program or as part of the regular school year.
USDA obtains the July numbers of sponsors and sites
from the states and reports them as the states provide
them. USDA does not report the number of sponsors or
sites for June or August.
For this report, FRAC gave states the opportunity to
update the July data on sponsors and sites, and the
total number of lunches for June, July, and August
that FRAC obtained from USDA. The state changes
are included.
National School Lunch Program (NSLP)
Using data provided by USDA, FRAC calculated the
regular school year NSLP average of daily low-income
student attendance for each state, based on the number
of free and reduced-price meals served from September
through May.
FRAC used the July average daily attendance
figures provided by USDA for the summertime NSLP
participation data in this report. The NSLP summer
meal numbers include all of the free and reduced-price
lunches served through NSLP during July. This includes
lunches served at summer school, through the NSLP
Seamless Summer Option, and on regular school days
(during July).
Note that USDA calculates average daily participation
in the regular year NSLP by dividing the average daily
lunch figures by an attendance factor (0.938) to account
for children who were absent from school on a particular
day. FRAC’s annual School Breakfast Scorecard reports
these NSLP average daily participation numbers; that
is, including the attendance factor. To make the NSLP
numbers consistent with the SFSP numbers, for which
there is no analogous attendance factor; however, this
report — Hunger Doesn’t Take a Vacation — does
not include the attendance factor. As a result, the
regular school year NSLP numbers in this report do not
match the NSLP numbers in FRAC’s School Breakfast
Scorecard School Year 2016–2017.
FRAC recalculated average daily NSLP participation
for July 2016 and 2017 in Hawaii to resolve data
inconsistencies. While the number of lunches served
in July 2017 declined by 10.0 percent compared to the
previous July, the reported average daily participation
FRAC n Hunger Doesn’t Take a Vacation: Summer Nutrition Status Report n www.FRAC.org n @fractweets 12
FRAC n Hunger Doesn’t Take a Vacation: Summer Nutrition Status Report n www.FRAC.org n @fractweets 13
fell 68.0 percent, apparently due to the average number
of operating days rising sharply from around nine days
in July 2016 to 24 days in July 2017. FRAC was unable
to determine the actual number of operating days in
either summer. Instead, FRAC determined that Hawaii
averaged about 10 operating days in July over the
period from 2000 to 2015. FRAC calculated average
daily participation in lunch in July 2016 and 2017 by
dividing the number of meals served in July by 10 days.
FRAC received corrected total average daily NSLP
participation data from the District of Columbia, and
FRAC used these numbers to recalculate average
operating days and free and reduced-price average
daily participation.
The Cost of Low Participation
For each state, FRAC calculated the average daily
number of children receiving summer nutrition in July
for every 100 children receiving free or reduced-price
lunches during the regular school year. FRAC then
calculated the number of additional children who
would be reached if that state achieved a 40 to 100
ratio of summer nutrition to regular school year lunch
participation. FRAC then multiplied this unserved
population by the summer lunch reimbursement rate
for 20 days (the number of weekdays in July 2017,
not counting the Independence Day holiday) of SFSP
lunches. FRAC assumed each meal is reimbursed at the
lowest standard rate available ($3.77 per lunch for
July 2017).

14 FRAC n Title of the Report Here n www.FRAC.org n twitter@fractweets
Alabama 37,879 372,326 10.2 39 37,031 362,235 10.2 39 -2.2%
Alaska 3,994 37,068 10.8 37 4,062 38,871 10.5 35 1.7%
Arizona 57,533 465,440 12.4 31 48,216 462,360 10.4 36 -16.2%
Arkansas 28,921 229,149 12.6 30 24,302 227,029 10.7 34 -16.0%
California 456,607 2,458,336 18.6 13 443,214 2,416,712 18.3 14 -2.9%
Colorado 20,271 230,033 8.8 46 19,625 224,547 8.7 43 -3.2%
Connecticut 37,303 159,482 23.4 7 34,257 160,455 21.3 9 -8.2%
Delaware 10,211 62,576 16.3 20 10,147 62,719 16.2 19 -0.6%
District of Columbia 21,711 44,457 48.8 1 20,260 42,280 47.9 1 -6.7%
Florida 220,486 1,324,540 16.6 18 213,812 1,338,262 16.0 22 -3.0%
Georgia 141,784 879,591 16.1 22 195,233 870,584 22.4 7 37.7%
Hawaii 6,066 62,669 9.7 42 5,861 61,112 9.6 41 -3.4%
Idaho 20,423 95,440 21.4 8 18,301 92,882 19.7 10 -10.4%
Illinois 91,504 782,323 11.7 34 89,065 767,893 11.6 31 -2.7%
Indiana 68,151 426,395 16.0 23 79,276 417,168 19.0 12 16.3%
Iowa 19,990 172,387 11.6 35 19,778 172,114 11.5 32 -1.1%
Kansas 17,187 187,582 9.2 45 17,637 183,858 9.6 40 2.6%
Kentucky 32,243 392,424 8.2 47 30,876 398,106 7.8 46 -4.2%
Louisiana 37,594 397,895 9.4 44 28,795 425,670 6.8 49 -23.4%
Maine 16,157 58,887 27.4 5 15,682 57,272 27.4 5 -2.9%
Maryland 70,391 298,413 23.6 6 63,735 295,498 21.6 8 -9.5%
Massachusetts 56,376 317,174 17.8 15 53,581 321,014 16.7 17 -5.0%
Michigan 64,422 541,320 11.9 32 66,414 522,393 12.7 30 3.1%
Minnesota 44,497 272,593 16.3 19 46,948 271,639 17.3 16 5.5%
Mississippi 24,105 301,783 8.0 49 22,656 293,397 7.7 47 -6.0%
Missouri 35,208 361,277 9.7 41 31,139 352,424 8.8 42 -11.6%
Montana 9,022 46,297 19.5 11 8,599 46,828 18.4 13 -4.7%
Nebraska 9,017 115,480 7.8 50 8,155 118,849 6.9 48 -9.6%
Nevada 20,364 172,670 11.8 33 8,364 170,769 4.9 50 -58.9%
New Hampshire 5,531 36,647 15.1 26 5,586 34,854 16.0 21 1.0%
New Jersey 80,915 428,380 18.9 12 101,138 426,413 23.7 6 25.0%
New Mexico 61,999 173,316 35.8 2 49,193 173,400 28.4 4 -20.7%
New York 352,265 1,178,565 29.9 4 358,046 1,179,610 30.4 3 1.6%
North Carolina 102,769 651,308 15.8 24 100,468 640,546 15.7 24 -2.2%
North Dakota 3,166 30,521 10.4 38 3,254 31,288 10.4 38 2.8%
Ohio 62,939 630,182 10.0 40 64,864 622,186 10.4 37 3.1%
Oklahoma 16,992 306,709 5.5 51 14,458 305,955 4.7 51 -14.9%
Oregon 34,455 213,076 16.2 21 33,475 205,394 16.3 18 -2.8%
Pennsylvania 89,745 619,051 14.5 28 93,566 630,888 14.8 28 4.3%
Rhode Island 10,239 50,898 20.1 9 9,770 50,255 19.4 11 -4.6%
South Carolina 69,466 348,413 19.9 10 61,610 345,251 17.8 15 -11.3%
South Dakota 8,237 49,398 16.7 17 7,522 48,043 15.7 25 -8.7%
Tennessee 65,713 495,007 13.3 29 65,379 481,773 13.6 29 -0.5%
Texas 195,681 2,405,162 8.1 48 197,088 2,412,221 8.2 45 0.7%
Utah 28,294 160,487 17.6 16 23,573 158,817 14.8 27 -16.7%
Vermont 9,041 25,928 34.9 3 7,843 25,570 30.7 2 -13.2%
Virginia 62,703 413,812 15.2 25 66,007 410,283 16.1 20 5.3%
Washington 37,530 339,837 11.0 36 37,660 338,448 11.1 33 0.3%
West Virginia 11,879 124,980 9.5 43 10,667 130,221 8.2 44 -10.2%
Wisconsin 42,391 281,406 15.1 27 41,685 271,323 15.4 26 -1.7%
Wyoming 4,585 24,719 18.5 14 3,916 24,765 15.8 23 -14.6%
US 3,035,954 20,253,808 15.0 3,021,791 20,122,441 15.0 -0.5%
FRAC n Hunger Doesn’t Take a Vacation: Summer Nutrition Status Report n www.FRAC.org n @fractweets 14
Table 1:
Average Daily Participation (ADP) in Summer Nutrition1 in July 2016 and July 2017, Compared to Regular School Year National School Lunch Program (NSLP)2 Average Daily Participation (ADP) for School Years 2015–2016 and 2016–2017, by State
Summer Nutrition ADP
July 2016State
Summer Nutrition ADP
July 2017
NSLP ADP
2015–2016
NSLP ADP
2016–2017
Ratio of Summer Nutrition to NSLP3 2015–2016
Ratio of Summer
Nutrition to NSLP3
2016–2017
Percent Change in Summer Nutrition
ADP 2016–2017
Rank 2015–2016
Rank 2016–2017
1 Summer Nutrition includes the Summer Food Service Program and free and reduced-price National School Lunch Program, including the Seamless Summer Option.2 School Year NSLP numbers reflect free and reduced-price lunch participation during the regular school year.3 Ratio of Summer Nutrition to NSLP is the number of children in Summer Nutrition per 100 in NSLP.
FRAC n Hunger Doesn’t Take a Vacation: Summer Nutrition Status Report n www.FRAC.org n @fractweets 15
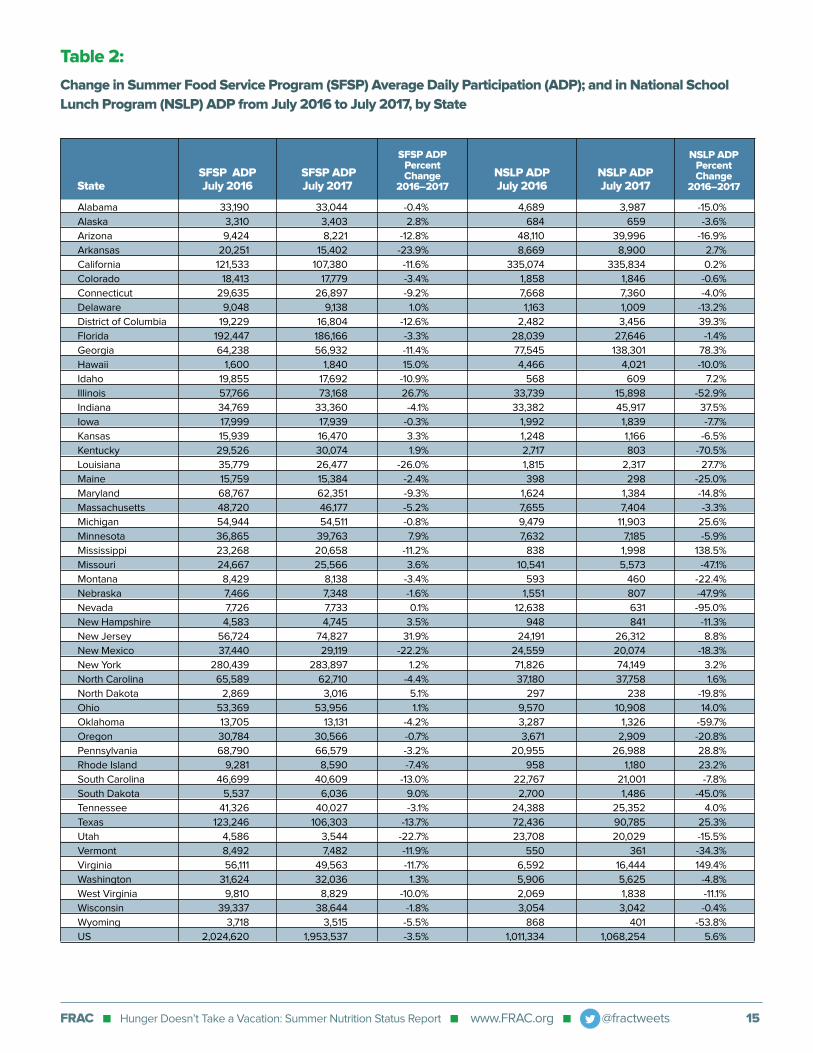
Table 2:
Change in Summer Food Service Program (SFSP) Average Daily Participation (ADP); and in National School
Lunch Program (NSLP) ADP from July 2016 to July 2017, by State
SFSP ADP July 2017
NSLP ADP July 2017
SFSP ADP July 2016State
NSLP ADP July 2016
SFSP ADP Percent Change
2016–2017
NSLP ADP Percent Change
2016–2017
Alabama 33,190 33,044 -0.4% 4,689 3,987 -15.0%
Alaska 3,310 3,403 2.8% 684 659 -3.6%
Arizona 9,424 8,221 -12.8% 48,110 39,996 -16.9%
Arkansas 20,251 15,402 -23.9% 8,669 8,900 2.7%
California 121,533 107,380 -11.6% 335,074 335,834 0.2%
Colorado 18,413 17,779 -3.4% 1,858 1,846 -0.6%
Connecticut 29,635 26,897 -9.2% 7,668 7,360 -4.0%
Delaware 9,048 9,138 1.0% 1,163 1,009 -13.2%
District of Columbia 19,229 16,804 -12.6% 2,482 3,456 39.3%
Florida 192,447 186,166 -3.3% 28,039 27,646 -1.4%
Georgia 64,238 56,932 -11.4% 77,545 138,301 78.3%
Hawaii 1,600 1,840 15.0% 4,466 4,021 -10.0%
Idaho 19,855 17,692 -10.9% 568 609 7.2%
Illinois 57,766 73,168 26.7% 33,739 15,898 -52.9%
Indiana 34,769 33,360 -4.1% 33,382 45,917 37.5%
Iowa 17,999 17,939 -0.3% 1,992 1,839 -7.7%
Kansas 15,939 16,470 3.3% 1,248 1,166 -6.5%
Kentucky 29,526 30,074 1.9% 2,717 803 -70.5%
Louisiana 35,779 26,477 -26.0% 1,815 2,317 27.7%
Maine 15,759 15,384 -2.4% 398 298 -25.0%
Maryland 68,767 62,351 -9.3% 1,624 1,384 -14.8%
Massachusetts 48,720 46,177 -5.2% 7,655 7,404 -3.3%
Michigan 54,944 54,511 -0.8% 9,479 11,903 25.6%
Minnesota 36,865 39,763 7.9% 7,632 7,185 -5.9%
Mississippi 23,268 20,658 -11.2% 838 1,998 138.5%
Missouri 24,667 25,566 3.6% 10,541 5,573 -47.1%
Montana 8,429 8,138 -3.4% 593 460 -22.4%
Nebraska 7,466 7,348 -1.6% 1,551 807 -47.9%
Nevada 7,726 7,733 0.1% 12,638 631 -95.0%
New Hampshire 4,583 4,745 3.5% 948 841 -11.3%
New Jersey 56,724 74,827 31.9% 24,191 26,312 8.8%
New Mexico 37,440 29,119 -22.2% 24,559 20,074 -18.3%
New York 280,439 283,897 1.2% 71,826 74,149 3.2%
North Carolina 65,589 62,710 -4.4% 37,180 37,758 1.6%
North Dakota 2,869 3,016 5.1% 297 238 -19.8%
Ohio 53,369 53,956 1.1% 9,570 10,908 14.0%
Oklahoma 13,705 13,131 -4.2% 3,287 1,326 -59.7%
Oregon 30,784 30,566 -0.7% 3,671 2,909 -20.8%
Pennsylvania 68,790 66,579 -3.2% 20,955 26,988 28.8%
Rhode Island 9,281 8,590 -7.4% 958 1,180 23.2%
South Carolina 46,699 40,609 -13.0% 22,767 21,001 -7.8%
South Dakota 5,537 6,036 9.0% 2,700 1,486 -45.0%
Tennessee 41,326 40,027 -3.1% 24,388 25,352 4.0%
Texas 123,246 106,303 -13.7% 72,436 90,785 25.3%
Utah 4,586 3,544 -22.7% 23,708 20,029 -15.5%
Vermont 8,492 7,482 -11.9% 550 361 -34.3%
Virginia 56,111 49,563 -11.7% 6,592 16,444 149.4%
Washington 31,624 32,036 1.3% 5,906 5,625 -4.8%
West Virginia 9,810 8,829 -10.0% 2,069 1,838 -11.1%
Wisconsin 39,337 38,644 -1.8% 3,054 3,042 -0.4%
Wyoming 3,718 3,515 -5.5% 868 401 -53.8%
US 2,024,620 1,953,537 -3.5% 1,011,334 1,068,254 5.6%
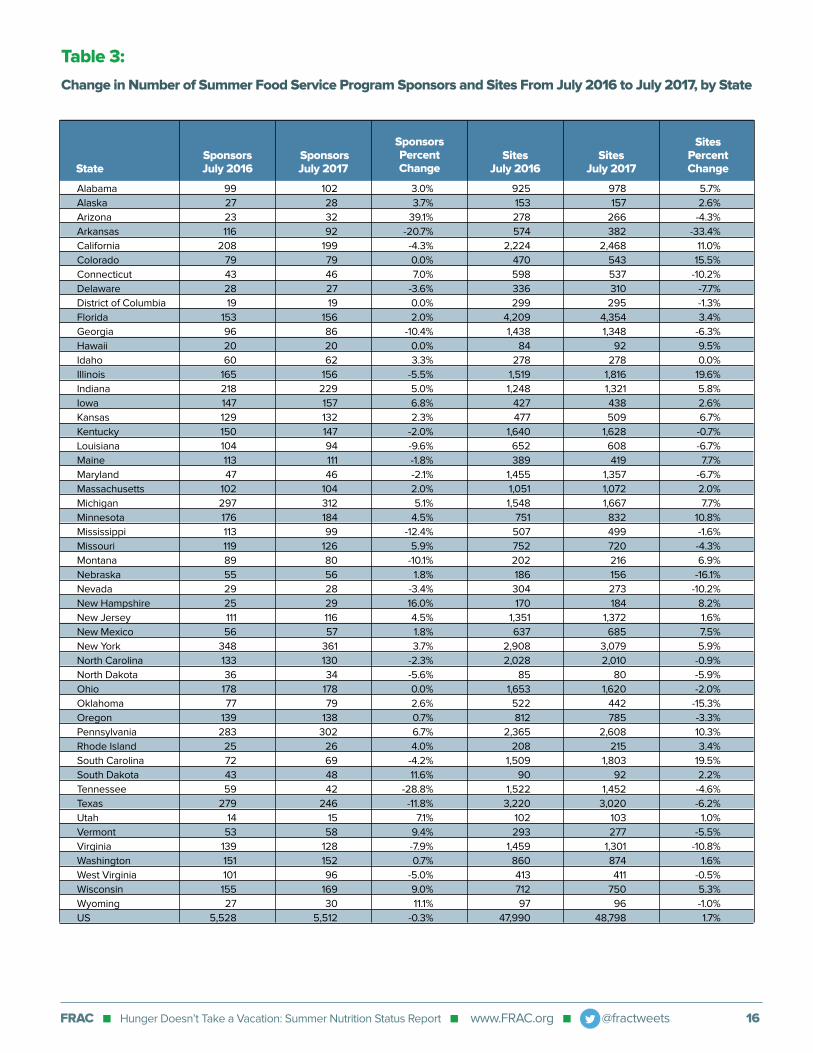
Table 3:
Change in Number of Summer Food Service Program Sponsors and Sites From July 2016 to July 2017, by State
Sponsors July 2017
Sites July 2017
Sponsors July 2016State
Sites July 2016
Sponsors Percent Change
Sites PercentChange
Alabama 99 102 3.0% 925 978 5.7%
Alaska 27 28 3.7% 153 157 2.6%
Arizona 23 32 39.1% 278 266 -4.3%
Arkansas 116 92 -20.7% 574 382 -33.4%
California 208 199 -4.3% 2,224 2,468 11.0%
Colorado 79 79 0.0% 470 543 15.5%
Connecticut 43 46 7.0% 598 537 -10.2%
Delaware 28 27 -3.6% 336 310 -7.7%
District of Columbia 19 19 0.0% 299 295 -1.3%
Florida 153 156 2.0% 4,209 4,354 3.4%
Georgia 96 86 -10.4% 1,438 1,348 -6.3%
Hawaii 20 20 0.0% 84 92 9.5%
Idaho 60 62 3.3% 278 278 0.0%
Illinois 165 156 -5.5% 1,519 1,816 19.6%
Indiana 218 229 5.0% 1,248 1,321 5.8%
Iowa 147 157 6.8% 427 438 2.6%
Kansas 129 132 2.3% 477 509 6.7%
Kentucky 150 147 -2.0% 1,640 1,628 -0.7%
Louisiana 104 94 -9.6% 652 608 -6.7%
Maine 113 111 -1.8% 389 419 7.7%
Maryland 47 46 -2.1% 1,455 1,357 -6.7%
Massachusetts 102 104 2.0% 1,051 1,072 2.0%
Michigan 297 312 5.1% 1,548 1,667 7.7%
Minnesota 176 184 4.5% 751 832 10.8%
Mississippi 113 99 -12.4% 507 499 -1.6%
Missouri 119 126 5.9% 752 720 -4.3%
Montana 89 80 -10.1% 202 216 6.9%
Nebraska 55 56 1.8% 186 156 -16.1%
Nevada 29 28 -3.4% 304 273 -10.2%
New Hampshire 25 29 16.0% 170 184 8.2%
New Jersey 111 116 4.5% 1,351 1,372 1.6%
New Mexico 56 57 1.8% 637 685 7.5%
New York 348 361 3.7% 2,908 3,079 5.9%
North Carolina 133 130 -2.3% 2,028 2,010 -0.9%
North Dakota 36 34 -5.6% 85 80 -5.9%
Ohio 178 178 0.0% 1,653 1,620 -2.0%
Oklahoma 77 79 2.6% 522 442 -15.3%
Oregon 139 138 0.7% 812 785 -3.3%
Pennsylvania 283 302 6.7% 2,365 2,608 10.3%
Rhode Island 25 26 4.0% 208 215 3.4%
South Carolina 72 69 -4.2% 1,509 1,803 19.5%
South Dakota 43 48 11.6% 90 92 2.2%
Tennessee 59 42 -28.8% 1,522 1,452 -4.6%
Texas 279 246 -11.8% 3,220 3,020 -6.2%
Utah 14 15 7.1% 102 103 1.0%
Vermont 53 58 9.4% 293 277 -5.5%
Virginia 139 128 -7.9% 1,459 1,301 -10.8%
Washington 151 152 0.7% 860 874 1.6%
West Virginia 101 96 -5.0% 413 411 -0.5%
Wisconsin 155 169 9.0% 712 750 5.3%
Wyoming 27 30 11.1% 97 96 -1.0%
US 5,528 5,512 -0.3% 47,990 48,798 1.7%
FRAC n Hunger Doesn’t Take a Vacation: Summer Nutrition Status Report n www.FRAC.org n @fractweets 16
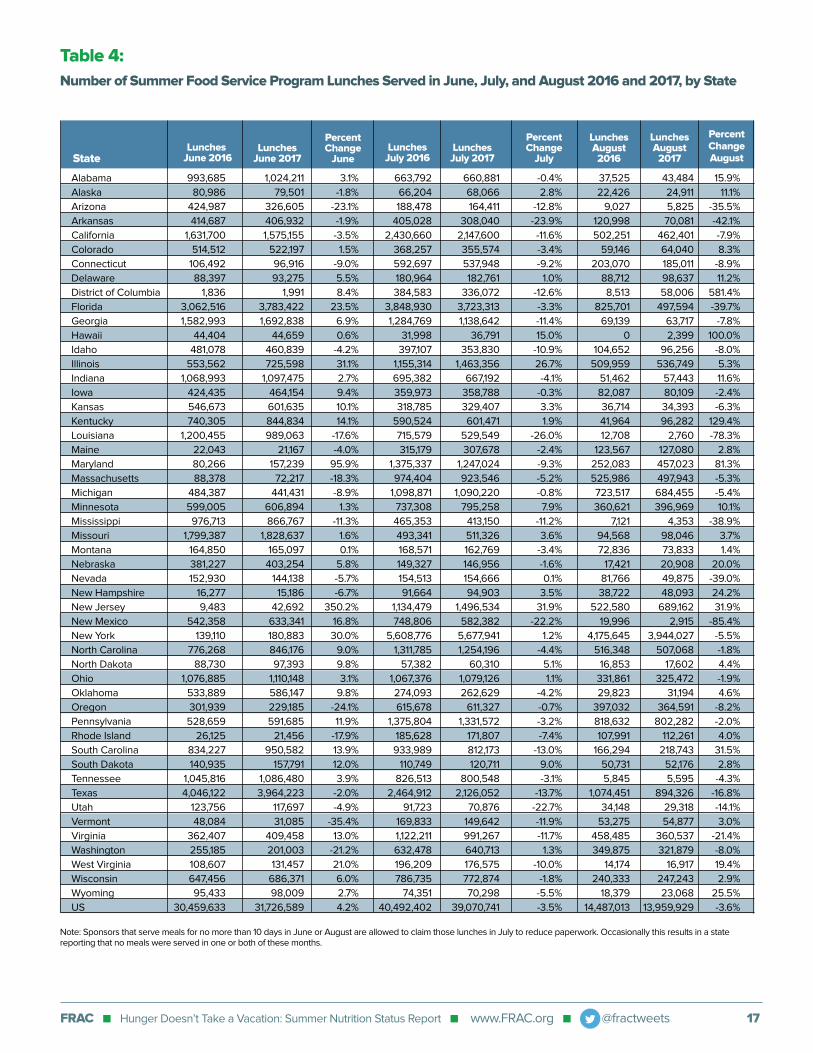
Table 4:
Number of Summer Food Service Program Lunches Served in June, July, and August 2016 and 2017, by State
Lunches June 2016State
Lunches July 2017
Lunches June 2017
Percent Change
July
Percent Change
June
Lunches August 2016
Percent Change August
Lunches July 2016
Lunches August 2017
Note: Sponsors that serve meals for no more than 10 days in June or August are allowed to claim those lunches in July to reduce paperwork. Occasionally this results in a state reporting that no meals were served in one or both of these months.
Alabama 993,685 1,024,211 3.1% 663,792 660,881 -0.4% 37,525 43,484 15.9%
Alaska 80,986 79,501 -1.8% 66,204 68,066 2.8% 22,426 24,911 11.1%
Arizona 424,987 326,605 -23.1% 188,478 164,411 -12.8% 9,027 5,825 -35.5%
Arkansas 414,687 406,932 -1.9% 405,028 308,040 -23.9% 120,998 70,081 -42.1%
California 1,631,700 1,575,155 -3.5% 2,430,660 2,147,600 -11.6% 502,251 462,401 -7.9%
Colorado 514,512 522,197 1.5% 368,257 355,574 -3.4% 59,146 64,040 8.3%
Connecticut 106,492 96,916 -9.0% 592,697 537,948 -9.2% 203,070 185,011 -8.9%
Delaware 88,397 93,275 5.5% 180,964 182,761 1.0% 88,712 98,637 11.2%
District of Columbia 1,836 1,991 8.4% 384,583 336,072 -12.6% 8,513 58,006 581.4%
Florida 3,062,516 3,783,422 23.5% 3,848,930 3,723,313 -3.3% 825,701 497,594 -39.7%
Georgia 1,582,993 1,692,838 6.9% 1,284,769 1,138,642 -11.4% 69,139 63,717 -7.8%
Hawaii 44,404 44,659 0.6% 31,998 36,791 15.0% 0 2,399 100.0%
Idaho 481,078 460,839 -4.2% 397,107 353,830 -10.9% 104,652 96,256 -8.0%
Illinois 553,562 725,598 31.1% 1,155,314 1,463,356 26.7% 509,959 536,749 5.3%
Indiana 1,068,993 1,097,475 2.7% 695,382 667,192 -4.1% 51,462 57,443 11.6%
Iowa 424,435 464,154 9.4% 359,973 358,788 -0.3% 82,087 80,109 -2.4%
Kansas 546,673 601,635 10.1% 318,785 329,407 3.3% 36,714 34,393 -6.3%
Kentucky 740,305 844,834 14.1% 590,524 601,471 1.9% 41,964 96,282 129.4%
Louisiana 1,200,455 989,063 -17.6% 715,579 529,549 -26.0% 12,708 2,760 -78.3%
Maine 22,043 21,167 -4.0% 315,179 307,678 -2.4% 123,567 127,080 2.8%
Maryland 80,266 157,239 95.9% 1,375,337 1,247,024 -9.3% 252,083 457,023 81.3%
Massachusetts 88,378 72,217 -18.3% 974,404 923,546 -5.2% 525,986 497,943 -5.3%
Michigan 484,387 441,431 -8.9% 1,098,871 1,090,220 -0.8% 723,517 684,455 -5.4%
Minnesota 599,005 606,894 1.3% 737,308 795,258 7.9% 360,621 396,969 10.1%
Mississippi 976,713 866,767 -11.3% 465,353 413,150 -11.2% 7,121 4,353 -38.9%
Missouri 1,799,387 1,828,637 1.6% 493,341 511,326 3.6% 94,568 98,046 3.7%
Montana 164,850 165,097 0.1% 168,571 162,769 -3.4% 72,836 73,833 1.4%
Nebraska 381,227 403,254 5.8% 149,327 146,956 -1.6% 17,421 20,908 20.0%
Nevada 152,930 144,138 -5.7% 154,513 154,666 0.1% 81,766 49,875 -39.0%
New Hampshire 16,277 15,186 -6.7% 91,664 94,903 3.5% 38,722 48,093 24.2%
New Jersey 9,483 42,692 350.2% 1,134,479 1,496,534 31.9% 522,580 689,162 31.9%
New Mexico 542,358 633,341 16.8% 748,806 582,382 -22.2% 19,996 2,915 -85.4%
New York 139,110 180,883 30.0% 5,608,776 5,677,941 1.2% 4,175,645 3,944,027 -5.5%
North Carolina 776,268 846,176 9.0% 1,311,785 1,254,196 -4.4% 516,348 507,068 -1.8%
North Dakota 88,730 97,393 9.8% 57,382 60,310 5.1% 16,853 17,602 4.4%
Ohio 1,076,885 1,110,148 3.1% 1,067,376 1,079,126 1.1% 331,861 325,472 -1.9%
Oklahoma 533,889 586,147 9.8% 274,093 262,629 -4.2% 29,823 31,194 4.6%
Oregon 301,939 229,185 -24.1% 615,678 611,327 -0.7% 397,032 364,591 -8.2%
Pennsylvania 528,659 591,685 11.9% 1,375,804 1,331,572 -3.2% 818,632 802,282 -2.0%
Rhode Island 26,125 21,456 -17.9% 185,628 171,807 -7.4% 107,991 112,261 4.0%
South Carolina 834,227 950,582 13.9% 933,989 812,173 -13.0% 166,294 218,743 31.5%
South Dakota 140,935 157,791 12.0% 110,749 120,711 9.0% 50,731 52,176 2.8%
Tennessee 1,045,816 1,086,480 3.9% 826,513 800,548 -3.1% 5,845 5,595 -4.3%
Texas 4,046,122 3,964,223 -2.0% 2,464,912 2,126,052 -13.7% 1,074,451 894,326 -16.8%
Utah 123,756 117,697 -4.9% 91,723 70,876 -22.7% 34,148 29,318 -14.1%
Vermont 48,084 31,085 -35.4% 169,833 149,642 -11.9% 53,275 54,877 3.0%
Virginia 362,407 409,458 13.0% 1,122,211 991,267 -11.7% 458,485 360,537 -21.4%
Washington 255,185 201,003 -21.2% 632,478 640,713 1.3% 349,875 321,879 -8.0%
West Virginia 108,607 131,457 21.0% 196,209 176,575 -10.0% 14,174 16,917 19.4%
Wisconsin 647,456 686,371 6.0% 786,735 772,874 -1.8% 240,333 247,243 2.9%
Wyoming 95,433 98,009 2.7% 74,351 70,298 -5.5% 18,379 23,068 25.5%
US 30,459,633 31,726,589 4.2% 40,492,402 39,070,741 -3.5% 14,487,013 13,959,929 -3.6%
FRAC n Hunger Doesn’t Take a Vacation: Summer Nutrition Status Report n www.FRAC.org n @fractweets 17

Ratio of Summer Nutrition to NSLP3
Additional Federal Reimbursement Dollars
if Summer Nutrition to NSLP Ratio Reached
40:1004
Summer Nutrition ADP, July 2017State
Additional Summer Nutrition ADP if Summer Nutrition to NSLP Ratio
Reached 40:100
Total Summer Nutrition ADP if Summer Nutrition to NSLP Ratio Reached
40:100
Alabama 37,031 10.2 144,894 107,863 $8,132,842
Alaska 4,062 10.5 15,548 11,486 $866,039
Arizona 48,216 10.4 184,944 136,727 $10,309,251
Arkansas 24,302 10.7 90,812 66,510 $5,014,851
California 443,214 18.3 966,685 523,471 $39,469,688
Colorado 19,625 8.7 89,819 70,194 $5,292,615
Connecticut 34,257 21.3 64,182 29,925 $2,256,345
Delaware 10,147 16.2 25,088 14,941 $1,126,515
District of Columbia 20,260 47.9 — — —
Florida 213,812 16.0 535,305 321,493 $24,240,596
Georgia 195,233 22.4 348,234 153,000 $11,536,226
Hawaii 5,861 9.6 24,445 18,584 $1,401,266
Idaho 18,301 19.7 37,153 18,852 $1,421,455
Illinois 89,065 11.6 307,157 218,092 $16,444,111
Indiana 79,276 19.0 166,867 87,591 $6,604,364
Iowa 19,778 11.5 68,846 49,068 $3,699,704
Kansas 17,637 9.6 73,543 55,906 $4,215,345
Kentucky 30,876 7.8 159,242 128,366 $9,678,813
Louisiana 28,795 6.8 170,268 141,474 $10,667,104
Maine 15,682 27.4 22,909 7,227 $544,885
Maryland 63,735 21.6 118,199 54,464 $4,106,595
Massachusetts 53,581 16.7 128,406 74,825 $5,641,770
Michigan 66,414 12.7 208,957 142,543 $10,747,754
Minnesota 46,948 17.3 108,656 61,708 $4,652,768
Mississippi 22,656 7.7 117,359 94,703 $7,140,590
Missouri 31,139 8.8 140,969 109,830 $8,281,202
Montana 8,599 18.4 18,731 10,132 $763,987
Nebraska 8,155 6.9 47,539 39,384 $2,969,580
Nevada 8,364 4.9 68,307 59,943 $4,519,702
New Hampshire 5,586 16.0 13,942 8,356 $630,018
New Jersey 101,138 23.7 170,565 69,427 $5,234,774
New Mexico 49,193 28.4 69,360 20,167 $1,520,596
New York 358,046 30.4 471,844 113,798 $8,580,372
North Carolina 100,468 15.7 256,218 155,750 $11,743,566
North Dakota 3,254 10.4 12,515 9,261 $698,294
Ohio 64,864 10.4 248,874 184,010 $13,874,367
Oklahoma 14,458 4.7 122,382 107,924 $8,137,506
Oregon 33,475 16.3 82,158 48,683 $3,670,671
Pennsylvania 93,566 14.8 252,355 158,789 $11,972,676
Rhode Island 9,770 19.4 20,102 10,332 $779,032
South Carolina 61,610 17.8 138,100 76,490 $5,767,363
South Dakota 7,522 15.7 19,217 11,695 $881,832
Tennessee 65,379 13.6 192,709 127,330 $9,600,701
Texas 197,088 8.2 964,888 767,801 $57,892,156
Utah 23,573 14.8 63,527 39,954 $3,012,515
Vermont 7,843 30.7 10,228 2,384 $179,788
Virginia 66,007 16.1 164,113 98,106 $7,397,203
Washington 37,660 11.1 135,379 97,719 $7,367,996
West Virginia 10,667 8.2 52,088 41,421 $3,123,166
Wisconsin 41,685 15.4 108,529 66,844 $5,040,020
Wyoming 3,916 15.8 9,906 5,990 $451,670
US 3,021,791 15.0 8,052,324 5,030,534 $379,302,239
1 Summer Nutrition includes the Summer Food Service Program and free and reduced-price National School Lunch Program during the summer, including the Seamless Summer Option.2 School Year NSLP numbers reflect free and reduced-price lunch participation in regular school year 2016–2017.3 Ratio of Summer Nutrition to NSLP is the number of children in Summer Nutrition per 100 in NSLP.4 Additional federal reimbursement dollars were calculated assuming that the state’s sponsors were reimbursed for each child each weekday only for lunch (not also breakfast or a snack), at the lowest rate for an SFSP lunch ($3.77 per lunch), and were served 20 days in July 2017.
Table 5:Average Daily Participation (ADP) in Summer Nutrition1 and Additional ADP and Additional Federal Reimbursement if States Reached FRAC’s Goal of 40 Summer Nutrition Participants per 100 Regular School Year National School Lunch Program (NSLP)2 Participants
FRAC n Hunger Doesn’t Take a Vacation: Summer Nutrition Status Report n www.FRAC.org n @fractweets 18

Food Research & Action Center
1200 18th Street, NW
Suite 400
Washington, DC 20036
202.986.2200
ww.frac.org
@fractweets
@fracgram
facebook.com/ foodresearchandactioncenter
linkedin.com/company/ food-research-and-action-centerCopyright © 2018 Food Research & Action Center
Related Documents