HUNGARY This Data Spotlight note on Early Childhood Education and Care (ECEC) provides a summary of ECEC policy inputs and outputs in Hungary. It uses data available within the OECD Secretariat — Education at a Glance, the Programme for International Student Assessment (PISA) and the OECD Family Database — to make comparisons between Hungary’s ECEC system and the systems in other OECD countries (see Box 1 for definition and comparability issues). Key characteristics of ECEC in Hungary: Resources that are put in the ECEC system - The share of gross domestic product (GDP) devoted to pre-primary education (called kindergarten in Hungary) (ISCED 02) is 0.7%, slightly above the OECD average of 0.6%. Annual expenditure per student in pre-primary education (ISCED 02) is one of the lowest among OECD countries (USD 5 074 in Hungary compared with USD 8 070 across OECD countries). - The share of private funding in pre-primary education (ISCED 02) represents only 9% of the total funding of pre-primary education (ISCED 02) (the OECD average was 17%). - The number of children per teacher in pre-primary education (ISCED 02) is 13, one child less than the ratio observed across the OECD (14 children per teacher in pre-primary education). Access and participation - Since 2015, pre-primary education is compulsory from the age of 3. - Participation of 0-2 year-olds in formal care is almost half the OECD average (16% and 33%, respectively), but it increased by 8 percentage points between 2005 and 2013. The low levels of participation rates to ECEC services of under-3s in Hungary could be partly explained by the period of post-natal leave available for parents and to the shortage of ECEC places. - Participation of 3-5 year-olds in pre-primary education (ISCED 02) is slightly above the OECD average. For 3-year-olds, participation rates were 79% in Hungary compared with 71% of children in ECEC (ISCED 01 + ISCED 02) across the OECD. The 3-year-old rates have increased by 6 percentage points of the levels observed in 2005 (at 73%). - Further development of infrastructure of ECEC settings is in progress to tackle shortage of ECEC places and to ensure that quality kindergarten education is available to all families. Teacher’s academic qualification and working conditions - Pre-primary teachers (ISCED 02) have a Bachelor degree, as in most other OECD countries. - Pre-primary teachers in Hungary face comparatively low salaries and high workloads: the annual number of hours of teaching is higher than the OECD average (1 152 hours and 1 005 hours, respectively). A pre-primary education teacher in Hungary can expect to earn a starting salary of around USD 13 228, less than half the starting salary of their colleagues across the OECD (around USD 29 494). - The salary for teachers in pre-primary education (ISCED 02) in Hungary is 66% that of workers with tertiary education, which is slightly below the OECD average of 74%. Students' performance at the age of 15 in PISA 2012 - Hungary performed below the OECD average in PISA 2012. It has improved performance in reading, unchanged performance in science and decreased performance in mathematics across PISA cycles. - The impact of socio-economic background on mathematics performance of 15-year-olds was among the largest in OECD countries.

Welcome message from author
This document is posted to help you gain knowledge. Please leave a comment to let me know what you think about it! Share it to your friends and learn new things together.
Transcript
HUNGARY
This Data Spotlight note on Early Childhood Education and Care (ECEC) provides a summary of
ECEC policy inputs and outputs in Hungary. It uses data available within the OECD Secretariat —
Education at a Glance, the Programme for International Student Assessment (PISA) and the OECD
Family Database — to make comparisons between Hungary’s ECEC system and the systems in other
OECD countries (see Box 1 for definition and comparability issues).
Key characteristics of ECEC in Hungary:
Resources that are put in the ECEC system - The share of gross domestic product (GDP) devoted to pre-primary education (called kindergarten in Hungary)
(ISCED 02) is 0.7%, slightly above the OECD average of 0.6%. Annual expenditure per student in pre-primary education (ISCED 02) is one of the lowest among OECD countries (USD 5 074 in Hungary compared with USD 8 070 across OECD countries).
- The share of private funding in pre-primary education (ISCED 02) represents only 9% of the total funding of pre-primary education (ISCED 02) (the OECD average was 17%).
- The number of children per teacher in pre-primary education (ISCED 02) is 13, one child less than the ratio observed across the OECD (14 children per teacher in pre-primary education).
Access and participation - Since 2015, pre-primary education is compulsory from the age of 3. - Participation of 0-2 year-olds in formal care is almost half the OECD average (16% and 33%, respectively), but it
increased by 8 percentage points between 2005 and 2013. The low levels of participation rates to ECEC services of under-3s in Hungary could be partly explained by the period of post-natal leave available for parents and to the shortage of ECEC places.
- Participation of 3-5 year-olds in pre-primary education (ISCED 02) is slightly above the OECD average. For 3-year-olds, participation rates were 79% in Hungary compared with 71% of children in ECEC (ISCED 01 + ISCED 02) across the OECD. The 3-year-old rates have increased by 6 percentage points of the levels observed in 2005 (at 73%).
- Further development of infrastructure of ECEC settings is in progress to tackle shortage of ECEC places and to ensure that quality kindergarten education is available to all families.
Teacher’s academic qualification and working conditions - Pre-primary teachers (ISCED 02) have a Bachelor degree, as in most other OECD countries. - Pre-primary teachers in Hungary face comparatively low salaries and high workloads: the annual number of hours of
teaching is higher than the OECD average (1 152 hours and 1 005 hours, respectively). A pre-primary education teacher in Hungary can expect to earn a starting salary of around USD 13 228, less than half the starting salary of their colleagues across the OECD (around USD 29 494).
- The salary for teachers in pre-primary education (ISCED 02) in Hungary is 66% that of workers with tertiary education, which is slightly below the OECD average of 74%.
Students' performance at the age of 15 in PISA 2012 - Hungary performed below the OECD average in PISA 2012. It has improved performance in reading, unchanged
performance in science and decreased performance in mathematics across PISA cycles. - The impact of socio-economic background on mathematics performance of 15-year-olds was among the largest in
OECD countries.

HUNGARY
2 © OECD 2016
Introduction
Participation in ECEC can have a positive effect on children’s early learning and development, as
well as on subsequent outcomes, such as academic success, labour market performance and
socio-economic mobility. The benefits of ECEC on child outcomes, however, depend on high quality.
Settings and programmes that have a high level of quality are positively associated with children’s
cognitive, social and behavioural development, with disadvantaged children benefitting significantly
from high-quality settings (OECD, 2011; Gambaro et al., 2014). Policy outcomes are associated with
both policy inputs and policy outputs.
For simplicity purposes, this note uses the term early childhood education and care (ECEC) to refer
to arrangements providing care and education for children under compulsory school age. This term
differs from those used by other sources in this note, including the ISCED 2011 classification (see Box 1
for the ISCED 2011 methodological distinction between childcare and pre-primary education). Because of
these differences in definitions, caution is needed when comparing data presented here.
The note is structured in three sections:
Policy inputs: This section presents indicators of the resources that are put into a system, such
as the level and type of sources that finance ECEC, and the regulations of staff-child ratios to
achieve outputs or a result.
Policy outputs: This section covers indicators that are the result of policy inputs put in place,
such as enrolment rates by age. Trend data is presented to examine the changes in early
childhood education in recent years.
Policy outcomes: This section covers indicators on the outcomes of children that are associated
with both policy inputs and policy outputs. For example, indicators on student performance at
age 15 by participation in pre-primary education (drawn from PISA 2012 data).
Section 1. Policy inputs
Access to early childhood education and care services
The organisation of ECEC services varies greatly from country to country in terms of structure, but
also regarding the age of children attending different types of settings or the intensity of child
participation in different settings (see Box 1). In Hungary, two kinds of full-time centre-based ECEC
services are available: nursery (bölcsőde) for children up to age 3 and kindergarten (óvoda) for children
between age 3 and compulsory school. Both offer all-day services for 50 weeks per year.
A decree on the Basic National Programme of Kindergarten Education (363/2012) came into force
in 2013, outlining the principles and tasks of kindergarten education. In addition, participation in early
childhood education and care became mandatory from age 3, with minimum attendance of four hours per
day (since 2015). Children under three years are also entitled to an ECEC service place if the parent
studies full time or if the child becomes 6 months old (Korintus and Gábos, 2016).
HUNGARY
© OECD 2016 3
Box 1. Distinction between early childhood educational development and pre-primary education: The revised ISCED 2011 classification
There are many different ECEC systems and structures within OECD countries. Consequently, there is also a range of different approaches to identifying the boundary between early childhood education and childcare. The International Standard Classification of Education (ISCED) defines internationally comparable levels of education. In ISCED 2011, level 0 covers early childhood education for all ages, including very young children. As the educational properties of ISCED 0 programmes can be difficult to assess directly, several criteria are used to come up with a technical definition. For a programme to be reported as ISCED level 0 it must have: adequate intentional educational properties; be delivered by qualified staff members; take place in an institutionalised setting; meet a minimum intensity/duration; and be targeted at children from age 0 until entry into ISCED level 1 (OECD, 2016). Programmes classified at ISCED level 0 may be referred to in many ways nationally, for example: early childhood education and development, play school, reception, pre-primary, pre-school, Kindergarten, Kita, Krippe or educación inicial. For programmes provided in crèches, daycare centres, private homes, nurseries, Tagespflege or guarderías, it is important to ensure that they meet the ISCED level 0 classification criteria specified in ISCED 2011. In ISCED 2011, programmes are sub-classified into two categories depending on age and the level of complexity of the educational content: early childhood educational development (ISCED 01) and pre-primary education (ISCED 02). ISCED 01 programmes are generally designed for children younger than 3 (OECD, 2016). This is a new category not covered by ISCED 1997. ISCED 02 is designed for children from age 3 years to the start of primary education. It corresponds exactly to level 0 in ISCED 1997. The comparability of programmes at ISCED level 0 depends on each country’s ability to report data according to the standard international definition. Early childhood programmes that are offered in some countries do not necessarily meet the criteria or definition of ISCED 01. This is the case of Belgium (except in the Flemish Community), the Czech Republic, France, Ireland, Italy, Japan, Luxembourg, the Netherlands, Poland, Portugal, the Slovak Republic, Switzerland and the United States. On the other hand, the coverage of ISCED 02 (pre-primary education) is larger, with 32 countries reporting data on enrolment rates at ages 3 and 4. Because of these differences, caution is needed when comparing available data on ISCED 01 drawn from Education at a Glance. The definition of ECEC in the OECD’s Starting Strong series differs from the ISCED 2011 definition. The OECD definition states that “the term early childhood education and care (ECEC) includes all arrangements providing care and education for children under compulsory school age, regardless of setting, funding, opening hours or programme content” (OECD, 2001). This means that settings considered an integral part of countries’ ECEC systems, but not covered by the ISCED classification, still fall under the terminology of ECEC. Data reported in Education at a Glance 2016, and presented here as ISCED level 0, use the ISCED 2011 classification (Figures 1, 2, 3, 4 and 6). PISA 2012 uses the ISCED 1997 classification (Figure 7). The OECD Family Database definition of “formal” childcare among children aged 0-2 years includes centre-based services, organised day care, pre-school and professional child-minders (Figure 5). Because of these differences in definitions, caution is needed when comparing available data. Sources: OECD (2016), Education at a Glance 2016: OECD Indicators, OECD Publishing, Paris, http://dx.doi.org/10.1787/eag-2016-en; OECD (2001), Starting Strong I: Early Childhood Education and Care, OECD Publishing, Paris, http://dx.doi.org/10.1787/9789264192829-en.
Funding of early childhood education and care services
The level of governance responsible for early childhood education and care services differs
according to the area concerned, such as funding of settings, and also across countries. Responsibility for
ECEC policy in Hungary is shared between two under-Ministries within the Ministry of Human
Capacities: 1) the State Secretariat for Family and Youth Affairs is responsible for centre-based care
(bölcsőde) for children under the age of three; and 2) the State Secretariat for Education is responsible
for the kindergarten education system (óvoda) for children 3-6 years old.

HUNGARY
4 © OECD 2016
Above-average expenditure on early childhood education as a percentage of GDP
The financial investment in ECEC settings and equipment is a key requirement for the development
of good and high quality learning environments, and indicates that political priority is being given to the
care and education of young children. Sustainable public funding is essential to recruit competent and
qualified staff, ensure the quality of educational programmes, and promote early development.
In Hungary, public and private expenditure on pre-primary education (ISCED 02) represented 0.7%
of GDP in 2013, slightly above the OECD average of 0.6% of GDP.1 Countries with the highest
expenditure on pre-primary education include Chile, Iceland, Norway, and Sweden spent 1.0% or more
of their GDP on pre-primary education (OECD, 2016, Table C2.3).
Expenditure per student in early childhood education is below the average of OECD countries
In 2013, expenditure per student in pre-primary education (ISCED 02) in Hungary was USD 5 074
per pupil, which was much lower than the OECD average of USD 8 070 (see Figure 1), placing Hungary
among the OECD lowest spenders per capita in pre-primary education. Differences between the share of
spending on early childhood education and care (ISCED 0) in GDP and expenditure per student at this
level explain, at least partly, the differences in enrolment rates in early childhood development
programmes and pre-primary education between countries and in children to teacher ratios between
countries. For instance, countries with higher expenditure per student tend to have higher enrolment rates
or/and lower children to teaching staff ratio compared to the OECD average. The level of expenditure per
student varies between countries depending on fees and cost of education, the level of wealth of the
country, and the coverage by private pre-primary structures.2
Figure 1. Annual expenditure per student by educational institutions for all services (2013)
Notes: Countries are ranked in descending order of annual expenditure per student by educational institutions for pre-primary education. 1. Includes some expenditure on child care.
Source: OECD (2016), Education at a Glance 2016: OECD Indicators, Table C2.3, http://dx.doi.org/10.1787/888933398316.
HUNGARY
© OECD 2016 5
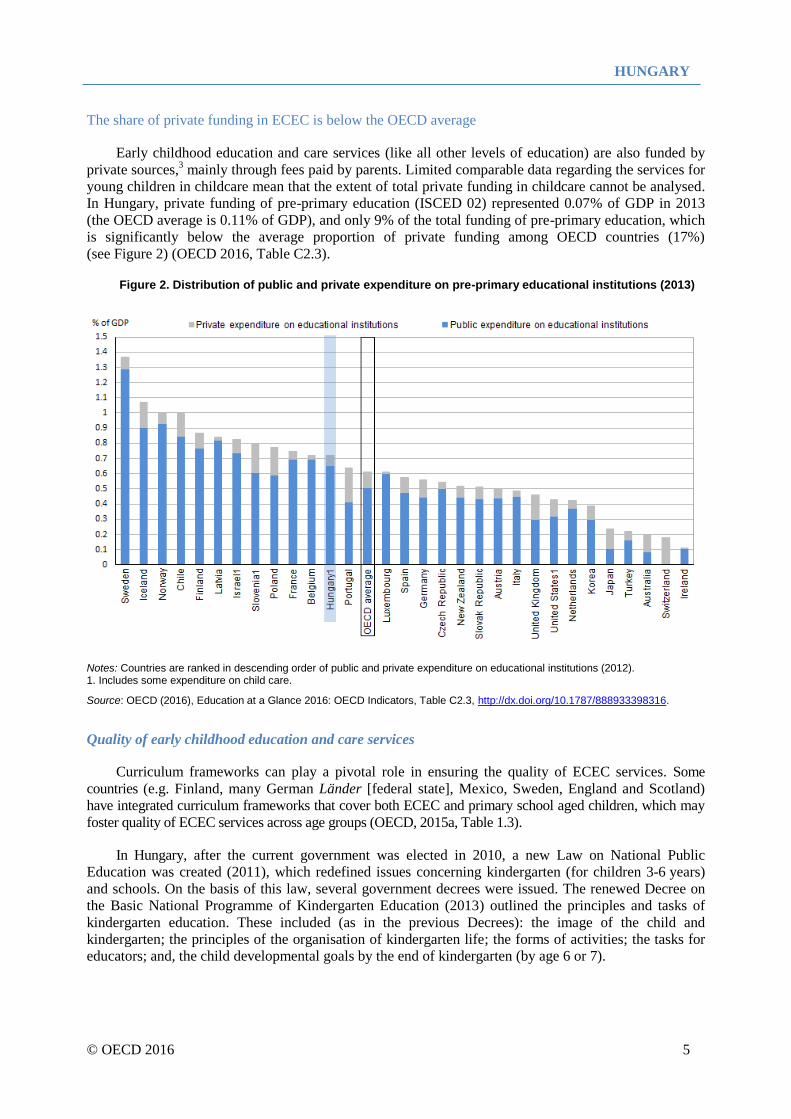
The share of private funding in ECEC is below the OECD average
Early childhood education and care services (like all other levels of education) are also funded by
private sources,3 mainly through fees paid by parents. Limited comparable data regarding the services for
young children in childcare mean that the extent of total private funding in childcare cannot be analysed.
In Hungary, private funding of pre-primary education (ISCED 02) represented 0.07% of GDP in 2013
(the OECD average is 0.11% of GDP), and only 9% of the total funding of pre-primary education, which
is significantly below the average proportion of private funding among OECD countries (17%)
(see Figure 2) (OECD 2016, Table C2.3).
Figure 2. Distribution of public and private expenditure on pre-primary educational institutions (2013)
Notes: Countries are ranked in descending order of public and private expenditure on educational institutions (2012). 1. Includes some expenditure on child care.
Source: OECD (2016), Education at a Glance 2016: OECD Indicators, Table C2.3, http://dx.doi.org/10.1787/888933398316.
Quality of early childhood education and care services
Curriculum frameworks can play a pivotal role in ensuring the quality of ECEC services. Some
countries (e.g. Finland, many German Länder [federal state], Mexico, Sweden, England and Scotland)
have integrated curriculum frameworks that cover both ECEC and primary school aged children, which may
foster quality of ECEC services across age groups (OECD, 2015a, Table 1.3).
In Hungary, after the current government was elected in 2010, a new Law on National Public
Education was created (2011), which redefined issues concerning kindergarten (for children 3-6 years)
and schools. On the basis of this law, several government decrees were issued. The renewed Decree on
the Basic National Programme of Kindergarten Education (2013) outlined the principles and tasks of
kindergarten education. These included (as in the previous Decrees): the image of the child and
kindergarten; the principles of the organisation of kindergarten life; the forms of activities; the tasks for
educators; and, the child developmental goals by the end of kindergarten (by age 6 or 7).

HUNGARY
6 © OECD 2016
Because attendance in kindergarten education has been mandatory since September 2015, further
development of infrastructure of ECEC settings is in progress to tackle shortage of ECEC places and to
ensure that quality kindergarten education is available to all families.
The number of pupils per teacher in pre-primary education is comparatively high
The pupil-to-staff ratio is an important indicator of the resources invested in early education and
childcare, and also of the quality of these services. A low pupil-to-staff ratio impacts staff working
conditions, alongside other factors such as reasonable hours or workload and salary levels. These affect
job satisfaction and staff retention, and through this, contribute to the quality of early childhood
education and care services.
In pre-primary education (ISCED 02), there were about 13 children per teacher in 2014 in Hungary,
which was almost the same number of children per teaching staff as the OECD average of 14 children
per teacher (see Figure 3). However, at the pre-primary level (ISCED 02), some auxiliary staff (support
staff for teachers and educators) also works directly with children. Across the OECD countries that have
available data, eight countries, reported better ratios for pupils-to-contact staff (teaching and auxiliary
staff) than for teaching staff only: an average of 12 pupils per contact staff compared to 14 per teaching
staff. In Hungary, the number of pupils per contact staff was 13 in 2014, the same than the children per
teaching staff (see Figure 3). However, Hungary employed additional staff in kindergartens in the
school-year 2013-2014 — including nurses, pedagogical assistants and special needs assistants — who
are not reported here, but that provide important support to teaching staff.4
Figure 3. Ratio of children-to-teaching staff in pre-primary education (2014)
Notes: Countries are ranked in descending order of the pupil-to-teaching-staff in pre-primary education. Data on “pupils for contact staff” is missing for Finland, Latvia, New Zealand, Spain, Switzerland, Poland, Portugal and Turkey. 1. Year of reference is 2013 instead of 2014.
Source: OECD (2016), Education at a Glance 2016: OECD Indicators, Table C2.2, http://dx.doi.org/10.1787/888933398305.
HUNGARY
© OECD 2016 7
Pre-primary teachers training and annual number of teaching hours
In OECD countries, the duration of initial teacher training varies more in pre-primary education
(ISCED 02) than at any other level of education: from two years for basic certification in Korea and
Japan to five years in Austria, France, Iceland, Italy and Chile. In Hungary, pre-primary teachers
(ISCED 02) have a tertiary level training, as in most other OECD countries.
The annual number of teaching hours in Hungary is above the average among OECD countries:
pre-primary teachers (ISCED 02) annually spent 1 152 hours on teaching in 2014, which was 147 hours
more than the OECD average of 1 005 hours (OECD, 2016, Table D4.1). However, with 36 weeks of
teaching per year, pre-primary teachers teach, on average, four weeks less than the average across OECD
countries (40 weeks). Pre-primary teachers in Hungary can spend up to one third of their total annual
statutory working time on tasks other than teaching at school, for example, on the preparation of lessons,
teamwork and dialogue with colleagues or participation in school management (OECD, 2014,
Table D4.4).
Salaries of pre-primary teachers are below the OECD average, both in absolute and relative terms
In 2014, the statutory salary of pre-primary teachers (ISCED 02) in Hungary was USD 13 228 for
beginning teachers, less than half the OECD average of USD 29 494. Hungarian teachers with 10 years
of experience earned USD 17 858, compared to USD 36 491 that their counterparts earned in average
across the OECD; and, those teachers with 15 years of experience earned USD 19 181 compared to an
OECD average of USD 39 245. The statutory salary at the top of the scale is about 50% lower than the
average top salary in OECD countries: USD 25 133 in Hungary compared to USD 47 826 on average
across the OECD (see Figure 4). The average salary of pre-primary teachers in Hungary, including
bonuses and allowances was around 40% below the OECD average: USD 21 917 compared to an OECD
average of USD 37 274 in 2014 (OECD, 2016, Table D3.4).
To compare the salary levels and the labour market situation between countries, teacher pay is
compared to earnings for similarly-educated workers based on teachers’ attainment level
(25-64 year-olds who work full time, full year). The salary for teachers in pre-primary education
(ISCED 02) in Hungary is 66% that of workers with tertiary education, which is slightly below the
OECD average of 74% (OECD, 2016, Table D3.2).

HUNGARY
8 © OECD 2016
Figure 4. Pre-primary teacher salaries at different points in their careers (2014)
Notes: The definition of teachers' typical qualification is based on a broad concept, including the typical ISCED level of attainment and other criteria. PPP refers to the parity purchasing power. Countries are ranked in descending order of starting salaries for pre-primary teachers with minimum training. 1. Statutory salaries do not include the part of social security contributions and pension-scheme contributions paid by the employees. 2. Statutory salaries include the part of social security contributions and pension-scheme contributions paid by the employers. 3. Includes data on the majority, i.e. kindergarten teachers only for pre-primary education. 4. Includes average bonuses for overtime hours for lower and upper secondary teachers. 5. Actual base salaries for 2013.
Source: OECD (2016), Education at a Glance 2016: OECD Indicators, Table D 3.1a, http://dx.doi.org/10.1787/888933399015.
Section 2. Policy outputs
Participation of 0-2 year olds in formal childcare
In Hungary, participation rates of children under the age of 3 in formal childcare arrangements5
(ISCED 0 and other registered ECEC services) are lower than in most OECD countries. On average
across OECD countries, 34% of 0-2 year-olds attend some form of formal ECEC, while in Hungary this
figure is only 16%. Participation, however, has increased in Hungary in recent years (by 8 percentage
points between 2005 and 2013). Denmark, Iceland, Luxembourg, Norway and the Netherlands stand out
with participation rates above 50% in 2013 (see Figure 5).
The low levels of participation rates to ECEC services of under-3s in Hungary could be partly
explained by the period of post-natal leave available for parents. This post-natal leave can be of three
years at its maximum; the last year is paid at a low flat rate, but until a child is two years old, insured
parents taking leave are paid at a high earnings-related level. Most parents (mainly mothers) make use of
their leave entitlements. However, the so-called “GYED Extra” measure, introduced in 2014, allows
parents to return to the labour market after their child is six months old, and to be eligible to receive
maternity benefits and to have a place for their child in daily child-care institutions. This measure should
HUNGARY
© OECD 2016 9
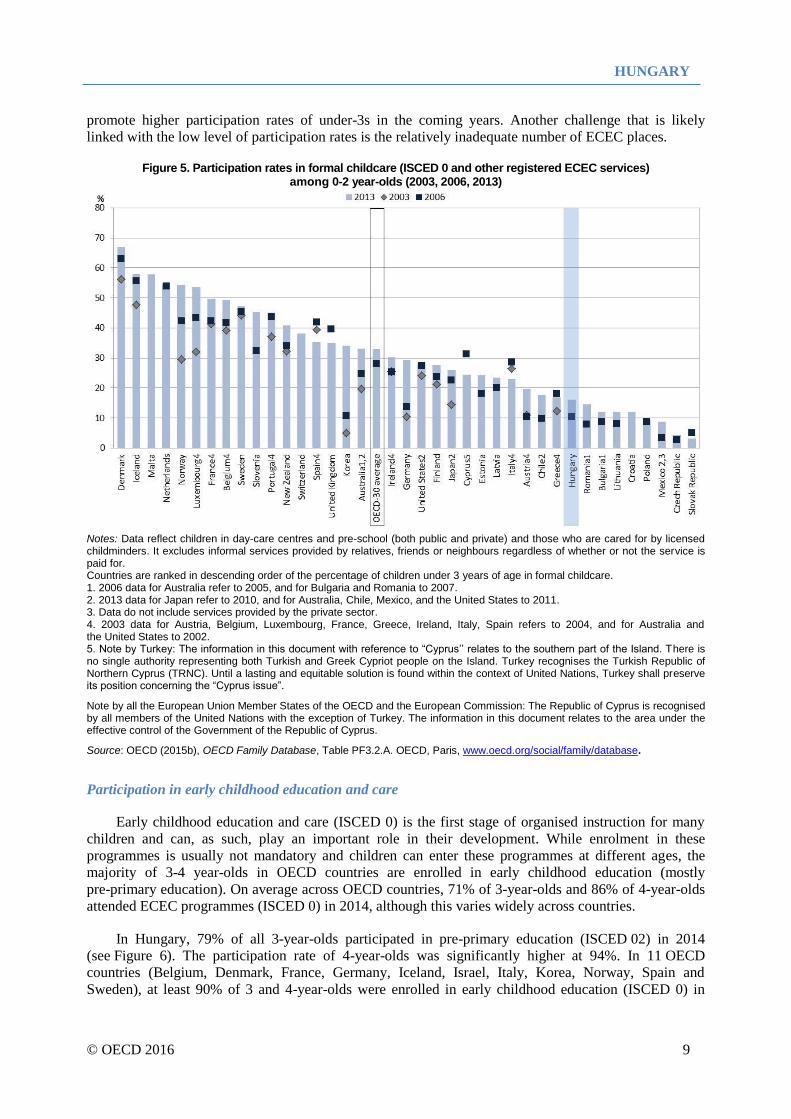
promote higher participation rates of under-3s in the coming years. Another challenge that is likely
linked with the low level of participation rates is the relatively inadequate number of ECEC places.
Figure 5. Participation rates in formal childcare (ISCED 0 and other registered ECEC services) among 0-2 year-olds (2003, 2006, 2013)
Notes: Data reflect children in day-care centres and pre-school (both public and private) and those who are cared for by licensed childminders. It excludes informal services provided by relatives, friends or neighbours regardless of whether or not the service is paid for. Countries are ranked in descending order of the percentage of children under 3 years of age in formal childcare. 1. 2006 data for Australia refer to 2005, and for Bulgaria and Romania to 2007. 2. 2013 data for Japan refer to 2010, and for Australia, Chile, Mexico, and the United States to 2011. 3. Data do not include services provided by the private sector. 4. 2003 data for Austria, Belgium, Luxembourg, France, Greece, Ireland, Italy, Spain refers to 2004, and for Australia and the United States to 2002. 5. Note by Turkey: The information in this document with reference to “Cyprus’’ relates to the southern part of the Island. There is no single authority representing both Turkish and Greek Cypriot people on the Island. Turkey recognises the Turkish Republic of Northern Cyprus (TRNC). Until a lasting and equitable solution is found within the context of United Nations, Turkey shall preserve its position concerning the “Cyprus issue”.
Note by all the European Union Member States of the OECD and the European Commission: The Republic of Cyprus is recognised by all members of the United Nations with the exception of Turkey. The information in this document relates to the area under the effective control of the Government of the Republic of Cyprus.
Source: OECD (2015b), OECD Family Database, Table PF3.2.A. OECD, Paris, www.oecd.org/social/family/database.
Participation in early childhood education and care
Early childhood education and care (ISCED 0) is the first stage of organised instruction for many
children and can, as such, play an important role in their development. While enrolment in these
programmes is usually not mandatory and children can enter these programmes at different ages, the
majority of 3-4 year-olds in OECD countries are enrolled in early childhood education (mostly
pre-primary education). On average across OECD countries, 71% of 3-year-olds and 86% of 4-year-olds
attended ECEC programmes (ISCED 0) in 2014, although this varies widely across countries.
In Hungary, 79% of all 3-year-olds participated in pre-primary education (ISCED 02) in 2014
(see Figure 6). The participation rate of 4-year-olds was significantly higher at 94%. In 11 OECD
countries (Belgium, Denmark, France, Germany, Iceland, Israel, Italy, Korea, Norway, Spain and
Sweden), at least 90% of 3 and 4-year-olds were enrolled in early childhood education (ISCED 0) in

HUNGARY
10 © OECD 2016
2014. Most OECD countries achieve full enrolment in ECEC for 5-year-olds. In Hungary, 96% of
5-year-olds participate in pre-primary education (ISCED 02) (OECD, 2016, Table C2.1).
Figure 6. Enrolment rates at age 3 in early childhood education and care (2005 and 2014)
Notes: Countries are ranked in descending order of the enrolment rates of 3-year-olds in 2013. 2005 data is missing for Austria, Belgium, Denmark, France, Greece, Iceland, Ireland, Latvia, Netherlands, New Zealand, Norway, Slovak Republic, Sweden and United Kingdom. 1. Year of reference 2013 instead of 2014. Refers only to ISCED 02. Source: OECD (2016), Education at a Glance 2016: OECD Indicators, Table C2.1, http://dx.doi.org/10.1787888933398347.
Section 3. Policy outcomes
The relationship between attending pre-primary education and mathematics performance of
15-year-olds
In PISA 2012, Hungarian students’ performance was below the OECD average, with improved
performance in reading, unchanged performance in science and decreased performance in mathematics
across PISA cycles. The impact of socio-economic background on mathematics performance of
15-year-olds was among the largest in OECD countries.
Research in neurosciences has shown that the brain sensitivity of highly important developmental
areas, such as emotional control, social skills, language and numeracy, peak in the first three years of a
child’s life (Gambaro et al., 2014). These findings indicate that the first years of children’s life are crucial
for their later development and learning. High quality ECEC can stimulate the development of these
skills, which highlights the importance of early development programmes and their level of quality
(OECD, 2006, 2011).
A strong start in education through ECEC is associated with higher performance in adolescence.
PISA results show that 15-year-olds who attended a pre-primary education programme (ISCED 02)
tended to perform better in mathematics than students who did not attend pre-primary education
(see Figure 7). Notably, children from a lower socio-economic background and in socio-economically
disadvantaged schools were less likely to have participated in pre-primary education.6
HUNGARY
© OECD 2016 11
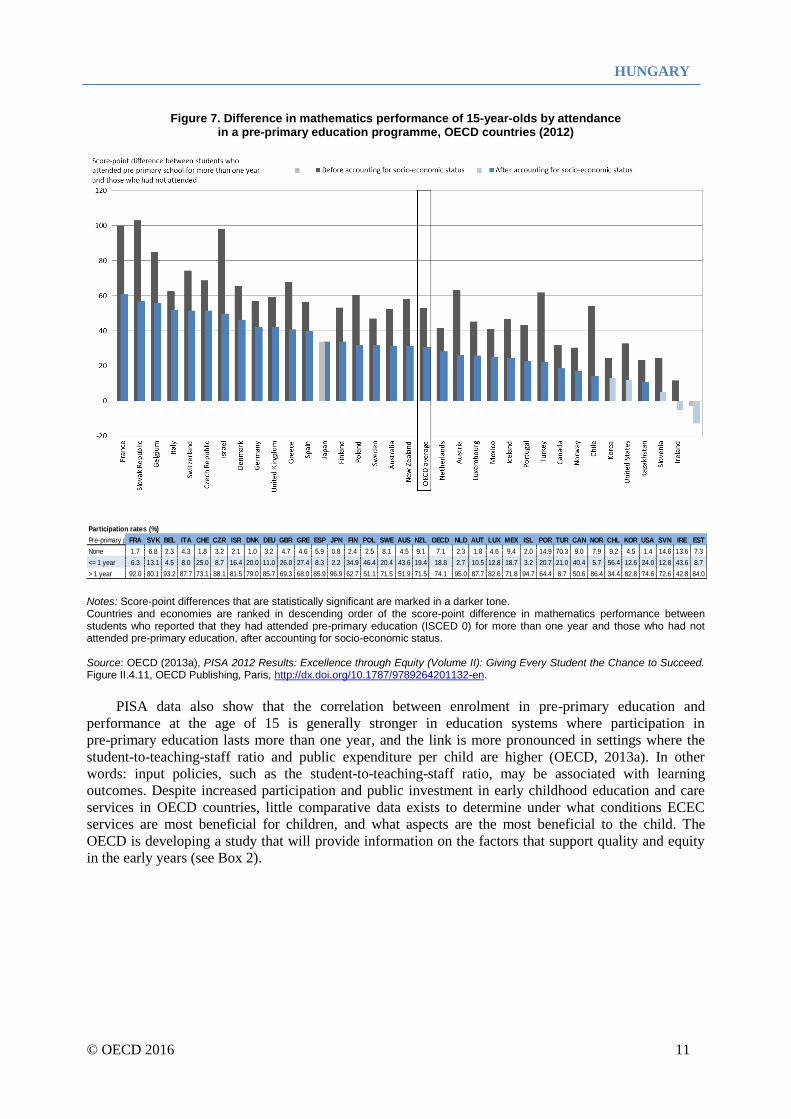
Figure 7. Difference in mathematics performance of 15-year-olds by attendance in a pre-primary education programme, OECD countries (2012)
Notes: Score-point differences that are statistically significant are marked in a darker tone. Countries and economies are ranked in descending order of the score-point difference in mathematics performance between students who reported that they had attended pre-primary education (ISCED 0) for more than one year and those who had not attended pre-primary education, after accounting for socio-economic status. Source: OECD (2013a), PISA 2012 Results: Excellence through Equity (Volume II): Giving Every Student the Chance to Succeed. Figure II.4.11, OECD Publishing, Paris, http://dx.doi.org/10.1787/9789264201132-en.
PISA data also show that the correlation between enrolment in pre-primary education and
performance at the age of 15 is generally stronger in education systems where participation in
pre-primary education lasts more than one year, and the link is more pronounced in settings where the
student-to-teaching-staff ratio and public expenditure per child are higher (OECD, 2013a). In other
words: input policies, such as the student-to-teaching-staff ratio, may be associated with learning
outcomes. Despite increased participation and public investment in early childhood education and care
services in OECD countries, little comparative data exists to determine under what conditions ECEC
services are most beneficial for children, and what aspects are the most beneficial to the child. The
OECD is developing a study that will provide information on the factors that support quality and equity
in the early years (see Box 2).
Pre-primary p FRA SVK BEL ITA CHE CZR ISR DNK DEU GBR GRE ESP JPN FIN POL SWE AUS NZL OECD NLD AUT LUX MEX ISL POR TUR CAN NOR CHL KOR USA SVN IRE EST
None 1.7 6.8 2.3 4.3 1.8 3.2 2.1 1.0 3.2 4.7 4.6 5.9 0.8 2.4 2.5 8.1 4.5 9.1 7.1 2.3 1.8 4.6 9.4 2.0 14.9 70.3 9.0 7.9 9.2 4.5 1.4 14.6 13.6 7.3
<= 1 year 6.3 13.1 4.5 8.0 25.0 8.7 16.4 20.0 11.0 26.0 27.4 8.3 2.2 34.9 46.4 20.4 43.6 19.4 18.8 2.7 10.5 12.8 18.7 3.2 20.7 21.0 40.4 5.7 56.4 12.6 24.0 12.8 43.6 8.7
> 1 year 92.0 80.1 93.2 87.7 73.1 88.1 81.5 79.0 85.7 69.3 68.0 85.9 96.9 62.7 51.1 71.5 51.9 71.5 74.1 95.0 87.7 82.6 71.8 94.7 64.4 8.7 50.6 86.4 34.4 82.8 74.6 72.6 42.8 84.0
Participation rates (%)

HUNGARY
12 © OECD 2016
Box 2: The development of international data on quality in early education and care
The OECD programme of work on ECEC includes a series of projects to develop the extent of available data on ECEC. These include: The TALIS Starting Strong Survey: is an international survey of ECEC staff and the quality of the learning and
well-being environment in different ECEC settings across OECD member and non-member economies. The objective is to collect data on staff characteristics, pre-service and in-service education, pedagogical practices and beliefs, organisation and management, and working conditions to give countries an internationally framed assessment of what actually happens in their ECEC settings, i.e. the quality of the learning and well-being environment children experience (instrument development and pilot study in 20116, field trial in 2017, main study in 2018 and reporting in 2019). The International Early Learning (for Child Well-being) Study seeks to provide reliable, comparative information
on the social, emotional and cognitive development of children to assist countries to improve children’s outcomes. It will measure children’s early learning outcomes, at approximately five years of age, in the context of their ECEC experiences and home environments. The study will include a child assessment component as well as a parent questionnaire to gather information about the home learning environment. The study will be conducted in 3-6 countries from 2016 to 2019. Results on the study will be released in 2020. A thematic study on transitions from ECEC to primary school will analyse country policies and practices in
stimulating quality transitions from ECEC to primary education. This study will be based on existing literature and country background notes, which will form the basis of a comparative analytical report in 2017.
This work is published under the responsibility of the Secretary-General of the OECD. The opinions expressed and arguments
employed herein do not necessarily reflect the official views of OECD member countries.
This document and any map included herein are without prejudice to the status of or sovereignty over any territory, to the
delimitation of international frontiers and boundaries and to the name of any territory, city or area.
The data for Israel are supplied by and under the responsibility of the relevant Israeli authorities. The use of such data by the OECD
is without prejudice to the status of the Golan Heights, East Jerusalem and Israeli settlements in the West Bank under the terms of
international law.
© OECD (2016)
You can copy, download or print OECD content for your own use, and you can include excerpts from OECD publications,
databases and multimedia products in your own documents, presentations, blogs, websites and teaching materials, provided that
suitable acknowledgment of OECD as source and copyright owner is given. All requests for commercial use and translation
rights should be submitted to [email protected].
For more information on Early Childhood Education and Care, visit www.oecd.org/edu/earlychildhood.
Questions can be directed to:
Miho Taguma, Directorate for Education and Skills
Email: [email protected]
Country note collaborators OECD: Maria Huerta, Eric Charbonnier, Etienne Albiser,
Mernie Graziotin, Sophie Limoges, Camilla Lorentzen
Rachel Linden and Victoria Liberatore.
Country note collaborators Hungary: László Limbacher, Tünde Hagymásy and Norbert
Görög

HUNGARY
© OECD 2016 13
Notes
1. Expenditure for early childhood educational development programmes (ISCED 01) is not presented here as
ISCED 01 is a category that does not apply in Hungary (see Box 1).
2. For example, in the Netherlands and Switzerland, the actual level of spending and enrolment in pre-primary
education is likely to be underestimated in the absence of data on integrated programs (some caution is
required before drawing conclusions about the conditions of access and quality of education and care for
young children).
3. Private sources include households and other private entities, such as private businesses and non-profit
organisations (e.g., religious organisations, charitable organisations, and business and labour
associations).
4. According to UOE definition on teacher aides “At early childhood education level, support personnel should not
be regarded as teachers’ aides unless they perform educational functions involving groups of pupils on a
regular basis.” However, there were 15 017 nurses, 2 763 pedagogical assistants and 212 special needs
assistants employed in kindergartens in school-year 2014/2014 who were not reported to UOE because
of the interpretation of the above definition.
5. The OECD Family Database definition of “formal” childcare among children aged 0-2 years includes centre-based
services, organised day care, pre-school and professional child-minders (OECD, 2015b).
6. Data for Hungary is not reported here due to missing information.

HUNGARY
14 © OECD 2016
REFERENCES
Gambaro, L., K. Stewart & J. Waldfogel (eds.) (2014), An Equal Start?: Providing Quality Early
Education and Care for Disadvantaged Children, Policy Press, Bristol.
Korintus, M. and Gábos, A. (2016), ‘Hungary country note’, in Koslowski A., Blum S. and Moss P.
(eds.) International Review of Leave Policies and Research 2016,
www.leavenetwork.org/lp_and_r_reports.
OECD (2016), Education at a Glance 2016: OECD Indicators, OECD Publishing, Paris,
http://dx.doi.org/10.1787/eag-2015-en.
OECD (2015a), Starting Strong IV: Monitoring Quality in Early Childhood Education and Care, OECD
Publishing, Paris, http://dx.doi.org/10.1787/9789264233515-en.
OECD (2015b), OECD Family Database, OECD, Paris, www.oecd.org/social/family/database.htm.
OECD (2014), Education at a Glance 2014: OECD Indicators, OECD Publishing, Paris,
http://dx.doi.org/10.1787/eag-2014-en.
OECD (2013a), PISA 2012 Results: Excellence through Equity (Volume II): Giving Every Student the
Chance to Succeed, PISA, OECD Publishing, Paris, http://dx.doi.org/10.1787/9789264201132-en.
OECD (2011), Starting Strong III: A Quality Toolbox for Early Childhood Education and Care, OECD
Publishing, Paris, http://dx.doi.org/10.1787/9789264123564-en.
OECD (2006), Starting Strong II: Early Childhood Education and Care, OECD Publishing, Paris,
http://dx.doi.org/10.1787/9789264035461-en.
OECD (2001), Starting Strong I: Early Childhood Education and Care, OECD Publishing, Paris,
http://dx.doi.org/10.1787/9789264192829-en.
HUNGARY
© OECD 2016 15
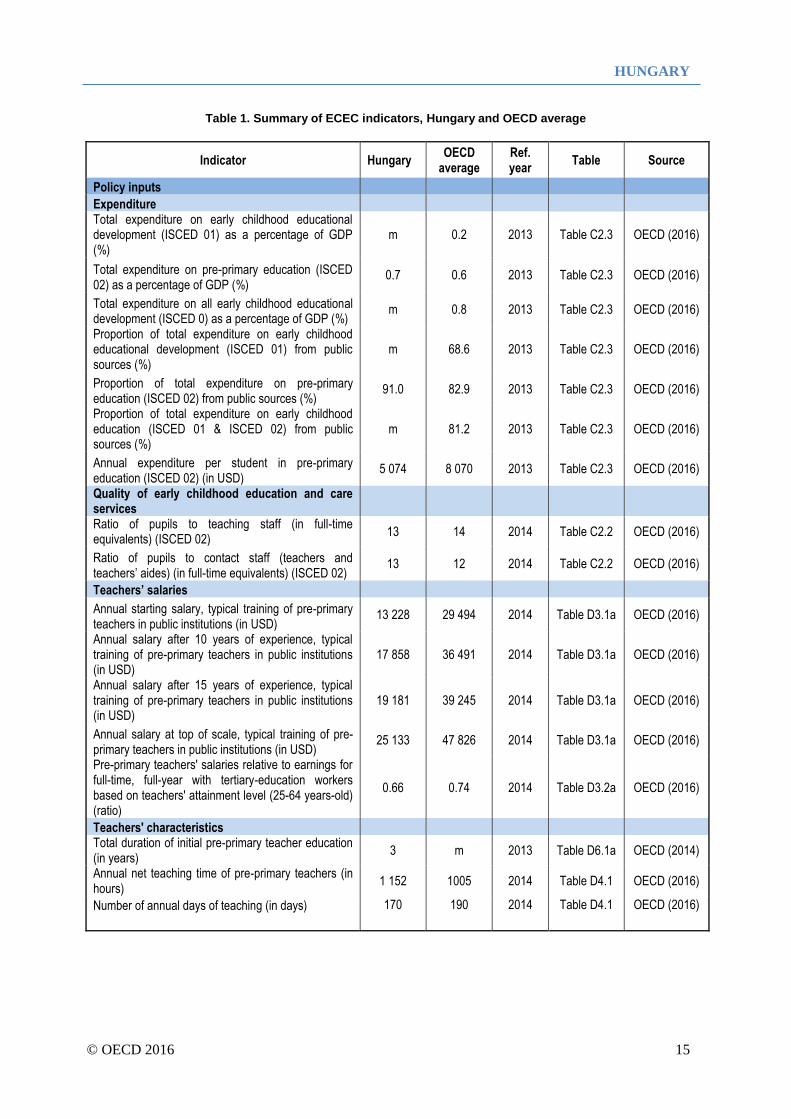
Table 1. Summary of ECEC indicators, Hungary and OECD average
Indicator Hungary OECD
average Ref. year
Table Source
Policy inputs
Expenditure Total expenditure on early childhood educational development (ISCED 01) as a percentage of GDP (%)
m 0.2 2013 Table C2.3 OECD (2016)
Total expenditure on pre-primary education (ISCED 02) as a percentage of GDP (%)
0.7 0.6 2013 Table C2.3 OECD (2016)
Total expenditure on all early childhood educational development (ISCED 0) as a percentage of GDP (%)
m 0.8 2013 Table C2.3 OECD (2016)
Proportion of total expenditure on early childhood educational development (ISCED 01) from public sources (%)
m 68.6 2013 Table C2.3 OECD (2016)
Proportion of total expenditure on pre-primary education (ISCED 02) from public sources (%)
91.0 82.9 2013 Table C2.3 OECD (2016)
Proportion of total expenditure on early childhood education (ISCED 01 & ISCED 02) from public sources (%)
m 81.2 2013 Table C2.3 OECD (2016)
Annual expenditure per student in pre-primary education (ISCED 02) (in USD)
5 074 8 070 2013 Table C2.3 OECD (2016)
Quality of early childhood education and care services Ratio of pupils to teaching staff (in full-time equivalents) (ISCED 02)
13 14 2014 Table C2.2 OECD (2016)
Ratio of pupils to contact staff (teachers and teachers’ aides) (in full-time equivalents) (ISCED 02)
13 12 2014 Table C2.2 OECD (2016)
Teachers’ salaries
Annual starting salary, typical training of pre-primary teachers in public institutions (in USD)
13 228 29 494 2014 Table D3.1a OECD (2016)
Annual salary after 10 years of experience, typical training of pre-primary teachers in public institutions (in USD)
17 858 36 491 2014 Table D3.1a OECD (2016)
Annual salary after 15 years of experience, typical training of pre-primary teachers in public institutions (in USD)
19 181 39 245 2014 Table D3.1a OECD (2016)
Annual salary at top of scale, typical training of pre-primary teachers in public institutions (in USD)
25 133 47 826 2014 Table D3.1a OECD (2016)
Pre-primary teachers' salaries relative to earnings for full-time, full-year with tertiary-education workers based on teachers' attainment level (25-64 years-old) (ratio)
0.66 0.74 2014 Table D3.2a OECD (2016)
Teachers' characteristics
Total duration of initial pre-primary teacher education (in years)
3 m 2013 Table D6.1a OECD (2014)
Annual net teaching time of pre-primary teachers (in hours)
1 152 1005 2014 Table D4.1 OECD (2016)
Number of annual days of teaching (in days) 170 190 2014 Table D4.1 OECD (2016)
HUNGARY
16 © OECD 2016
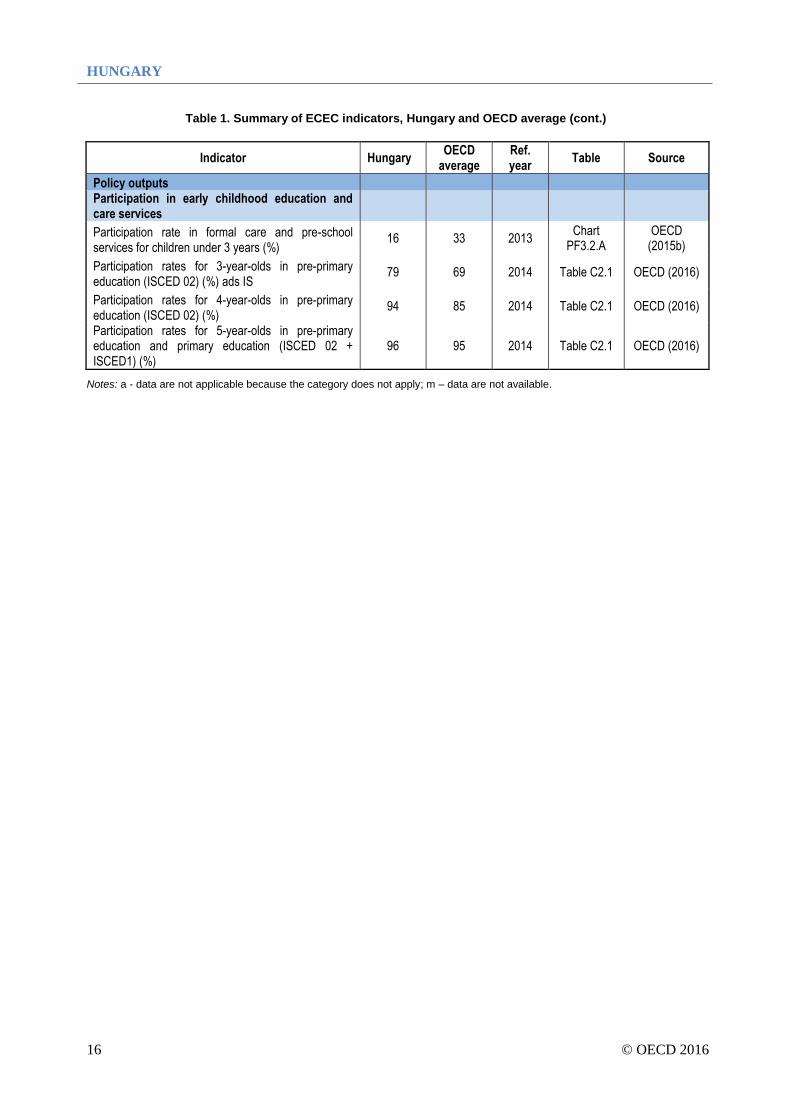
Table 1. Summary of ECEC indicators, Hungary and OECD average (cont.)
Indicator Hungary OECD
average Ref. year
Table Source
Policy outputs Participation in early childhood education and care services
Participation rate in formal care and pre-school services for children under 3 years (%)
16 33 2013 Chart
PF3.2.A OECD
(2015b)
Participation rates for 3-year-olds in pre-primary education (ISCED 02) (%) ads IS
79 69 2014 Table C2.1 OECD (2016)
Participation rates for 4-year-olds in pre-primary education (ISCED 02) (%)
94 85 2014 Table C2.1 OECD (2016)
Participation rates for 5-year-olds in pre-primary education and primary education (ISCED 02 + ISCED1) (%)
96 95 2014 Table C2.1 OECD (2016)
Notes: a - data are not applicable because the category does not apply; m – data are not available.
Related Documents