Humans and Hydrology at High Latitudes (H 3 L) Richard B. Lammers Water Systems Analysis Group, UNH Dan WhiteUniversity of Alaska, Fairbanks Lawrence C. Hamilton Department of Sociology, UNH Lilian Alessa University of Alaska, Anchorage Alexander I. Shiklomanov Water Systems Analysis Group, UNH Charles J. Vorosmarty Water Systems Analysis Group, UNH Rasmus O. Rasmussen University of Roskilde, Denmark Igor A. Shiklomanov Director, State Hydrological Institute, St. Petersburg, Russia Cynthia M. Duncan University of New Hampshire Sponsored by NSF - Synthesis of Arctic System Science - OPP 0531148

Humans and Hydrology at High Latitudes (H 3 L) Richard B. Lammers Water Systems Analysis Group, UNH Dan WhiteUniversity of Alaska, Fairbanks Lawrence C.
Jan 03, 2016
Welcome message from author
This document is posted to help you gain knowledge. Please leave a comment to let me know what you think about it! Share it to your friends and learn new things together.
Transcript

Humans and Hydrology at High Latitudes (H3L)
Richard B. Lammers Water Systems Analysis Group, UNHDan White University of Alaska, FairbanksLawrence C. Hamilton Department of Sociology, UNHLilian Alessa University of Alaska, AnchorageAlexander I. Shiklomanov Water Systems Analysis Group, UNHCharles J. Vorosmarty Water Systems Analysis Group, UNHRasmus O. Rasmussen University of Roskilde, DenmarkIgor A. Shiklomanov Director, State Hydrological Institute, St. Petersburg, RussiaCynthia M. Duncan University of New Hampshire
Sponsored by NSF - Synthesis of Arctic System Science - OPP 0531148

Major Challenges
(1) Integrating biogeophysical and human dimension data sets at the pan-arctic scale
(2) Ranking the major forcings on the water system
(3) Drawing conclusions on current system state and future trajectories at scales relevant to human activities (i.e. local and intermediate)

Hypotheses
H1: At local scales, direct human impacts (such as changes in land use and land cover, or water management) most often drive hydrologic change. At larger regional and pan-arctic scales, climate change drives hydrologic change.
H2: Climate change affects human activities in the pan-Arctic in ways that will, in turn, impact both the humans and hydrology of the pan-arctic system.
H3: A more temperate pan-arctic basin will lead to conditions under which direct human impacts on the hydrologic cycle will intensify and expand in scale.

GOAL 1
Retrospective: To analyze the major forces and trajectories shaping the pan-arctic water system and to understand their interactions with humans.
GOAL 2
Contemporary: To advance our knowledge of relationships linking broad scales of change to local societal impacts.
GOAL 3
Future: To forecast the range of potential future statistics of the pan-arctic hydrosphere, societal impacts, and response at multiple scales.

The proposed work involves a 200 year time range made up of the historical (1900-2000),
contemporary (2000), and prognostic (2000-2100) periods. These periods can be viewed from the
perspective of a variety of scales; large (continental), regional, and local (human) scales.
Goal 1
Goal 2
Goal 3

Table 1: Pan-Arctic Change Assessment Experiments
Historical Contemporary Future GOAL 1 GOAL 2 GOAL 3
Comprehensive Scenario
Single Change Scenarios
Paired (Coupled) Scenarios
Local to Large Scales
Future Scenario
S1: Land use/ cover change only.
P1: Land use/cover and human water use changes only.
S2: Human water use change only.
P2: Land use/cover and climate changes only.
(Baseline) C1: Combined Land use/cover, human water use and climate changes, Past 100 years.
S3: Climate change only.
P3: Human water use and climate changes only.
L1:
Typologi es
F1: Climate change scenarios from IPCC

FIGURE 3. Overall framework for the E-RIMS data and model integration system.

ArcticRIMS - http://RIMS.unh.edu


Okrug = Administrative District

Demography of Timyrsky Okrug
M e n a n d
W o m e n
M e n W o m e n
A l l a g e s 3 9 7 8 6 1 9 3 6 4 2 0 4 2 2 1 0 0 1 0 0 1 0 0
0 – 4 2 6 0 3 1 2 9 8 1 3 0 5 6 . 5 6 . 7 6 . 4
5 – 9 2 7 4 4 1 3 3 7 1 4 0 7 6 . 9 6 . 9 6 . 9
1 0 – 1 4 3 9 5 2 2 0 2 1 1 9 3 1 9 . 9 1 0 . 4 9 . 5
1 5 – 1 9 3 5 0 0 1 7 4 9 1 7 5 1 8 . 8 9 . 0 8 . 6
2 0 – 2 4 3 2 0 1 1 5 9 9 1 6 0 2 8 . 0 8 . 3 7 . 8
2 5 – 2 9 3 4 8 4 1 7 8 2 1 7 0 2 8 . 8 9 . 2 8 . 3
3 0 – 3 4 3 1 2 9 1 5 8 0 1 5 4 9 7 . 9 8 . 2 7 . 6
3 5 – 3 9 3 0 5 5 1 4 9 8 1 5 5 7 7 . 7 7 . 7 7 . 6
4 0 – 4 4 3 9 3 0 1 8 7 0 2 0 6 0 9 . 9 9 . 7 1 0 . 1
4 5 – 4 9 3 8 1 5 1 8 4 1 1 9 7 4 9 . 6 9 . 5 9 . 7
5 0 – 5 4 2 9 9 2 1 4 0 1 1 5 9 1 7 . 5 7 . 2 7 . 8
5 5 – 5 9 1 2 1 7 6 0 6 6 1 1 3 . 1 3 . 1 3 . 0
6 0 – 6 4 9 6 3 4 2 7 5 3 6 2 . 4 2 . 2 2 . 6
6 5 – 6 9 5 0 5 1 7 5 3 3 0 1 . 3 0 . 9 1 . 6
7 0 – 7 4 3 5 8 9 3 2 6 5 0 . 9 0 . 5 1 . 3
7 5 – 7 9 1 7 9 4 0 1 3 9 0 . 4 0 . 2 0 . 7
8 0 – 8 4 8 3 1 3 7 0 0 . 2 0 . 1 0 . 3
> 8 5 2 1 3 1 8 0 . 1 0 . 0 0 . 1
A g e i s u n k n o w n 5 5 3 1 2 4 0 . 1 0 . 2 0 . 1
M e d i a n a g e 3 0 . 6 2 9 . 7 3 1 . 5
I n p e r c e n t t o t o t a l
A g e
M e n a n d
W o m e n
M e n W o m e n
Indigenous population of Taimyrsky Okrug
Indigenous Men and
Women Men Women
Nganasany 834 362 472
Nentsy 3054 1400 1654
Entsy 197 99 98
Dolgany 5517 2504 3013
Total 9602 4365 5237
Aging Population
Therefore a Declining Population

QuickTime™ and aTIFF (Uncompressed) decompressor
are needed to see this picture.
Alaska counties mapped into EASE-Grid Cells

QuickTime™ and aBMP decompressor
are needed to see this picture.

How do we handle human data and do we handle it at the local or regional
scales?

Identify typologies: EconomySubsistenceResourcePublicMilitary

Within typologies, consider population growth, resource use, climate change, and
values to estimate future reliance on freshwater
Photo courtesy of Bryan Collver

Ice Road Construction
Snow birds flooding sea ice Point of withdrawal
Photos courtesy of AIC

Access to subsistence resources

(Larry Smith et al., 2005)

How Will People Respond to Change?

Multi-Agent Simulation (MAS) Modeling of the Human-Freshwater Network

Broader ARCSS Synthesis

Runoff
Precipitation/evaporation
Atmospheric circulation
Photo: Malcolm Ford

Outreach


Matrix view: Indicator Database of Arctic Community Change (INDACC).
Rows in this human-dimensions database are place/years; variables could be any place/year attributes.

Choropleth map of Alaska regions

Point map showing population of settlements in northern Alaska

0
5
10
15
20
0
5
10
15
20
0
5
10
15
20
1970 1980 1990 2000 1970 1980 1990 2000 1970 1980 1990 2000 1970 1980 1990 2000
Aleutians East Borough Aleutians West Census Area Bethel Census Area Bristol Bay Borough
Dillingham Census Area Lake and Peninsula Borough Nome Census Area North Slope Borough
Northwest Arctic Borough Wade Hampton Census AreaWrangell-Petersburg Census AreaYukon-Koyukuk Census Area
Population in 1000s
Observed & modeled population in 12 Alaska regions, 1969–2003
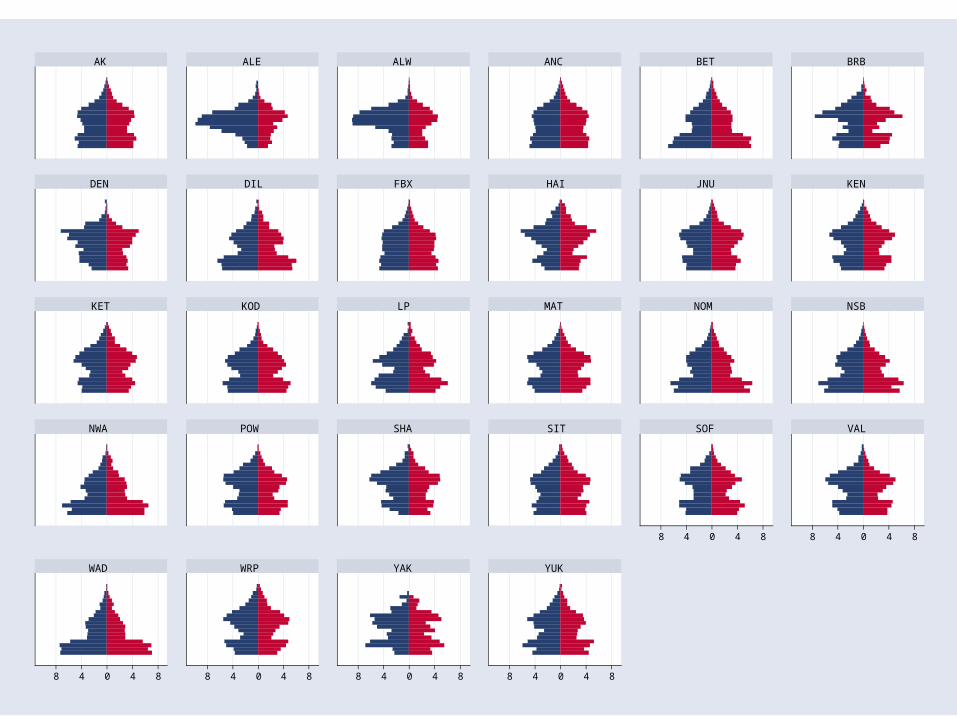
8 4 0 4 8 8 4 0 4 8
8 4 0 4 8 8 4 0 4 8 8 4 0 4 8 8 4 0 4 8
AK ALE ALW ANC BET BRB
DEN DIL FBX HAI JNU KEN
KET KOD LP MAT NOM NSB
NWA POW SHA SIT SOF VAL
WAD WRP YAK YUK

Multilevel models, also called mixed models, can include both “fixed effects,” which at the top level are analogous to coefficients of one-level models, and also “random effects,” which vary within levels. We can have multiple nested levels of random effects. The red curves in Figure 1 depict a simple two-level model of the form
pop i j = β0 + β1 year i j + β2 year 2i j + ζ0 j + ζ1 j year i j + ζ2 j year 2i j + ε i j
where pop i j is the population in year i for region j. The β (beta) parameters describe growth trends for all 12 regions considered together. ζ j (zeta) parameters represent effects that are unique for each region. Estimates of β’s and the standard deviations of ζ’s (all of which differ significantly from zero) are summarized in the following table.

. xtmixed pop year0 year2 || fips: year0 year2Performing EM optimization: Performing gradient-based optimization: Iteration 0: log restricted-likelihood = -2881.5464 Iteration 1: log restricted-likelihood = -2881.5464 Computing standard errors:
Mixed-effects REML regression Number of obs = 376Group variable: fips Number of groups = 12
Obs per group: min = 24 avg = 31.3 max = 35
Wald chi2(2) = 67.15Log restricted-likelihood = -2881.5464 Prob > chi2 = 0.0000
------------------------------------------------------------------------------ pop | Coef. Std. Err. z P>|z| [95% Conf. Interval]-------------+---------------------------------------------------------------- year0 | 157.8059 19.68347 8.02 0.000 119.227 196.3848 year2 | -2.524094 .7368461 -3.43 0.001 -3.968286 -1.079902 _cons | 3886.339 840.8581 4.62 0.000 2238.288 5534.391------------------------------------------------------------------------------
------------------------------------------------------------------------------ Random-effects Parameters | Estimate Std. Err. [95% Conf. Interval]-----------------------------+------------------------------------------------fips: Independent | sd(year0) | 54.97667 16.54872 30.47581 99.17486 sd(year2) | 2.356629 .5590851 1.48031 3.751714 sd(_cons) | 2887.341 629.0323 1883.894 4425.27-----------------------------+------------------------------------------------ sd(Residual) | 432.3029 16.55945 401.0354 466.0082------------------------------------------------------------------------------LR test vs. linear regression: chi2(3) = 1344.84 Prob > chi2 = 0.0000

End of slideshow
Related Documents