Girod: Image Communication Human Visual Perception - Overview ✗ Anatomy of the Human Eye ✗ Trichromacy ✗ Color Systems ✗ Color Representation in the Chromacity Plane ✗ Weber-Fechner Law ✗ Lateral inhibition and excitation ✗ Transfer functions of the color channels ✗ Spatial and temporal masking 3-1

Welcome message from author
This document is posted to help you gain knowledge. Please leave a comment to let me know what you think about it! Share it to your friends and learn new things together.
Transcript

Girod: Image Communication
Human Visual Perception - Overview
✗ Anatomy of the Human Eye
✗ Trichromacy
✗ Color Systems
✗ Color Representation in the Chromacity Plane
✗ Weber-Fechner Law
✗ Lateral inhibition and excitation
✗ Transfer functions of the color channels
✗ Spatial and temporal masking
3-1

Girod: Image Communication
Anatomy of the Human Eye
3-2
cornea
pupillens
iris
optic axis
fovea
optic nerve
opticdisk
retina
sclera
retinal imageobject

Girod: Image Communication
light
optic nerve
fibers
ganglion cells
inner synapticlayer
amacrine cellsbipolar cells
horizontal cells
outer synapticlayer
receptor nuclei
receptors
3-3
The Human Retina I
Signal propagation in the retina:
ganglion cells (= optic nerve)
bipolar cells
receptors

Girod: Image Communication
The Human Retina II
Video displays
3-4
receptorsin 1000/mm2
rods
cones
blind spot foveaangle [degree]nose
Rods Cones
high sensitivity low sensitivity
low light vision day light vision > 1 cd/m2
monochrome color
"scotopic vision" "photopic vision"

Girod: Image Communication
Absorption Spectra of Cones in the Human Retina
wavelength
Normalized absorption spectra
3-5

Girod: Image Communication
Trichromacy Theory
“primary colors“
“color space“
i(λ) =
dI(λ)dλ
Is = Vs (λ) i(λ) dλ0
∞∫
Im = Vm(λ) i(λ) dλ0
∞∫
I = V (λ) i(λ) dλ0
∞∫
Spectral irradiance on the retina
Cones "see" the physical quantities
Three numbers are sufficient to characterize each possible spectrum
Metamers: i1 (λ) ≠ i2(λ) but
Is1 = Is2
Im1 = Im2
I 1 = I 2
3-6

Girod: Image Communication
Additive Color MixingMapping is lineari λ → Is, Im, Il
Superposition
if i(λ) = a1 i1 (λ) + a2 i2 (λ)
dann Is = a1 Is1+ a2 Is2
Im = a1 Im1+ a2 Im2
Il = a1 Il1 + a2 Il2
then Is = a1 Is1 + a2 Is2
Im = a1 Im1 + a2 Im2
I = a1 I 1 + a2 I 2
I =
Is
Im
I
= a1I 1 + a2 I 2
Written as a vector
3-7

Girod: Image Communication
Gamut Spanned by Two Primary Colors
3-8

Girod: Image Communication
Gamut Spanned by Three Primary Colors
Each color inside the parallelepiped can be generated uniquely by additive mixture of the three primary colors.
3-9

Girod: Image Communication
Color Transmission with Three Signals
transmitter receiver
red
green
blue
3-10

Girod: Image Communication
Negative colors ??
• Agree on arbitrary primary colors as reference values • Relax restriction 0 ≤ a1, a2, a3 ≤ 1
Color matching experiment
0 ≤ a1, a2, a3
a1 < 0, 0 ≤ a2,a3
I = a1I 1 + a2 I 2 + a3 I 3
I − a1I 1 = a2 I 2 + a3I 3
3-11

Girod: Image Communication
Spectral Color Matching Experiment
C.I.E.: Commission Internationale de l'Eclairage, 1931
✗ Monochromatic primary colorsλr = 700 nm λg = 546.1 λb = 435.8 nm
color matching functions
3-12

Girod: Image Communication
C.I.E. Color Coordinate SystemsC.I.E. RGB color coordinate system
∞R0
= Vr (λ) i(λ) dλλ=0
∫ G0 = Vg(λ) i(λ) dλλ =0
∞∫ B0
= Vb (λ) i(λ) dλλ=0
∞∫
Inverse transform
R0 = 0. 490 X + 0.177 Y
G0 = 0. 310 X + 0. 813 Y + 0. 010 Z
B0 = 0.200 X + 0.010 Y + 0. 990 Z
C.I.E. XYZ color coordinate system
X = 2. 365 R0 − 0. 515 G0 + 0.005 B0
Y = −0. 897 R0 + 1. 426 G0 − 0. 014 B0
Z = −0. 468 R0 + 0.089 G0 + 1. 009 B0
3-13

Girod: Image Communication
Properties of XYZ Color Coordinate System
Color matching functions of standard observer (DIN 5033)
✗ XYZ color matching function always positive
✗ X, Y, Z are virtual primary colors
✗ Y curve corresponds to luminous efficiency curve
✗ Equal energy white i(λ) = const.
X = Y = Z
3-14

Girod: Image Communication
C.I.E. Chromaticity Coordinates (x,y)
Chromaticity
Geometric interpretation
x = XX + Y + Z
; y =Y
X + Y + Z ; z =
ZX + Y + Z
redundant, because x + y + z = 1
3-15

Girod: Image Communication
locus of spectral colors
lines of constant wavelength and hue
lines of constant saturation
C.I.E. Chromaticity Diagram
3-16

Girod: Image Communication
Additive Color Mixture in the Chromaticity Diagram
(Y1, x1, y1) (Y2, x2, y2)
Y = Y1 + Y2
x = a1x1 + a2x2
y = a1y1 + a2y2
a1 =
Y1
y1Y1
y1+
Y2
y2
a2 =
Y2
y2Y1
y1+ Y2
y2
with
geometric construction
color 1: color 2:
color mixture
3-17

Girod: Image Communication
Color Coordinates of Phosphors Used in Television Receivers
3-18

Girod: Image Communication
Just Noticeable Color Differences
MacAdam‘s ellipses (10 times enlarged)
3-20

Girod: Image Communication
CIE UCS System (1960)New chromaticity coordinates
Equal energy white E
u =4x
−2x + 12y + 3 v =
6y−2x + 12y + 3
uE =4
19
vE =6
19
3-21

Girod: Image Communication
CIE L*u*v* Color Difference Measure (1976)
Euclidean distance
∆s = ∆L∗( )2+ ∆u∗( )2
+ ∆v∗( )2
Color space
L∗ =116
YY0
13 − 16 for
YY0
> 0, 01
903YY0
otherwise
u∗ = 13 L∗( ′ u − ′ u 0 )
v∗ = 13 L∗( ′ v − ′ v 0 )
with
′ u =4X
X + 15Y + 3Z
′ v = 9YX + 15Y + 3Z
Y , ′ u 0, ′ v 0 - reference white0
3-22

Girod: Image Communication
Optical Properties of the Human Eye
✗ Deviations from ideal perspective projection due to
✗ Aperture of the eye✗ Focus errors (spherical aberration)✗ Chromatic aberration
✗ Effects can be summarized by a 2D convolution with the optical point-spread function (PSF).
✗ Instead of a PSF, an optical line-spread function (LSF) is often given, which can be measured more easily.
✗ Dispersion
3-23

Girod: Image Communication
Optical LSF of the Human Eye
LSF measured for different pupil diameters(Campbell + Gubisch)
LSF calculated from eye aperture (due to diffraction)
3-24

Girod: Image Communication
Optical Modulation Transfer Function (MTF)of the Human Eye
✗ The optical modulation transfer function (MTF) can be interpreted as Fourier transform of the optical LSF.
✗ MTF is measured directly with sinewave gratings.
2-25
spatial frequency
Measurements by Campbell + Greenfor various pupil diameters

Girod: Image Communication
Sine Wave Grating
3-26
position
contrast ratio =L2 - L1
L2 + L1

Girod: Image Communication
Visual Acuity
✗ Spatial resolution in lines/arcmin:
3-27
blind spot foveaangle [degree]
cones
rods
nose
✗ Minimum distance of adjacent cones in the central fovea limits spatial resolution. (2 - 2.3 µm 25 . . . 29 sec of arc)

Girod: Image Communication
Weber-Fechner Law, I
✗ Experiment:
3-28
✗ Result:
CONST
LB, background luminance (cd/m2)
surroundluminance LS
stimulusarea
backgroundluminance LB

Girod: Image Communication
Weber-Fechner Law, II
✗ "Weber-Fechner Law"
✗ Implies logarithmic relationship between physical luminance and subjectively perceived brightness.
✗ Other proposed nonlinearities: square-root, cube-root, polynomials
✗ γ-characteristic of CRT displays is approximate inverse of nonlinearity of human brightness perception.
∆L = c • LB c = 0.01 . . . 0.02
3-29

Girod: Image Communication
Inhibition and Excitation in the Retina
✗ Receptive field of a ganglion cell (=fiber of the optic nerve) shows „center-surround response“ with both
✗ Lateral inhibition✗ Lateral excitation
3-30
receptivefield
center
activity of neuron
averageactivity
surround
Girod: Image Communication
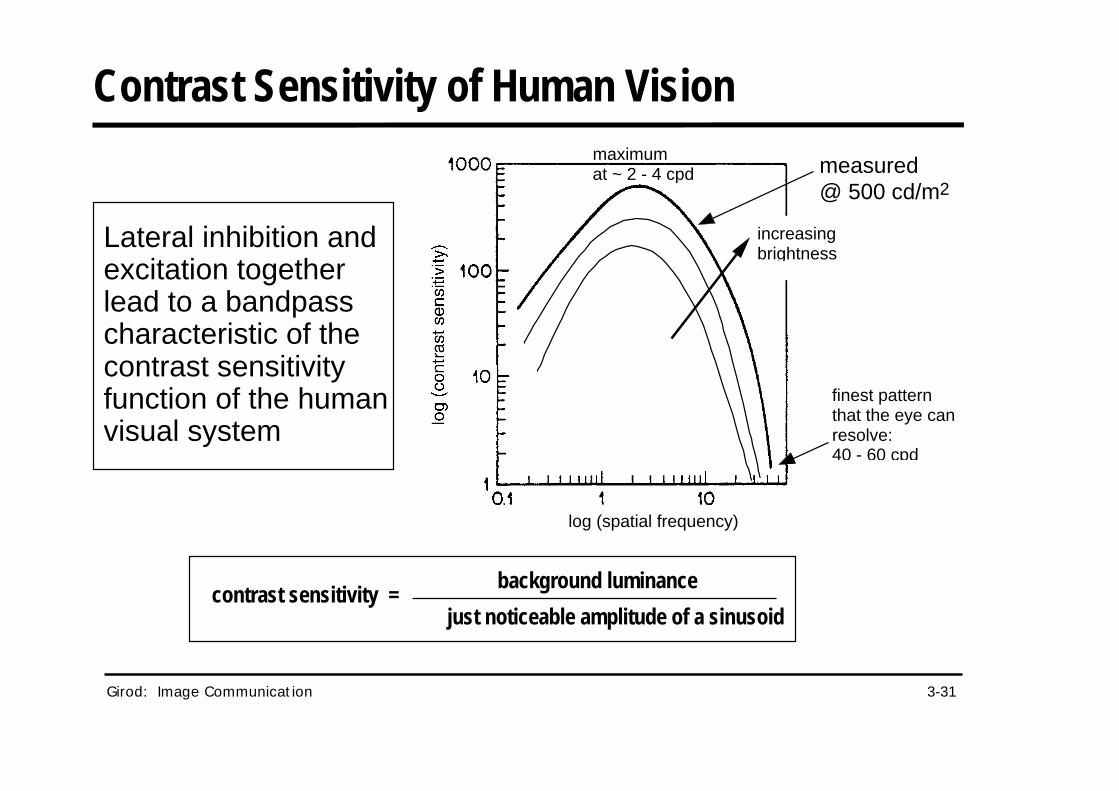
Contrast Sensitivity of Human Vision
contrast sensitivity = just noticeable amplitude of a sinusoid
background luminance
measured@ 500 cd/m2
maximumat ~ 2 - 4 cpd
finest pattern that the eye can resolve:40 - 60 cpd
log (spatial frequency)
increasingbrightness
Lateral inhibition and excitation together lead to a bandpass characteristic of the contrast sensitivity function of the human visual system
3-31

Girod: Image Communication
Viewing Geometry
for small angles:
Spatial frequency in cycles/degree [cpd]:
αy ≈y1
D1=
y2
D2
tube eye
3-32

Girod: Image Communication
Color Vision: Opponent Color Theory
✗ Retina carries out “matrix operation“ to represent colors in the opponent color system (Y, Y-B, R-G)
✗ Opponent color model: ✗ Opponent color space:
black
whitegreen
red
yellowblue
Luminance signal
B G R
B G R
YB
RGChromatic channels
Y
3-33

Girod: Image Communication
Color Vision: Contrast Sensitivity in Opponent Color Space✗ Spatial frequency response of Y-B and R-G channel (Girod, 1988):
✗ Some researchers have observed bandpass characteristic also for chromaticity channels.
✗ Bandwidth Y:RG:YB approximately 8:5:3.
3-34
spatial frequency (cpd)

Girod: Image Communication
Spatial Masking, I
Experiment:
visibility threshold(w-Modell, Girod, 1987)
distance from edge [arcmin]
80 → 230
80 → 180
80 → 130
6 dB
0 10 20-20 -10
change in video signalamplitude[0 . . . 255]
dynamic noise bar
distance D
lightdark
3-35

Girod: Image Communication
Spatial Masking, IIVisibility threshold for the γ-predistorted video signal (w-Modell, Girod, 1987):
3-36
80 → 230
80 → 180
80 → 130
6 dB
0 10 20-20 -10
"γ-shift"
distance from edge [arcmin]
change of video amplitude[0 . . . 255]

Girod: Image Communication
log (temporal frequency)
Maximum at 5 - 10 Hz
increasingbrightness
flicker fusion at 25 - 80 Hz
Temporal Contrast Sensitivity of Human Vision
3-37

Girod: Image Communication
temporal frequency
Spatiotemporal Contrast Sensitivity of Luminance Perception✗ Spatiotemporal contrast sensitivity of the luminance channel has bandpass characteristic.✗ Contrast sensitivity function separable for high spatial and temporal frequencies only.✗ Plot of contrast sensitivity function (from Kelly):
3-38

Girod: Image Communication
Temporal Masking
✗ Visibility thresholds for γ-predistorted video signal after luminance discontinuity (w-model, Girod, 1987):
3-39
time after discontinuity [ms]

Girod: Image Communication
Eye Movements
correctivesaccade
slowdrift
SPEM ; v < 30 °/s
SPEM: smooth pursuit eye movement
3-40

Girod: Image Communication
Temporal Masking and SPEMs
3-41
dark
bright
trajectory of eye movement
x
t
t 0 t 0
x
t
Eye fixates screen Eye tracks moving edge
t=0 t=t0 t0 < t < t1 t1 < t
t 1 t 1
dark
bright
trajectory of eye movement
Temporal masking

Girod: Image Communication
Human Visual Perception - Summary
✗ Anatomy of the Human Eye
✗ Trichromacy
✗ Color Systems and Representation
✗ Spatial frequency components visible up to 60 cpd
✗ Logarithmic relationship between luminance and subjective impression
✗ Lateral inhibition -> spatial bandpass characteristic
✗ Chromaticity channels have lower bandwidth
✗ Visibility threshold often increased in the vicinity of edges, but sometimes decreased („masking“).
3-42

Girod: Image Communication
Eye Movements and Spatiotemporal Frequency Response of the Human Visual System, I✗ Assume SPEM of constant velocity:
✗ Coordinate transformation in spatiotemporal frequency space (“Doppler effect“)
retina coordinate system display coordinate system
x' = x - v ty' = y - v tt' = t
x
y
ω ' = ωω ' = ωω ' = ω + ω v + ω v
x
y
t
x
y
t x x y y
12-22

Girod: Image Communication
Eye Movements and Spatiotemporal Frequency Response of the Human Visual System, II
relative velocity betweeneye and coordinate system
12-23Girod: Image Communication

Girod: Image Communication
relative velocity betweeneye and coordinate system
Eye Movements and Spatiotemporal Frequency Response of the Human Visual System, III
12-24

Girod: Image Communication
spatial frequency
temporalfrequency
"window of perception"
Perception of a Temporally Sampled Image Signal, Without Movement
12-25

Girod: Image Communication
spatial frequency
temporalfrequency
"window of perception"
Perception of a Temporally Sampled Image Signal, Without Movement
12-25
• Phosphors with fast decay reproduce more than 20 temporal baseband replicas
• No spectral overlap -> perfect reconstruction of original signal possible
spatial frequency
temporalfrequency
"window of perception",with SPEM
3 pel/frame
Perception of a Temporally Sampled Image Signal, Translatory Movement
12-26

Girod: Image Communication
✗ Anatomy of the Human Eye
✗ Trichromacy
✗ Color Systems and Representation
✗ Weber-Fechner Law
✗ Lateral inhibition and excitation
✗ Transfer functions of the color channels
✗ Spatial and temporal masking
✗ Eye movements
Related Documents


![Three-systems theory of human visual motion perception ... · Lu and Sperling [Vision Res. 35, 2697 (1995)] proposed that human visual motion perception is served by three separate](https://static.cupdf.com/doc/110x72/607dd917eadfd87f26441e91/three-systems-theory-of-human-visual-motion-perception-lu-and-sperling-vision.jpg)


