*Corresponding Author Address: Yutaka Inoue, Laboratory of Drug Safety Management, Faculty of Pharmaceutical Sciences, Josai University; 1-1 Keyakidai, Sakado-shi, Saitama, 3500295, Japan; E-mail: [email protected] World Journal of Pharmaceutical Sciences ISSN (Print): 2321-3310; ISSN (Online): 2321-3086 Published by Atom and Cell Publishers © All Rights Reserved Available online at: http://www.wjpsonline.org/ Original Article Human sensory testing of loperamide hydrochloride preparations for children to improve their palatability Yutaka Inoue * , Shunichi Funato, Rina Suzuki, Yuki Morita, Isamu Murata and Ikuo Kanamoto Faculty of Pharmaceutical Sciences, Josai University, Japan Received: 25-01-2015 / Revised: 24-02-2015 / Accepted: 27-02-2015 ABSTRACT The purpose of the present study was to evaluate taste by a human sensory test and the physicochemical properties of loperamide hydrochloride preparations for children (Preparations A, B, and C). Evaluation of bitterness revealed significantly differences between preparation C and preparation A or B. In contrast, the results of solubility and palatability with a human sensory test revealed differences between preparation A and preparation C. Measurement of sugar content revealed that the preparations all had equivalent sugar content. Measurement of particle size distribution and scanning electron microscopy revealed differences in the particle size and particle surface morphology for each preparation. A dissolution test revealed that Preparation Chad a briefer period prior to dissolution than the other preparations. The taste and palatability of a preparation were presumably the result of differences in the rate of dissolution of the principal agent, types of additives, and the process by which a preparation is manufactured. In other words, the characteristics of each preparation were revealed by evaluation of their physical properties and human sensory test Keywords: human sensory test, palatability, physicochemical property, loperamide hydrochloride INTRODUCTION When patients take a pharmaceutical, they tend to dislike taking it if the pharmaceutical is bitter or unpalatable 1, 2 . Difficulty taking a pharmaceutical leads to less compliance, which can in turn reduce its efficacy and result in a worse quality of life. The dissolution of preparations such as fine granules, dry syrups, and orally disintegrating tablets in the mouth can be anticipated based on the preparation‟s properties, and patients are acutely aware of a preparation‟s taste and palatability. Most pharmaceuticals are taken orally, and the good taste and easy palatability or bad taste and poor palatability of oral preparations greatly affect patient compliance. Aspects of the taste and palatability of a preparation, such as its bitterness, can be improved by masking bitterness through techniques such as coatings and inclusion of certain additives in the preparation 3-4 . As one of its efforts to reduce medical expenses, the Japanese Government recommends that medical facilities use generic pharmaceuticals (generics). An important task for medical personnel is to select generics that are safe for patients, efficacious, and highly palatable. Generics contain the same ingredients as brand-name pharmaceuticals (brand-name drugs) but they contain different preservatives, coloring agents, and excipients, so physicians and pharmacists often question their quality 5 . Generics are cheaper than brand-name drugs and have the same quality. However, many medical experts feel that there is a lack of clinical information on the clinical efficacy and safety of these drugs and inadequate information on the properties of preparations 6 .Thus, this clinical information and information on the properties of preparations are crucial to determining whether to dispense a brand- name drug or a generic. However, assessment of the taste and palatability of a preparation is difficult, and a comprehensive evaluation of a preparation, i.e. whether it tastes good or bad and whether it is palatable or not, often depends on human sensory perceptions as gauged by a human sensory test. A human sensory test directly gauges human sensory perceptions, so it offers the

Welcome message from author
This document is posted to help you gain knowledge. Please leave a comment to let me know what you think about it! Share it to your friends and learn new things together.
Transcript
*Corresponding Author Address: Yutaka Inoue, Laboratory of Drug Safety Management, Faculty of Pharmaceutical Sciences, Josai
University; 1-1 Keyakidai, Sakado-shi, Saitama, 3500295, Japan; E-mail: [email protected]
World Journal of Pharmaceutical Sciences ISSN (Print): 2321-3310; ISSN (Online): 2321-3086
Published by Atom and Cell Publishers © All Rights Reserved
Available online at: http://www.wjpsonline.org/
Original Article
Human sensory testing of loperamide hydrochloride preparations for children to
improve their palatability
Yutaka Inoue*, Shunichi Funato, Rina Suzuki, Yuki Morita, Isamu Murata and Ikuo
Kanamoto
Faculty of Pharmaceutical Sciences, Josai University, Japan
Received: 25-01-2015 / Revised: 24-02-2015 / Accepted: 27-02-2015
ABSTRACT
The purpose of the present study was to evaluate taste by a human sensory test and the physicochemical
properties of loperamide hydrochloride preparations for children (Preparations A, B, and C). Evaluation of
bitterness revealed significantly differences between preparation C and preparation A or B. In contrast, the
results of solubility and palatability with a human sensory test revealed differences between preparation A and
preparation C. Measurement of sugar content revealed that the preparations all had equivalent sugar content.
Measurement of particle size distribution and scanning electron microscopy revealed differences in the particle
size and particle surface morphology for each preparation. A dissolution test revealed that Preparation Chad a
briefer period prior to dissolution than the other preparations. The taste and palatability of a preparation were
presumably the result of differences in the rate of dissolution of the principal agent, types of additives, and the
process by which a preparation is manufactured. In other words, the characteristics of each preparation were
revealed by evaluation of their physical properties and human sensory test
Keywords: human sensory test, palatability, physicochemical property, loperamide hydrochloride
INTRODUCTION
When patients take a pharmaceutical, they tend to
dislike taking it if the pharmaceutical is bitter or
unpalatable1, 2
. Difficulty taking a pharmaceutical
leads to less compliance, which can in turn reduce
its efficacy and result in a worse quality of life. The
dissolution of preparations such as fine granules,
dry syrups, and orally disintegrating tablets in the
mouth can be anticipated based on the
preparation‟s properties, and patients are acutely
aware of a preparation‟s taste and palatability.
Most pharmaceuticals are taken orally, and the
good taste and easy palatability or bad taste and
poor palatability of oral preparations greatly affect
patient compliance. Aspects of the taste and
palatability of a preparation, such as its bitterness,
can be improved by masking bitterness through
techniques such as coatings and inclusion of certain
additives in the preparation3-4
.
As one of its efforts to reduce medical expenses,
the Japanese Government recommends that
medical facilities use generic pharmaceuticals
(generics). An important task for medical personnel
is to select generics that are safe for patients,
efficacious, and highly palatable. Generics contain
the same ingredients as brand-name
pharmaceuticals (brand-name drugs) but they
contain different preservatives, coloring agents, and
excipients, so physicians and pharmacists often
question their quality5. Generics are cheaper than
brand-name drugs and have the same quality.
However, many medical experts feel that there is a
lack of clinical information on the clinical efficacy
and safety of these drugs and inadequate
information on the properties of
preparations6.Thus, this clinical information and
information on the properties of preparations are
crucial to determining whether to dispense a brand-
name drug or a generic. However, assessment of
the taste and palatability of a preparation is
difficult, and a comprehensive evaluation of a
preparation, i.e. whether it tastes good or bad and
whether it is palatable or not, often depends on
human sensory perceptions as gauged by a human
sensory test. A human sensory test directly gauges
human sensory perceptions, so it offers the
Yutaka Inoue et al., World J Pharm Sci 2015; 3(3): 570-579
571
advantage of providing direct information on a
preparation, such as its taste and palatability7-9
.
Thus, information on a preparation, such as its taste
and palatability, can presumably be gauged via a
human sensory test in most instances. However,
assessments of taste and palatability in a human
sensory test are affected by participants‟ sex, age,
and differences in taste due to diet, so uniform,
objective assessment is difficult. An extremely
interesting proposition would be to perform a
human sensory test as well as to objectively assess
the taste and palatability of preparations.
Given a child‟s limited ability to swallow, children
are often prescribed medication in forms that other
patients with limited ability to swallow can take,
such as powders, fine granules, granules, and dry
syrups. The taste and palatability of preparations
for children may affect patient compliance.
However, preparation information such as the taste
and palatability of fine granules for children is
seldom provided in clinical practice. Previous
studies of tulobuterol and teprenone by the current
authors assessed and compared the taste of
pharmaceutical preparations using a human sensory
test and taste sensors. Results of those studies
revealed a correlation between results of a human
sensory test and readings from taste sensors,
indicating the usefulness of human sensory testing
and taste sensors. A correlation between results of
human sensory testing and evaluation of the
physicochemical properties of preparations might
be identified in terms of the taste and palatability of
preparations. Identification of this correlation
would allow objective assessment in place of a
human sensory test and provide a valuable source
of information for clinical practice and
development of preparations.
Loperamide hydrochloride is widely used in
clinical practice. Loperamide hydrochloride is an
antidiarrheal that stimulates the μ- opioid receptors
and inhibits gastrointestinal motility. Loperamide
hydrochloride for use by children is sold in the
form of fine granules and dry syrups. However,
loperamide hydrochloride is a bitter drug. When
given to children, children may refuse to take the
drug because of the taste or palatability, i.e.
bitterness, of a preparation. Thus, children have
less compliance with taking their medication,
reducing its efficacy.
The current study used loperamide hydrochloride
granules and dry syrup for children to examine the
correlation between a human sensory test and the
physicochemical properties of those preparations.
The purpose of the present study was to evaluate
taste by a human sensory test and the
physicochemical properties of loperamide
hydrochloride granules and dry syrup for children
(Preparations A (brand medicine), B and C (generic
medicines).Accordingly, between a human sensory
test and the physicochemical properties of those
preparations examine the correlation via
measurement of particle size distribution,
observation of particle morphology using scanning
electron microscopy (SEM), measurement of sugar
content analysis, and a dissolution test.
MATERIALS AND METHODS
Materials: Three different loperamide
hydrochloride preparations for children were used
in the present study: loperamide hydrochloride in
its original form, Lopemin® Fine Granules for
Children 0.05% (Lot NO. 026AAG, 032BBJ,
Janssen Pharmaceutical K.K., Preparation A), and
in two generic forms, Taiyo® 0.05% Loperamide
HCL (Lot NO. AX1423, BH1193, Teva Pharma
Japan Inc., Preparation B) and Lopecald® Dry
Syrup 0.05% (Lot NO. AS01, Shiono Chemical
Co., Ltd., Preparation C) (Table 1). Loperamide
hydrochloride powder (Lot no. 23922603) from
Wako Pure Chemical Industries, Ltd. was used. All
other reagents were of special reagent grade.
Human gustatory sensation tests: Human
gustatory sensation tests were performed with 41
healthy human volunteers (18 males, 23 females,
mean age: 22.7±3.5 years). This study was fully
explained to potential volunteers and then their
consent was obtained. Volunteers were given 0.2 g
of each preparation in random order and asked to
place it in their mouths. Volunteers then evaluated
the preparation after it remained in their mouths for
15 s. After each evaluation, volunteers immediately
spit out the preparation and gargled with 25 mL of
water. Each subject then evaluated the next
preparation 15 min later to keep their evaluation
from being influenced by the previous preparation.
Evaluation was performed using a structured rating
scale. Volunteers evaluated gustatory sensation
using6 items: "bitterness," "sweetness,"
"solubility," "roughness," "palatability," and
"overall impression" (Scheme1).This experimental
protocol was approved by the Ethics Committee of
Josai University.
Measurement of the intensity of bitterness: The
intensity of bitterness was measured in accordance
with Katsuragi‟s method10-11
. The standard for
bitterness was quinine hydrochloride at
concentrations of 0.01, 0.3, 0.10, 0.30, and 1.0 mM
according to 46 healthy human volunteers (21
males, 25 females, mean age: 22.6±1.2 years). Two
mL of a solution with a varying concentration of
quinine hydrochloride was kept in the mouth for 5
s. After tasting, volunteers scored increasing
Yutaka Inoue et al., World J Pharm Sci 2015; 3(3): 570-579
572
concentrations of the standard solution with scores
of 0,1, 2, 3, and 4. Volunteers evaluated the
bitterness of each preparation after it remained in
their mouths for 15 s. After each evaluation,
volunteers immediately spit out the preparation and
gargled with 25 mL of water. Each subject then
evaluated the next preparation 15 min later to keep
their evaluation from being influenced by the
previous preparation. This experimental protocol
was approved by the Ethics Committee of Josai
University.
Sugar content according to a refractometer: The sugar content of each preparation was
determined with an Atago Master-N1 sugar
refractometer (Atago Co., Ltd., Japan) using
concentrations of 2, 10, and 20 µg/mL.
Measurement of particle size distribution: The
particle size distribution in each preparation was
measured using a dynamic light-scattering
instrument (Malvern Mastersizer Scirocco 2000,
Malvern Instruments Ltd., Worcs, U.K.). The
particle size distribution was characterized using
the mass median diameter d (0.5).
Observation of particle morphology using SEM:
A scanning electron microscope (Hitachi,
modelS3000N, Japan) was used to observe the
surface and shape of the particles in each
preparation. SEM was performed with a metal
coating and a voltage of 15 kV.
Evaluation using a dissolution test: The content
of loperamide hydrochloride in each preparation
was weighed to the mg. A dissolution test was
performed using the paddle method of dissolution
behavior as specified in the 16th edition of the
Japanese Pharmacopoeia. The dissolution medium
was distilled water and a phosphate buffer, pH 6.8
(900 mL, 37±0.5ºC). The rate of agitation of the
paddle was 50 rpm. Standard dissolution was
performed more than 85% in 15 minutes of
loperamide hydrochloride granules in accordance
with guidelines on generic. A phosphate buffer, pH
6.8, was used to simulate dissolution of loperamide
chloride from the preparation in the mouth.
Samples (10 mL) were withdrawn at various time
intervals using a syringe and filtered through a
0.45µm membrane filter. The filtered loperamide
solutions were used as the mobile-phase solution in
HPLC.The drug concentrations in the solution were
determined using HPLC (e2695, Waters Co.,
Japan), and an Inertsil® ODS-3 column (4.6
mm×150 mm, φ5 μm: GL Science, Inc. Japan) was
used. The flow rate was adjusted to about 6
minutes to serve as the retention time for
loperamide hydrochloride. The column temperature
was set at 40ºC, and the injection volume was 100
μL. Loperamide hydrochloride dissolution was
determined using a mobile phase of
phosphate/triethylamine hydrochloride/acetonitrile
(1/45/54, v/v/v). The measurement wavelength for
loperamide hydrochloride dissolution was 214 nm.
Statistical Analysis: Results are presented as
mean±standard deviation, and statistical
significance was evaluated using the Tukey Kramer
Test.
RESULTS
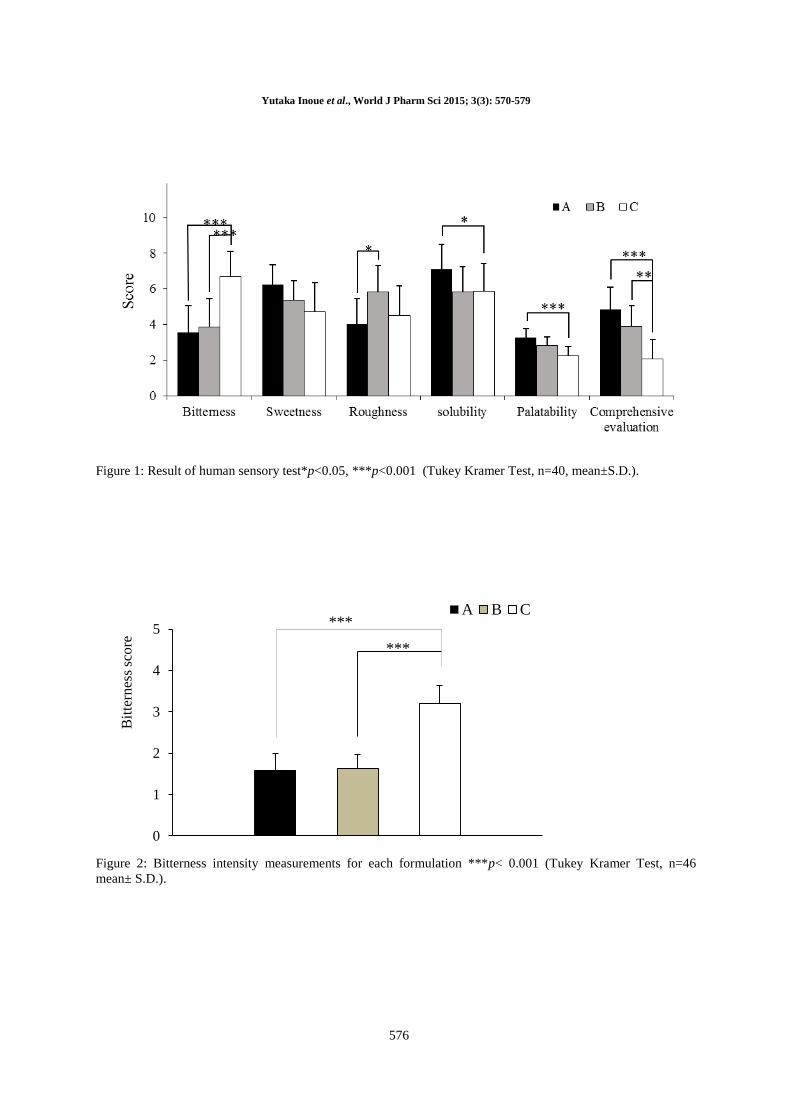
Human gustatory sensation tests: Human
sensory test results for Preparations A, B, and C are
shown in Fig. 1. In the human sensory test,
significant differences in the attributes
“bitterness,”“roughness,”“palatability” and “overall
impression” were noted. Significant differences in
the attribute “sweetness” were not noted.
Preparation C scored highest for the attribute
“bitterness”(bitterness score: 6.7), and significant
differences between that score and scores for
Preparations A and B were noted (p<0.001).
Preparation B scored highest for the attribute
“roughness”(roughness score: 5.8), and significant
differences between that score and scores for
Preparations B and A were noted (p<0.05).
Significant differences between the scores for
Preparations B and C were not noted. Preparation
A scored highest for the attribute “solubility”
(solubility score: 7.1), and significant differences
between that score and scores for Preparations A
and C were noted (p<0.05).Significant differences
between the scores for Preparations A and B were
not noted. Preparation A scored the highest for the
attribute “palatability” (palatability score: 3.3), and
significant differences between that score and
scores for Preparations A and C were noted
(p<0.001). Preparation A scored highest for the
attribute “overall impression”(overall impression
score: 4.8), followed by Preparation B (overall
impression score: 3.9) and then Preparation C
(overall impression score: 2.1). Preparation Chad
the lowest overall impression score. Significant
differences between that score and scores for
Preparation A (p<0.001) and Preparation B(p<0.01)
were noted.
Measurements of the intensity of the bitterness of
Preparations A, B, and C are indicated. Preparation
Chad the most intense bitterness (bitterness score:
3.20) while Preparations A and B had equivalent
bitterness scores (about 1.6). Significant
differences in the score for Preparation C and
scores for Preparations A and B were noted
(p<0.001). Significant differences in the scores for
Preparations A and B were not noted.
Yutaka Inoue et al., World J Pharm Sci 2015; 3(3): 570-579
573
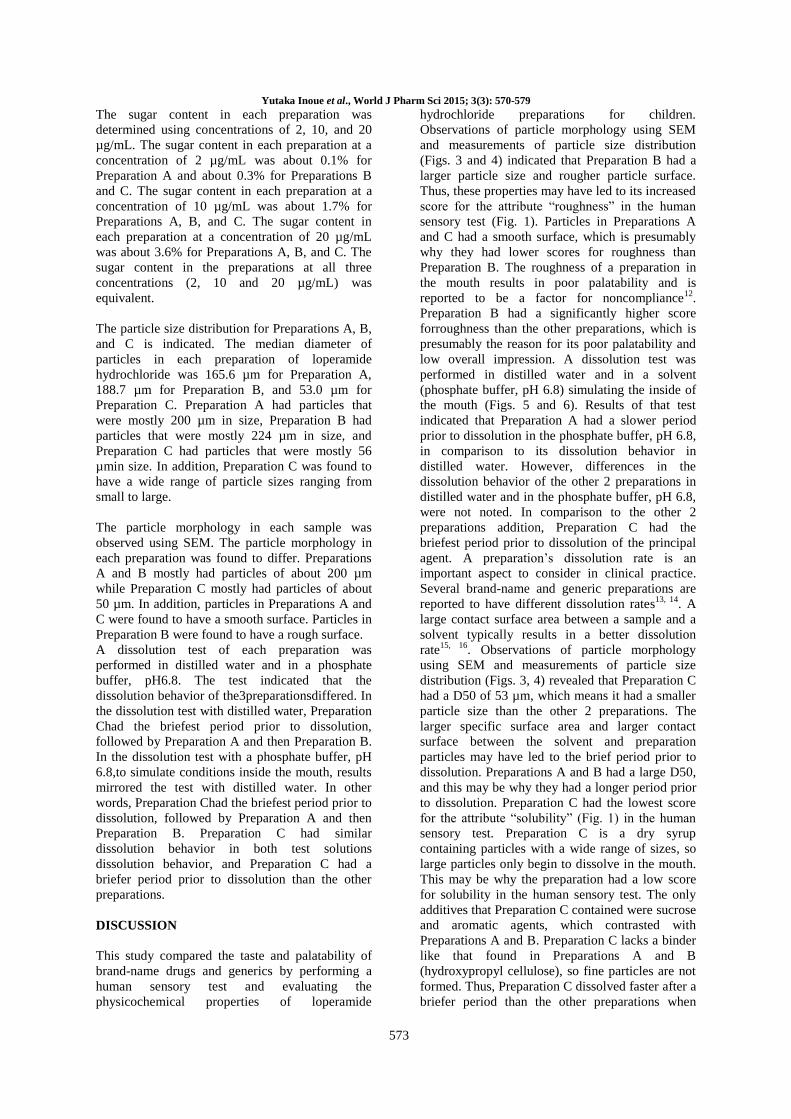
The sugar content in each preparation was
determined using concentrations of 2, 10, and 20
µg/mL. The sugar content in each preparation at a
concentration of 2 µg/mL was about 0.1% for
Preparation A and about 0.3% for Preparations B
and C. The sugar content in each preparation at a
concentration of 10 µg/mL was about 1.7% for
Preparations A, B, and C. The sugar content in
each preparation at a concentration of 20 µg/mL
was about 3.6% for Preparations A, B, and C. The
sugar content in the preparations at all three
concentrations (2, 10 and 20 µg/mL) was
equivalent.
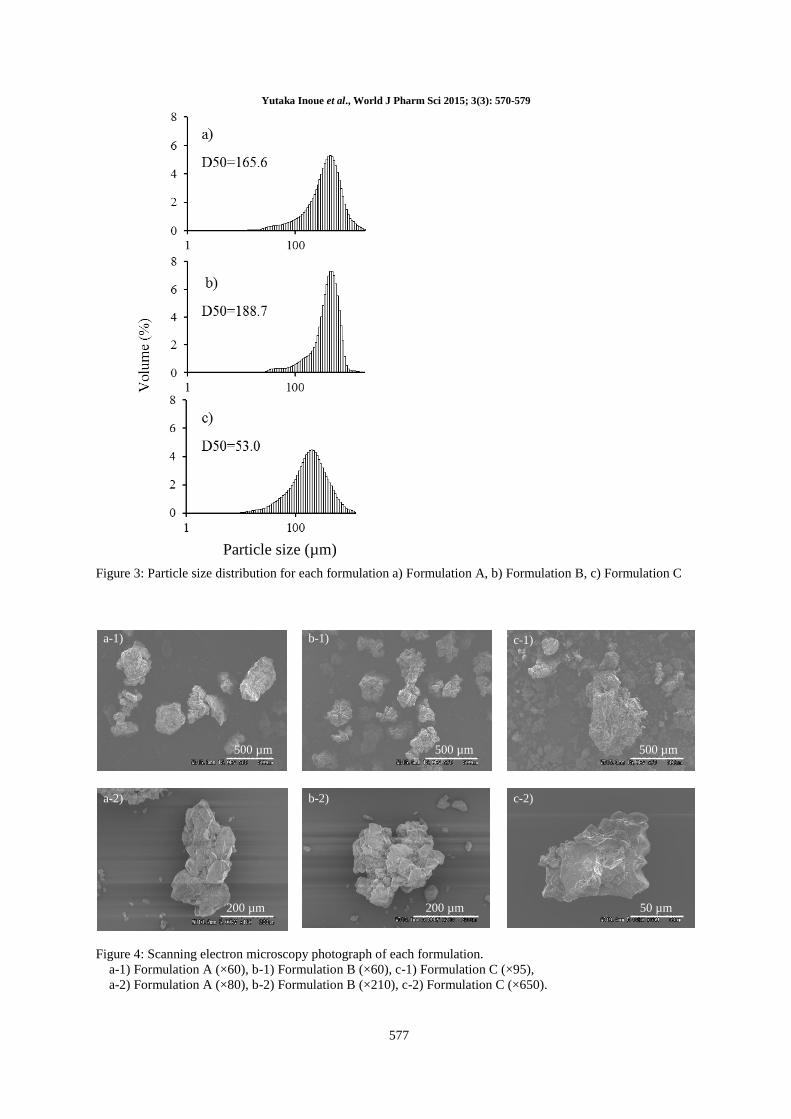
The particle size distribution for Preparations A, B,
and C is indicated. The median diameter of
particles in each preparation of loperamide
hydrochloride was 165.6 µm for Preparation A,
188.7 µm for Preparation B, and 53.0 µm for
Preparation C. Preparation A had particles that
were mostly 200 µm in size, Preparation B had
particles that were mostly 224 µm in size, and
Preparation C had particles that were mostly 56
µmin size. In addition, Preparation C was found to
have a wide range of particle sizes ranging from
small to large.
The particle morphology in each sample was
observed using SEM. The particle morphology in
each preparation was found to differ. Preparations
A and B mostly had particles of about 200 µm
while Preparation C mostly had particles of about
50 µm. In addition, particles in Preparations A and
C were found to have a smooth surface. Particles in
Preparation B were found to have a rough surface.
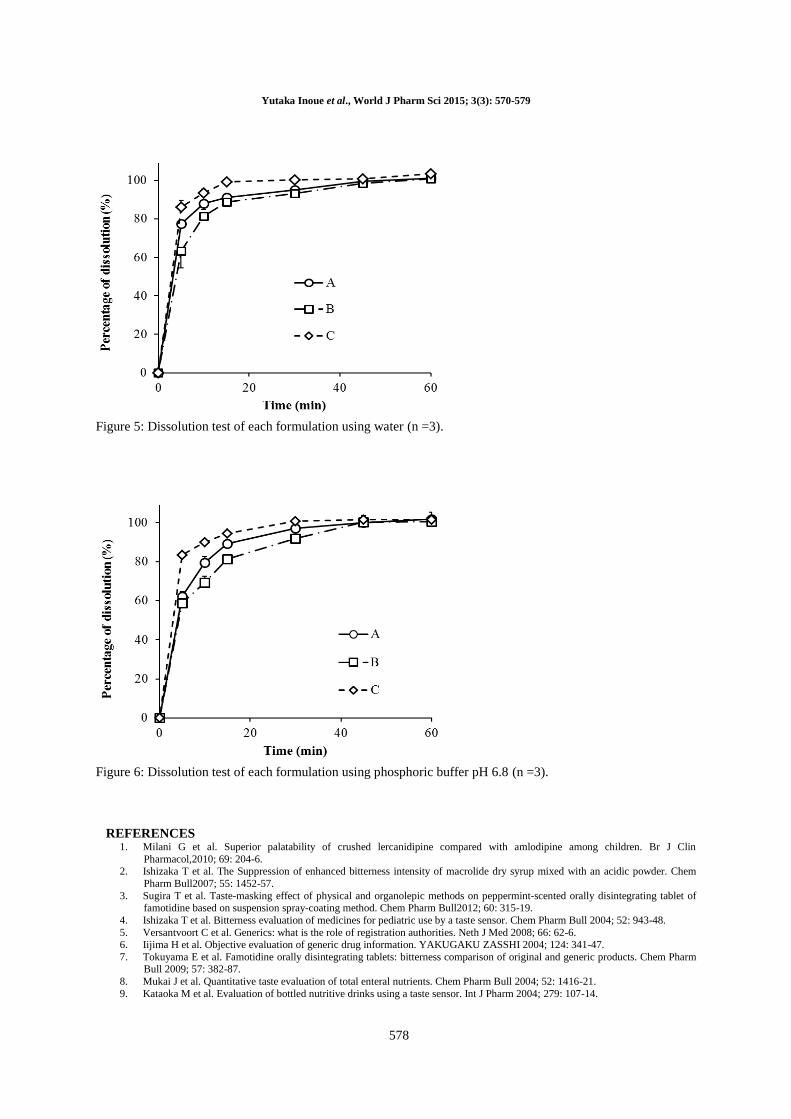
A dissolution test of each preparation was
performed in distilled water and in a phosphate
buffer, pH6.8. The test indicated that the
dissolution behavior of the3preparationsdiffered. In
the dissolution test with distilled water, Preparation
Chad the briefest period prior to dissolution,
followed by Preparation A and then Preparation B.
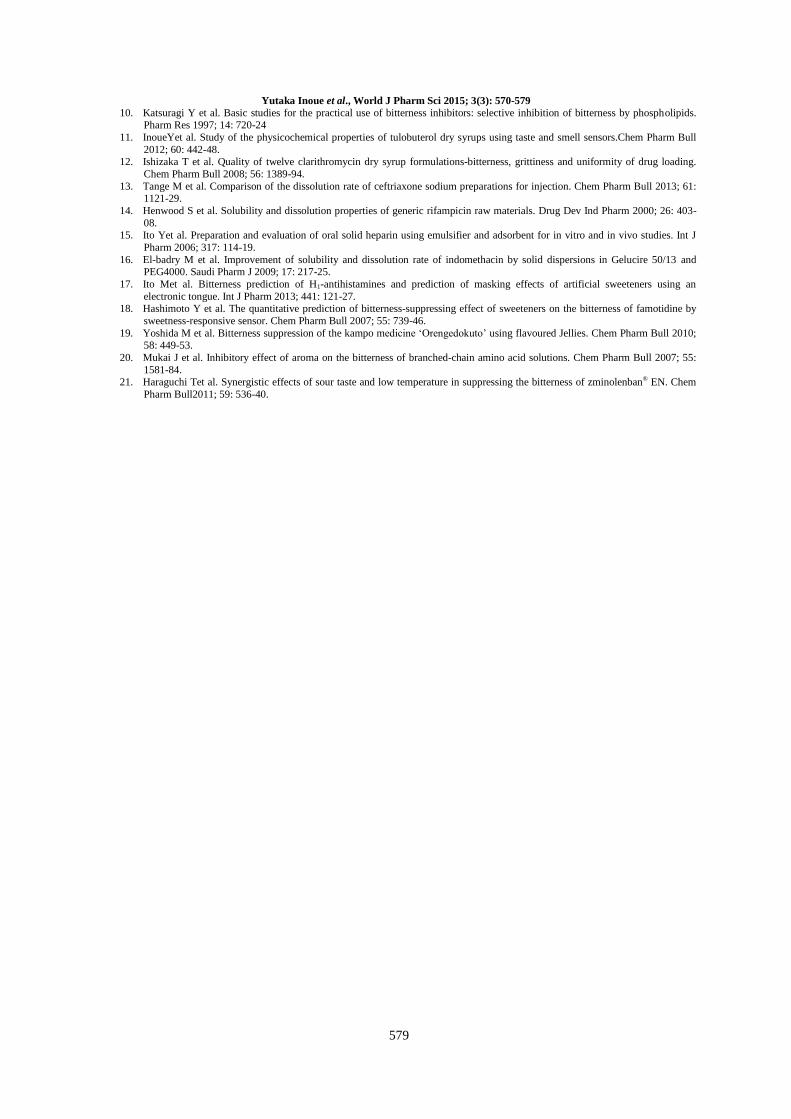
In the dissolution test with a phosphate buffer, pH
6.8,to simulate conditions inside the mouth, results
mirrored the test with distilled water. In other
words, Preparation Chad the briefest period prior to
dissolution, followed by Preparation A and then
Preparation B. Preparation C had similar
dissolution behavior in both test solutions
dissolution behavior, and Preparation C had a
briefer period prior to dissolution than the other
preparations.
DISCUSSION
This study compared the taste and palatability of
brand-name drugs and generics by performing a
human sensory test and evaluating the
physicochemical properties of loperamide
hydrochloride preparations for children.
Observations of particle morphology using SEM
and measurements of particle size distribution
(Figs. 3 and 4) indicated that Preparation B had a
larger particle size and rougher particle surface.
Thus, these properties may have led to its increased
score for the attribute “roughness” in the human
sensory test (Fig. 1). Particles in Preparations A
and C had a smooth surface, which is presumably
why they had lower scores for roughness than
Preparation B. The roughness of a preparation in
the mouth results in poor palatability and is
reported to be a factor for noncompliance12
.
Preparation B had a significantly higher score
forroughness than the other preparations, which is
presumably the reason for its poor palatability and
low overall impression. A dissolution test was
performed in distilled water and in a solvent
(phosphate buffer, pH 6.8) simulating the inside of
the mouth (Figs. 5 and 6). Results of that test
indicated that Preparation A had a slower period
prior to dissolution in the phosphate buffer, pH 6.8,
in comparison to its dissolution behavior in
distilled water. However, differences in the
dissolution behavior of the other 2 preparations in
distilled water and in the phosphate buffer, pH 6.8,
were not noted. In comparison to the other 2
preparations addition, Preparation C had the
briefest period prior to dissolution of the principal
agent. A preparation‟s dissolution rate is an
important aspect to consider in clinical practice.
Several brand-name and generic preparations are
reported to have different dissolution rates13, 14
. A
large contact surface area between a sample and a
solvent typically results in a better dissolution
rate15, 16
. Observations of particle morphology
using SEM and measurements of particle size
distribution (Figs. 3, 4) revealed that Preparation C
had a D50 of 53 µm, which means it had a smaller
particle size than the other 2 preparations. The
larger specific surface area and larger contact
surface between the solvent and preparation
particles may have led to the brief period prior to
dissolution. Preparations A and B had a large D50,
and this may be why they had a longer period prior
to dissolution. Preparation C had the lowest score
for the attribute “solubility” (Fig. 1) in the human
sensory test. Preparation C is a dry syrup
containing particles with a wide range of sizes, so
large particles only begin to dissolve in the mouth.
This may be why the preparation had a low score
for solubility in the human sensory test. The only
additives that Preparation C contained were sucrose
and aromatic agents, which contrasted with
Preparations A and B. Preparation C lacks a binder
like that found in Preparations A and B
(hydroxypropyl cellulose), so fine particles are not
formed. Thus, Preparation C dissolved faster after a
briefer period than the other preparations when

Yutaka Inoue et al., World J Pharm Sci 2015; 3(3): 570-579
574
subjected to the paddle. Thus, the principal agent in
Preparation C dissolves quickly under conditions
like those inside the mouth. Faster dissolution of
loperamide may account for the bitterness of that
preparation. This is presumably why Preparation C
had the highest score for the attribute “bitterness”
in the human sensory test. Significant differences
in the attribute “sweetness” (Fig. 1) of
the3preparationsin the human sensory test were not
noted. Measurements of sugar content (Table 2)
also indicated that the preparations had almost the
same sugar content. The sweetening agent
contained in a preparation is reported to help mask
bitterness. How effectively bitterness is masked
may differ depending on the type of sweetening
agentadded17, 18
. Preparations A, B, and C all had
sucrose as a sweetening agent (an excipient).
Addition of sucrose as a sweetening agent
presumably led to the lack of difference in how
effectively bitterness was inhibited. However,
Preparation C had a significantly higher score for
the attribute “bitterness” (Fig. 1) in the human
sensory test and more intense bitterness (Fig. 2)
than the other preparations. The taste of a
preparation is reported to change as a result of
dissolution of bitter ingredients in the preparation
and the sweetness, flavor, and aroma of additives17-
20. Adding a sour aromatic agent and sourness to a
bitter preparation is reported to reduce the
preparation‟s bitterness and increase its
palatability21
. Thus, a citrus aroma had been added
to Preparation A, adding sourness to the principal
agent and lessening bitterness. Preparation B
included sodium citrate, which may have directly
led to the sourness of the preparation and its
reduced bitterness. In contrast, Preparation C had
only sucrose and aromatic agents to mask
bitterness, making it much less effective at masking
bitterness than the other preparations. This may be
which its bitterness was most apparent. Thus,
Preparation C had significantly more intense
bitterness than the other 2 preparations, resulting in
its poor palatability and low overall impression
score in the human sensory test. Of the
preparations, Preparation C had the poorest
palatability and lowest overall impression score.
CONCLUSION
A human sensory test was performed and the
physicochemical properties of loperamide
hydrochloride preparations for children were
evaluated. Among the attributes assessed in the
human sensory test, “sweetness,”“roughness,”and
“solubility” were found to be correlated with
assessed physicochemical properties. In addition,
the attribute “bitterness” in the human sensory test
was found to be correlated with measurement of
the intensity of bitterness using quinine
hydrochloride. Masked bitterness and improved
palatability are major factors that affect the
treatment of children and patient compliance.
Ascertaining information on a preparation‟s
properties can provide valuable information to
improve patient compliance with medication, assist
medical personnel, and help with development of
preparations. This information can help with a wide
range of treatments tailored to those requirements
in clinical settings. In order to give pharmaceuticals
appropriately, pharmacists must pay close attention
to principal agents and additives as well as the
characteristics of preparations and dispense those
preparations accordingly.
ACKNOWLEDGEMENT
The authors wish to express sincere thanks to
students at Josai University who cooperated in
human sensory testing as part of this study.
CONFLICTS OF INTEREST
This study was conducted fairly and impartially
and ethical considerations were taken into account.
The authors have no relationships with any
companies or other commercial entities mentioned
in this paper.
Table 1: Additives of each formulation
Formulation Product name Additives
A LOPEMIN®
Fine Granules
for Children 0.05%
Sucrose, Magnesium aluminometasilicate,
Light anhydrous silicic acid, Magnesium stearate,
Hydroxypropyl cellulose (HPC), Carmellose calcium,
Sunset yellow FCF, Flavour
B LOPERAMIDE HCL®
0.05%「TAIYO」
Sucrose, Corn starch, Hydrated silicon dioxide, HPC,
Carmellose calcium, Sodium citrate hydrate,
Propylene glycol, sunset yellow FCF, Flavour
C LOPECALD®
DS 0.05% White soft sugar, Flavour
Yutaka Inoue et al., World J Pharm Sci 2015; 3(3): 570-579
575
Table 2:. Brix measurement of each formulation
Formulation Concentration of Loperamide (µg/mL)
2
10
20
A 0.11 ± 0.01% 1.69 ± 0.03% 3.68 ± 0.03%
B 0.30 ± 0.04% 1.70 ± 0.03% 3.61 ± 0.03%
C 0.37 ± 0.03% 1.70 ± 0.03% 3.60 ± 0.04%
n=4 mean±S.D
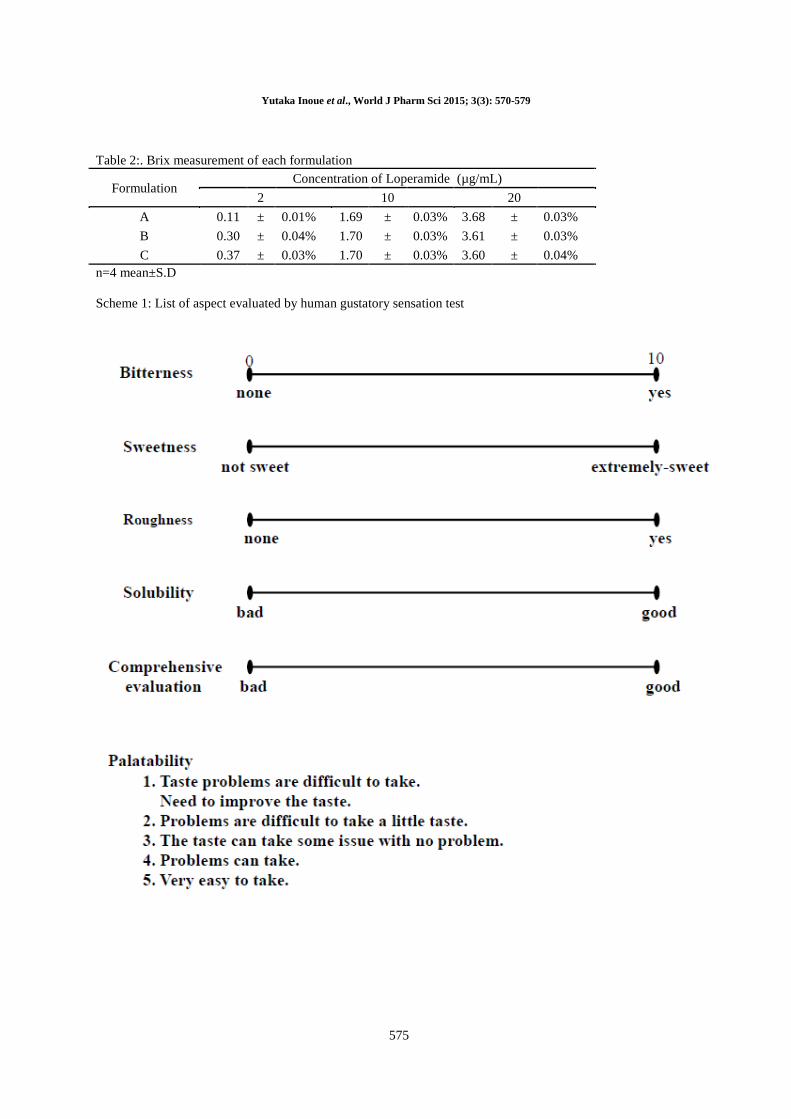
Scheme 1: List of aspect evaluated by human gustatory sensation test
Yutaka Inoue et al., World J Pharm Sci 2015; 3(3): 570-579
576
Figure 1: Result of human sensory test*p<0.05, ***p<0.001 (Tukey Kramer Test, n=40, mean±S.D.).
0
1
2
3
4
5
Bit
tern
ess
sco
re
A B C***
***
Figure 2: Bitterness intensity measurements for each formulation ***p< 0.001 (Tukey Kramer Test, n=46
mean± S.D.).
Yutaka Inoue et al., World J Pharm Sci 2015; 3(3): 570-579
577
Figure 3: Particle size distribution for each formulation a) Formulation A, b) Formulation B, c) Formulation C
a-1)
500 µm
b-1)
500 µm
c-1)
500 µm
a-2) b-2) c-2)
200 µm 200 µm 50 µm
Figure 4: Scanning electron microscopy photograph of each formulation.
a-1) Formulation A (×60), b-1) Formulation B (×60), c-1) Formulation C (×95),
a-2) Formulation A (×80), b-2) Formulation B (×210), c-2) Formulation C (×650).
Particle size (µm)
Yutaka Inoue et al., World J Pharm Sci 2015; 3(3): 570-579
578
Figure 5: Dissolution test of each formulation using water (n =3).
Figure 6: Dissolution test of each formulation using phosphoric buffer pH 6.8 (n =3).
REFERENCES 1. Milani G et al. Superior palatability of crushed lercanidipine compared with amlodipine among children. Br J Clin
Pharmacol,2010; 69: 204-6. 2. Ishizaka T et al. The Suppression of enhanced bitterness intensity of macrolide dry syrup mixed with an acidic powder. Chem
Pharm Bull2007; 55: 1452-57.
3. Sugira T et al. Taste-masking effect of physical and organolepic methods on peppermint-scented orally disintegrating tablet of famotidine based on suspension spray-coating method. Chem Pharm Bull2012; 60: 315-19.
4. Ishizaka T et al. Bitterness evaluation of medicines for pediatric use by a taste sensor. Chem Pharm Bull 2004; 52: 943-48.
5. Versantvoort C et al. Generics: what is the role of registration authorities. Neth J Med 2008; 66: 62-6. 6. Iijima H et al. Objective evaluation of generic drug information. YAKUGAKU ZASSHI 2004; 124: 341-47.
7. Tokuyama E et al. Famotidine orally disintegrating tablets: bitterness comparison of original and generic products. Chem Pharm Bull 2009; 57: 382-87.
8. Mukai J et al. Quantitative taste evaluation of total enteral nutrients. Chem Pharm Bull 2004; 52: 1416-21.
9. Kataoka M et al. Evaluation of bottled nutritive drinks using a taste sensor. Int J Pharm 2004; 279: 107-14.
Yutaka Inoue et al., World J Pharm Sci 2015; 3(3): 570-579
579
10. Katsuragi Y et al. Basic studies for the practical use of bitterness inhibitors: selective inhibition of bitterness by phospholipids. Pharm Res 1997; 14: 720-24
11. InoueYet al. Study of the physicochemical properties of tulobuterol dry syrups using taste and smell sensors.Chem Pharm Bull
2012; 60: 442-48. 12. Ishizaka T et al. Quality of twelve clarithromycin dry syrup formulations-bitterness, grittiness and uniformity of drug loading.
Chem Pharm Bull 2008; 56: 1389-94.
13. Tange M et al. Comparison of the dissolution rate of ceftriaxone sodium preparations for injection. Chem Pharm Bull 2013; 61: 1121-29.
14. Henwood S et al. Solubility and dissolution properties of generic rifampicin raw materials. Drug Dev Ind Pharm 2000; 26: 403-
08. 15. Ito Yet al. Preparation and evaluation of oral solid heparin using emulsifier and adsorbent for in vitro and in vivo studies. Int J
Pharm 2006; 317: 114-19.
16. El-badry M et al. Improvement of solubility and dissolution rate of indomethacin by solid dispersions in Gelucire 50/13 and PEG4000. Saudi Pharm J 2009; 17: 217-25.
17. Ito Met al. Bitterness prediction of H1-antihistamines and prediction of masking effects of artificial sweeteners using an
electronic tongue. Int J Pharm 2013; 441: 121-27. 18. Hashimoto Y et al. The quantitative prediction of bitterness-suppressing effect of sweeteners on the bitterness of famotidine by
sweetness-responsive sensor. Chem Pharm Bull 2007; 55: 739-46.
19. Yoshida M et al. Bitterness suppression of the kampo medicine „Orengedokuto‟ using flavoured Jellies. Chem Pharm Bull 2010; 58: 449-53.
20. Mukai J et al. Inhibitory effect of aroma on the bitterness of branched-chain amino acid solutions. Chem Pharm Bull 2007; 55:
1581-84. 21. Haraguchi Tet al. Synergistic effects of sour taste and low temperature in suppressing the bitterness of zminolenban® EN. Chem
Pharm Bull2011; 59: 536-40.
Related Documents