Morbidity and Mortality Weekly Report Weekly / Vol. 59 / No. 48 December 10, 2010 Centers for Disease Control and Prevention www.cdc.gov/mmwr U.S. DEPARTMENT OF HEALTH AND HUMAN SERVICES Paragonimiasis is a parasitic disease caused by Paragonimus trematodes, commonly known as lung flukes. Humans become infected by eating raw or undercooked crayfish (also known as crawfish and crawdads) or freshwater crabs that harbor the parasites. Paragonimiasis most frequently involves the lungs, but can affect other organs, including the brain and skin. In North America, Paragonimus kellicotti causes infections among dogs, cats, and wild carnivores, but rarely infects humans (1). Paragonimiasis is not a nationally notifiable condition. In September 2009, physicians from the Washington University School of Medicine (WUSM) in St. Louis published details of three paragonimiasis cases diagnosed since July 2006 in persons who had eaten raw crayfish from rivers in Missouri (2), prompting the Missouri Department of Health and Senior Services (MDHSS), CDC, and WUSM to collaborate in paragonimiasis surveillance and prevention. During September 2009–September 2010, six additional cases were diagnosed in Missouri. ese nine patients, aged 10−32 years, had fever, cough, pleural effusion, and eosinophilia. All had eaten raw or undercooked crayfish from rivers in Missouri while on canoeing or camping trips within 4 months of illness onset. Health-care providers should consider paragonimiasis when examining patients with unexplained fever, cough, eosinophilia, and pleural effusion or other chest radiographic abnormalities and should ask those patients whether they have eaten raw or undercooked crayfish. e WUSM article (2) and reports of two paragonimia- sis cases in October 2009 prompted MDHSS, the Missouri Department of Natural Resources, and the Missouri Division of Tourism to distribute posters warning against eating raw or undercooked crayfish to campers and canoe outfitters in November 2009. After the sixth case was reported in April 2010, MDHSS issued a health advisory on April 30 to enhance health-care provider awareness about paragonimiasis and to request voluntary reporting of cases. MDHSS developed an investigation form and revised the Missouri Health Surveillance Information System for reporting of paragonimiasis. In May, WUSM issued a press release to publicize the series of six cases, resulting in an additional patient (patient 7) seeking evalua- tion in June, 10 months after illness onset and after having undergone multiple diagnostic tests and failed treatments. In September, a medical center in northwest Missouri reported the other two cases. Clinical information and exposure histories were collected through medical record review and interviews of patients and the parents of a patient by attending physicians. Sputum, stool, pleural effusion, and lung biopsies, if available, were examined microscopically for Paragonimus parasites or eggs. Serum samples were tested for Paragonimus antibodies by enzyme-linked immu- nosorbent assay (ELISA) at a commercial laboratory or by immu- noblot assay at CDC. Seven patients lived in Missouri and two in Illinois (Table). All nine patients had eaten raw or undercooked crayfish directly taken from rivers in Missouri (i.e., Current, Jacks Fork, Huzzah, Little Niangua, and Meramec) while canoeing or camping within the months of May–August during 2006–2010. Among the eight adults, seven had eaten raw crayfish during group canoe trips, and the other had eaten undercooked crayfish while camping. Seven adults had eaten raw or undercooked crayfish after alcohol consumption; two had eaten raw crayfish on dares. e child had eaten a small raw crayfish while camping to demonstrate outdoor survival skills to other children. Human Paragonimiasis After Eating Raw or Undercooked Crayfish — Missouri, July 2006−September 2010 INSIDE 1577 Nonpolio Enterovirus and Human Parechovirus Surveillance — United States, 2006–2008 1581 Progress Toward Poliomyelitis Eradication — India, January 2009–October 2010 1586 Update: Outbreak of Cholera — Haiti, 2010 1591 Notice to Readers 1592 QuickStats

Welcome message from author
This document is posted to help you gain knowledge. Please leave a comment to let me know what you think about it! Share it to your friends and learn new things together.
Transcript

Morbidity and Mortality Weekly Report
Weekly / Vol. 59 / No. 48 December 10, 2010
Centers for Disease Control and Preventionwww.cdc.gov/mmwr
U.S. DEPARTMENT OF HEALTH AND HUMAN SERVICES
Paragonimiasis is a parasitic disease caused by Paragonimus trematodes, commonly known as lung flukes. Humans become infected by eating raw or undercooked crayfish (also known as crawfish and crawdads) or freshwater crabs that harbor the parasites. Paragonimiasis most frequently involves the lungs, but can affect other organs, including the brain and skin. In North America, Paragonimus kellicotti causes infections among dogs, cats, and wild carnivores, but rarely infects humans (1). Paragonimiasis is not a nationally notifiable condition. In September 2009, physicians from the Washington University School of Medicine (WUSM) in St. Louis published details of three paragonimiasis cases diagnosed since July 2006 in persons who had eaten raw crayfish from rivers in Missouri (2), prompting the Missouri Department of Health and Senior Services (MDHSS), CDC, and WUSM to collaborate in paragonimiasis surveillance and prevention. During September 2009–September 2010, six additional cases were diagnosed in Missouri. These nine patients, aged 10−32 years, had fever, cough, pleural effusion, and eosinophilia. All had eaten raw or undercooked crayfish from rivers in Missouri while on canoeing or camping trips within 4 months of illness onset. Health-care providers should consider paragonimiasis when examining patients with unexplained fever, cough, eosinophilia, and pleural effusion or other chest radiographic abnormalities and should ask those patients whether they have eaten raw or undercooked crayfish.
The WUSM article (2) and reports of two paragonimia-sis cases in October 2009 prompted MDHSS, the Missouri Department of Natural Resources, and the Missouri Division of Tourism to distribute posters warning against eating raw or undercooked crayfish to campers and canoe outfitters in November 2009. After the sixth case was reported in April 2010, MDHSS issued a health advisory on April 30 to enhance health-care provider awareness about paragonimiasis and to request voluntary reporting of cases. MDHSS developed an investigation form and revised the Missouri Health Surveillance
Information System for reporting of paragonimiasis. In May, WUSM issued a press release to publicize the series of six cases, resulting in an additional patient (patient 7) seeking evalua-tion in June, 10 months after illness onset and after having undergone multiple diagnostic tests and failed treatments. In September, a medical center in northwest Missouri reported the other two cases.
Clinical information and exposure histories were collected through medical record review and interviews of patients and the parents of a patient by attending physicians. Sputum, stool, pleural effusion, and lung biopsies, if available, were examined microscopically for Paragonimus parasites or eggs. Serum samples were tested for Paragonimus antibodies by enzyme-linked immu-nosorbent assay (ELISA) at a commercial laboratory or by immu-noblot assay at CDC. Seven patients lived in Missouri and two in Illinois (Table). All nine patients had eaten raw or undercooked crayfish directly taken from rivers in Missouri (i.e., Current, Jacks Fork, Huzzah, Little Niangua, and Meramec) while canoeing or camping within the months of May–August during 2006–2010. Among the eight adults, seven had eaten raw crayfish during group canoe trips, and the other had eaten undercooked crayfish while camping. Seven adults had eaten raw or undercooked crayfish after alcohol consumption; two had eaten raw crayfish on dares. The child had eaten a small raw crayfish while camping to demonstrate outdoor survival skills to other children.
Human Paragonimiasis After Eating Raw or Undercooked Crayfish — Missouri, July 2006−September 2010
INSIDE1577 Nonpolio Enterovirus and Human Parechovirus
Surveillance — United States, 2006–20081581 Progress Toward Poliomyelitis Eradication — India,
January 2009–October 20101586 Update: Outbreak of Cholera — Haiti, 20101591 Notice to Readers1592 QuickStats

The MMWR series of publications is published by the Office of Surveillance, Epidemiology, and Laboratory Services, Centers for Disease Control and Prevention (CDC), U.S. Department of Health and Human Services, Atlanta, GA 30333.Suggested citation: Centers for Disease Control and Prevention. [Article title]. MMWR 2010;59:[inclusive page numbers].
Centers for Disease Control and PreventionThomas R. Frieden, MD, MPH, Director
Harold W. Jaffe, MD, MA, Associate Director for ScienceJames W. Stephens, PhD, Office of the Associate Director for Science
Stephen B. Thacker, MD, MSc, Deputy Director for Surveillance, Epidemiology, and Laboratory ServicesStephanie Zaza, MD, MPH, Director, Epidemiology and Analysis Program Office
MMWR Editorial and Production StaffRonald L. Moolenaar, MD, MPH, Editor, MMWR Series
Virginia A. Caine, MD, Indianapolis, INJonathan E. Fielding, MD, MPH, MBA, Los Angeles, CA
David W. Fleming, MD, Seattle, WAWilliam E. Halperin, MD, DrPH, MPH, Newark, NJ
King K. Holmes, MD, PhD, Seattle, WADeborah Holtzman, PhD, Atlanta, GA
John K. Iglehart, Bethesda, MDDennis G. Maki, MD, Madison, WI
John S. Moran, MD, MPH, Deputy Editor, MMWR SeriesRobert A. Gunn, MD, MPH, Associate Editor, MMWR Series
Teresa F. Rutledge, Managing Editor, MMWR SeriesDouglas W. Weatherwax, Lead Technical Writer-Editor
Donald G. Meadows, MA, Jude C. Rutledge, Writer-Editors
Martha F. Boyd, Lead Visual Information SpecialistMalbea A. LaPete, Julia C. Martinroe, Stephen R. Spriggs, Terraye M. Starr
Visual Information SpecialistsQuang M. Doan, MBA, Phyllis H. King
Information Technology Specialists
Patricia Quinlisk, MD, MPH, Des Moines, IAPatrick L. Remington, MD, MPH, Madison, WI
Barbara K. Rimer, DrPH, Chapel Hill, NCJohn V. Rullan, MD, MPH, San Juan, PR
William Schaffner, MD, Nashville, TNAnne Schuchat, MD, Atlanta, GA
Dixie E. Snider, MD, MPH, Atlanta, GAJohn W. Ward, MD, Atlanta, GA
MMWR Editorial BoardWilliam L. Roper, MD, MPH, Chapel Hill, NC, Chairman
MMWR Morbidity and Mortality Weekly Report
1574 MMWR / December 10, 2010 / Vol. 59 / No. 48
Illness onset ranged from 2−16 weeks after cray-fish ingestion. Common signs and symptoms were fever (100%), cough (100%), weight loss (56%), malaise (56%), chest pain (44%), dyspnea (44%), myalgia (44%), and night sweats (44%). Cough was not among the earliest indicators for patients 1, 4, and 7. Patient 1 experienced fever and headache 3 weeks before the onset of mild nonproductive cough. Two patients (patients 4 and 7) experienced upper-abdominal pain 6−8 weeks after crayfish ingestion. Patient 4 underwent emergency cholecystectomy for suspected acute cholecystitis, but his resected gall
bladder was normal. Patient 7 experienced acute chest pain 2 weeks after experiencing abdominal pain. In addition, patient 8 experienced bilateral spontane-ous pneumothoraces 3 weeks after the onset of fever, dyspnea, and nonproductive cough. These clinical manifestations likely were caused by P. kellicotti migration through the diaphragm into the pleural space and lungs.
During routine clinical care, all patients received a presumptive diagnosis of paragonimiasis 3−45 weeks after illness onset. All had eosinophilia (range: 850−3,900 eosinophils/mm3; eosinophil percentage:
TABLE. Characteristics of nine patients with paragonimiasis — Missouri, July 2006−September 2010
PatientAge (yrs) Sex
Crayfish ingestionIncubation
period (wks)
Onset to diagnosis
(wks) Basis of diagnosisDate Source river
1 31 Male Jun 2006 Jacks Fork and Current
2 3 Clinical history and findings, and response to therapy; IB negative
2 26 Female Jul 2007 Meramec 2 12 ELISA positive3 32 Male Aug 2007 Current 3 12 ELISA positive4 28 Male Jun 2009 Huzzah 8 12 ELISA positive; IB negative5 10 Male May 2009 Current 16 3 Clinical history and findings, and response to therapy; IB negative6 20 Male Jun 2009 Jacks Fork 12 36 IB positive7 22 Male Aug 2009 Jacks Fork 6 40 Sputum cytology, IB positive8 18 Male Jun 2010 Jacks Fork 3 10 IB positive9 27 Male Aug 2009 Little Niangua 12 45 Bronchoalveolar lavage fluid cytology, IB positive
Abbreviations: ELISA = enzyme-linked immunosorbent assay; IB = immunoblot assay.

MMWR Morbidity and Mortality Weekly Report
MMWR / December 10, 2010 / Vol. 59 / No. 48 1575
7%−40%) and pleural effusion. Pleural effusions were analyzed for six patients. Five patients had eosinophilic pleural effusion, defined as a pleural effusion with ≥10% eosinophils (eosinophil percentage: 44%−90%; normal: ≤3%). Other chest radiologic abnormalities included pulmonary nodules (four patients), pericar-dial effusion (three patients), pulmonary infiltrates (three patients), and pneumothorax (one patient). Extrapulmonary complications included migratory skin nodules (four patients), cardiac tamponade (one patient), and cerebral lesions (one patient) associated with blurred vision.
P. kellicotti eggs were identified in sputum or bronchoalveolar lavage fluid from two patients 40–45 weeks after illness onset. Paragonimus antibodies were positive by ELISA or immunoblot for seven patients (Table). Among seven patients (patients 1 and 4−9) whose serum samples were tested for Paragonimus antibodies by immunoblot, three (patients 1, 4, and 5) tested negative in two consecutive serum samples col-lected ≥1 month apart. An acute serum from patient 4 was tested by ELISA; the result was positive. Patients 1 and 5 were diagnosed on the basis of their clinical histories and findings and response to therapy.
All patients were treated with 75 mg praziquantel per kilogram of body weight in 3 divided doses for 2–3 days. Their symptoms promptly improved. All symptoms, eosinophilia, and radiographic abnormali-ties resolved within 1−3 months of treatment.
Reported by
SL Patrick, PhD, G Turabelidze, MD, H Marx, A Grim, MPH, Missouri Dept of Health and Senior Svcs; MA Lane, MD, GJ Weil, MD, TC Bailey, MD, NF Önen, MD, Infectious Disease Div; LM Demertzis, MD, PG Tuteur, MD, Pulmonary Div, Dept of Medi-cine, EV Hayes MD, SZ Davila, MD, Dept of Pedi-atrics, Washington Univ School of Medicine, St. Louis; SM Folk, MD, RE Mitchem, DO, E Kammerer, MD, Heartland Regional Medical Center, St. Joseph, Mis-souri. LP Fannon Jr, Atlanta Research and Education Foundation, Georgia. JL Jones, MD, PP Wilkins, PhD, Div of Parasitic Diseases and Malaria, Center for Global Health; YC Lo, MD, EIS Officer, CDC.
Editorial Note
During 1965–2007, only six other cases of non-imported paragonimiasis were reported in the United States, occurring in Colorado, Iowa, Michigan, Missouri, and Oklahoma. Among those six patients,
five had eaten crayfish (3−8). This report of nine cases recently identified in Missouri highlights the need for increased awareness of this underrecognized disease and public education to prevent it.
The life cycle of P. kellicotti requires two intermedi-ate hosts. The first intermediate host is a snail (e.g., Pomatiopsis lapidaria), and the second is crayfish, principally Cambarus spp. (1). After humans eat raw or undercooked crayfish that harbor P. kellicotti, the parasite penetrates through the intestinal wall into the peritoneal cavity, then through the diaphragm into the pleural space and lungs, and can migrate to other organs, including the brain and skin. Eggs laid in lungs are excreted in sputum, or swallowed and passed with stool. Paragonimus species are endemic in Africa, the Americas, and Asia, but the distribution of P. kellicotti is still being determined (1).
Behavioral factors that led patients in this report to eat raw or undercooked crayfish included alcohol consumption, dares, and demonstration of survival skills. Eight of the nine patients were males. Although crayfish commonly is regarded as food in survival situations, persons who learn or practice survival skills should be cautioned that eating raw or undercooked crayfish carries a risk for paragonimiasis and other diseases (9). Owners and customers of campgrounds and canoe rental businesses should be alerted to thoroughly cook crayfish before eating. The Food and
What is already known on this topic?
Paragonimiasis, a rare parasitic disease in the United States, is caused by Paragonimus trematodes (lung flukes) that infect humans who eat raw or under-cooked crayfish or freshwater crabs that harbor the parasites.
What is added by this report?
During July 2006–September 2010, nine cases of paragonimiasis were identified by physicians within 4 months of illness onset in patients who had eaten raw or undercooked crayfish from rivers in Missouri while canoeing or camping.
What are the implications for public health practice?
Efforts are needed to educate the public, especially persons involved in recreation along streams and rivers, to avoid eating uncooked crayfish. Health-care providers should consider paragonimiasis in patients who have eaten raw or undercooked crayfish and have unexplained fever, cough, eosinophilia, and pleural effusion or other chest radiographic abnormalities.

MMWR Morbidity and Mortality Weekly Report
1576 MMWR / December 10, 2010 / Vol. 59 / No. 48
Drug Administration advises cooking shellfish to an internal temperature of 145°F (63°C).*
Early symptoms of paragonimiasis include diar-rhea, abdominal pain, and fever, which can occur 2−15 days after eating infected crayfish. Later mani-festations include fever, cough, hemoptysis, and chest radiographic abnormalities, which occur when the parasite migrates to lungs. Migration of the parasite to the brain can cause severe complications, including vision loss. Eosinophilia in blood or pleural effusion is a supportive laboratory finding.
Definitive paragonimiasis diagnosis classically is based on viewing Paragonimus eggs or parasites in tissues or bodily fluids by microscope, although the eggs typically are not present until 2−3 months after infection. P. kellicotti eggs were evident in sputum, bronchoalveolar lavage fluid, pleural effusion or biopsies, or lung biopsies in previous reports and in two cases described in this report; the intervals from illness onset to parasitologic diagnosis ranged from 1 month to 5 years (4−9). Serologic testing is an impor-tant tool for diagnosing infections with Paragonimus westermani, a related fluke, but experience with its use in P. kellicotti infection is limited. ELISA is easier to perform, but might not provide positive results until the P. kellicotti infection has progressed 4−24 months (1). CDC’s immunoblot assay targets antibodies directed against P. westermani antigens and is highly sensitive (96%) and specific (99%) for P. westermani infection (10). Although existing serologic methods using P. westermani antigens might be less sensitive for early detection of P. kellicotti infection, a positive result is useful in confirming the diagnosis. Immunoblot assay was positive as early as 10 weeks after illness onset in one case described in this report.
Health-care providers should consider parago-nimiasis and inquire about ingestion of raw or under-cooked crayfish among patients with unexplained fever, cough, eosinophilia, and pleural effusion or other chest radiographic abnormalities. Empiric treat-ment with praziquantel is warranted for patients with signs and symptoms consistent with paragonimiasis and a history of eating raw or undercooked crayfish, regardless of serology results, particularly with an ill-ness of <3 months duration.†
AcknowledgmentsThis report is based, in part, on contributions by R Tolen,
St. Joseph–Buchanan County Health Dept; and A Turner, C Butler, C Hinkle, J Bauer, and L Buchanan, Missouri Dept of Health and Senior Svcs.
References 1. Procop GW. North American paragonimiasis (caused by
Paragonimus kellicotti) in the context of global paragonimiasis. Clin Microbiol Rev 2009;22:415–46.
2. Lane MA, Barsanti MC, Santos CA, Yeung M, Lubner SJ, Weil GJ. Human paragonimiasis in North America following ingestion of raw crayfish. Clin Infect Dis 2009;49:e55–61.
3. Pachucki CT, Levandowski RA, Brown VA, Sonnenkalb BH, Vruno MJ. American paragonimiasis treated with praziquantel. N Engl J Med 1984;311:582–3.
4. Procop GW, Marty AM, Scheck DN, Mease DR, Maw GM. North American paragonimiasis: a case report. Acta Cytol 2000;44:75–80.
5. DeFrain M, Hooker R. North American paragonimiasis: case report of a severe clinical infection. Chest 2002; 121:1368–72.
6. Castilla EA, Jessen R, Sheck DN, Procop GW. Cavitary mass lesion and recurrent pneumothoraces due to Paragonimus kellicotti infection: North American paragonimiasis. Am J Surg Pathol 2003;27:1157–60.
7. Madariaga MG, Ruma T, Theis JH. Autochthonous human paragonimiasis in North America. Wilderness Environ Med 2007;18:203–5.
8. Boe DM, Schwarz MI. A 31-year-old man with chronic cough and hemoptysis. Chest 2007;132:721–6.
9. Bean NH, Maloney EK, Potter ME, et al. Crayfish: a newly recognized vehicle for vibrio infections. Epidemiol Infect 1998;121:269–73.
10. Slemenda SB, Maddison SE, Jong EC, Moore DD. Diagnosis of paragonimiasis by immunoblot. Am J Trop Med Hyg 1988;39:469–71.
* Additional guidelines for selecting and serving fresh and frozen seafood safely are available at http://www.fda.gov/food/resourcesforyou/consumers/ucm077331.htm.
† Additional information about paragonimiasis is available from CDC at http://www.dpd.cdc.gov/dpdx/html/paragonimiasis.htm.

MMWR Morbidity and Mortality Weekly Report
MMWR / December 10, 2010 / Vol. 59 / No. 48 1577
Enteroviruses, members of the Picornaviridae family, are common viruses associated with clinical manifestations ranging from mild respiratory symp-toms to serious conditions, including aseptic menin-gitis, encephalitis, neonatal sepsis, and acute flaccid paralysis. Approximately 100 serotypes of nonpolio enteroviruses have been recognized (1), and some viruses previously classified as enteroviruses, namely echovirus 22 and 23, recently have been reclassified as human parechoviruses (HPeVs), a different genus within the Picornaviridae family. This report describes trends in nonpolio enterovirus and HPeV detec-tions during 2006–2008, based on data from two laboratory-based surveillance systems, the National Enterovirus Surveillance System (NESS) and, for the first time, the National Respiratory and Enteric Virus Surveillance System (NREVSS). As in previous years, approximately 70% of detections occurred during July–October, the peak enterovirus season. The five most common enterovirus serotypes (coxsackievirus B1 [CVB1], echovirus 6, echovirus 9, echovirus 18, and coxsackievirus A9) accounted for 54% of total serotyped detections. During 2006–2008, southern states reported the most serotyped enterovirus detec-tions, followed by midwestern states, western states, and the northeastern states. In 2007 and 2008, CVB1 was the predominant serotype detected, accounting for 24% and 19% of overall detections, respectively. In 2007, CVB1 was implicated in an outbreak of serious neonatal infections in the United States (2). Understanding trends in enterovirus and HPeV cir-culation can help clinicians decide when to test for these infections. Also, more timely reporting of data could help public health officials recognize outbreaks associated with these viruses.
NESS, initiated in 1961, is a passive, volun-tary surveillance system that monitors laboratory detections of enteroviruses in the United States. Participating laboratories are encouraged to report enterovirus detections by serotype, specimen type, collection date, age of patient, and sex of patient to CDC monthly. Enterovirus serotyping is performed by sequencing the genome region encoding the VP1 capsid protein by immunofluorescence using type-specific monoclonal antibodies, or by neutralization with type-specific polyclonal antisera.
NREVSS is a passive, voluntary, laboratory-based surveillance system that tracks temporal and geo-graphic trends in the circulation of respiratory and enteric pathogens. NREVSS began collecting entero-virus reports in July 2007. It collects the number of enterovirus tests and the proportion that are positive, by specimen site and collection date; no serotyping, demographic data, or clinical data are reported. All participating laboratories that reported at least one enterovirus-positive specimen were included in this analysis. Enteroviruses were detected by cell culture or nucleic acid detection (polymerase chain reaction).
During 2006–2008, enterovirus and HPeV detec-tions were reported from 49 states through one or both of these surveillance systems during the years specified (Figure 1). A total of 20 laboratories (includ-ing 18 public health laboratories, one private refer-ence laboratory, and CDC’s Picornavirus Laboratory) reported results to NESS. Public health and private laboratories without the capacity to serotype send specimens to CDC Picornavirus Laboratory for sero-typing. A total of 1,632 enterovirus or HPeV detec-tions were reported to NESS during this period (920 from public health laboratories, 661 from the one reference laboratory, and 51 from CDC’s Picornavirus Laboratory). Of these detections, 1,103 (68%) were reported during July–October. The age of patients for whom age was known (1,415 [87%]) ranged from <1 month to 79 years, with a mean age of 9 years and a median age of 2 years. Children aged ≤1 year accounted for 660 (47%) of these 1,415 enterovirus or HPeV detections for which the age of patient was known. Cerebral spinal fluid was the most common source for detections, accounting for 743 (51%) of the 1,468 reports of known specimen type, followed by 324 (22%) detections from throat-nasopharyngeal specimens, 268 (17%) from stool-rectal swabs, and 133 (10%) from tissue specimens.
Enterovirus or HPeV serotypes were specified for 1,171 (72%) NESS reports. By region,* southern states had the most serotyped detections reported,
Nonpolio Enterovirus and Human Parechovirus Surveillance — United States, 2006–2008
* Midwest: Illinois, Indiana, Kansas, Michigan, Minnesota, Missouri, Ohio, and Wisconsin; Northeast: Massachusetts, New Jersey, and New York; South: Florida, Georgia, Kentucky, Louisiana, Maryland, North Carolina, Oklahoma, and Tennessee; West: Alaska, Arizona, California, Colorado, Hawaii, Nevada, New Mexico, Oregon, Utah, and Washington.

MMWR Morbidity and Mortality Weekly Report
1578 MMWR / December 10, 2010 / Vol. 59 / No. 48
accounting for 418 of 1,167 (36%) reports for which state information was provided, followed by 373 (32%) detections from midwestern states, 222 (19%) from western states, and 154 (13%) from northeastern states. The five most common enterovirus serotypes accounted for 54% of total detections with a known serotype in 2006–2008 (Table). Overall, during 2006–2008, CVB1 was the most commonly detected enterovirus identified in 235 (17%) of 1,171 specimens tested (Table). In 2007, CVB1 was detected in 22 mostly southern and western states; two states reported 70 (51%) of 137 detections. In 2008, CVB1 was detected in 10 states; one state reported 15 (34%) of 44 detections. During 2006–2008, three public health laboratories and CDC’s Picornavirus Laboratory reported a total of 21 HPeV type 1 (HPeV1) detections. HPeV1 was one of the 15 most common enteroviruses reported during the surveillance period but was detected in <2% of specimens (Table). During the surveillance period, only 14 cases of enterovirus 71 (EV71), a virus that has caused widespread outbreaks of hand, foot, and mouth disease in several Asian countries (3), were reported to NESS, and it was not included as one of the 15 most common serotypes reported.
During July 2007–December 2008, a total of 3,192 (3%) of the 108,798 reports sent to NREVSS were positive for enterovirus. One hundred laboratories
reported testing for enteroviruses to NREVSS. During this period, the highest proportion of detections was reported during July–October (Figure 2). The pro-portion of enterovirus-positive specimens was similar across regions.
Reported by
GR Villarruel, MPH, GE Langley, MD, MS Oberste, PhD, M Pallansch, PhD, Div of Viral Diseases, National Center for Immunizations and Respiratory Diseases, CDC.
Editorial Note
The findings in this report are consistent with pre-vious trends regarding the most commonly detected enterovirus serotypes (4). During 2006–2008, CVB1 became the predominant enterovirus serotype identi-fied, found in several states, and concentrated in a few. Common clinical presentations of CVB1 include aseptic meningitis, myocarditis, pleurodynia, and hand, foot, and mouth disease. CVB1 generally shows an epidemic pattern of circulation with irregular intervals of increased circulation usually lasting 2–3 years (4). During 1970–2005, CVB1 accounted for approximately 2% of reports with known serotype, with an increase of CVB1 observed in the early 1990s and then again in the early 2000s (4). In 2007, increased detections of CVB1 reported to NESS led to an investigation that identified severe neonatal disease and deaths associated with CVB1 infection in multiple states (2,5).
Since 1997, EV71 has caused widespread out-breaks of hand, foot, and mouth disease in several Asian countries (3). A small proportion of cases have resulted in encephalitis and death. In the United States, small clusters of serious disease were detected during 2003–2005 (6). Although there was an increase in reported EV71 detections in the United States during 2006–2008, EV71 detections were uncommon.
HPeV1 usually has been associated with mild gastrointestinal and respiratory symptoms, menin-gitis, and neonatal sepsis (7). HPeV1 was one of the 15 most common detections during 2006–2008; no other HPeV types were reported during that period. HPeV cannot be detected by EV-specific assays. CDC’s Picornavirus Laboratory has performed the majority of HPeV typing reported to NESS but has worked with clinical and state laboratories to enhance their HPeV diagnostic and molecular typing assays
FIGURE 1. Method of reporting enterovirus detections, by state — National Enterovirus Surveillance System (NESS) and National Respiratory and Enteric Virus Surveillance System (NREVSS), United States, 2006–2008
Reporting to NREVSS
Reporting to NESS
Reporting to NREVSS and NESS
No reporting

MMWR Morbidity and Mortality Weekly Report
MMWR / December 10, 2010 / Vol. 59 / No. 48 1579
(8) to improve detections and enhance parechovirus surveillance.
The findings in this report are subject to at least four limitations. First, enteroviral infections other than poliovirus infections are not nationally notifiable in the United States. NESS is a passive system that relies on voluntary participation from laboratories, so findings are not necessarily representative of national or regional enterovirus activity. Although there might be more reports emanating from one state or region, it might not represent an increased burden of disease in that state or region. Second, the findings are limited by the lack of clinical information; however, most
FIGURE 2. Percentage of specimens testing positive for enterovirus, by month of report — National Respiratory and Enteric Virus Surveillance System (NREVSS), United States, July 2007–December 2008
0Jul Aug
2007 2008Month/Year
Sep Oct Nov Dec
Perc
enta
ge
Jan Feb Mar Apr May Jun Jul Aug Sep Oct Nov Dec
1
2
3
4
5
6
7
8
9
10
TABLE. Distribution of the 15 most commonly reported nonpolio enterovirus and parechovirus serotypes, by rank and year — National Enterovirus Surveillance System, United States, 2006–2008
Rank
2006 (n = 353) 2007 (n = 582) 2008 (n = 236) 2006–2008 (N = 1,171)
Serotype % Serotype % Serotype % Serotype %
1 Echovirus 6 15.3 Coxsackievirus B1 23.6 Coxsackievirus B1 18.6 Coxsackievirus B1 16.52 Echovirus 9 13.0 Echovirus 18 12.9 Echovirus 30 17.0 Echovirus 6 10.73 Coxsackievirus A9 11.9 Echovirus 9 10.5 Echovirus 6 11.9 Echovirus 9 10.74 Coxsackievirus B5 9.6 Coxsackievirus B4 10.0 Echovirus 9 7.6 Echovirus 18 8.85 Coxsackievirus B3 9.1 Echovirus 11 8.4 Echovirus 11 6.4 Coxsackievirus A9 7.56 Coxsackievirus B2 7.1 Echovirus 6 7.4 Coxsackievirus A9 5.9 Coxsackievirus B4 6.77 Coxsackievirus B4 4.5 Coxsackievirus A9 5.5 Echovirus 18 5.1 Echovirus 11 5.88 Echovirus 18 4.5 Coxsackievirus B3 3.9 Coxsackievirus A16 4.2 Coxsackievirus B3 5.49 Coxsackievirus B1 3.7 Coxsackievirus B5 2.4 Coxsackievirus B3 3.4 Echovirus 30 4.5
10 Echovirus 7 3.4 Echovirus 25 1.9 Human parechovirus 1 2.1 Coxsackievirus B5 4.411 Echovirus 30 2.8 Coxsackievirus B2 1.9 Echovirus 31 2.1 Coxsackievirus B2 3.412 Human parechovirus 1 1.9 Human parechovirus 1 1.6 Enterovirus 71 2.1 Echovirus 25 1.813 Enterovirus 71 1.9 Echovirus 7 1.2 Coxsackievirus B2 1.7 Human parechovirus 1 1.814 Echovirus 25 1.7 Echovirus 5 1.0 Coxsackievirus B4 1.7 Echovirus 7 1.715 Coxsackievirus A10 1.4 Echovirus 30 0.9 Echovirus 25 1.7 Coxsackievirus A16 1.7
Total 91.8 93.1 91.5 91.5
detections likely represent serious disease because cerebral spinal fluid was the most common source of detection. Third, most testing is performed during the summer months; circulation during other parts of the year might go undetected. Finally, although monthly NESS reporting is encouraged, not all participating laboratories submit timely data, which can delay accurate reporting.
NESS could be improved with more regular reporting by current laboratories and by increasing the number of participating laboratories. NREVSS provides enterovirus activity over a wider geographic area because more laboratories participate in the
MMWR Morbidity and Mortality Weekly Report
1580 MMWR / December 10, 2010 / Vol. 59 / No. 48
system, but it does not provide serotype or demo-graphic information. The combined systems provide the best available data on enterovirus circulation in the United States.
Since July 2009, a simplified, Internet-based NESS system has allowed participating laboratories to easily input enterovirus detection data and to analyze national and state-based trends in enterovirus surveil-lance, by serotype. Additional information about this system is available by e-mail ([email protected]).
AcknowledgmentsThe findings in this report are based, in part, on contribu-
tions by staff members of participating NREVSS laborato-ries and state virology laboratories reporting to NESS.
References1. Pallansch MA, Roos RP. Enteroviruses: polioviruses,
coxsackieviruses, echoviruses, and newer enteroviruses. In: Knipe DM, Howley PM, Griffin DE, et al, eds. Fields Virology, 4th ed. Philadelphia, PA: Lippincott, Williams, & Wilkins; 2001:723–75.
2. CDC. Increased detections and severe neonatal disease associated with coxsackievirus B1 infection—United States, 2007. MMWR 2008;57:553–6.
3. CDC. Deaths among children during an outbreak of hand, foot, and mouth disease—Taiwan, Republic of China, April–July 1998. MMWR 1998;47:629–32.
4. CDC. Enterovirus surveillance—United States, 1970–2005. MMWR 2006;55(No. SS-08).
5. Wikswo ME, Khetsuriani N, Fowlkes AL, et al. Increased activity of coxsackievirus B1 strains associated with severe disease among young infants in the United States, 2007–2008. Clin Infect Dis 2009;49:e44–51.
6. Perez-Velez CM, Anderson MS, Robinson CC, et al. Outbreak of neurologic enterovirus type 71 disease: a diagnostic challenge. Clin Infect Dis 2007;45:9507.
7. Harvala H, Wolthers KC, Simmonds P. Parechoviruses in children: understanding a new infection. Curr Opin Infect Dis 2010;23:224–30.
8. Nix WA, Maher K, Johansson ES, et al. Detection of all known parechoviruses by real-time PCR. J Clin Microbiol 2008;46:2519–24.
What is already known on this topic?
Approximately 100 serotypes of nonpolio entero-viruses have been recognized and are associated with mild to serious conditions, including aseptic meningitis, encephalitis, neonatal sepsis, and acute flaccid paralysis, especially during the summer and fall months.
What is added by this report?
During 2006–2008, the five most frequently detected enteroviruses were coxsackievirus B1 (CVB1), echovirus 6, echovirus 9, echovirus 18, and coxsacki-evirus A9; these accounted for 54% of total known serotyped detections during that period. In 2007 and 2008, CVB1 became the predominant serotype detected, accounting for 24% and 19% of overall detections, respectively.
What are the implications for public health practice?
Understanding trends in enterovirus and human parechovirus circulation can help clinicians decide when to test for these infections and can guide public health officials to recognize outbreaks associated with these viruses, as was the case with an outbreak of serious neonatal infections associated with CVB1 in 2007.

MMWR Morbidity and Mortality Weekly Report
MMWR / December 10, 2010 / Vol. 59 / No. 48 1581
India is one of only four countries (including Afghanistan, Nigeria, and Pakistan) where wild polio-virus (WPV) transmission has never been interrupted (1). Historically, WPV transmission in India has centered largely in Uttar Pradesh and Bihar, two states with low routine vaccination coverage, large migrant and remote populations, and lower relative vaccine effectiveness than other areas of the country (2–4). However, during a 9-month period from November 2009 to August 2010, no WPV type 1 (WPV1) cases were reported in Uttar Pradesh or Bihar. This report summarizes the substantial progress made in India toward polio eradication during January 2009–October 2010, according to data reported as of December 4, and updates previous reports (2,4). During January–October 2010, only 40 WPV cases were confirmed in India, a 94% decrease from the 626 WPV cases confirmed during the same period in 2009; the decrease likely resulted, in large part, from the introduction of bivalent oral poliovirus vac-cine types 1 and 3 (bOPV). Increasingly important contributors to WPV transmission are large migrant subpopulations; surveys have indicated that up to 11% of children aged <5 years in these subpopulations were missed during supplementary immunization activities (SIAs). Interruption of all WPV transmission in India will require maintaining high levels of immu-nity in Uttar Pradesh and Bihar and additional efforts directed toward children in migrant subpopulations that are not vaccinated as readily during SIAs.
Immunization ActivitiesUsing population-based survey data, India estimated
nationwide routine coverage with 3 doses of oral poliovi-rus vaccine (OPV) at 66% among children aged 12–23 months during 2007–2008, the most recent years for which coverage data were available (5). Routine coverage estimates in Bihar (53%) and Uttar Pradesh (40%) were among the lowest in the country (5).
SIAs* conducted in India during 2009–2010 (Figures 1 and 2) included two national immunization
days (NIDs) each year. In addition, seven subnational immunization days (SNIDs) and four large-scale (multidistrict) mop-up† activities were conducted dur-ing 2009, and five SNIDs and three large-scale mop-ups were conducted during January–October 2010 (Figure 1). After introduction of bOPV in January 2010, six SIAs were conducted using bOPV.
In 2010, SIA monitoring data§ indicated >99% coverage among children aged <2 years in Bihar and >97% in Uttar Pradesh. After enhanced efforts during 2009–2010 to identify specific areas in other states where migrant populations resided, directed surveys conducted with specific migrant subpopulations (e.g., construction laborers, nomads, and brick kiln workers) after SIA rounds indicated that 3%–11% of children aged <5 years had been missed. In Uttar Pradesh during 2010, surveys after SIAs indicated that, on average, 4.1% of children in the migrant subpopulations, compared with 2.2% missed among children aged <5 years in the general population.
WPV SurveillanceAcute flaccid paralysis (AFP) surveillance. The
national nonpolio AFP rate,¶ a measure of surveillance system sensitivity, was 11.4 per 100,000 children aged <15 years in 2009 and 11.1 per 100,000 (annualized) during January–October 2010. The highest state-level nonpolio AFP rates were in Bihar (33.9) and Uttar Pradesh (22.8) in 2010. Adequate stool specimen col-lection** in India was 83% in 2009 and 84% during January–October 2010.
Environmental surveillance. Wastewater testing for poliovirus began in Mumbai in January 2001 and in Delhi in May 2010. Although WPV was isolated frequently from samples taken in Mumbai in previous years, no WPV was detected in Mumbai wastewater
Progress Toward Poliomyelitis Eradication — India, January 2009–October 2010
* SIAs are mass campaigns conducted over a period of multiple days in which 1 dose of OPV is administered to all children aged <5 years, regardless of vaccination history. Surveillance data analysis determines the geographic extent of campaigns (i.e., national or subnational).
† Mop-up rounds are intensive house-to-house SIAs conducted in a limited area (groups of districts) with evidence of recent transmission.
§ SIA monitoring data are obtained from systematic surveys conducted after every SIA in high-risk areas to identify children aged <5 years who were missed with vaccination.
¶ The nonpolio AFP rate is the number of AFP cases not caused by WPV per 100,000 children aged <15 years. India’s operational target for each district is two or more AFP cases per 100,000.
** The percentage of reported AFP cases with two stool specimens collected within 14 days of paralysis onset (target: ≥80%).

MMWR Morbidity and Mortality Weekly Report
1582 MMWR / December 10, 2010 / Vol. 59 / No. 48
in 2010. Environmental testing during May–August 2010 detected both WPV1 and WPV type 3 (WPV3) in wastewater at Delhi sites. Genetic analysis has suggested WPV circulation within Delhi was linked to 2009 WPV1 and WPV3 Bihar isolates. No WPV has been detected in environmental samples since mid-August.
Laboratory network. During January–October 2010, >90% of stool specimens submitted for virus isolation had laboratory results reported within 14 days of specimen receipt. The mean interval from onset of paralysis and confirmation of WPV isolation was 24 days.††
WPV EpidemiologyDuring all of 2009, a total of 741 WPV cases were
reported in India from 56 districts in nine states of
35 states/union territories in India (Figure 3). During January–October 2010, a total of 40 WPV cases had been reported from 17 districts in seven states, a 94% decrease from the 626 WPV cases from 52 districts in nine states during the same reporting period in 2009. Among the 40 WPV cases reported in 2010, 28 (70%) occurred in children aged <2 years. Six (15%) of the 40 children had received 1–3 OPV doses, eight (20%) had received 4–7 doses, and 25 (63%) had received >7 doses; one child had unknown vaccination status. In Uttar Pradesh and Bihar, 19 cases had been reported from 10 districts; all of these patients had received >7 OPV doses. According to data reported as of December 4, 2010, during January–October 2010, a total of 17 WPV1 and 23 WPV3 cases were confirmed, representing a 78% decrease from 76 WPV1 cases and a 96% decrease from 550 WPV3 cases confirmed during the same period in 2009.
†† The eight polio laboratories in India processed 100,102 stool specimens during 2009 and 91,952 stool specimens during January–October 2010.
0
50
100
150
200
250
300
350
20082005 2006 2007 2009
No.
of c
ases
WPV type 1
WPV type 3
2010
Month/Year
National immunization day
Subnational immunization day
Mop-up
FIGURE 1. Number of wild poliovirus (WPV) cases, by type, month of onset, and type of supplementary immunization activity — India, January 2005–October 2010

MMWR Morbidity and Mortality Weekly Report
MMWR / December 10, 2010 / Vol. 59 / No. 48 1583
WPV1. In 2009, a total of 80 WPV1 cases were reported (including one case with both WPV1 and WPV3 isolated) from 35 districts in six states. During January–October 2010, a total of 17 WPV1 cases were reported from seven districts in five states. WPV1 isolates related to 2009 Bihar WPV1 strains have been isolated from AFP patients with onset of paralysis during January–October 2010 in West Bengal (five patients), Jharkhand (three), and Maharashtra (five). In addition, WPV1 strains circulating in Bihar during 2009 were associated with a WPV1 case in Jammu and Kashmir in 2010 after importation into Punjab in 2009. The most recent WPV1 case in India had onset on September 21 in West Bengal.
The last confirmed WPV1 case in Uttar Pradesh was in a patient with onset of paralysis on November 13, 2009. In Bihar, no WPV1 cases were reported from October 30, 2009, to August 7, 2010. Subsequently, three cases have been reported in a single Bihar district
bordering Nepal (Champaran East), with onset in the most recent case on September 1. The recent Bihar outbreak began after an outbreak was identified in Nepal in May 2010 immediately across the border from Champaran East; WPV1 isolates from both areas are related to WPV1 strains circulating in Bihar during 2009.
WPV3. In 2009, a total of 661 WPV3 cases were reported from 47 districts in eight states; 569 (86%) were from Uttar Pradesh, and 79 (12%) were from Bihar. During January–October 2010, a total of 23 cases were reported from 12 districts in five states, compared with 550 cases from 43 districts in seven states during the same 10-month period in 2009. Of the 23 cases reported during January–October 2010, 10 (43%) were from Uttar Pradesh, six (26%) from Bihar, four (17%) from Jharkhand, two (9%) from West Bengal, and one (4%) from Haryana. The most recent WPV3 case in India had onset on August 31 in Jharkhand.
11–138–105–71–40
4–53210
43210
4–53210
tOPV
mOPV1 mOPV3
bOPV
FIGURE 2. Number of supplementary immunization activity (SIA)* rounds, by vaccine used and district — Uttar Pradesh, Bihar, and surrounding areas, India, January 2009–October 2010
Abbreviations: mOPV1 = monovalent oral poliovirus vaccine type 1; mOPV3 = monovalent oral poliovirus vaccine type 3; tOPV = trivalent oral poliovirus vaccine; bOPV = bivalent oral poliovirus vaccine.
* SIAs are mass campaigns conducted over a period of multiple days in which 1 dose of oral polio vaccine is administered to all children aged <5 years, regardless of vaccination history. Surveillance data analysis determines the geographic extent of campaigns (i.e., national or subnational).

MMWR Morbidity and Mortality Weekly Report
1584 MMWR / December 10, 2010 / Vol. 59 / No. 48
Reported by
Ministry of Health and Family Welfare, Government of India. National Polio Surveillance Project, World Health Organization, India; Regional Poliovirus Laboratory Network, Immunization and Vaccine Development Dept, World Health Organization Regional Office for South-East Asia. Div of Viral Diseases and Global Immunization Div, National Center for Immuniza-tion and Respiratory Diseases; CV Cardemil, MD, EIS Officer, CDC
Editorial Note
During 2009–2010, India made substantial progress toward polio eradication. The absence of reported WPV1 cases in Uttar Pradesh and Bihar for 9 months during November 2009–August 2010 was unprecedented; Uttar Pradesh has remained free of detected WPV cases since April 2010. For the first 10 months of 2010, the total number of WPV cases in India reached a new low at 40, compared with 626 cases during the same reporting period in 2009.
The introduction of bOPV in SIAs beginning in January 2010 likely contributed substantially to the simultaneous reduction in WPV1 and WPV3 cases. Previous SIAs were conducted predominantly using monovalent oral poliovirus vaccine type 1 (mOPV1) and occasionally monovalent oral poliovirus vaccine type 3 (mOPV3); trivalent oral poliovirus vaccine (tOPV) was used less often because higher type-specific seroconversion per dose has been observed with mOPV formulations than with tOPV (3,6). A recent clinical trial demonstrated the superiority of bOPV compared with tOPV and noninferiority com-pared with mOPV1 and mOPV3 (7). Once supplies became available, bOPV became the predominant formulation used in SIAs. Preliminary data from August 2010 seroprevalence studies among infants aged 6–7 months in high-risk areas of Uttar Pradesh and Bihar indicate that, after bOPV introduction, seroprevalence against WPV3 increased and high levels of seroprevalence against WPV1 were main-tained (Enterovirus Research Center, Mumbai, India, unpublished data, 2010).
* Data of December 4, 2010.
2009 cases (N = 741) 2010 cases (N = 40)
Uttar Pradesh
WPV type 1
WPV type 3
Bihar
Jharkhand
West BengalMaharashtra
Haryana
Jammu and Kashmir
FIGURE 3. Wild poliovirus (WPV) cases, by type — India, 2009 and 2010*

MMWR Morbidity and Mortality Weekly Report
MMWR / December 10, 2010 / Vol. 59 / No. 48 1585
Appropriately targeted environmental surveillance can be more sensitive in detecting low-level WPV circulation than AFP surveillance (8). WPV was last detected in sewage in Mumbai in May 2009 and in Delhi in mid-August 2010, where sewage sampling was initiated in May of this year. The recent lack of detection of WPV in any samples is encouraging; however, sewage sampling in India still is restricted to these two major metropolitan areas.
Despite India’s gains in 2010, the risk remains for WPV circulation and reintroduction among migrant populations and residents of high-risk areas in western Uttar Pradesh and central Bihar, primarily because of high population density, weak routine immunization, and suboptimal hygiene and sanitation. Families of cer-tain migrant subpopulations (e.g., construction laborers, nomads, and brick kiln workers) that move regularly to and from Uttar Pradesh and Bihar have higher pro-portions of undervaccinated children than the general population, according to 2010 directed surveys of these subpopulations and supported by reported vaccination rates among nonpolio AFP case patients.
The risk for persistence of low-level, undetected, WPV transmission among Uttar Pradesh or Bihar residents, or among migrant subpopulations, is a concern. All WPV1 isolates from India and Nepal in 2010 are genetically linked to strains detected in central Bihar in 2009, and the 2010 WPV1 outbreak in Tajikistan was linked to WPV1 from Uttar Pradesh in 2009 (9). OPV-vaccinated children with serologic immunity can excrete WPV, which might contribute to transmission despite high OPV coverage in SIAs (6,10). Moreover, transmission has continued in some areas with recent outbreaks (Maharashtra and West Bengal). WPV could spread to other parts of India with relatively low population immunity months after the last observed case in the outbreak area.
The current high season for polio in India has passed with historically low incidence of WPV cases. Successful interruption of all residual WPV transmission in India will require maintaining high levels of immunity in Uttar Pradesh and Bihar through SIAs and programs to strengthen routine vaccination, along with continued mop-ups to control outbreaks in areas where WPV was reintroduced. SIAs planned for 2011 represent an opportunity to interrupt transmission, provided that high coverage during SIAs is maintained, immediate large-scale mop-ups are conducted in response to any new WPV detected, and focus is continued on vigorous vaccination of migrant subpopulations.
References 1. CDC. Progress toward interruption of wild poliovirus
transmission—worldwide, 2009. MMWR 2010; 59:545–50. 2. CDC. Progress toward poliomyelitis eradication—
India, January 2006–September 2007. MMWR 2007; 56:1187–91.
3. Grassly NC, Wenger J, Durrani S, et al. Protective efficacy of a monovalent oral type 1 poliovirus vaccine: a case-control study. Lancet 2007;369:1356–62.
4. CDC. Progress toward poliomyelitis eradication—India, January 2007–May 2009. MMWR 2009;58:719–23.
5. Ministry of Health and Family Welfare, Government of India. District level household and facility survey. Available at http://www.rchiips.org. Accessed December 3, 2010.
6. Sutter RK, Kew OM, Cochi SL. Poliovirus vaccine—live. In: Plotkin S, Orenstein W, Offit P, eds. Vaccines. 5th ed. Philadelphia, PA: Saunders; 2008.
7. Sutter RW, John TJ, Jain H, et al. Immunogenicity of bivalent types 1 and 3 oral poliovirus vaccine: a randomised, double-blind, controlled trial. Lancet 2010;376:1624–5.
8. Deshpande JM, Shetty SJ, Siddiqui ZA. Environmental surveillance system to track wild poliovirus transmission. Appl Environ Microbiol 2003;69:2919–27.
9. CDC. Outbreaks following wild poliovirus importations—Europe, Africa, and Asia, January 2009–September 2010. MMWR 2010;59:1393–9.
10. Grassly NC, Jafari H, Bahl S, et al. Asymptomatic wild-type poliovirus infection in India among children with previous oral poliovirus vaccination. J Infect Dis 2010;201:1535–43.
What is already known on this topic?
India is one of four countries (including Afghanistan, Nigeria, and Pakistan) where wild poliovirus (WPV) remains endemic; most cases in India in the past have been reported in Uttar Pradesh and Bihar, two states with low routine vaccination coverage, lower vaccine effec-tiveness than elsewhere, and large migrant subpopula-tions that require frequent supplementary immunization activities (SIAs) to control WPV transmission.
What is added by this report?
As of December 4, during January–October 2010, a total of 40 WPV cases had been confirmed in 2010, a 94% decrease from the 626 WPV cases during the same 10-month period in 2009; this progress likely resulted in large part from the introduction of bivalent oral poliovirus vaccine types 1 and 3 (bOPV) in SIAs.
What are the implications for public health practice?
Despite the progress in India, the risk for persistent WPV transmission remains, particularly in migrant subpopulations and among residents of Uttar Pradesh and Bihar. To interrupt all WPV transmission, India is taking steps to strengthen routine vaccination and SIA coverage, implement immediate, large-scale mop-ups in response to new cases, target migrant subpopulations, and maintain high levels of immunity in Uttar Pradesh and Bihar.

MMWR Morbidity and Mortality Weekly Report
1586 MMWR / December 10, 2010 / Vol. 59 / No. 48
On December 8, 2010, this report was posted as an MMWR Dispatch on the MMWR website (http://www.cdc.gov/mmwr).
The first cholera outbreak in Haiti in at least a century was confirmed by the Haitian National Public Health Laboratory on October 21, 2010 (1). Surveillance data through December 3, provided by the Haitian Ministry of Public Health and Population (MSPP), indicated that the outbreak had spread nationwide and that cases of cholera and cholera-associated hospitalizations and deaths had climbed rapidly in November. As of December 3, MSPP reported 91,770 cases of cholera from all 10 depart-ments and the capital city of Port-au-Prince; 43,243 (47.1%) patients had been hospitalized, and 2,071 (2.3%) had died. A rapid mortality assessment in Artibonite Department found that deaths occurred as rapidly as 2 hours after symptom onset and identified important gaps in access to life-saving treatments, including oral rehydration solution (ORS). Urgent activities are under way, and additional efforts are imperative to reduce cholera mortality by expanding access to cholera treatment and to reduce cholera transmission by improving access to safe water and adequate sanitation.
A nationwide cholera surveillance system has been established in Haiti. Hospitals and clinics send daily case counts to local MSPP officials; aggregate data are sent on to department-level officials and then to central government officials. A case of cholera is defined as profuse, acute, watery diarrhea in a resident of a depart-ment in which at least one case of cholera has been laboratory-confirmed by isolation of Vibrio cholerae from culture of a stool specimen. A hospitalized case occurs in a patient admitted to a health facility (i.e., a hospital or cholera treatment site) for at least one night. A cholera death is the death of a person with illness that meets the case definition for cholera. Any cholera death that occurs in a health facility, regardless of whether the decedent was admitted overnight, is considered a cholera hospital death. MSPP posts daily and cumulative tallies of cholera reports on a public website; tallies are stratified by department and age group (aged <5 years and all ages).* Since November
16, nonhospitalized cases have been posted in addition to hospitalized cases.
All 10 departments and the capital city of Port-au-Prince have reported laboratory-confirmed cases of cholera. As of December 3, a total of 91,770 cases had been reported nationwide, and 43,243 (47.1%) patients had been hospitalized (Figure 1). The larg-est number of cases (42,596 [46.4%]) were reported from Artibonite Department, which comprises approximately 16% of the Haiti population (2) and is the department where cases were first laboratory-confirmed (Figure 2). As of December 3, of 2,071 deaths, 1,437 (69.4%) had occurred in hospitals. A total of 82,599 (90.0%) cases, 39,435 (91.2%) hos-pitalizations, and 1,908 (92.1%) deaths had occurred among persons aged ≥5 years.
Nationwide, during November 27–December 3, the median daily number of deaths was 41 (range: 18–64). As of December 3, the overall case-fatality ratio (CFR) (cumulative deaths divided by cumula-tive cases) was 2.3%. The hospital CFR (cumulative hospital deaths divided by cumulative hospitalized cases) was 3.3%. The daily nationwide hospital CFR has varied; however, simple linear regression indicates decreases in the rolling 7-day hospital CFR in Artibonite (p<0.001) and in all other depart-ments combined (p<0.001) (Figure 3). In Artibonite Department, the rolling 7-day hospital CFR decreased from a high of 4.2% on November 9 to a low of 1.4% on December 1 (Figure 3).
A rapid assessment of mortality from cholera among persons aged ≥5 years was conducted in Artibonite Department during November 12–16. Teams visited homes of 22 cholera decedents identi-fied through records in two hospitals. Family members were interviewed about decedents’ use of ORS and other health-care services. Family and community members were asked about other cholera deaths in the community, resulting in identification of an additional 65 decedents, whose families also were interviewed. Among the total of 87 cholera decedents identified, 58 (67%) were male; eight (9.2%) were aged 5–18 years, and 79 (90.8%) were aged 19–100 years. Of the 87 deaths, 48 (55%) occurred in a hospital or other health facility, and 39 (45%) occurred in the commu-nity. For those who died in the community, median time to death from onset of symptoms was 12 hours
* Available at http://mspp.gouv.ht/site/index.php?option=com_content&view= article&id=57&itemid=1.
Update: Outbreak of Cholera — Haiti, 2010

MMWR Morbidity and Mortality Weekly Report
MMWR / December 10, 2010 / Vol. 59 / No. 48 1587
(range: 2 hours–8 days). Only nine (23%) of the 39 persons who died in the community received ORS. Sixteen (41%) of the 39 had sought health care; eight died en route to a health facility, and eight died after discharge. When asked to cite reasons for not seeking health care, family members in 10 cases did not think the ill person had cholera; family members in seven cases reported difficulty getting to a health facility (including transport at night), and family members in six cases did not see the need to seek care.
Reported by
Ministry of Public Health and Population, Haiti. Pan American Health Organization. CDC.
Editorial Note
Surveillance data show that from October 21 to December 3, cholera spread rapidly across Haiti. Although decreasing, the hospital CFR of 3.3% remains high. Improvements in receipt of appropri-ate care in health facilities might be reflected in the
decreasing hospital CFR. However, when cholera is recognized early and appropriate rehydration treatment is initiated rapidly, a CFR <1% can be achieved among patients who have sought care (3). The outbreak strain of cholera has been identified as a “hybrid” strain of the El Tor biotype and the clas-sic toxin type; the classic toxin might be associated with more severe illness, and the El Tor biotype is associated with longer persistence in the environ-ment (4,5).† Underlying poor nutritional status and other comorbidities also are likely to contribute to disease severity in Haiti (6,7). In 2008, only 63% of Haiti’s population had access to an improved drinking water source,§ and only 17% had access to adequate sanitation (8). The lack of safe water and sanitation
† Most toxigenic cholera strains circulating in the world today are biotype El Tor with some variant of the classic toxin.
§ Defined as 1) a piped household water connection located inside the user’s dwelling, plot, or yard; 2) public taps or standpipes; 3) tube wells or boreholes; 4) protected dug wells; 5)protected springs; or 6) rainwater collection.
FIGURE 1. Reported number of new cases of cholera (N = 91,770), by hospitalization status — Haiti, October 20–December 3, 2010*
3,000
3,500
Nonhospitalized
Hospitalized
2,500
1,500
2,000
1,000
No.
of c
ases
0
500
Month/Day
Oct Nov Dec
20 22 24 26 28 30 1 3 5 7 9 11 13 15 17 19 21 23 25 2927 1 3
* Because of time delays in reporting, case counts for the most recently reported days likely are underestimated.

MMWR Morbidity and Mortality Weekly Report
1588 MMWR / December 10, 2010 / Vol. 59 / No. 48
infrastructure in Haiti and the devastation caused by the January 2010 earthquake have created condi-tions favorable for the rapid spread of cholera across the country.
A cholera epidemic in the Western Hemisphere began in 1991 and lasted for nearly a decade, spread-ing across Central and South America in countries that, like Haiti, were previously unexposed to cholera and thus lacked population immunity (9). Peru experienced the highest cholera incidence and mortality among affected countries. During the first 6 full epidemiologic weeks of the cholera epidemic in Peru, 19,431 hospitalizations (87.5 per 100,000 population) and 368 cholera deaths (1.7 per 100,000) were reported (10). By comparison, during the first 6 full weeks of the Haiti outbreak, 39,010 hospitaliza-tions (393 per 100,000 population) and 1,882 chol-era deaths (19.0 per 100,000) were reported. Thus, early rates of reported hospitalizations and deaths in Haiti were substantially higher than those in Peru (rate ratios: 4.5 and 11.5, respectively). In fact, the death rate during 6 weeks of the outbreak in Haiti (19.0 per 100,000) exceeded the death rate observed during the first 48 weeks of the Peru epidemic (13.1 per 100,000).¶
Urgent measures are being taken to expand access to treatment that will mitigate cholera morbidity and mortality; improvements in water quality and sanita-tion also are necessary to reduce transmission. Because cholera can progress quickly to severe dehydration, shock, and death, rapid rehydration is the mainstay of cholera treatment. In the mortality assessment pre-sented in this report, only nine of 39 cholera decedents who died outside of health facilities had received ORS, and eight died en route to care. Early access to ORS in homes, in communities (e.g., at specially designated ORS sites), and at health facilities can slow disease progression, reduce the need for hospitalization, and reduce mortality. Because cholera can lead to death rapidly, ideally all persons at risk for cholera should be within 1 hour of a location where they can receive ORS and should have access to more advanced care at specially designated cholera treatment centers.
MSPP, the U.S. government, and multiple other governmental and nongovernmental entities have worked rapidly under challenging circumstances to
* Artibonite 42,596; Port-au-Prince 12,566; Nord 10,436; Nord’ Ouest 9,735; Centre 9,527; Ouest 4,899; Sud 419; Nord’ Est 341; Grande Anse 205; Sud’ Est 76; Nippes 34.
† Includes the following communes: Carrefour, Cite Soleil, Delmas, Kenscoff, Petion Ville, Port-au-Prince, and Tabarre.
FIGURE 2. Cumulative number of cases of cholera reported overall* and date of first laboratory-confirmed case, by department and in Port-au-Prince†— National Cholera Monitoring System, Haiti, December 3, 2010
10,001–43,000501–10,0000–500
Nord’ OuestOct 26
Oct 25
Nov 13
Nord
Nord’ Est
Artibonite
Grande AnseNippes
SudSud’ Est
Ouest
CentreOct 24
Oct 23
Nov 14Nov 18
Nov 10
Nov 19
Oct 21
Port-au-Prince
What is already known on this topic?
Cholera is marked by profuse, acute, watery diarrhea that can lead to rapid dehydration and death; case-fatality ratios can be reduced to <1% with early recognition and appropriate rehydration. For at least a century, no cholera outbreak had occurred in Haiti.
What is added by this report?
As of December 3, a total of 91,770 cases of cholera had been reported in Haiti from all 10 departments and the city of Port-au-Prince, including 43,243 hospitalizations and 2,071 deaths; the case-fatality ratio was 2.3% overall and 3.3% among persons hospitalized. A mortality assessment of 87 decedents indicated that some deaths occurred within 2 hours after symptom onset and important gaps exist in access to life-saving rehydration.
What are the implications for public health practice?
The potential exists to prevent many cholera deaths in Haiti; to do so, urgent efforts are needed to rec-ognize affected patients early, provide ready access to oral rehydration solution, and provide access to more advanced care at cholera treatment centers as needed. Short-term and long-term measures to improve water and sanitation in Haiti also are necessary.
¶ Cholera death total for Peru in 1991 derived from data available at http://www.paho.org/english/sha/epibul_95-98/be971cho.htm. Peru population estimate for death rate calculations available at http://ais.paho.org/phip/viz/basicindicatorbrowaser.asp.

MMWR Morbidity and Mortality Weekly Report
MMWR / December 10, 2010 / Vol. 59 / No. 48 1589
establish, staff, and supply cholera treatment sites. To expand treatment options further, the United States is developing cholera treatment sites within health facilities supported by the President’s Emergency Plan for AIDS Relief (PEPFAR). In addition, CDC, MSPP, and the International Centre for Diarrhoeal Disease Research, Bangladesh, have developed a train-the-trainer program** in which health workers educated in cholera treatment and clinical manage-ment techniques are providing clinical training to health workers across the country. Ensuring sufficient supplies and staffing for cholera treatment sites dur-ing the evolving cholera outbreak will be challenging, and ensuring appropriate care will require systematic assessments of cholera treatment sites.
Short-term and long-term efforts also are needed to prevent cholera transmission. In the short-term, products for household water chlorination and safe
water storage must be made available to all households and health facilities, including in communities not yet affected by cholera. Hand washing with soap and safe sanitation behaviors, including latrine use, need to be reinforced, and soap should be made more widely available. Safe food-handling practices, in homes and in open markets, ought to be encouraged. Although much work has been done by MSPP and its partners to improve access to safe drinking water and adequate sanitation in the areas of Haiti hardest hit by the January 2010 earthquake, additional activities are needed to ensure long-term access. In the coming months, certain efforts will be critical for reducing cholera transmission and mortality: 1) sustaining and improving drinking water chlorination; 2) improving access to safe drinking water sources; 3) enhancing water, sanitation, and hygiene education activities; and 4) ensuring appropriate sanitation measures in cholera treatment centers to prevent contamination of the environment.
6
7
5
Artibonite
All other departments combined
3
4
1
2
Case
-fata
lity
ratio
(%)
031 282624222018161412108642 30
Month/Day
Oct Nov2Dec
FIGURE 3. Rolling 7-day hospital case-fatality ratio* for Artibonite and all other departments — Haiti, October 31– December 3, 2010
* Case-fatality ratio calculated as new hospital deaths divided by new hospitalizations during the 7-day period ending on that date.
** Information available at http://www.cdc.gov/haiticholera/training/hcp_materials.htm.

MMWR Morbidity and Mortality Weekly Report
1590 MMWR / December 10, 2010 / Vol. 59 / No. 48
The findings in this report are subject to at least four limitations. First, cholera cases and deaths, par-ticularly those not evaluated or occurring in health facilities, likely are underreported, and how reporting might differ among facilities and age groups is not well understood. Second, the mortality assessment was conducted in one area of Artibonite Department, and sampling was not systematic; as such, demographic characteristics, circumstances of illness, and location of death might not be representative of all deaths in the country. Third, family member responses in the mortality assessment might not have provided an accurate account of the decedent’s perceptions or experiences. Finally, population estimates used to calculate rates for cholera morbidity and mortality are uncertain, particularly because of the mortality caused by the earthquake in Haiti.
Despite strong responses from MSPP and govern-ments and nongovernmental agencies, the size and speed of this cholera outbreak, combined with the lack of safe water and sanitation infrastructure in Haiti, indicate that further action is urgently needed to reduce cholera transmission and mortality. All parties should extend their periods of involvement and redouble their efforts to support efforts in Haiti to reduce the burden of this disease.
References 1. CDC. Update: cholera outbreak—Haiti, 2010. MMWR
2010;59:1473–9. 2. Direction des Statistique Demographiques et Sociales of the
Institut Haitien de Statistique et d’Informatique. Population totale, population de 18 ans et plus menages et densites estimes en 2009 [French]. March 2009. Available at http://www.ihsi.ht/pdf/projection/poptotal&menagdens_estim2009.pdf. Accessed December 6, 2010.
3. World Health Organization. Cholera. Fact sheet no. 107. Geneva, Switzerland: World Health Organization; June 2010. Available at http://www.who.int/mediacentre/factsheets/fs107/en/index.html. Accessed on December 8, 2010.
4. Siddique A, Nair G, Alam M, et al. El Tor cholera with severe disease: a new threat to Asia and beyond. Epidemiol Infect 2010;138:347–52.
5. Gangarosa E. The epidemiology of cholera: past and present. Bull NY Acad Med 1971;47:1140–51.
6. Palmer D, Koster F, Alam A, Islam M. Nutritional status: a determinant of severity of diarrhea in patients with cholera. J Infect Dis 1976;134:8–14.
7. Von Seidlein L, Wang X, Macuamule A, et al. Is HIV infection associated with an increased risk for cholera? Findings from a case-control study in Mozambique. Trop Med Int Health 2008;13:683–8.
8. World Health Organization and UNICEF. Progress on sanitation and drinking water: 2010 update. Geneva, Switzerland: WHO Press; 2010. Available at http://www.who.int/water_sanitation_health/publications/9789241563956/en/index.html. Accessed December 6, 2010.
9. Swerdlow DL, Mintz ED, Rodriguez M, et al. Waterborne transmission of epidemic cholera in Trujillo, Peru: lessons for a continent at risk. Lancet 1992;340:28–32.
10. Ministry of Health, Peru. Cholera epidemic in Peru. Epidemiological Bulletin no. 11, 1991.

MMWR Morbidity and Mortality Weekly Report
MMWR / December 10, 2010 / Vol. 59 / No. 48 1591
Notice to Readers
Update: Vol. 47, No. 9In the report, “Human Exposure to Brucella abortus
Strain RB51 — Kansas, 1997,” the sixth paragraph of the Editorial Note (page 174) mentioned efforts by CDC’s Special Bacteriology Reference Laboratory to develop a polymerase chain reaction assay for detec-tion of human RB51 infection. However, currently no validated routine test is available to monitor infec-tions associated with exposure to the RB51 vaccine strain. Exposure to RB51 does not elicit a measurable antibody response; therefore, serology cannot provide an indicator of infection. Persons seeking assistance in identifying Brucella spp. or serologic monitoring of exposed persons should contact their state health departments or the CDC Bacterial Special Pathogens Branch at telephone 404-639-1711.
Postexposure prophylaxis is recommended for persons at high risk. A high-risk exposure is defined as 1) having direct personal exposure to Brucella (e.g., sniffing bacteriologic cultures, direct skin contact, pipetting by mouth, inoculation, or spraying into the eyes, nose, or mouth), 2) performing work on an open bench (i.e., outside of biosafety level 3 containment equipment) with an open culture plate containing a Brucella isolate or being in close proximity to such work (e.g., across an open bench top or within 5 feet), or 3) presence in the laboratory during any procedure conducted on a Brucella isolate that might result in generation of aerosolized organisms and inhalational exposure (e.g., vortexing or catalase testing).
Errata: Vol. 59, No. 32In the “Final 2009 Reports of Nationally
Notifiable Infectious Diseases,” on page 1027, in “Table 2. Reported cases of notifiable diseases, by geographic division and area — United States, 2009,” the AIDS heading should read “HIV diagnoses.” On page 1030, under “Coccidioidomycosis,” the United States total should read “12,926,” and the totals for Pacific and California should read “2,488.”
hxv5
Highlight
hxv5
Highlight
MMWR Morbidity and Mortality Weekly Report
1592 MMWR / December 10, 2010 / Vol. 59 / No. 48
QuickStats
FROM THE NATIONAL CENTER FOR HEALTH STATISTICS
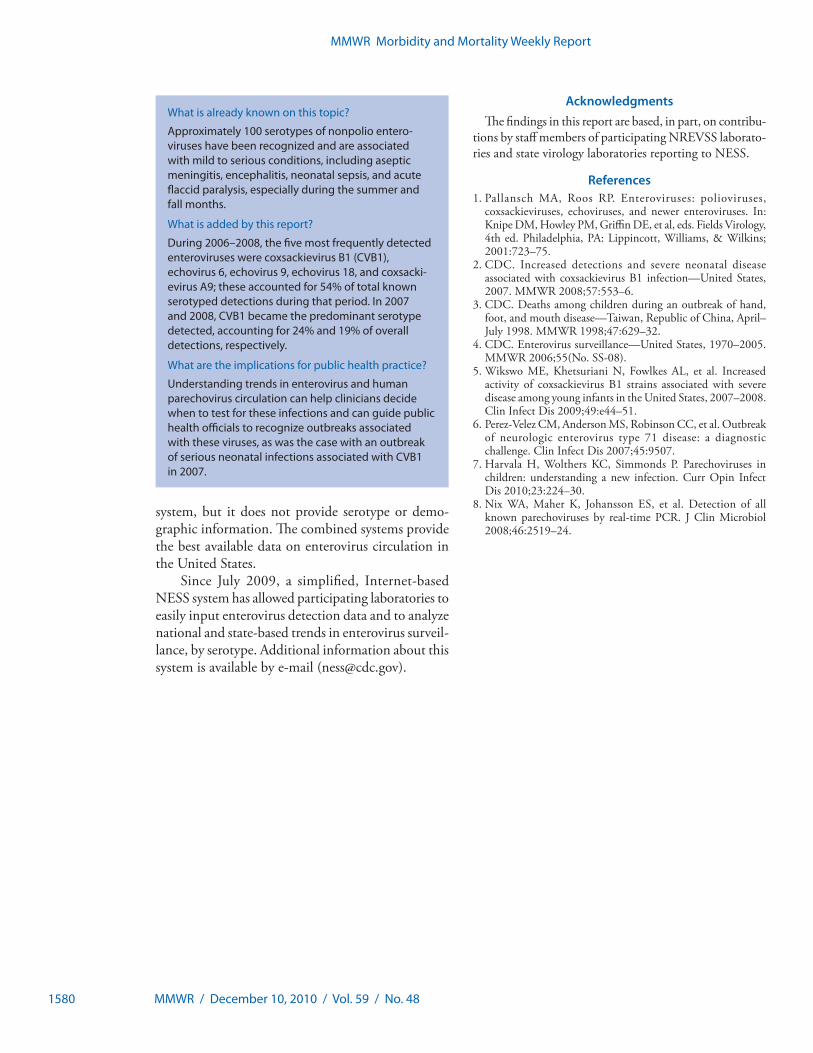
Percentage of Adults Aged ≥18 Years Who Reported Vision Trouble,* by Sex and Age Group — National Health Interview Survey, 2009†
* Based on responses to the following questions: “Do you have any trouble seeing, even when wearing glasses or contact lenses?” and “Are you blind or unable to see at all?” For this analysis, “any trouble seeing” and “blind” were combined into one category.
† Estimates are based on household interviews of a sample of the civilian, noninstitutionalized U.S. population and are derived from the National Health Interview Survey sample adult component.
§ 95% confidence interval.
In 2009, women (9.3%) were more likely than men (7.2%) to report vision trouble. Among both men and women, adults aged ≥75 years were most likely to report vision trouble, and adults aged 18–44 years were least likely to report vision trouble. Within each sex, rates of reported vision trouble were similar for persons aged 45–64 years and 65–74 years.
Source: National Health Interview Survey, 2009 data. Available at http://www.cdc.gov/nchs/nhis.htm.
Overall
18–44 yrs
45–64 yrs
65–74 yrs
≥75 yrs
0
5
10
15
20
25
Male Female
Perc
enta
ge
Sex
§

MMWR Morbidity and Mortality Weekly Report
MMWR / December 10, 2010 / Vol. 59 / No. 48 1593
TABLE I. Provisional cases of infrequently reported notifiable diseases (<1,000 cases reported during the preceding year) — United States, week ending December 4, 2010 (48th week)*
DiseaseCurrent
weekCum 2010
5-year weekly
average†
Total cases reported for previous years States reporting cases
during current week (No.)2009 2008 2007 2006 2005
Anthrax — — 0 1 — 1 1 —Botulism, total 1 93 3 118 145 144 165 135
foodborne — 6 0 10 17 32 20 19infant 1 66 2 83 109 85 97 85 WA (1)other (wound and unspecified) — 21 1 25 19 27 48 31
Brucellosis — 114 2 115 80 131 121 120Chancroid — 35 1 28 25 23 33 17Cholera — 5 0 10 5 7 9 8Cyclosporiasis§
— 166 1 141 139 93 137 543Diphtheria — — — — — — — —Domestic arboviral diseases § ,¶:
California serogroup virus disease — 65 0 55 62 55 67 80Eastern equine encephalitis virus disease — 10 — 4 4 4 8 21Powassan virus disease — 5 0 6 2 7 1 1St. Louis encephalitis virus disease — 8 0 12 13 9 10 13Western equine encephalitis virus disease — — — — — — — —
Haemophilus influenzae,** invasive disease (age <5 yrs):serotype b — 14 0 35 30 22 29 9nonserotype b 1 139 3 236 244 199 175 135 OK (1)unknown serotype 4 232 3 178 163 180 179 217 FL (3), OK (1)
Hansen disease§ — 56 2 103 80 101 66 87Hantavirus pulmonary syndrome§
— 17 1 20 18 32 40 26Hemolytic uremic syndrome, postdiarrheal§ 2 208 4 242 330 292 288 221 TN (1), OK (1)HIV infection, pediatric (age <13 yrs)††
— — 3 — — — — 380Influenza-associated pediatric mortality§,§§
— 58 4 358 90 77 43 45Listeriosis 7 713 17 851 759 808 884 896 NY (1), MD (1), WV (1), OK (2), CO (1), WA (1)Measles¶¶
1 59 0 71 140 43 55 66 CA (1)Meningococcal disease, invasive***:
A, C, Y, and W-135 — 215 6 301 330 325 318 297serogroup B — 99 3 174 188 167 193 156other serogroup — 8 0 23 38 35 32 27unknown serogroup 6 373 10 482 616 550 651 765 PA (1), GA (1), FL (1), CO (1), OR (1), CA (1)
Mumps 1 2,477 37 1,991 454 800 6,584 314 OH (1)Novel influenza A virus infections†††
— 3 0 43,774 2 4 NN NNPlague — 2 — 8 3 7 17 8Poliomyelitis, paralytic — — — 1 — — — 1Polio virus Infection, nonparalytic§
— — — — — — NN NNPsittacosis§
— 4 0 9 8 12 21 16Q fever, total§,§§§
1 111 1 114 120 171 169 136acute 1 85 1 94 106 — — — CA (1)chronic — 26 0 20 14 — — —
Rabies, human — 1 0 4 2 1 3 2Rubella¶¶¶
— 6 0 3 16 12 11 11Rubella, congenital syndrome — — — 2 — — 1 1SARS-CoV§,**** — — — — — — — —Smallpox§ — — — — — — — —Streptococcal toxic-shock syndrome§
— 149 2 161 157 132 125 129Syphilis, congenital (age <1 yr)††††
— 194 7 423 431 430 349 329Tetanus — 7 1 18 19 28 41 27Toxic-shock syndrome (staphylococcal)§
2 72 1 74 71 92 101 90 GA (1), CA (1)Trichinellosis — 5 0 13 39 5 15 16Tularemia 2 101 1 93 123 137 95 154 CA (2)Typhoid fever 5 381 4 397 449 434 353 324 MD (1), VA (1), NC (1), FL (1), CA (1)Vancomycin-intermediate Staphylococcus aureus§
2 84 1 78 63 37 6 2 NY (2)Vancomycin-resistant Staphylococcus aureus§
— 1 — 1 — 2 1 3Vibriosis (noncholera Vibrio species infections)§
4 716 5 789 588 549 NN NN FL (2), CA (1), HI (1)Viral hemorrhagic fever§§§§ — 1 — NN NN NN NN NNYellow fever — — — — — — — —
See Table I footnotes on next page.
Notifiable Diseases and Mortality Tables

MMWR Morbidity and Mortality Weekly Report
1594 MMWR / December 10, 2010 / Vol. 59 / No. 48
Notifiable Disease Data Team and 122 Cities Mortality Data Team Patsy A. Hall-BakerDeborah A. Adams Rosaline DharaWillie J. Anderson Pearl C. SharpMichael S. Wodajo Lenee Blanton
* Ratio of current 4-week total to mean of 15 4-week totals (from previous, comparable, and subsequent 4-week periods for the past 5 years). The point where the hatched area begins is based on the mean and two standard deviations of these 4-week totals.
FIGURE I. Selected notifiable disease reports, United States, comparison of provisional 4-week totals December 4, 2010, with historical data
420.250.125 1
Beyond historical limits
DISEASE
Ratio (Log scale)*
DECREASE INCREASECASES CURRENT
4 WEEKS
Hepatitis A, acute
Hepatitis B, acute
Hepatitis C, acute
Legionellosis
Measles
Mumps
Pertussis
Giardiasis
Meningococcal disease
705
74
104
35
139
2
33
12
1,079
0.5
TABLE I. (Continued) Provisional cases of infrequently reported notifiable diseases (<1,000 cases reported during the preceding year) — United States, week ending December 4, 2010 (48th week)*
—: No reported cases. N: Not reportable. NN: Not Nationally Notifiable Cum: Cumulative year-to-date counts. * Case counts for reporting year 2010 are provisional and subject to change. For further information on interpretation of these data, see http://www.cdc.gov/ncphi/disss/nndss/phs/files/
ProvisionalNationa%20NotifiableDiseasesSurveillanceData20100927.pdf. † Calculated by summing the incidence counts for the current week, the 2 weeks preceding the current week, and the 2 weeks following the current week, for a total of 5 preceding years.
Additional information is available at http://www.cdc.gov/ncphi/disss/nndss/phs/files/5yearweeklyaverage.pdf. § Not reportable in all states. Data from states where the condition is not reportable are excluded from this table except starting in 2007 for the domestic arboviral diseases, STD data, TB
data, and influenza-associated pediatric mortality, and in 2003 for SARS-CoV. Reporting exceptions are available at http://www.cdc.gov/ncphi/disss/nndss/phs/infdis.htm. ¶ Includes both neuroinvasive and nonneuroinvasive. Updated weekly from reports to the Division of Vector-Borne Infectious Diseases, National Center for Zoonotic, Vector-Borne, and
Enteric Diseases (ArboNET Surveillance). Data for West Nile virus are available in Table II. ** Data for H. influenzae (all ages, all serotypes) are available in Table II. †† Updated monthly from reports to the Division of HIV/AIDS Prevention, National Center for HIV/AIDS, Viral Hepatitis, STD, and TB Prevention. Implementation of HIV reporting influences
the number of cases reported. Updates of pediatric HIV data have been temporarily suspended until upgrading of the national HIV/AIDS surveillance data management system is completed. Data for HIV/AIDS, when available, are displayed in Table IV, which appears quarterly.
§§ Updated weekly from reports to the Influenza Division, National Center for Immunization and Respiratory Diseases. Since October 3, 2010, one influenza-associated pediatric death occurred during the 2010–11 influenza season. Since August 30, 2009, a total of 282 influenza-associated pediatric deaths occurring during the 2009–10 influenza season have been reported.
¶¶ The one measles case reported for the current week was imported. *** Data for meningococcal disease (all serogroups) are available in Table II. ††† CDC discontinued reporting of individual confirmed and probable cases of 2009 pandemic influenza A (H1N1) virus infections on July 24, 2009. During 2009, four cases of human
infection with novel influenza A viruses, different from the 2009 pandemic influenza A (H1N1) strain, were reported to CDC. The three cases of novel influenza A virus infection reported to CDC during 2010 were identified as swine influenza A (H3N2) virus and are unrelated to the 2009 pandemic influenza A (H1N1) virus. Total case counts for 2009 were provided by the Influenza Division, National Center for Immunization and Respiratory Diseases (NCIRD).
§§§ In 2009, Q fever acute and chronic reporting categories were recognized as a result of revisions to the Q fever case definition. Prior to that time, case counts were not differentiated with respect to acute and chronic Q fever cases.
¶¶¶ No rubella cases were reported for the current week. **** Updated weekly from reports to the Division of Viral and Rickettsial Diseases, National Center for Zoonotic, Vector-Borne, and Enteric Diseases. †††† Updated weekly from reports to the Division of STD Prevention, National Center for HIV/AIDS, Viral Hepatitis, STD, and TB Prevention. §§§§ There was one case of viral hemorrhagic fever reported during week 12. The one case report was confirmed as lassa fever. See Table II for dengue hemorrhagic fever.

MMWR Morbidity and Mortality Weekly Report
MMWR / December 10, 2010 / Vol. 59 / No. 48 1595
TABLE II. Provisional cases of selected notifiable diseases, United States, weeks ending December 4, 2010, and December 5, 2009 (48th week)*
Reporting area
Chlamydia trachomatis infection Cryptosporidiosis
Current week
Previous 52 weeks Cum 2010
Cum 2009
Current week
Previous 52 weeks Cum 2010
Cum 2009Med Max Med Max
United States 11,987 23,850 26,342 1,112,919 1,151,894 64 120 342 7,123 6,917New England 731 759 1,396 37,043 37,042 2 7 77 425 432
Connecticut 122 198 736 9,389 10,594 — 0 71 71 38Maine† — 49 69 1,996 2,250 — 1 7 74 47Massachusetts 408 399 695 19,020 17,717 — 3 8 148 169New Hampshire 60 43 114 2,283 1,971 — 1 5 51 79Rhode Island† 118 64 120 3,206 3,394 — 0 2 13 22Vermont† 23 23 51 1,149 1,116 2 1 5 68 77
Mid. Atlantic 1,895 3,375 5,027 158,925 146,305 5 15 38 785 778New Jersey 519 516 691 24,908 22,686 — 1 4 36 51New York (Upstate) 826 687 2,530 32,372 29,124 5 3 16 202 202New York City — 1,213 2,738 57,635 54,555 — 2 5 93 80Pennsylvania 550 933 1,092 44,010 39,940 — 8 26 454 445
E.N. Central 721 3,486 4,127 161,641 184,912 6 30 122 1,903 1,628Illinois 11 761 1,225 35,060 56,746 — 4 21 265 149Indiana — 372 797 17,664 20,521 — 3 10 143 269Michigan 460 923 1,419 44,444 42,908 1 5 18 300 270Ohio 143 981 1,085 44,932 45,161 5 7 24 431 363Wisconsin 107 424 512 19,541 19,576 — 9 57 764 577
W.N. Central 189 1,360 1,565 62,928 65,826 9 22 83 1,241 1,050Iowa 15 202 270 9,479 8,842 — 4 24 316 198Kansas 28 189 235 8,814 9,905 4 2 9 130 100Minnesota — 282 340 12,259 13,387 — 0 16 98 321Missouri 116 503 616 23,774 24,105 2 4 30 357 177Nebraska† — 93 237 4,198 5,081 2 2 26 222 114North Dakota 9 30 89 1,532 1,734 1 0 18 31 12South Dakota 21 62 77 2,872 2,772 — 2 6 87 128
S. Atlantic 3,762 4,736 5,681 223,144 233,333 16 18 51 940 1,069Delaware 99 84 220 4,094 4,364 — 0 2 7 10District of Columbia — 91 177 4,387 6,258 — 0 1 5 7Florida 700 1,469 1,737 68,802 68,203 12 7 19 357 430Georgia 221 622 1,229 29,717 37,533 3 5 31 279 322Maryland† 677 453 1,031 21,448 21,090 — 1 3 33 41North Carolina 686 765 1,562 37,241 38,231 — 0 12 73 108South Carolina† 590 524 748 25,294 25,055 — 1 8 82 58Virginia† 721 596 902 28,599 29,188 1 2 8 88 77West Virginia 68 73 117 3,562 3,411 — 0 3 16 16
E.S. Central 437 1,746 2,414 80,542 86,741 1 4 19 304 216Alabama† — 495 757 23,968 24,418 — 2 13 150 62Kentucky 337 264 614 13,395 12,174 — 1 6 79 62Mississippi — 377 780 17,518 22,252 — 0 3 22 18Tennessee† 100 573 747 25,661 27,897 1 1 5 53 74
W.S. Central 1,347 3,016 4,582 147,448 149,303 2 7 39 405 533Arkansas† 286 268 392 11,452 13,457 — 0 3 31 54Louisiana 210 286 1,731 15,385 25,516 — 1 6 60 53Oklahoma — 261 1,374 13,728 13,147 2 1 8 80 120Texas† 851 2,222 3,194 106,883 97,183 — 4 30 234 306
Mountain 931 1,455 1,912 70,019 73,891 2 10 29 518 535Arizona 321 515 713 24,290 23,823 — 1 3 35 33Colorado 185 359 560 16,009 18,401 1 2 8 129 133Idaho† 82 69 200 3,654 3,516 1 2 7 89 90Montana† — 60 82 2,733 2,780 — 1 4 46 53Nevada† 159 172 337 8,545 9,286 — 0 6 31 25New Mexico† 184 162 453 7,411 8,505 — 2 12 113 140Utah — 121 176 5,630 5,730 — 1 5 59 39Wyoming† — 36 79 1,747 1,850 — 0 2 16 22
Pacific 1,974 3,658 5,350 171,229 174,541 21 12 28 602 676Alaska — 113 148 5,224 4,804 — 0 1 5 6California 1,397 2,806 4,406 131,258 133,700 14 8 18 353 408Hawaii 1 112 158 5,361 5,657 — 0 1 1 1Oregon 282 212 468 10,500 10,423 1 3 13 166 179Washington 294 399 500 18,886 19,957 6 1 8 77 82
TerritoriesAmerican Samoa — 0 0 — — N 0 0 N NC.N.M.I. — — — — — — — — — —Guam — 7 31 259 327 — 0 0 — —Puerto Rico — 92 265 4,950 6,765 N 0 0 N NU.S. Virgin Islands — 11 29 323 469 — 0 0 — —
C.N.M.I.: Commonwealth of Northern Mariana Islands.U: Unavailable. —: No reported cases. N: Not reportable. NN: Not Nationally Notifiable. Cum: Cumulative year-to-date counts. Med: Median. Max: Maximum.* Case counts for reporting year 2010 are provisional and subject to change. For further information on interpretation of these data, see http://www.cdc.gov/ncphi/disss/nndss/phs/files/
ProvisionalNationa%20NotifiableDiseasesSurveillanceData20100927.pdf. Data for HIV/AIDS, AIDS and TB, when available, are displayed in Table IV, which appears quarterly.† Contains data reported through the National Electronic Disease Surveillance System (NEDSS).

MMWR Morbidity and Mortality Weekly Report
1596 MMWR / December 10, 2010 / Vol. 59 / No. 48
TABLE II. (Continued) Provisional cases of selected notifiable diseases, United States, weeks ending December 4, 2010, and December 5, 2009 (48th week)*
Dengue Virus Infection
Reporting area
Dengue Fever† Dengue Hemorrhagic Fever§
Current week
Previous 52 weeks Cum 2010
Cum 2009
Current week
Previous 52 weeks Cum 2010
Cum 2009Med Max Med Max
United States — 6 36 459 NN — 0 2 5 NNNew England — 0 3 8 NN — 0 0 — NN
Connecticut — 0 0 — NN — 0 0 — NNMaine¶ — 0 2 5 NN — 0 0 — NNMassachusetts — 0 0 — NN — 0 0 — NNNew Hampshire — 0 0 — NN — 0 0 — NNRhode Island¶ — 0 0 — NN — 0 0 — NNVermont¶ — 0 1 3 NN — 0 0 — NN
Mid. Atlantic — 2 12 132 NN — 0 1 1 NNNew Jersey — 0 0 — NN — 0 0 — NNNew York (Upstate) — 0 0 — NN — 0 0 — NNNew York City — 1 12 115 NN — 0 1 1 NNPennsylvania — 0 2 17 NN — 0 0 — NN
E.N. Central — 0 5 41 NN — 0 1 1 NNIllinois — 0 0 — NN — 0 0 — NNIndiana — 0 2 11 NN — 0 0 — NNMichigan — 0 2 9 NN — 0 0 — NNOhio — 0 2 16 NN — 0 0 — NNWisconsin — 0 2 5 NN — 0 1 1 NN
W.N. Central — 0 2 17 NN — 0 0 — NNIowa — 0 1 2 NN — 0 0 — NNKansas — 0 1 1 NN — 0 0 — NNMinnesota — 0 2 13 NN — 0 0 — NNMissouri — 0 0 — NN — 0 0 — NNNebraska¶ — 0 0 — NN — 0 0 — NNNorth Dakota — 0 1 1 NN — 0 0 — NNSouth Dakota — 0 0 — NN — 0 0 — NN
S. Atlantic — 2 17 213 NN — 0 1 2 NNDelaware — 0 0 — NN — 0 0 — NNDistrict of Columbia — 0 0 — NN — 0 0 — NNFlorida — 2 14 174 NN — 0 1 2 NNGeorgia — 0 2 11 NN — 0 0 — NNMaryland¶ — 0 0 — NN — 0 0 — NNNorth Carolina — 0 1 4 NN — 0 0 — NNSouth Carolina¶ — 0 3 10 NN — 0 0 — NNVirginia¶ — 0 3 12 NN — 0 0 — NNWest Virginia — 0 1 2 NN — 0 0 — NN
E.S. Central — 0 2 5 NN — 0 0 — NNAlabama¶ — 0 2 2 NN — 0 0 — NNKentucky — 0 1 1 NN — 0 0 — NNMississippi — 0 1 1 NN — 0 0 — NNTennessee¶ — 0 1 1 NN — 0 0 — NN
W.S. Central — 0 1 4 NN — 0 1 1 NNArkansas¶ — 0 0 — NN — 0 1 1 NNLouisiana — 0 0 — NN — 0 0 — NNOklahoma — 0 1 4 NN — 0 0 — NNTexas¶ — 0 0 — NN — 0 0 — NN
Mountain — 0 2 16 NN — 0 0 — NNArizona — 0 1 6 NN — 0 0 — NNColorado — 0 0 — NN — 0 0 — NNIdaho¶ — 0 1 2 NN — 0 0 — NNMontana¶ — 0 1 3 NN — 0 0 — NNNevada¶ — 0 1 4 NN — 0 0 — NNNew Mexico¶ — 0 1 1 NN — 0 0 — NNUtah — 0 0 — NN — 0 0 — NNWyoming¶ — 0 0 — NN — 0 0 — NN
Pacific — 0 5 23 NN — 0 0 — NNAlaska — 0 0 — NN — 0 0 — NNCalifornia — 0 5 11 NN — 0 0 — NNHawaii — 0 0 — NN — 0 0 — NNOregon — 0 0 — NN — 0 0 — NNWashington — 0 2 12 NN — 0 0 — NN
TerritoriesAmerican Samoa — 0 0 — NN — 0 0 — NNC.N.M.I. — — — — NN — — — — NNGuam — 0 0 — NN — 0 0 — NNPuerto Rico — 109 535 9,692 NN — 0 3 37 NNU.S. Virgin Islands — 0 0 — NN — 0 0 — NN
C.N.M.I.: Commonwealth of Northern Mariana Islands.U: Unavailable. —: No reported cases. N: Not reportable. NN: Not Nationally Notifiable. Cum: Cumulative year-to-date counts. Med: Median. Max: Maximum.* Case counts for reporting year 2010 are provisional and subject to change. For further information on interpretation of these data, see http://www.cdc.gov/ncphi/disss/nndss/phs/files/
ProvisionalNationa%20NotifiableDiseasesSurveillanceData20100927.pdf. Data for HIV/AIDS, AIDS and TB, when available, are displayed in Table IV, which appears quarterly.† Dengue Fever includes cases that meet criteria for Dengue Fever with hemorrhage, other clinical, and unknown case classifications. § DHF includes cases that meet criteria for dengue shock syndrome (DSS), a more severe form of DHF.¶ Contains data reported through the National Electronic Disease Surveillance System (NEDSS).

MMWR Morbidity and Mortality Weekly Report
MMWR / December 10, 2010 / Vol. 59 / No. 48 1597
TABLE II. (Continued) Provisional cases of selected notifiable diseases, United States, weeks ending December 4, 2010, and December 5, 2009 (48th week)*
Ehrlichiosis/Anaplasmosis†
Reporting area
Ehrlichia chaffeensis Anaplasma phagocytophilum Undetermined
Current week
Previous 52 weeks Cum 2010
Cum 2009
Current week
Previous 52 weeks Cum 2010
Cum 2009
Current week
Previous 52 weeks Cum 2010
Cum 2009Med Max Med Max Med Max
United States 3 8 181 574 900 10 11 309 747 899 — 1 35 98 164New England — 0 2 6 52 — 1 8 81 261 — 0 2 8 2
Connecticut — 0 0 — — — 0 5 25 17 — 0 2 6 —Maine§ — 0 1 4 5 — 0 2 16 14 — 0 0 — —Massachusetts — 0 0 — 9 — 0 2 — 97 — 0 0 — —New Hampshire — 0 1 2 4 — 0 3 16 19 — 0 1 2 1Rhode Island§ — 0 1 — 33 — 0 7 24 114 — 0 0 — 1Vermont§ — 0 0 — 1 — 0 0 — — — 0 0 — —
Mid. Atlantic 1 1 15 50 189 10 3 17 206 303 — 0 2 4 44New Jersey — 0 2 — 100 — 0 1 1 70 — 0 0 — —New York (Upstate) 1 0 15 29 53 10 3 17 202 222 — 0 1 4 6New York City — 0 3 20 10 — 0 1 3 9 — 0 0 — 1Pennsylvania — 0 1 1 26 — 0 1 — 2 — 0 1 — 37
E.N. Central — 0 4 32 84 — 4 39 365 277 — 1 7 61 71Illinois — 0 2 12 33 — 0 2 7 6 — 0 2 3 3Indiana — 0 0 — — — 0 0 — — — 0 3 28 36Michigan — 0 1 2 6 — 0 0 — — — 0 1 4 —Ohio — 0 3 6 13 — 0 1 2 1 — 0 0 — 2Wisconsin — 0 1 12 32 — 4 39 356 270 — 0 4 26 30
W.N. Central — 1 13 123 153 — 0 261 14 35 — 0 30 11 20Iowa — 0 0 — — — 0 0 — — — 0 0 — —Kansas — 0 1 6 6 — 0 0 — 1 — 0 0 — —Minnesota — 0 6 — 2 — 0 261 — 29 — 0 30 — 7Missouri — 1 13 115 143 — 0 3 14 4 — 0 3 11 13Nebraska§ — 0 1 2 2 — 0 0 — 1 — 0 0 — —North Dakota — 0 0 — — — 0 0 — — — 0 0 — —South Dakota — 0 0 — — — 0 0 — — — 0 0 — —
S. Atlantic — 4 19 247 255 — 1 7 57 17 — 0 2 7 2Delaware — 0 3 17 22 — 0 1 4 2 — 0 0 — —District of Columbia — 0 0 — — — 0 0 — — — 0 0 — —Florida — 0 2 8 12 — 0 1 3 3 — 0 0 — —Georgia — 0 4 22 18 — 0 1 2 1 — 0 1 1 —Maryland§ — 0 3 24 42 — 0 2 15 4 — 0 2 3 —North Carolina — 2 13 100 61 — 0 4 21 3 — 0 0 — —South Carolina§ — 0 2 3 12 — 0 1 1 — — 0 0 — —Virginia§ — 1 13 72 87 — 0 2 11 4 — 0 1 3 2West Virginia — 0 1 1 1 — 0 0 — — — 0 1 — —
E.S. Central — 1 10 85 134 — 0 2 18 3 — 0 1 6 24Alabama§ — 0 3 11 9 — 0 2 7 1 — 0 0 — —Kentucky — 0 2 16 12 — 0 0 — — — 0 0 — —Mississippi — 0 1 3 6 — 0 1 1 — — 0 0 — —Tennessee§ — 0 6 55 107 — 0 2 10 2 — 0 1 6 24
W.S. Central 2 0 141 30 30 — 0 23 6 1 — 0 1 1 —Arkansas§ 2 0 34 11 4 — 0 6 3 — — 0 0 — —Louisiana — 0 1 1 — — 0 0 — — — 0 0 — —Oklahoma — 0 105 15 24 — 0 16 2 1 — 0 0 — —Texas§ — 0 2 3 2 — 0 1 1 — — 0 1 1 —
Mountain — 0 0 — — — 0 0 — — — 0 0 — 1Arizona — 0 0 — — — 0 0 — — — 0 0 — 1Colorado — 0 0 — — — 0 0 — — — 0 0 — —Idaho§ — 0 0 — — — 0 0 — — — 0 0 — —Montana§ — 0 0 — — — 0 0 — — — 0 0 — —Nevada§ — 0 0 — — — 0 0 — — — 0 0 — —New Mexico§ — 0 0 — — — 0 0 — — — 0 0 — —Utah — 0 0 — — — 0 0 — — — 0 0 — —Wyoming§ — 0 0 — — — 0 0 — — — 0 0 — —
Pacific — 0 1 1 3 — 0 0 — 2 — 0 1 — —Alaska — 0 0 — — — 0 0 — — — 0 0 — —California — 0 1 1 3 — 0 0 — 2 — 0 1 — —Hawaii — 0 0 — — — 0 0 — — — 0 0 — —Oregon — 0 0 — — — 0 0 — — — 0 0 — —Washington — 0 0 — — — 0 0 — — — 0 0 — —
TerritoriesAmerican Samoa — 0 0 — — — 0 0 — — — 0 0 — —C.N.M.I. — — — — — — — — — — — — — — —Guam — 0 0 — — — 0 0 — — — 0 0 — —Puerto Rico — 0 0 — — — 0 0 — — — 0 0 — —U.S. Virgin Islands — 0 0 — — — 0 0 — — — 0 0 — —
C.N.M.I.: Commonwealth of Northern Mariana Islands.U: Unavailable. —: No reported cases. N: Not reportable. NN: Not Nationally Notifiable. Cum: Cumulative year-to-date counts. Med: Median. Max: Maximum.* Case counts for reporting year 2010 are provisional and subject to change. For further information on interpretation of these data, see http://www.cdc.gov/ncphi/disss/nndss/phs/files/
ProvisionalNationa%20NotifiableDiseasesSurveillanceData20100927.pdf. Data for HIV/AIDS, AIDS and TB, when available, are displayed in Table IV, which appears quarterly.† Cumulative total E. ewingii cases reported for year 2010 = 10.§ Contains data reported through the National Electronic Disease Surveillance System (NEDSS).

MMWR Morbidity and Mortality Weekly Report
1598 MMWR / December 10, 2010 / Vol. 59 / No. 48
TABLE II. (Continued) Provisional cases of selected notifiable diseases, United States, weeks ending December 4, 2010, and December 5, 2009 (48th week)*
Reporting area
Giardiasis GonorrheaHaemophilus influenzae, invasive†
All ages, all serotypes
Current week
Previous 52 weeks Cum 2010
Cum 2009
Current week
Previous 52 weeks Cum 2010
Cum 2009
Current week
Previous 52 weeks Cum 2010
Cum 2009Med Max Med Max Med Max
United States 200 341 666 16,460 17,749 2,918 5,565 6,382 260,808 279,857 45 59 171 2,664 2,629New England 10 31 54 1,458 1,641 183 102 196 4,981 4,616 3 3 21 171 179
Connecticut — 5 13 236 273 116 39 169 2,151 2,220 3 0 15 43 48Maine§ 6 4 12 215 200 — 3 11 136 128 — 0 2 11 19Massachusetts — 13 24 637 707 62 46 81 2,234 1,812 — 2 8 86 86New Hampshire 1 3 8 135 190 4 3 7 147 105 — 0 2 11 12Rhode Island§ — 1 7 60 60 1 5 14 266 307 — 0 2 11 9Vermont§ 3 4 10 175 211 — 0 17 47 44 — 0 1 9 5
Mid. Atlantic 46 63 103 2,956 3,211 397 688 1,157 33,636 29,313 7 11 34 531 536New Jersey — 6 14 293 404 129 112 176 5,503 4,470 — 2 7 84 118New York (Upstate) 27 22 84 1,094 1,239 110 104 422 5,367 5,380 6 3 20 148 145New York City 8 17 33 855 774 — 230 528 11,058 10,246 — 2 6 102 68Pennsylvania 11 14 27 714 794 158 249 366 11,708 9,217 1 4 9 197 205
E.N. Central 25 54 83 2,640 2,731 240 942 1,260 44,428 59,011 5 10 20 443 413Illinois — 12 26 532 576 8 186 366 8,357 18,795 — 3 9 136 155Indiana — 5 14 207 285 — 99 222 4,999 6,481 — 1 6 75 75Michigan 3 13 25 629 620 142 249 471 12,283 13,904 — 0 3 32 24Ohio 21 16 29 806 764 64 318 380 14,424 14,963 5 2 6 110 91Wisconsin 1 8 32 466 486 26 93 155 4,365 4,868 — 2 5 90 68
W.N. Central 13 24 165 1,321 1,751 55 280 357 13,106 13,905 6 3 24 154 151Iowa 1 5 11 267 276 7 33 57 1,620 1,570 — 0 1 1 —Kansas 1 4 10 199 152 7 37 62 1,813 2,367 — 0 2 15 13Minnesota — 0 135 136 539 — 38 62 1,734 2,155 — 0 17 25 54Missouri 5 8 26 404 487 41 137 178 6,430 6,066 3 1 6 79 56Nebraska§ 6 4 9 207 162 — 20 50 995 1,293 3 0 2 24 22North Dakota — 0 7 29 25 — 2 11 102 133 — 0 4 10 6South Dakota — 1 7 79 110 — 8 19 412 321 — 0 0 — —
S. Atlantic 42 71 143 3,389 3,463 1,052 1,348 1,787 64,705 69,777 15 14 27 696 712Delaware — 0 5 30 25 17 18 48 916 891 — 0 1 5 4District of Columbia — 1 5 35 70 — 33 66 1,647 2,446 — 0 1 4 5Florida 34 39 87 1,973 1,800 242 392 493 18,581 19,537 8 3 9 177 207Georgia — 9 51 485 701 79 211 421 9,888 12,829 2 3 9 162 139Maryland§ 2 5 11 246 264 206 132 237 6,276 5,748 3 1 6 63 81North Carolina N 0 0 N N 222 246 596 12,473 12,950 1 2 9 114 97South Carolina§ — 2 9 124 102 129 152 232 7,450 7,846 — 2 7 72 70Virginia§ 3 9 36 451 449 144 152 265 6,947 7,081 — 2 4 72 82West Virginia 3 0 6 45 52 13 10 26 527 449 1 0 5 27 27
E.S. Central 5 6 15 265 386 98 465 697 21,901 24,893 — 3 12 156 153Alabama§ 5 4 11 208 185 — 146 217 6,976 7,041 — 0 3 24 36Kentucky N 0 0 N N 77 72 142 3,475 3,517 — 1 2 32 19Mississippi N 0 0 N N — 110 216 5,036 6,890 — 0 2 11 8Tennessee§ — 1 9 57 201 21 137 194 6,414 7,445 — 2 10 89 90
W.S. Central 3 8 16 355 482 402 830 1,303 40,080 43,639 5 2 20 123 116Arkansas§ 2 2 7 125 141 82 77 133 3,510 4,197 — 0 3 16 20Louisiana 1 3 9 167 188 93 86 508 4,461 8,300 — 0 4 24 20Oklahoma — 2 7 63 153 — 78 359 4,041 4,166 5 1 15 75 72Texas§ N 0 0 N N 227 582 964 28,068 26,976 — 0 2 8 4
Mountain 10 30 50 1,509 1,556 139 180 262 8,332 8,663 4 5 15 269 229Arizona — 3 8 146 194 43 63 109 2,864 2,904 — 2 10 97 75Colorado 7 13 27 652 468 28 53 95 2,482 2,606 2 1 5 77 63Idaho§ 2 4 9 191 196 13 2 7 121 98 1 0 2 18 4Montana§ — 2 7 97 127 — 2 6 95 73 — 0 1 2 1Nevada§ 1 1 11 96 102 28 29 94 1,485 1,590 1 0 2 9 18New Mexico§ — 2 5 92 110 27 20 41 981 998 — 1 5 39 33Utah — 4 11 199 295 — 5 15 275 324 — 0 4 21 32Wyoming§ — 1 5 36 64 — 0 4 29 70 — 0 2 6 3
Pacific 46 53 133 2,567 2,528 352 606 815 29,639 26,040 — 2 21 121 140Alaska — 2 6 88 106 — 24 37 1,128 908 — 0 2 20 20California 32 33 61 1,592 1,657 294 497 691 24,366 21,392 — 0 18 22 40Hawaii — 0 4 33 20 4 14 25 693 592 — 0 2 9 28Oregon 2 9 20 441 381 9 19 42 928 1,016 — 1 5 64 49Washington 12 8 75 413 364 45 52 80 2,524 2,132 — 0 4 6 3
TerritoriesAmerican Samoa — 0 0 — — — 0 0 — — — 0 0 — —C.N.M.I. — — — — — — — — — — — — — — —Guam — 0 1 2 3 — 0 4 30 19 — 0 0 — —Puerto Rico — 1 8 65 147 — 6 14 274 216 — 0 1 1 4U.S. Virgin Islands — 0 0 — — — 2 7 78 114 — 0 0 — —
C.N.M.I.: Commonwealth of Northern Mariana Islands.U: Unavailable. —: No reported cases. N: Not reportable. NN: Not Nationally Notifiable. Cum: Cumulative year-to-date counts. Med: Median. Max: Maximum.* Case counts for reporting year 2010 are provisional and subject to change. For further information on interpretation of these data, see http://www.cdc.gov/ncphi/disss/nndss/phs/files/
ProvisionalNationa%20NotifiableDiseasesSurveillanceData20100927.pdf. Data for HIV/AIDS, AIDS and TB, when available, are displayed in Table IV, which appears quarterly.† Data for H. influenzae (age <5 yrs for serotype b, nonserotype b, and unknown serotype) are available in Table I.§ Contains data reported through the National Electronic Disease Surveillance System (NEDSS).

MMWR Morbidity and Mortality Weekly Report
MMWR / December 10, 2010 / Vol. 59 / No. 48 1599
TABLE II. (Continued) Provisional cases of selected notifiable diseases, United States, weeks ending December 4, 2010, and December 5, 2009 (48th week)*
Hepatitis (viral, acute), by type
Reporting area
A B C
Current week
Previous 52 weeks Cum 2010
Cum 2009
Current week
Previous 52 weeks Cum 2010
Cum 2009
Current week
Previous 52 weeks Cum 2010
Cum 2009Med Max Med Max Med Max
United States 23 30 69 1,420 1,823 28 63 204 2,854 2,997 7 14 44 753 699New England — 2 5 85 103 — 1 5 48 51 — 1 4 39 63
Connecticut — 0 3 27 18 — 0 2 19 15 — 0 4 27 50Maine† — 0 1 7 1 — 0 2 13 15 — 0 0 — 2Massachusetts — 1 5 41 67 — 0 2 8 17 — 0 1 10 10New Hampshire — 0 1 2 7 — 0 2 6 4 N 0 0 N NRhode Island† — 0 4 8 8 U 0 0 U U U 0 0 U UVermont† — 0 0 — 2 — 0 1 2 — — 0 1 2 1
Mid. Atlantic 3 4 10 193 252 2 5 10 260 308 1 2 6 102 94New Jersey — 0 3 14 61 — 1 5 66 91 — 0 2 14 7New York (Upstate) 2 1 4 57 44 2 1 6 51 47 — 1 4 56 44New York City — 1 5 70 83 — 2 4 77 67 — 0 1 1 5Pennsylvania 1 1 4 52 64 — 1 5 66 103 1 0 3 31 38
E.N. Central 2 4 9 200 275 1 9 17 425 404 1 2 8 109 84Illinois — 1 3 44 122 — 1 5 80 114 — 0 1 2 4Indiana — 0 2 17 16 — 1 5 50 68 — 0 2 21 19Michigan 1 1 5 67 71 1 3 6 116 118 1 1 5 70 32Ohio 1 1 5 46 35 — 2 6 85 82 — 0 1 8 26Wisconsin — 0 3 26 31 — 2 8 94 22 — 0 2 8 3
W.N. Central — 1 13 74 111 1 2 15 110 131 — 0 11 24 22Iowa — 0 3 11 35 — 0 2 13 34 — 0 1 — 10Kansas — 0 3 12 12 — 0 2 8 6 — 0 2 3 1Minnesota — 0 12 15 19 — 0 13 8 24 — 0 9 12 6Missouri — 0 2 23 21 1 1 3 68 43 — 0 1 7 —Nebraska† — 0 4 12 20 — 0 2 12 21 — 0 1 2 3North Dakota — 0 1 — 1 — 0 0 — — — 0 1 — 1South Dakota — 0 1 1 3 — 0 1 1 3 — 0 0 — 1
S. Atlantic 3 7 14 321 399 8 17 40 811 819 3 4 7 162 163Delaware — 0 1 7 4 — 0 2 23 31 U 0 0 U UDistrict of Columbia — 0 1 1 1 — 0 1 3 10 — 0 1 2 1Florida 2 3 7 132 162 5 6 11 278 272 2 1 5 54 48Georgia — 1 3 35 48 1 3 7 138 136 — 0 2 9 31Maryland† — 0 3 23 45 — 1 6 70 69 1 0 3 26 22North Carolina — 0 5 45 36 — 1 16 91 99 — 1 3 40 22South Carolina† — 0 3 22 60 — 1 4 53 53 — 0 1 1 1Virginia† 1 1 6 48 38 2 2 14 93 88 — 0 2 13 10West Virginia — 0 5 8 5 — 0 14 62 61 — 0 5 17 28
E.S. Central 2 1 3 41 39 5 7 13 334 318 — 3 8 143 98Alabama† 2 0 1 8 11 — 1 4 61 82 — 0 1 6 8Kentucky — 0 3 19 10 — 2 8 121 83 — 2 6 99 59Mississippi — 0 1 2 8 — 1 3 34 31 U 0 0 U UTennessee† — 0 2 12 10 5 2 8 118 122 — 1 4 38 31
W.S. Central 5 3 19 134 181 8 9 109 456 534 2 1 14 69 54Arkansas† — 0 1 2 11 — 0 4 41 61 — 0 0 — 2Louisiana — 0 2 12 6 — 1 4 45 66 — 0 1 9 8Oklahoma — 0 3 1 6 2 2 19 89 98 2 0 12 30 12Texas† 5 2 18 119 158 6 5 87 281 309 — 0 3 30 32
Mountain — 3 8 135 151 1 3 8 128 123 — 1 5 50 49Arizona — 1 5 60 63 — 1 2 30 40 U 0 0 U UColorado — 1 3 34 47 — 0 5 40 25 — 0 1 12 26Idaho† — 0 2 7 5 — 0 1 6 11 — 0 2 9 6Montana† — 0 1 4 6 — 0 1 1 1 — 0 1 2 1Nevada† — 0 2 14 13 1 1 3 38 31 — 0 1 6 4New Mexico† — 0 1 5 8 — 0 1 5 6 — 0 2 11 6Utah — 0 1 8 7 — 0 1 5 5 — 0 2 10 6Wyoming† — 0 3 3 2 — 0 1 3 4 — 0 0 — —
Pacific 8 5 17 237 312 2 6 20 282 309 — 1 6 55 72Alaska — 0 1 3 2 — 0 1 3 4 U 0 0 U UCalifornia 8 4 16 195 247 2 4 17 198 219 — 0 4 22 38Hawaii — 0 2 4 8 — 0 1 3 6 U 0 0 U UOregon — 0 2 17 16 — 1 3 35 40 — 0 3 14 17Washington — 0 2 18 39 — 1 4 43 40 — 0 6 19 15
TerritoriesAmerican Samoa — 0 0 — — — 0 0 — — — 0 0 — —C.N.M.I. — — — — — — — — — — — — — — —Guam — 0 6 18 6 — 1 6 40 54 — 1 7 35 48Puerto Rico — 0 2 13 21 — 0 2 18 32 — 0 0 — —U.S. Virgin Islands — 0 0 — — — 0 0 — — — 0 0 — —
C.N.M.I.: Commonwealth of Northern Mariana Islands.U: Unavailable. —: No reported cases. N: Not reportable. NN: Not Nationally Notifiable. Cum: Cumulative year-to-date counts. Med: Median. Max: Maximum.* Case counts for reporting year 2010 are provisional and subject to change. For further information on interpretation of these data, see http://www.cdc.gov/ncphi/disss/nndss/phs/files/
ProvisionalNationa%20NotifiableDiseasesSurveillanceData20100927.pdf. Data for HIV/AIDS, AIDS and TB, when available, are displayed in Table IV, which appears quarterly.† Contains data reported through the National Electronic Disease Surveillance System (NEDSS).

MMWR Morbidity and Mortality Weekly Report
1600 MMWR / December 10, 2010 / Vol. 59 / No. 48
TABLE II. (Continued) Provisional cases of selected notifiable diseases, United States, weeks ending December 4, 2010, and December 5, 2009 (48th week)*
Reporting area
Legionellosis Lyme disease Malaria
Current week
Previous 52 weeks Cum 2010
Cum 2009
Current week
Previous 52 weeks Cum 2010
Cum 2009
Current week
Previous 52 weeks Cum 2010
Cum 2009Med Max Med Max Med Max
United States 41 57 114 2,951 3,259 130 403 2,336 25,873 35,247 16 27 89 1,357 1,290New England 2 3 15 217 186 28 119 478 7,632 12,070 — 2 4 65 56
Connecticut 2 0 6 49 51 — 41 204 2,539 4,077 — 0 1 1 5Maine† — 0 4 12 8 25 11 76 673 854 — 0 1 5 2Massachusetts — 1 8 103 88 — 37 206 2,763 5,144 — 1 3 45 36New Hampshire — 0 5 21 13 1 23 67 1,178 1,373 — 0 2 4 4Rhode Island† — 0 4 23 19 — 1 40 149 228 — 0 1 7 5Vermont† — 0 2 9 7 2 4 27 330 394 — 0 1 3 4
Mid. Atlantic 16 14 44 810 1,136 59 177 726 11,868 15,351 2 7 17 368 382New Jersey — 2 11 93 210 — 46 212 3,100 4,879 — 0 4 1 95New York (Upstate) 9 5 19 271 336 38 52 577 2,745 3,862 2 1 6 70 45New York City — 2 14 140 220 — 1 14 67 1,020 — 4 14 242 190Pennsylvania 7 5 18 306 370 21 82 383 5,956 5,590 — 1 3 55 52
E.N. Central 8 11 41 653 688 7 14 270 2,298 2,920 1 3 9 137 163Illinois — 1 15 120 125 — 1 17 123 136 — 1 7 51 68Indiana — 2 6 102 60 — 1 7 69 81 — 0 2 8 23Michigan 1 3 20 165 159 — 1 13 91 99 — 0 4 29 28Ohio 7 4 15 220 270 7 0 5 34 55 1 0 5 39 35Wisconsin — 0 11 46 74 — 12 243 1,981 2,549 — 0 1 10 9
W.N. Central 1 1 19 104 114 — 2 1,395 115 261 — 1 11 67 64Iowa — 0 1 — 23 — 1 10 80 106 — 0 2 13 10Kansas — 0 2 11 7 — 0 1 6 18 — 0 2 11 8Minnesota — 0 16 35 12 — 0 1,380 — 128 — 0 11 3 24Missouri — 0 4 33 57 — 0 1 1 3 — 0 3 21 12Nebraska† — 0 2 9 12 — 0 2 9 5 — 0 2 15 8North Dakota 1 0 1 7 1 — 0 15 18 — — 0 1 1 1South Dakota — 0 2 9 2 — 0 1 1 1 — 0 2 3 1
S. Atlantic 6 10 27 505 556 33 59 175 3,594 4,180 3 7 42 390 341Delaware 1 0 3 16 19 2 11 32 600 950 — 0 1 2 5District of Columbia — 0 4 15 23 — 0 4 27 61 — 0 2 9 17Florida 4 3 9 163 175 3 2 10 97 105 3 2 7 123 84Georgia — 1 4 52 58 — 0 2 11 40 — 0 5 45 66Maryland† 1 2 6 108 143 9 24 100 1,553 1,976 — 1 22 93 75North Carolina — 0 7 53 58 — 1 9 80 93 — 0 13 47 30South Carolina† — 0 2 10 12 — 0 3 28 41 — 0 1 4 5Virginia† — 1 8 74 59 19 18 79 1,077 750 — 1 5 64 57West Virginia — 0 3 14 9 — 0 32 121 164 — 0 2 3 2
E.S. Central 1 2 10 124 137 — 1 4 44 36 1 0 3 30 31Alabama† — 0 2 18 17 — 0 1 2 3 — 0 1 9 9Kentucky — 0 4 26 52 — 0 1 5 1 1 0 3 7 9Mississippi — 0 3 10 4 — 0 0 — — — 0 2 2 4Tennessee† 1 1 6 70 64 — 0 4 37 32 — 0 2 12 9
W.S. Central 2 3 14 139 123 — 2 44 94 216 — 1 31 77 64Arkansas† 1 0 2 15 8 — 0 0 — — — 0 1 2 5Louisiana — 0 3 8 14 — 0 1 2 — — 0 1 5 6Oklahoma — 0 4 13 6 — 0 2 — — — 0 1 5 1Texas† 1 2 10 103 95 — 2 42 92 216 — 1 30 65 52
Mountain 1 3 10 155 138 — 0 3 24 54 1 1 4 58 47Arizona — 1 6 59 43 — 0 1 2 6 — 0 2 22 10Colorado — 0 5 32 27 — 0 1 3 1 1 0 3 21 26Idaho† 1 0 1 7 7 — 0 2 7 15 — 0 1 3 2Montana† — 0 1 4 7 — 0 1 4 3 — 0 1 2 5Nevada† — 0 2 19 13 — 0 1 1 12 — 0 1 6 —New Mexico† — 0 2 9 9 — 0 2 5 5 — 0 1 1 —Utah — 0 2 20 28 — 0 1 2 9 — 0 1 3 4Wyoming† — 0 2 5 4 — 0 1 — 3 — 0 0 — —
Pacific 4 5 19 244 181 3 4 11 204 159 8 3 19 165 142Alaska — 0 2 2 1 — 0 1 6 7 — 0 1 3 2California 4 4 19 204 140 3 3 9 136 100 4 2 13 112 107Hawaii — 0 1 1 1 N 0 0 N N — 0 1 1 1Oregon — 0 3 14 16 — 1 4 49 37 — 0 3 14 11Washington — 0 4 23 23 — 0 3 13 15 4 0 5 35 21
TerritoriesAmerican Samoa — 0 0 — — N 0 0 N N — 0 0 — —C.N.M.I. — — — — — — — — — — — — — — —Guam — 0 1 1 — — 0 0 — — — 0 0 — —Puerto Rico — 0 1 — 2 N 0 0 N N — 0 2 4 5U.S. Virgin Islands — 0 0 — — — 0 0 — — — 0 0 — —
C.N.M.I.: Commonwealth of Northern Mariana Islands.U: Unavailable. —: No reported cases. N: Not reportable. NN: Not Nationally Notifiable. Cum: Cumulative year-to-date counts. Med: Median. Max: Maximum.* Case counts for reporting year 2010 are provisional and subject to change. For further information on interpretation of these data, see http://www.cdc.gov/ncphi/disss/nndss/phs/files/
ProvisionalNationa%20NotifiableDiseasesSurveillanceData20100927.pdf. Data for HIV/AIDS, AIDS and TB, when available, are displayed in Table IV, which appears quarterly.† Contains data reported through the National Electronic Disease Surveillance System (NEDSS).

MMWR Morbidity and Mortality Weekly Report
MMWR / December 10, 2010 / Vol. 59 / No. 48 1601
TABLE II. (Continued) Provisional cases of selected notifiable diseases, United States, weeks ending December 4, 2010, and December 5, 2009 (48th week)*
Reporting area
Meningococcal disease, invasive† All groups Pertussis Rabies, animal
Current week
Previous 52 weeks Cum 2010
Cum 2009
Current week
Previous 52 weeks Cum 2010
Cum 2009
Current week
Previous 52 weeks Cum 2010
Cum 2009Med Max Med Max Med Max
United States 6 15 43 695 881 353 373 1,756 18,586 14,235 41 64 143 3,102 4,822New England — 0 3 18 33 1 8 23 449 596 — 4 15 211 321
Connecticut — 0 2 3 6 — 1 8 106 53 — 0 14 59 132Maine§ — 0 1 4 4 1 1 5 45 80 — 1 4 58 51Massachusetts — 0 2 6 15 — 5 14 239 337 — 0 0 — —New Hampshire — 0 0 — 3 — 0 2 18 73 — 0 5 13 32Rhode Island§ — 0 0 — 4 — 0 9 26 42 — 0 4 31 43Vermont§ — 0 1 5 1 — 0 4 15 11 — 1 3 50 63
Mid. Atlantic 1 1 4 68 101 87 29 72 1,583 1,116 17 19 41 984 535New Jersey — 0 2 17 17 — 3 9 132 230 — 0 0 — —New York (Upstate) — 0 3 11 23 69 10 27 576 214 6 9 19 474 415New York City — 0 2 16 17 — 0 9 78 88 — 2 12 120 20Pennsylvania 1 0 2 24 44 18 11 54 797 584 11 8 24 390 100
E.N. Central — 2 9 118 159 87 90 174 4,657 2,951 — 2 27 223 218Illinois — 0 3 19 44 — 15 29 778 603 — 1 11 114 82Indiana — 0 3 24 34 — 9 26 504 359 — 0 0 — 25Michigan — 0 3 21 20 7 27 55 1,305 809 — 1 5 64 65Ohio — 1 2 31 40 80 28 71 1,626 1,015 — 0 12 45 46Wisconsin — 0 3 23 21 — 8 21 444 165 — 0 0 — —
W.N. Central — 1 5 49 80 24 32 627 2,186 2,052 1 4 16 243 371Iowa — 0 3 9 13 — 11 26 545 221 — 0 3 26 32Kansas — 0 2 7 13 — 3 9 150 233 — 1 4 59 73Minnesota — 0 2 2 13 — 0 601 698 421 — 0 9 26 60Missouri — 0 4 24 26 23 8 43 508 969 — 1 6 66 65Nebraska§ — 0 2 5 10 1 4 13 207 133 1 1 4 51 77North Dakota — 0 1 2 1 — 0 30 50 29 — 0 7 15 11South Dakota — 0 1 — 4 — 0 5 28 46 — 0 0 — 53
S. Atlantic 2 2 7 126 157 30 29 78 1,475 1,527 22 21 73 1,026 2,014Delaware — 0 1 2 2 — 0 4 14 13 — 0 0 — —District of Columbia — 0 0 — — — 0 1 7 6 — 0 0 — —Florida 1 1 5 57 50 10 5 28 300 486 — 0 60 72 161Georgia 1 0 2 13 30 1 3 18 220 217 — 0 8 — 387Maryland§ — 0 1 8 10 1 3 8 124 140 5 6 14 344 368North Carolina — 0 2 15 31 — 0 32 124 192 — 0 7 — 453South Carolina§ — 0 1 10 11 9 5 19 328 247 — 0 0 — —Virginia§ — 0 2 19 17 6 5 15 241 195 15 10 25 534 531West Virginia — 0 2 2 6 3 1 21 117 31 2 1 7 76 114
E.S. Central — 1 3 39 33 6 15 34 690 761 — 3 7 139 136Alabama§ — 0 1 7 10 — 4 8 179 288 — 1 4 49 —Kentucky — 0 2 17 6 — 5 14 232 216 — 0 4 21 45Mississippi — 0 1 5 3 2 1 8 71 74 — 0 1 1 4Tennessee§ — 0 2 10 14 4 4 11 208 183 — 1 4 68 87
W.S. Central — 1 9 79 86 57 56 753 2,669 3,059 1 0 30 69 881Arkansas§ — 0 1 6 9 — 3 29 159 329 — 0 7 28 38Louisiana — 0 4 12 18 — 1 3 36 144 — 0 0 — —Oklahoma — 0 7 15 14 23 0 41 89 75 1 0 30 41 32Texas§ — 1 7 46 45 34 48 681 2,385 2,511 — 0 7 — 811
Mountain 1 1 6 51 60 27 27 92 1,465 933 — 1 8 80 103Arizona — 0 2 13 13 — 7 16 379 250 — 0 5 — —Colorado 1 0 4 20 21 25 4 86 437 208 — 0 0 — —Idaho§ — 0 1 5 7 1 3 19 182 89 — 0 2 11 8Montana§ — 0 1 1 5 — 1 12 82 56 — 0 3 17 25Nevada§ — 0 1 8 4 — 0 7 32 24 — 0 2 8 6New Mexico§ — 0 1 3 3 1 2 11 128 72 — 0 2 13 26Utah — 0 1 1 2 — 4 13 215 212 — 0 2 10 13Wyoming§ — 0 0 — 5 — 0 2 10 22 — 0 4 21 25
Pacific 2 3 16 147 172 34 43 209 3,412 1,240 — 3 12 127 243Alaska — 0 1 1 6 — 0 6 38 55 — 0 2 12 12California 1 2 13 98 108 17 28 181 2,625 646 — 2 12 102 220Hawaii — 0 1 1 5 — 0 6 42 43 — 0 0 — —Oregon 1 1 2 31 40 1 6 16 303 243 — 0 2 13 11Washington — 0 7 16 13 16 5 38 404 253 — 0 0 — —
TerritoriesAmerican Samoa — 0 0 — — — 0 0 — — N 0 0 N NC.N.M.I. — — — — — — — — — — — — — — —Guam — 0 0 — — — 0 0 — 2 — 0 0 — —Puerto Rico — 0 0 — 1 — 0 1 3 1 — 1 3 40 39U.S. Virgin Islands — 0 0 — — — 0 0 — — — 0 0 — —
C.N.M.I.: Commonwealth of Northern Mariana Islands.U: Unavailable. —: No reported cases. N: Not reportable. NN: Not Nationally Notifiable. Cum: Cumulative year-to-date counts. Med: Median. Max: Maximum.* Case counts for reporting year 2010 are provisional and subject to change. For further information on interpretation of these data, see http://www.cdc.gov/ncphi/disss/nndss/phs/files/
ProvisionalNationa%20NotifiableDiseasesSurveillanceData20100927.pdf. Data for HIV/AIDS, AIDS and TB, when available, are displayed in Table IV, which appears quarterly.† Data for meningococcal disease, invasive caused by serogroups A, C, Y, and W-135; serogroup B; other serogroup; and unknown serogroup are available in Table I.§ Contains data reported through the National Electronic Disease Surveillance System (NEDSS).

MMWR Morbidity and Mortality Weekly Report
1602 MMWR / December 10, 2010 / Vol. 59 / No. 48
TABLE II. (Continued) Provisional cases of selected notifiable diseases, United States, weeks ending December 4, 2010, and December 5, 2009 (48th week)*
Reporting area
Salmonellosis Shiga toxin-producing E. coli (STEC)† Shigellosis
Current week
Previous 52 weeks Cum 2010
Cum 2009
Current week
Previous 52 weeks Cum 2010
Cum 2009
Current week
Previous 52 weeks Cum 2010
Cum 2009Med Max Med Max Med Max
United States 560 906 1,724 47,644 45,263 47 84 209 4,436 4,290 170 277 527 12,844 14,450New England 3 32 476 2,115 2,070 — 2 52 187 286 — 4 66 295 327
Connecticut — 0 460 460 430 — 0 52 52 67 — 0 61 61 43Maine§ 2 2 7 121 116 — 0 3 19 19 — 0 1 8 5Massachusetts — 23 54 1,164 1,082 — 1 8 77 102 — 4 16 202 230New Hampshire — 3 10 156 251 — 0 2 20 35 — 0 1 12 21Rhode Island§ — 2 17 140 131 — 0 1 2 38 — 0 3 11 23Vermont§ 1 1 5 74 60 — 0 2 17 25 — 0 1 1 5
Mid. Atlantic 29 95 219 5,392 5,155 5 9 31 499 407 4 34 53 1,461 2,631New Jersey — 18 57 997 1,060 — 1 7 74 99 — 6 16 315 562New York (Upstate) 16 25 78 1,342 1,220 4 3 13 190 141 3 4 19 212 207New York City — 25 56 1,270 1,198 — 1 7 77 56 — 5 14 278 430Pennsylvania 13 31 82 1,783 1,677 1 3 13 158 111 1 14 34 656 1,432
E.N. Central 27 88 245 5,039 4,877 — 9 39 692 689 4 27 238 1,555 2,377Illinois — 28 114 1,693 1,393 — 2 9 121 164 — 9 228 760 577Indiana — 11 62 622 586 — 1 9 67 93 — 1 5 38 68Michigan 3 15 48 864 913 — 2 16 149 130 1 5 9 227 214Ohio 24 24 47 1,246 1,337 — 3 11 136 124 3 6 23 289 1,040Wisconsin — 10 45 614 648 — 3 17 219 178 — 4 21 241 478
W.N. Central 25 45 98 2,327 2,481 5 11 39 617 703 14 44 88 1,932 1,143Iowa 5 9 34 499 378 — 2 16 165 154 — 1 5 47 51Kansas 2 8 19 420 378 2 1 6 70 54 — 5 14 252 187Minnesota — 0 32 178 529 — 0 13 31 204 — 0 3 14 74Missouri 18 13 44 784 618 2 4 27 231 133 14 39 75 1,557 792Nebraska§ — 4 13 237 330 1 1 6 71 83 — 1 10 55 31North Dakota — 0 39 50 64 — 0 10 17 8 — 0 5 — 4South Dakota — 3 15 159 184 — 0 4 32 67 — 0 2 7 4
S. Atlantic 233 268 609 14,799 13,392 19 13 30 698 632 39 46 127 2,507 2,229Delaware 1 3 11 169 136 — 0 2 6 13 — 0 5 39 142District of Columbia — 1 6 70 94 — 0 1 5 2 — 0 4 25 24Florida 108 121 227 5,915 6,137 10 4 13 231 163 25 18 53 1,064 436Georgia 40 41 132 2,618 2,263 — 1 15 103 68 7 14 39 725 619Maryland§ 17 16 54 978 751 3 2 9 97 88 1 3 8 124 353North Carolina 18 30 208 2,259 1,698 3 1 10 89 105 — 3 36 229 351South Carolina§ 31 20 98 1,564 1,121 — 0 2 20 32 1 1 5 62 118Virginia§ 11 18 68 1,056 985 3 2 15 126 132 4 2 15 136 177West Virginia 7 2 16 170 207 — 0 4 21 29 1 0 66 103 9
E.S. Central 46 53 177 3,725 2,935 1 4 22 258 204 3 13 40 701 762Alabama§ 9 19 52 992 877 — 1 4 51 45 2 3 14 200 147Kentucky 14 10 31 548 426 — 1 6 68 67 1 3 28 212 209Mississippi 10 17 67 1,175 876 — 0 12 30 6 — 1 4 51 47Tennessee§ 13 14 53 1,010 756 1 2 7 109 86 — 5 14 238 359
W.S. Central 36 104 547 5,685 5,555 1 5 68 275 294 71 52 251 2,533 2,720Arkansas§ 7 12 43 742 584 1 1 5 47 43 2 1 9 73 293Louisiana 8 19 49 1,175 1,137 — 0 2 19 23 — 5 13 256 168Oklahoma 8 12 46 638 580 — 0 27 40 32 2 6 96 250 267Texas§ 13 51 477 3,130 3,254 — 3 41 169 196 67 41 144 1,954 1,992
Mountain 17 48 105 2,577 2,849 2 10 34 595 546 5 15 32 751 1,085Arizona 1 17 42 878 1,018 — 1 11 82 65 2 8 18 409 778Colorado 9 10 24 547 580 — 3 21 209 163 2 2 6 94 92Idaho§ 4 3 9 156 165 1 2 7 101 88 — 0 3 23 8Montana§ 2 2 7 84 103 1 1 5 40 35 — 0 1 6 11Nevada§ 1 4 22 277 239 — 0 5 30 34 1 1 6 47 66New Mexico§ — 6 18 309 347 — 1 5 41 36 — 2 10 132 103Utah — 5 17 287 305 — 1 7 77 110 — 1 4 40 23Wyoming§ — 1 5 39 92 — 0 2 15 15 — 0 0 — 4
Pacific 144 117 299 5,985 5,949 14 10 46 615 529 30 21 64 1,109 1,176Alaska — 1 5 78 64 — 0 1 2 1 — 0 2 1 4California 107 84 227 4,525 4,450 6 6 35 279 248 25 17 51 924 944Hawaii 5 4 14 210 314 — 0 4 18 11 1 0 3 22 41Oregon 1 8 48 487 408 1 2 15 113 78 — 1 5 57 51Washington 31 14 61 685 713 7 2 19 203 191 4 1 20 105 136
TerritoriesAmerican Samoa — 0 1 2 — — 0 0 — — — 1 1 4 3C.N.M.I. — — — — — — — — — — — — — — —Guam — 0 2 7 11 — 0 0 — — — 0 1 1 13Puerto Rico 5 11 39 467 521 — 0 0 — — — 0 1 5 14U.S. Virgin Islands — 0 0 — — — 0 0 — — — 0 0 — —
C.N.M.I.: Commonwealth of Northern Mariana Islands.U: Unavailable. —: No reported cases. N: Not reportable. NN: Not Nationally Notifiable. Cum: Cumulative year-to-date counts. Med: Median. Max: Maximum.* Case counts for reporting year 2010 are provisional and subject to change. For further information on interpretation of these data, see http://www.cdc.gov/ncphi/disss/nndss/phs/files/
ProvisionalNationa%20NotifiableDiseasesSurveillanceData20100927.pdf. Data for HIV/AIDS, AIDS and TB, when available, are displayed in Table IV, which appears quarterly.† Includes E. coli O157:H7; Shiga toxin-positive, serogroup non-O157; and Shiga toxin-positive, not serogrouped.§ Contains data reported through the National Electronic Disease Surveillance System (NEDSS).
MMWR Morbidity and Mortality Weekly Report
MMWR / December 10, 2010 / Vol. 59 / No. 48 1603
TABLE II. (Continued) Provisional cases of selected notifiable diseases, United States, weeks ending December 4, 2010, and December 5, 2009 (48th week)*
Spotted Fever Rickettsiosis (including RMSF)†
Reporting area
Confirmed Probable
Current week
Previous 52 weeks Cum 2010
Cum 2009
Current week
Previous 52 weeks Cum 2010
Cum 2009Med Max Med Max
United States 1 2 12 155 143 8 23 421 1,450 1,226New England — 0 0 — 2 — 0 1 3 11
Connecticut — 0 0 — — — 0 0 — —Maine§ — 0 0 — — — 0 1 2 5Massachusetts — 0 0 — 1 — 0 1 — 6New Hampshire — 0 0 — — — 0 1 1 —Rhode Island§ — 0 0 — — — 0 0 — —Vermont§ — 0 0 — 1 — 0 0 — —
Mid. Atlantic — 0 2 16 12 1 1 4 59 95New Jersey — 0 0 — 2 — 0 2 — 60New York (Upstate) — 0 1 2 — 1 0 3 18 14New York City — 0 1 1 1 — 0 4 28 7Pennsylvania — 0 2 13 9 — 0 1 13 14
E.N. Central — 0 1 4 9 — 1 9 91 81Illinois — 0 1 2 1 — 0 5 33 48Indiana — 0 1 2 3 — 0 5 43 10Michigan — 0 0 — 4 — 0 1 1 1Ohio — 0 0 — — — 0 2 13 18Wisconsin — 0 0 — 1 — 0 1 1 4
W.N. Central — 0 4 18 19 — 4 21 309 253Iowa — 0 0 — 1 — 0 1 4 4Kansas — 0 1 2 1 — 0 0 — —Minnesota — 0 1 — 2 — 0 1 — 2Missouri — 0 4 14 7 — 4 20 301 243Nebraska§ — 0 1 2 8 — 0 1 3 4North Dakota — 0 0 — — — 0 1 1 —South Dakota — 0 0 — — — 0 0 — —
S. Atlantic 1 1 9 82 66 1 8 60 485 372Delaware — 0 1 1 — — 0 3 20 18District of Columbia — 0 1 1 — — 0 1 — —Florida — 0 1 4 — — 0 2 11 7Georgia 1 1 6 57 52 — 0 0 — —Maryland§ — 0 1 3 3 — 1 5 53 37North Carolina — 0 3 11 7 1 2 48 253 242South Carolina§ — 0 1 1 3 — 0 2 18 15Virginia§ — 0 2 4 1 — 2 12 130 51West Virginia — 0 0 — — — 0 0 — 2
E.S. Central — 0 3 19 9 — 5 29 380 252Alabama§ — 0 1 5 3 — 1 8 75 61Kentucky — 0 2 6 1 — 0 0 — —Mississippi — 0 0 — — — 0 3 15 9Tennessee§ — 0 2 8 5 — 4 20 290 182
W.S. Central — 0 3 6 9 6 1 408 111 138Arkansas§ — 0 2 2 — 6 0 110 64 70Louisiana — 0 0 — — — 0 1 2 2Oklahoma — 0 3 3 7 — 0 287 26 46Texas§ — 0 1 1 2 — 0 11 19 20
Mountain — 0 1 2 16 — 0 2 12 24Arizona — 0 1 — 10 — 0 1 2 12Colorado — 0 0 — 1 — 0 1 1 —Idaho§ — 0 0 — — — 0 1 5 1Montana§ — 0 1 2 4 — 0 1 1 6Nevada§ — 0 0 — — — 0 0 — 1New Mexico§ — 0 0 — — — 0 1 1 1Utah — 0 0 — — — 0 1 1 1Wyoming§ — 0 0 — 1 — 0 1 1 2
Pacific — 0 2 8 1 — 0 0 — —Alaska N 0 0 N N N 0 0 N NCalifornia — 0 2 7 1 — 0 0 — —Hawaii N 0 0 N N N 0 0 N NOregon — 0 1 1 — — 0 0 — —Washington — 0 0 — — — 0 0 — —
TerritoriesAmerican Samoa N 0 0 N N N 0 0 N NC.N.M.I. — — — — — — — — — —Guam N 0 0 N N N 0 0 N NPuerto Rico N 0 0 N N N 0 0 N NU.S. Virgin Islands — 0 0 — — — 0 0 — —
C.N.M.I.: Commonwealth of Northern Mariana Islands.U: Unavailable. —: No reported cases. N: Not reportable. NN: Not Nationally Notifiable. Cum: Cumulative year-to-date counts. Med: Median. Max: Maximum.* Case counts for reporting year 2010 are provisional and subject to change. For further information on interpretation of these data, see http://www.cdc.gov/ncphi/disss/nndss/phs/files/
ProvisionalNationa%20NotifiableDiseasesSurveillanceData20100927.pdf. Data for HIV/AIDS, AIDS and TB, when available, are displayed in Table IV, which appears quarterly.† Illnesses with similar clinical presentation that result from Spotted fever group rickettsia infections are reported as Spotted fever rickettsioses. Rocky Mountain spotted fever (RMSF) caused
by Rickettsia rickettsii, is the most common and well-known spotted fever.§ Contains data reported through the National Electronic Disease Surveillance System (NEDSS).

MMWR Morbidity and Mortality Weekly Report
1604 MMWR / December 10, 2010 / Vol. 59 / No. 48
TABLE II. (Continued) Provisional cases of selected notifiable diseases, United States, weeks ending December 4, 2010, and December 5, 2009 (48th week)*
Streptococcus pneumoniae,† invasive disease
Reporting area
All ages Age <5 Syphilis, primary and secondary
Current week
Previous 52 weeks Cum 2010
Cum 2009
Current week
Previous 52 weeks Cum 2010
Cum 2009
Current week
Previous 52 weeks Cum 2010
Cum 2009Med Max Med Max Med Max
United States 310 247 495 13,057 2,736 39 44 156 1,999 2,212 79 242 413 11,390 12,905New England 30 9 99 706 50 2 1 24 90 71 4 9 22 428 299
Connecticut 23 0 91 336 — 1 0 22 28 — 2 1 10 87 53Maine§ 2 2 6 110 19 — 0 1 10 8 — 0 3 23 3Massachusetts — 1 5 58 3 — 1 4 40 44 — 5 15 257 214New Hampshire — 0 7 59 — — 0 1 3 11 — 0 2 22 14Rhode Island§ — 0 36 69 15 — 0 3 3 4 2 0 4 37 15Vermont§ 5 1 6 74 13 1 0 1 6 4 — 0 2 2 —
Mid. Atlantic 28 26 56 1,268 189 15 7 48 341 278 12 33 46 1,550 1,635New Jersey — 1 8 96 — — 1 5 50 60 6 4 12 219 207New York (Upstate) 6 3 12 150 80 6 2 19 111 123 1 2 11 123 112New York City 16 9 31 563 16 9 2 24 126 80 — 18 31 861 997Pennsylvania 6 9 22 459 93 — 1 5 54 15 5 7 16 347 319
E.N. Central 56 49 98 2,658 622 2 7 18 328 382 1 27 49 1,248 1,438Illinois — 2 7 95 — — 2 5 87 68 — 8 26 431 697Indiana — 7 24 482 235 — 1 6 41 77 — 3 14 158 144Michigan 4 12 27 630 25 — 1 6 75 72 — 4 12 196 217Ohio 46 21 49 1,114 362 2 2 6 91 126 1 9 18 423 338Wisconsin 6 6 22 337 — — 1 4 34 39 — 1 3 40 42
W.N. Central 11 10 182 699 168 1 2 12 122 172 1 6 18 315 286Iowa — 0 0 — — — 0 0 — — — 0 3 16 21Kansas 2 2 7 99 52 — 0 2 14 18 — 0 3 18 31Minnesota — 0 179 287 43 — 0 10 44 81 1 2 9 131 65Missouri 4 2 10 113 62 — 1 3 39 44 — 3 9 140 160Nebraska§ 5 2 7 124 2 1 0 2 15 14 — 0 1 6 5North Dakota — 0 11 60 7 — 0 1 2 5 — 0 0 — 4South Dakota — 0 3 16 2 — 0 2 8 10 — 0 1 4 —
S. Atlantic 68 52 144 2,963 1,236 9 9 28 495 538 27 57 218 2,786 3,118Delaware — 0 3 37 18 — 0 0 — 3 — 0 1 4 27District of Columbia — 0 4 24 20 — 0 2 7 5 — 2 21 145 161Florida 39 23 89 1,340 702 7 3 18 182 187 1 21 44 1,009 965Georgia 10 11 28 511 395 2 3 12 143 158 4 12 167 600 751Maryland§ 9 7 31 457 4 — 1 6 48 76 3 6 14 284 282North Carolina — 0 0 — — — 0 0 — — 10 7 22 332 532South Carolina§ 9 6 25 430 — — 1 4 46 46 2 2 7 137 114Virginia§ — 1 4 49 — — 1 4 47 44 7 4 22 270 282West Virginia 1 2 21 115 97 — 0 4 22 19 — 0 2 5 4
E.S. Central 26 21 50 1,175 248 — 2 8 114 139 — 16 39 782 1,046Alabama§ — 0 0 — — — 0 0 — — — 5 11 220 401Kentucky 5 3 16 181 70 — 0 2 13 8 — 2 13 120 62Mississippi — 1 6 51 51 — 0 2 11 25 — 4 17 200 201Tennessee§ 21 18 44 943 127 — 2 6 90 106 — 5 17 242 382
W.S. Central 51 28 91 1,697 111 5 5 41 263 323 21 37 63 1,772 2,602Arkansas§ 1 3 9 150 51 — 0 3 16 39 2 3 12 162 262Louisiana 1 2 8 99 60 — 0 3 25 29 3 8 28 396 709Oklahoma 2 1 5 44 — 2 1 5 44 55 — 1 7 77 86Texas§ 47 23 83 1,404 — 3 3 34 178 200 16 24 34 1,137 1,545
Mountain 37 29 82 1,626 109 4 4 12 214 280 2 10 25 475 495Arizona 12 11 51 705 — 2 2 7 90 115 — 3 8 148 219Colorado 22 10 20 517 — 2 1 4 63 45 — 3 8 127 91Idaho§ 1 0 2 16 — — 0 2 9 9 — 0 1 2 3Montana§ 1 0 2 21 — — 0 1 3 — — 0 2 3 4Nevada§ 1 2 4 75 38 — 0 1 5 7 — 1 9 111 88New Mexico§ — 2 9 139 — — 0 4 16 36 2 1 4 48 58Utah — 2 9 142 59 — 0 3 25 66 — 1 4 36 29Wyoming§ — 0 1 11 12 — 0 1 3 2 — 0 0 — 3
Pacific 3 5 14 265 3 1 0 7 32 29 11 42 61 2,034 1,986Alaska — 2 9 102 — — 0 5 19 19 — 0 1 1 —California 3 3 12 163 — 1 0 2 13 — 6 36 54 1,750 1,774Hawaii — 0 0 — 3 — 0 0 — 10 — 0 4 32 33Oregon — 0 0 — — — 0 0 — — 1 1 7 59 49Washington — 0 0 — — — 0 0 — — 4 4 11 192 130
TerritoriesAmerican Samoa — 0 0 — — — 0 0 — — — 0 0 — —C.N.M.I. — — — — — — — — — — — — — — —Guam — 0 0 — — — 0 0 — — — 0 0 — —Puerto Rico — 0 0 — — — 0 0 — — — 4 15 202 200U.S. Virgin Islands — 0 0 — — — 0 0 — — — 0 0 — —
C.N.M.I.: Commonwealth of Northern Mariana Islands.U: Unavailable. —: No reported cases. N: Not reportable. NN: Not Nationally Notifiable. Cum: Cumulative year-to-date counts. Med: Median. Max: Maximum.* Case counts for reporting year 2010 are provisional and subject to change. For further information on interpretation of these data, see http://www.cdc.gov/ncphi/disss/nndss/phs/files/
ProvisionalNationa%20NotifiableDiseasesSurveillanceData20100927.pdf. Data for HIV/AIDS, AIDS and TB, when available, are displayed in Table IV, which appears quarterly.† Includes drug resistant and susceptible cases of invasive Streptococcus pneumoniae disease among children <5 years and among all ages. Case definition: Isolation of S. pneumoniae from
a normally sterile body site (e.g., blood or cerebrospinal fluid).§ Contains data reported through the National Electronic Disease Surveillance System (NEDSS).

MMWR Morbidity and Mortality Weekly Report
MMWR / December 10, 2010 / Vol. 59 / No. 48 1605
TABLE II. (Continued) Provisional cases of selected notifiable diseases, United States, weeks ending December 4, 2010, and December 5, 2009 (48th week)*
West Nile virus disease†
Reporting area
Varicella (chickenpox)§ Neuroinvasive Nonneuroinvasive¶
Current week
Previous 52 weeks Cum 2010
Cum 2009
Current week
Previous 52 weeks Cum 2010
Cum 2009
Current week
Previous 52 weeks Cum 2010
Cum 2009Med Max Med Max Med Max
United States 261 292 550 13,227 19,250 — 0 70 595 384 — 1 52 377 334New England 11 14 36 699 1,027 — 0 3 13 — — 0 1 2 —
Connecticut 2 6 20 288 468 — 0 2 6 — — 0 1 1 —Maine§ — 4 15 213 228 — 0 0 — — — 0 0 — —Massachusetts — 0 1 2 4 — 0 2 6 — — 0 1 1 —New Hampshire — 2 8 114 191 — 0 1 1 — — 0 0 — —Rhode Island§ — 1 12 32 39 — 0 0 — — — 0 0 — —Vermont§ 9 0 10 50 97 — 0 0 — — — 0 0 — —
Mid. Atlantic 38 33 62 1,513 1,937 — 0 19 125 9 — 0 13 62 1New Jersey — 8 30 498 442 — 0 3 15 3 — 0 6 15 —New York (Upstate) N 0 0 N N — 0 9 57 3 — 0 7 30 1New York City — 0 0 — — — 0 7 32 3 — 0 4 8 —Pennsylvania 38 22 39 1,015 1,495 — 0 3 21 — — 0 3 9 —
E.N. Central 74 100 176 4,434 6,076 — 0 14 75 9 — 0 7 28 4Illinois 5 22 45 1,108 1,514 — 0 10 41 5 — 0 4 15 —Indiana§ 15 6 35 389 421 — 0 2 5 2 — 0 2 6 2Michigan 22 31 62 1,338 1,782 — 0 6 25 1 — 0 1 4 —Ohio 27 29 56 1,264 1,805 — 0 1 4 — — 0 1 1 2Wisconsin 5 6 22 335 554 — 0 0 — 1 — 0 1 2 —
W.N. Central 15 15 32 762 1,220 — 0 7 28 26 — 0 11 68 75Iowa N 0 0 N N — 0 1 2 — — 0 2 4 5Kansas§ — 4 22 228 528 — 0 1 3 4 — 0 2 10 9Minnesota — 0 0 — — — 0 1 4 1 — 0 3 4 3Missouri 15 7 23 442 557 — 0 1 3 4 — 0 0 — 1Nebraska§ N 0 0 N N — 0 3 10 11 — 0 7 27 41North Dakota — 0 9 37 83 — 0 2 2 — — 0 2 7 1South Dakota — 1 7 55 52 — 0 2 4 6 — 0 3 16 15
S. Atlantic 39 34 100 1,985 2,443 — 0 4 33 16 — 0 4 21 2Delaware§ — 0 3 24 12 — 0 0 — — — 0 0 — —District of Columbia — 0 4 18 30 — 0 1 1 2 — 0 1 1 —Florida§ 25 15 57 946 1,077 — 0 2 8 2 — 0 1 3 1Georgia N 0 0 N N — 0 1 4 4 — 0 3 8 —Maryland§ N 0 0 N N — 0 3 16 — — 0 2 7 1North Carolina N 0 0 N N — 0 0 — — — 0 0 — —South Carolina§ — 0 35 75 123 — 0 1 1 3 — 0 0 — —Virginia§ 8 11 34 495 723 — 0 1 3 5 — 0 1 2 —West Virginia 6 8 26 427 478 — 0 0 — — — 0 0 — —
E.S. Central 4 5 22 278 519 — 0 1 8 36 — 0 3 11 27Alabama§ 4 5 22 271 514 — 0 1 1 — — 0 1 2 —Kentucky N 0 0 N N — 0 1 2 3 — 0 1 1 —Mississippi — 0 2 7 5 — 0 1 3 29 — 0 2 6 22Tennessee§ N 0 0 N N — 0 1 2 4 — 0 2 2 5
W.S. Central 69 45 285 2,562 4,644 — 0 15 97 117 — 0 3 19 35Arkansas§ — 2 32 129 465 — 0 3 6 6 — 0 1 1 —Louisiana — 2 5 80 129 — 0 3 14 10 — 0 1 6 11Oklahoma N 0 0 N N — 0 0 — 8 — 0 0 — 2Texas§ 69 39 272 2,353 4,050 — 0 15 77 93 — 0 2 12 22
Mountain 9 20 36 927 1,290 — 0 18 151 77 — 0 15 127 123Arizona — 0 0 — — — 0 13 103 12 — 0 9 58 8Colorado§ 8 8 18 379 497 — 0 5 26 36 — 0 11 55 67Idaho§ N 0 0 N N — 0 0 — 9 — 0 1 3 29Montana§ — 3 17 182 161 — 0 0 — 2 — 0 0 — 3Nevada§ N 0 0 N N — 0 0 — 7 — 0 1 2 5New Mexico§ 1 1 8 92 113 — 0 5 19 6 — 0 2 4 2Utah — 5 17 260 519 — 0 1 1 1 — 0 1 1 1Wyoming§ — 0 3 14 — — 0 1 2 4 — 0 1 4 8
Pacific 2 1 6 67 94 — 0 7 65 94 — 0 5 39 67Alaska — 0 5 37 55 — 0 0 — — — 0 0 — —California — 0 0 — — — 0 7 64 67 — 0 5 38 45Hawaii 2 0 6 30 39 — 0 0 — — — 0 0 — —Oregon N 0 0 N N — 0 0 — 1 — 0 0 — 10Washington N 0 0 N N — 0 1 1 26 — 0 1 1 12
TerritoriesAmerican Samoa N 0 0 N N — 0 0 — — — 0 0 — —C.N.M.I. — — — — — — — — — — — — — — —Guam — 0 2 15 30 — 0 0 — — — 0 0 — —Puerto Rico 1 9 30 518 488 — 0 0 — — — 0 0 — —U.S. Virgin Islands — 0 0 — — — 0 0 — — — 0 0 — —
C.N.M.I.: Commonwealth of Northern Mariana Islands.U: Unavailable. —: No reported cases. N: Not reportable. NN: Not Nationally Notifiable. Cum: Cumulative year-to-date counts. Med: Median. Max: Maximum.* Case counts for reporting year 2010 are provisional and subject to change. For further information on interpretation of these data, see http://www.cdc.gov/ncphi/disss/nndss/phs/files/
ProvisionalNationa%20NotifiableDiseasesSurveillanceData20100927.pdf. Data for HIV/AIDS, AIDS and TB, when available, are displayed in Table IV, which appears quarterly.† Updated weekly from reports to the Division of Vector-Borne Infectious Diseases, National Center for Zoonotic, Vector-Borne, and Enteric Diseases (ArboNET Surveillance). Data for California
serogroup, eastern equine, Powassan, St. Louis, and western equine diseases are available in Table I.§ Contains data reported through the National Electronic Disease Surveillance System (NEDSS).¶ Not reportable in all states. Data from states where the condition is not reportable are excluded from this table, except starting in 2007 for the domestic arboviral diseases and influenza-
associated pediatric mortality, and in 2003 for SARS-CoV. Reporting exceptions are available at http://www.cdc.gov/ncphi/disss/nndss/phs/infdis.htm.

MMWR Morbidity and Mortality Weekly Report
1606 MMWR / December 10, 2010 / Vol. 59 / No. 48
TABLE III. Deaths in 122 U.S. cities,* week ending December 4, 2010 (48th week)
Reporting area
All causes, by age (years)
P&I† Total Reporting area
All causes, by age (years)
P&I† Total
All Ages ≥65 45–64 25–44 1–24 <1
All Ages ≥65 45–64 25–44 1–24 <1
New England 638 455 136 35 7 5 62 S. Atlantic 1,375 907 334 85 25 24 86Boston, MA 152 96 44 8 2 2 14 Atlanta, GA 147 107 29 7 3 1 7Bridgeport, CT 26 23 2 1 — — 3 Baltimore, MD 172 97 54 13 5 3 12Cambridge, MA 31 26 5 — — — 2 Charlotte, NC 156 103 34 13 2 4 14Fall River, MA 41 36 4 1 — — 3 Jacksonville, FL 167 117 35 11 2 2 11Hartford, CT 66 46 13 4 2 1 9 Miami, FL 113 70 30 7 5 1 3Lowell, MA 22 11 5 5 — 1 3 Norfolk, VA 56 36 15 4 — 1 2Lynn, MA 14 11 2 1 — — 1 Richmond, VA 48 32 11 5 — — 5New Bedford, MA 34 24 9 1 — — 2 Savannah, GA 59 43 13 1 1 1 6New Haven, CT 50 31 13 5 — 1 4 St. Petersburg, FL 57 44 11 1 1 — 3Providence, RI 83 62 17 3 1 — 7 Tampa, FL 276 177 70 17 4 8 15Somerville, MA 4 2 1 1 — — — Washington, D.C. 104 66 28 6 1 3 7Springfield, MA 16 9 4 2 1 — 4 Wilmington, DE 20 15 4 — 1 — 1Waterbury, CT 28 23 5 — — — 2 E.S. Central 945 611 222 55 29 27 73Worcester, MA 71 55 12 3 1 — 8 Birmingham, AL 229 146 54 11 9 8 16
Mid. Atlantic 2,028 1,433 426 110 32 25 97 Chattanooga, TN 76 53 13 7 — 3 6Albany, NY 49 35 13 1 — — 1 Knoxville, TN 121 79 34 6 1 1 9Allentown, PA 27 24 3 — — — 1 Lexington, KY 61 42 16 1 2 — 5Buffalo, NY 69 45 15 4 4 1 4 Memphis, TN 186 118 44 13 7 4 14Camden, NJ 3 2 1 — — — — Mobile, AL 91 60 21 6 1 3 7Elizabeth, NJ 17 13 4 — — — 1 Montgomery, AL 28 21 4 1 1 1 7Erie, PA 63 49 13 — — 1 9 Nashville, TN 153 92 36 10 8 7 9Jersey City, NJ 28 18 5 4 1 — 2 W.S. Central 1,393 905 334 89 33 31 79New York City, NY 961 697 203 40 11 9 41 Austin, TX 115 71 32 7 5 — 7Newark, NJ 29 13 8 7 1 — — Baton Rouge, LA 80 47 15 13 — 5 —Paterson, NJ 27 19 4 3 — 1 3 Corpus Christi, TX 65 43 17 1 4 — 8Philadelphia, PA 364 233 77 32 11 11 9 Dallas, TX 303 180 83 22 9 8 17Pittsburgh, PA§ 37 26 9 1 — 1 5 El Paso, TX 111 86 19 4 1 1 1Reading, PA 36 27 6 2 — — 1 Fort Worth, TX U U U U U U URochester, NY 81 56 16 6 3 — 4 Houston, TX 89 56 18 3 5 7 6Schenectady, NY 27 19 8 — — — 2 Little Rock, AR 79 49 24 4 1 1 —Scranton, PA 26 23 3 — — — — New Orleans, LA U U U U U U USyracuse, NY 103 80 20 1 1 1 10 San Antonio, TX 295 205 58 21 5 6 23Trenton, NJ 48 29 14 5 — — 2 Shreveport, LA 89 55 28 4 1 1 6Utica, NY 13 12 1 — — — — Tulsa, OK 167 113 40 10 2 2 11Yonkers, NY 20 13 3 4 — — 2 Mountain 1,205 798 280 73 32 22 66
E.N. Central 2,139 1,482 472 113 38 34 131 Albuquerque, NM 148 98 38 6 5 1 9Akron, OH 79 56 15 5 1 2 3 Boise, ID 76 54 10 8 4 — 5Canton, OH 28 22 4 2 — — 2 Colorado Springs, CO 85 54 19 9 1 2 1Chicago, IL 207 131 57 15 4 — 13 Denver, CO 76 41 27 4 1 3 1Cincinnati, OH 99 62 19 12 2 4 5 Las Vegas, NV 235 167 52 10 4 2 11Cleveland, OH 295 206 70 15 3 1 15 Ogden, UT 42 29 10 2 — 1 2Columbus, OH 219 150 52 8 4 5 14 Phoenix, AZ 192 115 49 15 8 5 12Dayton, OH 164 115 44 4 — 1 12 Pueblo, CO 42 33 5 2 2 — 4Detroit, MI 194 114 59 13 7 1 10 Salt Lake City, UT 149 100 34 5 4 6 10Evansville, IN 51 39 9 2 — 1 5 Tucson, AZ 160 107 36 12 3 2 11Fort Wayne, IN 76 56 14 2 3 1 — Pacific 1,879 1,328 397 87 35 32 154Gary, IN 7 4 2 — 1 — — Berkeley, CA 17 10 6 — — 1 —Grand Rapids, MI 50 38 8 1 2 1 1 Fresno, CA 158 113 33 8 2 2 22Indianapolis, IN 170 128 28 6 — 8 12 Glendale, CA 38 30 8 — — — 2Lansing, MI 72 56 11 3 1 1 4 Honolulu, HI 79 60 12 4 — 3 8Milwaukee, WI 108 70 26 6 5 1 9 Long Beach, CA 47 33 11 — 2 1 6Peoria, IL 59 43 11 2 2 1 4 Los Angeles, CA 296 195 68 18 7 8 32Rockford, IL 71 47 17 7 — — 8 Pasadena, CA 32 25 3 2 1 1 5South Bend, IN 74 53 12 4 2 3 5 Portland, OR 107 84 16 5 1 1 6Toledo, OH 59 43 7 6 1 2 6 Sacramento, CA 303 210 70 11 8 4 28Youngstown, OH 57 49 7 — — 1 3 San Diego, CA 27 20 6 1 — — 2
W.N. Central 697 456 179 32 16 12 48 San Francisco, CA 118 74 31 6 4 3 8Des Moines, IA 12 11 1 — — — — San Jose, CA 244 185 46 7 3 3 14Duluth, MN 31 29 1 1 — — 5 Santa Cruz, CA 44 34 8 1 1 — 2Kansas City, KS 45 22 21 1 1 — 5 Seattle, WA 132 82 31 13 2 4 2Kansas City, MO 106 69 32 3 1 1 5 Spokane, WA 84 65 13 4 1 1 7Lincoln, NE 49 36 11 1 1 — 2 Tacoma, WA 153 108 35 7 3 — 10Minneapolis, MN 76 47 20 3 4 2 5 Total¶ 12,299 8,375 2,780 679 247 212 796Omaha, NE 96 71 19 4 1 1 11St. Louis, MO 135 70 39 12 7 5 8St. Paul, MN 61 44 13 3 — 1 3Wichita, KS 86 57 22 4 1 2 4
U: Unavailable. —: No reported cases. * Mortality data in this table are voluntarily reported from 122 cities in the United States, most of which have populations of >100,000. A death is reported by the place of its occurrence and
by the week that the death certificate was filed. Fetal deaths are not included.† Pneumonia and influenza.§ Because of changes in reporting methods in this Pennsylvania city, these numbers are partial counts for the current week. Complete counts will be available in 4 to 6 weeks.¶ Total includes unknown ages.


The Morbidity and Mortality Weekly Report (MMWR) Series is prepared by the Centers for Disease Control and Prevention (CDC) and is available free of charge in electronic format. To receive an electronic copy each week, visit MMWR’s free subscription page at http://www.cdc.gov/mmwr/mmwrsubscribe.html. Paper copy subscriptions are available through the Superintendent of Documents, U.S. Government Printing Office, Washington, DC 20402; telephone 202-512-1800.Data presented by the Notifiable Disease Data Team and 122 Cities Mortality Data Team in the weekly MMWR are provisional, based on weekly reports to CDC by state health departments. Address all inquiries about the MMWR Series, including material to be considered for publication, to Editor, MMWR Series, Mailstop E-90, CDC, 1600 Clifton Rd., N.E., Atlanta, GA 30333 or to [email protected]. All material in the MMWR Series is in the public domain and may be used and reprinted without permission; citation as to source, however, is appreciated.Use of trade names and commercial sources is for identification only and does not imply endorsement by the U.S. Department of Health and Human Services.References to non-CDC sites on the Internet are provided as a service to MMWR readers and do not constitute or imply endorsement of these organizations or their programs by CDC or the U.S. Department of Health and Human Services. CDC is not responsible for the content of these sites. URL addresses listed in MMWR were current as of the date of publication.
U.S. Government Printing Office: 2011-723-011/21015 Region IV ISSN: 0149-2195
Related Documents