Human monochroma+c light discrimina+on explained by op+mal decoding of cone absorp+ons Li Zhaoping, Wilson S. Geisler, and Keith A. May (Paper in PLoS One 2011) Presented on June, 9, 2011, at the Gatsby external seminar.

Welcome message from author
This document is posted to help you gain knowledge. Please leave a comment to let me know what you think about it! Share it to your friends and learn new things together.
Transcript
Human monochroma+c light discrimina+on explained by op+mal decoding of cone absorp+ons
Li Zhaoping, Wilson S. Geisler, and Keith A. May (Paper in PLoS One 2011)
Presented on June, 9, 2011, at the Gatsby external seminar.

Motivation: Decoding from real physiological signals for real behavioral data
Sensory signal: S, neural responses r, perception: S’ Encoding: P(r|S) --- likelihood Decoding: P(S’|r) ~ P(r|S) P(S) Prior: P(S).
In most decoding work so far, one or more of the followings apply: (1) P(r|S) is assumed, not quantitatively known (e.g., noise is unknown) (2) r is not neural response, but artificial by experimental design (3) S’ is not the behavioral perception, but modeler’s toy.
e.g., Pillow et al, decoding visual inputs from retinal ganglion responses. many parameters in P(r|S) are assumed, S’ is not for behavioral
e.g., Koerding & Wolpert, inferring motor target position S’ from noisy position seen r, with prior P(S).
S: actual target position invisible to subjects r: not neural response, but fake target position shown to subjects with likelihood
P(r|S), --- typical of many behavioral studies of Bayesian inference. P(S): prior, controlled by experimenter, experienced by subjects.
S’: Subject’s estimate of target position, manifested in their motor responses

Sensory signal: S, neural responses r, perception: S’ Encoding: P(r|S) --- likelihood Decoding: P(S’|r) ~ P(r|S) P(S) Prior: P(S).
Motivation: Decoding from real physiological signals for real behavioral data
Some exceptions: Paradiso (1988),human orientation
discrimination from V1 neural responses.
Fisher Information
€
IF = dri∫i∑ P(ri | S)[−∂ 2 lnP(ri | S) /∂S2]
∝number of neurons
However, used several free parameters
3 parameters: Orientation tuning function and response amplitude,
2 parameters: Neural noise 1 parameter: total number of neurons.

Motivation: Decoding from real physiological signals for real behavioral data
Current work: Color perception from cone responses, only one free parameter (input intensity)
Sensory signal: S, neural responses r, perception: S’ Encoding: P(r|S) --- likelihood Decoding: P(S’|r) ~ P(r|S) P(S) Prior: P(S).
Behavior
€
λ
€
λ + dλ
400 500 600 70010−6
10−4
10−2
100
Wavelength ! (nm)
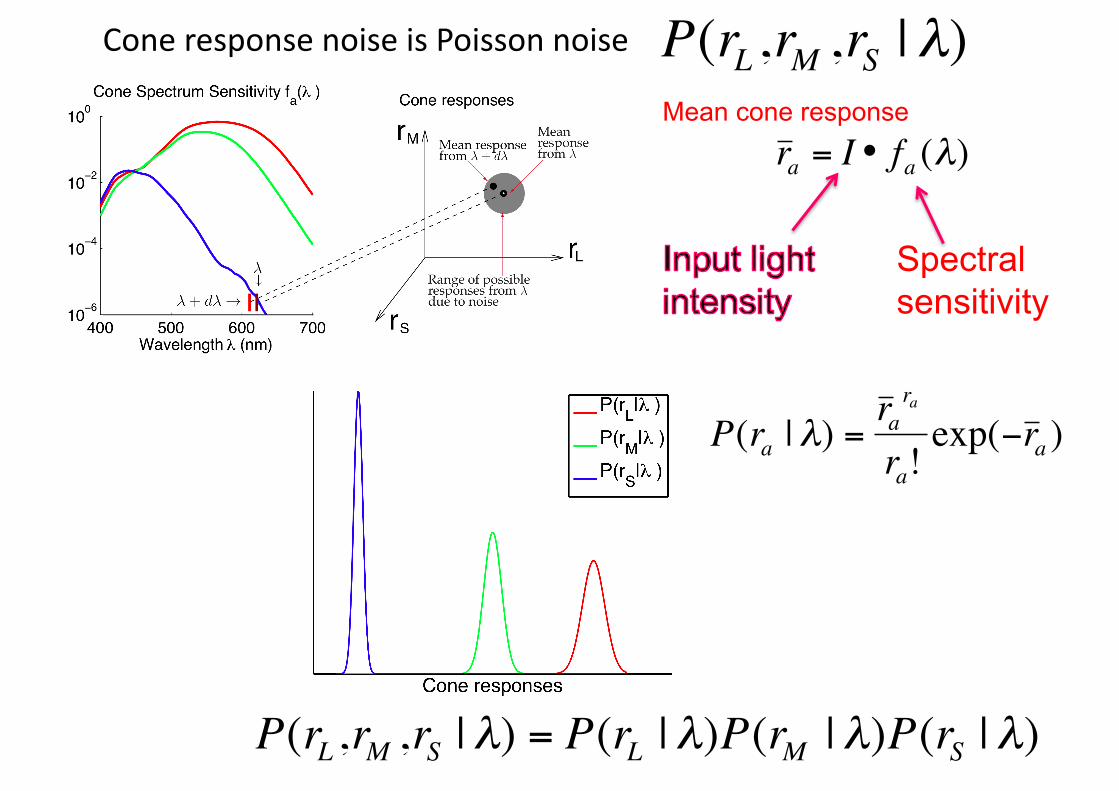
Cone Spectrum Sensitivity fa(! )
Physiology P(r|S), Poisson noise. Number of cones.

Current work: Color perception from cone responses, only one free parameter (input intensity)
Behavior
€
λ
€
λ + dλ
400 500 600 70010−6
10−4
10−2
100
Wavelength ! (nm)
Cone Spectrum Sensitivity fa(! )
Physiology P(r|S), Poisson noise. Number of cones.
(2) Na red cones, each Poisson, each with tuning function fa(λ), equivalent to one single giant red cone, Poisson, with tuning function Nafa(λ).
(1) Other than different sensitivities to wavelength, different cones give equal electrical responses to light after photon absorption--- physiologically known.
Hence, different amplitudes of cone tuning curves reflect different cone densities and pre-receptor optical absorption

Monochroma+c discrimina+on threshold depends on wavelength (Pokorny and Smith, 1970)
€
λ
€
λ + dλ
Subject adjust the intensity of the test field to make it appear iden+cal to the standard field, threshold is reached when this is impossible
Why? Can we understand this from the informa+on in the cone absorp+ons regardless of the post‐receptor mechanisms (like an ideal observer’s approach)
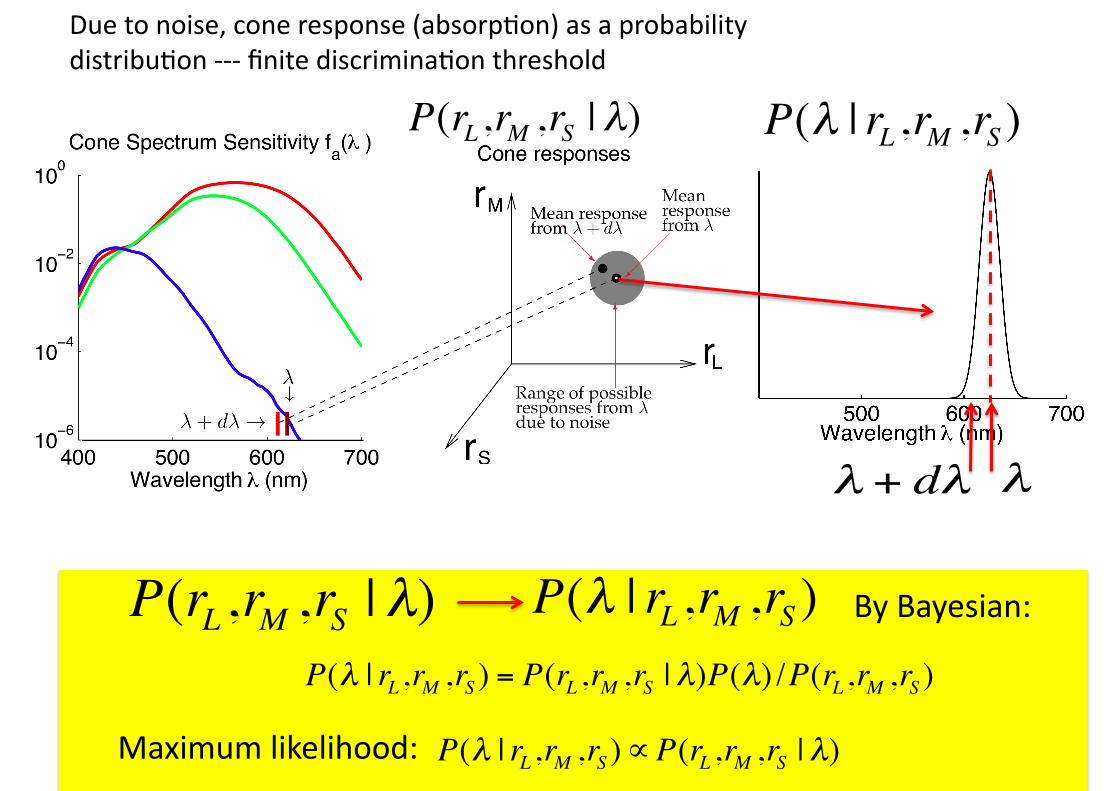
€
P(rL ,rM ,rS | λ)
Due to noise, cone response (absorp+on) as a probability distribu+on ‐‐‐ finite discrimina+on threshold
€
P(λ | rL ,rM ,rS )
€
λ
€
λ + dλ
€
P(λ | rL ,rM ,rS ) = P(rL ,rM ,rS | λ)P(λ) /P(rL ,rM ,rS )
€
P(λ | rL ,rM ,rS )∝P(rL ,rM ,rS | λ)
By Bayesian:
Maximum likelihood:
€
P(rL ,rM ,rS | λ)
€
P(λ | rL ,rM ,rS )
€
P(rL ,rM ,rS | λ)Cone response noise is Poisson noise
€
r a = I • fa (λ)
€
P(rL ,rM ,rS | λ) = P(rL | λ)P(rM | λ)P(rS | λ)
€
P(ra | λ) =r a
ra
ra!exp(−r a )
Mean cone response
Spectral sensitivity

An example of maximum likelihood decoding, given get
€
P(λ | rL ,rM ,rS ) ≈ exp[−(λ − λ )2
2σ 2(λ )]€
(rL ,rM ,rS )
Responses generated by wavelength at 550 nm
€
σ(λ )Threshold value
€
P(λ | rL ,rM ,rS )∝ P(rL ,rM ,rS | λ)
€
r a = I • fa (λ)
€
Fisher Information IF (λ) = I[ f 'aa∑ (λ)]2 / fa (λ)
threshold σ (λ) = IF−1/ 2
€
λ
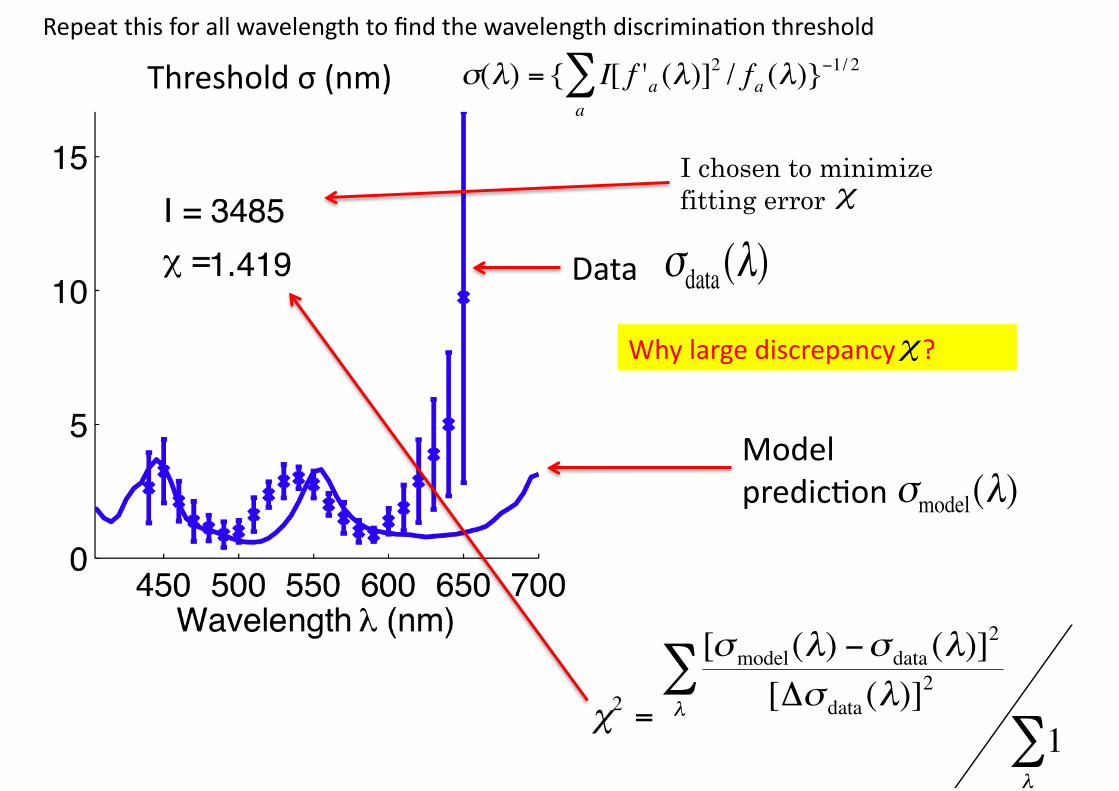
Repeat this for all wavelength to find the wavelength discrimina+on threshold
Model predic+on
Threshold σ (nm)
Why large discrepancy ?
Data
€
χ2 =
[σmodel(λ) −σ data (λ)]2
[Δσ data (λ)]2
λ
∑1
λ
∑
€
σdata (λ)
€
σmodel(λ)
€
σ(λ) = { I[ f 'aa∑ (λ)]2 / fa (λ)}
−1/ 2
I chosen to minimize fitting error
€
χ
€
χ

Back to the original measurements (Pokorny and Smith, 1970)
€
λ
€
λ + dλ
Subject adjust the test field by intensity I to make it appear iden+cal to the standard field, threshold is reached when this is impossible
Both input intensity I and input wavelength λ are changed in matching.
€
P(λ | rL ,rM ,rS )
€
P(λ,I | rL ,rM ,rS )

Back to the original measurements (Pokorny and Smith, 1970)
€
λ
€
λ + dλ
Subject adjust the test field by intensity I to make it appear iden+cal to the standard field, threshold is reached when this is impossible
Both input intensity I and input wavelength λ are changed in matching.
€
P(λ,I | rL ,rM ,rS )
€
λ€
IContour plot

Back to the original measurements (Pokorny and Smith, 1970) Both input intensity I and input wavelength λ are changed in matching.
€
P(λ,I | rL ,rM ,rS )
€
λ€
IContour plot
€
P(λ | rL ,rM ,rS )
Threshold value when I is fixed
Threshold when I can change

Back to the original measurements (Pokorny and Smith, 1970)
€
P(λ,I | rL ,rM ,rS )
€
λ€
IContour plot
Threshold when I can change
Wavelength-intensity confound! Is the right patch redder or darker?
€
λ
€
λ + dλ

Back to the original measurements (Pokorny and Smith, 1970)
Wavelength-intensity confound! Is the right patch redder or darker?
€
λ
€
λ + dλ
400 500 600 70010−6
10−4
10−2
100
Wavelength ! (nm)
Cone Spectrum Sensitivity fa(! )At long λ, increasing λ decreases responses from all 3 cones, difficult to tell whether the input is redder or darker, the confound is stronger, hence larger threshold.
At medium λ, increasing λ increases response from some cone and decreases response from other cones, easier to tell wavelength change. The confound is weaker, hence smaller threshold.

€
P(λ,I | rL ,rM ,rS )
€
λ€
IContour plot
Threshold when I can change
€
IF (λ,I) = −
∂ 2 lnP(r | λ,I)∂λ2
∂ 2 lnP(r | λ,I)∂λ∂I
∂ 2 lnP(r | λ,I)∂λ∂I
∂ 2 lnP(r | λ,I)∂I2
2-d Fisher information formulation
€
P(λ,I | r) ≈exp{−[IF ,11(λ − λ )2 + 2IF ,12(λ − λ )(I − I ) + IF ,22(I − I )2]/2}
€
σ(λ) =1I
fa (λ)a∑
[ f 'b (λ)]2
fb (λ)fc (λ) − [ f 'd (λ)]
2
d∑
c∑
b∑
1/ 2
Result:

Be^er explana+on of data!
When input intensity is adjusted in color matching
otherwise
€
σ(λ) =1I
fa (λ)a∑
[ f 'b (λ)]2
fb (λ)fc (λ) − [ f 'd (λ)]
2
d∑
c∑
b∑
1/ 2

Monochroma+c light wavelength discrimina+on explained by op+mal decoding based on signals in the cones.
Suggest that efficiency in informa+on processing efficiency in post‐receptoral mechanisms is a constant regardless of wavelength.
Model has to match with experimental methods to account for data.
Predic+on ‐‐‐ smaller threshold when input intensity is fixed in threshold assessments

Relative cone densities for L, M, S cones influence model prediction accuracy
normal amount of S cones S cones too numerous

When S cones are too few …
An extra peak… as seen in some data (Bedford and Wyszecki 1958)when the input field is too small, too few S cones
L & M cone co-vary here … becoming color blind.

Importance of proper experimental procedures:
€
λ€
I
Wavelength-intensity confound means that it is difficult to ask subjects to match the brightness of two color fields while checking whether they differ in hue.
€
λ
€
λ + dλPokorny and Smith (1970): Subject adjust the test field by intensity I to make it appear iden+cal to the standard field, threshold is reached when this is impossible
Two kinds of procedures in the literature:
Bedford and Wyszecki (1958): Subject adjust the test field by intensity I to match the brightness of the two fields, and then see if there is a hue difference. Threshold is reached when there is a hue difference.

Summary:
Human wavelength discrimination can be understood as optimal decoding from cone absorptions (with constant efficiency)
This model reveals the reliability of data from different experimental procedures.
Related Documents