Dissertation submitted to the Combined Faculties for the Natural Sciences and Mathematics of the Ruperto-Carola University of Heidelberg, Germany for the degree of Doctor of Natural Sciences presented by Martina Klünemann, MSc Born in: Haselünne, Germany Oral examination: March 30 th , 2017

Welcome message from author
This document is posted to help you gain knowledge. Please leave a comment to let me know what you think about it! Share it to your friends and learn new things together.
Transcript

Dissertation
submitted to the Combined Faculties for the Natural Sciences and Mathematics
of the Ruperto-Carola University of Heidelberg, Germany for the degree of
Doctor of Natural Sciences
presented by Martina Klünemann, MSc
Born in: Haselünne, Germany Oral examination: March 30th, 2017


Human gut bacteria interactions with
host-targeted drugs
Referees: Dr. Anne-Claude Gavin
Prof. Dr. Rob Russell


“I don't know, and I would rather not guess.” (Frodo in “The Lord of the Rings” by J.R.R. Tolkien)


I
Acknowledgements
First of all I would like to thank Kiran for taking me on as a PhD student, advising me and having just another idea for an interesting experiment. Your light-hearted spirit, inquisitiveness and last minute polishing of manuscripts did shape my idea of science for the better.
Furthermore I like to thank my thesis advisory committee members Anne-Claude Gavin, Rob Russell, Christoph Steinbeck and Carsten Schultz for advise, feedback and thorough questioning during our regular meetings. In particular, I would like to thank Anne-Claude and Rob for accepting my thesis for examination.
I love to thank the Patil group as a whole and Melanie Tramontano, Sergej Andrejev and Filipa Pereira in particular. Thank you for getting me started in the lab and keeping me motivated. Thanks for discussions and sword fights and chocolate and the one or other kick in the butt. I am happy to have shared the last four years with you guys!
I would also like to thank the Typas group, especially Manuel Banzhaf and Lisa Maier, for mentoring, sharing their knowledge on bacteria and screening, hosting experiments in their sometimes crowded lab without ever complaining, and being in general a positive influence on the EMBL community.
Of course I want to mention the rest of the EMBL community as well. Thanks guys for discussions, friendship, coffee breaks, pizza session, hugs, and last but definitely not least parties! I made friends with many of you and my life is richer and better for it. Thank you especially Deepikaa Menon for kicking my butt, and thank you Simone Li for being amazing in general. Thank you for the last four years of friendship and support and slightly odd ideas and trips. Simone, without you I would have gone crazy but I will nevertheless remember forever that you are the reason I didn’t get enough cookies during my predoc course!
I am eternally thankful for Daniela Begolo, without you I would have died. Thanks for saving me from starvation, dehydration, and boredom. You are one of the best and have been there for good and bad times. Thank you!
I also want to thank my other friends without whom I wouldn’t be who I am, especially Katha Wilmes, Kadda Pallmer and the Münsteraner Crew. You guys are amazing. Particularly, I am deeply grateful to Phillip Ihmor and Neda Kazemie for getting me started with and keeping motivated during thesis writing. Johannes Sonnenholzner is acknowledged for providing me with an almost perfect playlist. Thank you!

II
Last but not least I would like to thank my family. Danke, dass ihr immer da seid egal was passiert. Vielen Dank für Umarmungen, Zuspruch, Ablenkung, Interesse an dem was ich tue, und Vetrauen darauf, dass schon was bei rum kommt. Vielen Dank für alles!
This thesis was written in memory of the Cookie and Wine Connection. We did it!

III
Abstract
Studies as early as in the 70s showed that the gut and its intrinsic gut microbiota is a possible site of drug modification and later studies confirmed that human microbiota metabolism with its diverse set of genes can be a cause for drug side effects. Yet, our knowledge of the biochemical capabilities of gut bacteria to interact with or metabolize therapeutic drugs remains largely incomplete. To our knowledge, there has not been any systematic screen of xenobiotic-microbial interactions elucidating how wide-spread bacterial drug modification is across therapeutic drugs or the gut microbiota. In my PhD work, I tested, under anaerobic conditions, 450 bacteria-drug interactions covering 25 metabolically diverse gut bacteria and 18 structurally diverse FDA-approved drugs. This revealed almost 50 novel bioaccumulation or biotransformation links between 19 bacterial species and 10 drugs. The implicated bacteria are phylogenetically diverse, including commensals, probiotics and bacteria associated with diseases. The affected drugs span diverse indication areas, from asthma (montelukast) to depression (duloxetine and aripiprazole). As a case in point, the results from this bacteria-drug interaction study are followed upon in more details through investigation of interactions involving duloxetine – a widely used antidepressant. I found that duloxetine induces higher diversity in synthetic bacterial communities, and its bioaccumulation by community members affects the community dynamics. Following, I found that duloxetine affects the native metabolism of B. uniformis and C. saccharolyticum, in particular the purine metabolism. These interactions might in turn influence bacterial behavior in a community. To find the direct protein targets of duloxetine in C. saccharolyticum, I used click chemistry-based methods and proteomics. Two of the five strongly enriched binding proteins are part of a NADH:quinone dehydrogenase complex. Two potential underlying mechanisms for duloxetine interactions are suggested: i) Duloxetine inhibits NADH:quinone dehydrogenase by binding to its quinone binding site. The resulting NADH excess leads to a change in downstream pathways like purine metabolism. ii) Duloxetine binds competitively on the NADH binding site of NADH:quinone dehydrogenase and other proteins.
In addition to discovering new xenobiotic interactions, the study highlights a new dimension to gut microbiota-drug interactions, namely bioaccumulation, which so far has been largely overlooked. My results suggest that bioaccumulation of drug compounds might be a common feature to many gut bacteria and thus have broad and far-reaching implications for drug dosage decisions and personalized medicine.


V
Zusammenfassung
Bereits in den 70er Jahren zeigten Studien, dass der Darm und sein intrinsisches Darmmikrobiom ein möglicher Ort für die Modifikation von Medikamenten ist. Spätere Studien bestätigten, dass der Stoffwechsel des menschlichen Mikrobiom mit seinen im vergleich zum menschlichen Genom unterschiedlichen Satz an Genen eine Ursache für Medikamentenneben-wirkungen sein kann. Unser Wissen über die biochemischen Fähigkeiten von Darmbakterien mit therapeutischen Wirkstoffen in Wechselwirkung zu treten oder diese zu metabolisieren, bleibt jedoch weitgehend unvollständig. Unseres Wissens nach gibt es bis jetzt keine systematische Studie von xenobiotisch-mikrobiellen Wechselwirkungen, die darlegen könnte, wie weit verbreitet bakterielle Modifikation von therapeutische Arzneimitteln durch das Darmmikrobiom ist. In meiner Doktorarbeit habe ich unter anaeroben Bedingungen 450 Bakterien-Wirkstoff-Wechselwirkungen getestet, die 25 metabolisch verschiedene Darmbakterien und 18 strukturell verschiedene, FDA-zugelassene Medikamente abdecken. Dies zeigte fast 50 neue Zusammenhänge, Bioakkumulationen oder Biotransformationen, zwischen 19 Bakterienarten und 10 Wirkstoffen auf. Die betroffenen Bakterien sind phylogenetisch unterschiedlich, einschließlich Kommensalen, probiotischen Bakterien und Bakterien, die mit Krankheiten assoziiert sind. Die betroffenen Medikamente erstrecken sich über diverse Indikationsbereiche, von Asthma (Montelukast) bis hin zu Depression (Duloxetin und Aripiprazol). Als typisches Beispiel werden die Ergebnisse dieser Bakterien-Wirkstoff-Wechselwirkungsstudie anhand von Wechselwirkungen mit Duloxetin, einem weit verbreiteten Antidepressivum, genauer untersucht. Duloxetin induziert eine höhere Diversität in synthetischen Bakteriengemeinschaften, und seine Bioakkumulation durch Gemeinschafts-mitglieder beeinflusst die Gemeinschaftsdynamik. Weiterhin beeinflusst Duloxetin den nativen Metabolismus von B. uniformis und C. saccharolyticum, insbesondere den Purinstoffwechsel. Diese Wechselwirkungen könnten wiederum das bakterielle Verhalten in einer Gemeinschaft beeinflussen. Um die direkten Proteintargets von Duloxetin in C. saccharolyticum zu finden, verwendete ich Klick-Chemie-basierte Methoden und Proteomics. Zwei der fünf stark angereicherten Proteine sind Teil eines NADH:Quinone-Dehydrogenase-Komplexes. Zwei mögliche zugrundeliegende Mechanismen für Duloxetin-Wechselwirkungen werden vorgeschlagen: i) Duloxetin hemmt NADH:Quinone-Dehydrogenase durch Bindung an seine Quinone-Bindungsstelle. Der resultierende NADH-Überschuss führt zu einer Veränderung in Downstream-

VI
Stoffwechselwegen wie dem Purinstoffwechsel. ii) Duloxetin bindet kompetitiv an der NADH-Bindungsstelle von NADH:Quinone-Dehydrogenase.
Neben der Entdeckung neuer xenobiotischer Wechselwirkungen unterstreicht die Studie eine neue Dimension der Mikrobiota-Wirkstoff-Wechselwirkungen, nämlich die der Bioakkumulation, die bisher weitgehend übersehen wurde. Meine Ergebnisse legen nahe, dass die Bioakkumulation von Wirkstoffen ein gemeinsames Merkmal vieler Darmbakterien sein kann und somit breite und weit reichende Implikationen für Arzneimitteldosierungsentscheidungen und personalisierte Medizin aufweist.

VII
Table of contents
ACKNOWLEDGEMENTS ................................................................................... I!ABSTRACT ........................................................................................................ III!ZUSAMMENFASSUNG ...................................................................................... V!TABLE OF CONTENTS ................................................................................... VII!LIST OF FIGURES .......................................................................................... XIII!LIST OF TABLES .............................................................................................. XV!1! INTRODUCTION ........................................................................................... 17!
1.1! The human gut microbiota and its xenometabolism ................................. 17!1.1.1! The human gut microbiota ............................................................. 17!1.1.2! Hierarchy of xenometabolic interactions in the gut ................... 18!
1.2! Promiscuous enzymes drive and enlarge xenometabolic interactions .... 20!1.3! Enzyme availability and interaction between xeno- and native metabolism ............................................................................................................... 22!
1.3.1! Bacterial metabolism can change xenobiotics .............................. 22!1.3.2! Xenobiotics can change bacterial metabolism ............................. 22!
1.4! Community structure influences xenometabolic interactions .................. 23!1.4.1! Community structure determines possible interactions ............ 23!1.4.2! Xenobiotics influence gut microbiota composition and structure 25!
1.5! Host-microbiota co-metabolism of xenobiotics ......................................... 25!1.6! The gut-brain axis and depression ................................................................ 27!
1.6.1! Duloxetine and its pharmacokinetics and -dynamics ................. 29!1.7! Aims and Outline of the Thesis ..................................................................... 30!
1.7.1! Aims ................................................................................................... 30!1.7.2! Outline ............................................................................................... 31!
2! HUMAN GUT BACTERIA INTERACTIONS WITH HOST-TARGETED DRUGS ................................................................................................................ 32!
2.1! Introduction ..................................................................................................... 32!2.1.1! Why investigate bacteria-drug interactions? ................................ 32!

VIII
2.1.2! Human gut bacteria investigated in this study ............................. 33!2.1.3! Experimental setup of bacteria-drug interaction screen and depletion-mode assay .................................................................................. 34!
2.2! Results ................................................................................................................ 38!2.2.1! Drug Selection ................................................................................... 38!2.2.2! Bacteria-Drug Interaction Screen .................................................. 41!2.2.3! Depletion-mode assay ...................................................................... 48!2.2.4! Summary: Bacteria-Drug interactions are specific ...................... 51!
2.3! Discussion and Outlook .................................................................................. 53!2.4! Clarification of contribution .......................................................................... 58!
3! DULOXETINE AFFECTS BACTERIAL GROWTH AND INDUCES CHANGES IN BACTERIAL COMMUNITIES ................................................. 59!
3.1! Introduction ...................................................................................................... 59!3.1.1! Why investigate bacterial interactions with duloxetine? ............ 59!3.1.2! Why investigate interactions in a synthetic community? ........... 60!3.1.3! Aims and Experimental outline ...................................................... 61!
3.2! Results ................................................................................................................ 63!3.2.1! Growth effects of duloxetine ........................................................... 63!3.2.2! Bacterial community shifts induced by duloxetine ..................... 65!
3.3! Summary and Discussion ............................................................................... 67!3.4! Clarification of contribution .......................................................................... 71!
4! HUMAN GUT BACTERIA CHANGE THEIR NATIVE METABOLISM UPON DULOXETINE EXPOSURE .................................................................. 73!
4.1! Introduction ...................................................................................................... 73!4.1.1! Why investigate bacterial duloxetine metabolism? ..................... 73!4.1.2! How to investigate bacterial metabolism: Untargeted metabolomics ................................................................................................ 74!4.1.3! Experimental Outline and Aims .................................................... 75!
4.2! Untargeted metabolomics of duloxetine interactions using 1H NMR spectroscopy ............................................................................................................. 77!
4.2.1! Experimental setup ........................................................................... 77!4.2.2! Results ................................................................................................ 77!4.2.3! Summary ............................................................................................ 79!
4.3! Untargeted metabolomics of bacterial duloxetine depletion using LC-MS/MS ...................................................................................................................... 80!

IX
4.3.1! Experimental setup .......................................................................... 80!4.3.2! Duloxetine is depleted in all conditions ........................................ 81!4.3.3! Systemic investigation of changes in mass features .................... 84!4.3.4! Feature annotation and pathway analysis ..................................... 85!
4.4! Summary and Discussion ............................................................................... 90!4.5! Clarification of contribution .......................................................................... 94!
5! DULOXETINE BINDS TO A NADH:QUINONE DEHYDROGENASE AND PURINE PATHWAY MEMBERS ...................................................................... 95!
5.1! Introduction ..................................................................................................... 95!5.1.1! Why investigate protein interactions of duloxetine? .................. 95!5.1.2! Aims and Experimental Outline .................................................... 96!5.1.3! Pull-down and proteomics of duloxetine binding proteins ....... 97!5.1.4! Overexpression of candidate proteins ........................................... 98!
5.2! Results ............................................................................................................... 99!5.2.1! Duloxetine binding protein enrichment ....................................... 99!5.2.2! Homologous overexpression of protein candidates .................. 105!5.2.3! Heterologous overexpression of protein candidates ................. 106!
5.3! Summary and Discussion ............................................................................. 108!5.3.1! Summary ......................................................................................... 108!5.3.2! Duloxetine as NADH:quinone dehydrogenase inhibitor at quinone binding site .................................................................................. 110!5.3.3! Duloxetine as nucleotide mimicking electron acceptor ........... 111!5.3.4! Alternative explanations ............................................................... 113!5.3.5! Conclusion ...................................................................................... 113!
5.4! Clarification of Contribution ....................................................................... 114!6! DISCUSSION AND OUTLOOK .................................................................. 115!
6.1! Summary of Results ....................................................................................... 115!6.1.1! Bioaccumulation of xenobiotics is a wide-spread characteristic of the human gut bacteria and affects community dynamics .............. 115!6.1.2! Bacterial NADH:quinone dehydrogenase and purine metabolism are likely affected by duloxetine ......................................... 116!
6.2! Discussion ....................................................................................................... 119!6.2.1! Side effects of host-targeted drugs are mediated through the gut microbiota ................................................................................................... 119!

X
6.2.2! Duloxetine influences depression symptoms through impact on gut microbiota ............................................................................................. 122!6.2.3! Deprotonated, negatively charged drugs are less likely to be sequestered .................................................................................................. 123!6.2.4! Potential of host-targeted drugs as antibiotic adjuvants ........... 124!6.2.5! Duloxetine inhibits bacterial NADH:quinone dehydrogenase and affects purine metabolism ................................................................. 126!
6.3! Conclusion ...................................................................................................... 127!7! MATERIALS AND METHODS ................................................................... 129!
7.1! Growth conditions and media ..................................................................... 129!7.2! UPLC methods ............................................................................................... 130!
7.2.1! UPLC-UV methods ........................................................................ 130!7.2.2! Data analysis .................................................................................... 132!
7.3! Bacteria-Drug Interaction Screen ................................................................ 133!7.3.1! Drug Selection ................................................................................. 133!7.3.2! Experimental setup ......................................................................... 134!7.3.3! Data analysis .................................................................................... 135!
7.4! Community Assembly Assay ....................................................................... 136!7.4.1! Experimental Setup ........................................................................ 136!7.4.2! DNA extraction and 16S barcode sequencing library preparation 137!7.4.3! 16S barcode sequencing analysis .................................................. 138!
7.5! Other in vitro assays ...................................................................................... 138!7.5.1! Depletion-mode assay .................................................................... 138!7.5.2! Growth curves for IC50 determination ....................................... 139!7.5.3! Resting Cell and Lysate assay ........................................................ 139!7.5.4! Duloxetine pull down assay .......................................................... 140!7.5.5! Homologous overexpression of protein candidates .................. 141!7.5.6! Heterologous overexpression of protein candidates ................. 142!
7.6! Untargeted Metabolomics with NMR ......................................................... 143!7.7! Untargeted Metabolomics with LC-MS/MS .............................................. 144!
7.7.1! Experimental setup ......................................................................... 144!7.7.2! Mass spectrometry method ........................................................... 144!7.7.3! Data analysis .................................................................................... 145!
7.8! Proteomics ...................................................................................................... 146!

XI
7.8.1! Sample preparation ........................................................................ 146!7.8.2! Mass spectrometry method and protein identification ............ 147!7.8.3! Data analysis ................................................................................... 148!
REFERENCES ................................................................................................... 149!APPENDIX ....................................................................................................... 162!
A. Side effect keywords ........................................................................................ 162!B. Bacteria-Drug Interactions ............................................................................. 163!C. C. saccharolyticum growth curves and IC50 ................................................ 167!


XIII
List of Figures
Figure 1: Hierarchal organization of xenobiotic interactions with the human gut microbiota. .............................................................................................................. 19!
Figure 2: Examples of promiscuous enzyme-drug interactions in bacteria. ........... 21!Figure 3: Chemical structure of duloxetine. ................................................................ 29!Figure 4: Experimental outline bacteria-drug interaction screen and depletion-
mode assay. .............................................................................................................. 36!Figure 5: Drug Selection workflow and result. ............................................................ 39!Figure 6: Technical replicates of UPLC injections from bacteria-drug interaction
screen. ...................................................................................................................... 43!Figure 7: Density distribution of drug depletion in bacteria-drug interaction
screen. ...................................................................................................................... 44!Figure 8: Reproducibility of significant growth fold changes in bacteria-drug
interaction screen. .................................................................................................. 46!Figure 9: Heatmap of growth effects in bacteria-drug interaction screen. .............. 47!Figure 10: Examples of bacterial drug degradation from the depletion-mode assay.
................................................................................................................................... 50!Figure 11: Bacteria-drug interactions. .......................................................................... 52!Figure 12: Community assembly assay outline. .......................................................... 62!Figure 13: IC50s for duloxetine. .................................................................................... 64!Figure 14: Growth curves with duloxetine. ................................................................. 65!Figure 15: Community composition of duloxetine assembly assay. ........................ 66!Figure 16: Duloxetine depletion in community assembly assay. .............................. 67!Figure 17: Outline of untargeted metabolomics experiments. ................................. 76!Figure 18: NMR spectra comparing B. uniformis treated with duloxetine to
controls. ................................................................................................................... 79!Figure 19: Technical and biological replicates of untargeted metabolomics. ......... 82!Figure 20: Depletion of duloxetine in untargeted metabolomics. ............................ 83!Figure 21: PCA of mass features from untargeted metabolomics. ........................... 83!Figure 22: Comparing fold changes of duloxetine treated bacteria to controls. .... 85!Figure 23: Alkynated duloxetine. .................................................................................. 97!Figure 24: Volcano plot of proteins detected in pull down. .................................... 100!Figure 25: Heatmap of protein blast alignment. ....................................................... 101!

XIV
Figure 26: Duloxetine depletion in E. coli homologous overexpression. .............. 106!Figure 27: Duloxetine depletion in E. coli heterologous overexpression. .............. 107!Figure 28: NADH:quinone dehydrogenase. .............................................................. 109!Figure 29: Enriched metabolites and enzymes in purine pathway of C.
saccharolyticum. .................................................................................................... 118!Figure 30: Outline of bacteria-drug interaction screening plates. .......................... 134!Figure 31: Growth curves of C. saccharolyticum exposed to a dilution series of
duloxetine. ............................................................................................................. 167!Figure 32: Duloxetine IC50 determination for C. saccharolyticum. ....................... 167!

XV
List of Tables
Table 1: Selection of species in bacteria-drug interaction screen. ............................ 34!Table 2: Drugs selected for the Bacteria-Drug Interaction Screen. .......................... 40!Table 3: Duloxetine depletion in NMR spectroscopy samples. Interference
indicates duloxetine peaks, which partially interfered with peaks in bacteria only treated sample. ............................................................................................... 78!
Table 4: KEGG Pathways enriched in significantly changed mass features. .......... 88!Table 5: Species-specific annotations of top 10 changed mass features. ................. 89!Table 6: GO term enrichment (most specific) for 55 enriched proteins. .............. 102!Table 7: KEGG Pathway enrichment analysis for 55 enriched proteins represented
by 33 EC numbers. ............................................................................................... 104!Table 8: Gut Microbiota Medium (GMM) ................................................................ 129!Table 9: Recipe for LB medium. .................................................................................. 130!Table 10: UPLC methods. ............................................................................................ 131!Table 11: UPLC method description by drug ........................................................... 131!Table 12: Indirect gut related side effects from SIDER database. ........................... 162!Table 13: Direct gut related side effects from SIDER database. .............................. 163!Table 14: Drug depletion in bacteria-drug interaction screen. ............................... 163!Table 15: Growth effects from bacteria-drug interaction screen. ........................... 164!Table 16: Drug depletion in depletion-mode assay. ................................................. 165!


17
1 Introduction
The text of the following chapter sections 1.1-1.5 has mainly been taken from the
review Klünemann et al. (2014) and has been originally written by myself. I
modified and updated it according to the needs of this thesis introduction.
1.1 The human gut microbiota and its xenometabolism
1.1.1 The human gut microbiota
With the help of metagenomics tools, it is now possible to determine the
identity of a large fraction of the microbial species colonizing the human gut (Qin
et al. 2010; Human Microbiome Project Consortium. 2012). These tools are also
revealing the genetic repertoire of the gut microbiome in an unprecedented detail.
The resulting rich datasets are enabling the characterization of the gut microbial
communities and their association with health (Blaser et al. 2013).
The gut microbiota has been shown to modify or metabolize several kinds of
xenobiotics, from novel cancer drugs through millennia old analgesics to dietary
components (Goldman et al. 1974; Azad Khan et al. 1983; Sousa et al. 2008;
Wallace et al. 2010; Zheng et al. 2013; Clayton et al. 2009). Recent studies have
also highlighted the feasibility of exploiting and manipulating this microbial-
mediated xenometabolism to improve the host health or to prohibit medicinal
side effects. For example, Wallace et al. showed that a deleterious
biotransformation of the cancer drug Irinotecan can be averted by inhibiting
bacterial !–glucuronidase (Wallace et al. 2010). On a more general level, probiotic
bacteria like Lactobacillus sp. have been shown to ease C. difficile-associated
diseases, diarrhea and other side effects of antibiotics (Cimperman et al. 2011;
Hickson 2011).
Thanks to the advances in various omics technologies, molecular pathways of
xenometabolism and other xenobiotic interactions in the gut microbiota have now

18
started to unfold through the identification of responsible microorganisms and
enzymes (Ravcheev & Thiele 2016; Wang et al. 2011; Haiser et al. 2013). In parallel
to these advances stemming from metagenomics, more and more evidence is
piling up supporting the key role of gut microbiota in xenometabolism (Sousa et
al. 2008; Clayton et al. 2009; Zheng et al. 2013). In particular, metabolomics has
made it possible to trace the metabolic fate of xenobiotic compounds (Segata et al.
2013; Wikoff & Anfora 2009; van Duynhoven et al. 2011), which, together with
metagenomics, is leading to the recent resurge in the research on xenometabolism
(Sowada et al. 2014; Johnson et al. 2012; Wilson & Nicholson 2016).
Understanding xenobiotic interactions in the gut is a highly challenging task
due to three main reasons: the widespread promiscuity of metabolic enzymes, the
compositional complexity of the gut microbiota, and the interactions between the
host and the microbial-mediated xenometabolism. Due to the widespread
promiscuity of metabolic enzymes (Khersonsky & Tawfik 2010; Ekins 2004; Oguri
1994), the number of possible routes through which a xenobiotic compound can
interact with or get metabolized or modified by increases combinatorially with the
enzymatic repertoire of the microbiota. The compositional diversity and spatial
heterogeneity of the microbiota and the host-microbiota interaction through the
enterohepatic cycle adds another layer to this complexity.
1.1.2 Hierarchy of xenometabolic interactions in the gut
Xenometabolism is the enzyme-mediated biochemical transformation of a
xenobiotic, meaning non-native, compound. Other xenometabolic interactions
can involve the disturbance of native metabolism by the xenobiotic compound.
The general metabolic interactions that a xenobiotic compound can undergo in
the gut microbiota can be conceptually organized into three levels: community,
species and enzymes (Figure 1). Complex xenometabolic pathways often emerge
through the functional interplay within and across these hierarchical levels. At the
outermost level, the spatial and compositional structure of the microbial
community influences the survival, activity and procreation of species in the gut
environment, and hence the overall xenometabolism (Figure 1c). At the

19
intermediate level, individual species determine and control the enzyme
availability for the xenometabolism (Figure 1b). At the innermost level, the
enzymes perform the actual biotransformations owing to their promiscuity
(Figure 1a).
Figure 1: Hierarchal organization of xenobiotic interactions with the human gut microbiota. (a) Enzyme-level xenometabolism. Promiscuous enzymes like cytochrome P450 have broad substrate specificities and can biotransform different xenobiotics. Enzyme moonlighting can also lead to different modifications of a given xenobiotic compound. (b) Species-level xenometabolism. Xenometabolic enzymes are usually found in the cytosol of microbial cells, but some can be secreted as well. A xenobiotic compound can undergo different biotransformations within a microbe before its metabolites are exported into the gut lumen, or used by the microorganism as a nutrient. (c) Community-level xenometabolism. A xenobiotic or its derivatives can be absorbed and/or modified by the host, excreted from the gut, or modified by the gut microbiota in many alternative ways. Different species in the microbiota can transform a given xenobiotic into different compounds, which can be further metabolized by the same or different microbes. Depending on the metabolic status of certain bacteria, a xenobiotic might be degraded or not. The xenobiotics and the degradation intermediates are also affected by the structure of the microbiota and vice versa. Figure adapted from (Klünemann et al. 2014)
As a consequence, the gut microbiome can alter the disposition, toxicity, and
efficacy of therapeutic drugs in different ways (Swanson 2015): 1) Activation or
Inactivation of a xenobiotic by metabolic modification. 2) Sequestration or
bioaccumulation by binding the xenobiotic. 3) Reactivate a xenobiotic already
detoxified by liver metabolism. 4) Generating metabolic intermediates, which are

20
metabolized to toxic compounds by the host. 5) Microbial metabolites and
xenobiotics compete directly for host enzymes. The following chapter will focus
on potential mechanism behind gut microbial xenobiotic metabolism and its
consequences on the host while also highlighting how xenobiotics influence the
gut microbiota in return. The different levels of regulation conceptualized in
Figure 1 structure the following parts of introduction.
1.2 Promiscuous enzymes drive and enlarge
xenometabolic interactions
Enzymes can often bind to more compounds (substrate promiscuity) and
catalyze more reactions (functional moonlighting) than those listed in traditional
databases like KEGG (Kanehisa et al. 2014), and thus may exhibit functions and
biochemical features beyond the current description (Khersonsky & Tawfik 2010;
Ekins 2004). This promiscuity is the key driver of xenobiotic metabolism (Figure
1a). Indeed, xenobiotic metabolism in the liver is also driven by highly
promiscuous enzymes like cytochrome P450 oxidases and gluthathione S-
transferases (Jakoby & Ziegler 1990). In microbial systems, enzyme promiscuity
has been as yet mainly investigated in the context of bioremediation of toxic
compounds from the environment (Wu et al. 2012), or, in the context of
biotechnological production of valuable chemical compounds (Soni C Banerjee
2005; Gao et al. 2011). For a comprehensive review on the biotransformation of
xenobiotics mediated by the gut microbial enzymes and its similarity to
bioremediation, see Haiser & Turnbaugh (2013).
Specific links between xenometabolism and the responsible enzyme are
scarcely known for gut microbes. However, numerous enzyme-xenobiotic
compound relationships have been described in other biological systems,
particularly in the context of liver metabolism (Jakoby & Ziegler 1990; Holzhütter
et al. 2012; Valerio & Long 2010). To obtain an overview of the bacterial enzymes
relevant for xenobiotic metabolism, I compiled a xenobiotic-enzyme network for
exemplary xenobiotics (Figure 2) based on interactions obtained from the

21
BRENDA database (Schomburg et al. 2013). The densely populated columns in
Figure 2, such as EC3.1 (esterases) and EC1.7 (nitrate reductases), highlight the
enzyme classes that might be of broad relevance for xenobiotic biotransformation.
This network also underlines the notion that enzymes with similar biochemical
functionality often process structurally similar molecules. However, the large
enzymatic repertoire and the complexity of the gut microbiota require
consideration of xenobiotic metabolism beyond single-step biotransformations
(Figure 1b).
Figure 2: Examples of promiscuous enzyme-drug interactions in bacteria. Each column corresponds to a different enzyme class according to the Enzyme Commission (EC) nomenclature. Enzyme promiscuity is the key driver of xenobiotic metabolism, whereby a xenobiotic compound can often be transformed by several different enzymes and vice versa. The shown examples were obtained from the BRENDA database (Schomburg et al. 2013). Abbreviations: A, Activating; I, Inhibiting; P, Product; S, Substrate. Figure from (Klünemann et al. 2014)

22
1.3 Enzyme availability and interaction between xeno-
and native metabolism
1.3.1 Bacterial metabolism can change xenobiotics
One of the well-known examples of xenometabolism that is specific to a
particular gut bacterium is the metabolism of Digoxin by Eggerthella lenta (Haiser
et al. 2013). Although such specificity of xenometabolism is scarcely known for
other compounds, links between bacterial species and metabolites have been
observed in several studies (Zheng et al. 2013; Wang et al. 2011; Mahmood et al.
2015; Shu et al. 1991). Not only metabolic interactions can be species specific but
also sequestration. For example, the binding of L-DOPA to surface proteins of
Heliobacter pylori interferes with the treatment of Parkinson’s disease and it
improves again after eradication of the pathogen (Pierantozzi et al. 2006; Niehues
& Hensel 2009). Such correlations can be used to narrow down the list of potential
biotransforming species for a given xenobiotic compound.
While the nature and the abundance of different enzymes harbored by a
species will determine the possibilities and limits of the xenobiotic interactions
and xenometabolism, the interactions between xeno- and native metabolism will
impact the dynamics and efficiency of the actual xenometabolic pathways. One
step towards understanding species level xenometabolic interactions is to assess its
enzymatic repertoire and map the corresponding metabolic network.
1.3.2 Xenobiotics can change bacterial metabolism
The metabolic activity status of a bacterium can also have a strong influence
on the probability of biotransformations, which can subsequently impact the
entire community (Allison et al. 2011; Tamura et al. 2013; Cai et al. 2015). Some
xenobiotics can also directly influence the microbial metabolism, e.g. by invoking
changes in gene expression (Maurice et al. 2013; de Freitas et al. 2016). Such feed-
forward phenomena increase the challenges for investigating xenometabolic
interactions. Metatranscriptomic and metaproteomic studies can help to identify

23
the metabolic state of a given species and to understand the response of microbial
native metabolism to the perturbations introduced by xenobiotics (Booijink et al.
2010; Kolmeder et al. 2012; Pérez-Cobas et al. 2013; Cai et al. 2015). Another
method to investigate if and how bacterial native metabolism is affected makes use
of recent advances in (meta)metabolomics (Jacobs et al. 2008; Davey et al. 2013;
Johnson et al. 2012; Vernocchi et al. 2016). Thus, xenobiotics can alter the
composition of the intestinal microbiota as well as the microbial gene expression
and metabolism.
1.4 Community structure influences xenometabolic
interactions
1.4.1 Community structure determines possible interactions
A typical gut microbiota consists of hundreds of diverse microbial species
(Human Microbiome Project Consortium. 2012; Qin et al. 2010). This
compositional complexity, combined with the spatial heterogeneity of the
microbiota (Rey et al. 2013; Dunne 2001; Yang et al. 2005; Hao & Lee 2004) poses
arguably the biggest challenge for investigating the xenometabolism in the gut. A
microbial consortium can interact with and transform a certain xenobiotic
compound in qualitatively different ways than any single species (Figure 1c). A
community is especially more likely to perform multiple consecutive
transformation steps due to the larger enzymatic repertoire and thus the
likelihood is higher that at least some of the many species would express a given
enzyme under a given condition.
The spatial structure of the gut microbiota is a critical factor for
xenometabolism (Donaldson et al. 2015; Rey et al. 2013; Yang et al. 2005; Dunne
2001). For example, a biotransformation of a xenobiotic might require an acidic
environment and thus would be performed by microbes residing closer to or in
the small intestine, whereas microbes in the distal colon would perform
subsequent steps of the xenometabolism.

24
The composition of the gut microbiota is strongly influenced by several
environmental and host-dependent factors including nutrient supply, peristaltic
movements and the host’s immune system (Hao & Lee 2004; Hooper et al. 2012).
In turn, the gut microbiota can act as an ecosystem engineer influencing some of
these factors (Costello & Stagaman 2012). Regarding species composition,
individual gut microbiota are often considerably different from each other
(Human Microbiome Project Consortium. 2012). Interestingly, these diverse
microbiotas can converge regarding their functional repertoire, for example, when
seen from the viewpoint of the represented metabolic capabilities (Human
Microbiome Project Consortium. 2012; Abubucker et al. 2012). Accordingly, in a
recent metaproteomic analysis, Kolmeder et al. (2012) observed temporally stable
expression for a core protein pool of the human intestinal microbiota. From a
xenometabolism perspective, these observations suggest that different microbiota
may exhibit common functionalities despite compositional dissimilarities.
However, the dependency of xenometabolism on the microbial community
composition can be highly complex (Figure 1c). It has been shown that differences
in microbial composition is associated with differences in xenometabolic gene
capacity (Das et al. 2016). Hence the functional implications of the convergent
metabolic potential remain to be evaluated.
A source of diversity in xenometabolism that can arise even between species
with similar metabolic capabilities is the disparity in their ability to secrete
enzymes, and to uptake/excrete xenobiotics and derivative xenometabolites
(Nikaido 1996; Lee et al. 2010; Sorg et al. 2014). A given xenometabolic process
may involve a complex combination of intra- and extra-cellular biotransformation
processes (Figure 1b). In the gut lumen, secreted enzymes can transform the
original xenobiotic compound or its metabolic derivatives secreted by other
microbes. Inside the cells, biotransformation is limited to the enzyme repertoire of
the respective bacterium, but likelihood of biotransformation may be higher due
to higher proximity between the xenobiotic and the transforming enzyme(s).

25
1.4.2 Xenobiotics influence gut microbiota composition and structure
Secreted enzymes, native metabolites and xenometabolites can positively or
negatively impact the whole community (Lee et al. 2010; Riley & Wertz 2002; Sorg
et al. 2014). Thus, the xenometabolic processes and the gut microbiota can
reciprocally impact each other. Many examples of xenobiotic influence on gut
microbiota composition have been described in recent years (Catry et al. 2015;
Jackson et al. 2016; Cai et al. 2015; Davey et al. 2013). Particular noteworthy is a
study which disentangled the effect of metformin, an antidiabetic drug, on the gut
microbiome composition from the effect of diabetes or metabolic syndrome
(Forslund et al. 2015). Effects of proton pump inhibitors or antidepressants have
also been shown in large cohort studies (Jackson et al. 2016; Zhernakova et al.
2016). In a few studies, which investigated a cause for a shift in microbiome
composition, an effect of the xenobiotic on bacterial gene expression or
metabolism was observed (Cai et al. 2015; Catry et al. 2015; Kaufman & Griffiths
2009). However, most of these changes have been observed in host-mediated
systems, thus the shift in microbiota composition could also be caused by the host
and not by the xenobiotic directly interacting with the bacteria.
1.5 Host-microbiota co-metabolism of xenobiotics
After ingestion and passage of xenobiotics through the stomach, the
alkalization of the intestinal content is critical for the enzyme activity and
subsequently for xenometabolism within the small intestine. Absorption to the
bloodstream can occur by many different ways such as active transport, facilitated
diffusion, pinocytosis or passive diffusion. Absorbed substances are transported
via the portal vein to the liver, where metabolism of most xenobiotics takes place
(Chhabra 1979; Gad 2007). Following the absorption of drugs from the stomach
and gut, biotransformation in the gastrointestinal epithelial tissue and liver can
drastically alter their bioavailability and pharmacokinetics (Chhabra 1979). This
so-called first pass metabolism consists of two phases and it alters the activity of

26
xenobiotics and/or converts them into more water-soluble compounds, often
leading to detoxification and eventual excretion (Chhabra 1979; Gad 2007). In
phase I it is usually mediated by cytochrome P450 enzymes and it introduces
reactive or polar chemical groups enabling further detoxification reactions. In
phase II the enzymes catalyze conjugation reactions to transform compounds to
less toxic forms and increase the water-solubility for easier excretion. In many
cases, this so-called ‘first-pass metabolism’ not only includes metabolism by the
liver but also that by the gut microbiota (Björkholm et al. 2009).
The co-metabolism by the liver and the gut microbiota can also lead to the
circulation of xenobiotics between these two metabolic compartments,
constituting the enterohepatic cycle. During the enterohepatic circulation, an
unchanged xenobiotic or its biotransformed metabolite can be excreted back into
the small intestines via the bile (Gad 2007; Kaminsky & Zhang 2003). Xenobiotics
can be biotransformed first either by the liver or the microbiota and then further
modifications can occur in the other system (Clayton et al. 2009; Wallace et al.
2010). Together, the intestinal absorption barrier, phase I and II metabolism and
excretion constitute the defense mechanism of the human body against foreign
(toxic) substances.
The intestinal microbiota adds to the possibilities and complexity of human
metabolism in general and xenometabolism particularly. In general, the
microbiota has a strong impact on human metabolism, immune system and
potentially behavior (Wikoff & Anfora 2009; Hooper et al. 2012; Heijtz et al. 2011;
Cai et al. 2015). In particular, the interconnectivity between the intestinal tract
and other metabolic compartments makes it essential to view xenometabolic
processes as a co-metabolism by the host and the microbiota (Swanson 2015). The
examples of such co-metabolism include pro-drugs like mesalazine, which are
activated by the gut microbiota and then detoxified by the liver (Azad Khan et al.
1983). Another prominent example is irinotecan, a cancer drug, which is first
glucuronidated by the liver and then, through enterohepatic circulation,
transferred back to the gut, where it is further metabolized by the gut microbiota
(Wallace et al. 2010). Intriguingly, the xenobiotic co-metabolism can be further

27
interconnected by the mutual regulation of host and microbiota gene expression
in response to a xenobiotic. For example, the intestinal microbiota can mediate
changes in the hepatic gene expression and the xenometabolism thereof in
response to a xenobiotic (Björkholm et al. 2009). For a extensive review of gut
microbiota-host xenobiotic co-metabolism see Carmody & Turnbaugh (2014).
1.6 The gut-brain axis and depression
An intriguing example where all different factors of host system, microbiota
and drug interactions act in concert is the gut-brain axis, which is particularly
relevant for the development and treatment of depression. The human gut
microbiota, the gut and the central nervous system are closely connected through
an exchange of numerous metabolites and hormones (Collins & Bercik 2009;
O’Mahony et al. 2015). In particular at the functional level, the gut microbiota
plays an important role in maturation of the immune and nervous system (Sharon
et al. 2016). Microglia, the immune cells of the brain, and the blood-brain-barrier
are potentially trained and influenced by the microbiota. Newly emerging data
suggest the importance of communication between the gut and the brain in
disorders as diverse as anxiety, depression, cognition, and autism spectrum
disorder (Sharon et al. 2016). Other data from animal studies indicate that
changes in behavior can change the microbiome composition, and that these
changes have effects on inflammation signals in the GI tract (Collins & Bercik
2009). In turn, prebiotics and probiotics have a mood lightening effect or effects
on brain activity in human subjects (Schmidt et al. 2014; Tillisch et al. 2013).
Especially serotonin synthesis is closely connected to the gut and 90% of serotonin
is located in the enterochromaffin cells in the GI tract, where it regulates intestinal
movements (Berger et al. 2009). Additionally, the gut microbiome is able to
modulate host tryptophan metabolism, which in turn affects serotonin synthesis
and production of neuroactive metabolites (O’Mahony et al. 2015). Thus, there is
substantial overlap between behaviors influenced by the gut microbiota and those,
which rely on intact serotonergic neurotransmission like mood or appetite.

28
The development of depression seems to be closely linked with a change in
microbiota (Foster & McVey Neufeld 2013). Patients with major depressive
disorder have a different gut microbiome than healthy subjects (Zheng et al.
2016), and also in comparison to patients in remission (Jiang et al. 2015). Mice
treated with feces from patients showed depressive-like symptoms (Jiang et al.
2015; Zheng et al. 2016). However, in both cases the studies did not control for the
use of antidepressants, thus a change in microbiome might be induced by
medication. Two studies that investigated population cohorts found an
association between certain antidepressant treatments and changes in the diversity
of gut bacteria (Falcony et al. 2016; Zhernakova et al. 2016). In turn these studies
did not control for depression among subjects.
Another factor to be considered is that many antipsychotics induce weight
gain (Dent et al. 2012). Weight gain can be caused by a change in microbiota
(Musso et al. 2011) or because of differences in life style and nutrition change the
microbiota (Turnbaugh et al. 2009; Zhernakova et al. 2016). Thus, on the one
hand the observed changes in microbiome composition in patients with
depression could be caused by the weight gain induced by antidepressive
treatment. On the other hand, the weight gain might be caused through
medication changing the microbiome (Davey et al. 2013; Morgan et al. 2014).
Differences in weight gain can be observed between medications from the same
class. For example duloxetine induces weight gain, while the structurally similar
antidepressant fluoxetine does not (Dent et al. 2012).
Interestingly, many antipsychotic drugs have antimicrobial properties and can
in vitro augment the efficacy of antibiotics (Jeyaseeli et al. 2012; Jeyaseeli et al.
2006; Ayaz et al. 2015; Munoz-Bellido et al. 2000). For antidepressants, which act
as serotonin reuptake inhibitors blocking a molecular pump, these effects have
been associated with blocking drug efflux pumps in bacteria (Bohnert et al. 2011).
Different antidepressants affect bacteria with different efficiencies (Munoz-Bellido
et al. 2000; Kalaycı et al. 2015). Additionally, as some antidepressants have
antimicrobial effects on their own they have to directly affect bacterial physiology
as well (Munoz-Bellido et al. 2000).

29
Taking these studies together, an interaction between depression, medication
and gut microbiota is likely, but cause and consequence are yet difficult to assess.
In the next part I will shortly introduce the specific antidepressant duloxetine, as
much of the following study is based on it.
1.6.1 Duloxetine and its pharmacokinetics and -dynamics
Antidepressants are widely prescribed medications treating various forms of
depression and anxiety, and the number of patients receiving antidepressive
treatment is on the rise worldwide. In the US, duloxetine (Trade name: Cymbalta)
is one of the most commonly prescribed antidepressant, and is in the top 20
pharmaceutical products by sales volume in 2013 (PMLive 2015). It is a
norepinephrine and serotonin reuptake inhibitor (SNRI), which leads to a longer
exposition of synapses to these neurotransmitters, which in turn has a mood-
lightening effect. Duloxetine binds selectively with high affinity to both
norepinephrine (NE) and serotonin (5-HT) transporters and lacks affinity for
monoamine receptors within the central nervous system (Wernicke et al. 2005). It
is also in use or investigated for treating stress-induced urinary incontinence.
Common side effects are nausea, insomnia, and dizziness, which are consistent
with the pharmacology of the molecule as it interacts with the hormonal and
nervous system (Wernicke et al. 2005). Another side effect of duloxetine that is
common to many antidepressants is weight gain (Dent et al. 2012) but also
constipation. Chemically, it is a naphthalene with a sulfur hetero cycle and an
secondary amine group attached (Figure 3).
Figure 3: Chemical structure of duloxetine.
Duloxetine is a thiophene derivative. It acts as a selective neurotransmitter reuptake inhibitor for serotonin
and noradrenalin (SNRI).

30
Duloxetine has a long half-life after oral administration of around 11h, and its
metabolites are systemically cleared only after up to 120 hours (Lantz et al. 2003).
It is mainly metabolized in the liver, and is hepatotoxic in higher doses.
Duloxetine interacts with many cytochrome P450 enzymes, but is mainly
metabolized by CYP1A2 and CYP2D6. Duloxetine’s main metabolites are
excreted to 70% in urine and to 20% in feces after extensive first and second phase
detoxifying metabolism. The major biotransformation pathways for duloxetine
involve oxidation of the naphthyl ring at either the 4-, 5-, or 6-positions followed
by further oxidation, methylation, and/or conjugation. Conjugated metabolites
are mainly found in the urine. In feces, 4-hydroxy duloxetine and an unidentified
polar metabolite are the main metabolites (Lantz et al. 2003). Duloxetine’s
metabolites 5-hydroxyduloxetine, 6-hydroxyduloxetine and 6-hydroxy-5-
methoxyduloxetine have been shown to inhibit 5HT and/or NE transporters and
hence are possibly contributing to duloxetine’s therapeutic impact (Kuo et al.
2004). Chan et al. (2011) reported that the hepatotoxicity of duloxetine is possibly
not related to the bioactivation of its thiophene moiety, or its transient binding of
CYP1A2, but might be due to the epoxidation of its naphthyl ring. As all
experiments are performed with the pure compound, it should be noted that
duloxetine is sensitive to neutral, acidic and alkaline hydrolysis, but stable to
oxidative stress (Sinha et al. 2009)
1.7 Aims and Outline of the Thesis
1.7.1 Aims
Studies as early as in the 70s showed that the gut and its intrinsic gut
microbiota is a possible site of drug modification (Goldman et al. 1974) and later
studies confirmed that human microbiota metabolism with its diverse set of genes
can be a cause for drug side effects (Wallace et al. 2010; Haiser et al. 2014; Sousa et
al. 2008). The general metabolic processes a xenobiotic compound can potentially
undergo in the gut are known in principle (Wilson & Nicholson 2016; Koppel &
Balskus 2016). However, the specifics of when, where, and how are often unclear.

31
The biomodification of a xenobiotic compound is hard to predict from the
compound structure alone, since it is also dependent on the chemical
environment and enzyme availability (Nicholson 2002). Thus, our knowledge of
the biochemical capabilities of gut bacteria to interact with or metabolize
therapeutic drugs remains largely incomplete.
The goal of this study was to conduct a systematic screen of xenobiotic-
microbial interactions elucidating the potential of gut bacteria to modify or
sequester host-targeted drugs. Insights into gut bacterial-drug interactions can
facilitate prediction of xenobiotic biotransformation, which is highly valuable
since it can reduce the cost of developing drugs and prevent unnecessary testing
for toxicity (Klünemann et al. 2014). Furthermore, together with other data from
metagenomic sequencing this knowledge can foster personalized dosage (for
better pharmacokinetics) and personalized medicine, thus reducing side effects
(Clayton et al. 2006). In conclusion, the aim of my PhD work is to find gut
bacteria-drug interactions in vitro and then investigate potential underlying
mechanisms.
1.7.2 Outline
In chapter 2, I present results from a bacteria-drug interaction screen and
investigations into the mode of bacterial drug depletion. Results from this
interaction study are followed upon in more details through investigation of gut
bacterial interactions with the antidepressant duloxetine. As gut bacteria live as
part of a community, interactions of duloxetine with different bacterial targets
within a defined community context are assessed and presented in chapter 3. In
chapter 4, I present results from investigating the effect of duloxetine on bacterial
native metabolism, which may in turn influence bacterial behavior in a
community. In chapter 5, to find a mechanistic explanation for bacteria-
duloxetine interactions, I explored the direct protein targets of duloxetine using
click-chemistry based methods and proteomics. In the last chapter I give a
summary of all findings, discuss how they connect to current research and
propose further research directions.

32
2 Human gut bacteria interactions with host-
targeted drugs
In this chapter I will describe the experimental basis for the rest of my PhD work presented in this thesis. I will explain why and how a gut bacteria-drug interaction screen and follow-up on the depletion-mode of bacterial drug depletion is conducted. I will describe the results from both experiments separately and give summary of findings fro both screens in the end. Then I will discuss the limitations and implications of the results for specific bacteria-drug interactions. In the end I will give a short outlook on further experiments.
2.1 Introduction
2.1.1 Why investigate bacteria-drug interactions?
Studies in the 70s showed that the gut and its intrinsic gut microbiota is a
possible site of drug degradation (Goldman et al. 1974) and later studies
confirmed that human microbiota metabolism with its diverse set of genes can be
a cause for side effects (Wallace et al. 2010; Haiser et al. 2014). It has been shown
recently that xenobiotics-gut microbiota-host interactions have major impacts on
health in a microbiota dependent manner (Zheng et al. 2013). Additionally, the
drugs can influence the human microbiota itself, which might cause side effects
(Forslund et al. 2015). Prediction of xenobiotic biotransformation is highly
valuable since it can reduce the cost of developing drugs and prevent unnecessary
testing for toxicity. Furthermore, in context with other data from metagenomic
sequencing and detailed knowledge of the pharmacodynamics/kinetics of the drug
it can foster personalized dosage boosting treatment efficiency. Knowing the
effects of a drug on the microbiota and its effect on the drug can lead to
development of new treatment strategies having the microbiota as its primary
target (Swanson 2015). To predict efficacy or potential toxic side effects one has

33
thus to investigate how the xenobiotic metabolism of gut bacteria influences the
degradation and absorption of the drugs.
The general metabolic processes a xenobiotic compound can potentially
undergo in the gut are known in principle. However, the specifics of when, where,
and how are often unclear. The biodegradation of a xenobiotic compound is hard
to predict from the compound structure alone, since it is also dependent on the
chemical environment and enzyme availability. Thus, for most current drugs it is
not known if and how they are affected by the human gut microbiota and in turn
how the microbiota is affected by drugs (Patterson & Turnbaugh 2014).
To our knowledge, there has not been any systematic study of xenobiotic-
microbial interactions elucidating how wide-spread bacterial drug interaction is
across therapeutic drugs or the gut microbiota. We therefore planned a medium-
scale systematic study researching the interactions between therapeutic drugs and
human gut bacteria in vitro in monocultures. We aimed to investigate around 500
pairwise interactions, one drug-bacteria interaction at a time.
2.1.2 Human gut bacteria investigated in this study
In this study, I used a subset of a panel of cultivatable human gut bacteria (96
strains representing 74 species) being used in a variety of projects at EMBL-
Heidelberg. These were rationally selected to cover a broad range of phylogenetic
and metabolic characteristics of the human gut microbiota. Parameters for
selection included: i) relative abundance higher than 10-5, ii) prevalence higher
than 90% in metagenomic datasets of healthy persons, iii) cultivability in
monocultures, and iv) availability of an annotated genome. Additional species
were included to cover probiotics, opportunistic pathogens and species
representing particular metabolic features like mucin degradation or xenobiotic
biotransformation. A subset of this selection was used in the bacteria-drug
interaction screen presented in this study. Besides covering the main phyla present
in the human gut, the focus here was to cover potentially metabolic diverse but
phylogenetically similar species. This focus allows narrowing down quickly on
relevant genes potentially involved in a bacteria-drug interaction. Additionally,

34
bacteria known to involved in xenobiotic interactions like E. lenta were included
(Haiser et al. 2014). The final selection used in the screen can be found in Table 1.
Bacteria strains were purchased from ATCC or DMSZ strain collections.
Table 1: Selection of species in bacteria-drug interaction screen.
Gram stain Phylum Species Strain NCBI tax ID negative Bacteroidetes Bacteroides fragilis EN-2; VPI 2553 272559 negative Bacteroidetes Bacteroides thetaiotaomicron E50(VPI 5482) 226186 negative Bacteroidetes Bacteroides uniformis VPI 0061 411479 negative Bacteroidetes Bacteroides uniformis HM-715 CL03T00C23 997889 negative Bacteroidetes Bacteroides uniformis HM-716 CL03T12C37 997890 negative Bacteroidetes Bacteroides vulgatus DSM-1447 435590 positive Actinobacteria Bifidobacterium animalis subsp. lactis BI-07 742729 positive Actinobacteria Bifidobacterium longum subsp. infantis S12 391904 positive Actinobacteria Bifidobacterium longum subsp. longum E194b (Variant a) positive Firmicutes Clostridium bolteae WAL 16351 411902 positive Firmicutes Clostridium ramosum 113-I; VPI 0427 445974 positive Firmicutes Clostridium saccharolyticum WM1 610130 positive Firmicutes Coprococcus comes VPI CI-38 470146 positive Actinobacteria Eggerthella lenta 1899 B; VPI 0255 479437 negative Proteobacteria Escherichia coli ED1a ED1a 585397 negative Proteobacteria Escherichia coli IAI1 IAI1 585034 positive Firmicutes Eubacterium rectale A1-86 657318 negative Fusobacteria Fusobacterium nucleatum 1612A; VPI 4355 190304 positive Firmicutes Lactobacillus gasseri AM 63 324831 positive Firmicutes Lactobacillus paracasei LPC-37 positive Firmicutes Lactobacillus plantarum WCFS1 220668 positive Firmicutes Lactococcus lactis IL1403 272623 positive Firmicutes Ruminococcus gnavus VPI C7-9 411470 positive Firmicutes Ruminococcus torques VPI B2-51 411460 positive Firmicutes Streptococcus salivarius 275
2.1.3 Experimental setup of bacteria-drug interaction screen
and depletion-mode assay
The number of interactions investigated was mainly limited by the detection
method for the drugs. For detection the drug is separated from media compounds
by liquid chromatography, thus each drug has a different chromatographic
method. As all drugs need to be detected in the same screen, establishing the
different methods using the same buffer system was challenging and time-

35
consuming. Within the constraints of analytics, I selected drugs to investigate a
broad diversity of them spanning a wide therapeutic area and a spectrum of
chemical structures. For a detailed description of drug selection and experimental
conditions refer to method section 7.3 on page 133.
The experimental investigation was set up in two parts: first a screening part
investigating a broad range of potential bacteria-drug interactions and then
assaying the depletion hits from the screen to determine the mode of depletion
(Figure 4). The bacteria-drug interaction screen was conducted in 96 well plates
with 150µl of medium, growth was monitored during 48h anaerobic incubation,
and bacteria were removed by centrifugation before extracting the spent medium
in organic phases to measure the drug concentration. Extraction protocol was
implemented with a pipetting robot. As shown in the plate outline in Figure 4, I
used one bacteria-free control per plate and drug, but triplicates for each bacteria-
drug interaction. All bacteria-drug interactions were screened in biological
duplicates.

36
Figure 4: Experimental outline bacteria-drug interaction screen and depletion-mode assay. Interactions were studied in two ways: first a screen in 96-well plates to find potential bacteria-drug interactions and then a depletion-mode assay of the hits to distinguish between bioaccumulation and metabolism of drug compounds. For indirect drug detection, bacterial cultures were removed by centrifugation and the supernatant was extracted and analyzed.
As bacteria are removed before extraction of the spent medium, drug
compounds can be depleted in the screen for multiple reasons: compounds can be
bound to bacteria or to secreted extracellular proteins, compounds can be taken
up by bacteria and stored inside, or compounds can be metabolized, either
completely or biotransformed to a different, maybe less bacteriotoxic form.
Whereas the first two effects are bioaccumulations and have implications mainly
on drug dosage and maybe bacterial physiology and community dynamics, the
latter can create compounds toxic to humans and lead to serious side effects
(Zheng et al. 2013). Hence I designed a depletion-mode assay to distinguish
between bioaccumulation of drug compounds by bacteria and a
biotransformation of drug compounds by bacteria.
In the depletion-mode assay I extract the same culture in two different ways:
indirectly by removing first the bacteria using centrifugation and then extracting
the drug from the spent media and directly by adding the extraction solvent

37
directly to the whole culture consisting of bacteria, extracellular components and
spent media (Figure 4). Indirect extraction hits would confirm the interaction
found in the bigger bacteria-drug interaction screen whereas hits from direct
extractions point to a metabolic interaction as the original drug compound is
removed from the whole culture. The assay was conducted in 2ml eppendorf tubes
with 1ml of medium, and after 48h incubation under agitation samples were split
for direct and indirect extraction. This way the same samples could be used to
investigate if the drug-bacteria interaction was bioaccumulation or
biotransformation of the drug. Each interaction and their controls were assayed at
least in triplicates.
Bacteria-drug interaction screen and depletion-mode assay both used a drug
concentration of 50µM, which in most cases approximates the concentration of
one pill (0.02-3mmol) diluted in the volume of the gut (approx. 2.5L). The
inoculation OD578 of 0.01 and incubation of the bacteria anaerobically for 48h at
37°C was also the same.
The concentrations of all drug compounds in the bacteria-drug interaction
screen and depletion-mode assay are determined by UV-UPLC methods. The
methods applied here use UV absorption and elution time for identification by
comparison to a standard. To be able to measure all selected drugs within one
screen with the available instrument, chromatographic conditions needed to be
optimized using a maximum of 4 different mobile phases, while one of them
needed to be pure water and one an organic phase respectively. Another
parameter for optimization was time. For optimal separation of compounds a
longer chromatography with a less steep gradient is usually preferable, but would
increase the measurement time for the whole screen strongly since approximately
6000 injections were to be expected.

38
2.2 Results
2.2.1 Drug Selection
The aim of this drug selection was to get a diverse set of drugs for screening,
representing different medical indications and structural drug classes, while also
selecting the drugs that are causing microbiota-associated side effects. I focused
on host-targeted drugs, excluding antibiotics on purpose as those are studied in
bacterial context heavily already and in these cases drug-to-bacteria interactions
were deemed more likely than bacteria-to-drug interactions. An overview of the
drug selection procedure is shown in Figure 5a. In general, information about
drug side effects are taken from SIDER database (Kuhn et al. 2016), information
about drug pharmacology from DrugBank (Law et al. 2014).
Using the side effect database SIDER (Kuhn et al. 2010), I selected around 90
drugs with a directly gut microbiota related side effect (e.g. bloating, diarrhea) and
120 drugs with a more indirectly gut microbiota related side effect (e.g.
arteriosclerosis, weight gain). Furthermore, drugs without any gut related side
effects and drugs known to be metabolized by bacteria were added to the selection
as controls. From these compounds with a molecular weight higher than 500
Dalton were generally excluded to focus on small molecule drugs. I only selected
orally administered drugs as they have a higher chance of passing into the gut in
high concentrations compared to intravenously applied drugs. Furthermore,
drugs which are taken regularly to treat chronic diseases or in high dosage or have
a long half-life and poor bioavailability are also more likely to reach the gut.
Finally, an emphasis was put on drugs with high market revenue, thus increasing
the relevance of potential findings to a broader population.

39
Figure 5: Drug Selection workflow and result. a) Drug selection started with approximately 1000 annotated drugs from the SIDER side effect database (Kuhn et al. 2016), which were filtered for their gut related side effects. Drug selection was enriched from another database (Saad et al. 2012) for known or suspected interactions with the gut microbiome, before filtered for oral administration and manually curated for overall interest. Final selection was filtered for availability from vendors and establishment of UPLC methods. b) Pie chart classifying selected compounds by disease indication.
After this selection procedure 30 drugs were left, and for 18 of them a
chromatographic method with the same buffer system and internal standard could
be established. 3 of the final 18 drugs are drugs with known specific bacterial
interactions, which serve as positive and negative controls to recapitulate known
biological interactions. The selected drugs, the therapeutic indication and the
primary reason for selection (e.g. control) are shown in Table 2 and different
therapeutic indications covered are shown in Figure 5b.

Table 2: Drugs selected for the Bacteria-D
rug Interaction Screen.
Chembl ID
D
rug Indication
Acute/chronic Selection
pKa* Stock conc.
Solvent
CHEM
BL112 Acetam
inophen M
inor pain; Fever acute
Usage widely spread; high dosage
9.38 50 m
M
water
CHEM
BL1112 Aripiprazole
Psychosis; Depression
chronic W
eight fluctuations; top selling product 7.46
50 mM
D
MSO
CHEM
BL1751 D
igoxin Arrhythm
ia acute
Negative control; only depleted by E. lenta
4.43 50 m
M
DM
SO
CHEM
BL502 D
onepezil HCl
Alzheimer's disease
chronic Long half-life; gastrointestinal side effects
8.62 23 m
M
water
CHEM
BL1175 D
uloxetine HCl
Depression; Anxiety disorders
chronic W
eight gain; top selling product 9.7
100 mM
D
MSO
CHEM
BL1138 Ezetim
ibe Cholesterol reduction
chronic H
igh % fecal excretion; top selling product
9.7 10 m
M
DM
SO
CHEM
BL1454 Levam
isole HCl
Parasitic worm infections; tested
for cancer treatment
acute W
ithdrawn due to coagulation side effects; in
trial as colon cancer drug; bacterial metabolism
6.98 50 m
M
water
CHEM
BL841 Loperam
ide HCl
Diarrhea; IBD
both
Usage very com
mon
9.41 50 m
M
DM
SO
CHEM
BL137 M
etronidazole HCl
Antibiotic for anaerobic bacteria acute
Positive control: degradation and growth 3.09
50 mM
water
CHEM
BL787 M
ontelukast Na
Acute asthma; Seasonal allergies
chronic G
astrointestinal disturbances; chronic use 4.3
50 mM
D
MSO
CHEM
BL1790041 Ranitidine H
Cl Peptic ulcer
acute V
itamin B12 deficiency; bacterial m
etabolism
8.08 100 m
M
DM
SO
CHEM
BL193240 Roflum
ilast Asthm
a; COPD
chronic
Gastrointestinal side effects are dose lim
iting 8.74
10 mM
D
MSO
CHEM
BL121 Rosiglitazone
Diabetes
chronic W
ithdrawn due to increase in heart attacks 6.23
100 mM
D
MSO
CHEM
BL1496 Rosuvastatin Ca
Cholesterol reduction chronic
Mechanism
of action unclear; top selling 3.8
10 mM
D
MSO
CHEM
BL1064 Sim
vastatin Cholesterol reduction;
Hyperlipidaem
ia
chronic M
echanism of action of statins unclear; top
selling product
13.5 100 m
M
DM
SO
CHEM
BL421 Sulfasalazine
Rheumatoid Athritis; IBD
chronic
Positive control; metabolized by m
any bacteria 2.4
100 mM
D
MSO
CHEM
BL483 Tenofovir
Disoproxil Fum
arate
HIV
chronic
Flatulence; top selling product 2.07
10 mM
D
MSO
CHEM
BL1020 Tolm
etin Sodium
Rheumatoid Arthritis,
both M
ild coronary and gastrointestinal side effects 3.5
100 mM
water
*Sources of most basic pKa values are D
rugbank (Law et al. 2014), CHEM
BL (Bento et al. 2014), and Toxnet (Wexler 2001) databases.

41
Special emphasis has been put to select proper controls for the bacteria-drug
interaction screen to be able to estimate the biological relevance of screening
results and compare them to known biology. Metronidazole, sulfasalazine and
digoxin are drugs with known and well-described bacterial interaction
mechanisms. Metronidazole is an antibiotic against anaerobic bacteria, which
upon reduction of its nitro group by bacteria inhibits their growth by introducing
DNA double strand breaks. It serves as a control both for growth inhibition and
drug depletion. Sulfasalazine is an inflammation inhibitor used in the treatment of
ulcerative colitis. It is a prodrug, which becomes active upon cleavage of its
azobond by bacterial azoreductases, and thus serves as a control for bacterial drug
depletion without strong effects on their growth. As most bacteria possess
azoreductases a broad interaction with many bacteria in the screen is expected
(Mahmood et al. 2015). Digoxin has been shown to be metabolically modified
only by a specific strain of Eggerthella lenta (Haiser et al. 2013; Haiser et al. 2014).
Thus, it serves as a negative control with no expected interaction with other
bacteria than E. lenta and provides clues about the specificity of the screen. For
levamisole and ranitidine metabolic bacteria-drug interactions have been reported
previously as well (Shu et al. 1991; Basit & Lacey 2001), although mechanism and
specificity is less clear as for the dedicated controls metronidazole, sulfasalazine
and digoxin. This bacteria-drug interaction screen can aid in elucidating
specificity in their bacterial interactions and also show the impact of levamisole
and ranitidine on bacterial growth.
2.2.2 Bacteria-Drug Interaction Screen
The aim of the bacteria-drug interaction screen was to test if gut bacteria
deplete drugs in their growth medium and if this depletion is impacting the
growth of the respective bacteria. Drugs and respective controls had been selected
as described before (see results 2.2.1), and an UPLC readout after extraction had
been established for them (see methods 7.2.). Growth was monitored by OD578
readout, every 2 hours for the first 12h and then approximately every 8h until the
end of the 48h growth curves. The following describes in short the analysis and

42
results of the interaction screen. First I will describe results from investigating
bacterial drug depletion, and then I will describe the impact of the screened drugs
on the growth of bacteria.
Drug depletion in the bacteria-drug interaction screen
UPLC methods had been established to separate drugs from medium
compounds and estimate their concentration based on area under the curve. As
shown in Figure 6, double injections of the same sample have a high correlation
for each respective drug detection method. However, throughout the screen it
became apparent that between-sample variability can be high and is mostly
dependent on different LC columns. LC columns are susceptible to clogging up
and breakdown of their matrix, and need to be exchanged regularly otherwise the
LC method looses sensitivity. Peak shape and thus area under the curve of the
respective drug peak are highly dependent on the performance state of LC
column. Thus, comparing samples measured on different LC columns or even at
different measurement times on the same column is difficult.
A way to analyze data from the screen and compare results between different
LC columns or between samples measured on the same column but at different
usage stages is to focus on one biological replicate at a time, and then compare
results from different biological replicates. Samples from one biological replicate
of bacteria-drug interaction are on the same 96-well plate, which is measured in
one LC run, and thus samples from one biological replicate are measured on the
same LC column. Variability within one biological replicate is therefore minimal,
but comparatively high between different biological replicates. Thus, I decided to
calculate the depletion of bacteria-drug interaction in comparison to its respective
control from the same LC run.

43
Figure 6: Technical replicates of UPLC injections from bacteria-drug interaction screen. Dots represent double injections of drug control, containing no bacteria. Axes show area under curve of drug peak normalized by peak of internal standard caffeine from UPLC measurements. Throughout the screen different LC columns have been used, indicated by the different colors.
The density distribution of drug depletion in comparison to the replicate-
specific control (Figure 7) shows that the positive controls for degradation
metronidazole and sulfasalazine are depleted in most interactions. Furthermore,
the negative control digoxin is only depleted in its specific interaction with
Eggerthella lenta. Thus, the bacteria-drug interaction screen is recapitulating
expected results and might allow exploration of additional biologically relevant
interactions.
Similar to digoxin five other drugs like tolmetin or rosuvastatin have a very
small distribution centered on zero. Drugs with this kind of density distribution
show no bacterial depletion and might be considered inert in respect to gut
bacterial degradation. Acetaminophen and ezetimibe have a narrow distribution
around zero as well but show specific and relatively strong interactions with
Escherichia coli iAi1 or Clostridium as they form a separate distribution.
Acetaminophen is completely depleted, ezetimibe to 60%.

44
Interestingly, 8 of the 15 tested drugs show a shift of their density towards
depletion, indicating interactions with many bacteria. These interactions might be
relatively minor like in the case of ranitidine or montelukast or strong as in the
case of simvastatin. Duloxetine, aripiprazole and roflumilast show a depletion of
up to 50% in many cases but almost no example of an interaction that is stronger
than that. Levamisole on the other hand seems to have not only weak interactions
but also strong interactions with some bacteria, indicated by an additional density
around 80% depletion.
Figure 7: Density distribution of drug depletion in bacteria-drug interaction screen. Density distribution of drug depletion in comparison to bacteria-free control for each drug respectively. Ticks in the rug below indicate different replicates, colored by genus of the respective tested species. Background colors indicate positive (green) and negative (blue) drug controls for depletion. Dashed lines in each plot mark a 30% threshold for bacteria-drug interaction.
Some drugs show a high variability in their density distribution of depletion,
with a shift to the right indicating an increase of drug concentration in
comparison to the replicate-specific control. In most cases these seem to be non-
repetitive outliers, which might be cause by a failing column. But in some cases
like simvastatin, aripiprazole or roflumilast these can be indicative of a
problematic LC method and results from these interactions should be considered
with caution.

45
The density distribution of the negative control digoxin shows a biological or
screening variability of around ±30%. Within this cutoff no bacteria show an
interaction with digoxin except the expected interaction with E. lenta. Also other
drugs like tenofovir or ezetimibe vary this much, having their density distributed
mainly between 30% depletion and 30% increase. Thus, I decided to apply a
threshold of at least 30% depletion when comparing the different bacteria-drug
interactions between biological replicates. A study by Haiser et al. on digoxin
showed that a depletion of this degree could lead to implications in mammalian
drug efficacy, which gives additional support for this decision (Haiser et al. 2013).
If a bacteria-drug interaction showed at least 30% depletion in both biological
replicates, it was considered biologically interesting and is considered a drug
depletion hit in this gut bacteria-drug interaction screen. Two tables listing all the
specific interactions can be found in the appendix B. In summary, 55 novel
interactions were found encompassing 20 different bacterial strains and 11
different drugs. If interactions from simvastatin are excluded because of its poor
robustness in LC quality, these numbers change to 49 interactions encompassing
19 bacterial strains.
Growth effects in the bacteria-drug interaction screen
Growth curves were recorded using optical density of the bacterial cultures in
each well at a wavelength of 578nm as readout. To correct for noisy growth the
maximum OD reached within each growth curve was annotated and manually
curated. Noisy growth was often associated with an aggregation of bacteria and
can vary across different drug conditions for the same bacterium, but this was not
further quantified. After annotation, fold changes in comparison to the respective
solvent control were calculated for each bacteria-drug interaction (Student’s t test,
alpha < 0.05). The reproducibility of significant changes in bacterial growth is
high (Figure 8). Many changes are lethal or lead to a strong decrease in maximum
OD. However, a few drugs seem to induce better growth than in control
conditions.
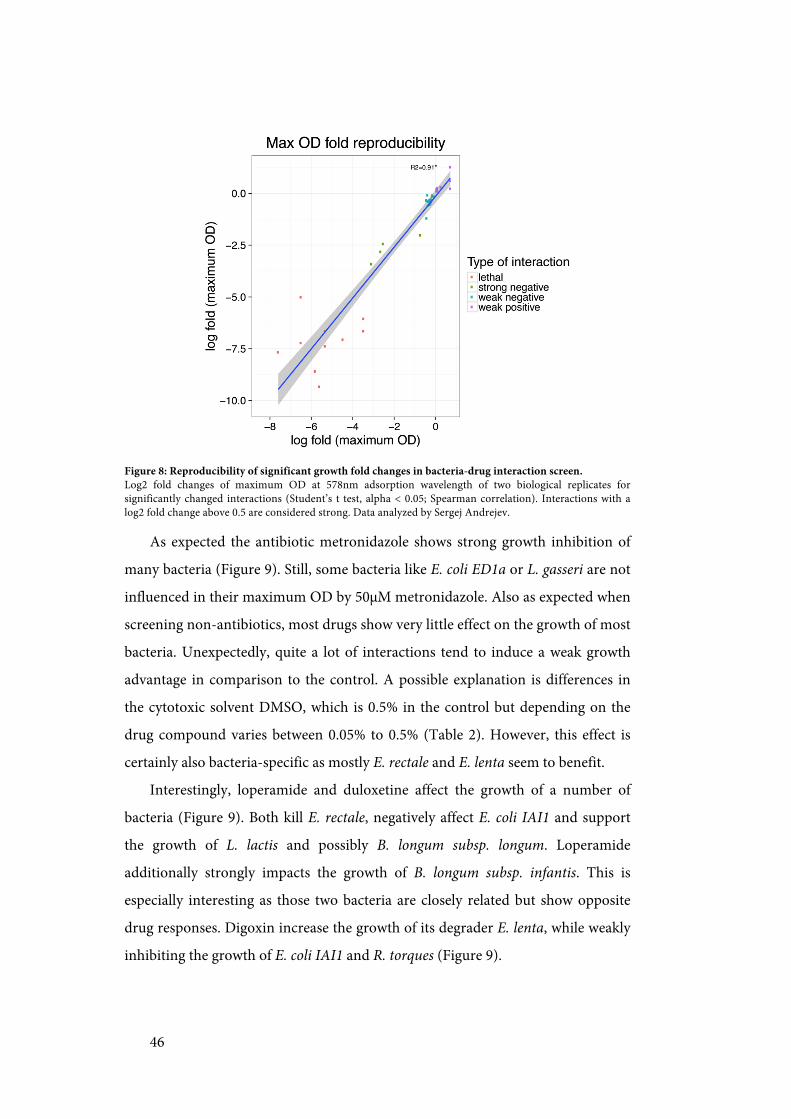
46
Figure 8: Reproducibility of significant growth fold changes in bacteria-drug interaction screen. Log2 fold changes of maximum OD at 578nm adsorption wavelength of two biological replicates for significantly changed interactions (Student’s t test, alpha < 0.05; Spearman correlation). Interactions with a log2 fold change above 0.5 are considered strong. Data analyzed by Sergej Andrejev.
As expected the antibiotic metronidazole shows strong growth inhibition of
many bacteria (Figure 9). Still, some bacteria like E. coli ED1a or L. gasseri are not
influenced in their maximum OD by 50µM metronidazole. Also as expected when
screening non-antibiotics, most drugs show very little effect on the growth of most
bacteria. Unexpectedly, quite a lot of interactions tend to induce a weak growth
advantage in comparison to the control. A possible explanation is differences in
the cytotoxic solvent DMSO, which is 0.5% in the control but depending on the
drug compound varies between 0.05% to 0.5% (Table 2). However, this effect is
certainly also bacteria-specific as mostly E. rectale and E. lenta seem to benefit.
Interestingly, loperamide and duloxetine affect the growth of a number of
bacteria (Figure 9). Both kill E. rectale, negatively affect E. coli IAI1 and support
the growth of L. lactis and possibly B. longum subsp. longum. Loperamide
additionally strongly impacts the growth of B. longum subsp. infantis. This is
especially interesting as those two bacteria are closely related but show opposite
drug responses. Digoxin increase the growth of its degrader E. lenta, while weakly
inhibiting the growth of E. coli IAI1 and R. torques (Figure 9).

47
Figure 9: Heatmap of growth effects in bacteria-drug interaction screen. Letters indicated significant changes (student’s t test, alpha < 0.05): L-lethal; N-strong negative; n-weak negative; p-weak positive. Interactions with a log2 fold change above 0.5 are considered strong. Clustering based on average linking. Data analyzed by Sergej Andrejev.
Some bacteria like R. torques and E. coli IAI1 are influenced by several drugs
(Figure 9). In the case of E. coli IAI1 the effects are not strong but because its
growth curves are very smooth, they are highly reproducible. Interestingly though
E. coli ED1a, a close relative with comparably smooth growth curves, is not
significantly influenced in its growth by any drug. R. torques grows slowly and has
a comparatively long lag phase. This might increase its sensitivity to drug
interactions. L. lactis shows significant growth promotion in response to two
different drugs, loperamide and levamisole, and is not negatively influenced by
other drugs.
In general, clustering of the growth profile reveals Bacteroides tend to have
more similar, common drug responses, while phyla like Firmicutes and
Actinobacteria are more diverse in their drug response (Figure 9). However,
phylogenetic clusters are not strong and even closely related species like E. coli
IAI1 and E. coli Ed1a or B. uniformis HM715 and B. uniformis HM716 do differ in
their drug response. Interestingly, the two Actinobacteria E. lenta and B. longum

48
infantis cluster closely and have growth profile distinct from all other bacteria in
the screen.
Summary
In summary, the gut bacteria-drug interaction screen revealed many potential
bacteria-drug interactions, showing that many bacteria potentially deplete drugs
from their growth medium as well as that some drugs can impact growth of
several bacteria. However, during the screening process it became apparent that
those interactions are highly sensitive to environmental conditions like differences
in medium composition and anaerobicity. Also technical difficulties around the
stability of UPLC measurements throughout screening increased the variability of
the screen and cast doubt on some results. Additionally, these results brought
about the question if the drug depletion is a metabolic degradation or
modification as in the case of sulfasalazine or digoxin, or rather a bioaccumulation
of the drug from the medium without any structural modification by the bacteria.
Thus, we decided to implement an assay to address this question and to confirm
and estimate the robustness of interactions found in the screen.
2.2.3 Depletion-mode assay
The depletion-mode assay was aimed to characterize the hits of the previous
bacteria-drug interaction screen to distinguish between bioaccumulation of the
drug and bacterial metabolic biotransformation. To reach this aim bacterial
cultures were extracted in two different ways: indirectly after removing bacteria by
centrifugation, and directly with all bacterial cells and extracellular proteins still
present. After extraction, drug concentration was measured by UPLC. For drug
depletion, 49 novel interactions were found in the screen encompassing 19
different bacteria and 10 different drug compounds. Of those I tested 28
interactions in the assay, encompassing all 10 drugs and 13 different bacteria
strains. As control also known metabolic interactions between bacteria and
sulfasalazine and the specific interaction between E. lenta and digoxin were tested.

49
All interactions were tested at least in triplicates, confirmed interactions often
repeated additionally.
For the controls all interactions could be confirmed in the depletion-mode
assay conditions. Controls showed depletion in indirect and direct extractions
(appendix B). 19 of the tested 28 novel interactions showed depletion in at least
the indirect extraction, meaning roughly 70% of the interactions from the
bacteria-drug interaction screen could be confirmed. For 11 interactions a
significant depletion (FDR controlled Student’s t-test, alpha < 0.05) was also
found in direct extractions. However, applying an additional threshold of at least
20% depletion leaves only 7 interactions with potentially metabolic modifications
of the drug compound. Four of these direct interactions are with levamisole, and
two with montelukast (Figure 10). While all interactions of levamisole are
potentially metabolic modifications, most other interactions of montelukast are
bioaccumulations. Only in its interaction with R. gnavus and B. longum subsp.
infantis montelukast was consistently confirmed to be depleted when directly
extracted. Levamisole is likely to be metabolically modified by all bacteria
depleting it, while montelukast is sequestered or modified depending on the
bacterium it interacts with.
The other mentioned direct interaction is donepezil and F. nucleatum. Two
additional interactions show a significant depletion only in the direct extraction,
but not in the indirect extraction. This is usually caused by an unusual high
variation in the indirect extraction, and the respective mean is still indicating
depletion (appendix B).

50
Figure 10: Examples of bacterial drug degradation from the depletion-mode assay. Boxplots show normalized values for each bacteria-drug interaction and different metabolite extraction methods. Plate: Extractions from bacteria-drug interaction screen; Indirect: Extractions of supernatant in depletion-mode assay; Direct: Extraction of whole bacterial culture in depletion-mode assay. AUC normalized by mean of respective controls from each batch or plate. Dashed line indicates mean of bacteria-free controls.
Ezetimibe showed very specific interactions in the bacteria-drug interaction
screen being only depleted by two bacteria: B. animalis subsp. lactis and C.
ramosum. Interestingly, the strong interaction with C. ramosum could not be
confirmed by the depletion-mode assay, the weaker interaction with B. animalis
subsp. lactis however shows a weak depletion in both assay extractions as well.
Duloxetine is another interesting case, as it shows eight interactions in the
interaction screen, of which five were tested in the depletion-mode assay: B.
uniformis, C. bolteae, C. comes, C. saccharolyticum and R. gnavus. Additionally, I
tested S. salivarius as it showed a strong tendency for depletion in one biological
replicate, and B. thetaiotaomicron as a negative control as it showed no depletion
in the screen (Figure 10). The depletion-mode assay confirmed all interactions but
made clear that most interactions of bacteria with duloxetine are
bioaccumulations, as most of the drug can be recovered after extracting the whole
bacteria culture. Curiously however, the in the bacteria-drug interaction screen
inert interaction between duloxetine and B. thetaiotaomicron is now positive, in

51
indirect and direct extractions. This happens similarly for the interaction of L.
gasseri and levamisole, which is also inert in the screen but shows depletion in a
direct extraction in the depletion-mode assay.
Thus, while roughly 70% of the interactions from the bacteria-interaction
screen could be confirmed with the depletion-mode assay and 35% of those are
likely biotransformations, it also became clear that the screen is not finding all
possible potential bacteria-drug interactions.
2.2.4 Summary: Bacteria-Drug interactions are specific
The bacteria-drug interaction screen and the following depletion-mode assay
showed that many bacteria could interact with human-targeted therapeutic drugs.
The results from both experiments are summarized in Figure 11. The screen
showed that 20 out of 25 tested bacteria deplete at least one drug compound in
their growth medium, and 11 out of 15 drug compounds are depleted by at least
one bacterium. From 375 tested bacteria-drug interactions 49 revealed a depletion
of a drug in the medium, and 22 an effect on the maximum growth capacity of
bacteria. The single tested Fusobacterium F. nucleatum accounts for 15% of the
found drug depletion interactions. Bacteroidetes phyla on the other hand accounts
for 24% of the interactions tested, but only for 16% of the depletion interactions
found. With the exception of E. coli IAI1, therapeutic drugs mainly affect the
growth of gram-positive bacteria.
Interestingly, only in six interactions the same drug, which is depleted from
the medium, affects also the growth of the respective bacterium. Digoxin is
promoting the growth of E. lenta, montelukast is promoting B. uniformis HM715
growth and duloxetine is inhibiting growth of C. saccharolyticum. All three drugs,
which are depleted by E. coli IAI1, are also inhibiting its growth. E. coli IAI1 is
relatively sensitive to both kinds of drug interaction, especially in comparison to
E. coli ED1a, which only depletes acetaminophen (Figure 11).

Figure 11: Bacteria-drug interactions. Bacteria-drug interactions found in the screen. D
rug bioaccumulation: at least 30%
depletion in both biological replicates. Growth effect: student’s t test, alpha<0.05, hit in both biological
replicates. Drug biotransform
ations found in depletion-mode assay indicated in black. Interactions from
bacteria-drug interaction screen only and are not corrected for non-hits from
depletion-mode assay as not all hits were tested. G
rowth data analyzed by Sergej Andrejev.

53
An unexpectedly divergent response when comparing drugs is the bacterial
response to simvastatin and rosuvastatin. Both drugs act similarly in humans, but
rosuvastatin interacts with no bacterium in any tested way, whereas simvastatin is
depleted by ten different bacteria and inhibits the growth of one. Contrasting this
finding both duloxetine and aripiprazole, which are both antidepressant drugs,
interact with a diverse set of bacteria having an impact both on depletion and
growth (Figure 11). Bacteria not interacting with any drug besides controls are B.
fragilis, B. longum subsp. longum and S. salivarius. The only drug not interacting
with any bacterium is tenofovir.
Besides single bacteria, I also tested two bacterial communities consisting of
five members each in the bacteria-drug interaction screen. One community
consisted of bacteria showing strong depletion of drugs in the first tested
biological replicate of the bacteria-drug interaction screen (Mix Depletion in
Figure 11), the other of bacteria showing little to no depletion (Mix NoDepletion
in Figure 11). Strikingly, a mix of bacteria not depleting drugs on their own
depletes ezetimibe in a community. Bacteria depleting duloxetine or ranitidine on
their own loose this ability in community. However, as community composition
cannot be interfered from growth alone this might also be caused by a loss of
specific depleting bacteria from the community.
2.3 Discussion and Outlook
The aim of the bacteria-drug interaction screen was to test if gut bacteria
deplete drugs in their growth medium and if this depletion is impacting the
growth of respective bacteria. Additionally, assaying the mode of depletion found
in the screen we wanted to address the question if the drug depletion is a
metabolic degradation or modification as in the case of sulfasalazine or digoxin, or
rather a sequestration or bioaccumulation of the drug from the medium without
any structural modification by the bacteria.

54
In summary, the results from the bacteria-drug interaction screen and the
depletion-mode assay show a broad potential of human gut bacteria to interact
with human-targeted drugs in a specific manner. Bacterial growth is affected in a
drug-species specific manner. Some drugs like loperamide and duloxetine affect a
broader bacteria spectrum, and act both as inhibitor and promoter of bacterial
growth depending on the bacterial species and strain. Bioaccumulation of drug
compounds from the medium might be a common feature of many bacteria-drug
interactions, and some drugs like duloxetine or montelukast show a strong
tendency to interact with bacteria in this manner. Interestingly, bacteria, which
deplete drug compounds from the medium, are usually not affected in their
growth by those compounds. Thus, this bacteria-drug interaction screen shows a
new dimension to microbiota interactions, which so far has often been
overlooked.
However, unfortunately the bacteria-drug interaction screen and also the
depletion-mode assay suffered from methodological difficulties comprised of LC
hypersensitivity and medium-batch dependent variation. To improve on this kind
of screen a growth medium less sensitive to batch-to-batch variations is
recommended as well as a LC detection method, which relies less on retention
time but more on the inherent features of each compound, like mass
spectrometry. Additionally, OD measurements should be performed at least every
hour if possible to improve sensitivity in growth curves comparison for the
already highly variably growth of natural isolates. This would also allow correcting
the strength of drug depletion for the amount of biomass in the culture. I will now
discuss specific interactions, which proved to be stable across most conditions, in
more detail and then give an outlook for further experiments.
For levamisole and ranitidine metabolic interactions with bacteria have been
shown before albeit the specific bacterial players remained unclear (Shu et al.
1991; Basit & Lacey 2001). Bacterial metabolism opens the thiazole-ring of
levamisole, and cleaves the N-oxide bond of ranitidine. Shu et al. suggest that
mainly Clostridiales and Bacteroides species are responsible for the levamisole
ring opening. Besides those species, the bacteria-drug interaction screen suggests

55
also Bifidobacteria and other Firmicutes like C. comes and L. gasseri can modify
levamisole. Basit and Lacey do not suggest specific bacteria for ranitidine
metabolism, but my screen suggests a diverse set of bacteria interact with it except
Bacteroides species. However, when replicated in the depletion-mode assay only
F. nucleatum truly degraded ranitidine, whereas for all other interactions it could
be recovered after extracting the whole culture. Thus, different to what the authors
suggest in their study, ranitidine metabolism might not be widely common but
relatively specific to some microbiota containing the low prevalent species F.
nucleatum (Li et al. 2014).
Montelukast is a leukotriene receptor antagonist used in the treatment of
asthma, with common side effects like diarrhea and inflammation of the
gastrointestinal tract. Glucuronidated metabolites of montelukast have been
found and it gets mainly eliminated via bile and thereafter feces. However, in rats
enterohepatic cycling has not been shown for montelukast (FDA 1997), although
colonic metabolites of drug detoxification are expected (Balani et al. 1997). In the
bacteria-drug interaction screen and following depletion-mode assay montelukast
is sequestered by many bacteria, biotransformed by R. gnavus and B. longum
subsp. infantis, and shows a weak growth promoting effect on B. uniformis
HM715. In a different screen testing for growth effects only, similar species were
affected (Lisa Maier (Typas group EMBL), personal communication). This
suggests that montelukast is selectively interacting with bacteria. If montelukast is
exposed to gut bacteria, its side effects might be caused by bacterial interactions.
Bacterial metabolites of montelukast might be toxic to enterocytes causing an
inflammation, or it has an effect on the bacterial community structure as a whole
leading to diarrhea. The only reported interaction of montelukast with bacteria so
far is an increase of bacterial growth in nasal cavity of mice treated with
montelukast (Khoury et al. 2006).
Three lipid-lowering agents were tested in the bacteria-drug interaction
screen: simvastatin and ezetimibe are commonly given together as standard
therapy against high cholesterol, rosuvastatin usually alone. As cardiovascular
diseases are highly prevalent in westernized cultures, with almost every fourth

56
person over the age of 40 in the USA using a statin drug (Gu et al. 2014). All
statins act as inhibitors of HMG-CoA reductase in the liver preventing production
of cholesterol, whereas ezetimibe likely binds NPC1L1 in gut and liver preventing
absorption of cholesterol into systemic cycling. Side effects of simvastatin and
ezetimibe are diarrhea and gastritis, whereas the only gut related side effect of
rosuvastatin is constipation. Interestingly, ezetimibe and simvastatin are strongly
depleted by gut bacteria, whereas rosuvastatin shows no interaction with any. For
simvastatin no information about drug modification was obtained. However, it is
a prodrug and roughly 60% of its original dose is excreted in feces, making
activation in the gut a likely explanation for its gastrointestinal side effects.
Colonic metabolism of simvastatin has been shown already (Aura et al. 2011).
Additionally, simvastatin and ezetimibe treatment does change relative abundance
of Lactobacillus species in the gut microbiota of mice (Catry et al. 2015). Thus,
especially simvastatin but also ezetimibe might have unfavorable impacts on the
microbiota whereas the synthetic statin rosuvastatin might be free of these effects
and thus a preferred treatment option for long-term treatment in cardiovascular
diseases.
Loperamide is a non-selective calcium blocker used as antidiarrheal
treatment. It is not strongly absorbed from the gut, and is thus mainly excreted
unmetabolized with the feces. A recent study showed that loperamide could
weaken the membrane of gram-negative pathogenic bacteria, but is not as
effective as an antibiotic adjuvant against gram-positive bacteria (Ejim et al. 2011).
However, in my bacteria-drug interaction screen besides E. coli IAI1 it mainly
affects the growth of gram-positive bacteria. Interestingly, duloxetine has a similar
growth effect profile as loperamide but in contrast is depleted by many bacteria. It
is classified as an inhibitor of sodium-dependent transporters. Thus, it is possible
that duloxetine has a similar destabilizing effect on the bacterial cell membrane
but caused by a different underlying mechanism than in loperamide.
To be specific, duloxetine is an antidepressant of the class selective serotonin-
norepinephrine reuptake inhibitor (Lantz et al. 2003). Another antipsychotic drug
in the screen is aripiprazole, a serotonin reuptake inhibitor with dopaminergic

57
effects acting on different enzymes than duloxetine (Burris et al. 2002). Both drugs
have side effects like weight fluctuations, constipation and diarrhea. Duloxetine is
heavily metabolized and mainly detoxified through the liver, but 20% of its
metabolites are excreted in feces. Aripiprazole is also detoxified hepaticly, but
around 18% of the original dose is excreted unchanged in feces. Both drugs show a
range of interactions in the bacteria-drug interaction screen and depletion-mode
assay, both affect bacterial growth, are depleted and possibly modified. Other
researchers found that aripiprazole and fluoxetine, a drug structurally very similar
to duloxetine, and also a number of other antidepressants could act as inhibitors
of intracellular bacterial pathogens (Czyż et al. 2014). Additionally, many
antidepressants have antimicrobial activity or enhance the action of antibiotics
(Munoz-Bellido et al. 2000; Kalaycı et al. 2015). These findings together suggest
that interactions between antidepressants and bacteria might be a robust
phenomenon. Interestingly, recent metagenomic deep sequencing studies showed
that use of antidepressants is associated with a change in microbiota composition
(Zhernakova et al. 2016; Falcony et al. 2016). Thus, the observed gastrointestinal
side effects of duloxetine and aripiprazole might be caused by bacterial
interactions in the gut. Recently, more evidence is accumulating that gut
microbiota and depression are linked with each other (Jiang et al. 2015; Foster &
McVey Neufeld 2013; Heijtz et al. 2011). Antidepressive medication might play a
role in this link, and so far few studies have investigated interactions between
medication, disease and the gut microbiota as a whole.
The findings from bacteria-drug interaction screen and depletion-mode assay
suggest that sequestration of drug compounds from the medium might be a
common feature of many bacteria-drug interactions, and for specific drugs this
bioaccumulation might lead to gastrointestinal side effects potentially caused by a
change in gut microbiota composition. Thus, further investigations into bacterial
drug and native metabolism and drug effects on bacterial communities could help
elucidate potential causes of drug side effects. In general, these findings show a
new dimension to microbiota interactions, which so far has often been
overlooked.

58
2.4 Clarification of contribution
I designed the bacteria-drug interaction screen in collaboration with Manuel
Banzhaf (Typas group, EMBL). Extractions of screening plates were conducted
together with Manuel, otherwise I conducted all experiments from the screen and
depletion-mode assay in this chapter. I setup the UPLC methods, and analyzed
and interpreted the resulting depletion data. Sergej Andrejev (Patil group, EMBL)
analyzed the growth curves. Melanie Tramontano (Patil group, EMB) and Lisa
Maier (Typas group, EMBL) provided a lot of feedback and discussions for data
interpretation and screen/assay optimization.

59
3 Duloxetine affects bacterial growth and
induces changes in bacterial communities
In this chapter I investigate the effects of one drug compound, the widely used antidepressant duloxetine, on a synthetic bacterial community. I first explain why I selected duloxetine and why I test in a synthetic community. After explaining the experimental set up, I describe the growth effects of duloxetine on bacteria grown in monoculture and then its effect on bacterial community composition. In the end, I discuss potential explanations derived from ecological principles for a change in bacterial community composition upon duloxetine exposure and suggest further possibilities for research.
3.1 Introduction
3.1.1 Why investigate bacterial interactions with duloxetine?
Results from the bacteria-drug interaction screen and depletion-mode assay
suggest that sequestration of drug compounds from the medium might be a
common and specific feature of many bacteria-drug interactions. Additionally, the
mixed bacteria communities tested in the screen suggest that bacteria might
behave different in community than in monocultures. To gain insights into how
drug bioaccumulation would impact at the level of a community, I decided to
focus on the specific example of duloxetine. Findings from my bacteria-drug
interaction screen and from literature suggest that interactions between
antidepressants and bacteria might be a robust phenomenon (Zhernakova et al.
2016; Czyż et al. 2014; Munoz-Bellido et al. 2000). Furthermore, the gut
microbiota plays an important role in the development of depression and other
mental diseases (Jiang et al. 2015; Foster & McVey Neufeld 2013). Antidepressive
medication might play a role in this link. Side effects of antidepressive medication
often include changes in the weight of patients (Dent et al. 2012), a morbidity

60
often associated with the microbiome as well (Musso et al. 2011). So far only few
studies have investigated interactions between medication, disease and the gut
microbiota as a whole for any disease, diabetes and metformin treatment being a
well researched exception (Forslund et al. 2015).
In the bacteria-drug interaction screen described in the previous chapter two
antidepressants, duloxetine and aripiprazole, were investigated, both showing
several interactions with gut bacteria. In the screen, the SSRI duloxetine is
sequestered by nine different bacterial strains, one of them likely transforming it,
and inhibits the growth of three strains, one of them also sequestering it (Figure
11). The partial dopamine agonist aripiprazole is sequestered by three different
strains, all of which also sequester duloxetine, and inhibits the growth of two other
strains (Figure 11). Preliminary experiments showed that duloxetine is also
sequestered when exposed to bacteria resting in PBS, but not by the spent medium
of bacteria usually sequestering duloxetine. Preliminary experiments with
aripiprazole showed that its interaction in many cases is sensitive to changing
environmental conditions like differences in oxygen or medium composition, and
additionally its LC method was instable. Thus, I decided to subsequently focus on
gut bacterial interactions with duloxetine. A detailed introduction to duloxetine is
given in the introduction chapter 1.6.1 on page 29.
3.1.2 Why investigate interactions in a synthetic community?
A natural bacterial community is usually complex and often not completely
defined. In case of the human gut microbiota the community can consist of up to
a thousand bacterial strains (Human Microbiome Project Consortium. 2012). This
complexity is hard to disentangle as specific members are hard to manipulate and
other community members can counterbalance specific bacterial interactions. In
an experiment the final read-out from a community is thus an integral of all
interactions taking place within the community. To address this challenge a
simplified synthetic community can guide the discovery of underlying principles
and inter-species dependencies. If communities are constructed with isolates from

61
a natural system, the evolved co-dependencies can often be preserved (Stadie et al.
2013; Ponomarova & Patil 2015).
One way to investigate bacterial community dynamics is in the context of
adaptive laboratory evolution (ALE). ALE can be as easily implemented with
communities as with single strains, and usually involves repeated transfers of
inoculum from a growing culture into fresh medium with the same or sequentially
stronger selective pressure. ALE is typically used to explore evolutionary dynamics
of single strains towards a specific or unspecific selective pressure (Lenski et al.
1991). It is a common tool especially in microbial synthetic bioengineering to
adapt a genetically modified organism like yeast or E. coli to a production
environment and to investigate the cause of those adaptions (Dragosits &
Mattanovich 2013). However, it is also increasingly used in basic science to
investigate co-dependencies in evolving communities. Especially structured
environments like biofilms with distinct evolutionary pressures can be well
investigated with this approach (Martin et al. 2016). A selective and distinct
evolutionary pressure like drug exposure should allow a fast adaption of the
community towards the pressure by selecting for less affected members or
members beneficial for the whole community. In a long-term experiment genetic
adaptions might additionally occur.
3.1.3 Aims and Experimental outline
To investigate whether duloxetine has an effect on bacterial communities, I
decided to assemble a synthetic community consisting of bacteria sequestering
duloxetine and bacteria being affected in their growth by duloxetine. These
communities were exposed to duloxetine and as control to its solvent DMSO
respectively (Figure 12). Every 48h, an inoculum of the evolved community was
transferred into fresh medium containing either duloxetine or DMSO. The
remaining bacterial community from each transfer was pelleted and subjected to
16s barcode sequencing to estimate the relative abundance of community
members. Additionally, the duloxetine concentration in the bacteria-free spent
medium was determined. Thus, the experiment allowed following the

62
establishment of a potentially stable community. From similar experiments within
our research group we expected a relatively stable community within five
transfers, whereas stochastic population bottleneck and founder effects seem to
dominate the first two transfers.
Figure 12: Community assembly assay outline. Two different communities were tested in a community assembly assay: a five-member bacterial community without B. uniformis and a six-member community with B. uniformis. Communities were inoculated with a total OD578 of 0.01 in GMM with or without duloxetine but respective solvent. An inoculum from the evolved culture was transferred every 48h to fresh media conditions. Each culture was 16s barcode sequenced and the duloxetine remaining in the medium was assessed.
I designed two different bacterial communities to not only assess the effect of
duloxetine on a community, but also to investigate if duloxetine bioaccumulation
can affect the community structure. Duloxetine bioaccumulation by community
members could potentially aid in the survival of bacterial species, which are
growth sensitive to duloxetine. One of the bacteria depleting duloxetine the
strongest was B. uniformis. It is highly prevalent and abundant in the gut
microbiome (Qin et al. 2010; Li et al. 2014) and has been associated with
improved metabolic functions of the microbiome (Gauffin Cano et al. 2012).
Thus, I designed a community with and without B. uniformis (Figure 12). Other
community members sequesetering duloxetine consisted of S. salivarius and B.
thetaiotaomicron, the latter is potentially additionally modifying duloxetine. As a
species inhibited in growth by duloxetine E. rectale was included in the
community. L. gasseri and R. torques, which so far had not shown any interactions
with duloxetine, were added to increase the likelihood that a community
consisting of more than one member species was formed. The species selection
represents the main phyla in the gut, Bacteroidetes and Firmicutes, and are
distinguishable by 16s barcode sequencing.

63
Duloxetine bioaccumulation and biotransformation by single species had
been assessed with the bacteria-drug interaction screen and depletion-mode assay
as described in the previous chapter. However, as techniques for growth readout
had improved in the lab and in the screen only one concentration of duloxetine
was assessed, I decided to also assess the growth sensitivity of synthetic
community members to duloxetine. A better characterization of bacterial
response to duloxetine can reveal more details about differences between bacterial
species and might allow an easier interpretation of results from the community
assembly assay.
3.2 Results
3.2.1 Growth effects of duloxetine
The aim of the duloxetine dilution growth curves was to estimate the
sensitivity of bacteria towards duloxetine, which were later used in the community
assembly assay. Sensitivity is recorded as concentration inhibiting 50% of the
effective growth (IC50). The strongest effect on growth by duloxetine was usually
seen around the inflection point of the exponential growth phase. To approximate
this point in each bacterial species, I first estimated the time point at which the
bacteria not exposed to duloxetine reached half the maximum OD. For this time
point I recorded the respective OD of all duloxetine exposed growth curves and
fitted a local regression from which I estimated the IC50 (Figure 13). B.
thetaiotaomicron, B. uniformis, L. gasseri and R. torques all have an IC50 around
100 µM for duloxetine. S. salivarius is more sensitive with an IC50 of 40 µM, and
E. rectale is the most duloxetine sensitive species with an IC50 around 30 µM.

64
Figure 13: IC50s for duloxetine. Dilution series of duloxetine in 1% DMSO. Underlying growth curves taken for 24h in GMM in triplicates. OD at half maximum OD time point of control used as effect response. Dashed line indicates 50% of half-maximum OD, to estimate corresponding inhibitory concentration (IC50). Curves are fitted with R function “loess”, span parameter equals 0.5.
Sensitivity to a drug is not always reflected only in a shift in exponential
growth but also in a prolonged lag phase or a reduced maximum OD (Figure 14).
The community assembly assay concentration is 50 µM duloxetine. At this
concentration only B. uniformis is not affected in its growth, all other bacteria
have growth deficiencies. As expected from the IC50, E. rectale is strongly delayed
in growth. Interestingly, it recovers half of the growth when reducing the
duloxetine concentration by just 20% to 40 µM. Even though B. thetaiotaomicron
has a much higher IC50, its growth rate is affected already at the lower duloxetine
concentration of 50 µM. Some bacteria besides being affected in lag or exponential
phase have a noisier growth with duloxetine than without, e.g. L. gasseri or R.
torques. This seemed to correspond to a stronger aggregation of bacteria in the
culture as observed by eye. However, this effect could not be quantified so far.

65
Figure 14: Growth curves with duloxetine. 24h growth curves in GMM with respective concentration of duloxetine with 1% DMSO as solvent. Curves fitted for triplicates with local regression using R’s loess function.
3.2.2 Bacterial community shifts induced by duloxetine
The aim of the community assembly assay was to investigate first whether
duloxetine has an effect on bacterial community composition, and second
whether bacteria sequestering duloxetine modify this effect. The presence of
duloxetine in the medium increases the community diversity in both bacterial
communities (Figure 15). Without duloxetine, two or three bacteria respectively
dominate the community from the second transfer on, whereas with duloxetine
four or five bacteria respectively coexist in the community. Interestingly, in both
communities E. rectale, the bacterium most sensitive to duloxetine, is relatively
abundant in the presence of duloxetine, whereas without duloxetine it is
superseded in most transfers. Also L. gasseri profits from the presence of
duloxetine, whereas R. torques is below detection limit in any bacterial
community.

66
Figure 15: Community composition of duloxetine assembly assay. Species abundance after transfer and 48h growth in bacterial community with and without duloxetine. Mean of relative abundance from triplicates after 16s DNA sequencing. a) Community of five bacteria, without strongly sequestering species B. uniformis. b) Community of six bacteria, with strongly sequestering species B. uniformis. DNA extraction and 16s library preparation by Melanie Tramontano (Patil group, EMBL). Analysis and visualization by Yongkyu Kim (Patil group, EMBL).
In general, the community without B. uniformis (Figure 15a) seems to be
more stable over time than the one with B. uniformis (Figure 15b). In bacterial
communities with B. uniformis, changes in relative composition can be observed
during all transfers whereas without it a relatively stable state seems to be reached
after the first transfer. Interestingly, in the community with B. uniformis not
exposed to duloxetine, E. rectale seems to regain community membership after
being depressed below detection limit in transfer 2 and 3 (Figure 15b). In the same
community exposed to duloxetine E. rectale is slowly diminishing in relative
abundance across all transfers. The opposite is true for B. uniformis. It slowly

67
diminishes in relative abundance without duloxetine, while gaining in the
community exposed to duloxetine.
Duloxetine is depleted in all transfers except for the first transfer of the
community without B. uniformis (Figure 16a). Duloxetine is always stronger
depleted in the community with B. uniformis than without it. This corresponds to
a higher fraction of duloxetine sequesetering bacteria (B. thetaiotaomicron, B.
uniformis, S. salivarius) in the community with B. uniformis than in the one
without it (Figure 16b).
Figure 16: Duloxetine depletion in community assembly assay. a) Duloxetine depletion (indirect extraction) at the end of each transfer of bacterial community. Dashed line indicates mean of control. b) Percentage of bacteria sequestering duloxetine in each transfer, as assessed with 16s DNA sequencing. All interactions tested in triplicates.
3.3 Summary and Discussion
The aim of these experiments was to investigate whether duloxetine and
duloxetine sequestering bacteria have an effect on bacterial community
composition and whether this effect could be explained by the effect duloxetine
has on bacteria grown in monocultures. It was found that duloxetine induced a
higher diversity within the tested bacterial synthetic communities. Unexpectedly,
E. rectale, the community member most sensitive to duloxetine, showed a stronger
survival in bacterial communities exposed to duloxetine. Additionally,
communities with duloxetine-sequester B. uniformis seem to be less stable over

68
transfers, potentially caused by E. rectale and B. uniformis competing with each
other.
A shift induced by xenobiotics has been observed before in host-mediated
communities (Cai et al. 2015; Catry et al. 2015; Davey et al. 2013) and as such a
shift in community composition upon duloxetine exposure was to be expected. A
change in bacterial community might be associated with side effects of duloxetine,
such as weight fluctuations (Bahra et al. 2015). Changes in gut microbiome have
also been implicated in development of depression and other mental diseases
(Sharon et al. 2016). As literature regarding this has been reviewed in the chapter
before and in the introduction to this chapter, I would like to focus in the
following on the ecological interpretation of the conducted experiments.
Ecological theory can give ideas as to the reason of the change in bacterial
community composition (for an review on ecological theory in microbiology see
Hibbing et al. 2010). The stress-gradient hypothesis suggests that competitive
interactions between species dominate in resource-rich environments
(competitive exclusion principle) whereas facilitative, complementary interactions
are often seen in stressful environments. Here, they enhance the realized niches of
species, which cannot persist in highly competitive environments, e.g. through
cross-feeding or motility (Maestre et al. 2009; Malkinson & Tielbörger 2010) For
bacteria this theory has been successfully tested in soil communities (Li et al.
2013).
All bacteria except possibly B. uniformis are stressed by duloxetine (Figure
14). Additionally, subinhibitory concentrations of xenobiotics have been shown to
change the metabolism or behavior of bacteria (de Freitas et al. 2016; Cecil et al.
2011). Thus, some of the community members might secrete additional nutrients
or change their metabolism or behavior otherwise, which reduces competition
and hence induces a better survival of E. rectale and L. gasseri. Additionally, E.
rectale recovers most from little changes in duloxetine concentration (Figure 14).
In both duloxetine treated communities duloxetine sequestering species are the
majority and twenty to thirty percent of duloxetine is sequestered from the
medium. Thus, E. rectale might recover the most from a disturbance of their

69
bacterial physiology by the presence of duloxetine-depleting bacteria and gain a
competitive advantage, but only in presence of duloxetine.
In structured environments like biofilms but also non-shaking lab cultures
differences in competition can be observed in comparison to free-living or well
mixed communities (Hibbing et al. 2010). Structured environments allow for
different niches to be formed, as gradients of nutrient and other supplies like
oxygen establish. Additionally, a common good trait like siderophore production
for iron scavenging or other excreted enzymes like proteases mainly benefits
closely related neighboring cells (Hibbing et al. 2010).
The experiment was set up as a non-shaken culture, furthermore duloxetine
potentially induces aggregation. A noisier growth with duloxetine than without
was observed for L. gasseri or R. torques in monocultures, and corresponded to a
stronger aggregation of bacteria in the culture as observed by eye. Thus,
aggregation and consequently escape from competition by occupying a new niche
might contribute to the survival of L. gasseri in the duloxetine treated samples. E.
rectale could be similarly affected, although the effect in monocultures is not as
pronounced as for L. gasseri. Bacteroides cultures in turn are well dispersed in
monoculture and duloxetine seems not to induce aggregation in these species.
Thus, they might not gain an advantage in niche specialization.
It has also been shown that bacteria do act very differently in community than
in monoculture (Chiu et al. 2014; Lawrence et al. 2012). Within a community a
shift in metabolic state and hence a shift in the member species’ sensitivity
towards duloxetine is conceivable. Therefore, a prediction of community
composition from monoculture growth data is not always possible.
To test some of the suggested hypothesis, new experiments should be
designed. The community assembly assay showed to be a suitable and
reproducibly robust tool to investigate bacterial communities. However, a five or
six member community might still be too large to disentangle the underlying
interactions. To test whether duloxetine and duloxetine sequestering bacteria have
an effect, a three-member community could be designed. One duloxetine sensitive
species, e.g. E. rectale, one sequestering species, e.g. B. uniformis, and one not

70
affected species e.g. B. vulgatus could be used to test duloxetine effects. Potentially,
B. uniformis can be substituted in a community with its not-sequestering strain B.
uniformis HM715. Besides using a smaller community, treatments in evolved
communities could be reverted after five transfers. A duloxetine-exposed evolved
community should revert to a state similar to non-exposed communities as soon
as the stress is removed. Additionally, evolved communities as a whole could be
tested for duloxetine sensitivity and thus show whether tolerance can evolve as a
community trait.
Another important aspect in the causes of a shift in community composition
is the shift in metabolic state of the affected bacteria. If we can show how affected
bacteria itself change and potentially how they change their respective
environment, we could start to understand how they impact a community. For
example, if duloxetine is blocking import of certain nutrients or induces excretion
of nutrients, this might explain why E. rectale unexpectedly gains a growth
advantage in community as to monoculture alone. Thus, another potential route
to be explored experimentally is investigation of the metabolic response towards
duloxetine exposure.
In conclusion, duloxetine induces a consistent change in microbial
communities. This change cannot be fully explained by the observed behavior of
bacterial species in monoculture. Duloxetine-sequestering bacteria potentially
additionally alter this change, as duloxetine bioaccumulation is stronger in
communities consisting of more duloxetine sequestering bacteria. However, as all
tested communities consist of duloxetine-sequestering bacteria before further
conclusions are made additional experiments should be undertaken.

71
3.4 Clarification of contribution
I planned and conducted the duloxetine dilution growth curves assay and the
community assembly assay. For the dilution curves I also did the computational
analysis and visualization. For the community assembly assay, I extracted DNA
from the bacteria pellets together with Melanie Tramontano (Patil group, EMBL),
subsequently Melanie prepared the 16S DNA library for sequencing in the EMBL
GeneCore facility. Yongkyu Kim (Patil group, EMBL) analyzed and partially
visualized the resulting data. I analyzed and visualized data from duloxetine
depletion.

73
4 Human gut bacteria change their native
metabolism upon duloxetine exposure
In this chapter I investigate the change in the extracellular metabolome of two bacteria exposed to duloxetine. I explain why and how I use untargeted metabolomics approaches, before describing the experimental set up consisting of an NMR and a mass spectrometry approach. In the result section I first describe the NMR experiment, give a short summary and explanation as to why I moved to a more sensitive mass spectrometry approach, and then describe the results from this approach in detail. In the end, I discuss different explanations for the upregulation of metabolic features from the purine pathway before concluding a likely oxidative stress response.
4.1 Introduction
4.1.1 Why investigate bacterial duloxetine metabolism?
Results from bacteria-drug interaction screen and depletion-mode assay
(Chapter 2) suggest that bioaccumulation of drug compounds from the medium
might be a common and specific feature of many bacteria-drug interactions. The
community assembly assay (Chapter 3) indicates that duloxetine does affect
bacteria in community and change their behavior resulting in differences in
composition. Bioaccumulation of duloxetine affects the bacterial community
additionally. Detailed reasons why I focused on the antidepressant duloxetine are
outlined in the introduction to the previous chapter. In short, gut bacterial
interactions with duloxetine, both for depletion and growth impairment, were
plenty and reproducible. In general, antidepressants are of great interest as
changes in gut microbiome composition have been associated with depression
(Jiang et al., 2015) and a study found changes in gut microbiome composition
associated with antidepressive treatment (Zhernakova et al., 2016). On top,

74
bioaccumulation can change the pharmacokinetics and efficacy of drugs (Niehues
& Hensel 2009; Pierantozzi et al. 2006). To study the molecular basis of bacteria-
duloxetine interactions, I focused on two bacteria, B. uniformis and C.
saccharolyticum. Because metabolites are the intermediates or end products of
multiple enzymatic reactions and therefore are the most informative proxies of the
biochemical activity of an organism, I focus first on the metabolic interaction
between bacteria and duloxetine (Alonso et al. 2015; Reaves & Rabinowitz 2011).
Investigating changes in the metabolic state of the bacteria upon drug exposure
can aid in generating hypothesis about the way duloxetine and bacteria interact.
4.1.2 How to investigate bacterial metabolism: Untargeted metabolomics
Untargeted metabolomics can be a great approach to explore a potential
uncharacterized interaction and generate hypotheses about its underlying
mechanism. In contrast to targeted approaches untargeted metabolomics avoids
the need for a prior specific hypothesis on a particular set of metabolites (Alonso
et al. 2015). In particular, untargeted metabolomics is a useful approach to
investigate microbial drug interactions and mammalian-bacterial co-metabolism
(Nichols et al. 2016). Many potential features can be reviewed at once and then
promising candidates can be characterized further by isolation and identification.
Untargeted metabolomics studies are characterized by the simultaneous
measurement of a large number of metabolites or potential metabolic features
from each sample. Therefore, there is a need to use high performance
bioinformatics tools (Booth et al. 2013). One of the most critical processes in
untargeted metabolomics studies is the identification of metabolites, which is a
prerequisite to relating the quantitative metabolomics data to its underlying
biochemical role (Alonso et al. 2015). Identification of metabolites is regularly
done by comparing the recorded spectra or masses to data found in public
libraries like KEGG (Kanehisa et al. 2012) or ECMDB (Guo et al. 2013).
Untargeted metabolomics is commonly implemented with NMR spectroscopy
or mass spectrometry (Alonso et al. 2015). NMR allows direct structural

75
elucidation of potential metabolites and their relative concentration, but is limited
in its sensitivity as well as by difficulties in working with complex
multicomponent mixtures. Advantages of NMR spectroscopy are that it is not
selective for any compound, all compounds are measured at once and amounts
estimated are truly relative to each other, which means intensities of different
peaks are comparable (Alonso et al. 2015). Mass spectrometry is a powerful
method as it is very sensitive and allows quantification of many small compounds
in the same run (Fuhrer & Zamboni 2015). However, identification of compounds
is harder than in NMR spectroscopy as only masses and their elution time from
LC can be measured and very little information about the chemical structure of
the compound can be assessed (Alonso et al. 2015). Thus, true identification of
compounds can only be achieved by comparison to standards. With an exact mass
it is possible to narrow down potential compounds to a few sum formulas, which
might correspond to only a handful of compounds. This is the reason mass
accuracy is an important factor in mass spectrometry (Fuhrer & Zamboni 2015).
Also exact relative quantification can be problematic, as different molecules have
different ionization efficiencies, thus also true quantification can only be achieved
in comparison to a standard (Alonso et al. 2015).
4.1.3 Experimental Outline and Aims
I first used an NMR spectroscopy approach to investigated potential drug
metabolites, which I later complemented with a more sensitive mass spectrometry
approach (Figure 17). The aims of all untargeted metabolomics approaches were
first to confirm bacterial drug depletion and thus to confirm the interaction of the
bacteria-drug pairs found in the interaction screen (see chapter 2), which had so
far only been assessed by a UPLC-UV method. Secondly, untargeted
metabolomics was used to aid in generating hypothesis about the way drug and
bacteria interact, based on an observable shift in the bacterial metabolome or on
the appearance of potential drug metabolites.
Besides a mix of bacteria for an NMR study, two bacteria were selected for
further in depth characterization of interaction with duloxetine. B. uniformis is

76
gram negative bacterium of the phylum Bacteroidetes with a high abundance and
prevalence across healthy human microbiomes (Li et al. 2014). In the bacteria-
drug interaction screen, it showed a strong sequestration of duloxetine but was
not affected in growth (Figure 11). C. saccharolyticum is a gram positive
bacterium of the phylum Firmicutes, the other phylum prevalent in the gut. It is
less abundant but as prevalent as B. uniformis in the microbiome of healthy
human individuals (Li et al. 2014). In the screen, C. saccharolyticum also strongly
depletes duloxetine from the medium, but different to B. uniformis it is affected in
its growth (Figure 11). The duloxetine IC50 values are 100 µM and 40 µM for B.
uniformis and C. saccharolyticum respectively (see Figure 13 for B. uniformis,
appendix C for C. saccharolyticum).
Figure 17: Outline of untargeted metabolomics experiments. Two methods for untargeted metabolomics are used to investigate bacterial interactions with duloxetine: NMR and mass spectrometry. The mix of depleting bacteria in the NMR experiment consisted of F. nucleatum, C. saccharolyticum, C. bolteae, C. ramosum, B. uniformis, B. longum subsp. longum. All incubation was anaerobic at 37°C. In all cases bacteria are removed by centrifugation from the sample and the remaining supernatant is extracted with a mixture of ACN:MethOH. Experiments for mass spectrometry were performed in triplicates.
All experiments were conducted on resting bacterial cells or lysates, after
washing the bacteria to remove extracellular metabolites and compounds from

77
growth medium (Figure 17). A drug-free bacteria control and a control containing
only the drug but no bacteria are essential for this type of experiment, to exclude
any potential confounders changing bacterial metabolism independent of the drug
response. All experiments also include an extraction step to remove proteins and
other debris and to concentrate low abundant metabolites. For more details please
refer to method sections 7.6 and 7.7 on page 143 and 144 respectively.
4.2 Untargeted metabolomics of duloxetine
interactions using 1H NMR spectroscopy
4.2.1 Experimental setup
For NMR spectroscopy I performed two different experiments: I tested the
depletion of duloxetine in a mixture of 6 bacteria (B. longum longum, B. uniformis,
C. bolteae, C. ramosum, C. saccharolyticum, F. nucleatum) potentially depleting it,
and I tested one specific interaction of duloxetine with B. uniformis. All
experiment were resting cell assays (see Methods 7.5.3), comparing bacteria
treated with duloxetine to bacteria not treated with duloxetine and a bacteria-free
control containing only duloxetine. The bacterial mix was tested with 1mM
duloxetine, the B. uniformis only samples with 100µM duloxetine. To record a
one-dimensional proton spectrum of the molecules of interest, all samples were
reconstituted in a mixture of 80% D2O and 20% deuterated acetonitrile with half
the original volume, thus doubling the concentration. 1D proton spectra for all
samples were then recorded on a 500 MHz Bruker DRX NMR spectroscope.
4.2.2 Results
For exploration of the samples we first recorded few scans which resulted in
less sensitive spectra. Comparing the duloxetine only spectra to spectra available
in literature, we confirmed which peaks are derived from duloxetine and ensured
the quality of the samples. In comparison to bacteria samples the duloxetine
spectrum is less noisy, and peaks can be clearly identified. We found that peaks

78
belonging to duloxetine are less intense in bacteria treated samples (Table 3). A
depletion of intensity of about 70% to 80% was observed on average in bacteria
treated samples for both the mix of bacteria and for B. uniformis alone. The
spectra were too noisy to look for newly appearing peaks, which might correspond
to drug metabolites, in bacteria samples treated with duloxetine in comparison to
non-treated bacteria. Table 3: Duloxetine depletion in NMR spectroscopy samples. Interference indicates duloxetine peaks, which partially interfered with peaks in bacteria only treated sample. Peak ppm Intensity Control Intensity Treated % Depletion Interference? B. uniformis 8.3926 66618879 12473273 81.28 7.9636 71192313 24288092 65.88 yes 7.6373 214566844 48974963 77.17 yes 7.4354 117082914 47424538 59.49 yes 7.2739 66015450 13959370 78.85 7.1646 81267273 33554120 58.71 yes 7.0418 58789654 13145173 77.64 6.1098 83133977 9079887 89.08 Bacteria Mix 8.6014 231244554 69008722 70.16 8.1448 260833964 80145756 69.27 7.845 546049193 139189689 74.51 7.7796 325619482 173526042 46.71 yes 7.6366 415219595 136583147 67.11 yes 7.4859 242977509 84612077 65.18 yes 7.3307 312083857 89942505 71.18 7.2576 239460962 68593682 71.35 6.273 376143332 92262036 75.47
Thus, after quality control we recorded many scans of the resonance spectra
to increase the signal-to-noise ratio and with this the sensitivity of the
measurement. These spectra show that none of the peaks in the bacteria treated
with duloxetine sample is new, as all peaks are already present either in the
bacteria control or the duloxetine only control (shown for B. uniformis in Figure
18). These hold true for the mix of bacteria as well as for the B. uniformis samples.
In conclusion, no potential drug metabolites were found with NMR spectrometry.

79
Figure 18: NMR spectra comparing B. uniformis treated with duloxetine to controls. Spectra are recorded with a 500 MHz Bruker DRX NMR. Duloxetine only sample is scaled for better visibility. Concentration of duloxetine during experimental exposure for 4h was 100µM, but samples are reconstituted with a mixture of 80% D2O and 20% deuterated acetonitrile in half the original volume doubling the effective concentration of metabolites for NMR study. Shapes in duloxetine treated B. uniformis samples indicate peaks originating from duloxetine (green diamond) or B. uniformis (red dot) respectively. NMR spectra recorded by Leo Nesme (Carlomagno group, EMBL).
4.2.3 Summary
There are two likely reasons a potential metabolite was not detected: either
NMR spectroscopy is not a suitable method in this case or there simply is no
metabolite produced in the interaction of duloxetine with bacteria. One NMR
specific reason why a potentially existing drug metabolite could not be detected is
sensitivity. A main challenge in these experiments was the low concentration of
drug and metabolites in the samples. For small molecule NMR spectrometry the
typical concentration ranges for structural elucidation start from 1mM. In this
experiment the concentration of duloxetine is around 2mM, and potential
metabolites can range from 1.6mM (80% of duloxetine is depleted), if there is
exactly one, to much lower concentrations. As we are operating on the lower end
of NMR detection, potential metabolites could be below our detection limit. While
it is possible to increase NMR sensitivity (signal-to-noise ratio) through recording

80
many scans of a spectrum, a limit is reached fast as signal-to-noise only doubles
each time the number of scans is squared. The time needed for recording each
spectra in figure was 16h, and since biological samples also degrade with time we
did not use a higher number of spectral scans. Another factor is that new peaks
from potential drug metabolites can be hidden behind peaks from other
molecules. As seen in Figure 18 the spectra from bacteria treated samples are
relatively noisy containing many different peaks, even though only the aromatic
range of peaks is shown. In shift ranges below 5ppm corresponding to single
molecular bonds, the spectra are often consisting of many overlapping double or
triple peaks, suggesting many different underlying compounds. Hence, I decided
to explore the metabolic space further using a more sensitive approach with
higher resolution of compounds: mass spectrometry.
4.3 Untargeted metabolomics of bacterial duloxetine
depletion using LC-MS/MS
4.3.1 Experimental setup
For the mass spectrometry approach I tested the interaction of duloxetine
with two bacteria, B. uniformis as before and C. saccharolyticum. Both interactions
were strong, reproducible and robust in tests before and had also show depletion
of duloxetine in lysate and resting cell assays (data not shown). I investigated the
small molecule metabolome of a lysate and an extracellular fraction. A lysate
exposes all bacterial enzymes at once to the drug and allows exploration of all
possible enzymatic interactions. New features in the drug treated sample are more
likely to be directly derived from duloxetine, and not to be a secondary effect of
bacteria secreting metabolites in response. In contrast, the extracellular fraction of
a resting cell assay explores the impact duloxetine can have on the whole bacterial
metabolome. The experiment was conducted as described in short as follows,
more details can be found in method section 7.7.

81
Bacteria were tested as lysate or resting cell assay in buffer and incubated for
30min (lysate) or 2h (intact cells) espectively. Then, debris/cells were removed by
centrifugation and metabolites were extracted in ice-cold 1:1 methanol:acetonitrile
containing 10µM Amitriptyline as a internal standard. Samples were vacuum
dried, and reconstituted in 20% acetonitrile containing 250µM caffeine. Lysates
were reconstituted in the same volume as extracted, whereas the extracellular
extractions were reconstituted in half the volume, effectively doubling the
concentration of metabolites. Samples were measured on a Q Exactive Plus-
Orbitrap Mass Spectrometer (Thermo Fisher) in positive mode using a Kinetex
C18 column for LC. Using the xcms R package from the Scripps Center for
Metabolomics (Mahieu et al. 2016), I performed feature selection, peak alignment
and retention time correction. Samples for lysate and extracellular fraction have
been processed independently. A strict univariate analysis taking the uncertainty
of the feature intensity into account followed.
4.3.2 Duloxetine is depleted in all conditions
As described before, untargeted metabolomics is sensitive to little variations
in the method, because it only observes features without having a standard run
side-by-side. Thus, internal standards from extraction and injection become more
important to judge the quality of the mass spectrometry data. The overall variance
of caffeine intensity, the internal standard for injection and run quality, is low
across both fractions (extracellular: coefficient of variation (CV) = 0.054; lysate:
CV=0.111) and variance was not biased to a treatment condition. The intensity of
internal standard for extraction amitriptyline has also a low CV in extracellular
fraction (CV=0.043) but in the lysate fraction it is slightly higher (CV=0.127). The
higher variance in amitriptyline was caused by a bias in extraction towards
samples containing lysed bacteria, hence I normalized the data set by the intensity
of amitriptyline rather then caffeine. After normalization, the intensities of
features from technical and biological replicates showed a high correlation with
each other (Figure 19) in lysate and extracellular extraction respectively.

82
Figure 19: Technical and biological replicates of untargeted metabolomics. Shown are log10 values for LC peak intensity of detected features normalized by LC peak intensity of internal standard amitriptyline (m/z 278.18). Technical replicates represent two different mass spectrometry injections of the same biological sample, biological replicates are replicated samples of the same tested condition. Only two biological replicates are shown here for reasons of brevity, but each condition has been tested in three biological replicates.
Duloxetine is depleted in all tested conditions, but strongest in the lysate of B.
uniformis (Figure 20). However, depletion was only roughly 20-30%, by far not as
strong as the depletion in the extracellular fraction in the NMR samples. This
might be explained by the shorter incubation times (2h MS samples, 4h NMR
samples). All treatment groups separate spatially into different cluster after
principle component analysis (Figure 21). The first two principle components
explain 38.8% and 45.8% of the observed variability for extracellular and lysate
fractions respectively. In the lysate, PC1 seems to separate the different bacteria
from each other whereas PC2 clearly separates the bacteria from the drug. In the

83
extracellular fraction, no clear dominating factor is obvious for separation along
PC1 axis, whereas PC2 seems to drive the separation of technical replicates. In all
cases, when looking at the weights of the components, not a few features drive
separation but many different features contribute (data not shown). This can
indicate a global difference in the small molecule metabolome, especially in the
case of extracellular extraction, as separation here is clearer than in the lysates.
Figure 20: Depletion of duloxetine in untargeted metabolomics. Lysates or whole cells were exposed to 1mM duloxetine, and after centrifugation to remove debris/cells soluble metabolites were extracted in MethOH/ACN. LC peak intensity of duloxetine (m/z 298.15) is normalized by LC peak intensity of internal standard amitriptyline (m/z 278.18) in respective duloxetine treated samples. Box plot represents mean and standard deviation of 3 biological replicates each injected twice.
Figure 21: PCA of mass features from untargeted metabolomics. In lysate extraction 5995 features were detected, in extracellular extractions 6270 features were detected in total. All feature intensities are normalized by amitriptyline and scaled to unit variance before analysis. Each biological replicate is injected twice, except in the case of biological replicates 1 and 2 from C. saccharolyticum lysates. Principle components 1 and 2 are shown, explaining 45.8% and 38.2% of total variance for lysate and extracellular extractions respectively.

84
4.3.3 Systemic investigation of changes in mass features
To explore this further, I compared the fold changes in the drug treated
bacteria to its controls. Figure 22 shows mass features significantly changed in
comparison to both controls (FDR: a<0.05; between treatment group CV>0.2;
within treatment group CV<0.2) and their respective fold change. At first
impression, as expected more changes occur in the extracellular fraction than in
the lysate fraction. Only metabolites that are directly derived from interaction
with duloxetine should significantly differ between drug-free and treated lysates.
That is additionally pronounced as more features are found in extracellular
samples (~6300) than in lysates (~6000), probably due to doubling of
concentration in the extracellular samples when reconstituted. In general in all
conditions, duloxetine has a high fold change in comparison to non-treated
bacteria, and a negative fold change in comparison to the drug control as it is
depleted. Other similarly behaving features might be related to the drug too, e.g.
ions of adducts or fragments of duloxetine or impurities in the drug solution.
A common aspect in both extracellular extractions is that many features have
a high fold change in comparison to duloxetine alone: those are likely bacteria
derived molecules as they tend to have a low fold change in comparison to the
bacteria control. This does not necessarily mean a difference in metabolite
secretion in response to duloxetine, as despite the normalization by an extraction
standard a higher amount of bacteria extracted in the treated sample could also
explain the fold change. In the case of B. uniformis this is a possible explanation
for the differences found. However, not most but only 1273 features out of 6279
total features showed a significant change in the duloxetine treated B. uniformis
samples in comparison to the bacteria only control, which makes a
methodological error unlikely (1218 out of 6279 for C. saccharolyticum).
Additionally, in the case of C. saccharolyticum it is unlikely to be a methodological
error, since many features are not only higher but also lower expressed than in the
bacteria only control. This indicates a strong change in the metabolite profile of C.
saccharolyticum and B. uniformis in response to duloxetine treatment.

85
Figure 22: Comparing fold changes of duloxetine treated bacteria to controls. Log 10 of significant (Student’s t-test, FDR < 0.05) fold changes between samples treated with duloxetine and the respective drug or bacteria control. Each dot represents a m/z feature, which is significantly differentially expressed in comparison to both controls. Features have been filtered for variation before testing: CV>0.2 between conditions, CV<0.2 within one condition. Uniqueness of features has been checked for features with For mass features with a fold change above 10 in comparison to both controls and in extracellular and lysate extraction respectively, features representing the same mass in both conditions are indicated in blue.
4.3.4 Feature annotation and pathway analysis
A main aim of the metabolomics approaches was to look for potential
duloxetine metabolites. Especially the experiments with lysates of bacteria were
aimed to look into any enzymatic interaction with duloxetine resulting in a
degradation product. Here, spectrometric features, which have the same fold
change in comparison to both controls, are especially interesting as this could
indicate that they are new features not observed in the controls. If the same
features are also appearing in the extracellular fraction, it could be an indication
for a potential duloxetine derived metabolite.

86
As shown in Figure 22 in B. uniformis lysates only one feature (674.461m/z;
1497s) is significantly and strongly upregulated (FC>10) in the duloxetine treated
lysates in comparison to untreated lysate or duloxetine alone. It can be found in
the extracellular extraction as well and is on the diagonal axis showing an equal
fold change to both controls. This mass features is annotated in METLIN (Smith
et al. 2005) as annonisin with acetonitrile adduct. However, it is likely to be an
artifact and not a duloxetine derived metabolite, as no adducts similarly
upregulated are found.
In C. saccharolyticum treated with duloxetine however, 26 features are
strongly upregulated (FC>10) and found in lysate and extracellular extraction
(Figure 22). In general, in C. saccharolyticum lysate many features are differently
expressed in comparison to B. uniformis lysate, which can hint to improper lysis
of bacteria resulting in an active metabolism with secondary effects of duloxetine
treatment. The applied lysis protocol is comparatively mild (1min bead beating in
PBS buffer), thus it is indeed possible that gram-positive C. saccharolyticum is not
as effectively lysed as the gram-negative B. uniformis. This means that features
found in C. saccharolyticum lysate are not directly derived from duloxetine, but
could be of secondary effect. When the 26 interesting features are matched against
METLIN database more than 18,000 potential metabolites are suggested, never
more than two mass features having the same suggested metabolite. If compared
to potential duloxetine metabolites of human detoxification metabolism described
in (Lantz et al. 2003), no mass is overlapping. Thus, the search space is either too
big or too small to result in a meaningful conclusion. Since an improper lysis
could not be excluded as a confounding factor, no further analysis of the potential
masses has been conducted.
To investigate what kind of metabolic pathways could be affected in the
bacteria by duloxetine treatment, I investigated the mass features significantly
changed in the extracellular fraction. I used PATHOS (Leader et al. 2011) to
annotate mass features, which are differentially expressed in comparison to both
controls, with metabolites from KEGG metabolic pathways. I annotated the
extracellular fraction, as those show the metabolic response and include secondary

87
effects of duloxetine on the whole metabolism. I allowed 12 different adducts to be
formed, and considered metabolites within a mass range of 5ppm. Results shown
here in Table 4 show mapping against E. coli pathways from the KEGG database.
In both cases roughly 14% of differentially expressed peaks could be annotated
with metabolite masses. Mass feature to metabolite is not a one-to-one
annotation, as many metabolites have the same mass e.g. sugars, and different
masses can match to one metabolite due to different adducts. Thus, disturbed
pathways are not ordered by their significance but rather by the number of unique
ions found for that pathway. Both bacteria share many of the affected pathways,
which seem to relate to amino acid and nucleotide metabolism, specifically to
purine nucleotide and cysteine/methionine metabolism.
I further analyzed the data by annotating the mass features with species-
specific metabolites. Data to do so was kindly provided by Daniel Sevin
(Cellzome). He generated lists of species-specific metabolites by building genome-
scale models for all organisms available in KEGG, and predicting their potential
metabolome from the model. Unfortunately, B. uniformis is not available in
KEGG, so instead I used the metabolome of its close relative B. thetaiotaomicron.
For adduct-formation I used a stricter cutoff as with PATHOS, only allowing H+
and ACN+H+ adducts to be formed to annotate a mass with its potential
metabolite. I used a mass accuracy of +/- 5ppm.

88
Table 4: KEGG Pathways enriched in significantly changed mass features. Ordered by unique ions found as part of the pathway. Purine metabolism pathway included for B. uniformis because of high number of unique masses found.
KEGG Pathway Name
Mtbls found in Pathway
Total Mtbls in Pathway
Unique Masses found
Unique Ions found
p-value hypergeo. test
B. uniformis 123/900 masses annotated Purine metabolism 10 90 8 15 0.15 Cysteine and methionine metabolism 12 54 12 14 6.3^10-4 Methane metabolism 12 60 10 12 1.7^10-3 Phenylalanine, tyrosine + tryptophan biosynt. 10 31 10 11 4.3^10-5 Glycine, serine and threonine metabolism 10 45 9 11 1^10-3 Arginine and proline metabolism 14 67 10 10 0.031 Histidine metabolism 9 44 8 9 4^10-3 Glyoxylate and dicarboxylate metabolism 9 55 8 9 0.02 Aminoacyl-tRNA biosynthesis 8 24 7 9 1.4^10-4 Ascorbate and aldarate metabolism 13 45 7 7 1.8^10-5 Tyrosine metabolism 10 75 7 7 0.06 Phenylalanine metabolism 13 64 6 6 1^10-3 Pentose and glucuronate interconversions 12 50 6 6 2.8^10-4 C5-Branched dibasic acid metabolism 13 32 5 5 1.6^10-7 C. saccharolyticum 116/804 masses annotated Methane metabolism 15 60 13 16 1.6^10-5 Purine metabolism 13 90 12 14 0.013 Ascorbate and aldarate metabolism 17 45 10 13 4.2^10-9 Cysteine and methionine metabolism 11 54 11 12 1.3^10-3 Pentose and glucuronate interconversions 15 50 9 12 1.2^10-6 Arginine and proline metabolism 14 67 10 10 2.5^10-4 Amino- and nucleotide sugar metabolism 18 77 7 10 6.8^10-6 Tyrosine metabolism 13 75 9 9 2.6^10-3 Glyoxylate and dicarboxylate metabolism 11 55 9 9 1.5^10-3 Galactose metabolism 13 41 7 9 2.7^10-6 Pentose phosphate pathway 13 34 6 9 1.9^10-7 Porphyrin and chlorophyll metabolism 9 93 8 8 0.23 C5-Branched dibasic acid metabolism 15 32 7 7 6.7^10-10 Naphthalene and anthracene degradation 9 60 7 7 0.025 Alanine, aspartate and glutamate metabolism 8 25 7 7 1.3^10-3 1,4-Dichlorobenzene degradation 9 74 5 5 0.08 Italic letters indicate pathways not shared between B. uniformis and C. saccharolyticum
For B. uniformis 38 out of 900 unique mass features were annotated with 75
potential metabolites out of 686 possible metabolites. For C. saccharolyticum 42
out of 804 unique mass features were annotated with 93 potential metabolites out
of 775 possible metabolites. A pathway enrichment analysis was not performed as
many pathways were insufficiently covered by the species-specific dataset already.

89
The top ten significantly changed mass features with their respective potential
metabolites can be found in Table 5. Sugars with the same sum formula have been
summarized within one descriptive term.
Table 5: Species-specific annotations of top 10 changed mass features.
Mass feature Name Sum formula FC bacteria (log10)
B. uniformis 252.1090 Deoxyadenosine C10H13N5O3 3.018 268.1035 Adenosine C10H13N5O4 2.973 268.1035 Deoxyguanosine C10H13N5O4 2.973 284.0989 Guanosine C10H13N5O5 2.515 230.1858 7,8-Diaminononanoate C9H20N2O2 2.348 182.0808 L-Tyrosine C9H11NO3 2.327 298.0969 5'-Methylthioadenosine C11H15N5O3S 2.204 270.1088 Deoxyuridine C9H12N2O5 1.630 134.0446 L-Aspartate C4H7NO4 1.627 244.0928 Cytidine C9H13N3O5 1.620 384.1492 Disaccharides C12H22O11 1.445 384.1492 b-D-Mannosyl-1,4-N-acetyl-D-glucosamine C14H25NO11 1.445 C. saccharolyticum 269.0881 Inosine C10H12N4O5 3.099 284.0989 Guanosine C10H13N5O5 2.884 261.0366 Hexose monosaccharide phosphates C6H13O9P 2.750 244.0928 Cytidine C9H13N3O5 2.576 112.0507 Cytosine C4H5N3O 2.251 231.0259 Pentose monosaccharide phosphates C5H11O8P 2.198 296.0646 Aminoimidazole ribotide C8H14N3O7P 1.984 74.06074 Aminoacetone C3H7NO 1.851 291.0470 Glycero-manno-Heptose 7-phosphates C7H15O10P 1.786 291.0470 Sedoheptulose 7-phosphate C7H15O10P 1.786 220.0811 O-Succinyl-L-homoserine C8H13NO6 1.531 220.0811 2,4,6/3,5-Pentahydroxycyclohexanone C6H10O6 1.531 220.0811 2-Deoxy-5-keto-D-gluconic acid C6H10O6 1.531 220.0811 1-Keto-D-chiro-inositol C6H10O6 1.531 220.0811 5-Deoxy-D-glucuronate C6H10O6 1.531 220.0811 2-Dehydro-3-deoxy-D-gluconate C6H10O6 1.531 220.0813 3-Keto-beta-D-galactose C6H10O6 1.531
In congruency with the pathway analysis in both bacteria the purine
(deoxy)ribonucleosides are strongly upregulated upon duloxetine treatment, but
also the pyrimidine nucleoside cytidine is upregulated in both cases. Other
nucleosides like deoxyuridine or inosine are also upregulated in one of the

90
bacteria respectively. While in B. unifomis unphosphorylated disaccharides are
strongly upregulated, the sugars upreglated in C. saccharolyticum are
phosphorylated pentose and hexose monosaccharides. B. uniformis has indeed a
strong expression of amino acids tyrosine and aspartate upon duloxetine
treatment, in C. saccharolyticum however no amino acid is within the top ten most
changed metabolites. Amino acids and sugars are main members of the KEGG
pathway “Methane metabolism” which are found enriched. It is noteworthy that
in the complete list of significantly changed, annotated metabolites of B. uniformis
and C. saccharolyticum a part of the Metacyc polyamine biosynthesis 1 pathway is
found: agmatine ! putrescine ! spermidine/5’-methyl-thioadenosine (Caspi et
al. 2016). In C. saccharolyticum aminoimidazole ribotide, a metabolite upstream
of purine synthesis and unique to this pathway is also upregulated.
4.4 Summary and Discussion
One aim of the presented experiments was to confirm bacterial duloxetine
depletion and thus to confirm the interaction of the bacteria-duloxetine pairs
found in the interaction screen with a method complementary to UPLC-UV
detection. All tested interactions showed depletion of duloxetine, both in NMR
spectroscopy and mass spectrometry. However, depletion was not consistent
across different samples. A strong depletion of 80% was observed in B. uniformis
resting cell samples for NMR, and less strong in samples for mass spectrometry.
As mentioned before this might be due to different incubation periods (NMR: 4h,
MS: 2h) or simply due to differences in the amount of bacteria as samples were
not normalized before duloxetine treatment. B. uniformis seems to be slightly
more effective in duloxetine depletion, both in resting cell and lysate assay, but B.
uniformis cultures often grow more dense than C. saccharolyticum cultures. As
results from the depletion-mode assay (Figure 10) suggest that duloxetine
depletion is likely not metabolic biotransformation, a difference in number of
bacteria can account for a difference in depletion if a similar strength of
duloxetine accumulation is assumed for both species.

91
Another aim of untargeted metabolomics was to aid in finding hypothesis
about the way drug and bacteria interact, based on the appearance of potential
drug metabolites or on an observable shift in the bacterial metabolome. In NMR
spectroscopy, no new spectral peaks could be observed in B. uniformis samples,
thus suggesting not one or two duloxetine metabolites but either no direct
duloxetine metabolite or many with a concentration below the detection limit of
NMR spectroscopy. In the mass spectrometry approach only one mass feature was
differentially changed in B. uniformis lysates. In C. saccharolyticum samples 28
mass features are changed but are likely not directly derived from duloxetine, but
of secondary effect, as improper lysis could not be excluded as confounding factor.
Taking into account that also the depletion-mode assay (Figure 10) does suggest a
binding without modification of duloxetine rather than a metabolic
biotransformation, it is very unlikely that duloxetine is metabolically modified by
B. uniformis or C. saccharolyticum.
Instead the data from mass spectrometry suggests a global difference in the
extracellular small molecule metabolome of bacteria treated with duloxetine. The
first two principle components separate treated bacteria well from their controls
despite capturing less than 40% of the variability. Extracellular fold changes show
strong differences in many features indicating a strong change in the metabolite
profile of C. saccharolyticum and B. uniformis in response to duloxetine treatment.
Mass feature annotation and pathway enrichment show that both bacteria share
many of the affected pathways. Metabolic pathways seem to relate to amino acid
and nucleotide metabolism, specifically to purine nucleotide and
cysteine/methionine metabolism. A look on the species-specific annotated
metabolites confirms nucleosides and sugars are strongly upregulated in both
bacteria (Table 5). While in B. uniformis maybe part of polyamine biosynthesis is
stronger affected, C. saccharolyticum seems to be clearly affected in its purine
metabolism or synthesis.
One question, which directly arises when doing this kind of untargeted
metabolomics studies, is if we just capture the most abundant metabolites in the

92
cell. Recently a study by Bennett et al. (2009) measured the absolute
concentrations of around 100 common metabolites in whole-cell extracts of
glucose-fed E. coli. The most abundant metabolites with a concentration of above
15mM are glutamate, glutathione and fructose-1,6-bisphosphate, followed by
ATP, UDP-N-acetyl-glucosamine and hexose phosphates (Bennett et al. 2009).
The latter two can be found upregulated in C. saccharolyticum. However, in
extracellular extractions of E. coli hexose and pentose phosphates range around
200nM (Moses & Sharp 1972). The least abundant metabolites with a
concentration below 200nM were adenosine, deoxyguanosine, adenine, guanosine
and NADP+ (Bennett et al. 2009). All of these nucleosides except NADP+ are
strongly upregulated in both bacteria in my experiment. Thus, I do not observe an
experimental artifact but more likely a real impact of duloxetine on the purine
metabolism of the two bacteria.
Duloxetine might act similar to an antibiotic as other antidepressant show
antimicrobial effects, stressing or weakening the bacterial cell wall, hence the
strong upregulation of extracellular compounds (Munoz-Bellido et al. 2000;
Kalaycı et al. 2015). In the bacteria-drug interaction screen a slight growth defect
is observed in C. saccharolyticum, but not B. uniformis. However, other bacteria
like E. rectale are strongly affected in their growth (Figure 13, page 64). Upon
administration of cell wall targeting antibiotics like ampicillin E. coli
downregulates intracellular nucleotide levels (Belenky et al. 2015). Other
antibiotics which interact with DNA or bacterial ribosome have the same effect
(Belenky et al. 2015). Hoerr et al. (2016) looked into the extracellular stress
response of E. coli respectively, and found an upregulation of thymine and alanine
in response to cephalexin, and putrescine, 2-oxogluterate, 2-phenylproprionate
and 3-hydroxyisovalerate in response to ampicillin. Of those metabolites, I only
found putrescine to be upregulated in my study. Duloxetine is likely not inducing
a bacterial cell wall stress response and an increase in extracellular metabolite
levels is not due to a leaky cell wall.
A different stress the bacteria could experience is oxidative stress upon
addition of duloxetine. A study recently characterized the H2O2 stress response in

93
anaerobically grown E. coli using transcriptomics and found similar pathways
affected, e.g. KEGG purine metabolism, alanine, aspartate and glutamate
metabolism, amino sugar and nucleotide sugar metabolism pathways (Kang et al.
2013). In particular, putrescine metabolism seems to be transcriptionally
upregulated and purine metabolism transcriptionally downregulated upon
oxidative stress. If mainly the catabolism is affected, an accumulation and
consequently secretion of purines could be the consequence. Those pathways and
pattern fit best to C. saccharolyticum, as only one of the mentioned pathways is
affected in B. uniformis. Interestingly, pentose phosphate pathway, which is also
affected in C. sacchaolyticum, feeds metabolites directly into purine pathway.
Disruption of the pentose phosphate pathway has been shown to increase
oxidative stress as it provides NADPH for ROS decomposition (Wang et al. 2014).
B. uniformis might be less affected by duloxetine because it is a gram-negative
bacterium and its additional cell membrane prevents duloxetine from entering the
cell. However, its oxidative stress response consisting of upregulation of
putrescine and spermidine seems to be active as well (Tkachenko et al. 2012).
However, it should also be noted that oxidative stress response is linked to
starvation in bacteria and bacterial cells in this assay have been kept in nutrient-
less buffer for 2h (Nguyen et al. 2011).
On an interesting side note, it can be speculated that many of the drug related
mass features changed in the lysates are due to autodegradation of duloxetine.
Pure duloxetine is known to have a strong autodegradation in aqueous solutions
(Sinha et al. 2009). Thus, some of the effects of duloxetine on bacteria might not
be direct effects of duloxetine but of its auto-metabolites as well.
In conclusion, these untargeted metabolomics data from NMR spectroscopy
and mass spectrometry suggest a global change in the metabolome of the tested
bacteria rather than a specific metabolic degradation of duloxetine. Duloxetine
might act as an inhibitor of a protein involved in purine nucleoside synthesis or
metabolism or induce a regulation of this pathway in another way. A changed
metabolic state of key bacteria in the microbiome might lead to a distinct change
of the microbiota composition. A change in microbiota composition is associated

94
with disease development: e.g. weight gain and metabolic syndrome but also
psychiatric diseases like depression or autism (Heijtz et al. 2011; Foster & McVey
Neufeld 2013; Jiang et al. 2015; Davey et al. 2013). The microbiome might thus
contribute to some of the side effects of duloxetine treatment because it is
influencing the gut-brain axis in an unfavorable way.
4.5 Clarification of contribution
I designed and conducted all experiments in this chapter. Samples for NMR
were measured, analyzed and interpreted in collaboration with Leo Nesme
(Carlomagno group, EMBL) and Bernd Simon (NMR core facility, EMBL).
Samples for mass spectrometry were measured in the metabolomics core facility at
EMBL, the MS method was setup in collaboration with Prasad Phapale (MCF,
EMBL). I analyzed and interpreted the mass spectrometry data alone. Daniel Sevin
(Cellzome) kindly shared data for additional feature annotation and KEGG
pathway analysis.

95
5 Duloxetine binds to a NADH:quinone dehydrogenase and purine pathway members
In this chapter I investigate the bacterial protein targets of duloxetine in C. saccharolyticum using click-chemistry based methods and proteomics. I will first explain why I want to investigate the underlying mechanism of bacterial duloxetine interaction and then present the experimental outline consisting of an exploratory proteomics approach, and subsequently overexpression of candidate proteins. After presenting results from the proteomics experiments and exploratory statistical analysis, I will present duloxetine-depletion results from homo- and heterologous overexpression of duloxetine-binding protein candidates. In the end I will discuss limitations of the selected approach and suggest two molecular mechanisms for duloxetine’s impact on bacterial metabolism.
5.1 Introduction
5.1.1 Why investigate protein interactions of duloxetine?
Results from the bacteria-drug interaction screen and the depletion-mode
assay (Chapter 2) suggest that bioaccumulation of drug compounds from the
medium might be a common and specific feature of many bacteria-drug
interactions. Detailed reasons why I focused on the antidepressant duloxetine are
outlined in the introduction to the previous chapters (section 3.1.1 and 4.1.1). In
short, gut bacterial interactions with duloxetine, both for bioaccumulation and
growth impairment, were plenty and reproducible. In general, antidepressants are
of great interest as changes in gut microbiome composition have been associated
with depression (Jiang et al. 2015) and a study found changes in gut microbiome
composition associated with antidepressive treatment (Zhernakova et al. 2016).
On top, bioaccumulation can change the pharmacokinetics and efficacy of drugs
(Niehues & Hensel 2009). The metabolomics study described in the preceding

96
chapter suggests that duloxetine is not biotransformed by B. uniformis or C.
saccharolyticum, but instead changes their native metabolism, likely affecting
purine metabolism.
Untargeted metabolomics as applied in the previous chapter can only be one
pillar where upon we should base a hypothesis about bacteria-duloxetine
interaction. Metabolomics can give clues about the consequences of a disturbance
on the whole metabolism of an organism, and potentially pinpoint the most
affected metabolic pathway. However, it cannot directly point at the underlying
molecular mechanism as extensive regulation and redundancies in the metabolic
network often obscure the primary cause of the disturbance (Reaves & Rabinowitz
2011). Instead, the proteome is the layer of functionality a small molecule
compound is usually acting on and how it is able to perturb the underlying system
of regulations and functions (Szklarczyk et al. 2016). Thus, we searched for direct
targets of duloxetine using a click chemistry-enabled protein pull-down and
proteomics. I focused on C. saccharolyticum as it, in addition to sequestering
duloxetine, is negatively affected in its growth upon duloxetine exposure (Figure
11 on page 52). Additionally, it is better described in KEGG and other databases,
which allows for better validation of findings, and proteomics results can be
complemented by the previous investigation on how duloxetine affects its
metabolome.
5.1.2 Aims and Experimental Outline
The first step of exploring duloxetine interactions mechanistically on a
protein level was to enrich for proteins that bind to it. This was implemented by
employing click chemistry-based reactions to bind duloxetine to immobile beads
and then pulling down binding proteins from a C. saccharolyticum lysate. The
proteins were identified using mass spectrometry. After exploratory statistical
analysis of the enriched proteins, I selected candidate proteins, which were
overexpressed in E. coli and subsequently their ability to sequester duloxetine
from the growth medium was assessed. I overexpressed 31 E. coli homologues and
heterologously four C. saccharolyticum proteins. Homologous overexpression

97
mutants were readily available from a mutant library, whereas heterologous
overexpression plasmids had to be newly designed. The aims of these experiments
were to find potential duloxetine interacting proteins, reinforce the evidence for
interaction by overexpression and accompanying functional assessment of
duloxetine sequestration to consequently suggest a potential mechanism for how
duloxetine interacts with C. saccharolyticum and potentially other gut bacteria.
5.1.3 Pull-down and proteomics of duloxetine binding proteins
Investigating protein-drug interactions is highly facilitated if one of the
interaction partners can be bound to a surface and thus the other one can be
locally enriched. This enables pull-down assays, metabolite enrichment and many
other forms of protein-ligand elucidation techniques. Click chemistry is an easy
way for combining two compounds of interest if they contain an alkyne or an
azide group. In collaboration with Schultz group (EMBL), we decided to introduce
an alkyne group at the methyl group of duloxetine (Figure 23). After synthesis and
clean up, the functionalized duloxetine allowed us to implement a pull down of
duloxetine interacting proteins from a C. saccharolyticum lysate.
Figure 23: Alkynated duloxetine.
Duloxetine tagged with an alkyne containing group (highlighted in yellow) to enable click reactions. Synthesis
by Felix Hövelmann (Schultz group, EMBL).
Felix Hövelmann (Schultz group, EMBL) synthesized the functionalized
duloxetine and linked it to desthiobiotin. The molecule was consequently
captured on a streptavidin beads to enable a pull down of binding proteins.
Bacterial lysates of C. saccharolyticum were prepared by bead beating and
additional ultrasound treatment. After spinning down debris from lysis, the lysate

98
was incubated anaerobically under agitation on streptavidin beads overnight at
4°C. As control, lysates with 50µM free duloxetine were also incubated on
streptavidin bound duloxetine beads. After washing the beads with PBS, to release
the captured proteins desthiobiotin could be substituted through biotin and the
whole protein-duloxetine-desthiobiotin complex was eluted. The pull down was
carried out in quadruplicates. Subsequently, Marie-Therese Mackmull (Beck
group, EMBL) measured the proteins from the eluents using mass spectrometry,
and analyzed the resulting data matching the measured peptides back to C.
saccharolyticum’s in silico proteome. She also performed a data imputation step to
increase the statistical power for proteins that were missing from the controls, and
as such particular interesting. I executed the following statistical and
bioinformatical analysis as described in the result section. More details of the
methods can be found in section 7.8 of the method chapter.
5.1.4 Overexpression of candidate proteins
Protein enrichment from a pull down is not sufficient to demonstrate a
potential mechanism for bacterial duloxetine interaction. Thus, we decided to
overexpress homologues of the protein candidates in E. coli BW25113 ΔtolC and
measure if duloxetine is sequestered from the medium in anaerobic conditions.
Sequestration would indicate a potential binding of duloxetine to the respective
overexpressed protein. To ensure that duloxetine molecules that enter the bacteria
cell is not directly exported again, I chose the tolC deletion mutant as a genetic
background for overexpression in E. coli. TolC is one of the major efflux pumps in
E. coli (Zgurskaya et al. 2011). Additionally, for a few candidates we decided to
overexpress C. saccharolyticum proteins heterologously to test if binding is
improved with the original protein structure. Homologous overexpression
mutants were readily available from a mutant library, whereas heterologous
overexpression plasmids had to be newly designed.
Not all candidates could be overexpressed, as some gene overexpressions are
not viable. For other candidates no potential homologue could be found in E. coli
BW25113. In some cases, all members of a complex have been overexpressed, even

99
though the third member was not enriched in the pull down, e.g. since proteins
homologous to XdhB and XdhC were enriched, XdhA was also overexpressed.
Additionally, selection for overexpression was based on an older analysis of
protein enrichment based on one unique peptide for protein identification instead
of two. Thus not all potential candidates from the pull down were considered.
For heterologous overexpression I selected four proteins: HisF/HisH form a
complex in E. coli. They are part of the histidine pathway and catalyze the last step
before their product 5-Aminoimidazole-4-carboxamide ribonucleotide (AICAR)
is entering the purine pathway. The other two proteins PyrD and PyrF are part of
the pyrimidine pathway but do not form a complex. In silico predictions using the
BNICE framework from a collaborator (Finley et al. 2009) suggested interaction of
duloxetine with the same enzyme class as PyrF. They are one catalytic step up-
and down stream respectively after Phosphoribosyl pyrophosphate (PRPP) is
entering the pyrimidine pathway. PRPP is a product of the pentose phosphate
pathway.
5.2 Results
5.2.1 Duloxetine binding protein enrichment
The aim of the pull-down assay was to enrich for C. saccharolyticum proteins,
which can bind to and thus interact with duloxetine. With a threshold of at least 2
unique peptides per protein and detection in at least three out of four replicates in
either control or treatment samples we detected a total of 591 proteins in the
samples using mass spectrometry based proteomics. Still, many proteins were only
detected in treatment samples but not controls. Thus, after log2 transformation
we performed a data imputation step to estimate missing intensities from the
average intensities in samples with protein detection. Then, data was quantile
normalized before calculating significant differential expression using Student’s t-
test controlling the false discovery rate at an alpha level below 0.1 (Figure 24).

100
With a threshold in log2 fold change between control and pulled down
proteins of at least 2, 55 proteins were significantly enriched in the pull down. Of
those 55 hits six proteins are so far uncharacterized. Of the five strongest hits (log2
fold change > 6) three proteins are uncharacterized and have homologues only to
other uncharacterized proteins. The remaining two strong hits (Uniprot ID:
D9R9H8, D9R9G9) contain both an iron-sulfur cluster and are part of a
NADH:ubiquinone dehydrogenase complex.
Figure 24: Volcano plot of proteins detected in pull down. Fold change of proteins detected in duloxetine pull down of C. saccharolyticum lysate. Presented values are reached after imputing for not-missing-at-random from controls and correcting for an overall higher intensity in test samples in comparison to control samples. Four replicates each were tested. Color refers to: not significantly enriched proteins (grey); significantly (FDR, alpha<0.1, log2(Fc)>2) enriched proteins (black); heterologous proteins overexpressed in E. Coli BW25113 (blue), and a respectively significant depletion (>20%) of duloxetine (red). Mass spectrometry and data imputation by Marie-Therese Mackmull (Beck group, EMBL).
To further link the enriched proteins from C. saccharolyticum to their
“duloxetine bioaccumulation” function, I compared their amino acid sequence
similarity (Figure 25) to other species from the bacteria-drug interaction screen
described in chapter 2 (Figure 11 on page 52). In there, the two E. coli strains IAI1
and ED1a behaved differently, with E. coli IAI1 sequestering duloxetine and being

101
slightly affected in its growth on the one hand, and E. coli ED1a not sequestering
duloxetine nor being affected in its growth on the other hand. I included the lab E.
coli strain BW25113 as further experiments had shown that duloxetine also affects
its growth.
Figure 25: Heatmap of protein blast alignment. Amino acid sequences from enriched proteins align with NCBI pblast tool to most similar sequences in target bacteria. pBlast bitscore used as distance measure, scores scaled by row. Clustering by average linking, annotation from Blast2GO analysis. Identifier is Uniprot ID. Highlighted names show divergent proteins in closely related E. coli strains, correlating with their diverging duloxetine response.
All E. coli strains have a similar phylogenetic distance to C. saccharolytium,
thus their protein alignments show high similarity within E. coli strains and very
little similarity towards C. saccharolyticum (Figure 25). However, for four proteins
the little similarity they do have is correlated with their divergent response to
duloxetine (highlighted in Figure 25). This subunit of xanthine dehydrogenase

102
(XdhB) is strongly enriched in the pull down with a log2 fold change over 5. This
enzyme is part of the purine metabolism pathway as annotated by KEGG. Albeit
peptidase C26 has the strongest divergence in its alignment similarity, and its
matching gene sequence is annotated as puuD in E. coli BW25113. The respective
protein is a gamma-glutamyl-gamma-aminobutyrate hydrolase, which is part of
the KEGG Arginine and proline metabolism pathway and involved in putrescine
degradation. The other two protein sequences map to no or to uncharacterized
proteins in E. coli.
To enable analysis of the functionality of these enriched proteins I used
Blast2GO (Conesa et al. 2005) to annotate proteins with their respective GO terms
and EC numbers. I used Blast2GO to align the enriched proteins against the NCBI
database restricted to Firmicutes only, and used the top five hits and their
respective annotation to annotate the query proteins. Enrichment analysis of
annotated GO terms can be directly done within Blast2GO (Table 6). To analyze
enrichment for KEGG metabolic pathways (Table 7), I extracted the annotated EC
numbers from Blast2GO (33 complete EC numbers in total) and used the
EC2KEGG tool (Porollo 2014).
Table 6: GO term enrichment (most specific) for 55 enriched proteins.
GO-ID Term Category FDR #Enrich #Ref Uniprot ID GO:0048037 Cofactor binding Function 4.41E-03 10 19 D9R7S8; D9R4N8;
D9R6Y5; D9R0M8; D9R8B3; D9R9G9; D9R9C5; D9R1R5; D9R8P2; D9R6Q6
GO:0008137 NADH dehydrogenase (ubiquinone) activity
Function 2.60E-02 3 0 D9R9H8; D9R9H0; D9R9G9
GO:0006120 Mitochondrial electron transport; NADH to ubiquinone
Process 2.60E-02 3 0 D9R9H8; D9R9H0; D9R9G9
GO:0006744 Ubiquinone biosynthetic process
Process 2.60E-02 3 0 D9R9H8; D9R9H0; D9R9G9
The GO term enrichment indicates that many of the enriched proteins bind to
cofactors. A closer look into the annotation reveals that those cofactors are
pyridoxal 5’-phosphate, flavin mononucleotide, FAD, NADP and NAD. While

103
pyridoxal-5’-phosphate is mainly involved in the transfer of amino and carboxyl
groups, the other cofactors are all involved in electron transfer. The remaining
three GO terms all refer to the same three proteins and in each case cover all
potential members of the respective GO term. They indicate a strong enrichment
for proteins of the NADH dehydrogenase with ubiquinone as an electron
acceptor. Two out of the three members are strongly enriched in the pull down
(log2 FC>6). In the same genomic region (Biocyc access NC_014376-66) in total
six enriched proteins can be found, distributed across three operons. Besides the
NADH dehydrogenase and a hydrogenase, the other proteins are a ferredoxin like
protein and a protein serine/threonine phosphatase, and the imidazole glycerol
phosphatase subunits HisH and HisF.
The KEGG pathway enrichment analysis reveals that many enzyme classes
enriched in the duloxetine pull down are part of the purine pathway or the
cysteine and methionine pathway (Table 7). The enzyme classes in the purine
pathway are represented by seven different proteins, in the methionine pathway
by three different proteins. The same pathways were also enriched in the
metabolomics data for C. saccharolyticum (Table 4, p. 88). Four enriched enzyme
functions (2.6.1.1; 2.6.1.5; 2.6.1.57; 2.6.1.9) are shared in several amino acid
metabolic pathways. However, these four enzyme annotations are based on one
protein only: Histidinol-phosphate aminotransferase (Uniprot: D9R8B3). The
NADH:quinone dehydrogenase proteins mentioned before are the only enriched
proteins involved in oxidative phosphorylation. Albeit it is important to notice
that EC2KEGG does not take incomplete EC numbers into account. Thus, for
example the histidine pathway proteins D9R9F0/HisF and D9R9F1/HisH with
EC:4.1.3.- and EC:2.4.2.- respectively are not considered for enrichment analysis
even though a identification by sequence similarity is possible.
The pathway analysis also shows nicely why species-specific comparisons are
important, especially when working with relatively little described organisms. Of
33 EC numbers annotated for the 55 enriched proteins only 20 could be mapped
to KEGG pathways for C. saccharolyticum. As an example, only 46 proteins are so
far annotated as members of the purine pathway in KEGG, while in total 107

104
potential proteins are known. A comparison to a general pathway map would
underestimate the enrichment for any given pathway in C. saccharolyticum. It also
indicates that some significant pathway enrichments like “Isoquinoline alkaloid
biosynthesis” are not meaningful, as so far no protein has been found to be part of
that pathway in C. saccharolyticum. However, for reasons of completeness they are
listed here.
Table 7: KEGG Pathway enrichment analysis for 55 enriched proteins represented by 33 EC numbers.
KEGG Pathway Name Total in KEGG
Total in Csh
In 55 enriched ECs enriched P-value FDR
Purine metabolism 107 46 6 1.17.1.4; 2.4.2.7; 3.2.2.1; 3.6.1.15; 3.6.1.3; 6.3.3.1
0 0
Cysteine and methionine metabolism
74 22 6 2.6.1.1; 2.6.1.5; 2.6.1.57; 3.2.2.16; 3.2.2.9; 4.3.1.17
0 0
Tyrosine metabolism 61 5 4 2.6.1.1; 2.6.1.5; 2.6.1.57; 2.6.1.9
0 0
Phenylalanine metabolism 66 7 4 2.6.1.1; 2.6.1.5; 2.6.1.57; 2.6.1.9
0 0
Novobiocin biosynthesis 12 3 4 2.6.1.1; 2.6.1.5; 2.6.1.57; 2.6.1.9
0 0
Isoquinoline alkaloid biosynthesis
51 0 3 2.6.1.1; 2.6.1.5; 2.6.1.57
0 0
Tropane; piperidine and pyridine alkaloid biosynthesis
27 0 4 2.6.1.1; 2.6.1.5; 2.6.1.57; 2.6.1.9
0 0
Phenylalanine; tyrosine and tryptophan biosynthesis
39 17 4 2.6.1.1; 2.6.1.5; 2.6.1.57; 2.6.1.9
0.00001 0.00008
Oxidative phosphorylation 11 4 2 1.6.5.3; 1.6.99.3 0.0008 0.00587 Fatty acid biosynthesis 17 7 2 1.1.1.100; 2.3.1.85 0.00188 0.01273 Thiamine metabolism 23 12 2 2.8.1.7; 3.6.1.15 0.00465 0.02728 Pantothenate and CoA biosynthesis
30 12 2 1.1.1.169; 2.2.1.6 0.00465 0.02728
Biosynthesis of unsaturated fatty acids
16 1 1 1.1.1.100 0.01487 0.06887
Ubiquinone and other terpenoid-quinone biosynthesis
40 3 1 2.6.1.5 0.02953 0.11298
Pyrimidine metabolism 63 32 2 1.3.5.2; 4.1.1.23 0.02611 0.11298 D-Glutamine and D-glutamate metabolism
12 3 1 6.3.2.8 0.02953 0.11298
C5-Branched dibasic acid metabolism
21 3 1 2.2.1.6 0.02953 0.11298
Glutathione metabolism 38 5 1 1.1.1.42 0.04397 0.15477 Biotin metabolism 20 5 1 1.1.1.100 0.04397 0.15477

105
5.2.2 Homologous overexpression of protein candidates
The aim of overexpressing candidate proteins was to reinforce the evidence
for duloxetine interaction by functional assessment of duloxetine sequestration.
For homologous overexpression, I selected 31 candidate proteins, which might
potentially interact with duloxetine. Selection was mainly based on a preliminary
analysis of protein enrichment and limited to matching homologues in E. coli,
thus only 17 of the 55 enriched proteins in the final bioinformatics analysis were
part of the overexpressed proteins.
Homologous overexpression showed a significant depletion of duloxetine in
all cases (Figure 26). If a minimal depletion of at least 20% is required, 19 out of 30
overexpressed genes sequester duloxetine from the medium (highlighted in Figure
24). The two strongest candidates with a depletion of over 30% are AroK, a
shikimate kinase I that is part of the phenylalanine, tyrosine and tryptophan
biosynthesis pathway, and CpdB, a 3’-nucleotidase or 2':3'-cyclic-nucleotide 2'-
phosphodiesterase, which is part of purine and pyrimidine pathways. Both of
these candidates were not strongly enriched in the pull-down assay in the final
bioinformatics analysis, but showed rather strong enrichment in a preliminary
analysis, which was based on one unique peptide per protein identification instead
of two. As depletion is not corrected for strength of protein overexpression and
bacterial cell density, differences in depletion strength need to be interpreted
carefully. Additionally, none of the hits was stronger than 35% depletion,
indicating that maybe unspecific binding might play a role. E. coli BW25113 ΔtolC
was tested before and did not show any depletion of duloxetine. Albeit in
comparison to wild type E. coli BW25113 it had stronger growth impairments at
50 µM duloxetine. Interestingly, the two different clones of norW overexpression
showed differently strong depletion of duloxetine. One clone was not impaired in
growth by duloxetine and depletes duloxetine stronger than the clone that is
impaired in growth.

106
Figure 26: Duloxetine depletion in E. coli homologous overexpression. Homologues of candidate proteins are overexpressed in E. coli BW25113 tolC deletion mutant. Results from 48h incubation, induction by 200 µM IPTG from beginning, 50 µM duloxetine added after 8h. Depletion of duloxetine after indirect extractions, in comparison to plate-specific control. Bacteria-free control indicated in red. Experiment performed in biological triplicates.
5.2.3 Heterologous overexpression of protein candidates
To test if binding is improved with the original protein structure, I
overexpressed C. saccharolyticum protein heterologously in E. coli TOP10. I
selected four genes for heterologous overexpression (Figure 27). As mentioned
before in C. saccharolyticum the operon of HisF/HisH protein complex is located
close to the NADH:quinone dehydrogenase complex operon, which are the
strongest enriched proteins. They are part of the histidine pathway. The other two
proteins PyrD and PyrF are part of the pyrimidine pathway but do not form a
complex. They are one catalytic step up- and down stream respectively after PRPP
is entering the pyrimidine pathway. PRPP is a product of the pentose phosphate
pathway.

107
Figure 27: Duloxetine depletion in E. coli heterologous overexpression. Overexpression of C. saccharolyticum candidate proteins in E. coli Top10. Depletion of duloxetine after indirect extraction in comparison to controls. Results from 48h incubation, induction by 200 µM IPTG after 5h, 50 µM duloxetine from beginning. Bacteria-free control indicated in red.
In all four cases heterologous overexpression of the candidates proteins lead
to a depletion of duloxetine from the medium. Depletion is relatively strong in
comparison to homologous overexpression and reached up to 45%. Interestingly,
even though HisH and HisF form a complex separate overexpression of each gene
does sequester duloxetine from the medium. However, since the wild type strain
of E. coli was not available and thus not tested in the assay, results should be
interpreted with care.

108
5.3 Summary and Discussion
5.3.1 Summary
The aims of these experiments were to find potential duloxetine interacting
proteins and reinforce the evidence for interaction by overexpression and
functional assessment of sequestration. Consequently, a potential mechanism for
how duloxetine interacts with C. saccharolyticum and potentially other gut
bacteria might come to light.
The five strongest enriched proteins from the duloxetine pull down are either
part of a NADH:quinone dehydrogenase or proteins with unknown function.
Many of the moderately to strongly enriched proteins are part of purine
metabolism or other proteins involved in nucleotide metabolism. Additionally,
the sequence alignment with pBlast showed a divergent similarity in the purine
pathway member xanthine dehydrogenase (XdhB) corresponding to a divergent
duloxetine response in E. coli strains. A different NADH dependent
dehydrogenase also showed a similar behavior. The homologous overexpression
of another purine pathway member showed a strong sequestration of duloxetine:
CpdB, a 3’-nucleotidase or 2':3'-cyclic-nucleotide 2'-phosphodiesterase.
Heterologous overexpression of pyrimidine and histidine pathway members also
showed duloxetine sequestration. Metabolomics analysis had beforehand also
suggested an effect in the same metabolic pathways (Table 4 on page 88).
Experimental support from the overexpression experiments should overall be
considered weak as important controls are missing within the same assay. Clearly,
the experiments need to be replicated with better controls like an empty vector
mutant for depletion control, but also growth should be more tightly monitored to
be able to correct for biomass differences. Additionally, growth might recover in
mutants overexpressing duloxetine-binding proteins as the deleterious effect is
titrated out. Thus, different induction strengths of protein overexpression should
also be tested. Ideally, IC50 values and respective duloxetine depletion curves are
determined for each overexpressed protein and induction strength to allow for
assertion of the impact of the respective protein in duloxetine bioaccumulation or

109
functional relevant inhibition. Consequently, the following discussion is mainly
based on results from the duloxetine pull-down assay, and thus rather speculative.
There are many potential mechanistic explanations possible for the observed
results. Particularly as three of the five strongest enriched proteins are of unknown
function there is room for speculation. I will present shortly two major thoughts
in the next few paragraphs based on the two different binding site of
NADH:quinone dehydrogenase (Figure 28). The underlying idea for the first is an
inhibition of NADH:quinone dehydrogenase through duloxetine binding on its
quinone binding site. The resulting NADH excess could lead to a change in
pentose phosphate metabolism and other downstream pathways like purine
metabolism. The second idea emphasizes that duloxetine itself might act as an
electron acceptor, as it binds many proteins with a redox cofactor. It could bind in
competition to NADH at its binding site on the NADH:quinone dehydrogenase,
as the naphthalene-derived group of duloxetine could be modified into a electron
donating naphtoquinone. In the end I will mention some other aspects and give a
short conclusion.
Figure 28: NADH:quinone dehydrogenase. Figure adapted from KEGG reference pathway for Oxidative Phosphorylation (map00190).

110
5.3.2 Duloxetine as NADH:quinone dehydrogenase inhibitor at
quinone binding site
NADH dependent quinone dehydrogenase is part of oxidative
phosphorylation in the respiratory chain and thus part of the energy metabolism
of most organisms (Haddock & Jones 1977). It is a complex consisting of several
proteins containing iron-sulfur clusters to form an electron transport chain within
the bacterial membrane build to tunnel electrons from NADH+H+ to a electron
acceptor, usually ubiquinone (Brandt 2006). The final electron acceptor depends
on the type of fermentation or respiration employed in the bacterium. The energy
freed by reducing ubiquinone is used to pump protons or Na+ ions out of the
cytosol into the periplasm to establish a proton motive force, which in turn is used
to produce ATP via the ATP synthase (Brandt & Müller 2015). Ubiquinone is
hydrophobic and hence embedded in the bacterial membrane, facing the cytosol.
Duloxetine is also a hydrophobic potentially inserting itself into the bacterial
membrane as well. As such it could potentially inhibit the electron transfer to
ubiqinone and block the whole electron transport chain like the inhibitor
rotenone (Singer & Ramsay 1994). NADH dehydrogenase inhibition at the
ubiquinone binding side is common and other small molecule drugs like
antidepressant nefazodone have been shown to act in this way (Dykens et al.
2008). Additionally, duloxetine is moderately sequestered by many bacteria with
diverse phylogeny (Figure 7), which suggest a binding in the membrane rather
than through a specific protein. Binding to and inhibition of the NADH:quinone
dehydrogenase though might be relatively specific, as only few mainly gram-
positive bacteria show growth defects upon duloxetine sequestration (Figure 11).
Usually, in aerobic respiration a high toxicity through reactive oxygen species
caused by leaked electrons is observed (Fato et al. 2008). As the tested conditions
are anaerobic the only effect might be an energetic loss through electron leakage,
which might manifest as the decreased growth capacity of C. saccharolyticum.
Another reason for a growth disadvantage might be that NADH cannot be
oxidized by NADH dehydrogenase anymore, causing a rearrangement of

111
metabolic fluxes in the downstream pathways and less than optimal energy
expenditure into growth. Downstream pathways like the purine, pyrimidine and
histidine metabolic pathways, all depend on Phosphoribosyl pyrophosphate
(PRPP) generated in the pentose phosphate pathway. They also produce NADH
along the synthesis of their final metabolites. Indeed Minato and colleagues found
when knocking out NADH:quinone dehydrogenase symporting sodium in Vibrio
cholera in anaerobic conditions there was no effect on pathways related to Na+ use
but a change in purine metabolism (Minato et al. 2014).
One drawback of this explanation is that purine pathway member proteins are
enriched in the pull down, which suggest a binding to duloxetine rather than a
regulation in response to it. Although the pull down was implemented overnight
at 4°C, so the formation of larger protein complexes was possible, it is unlikely
that pathways several metabolic steps downstream of the original binding partner
are enriched in this way. Aside from this, there are different NADH:(ubi)quinone
dehydrogenases potentially acting under different conditions or with different
functional history in different bacterial phyla or families (Haddock & Jones 1977;
Brandt 2006; Reyes-Prieto et al. 2014). For example, some are Na+ symporters,
some do not link electron transport to proton or Na+ transport at all (Reyes-Prieto
et al. 2014). The described mechanism is only one of several possibilities, and a
detailed sequence alignment analysis and biochemical characterization has to be
undertaken before making any conclusions about the function of this specific
NADH:quinone dehydrogenase from C. saccharolyticum.
5.3.3 Duloxetine as nucleotide mimicking electron acceptor
Many purine pathway members but also other proteins from the pyrimidine
pathway or cysteine and methionine pathway are enriched in the pull down. As
those proteins do not directly interact with the NADH:quinone dehydrogenase
another explanation seems also plausible. Several of the enriched proteins have a
nucleotide-binding domain for redox cofactors. Most redox cofactors like FAD
and NAD are based on adenine structures, and this might explain why enrichment
occurs especially in the purine pathway. This nucleotide-binding motif is called a

112
Rossmann fold. It is conserved for binding dinucleotides, is widely found across
kingdoms and still allows for flexibility in its structure potentially accommodating
different molecules (Hanukoglu 2015) It is noteworthy that the part of the
NADH:quinone dehydrogenase complex enriched is not the quinone binding
protein but rather the part which binds to NADH.
Disturbing so many binding sites of redox factors should lead to a strong
growth deficiency (Deris et al. 2014). This might not occur simply because
duloxetine binding affinity is not high and only in a artificial environment with
reduced complexity and energetic levels as in the pull down experiment binding
occurs. In many cases binding in purine-binding sites might be facilitated because
purines are planar double ring molecules like the naphthol ring in duloxetine, and
the binding site forms a stack with planar aromatic amino acid side groups (B-Rao
et al. 2012). However, unlike purines it cannot form hydrogen bonds with nearby
amino acids. Thus, duloxetine affinity is low and native substrates will bind more
likely than duloxetine, resulting in no to little growth defects.
Another more speculative idea why no strong growth defects occur is that
duloxetine itself is used as an electron acceptor. It has a naphthol group, which
might be prone to reduction. Naphthalene is degraded in anaerobic conditions by
adding a carboxyl group and then reducing the ring structure by adding protons
and ketone groups (Meckenstock & Mouttaki 2011; Mouttaki et al. 2012; Mihelcic
& Luthy 1988; Xu et al. 2007). The in the pull-down enriched xanthine
dehydrogenase is capable of catalyzing addition of ketone groups to ring
structures, but usually at purine bases on a C atom situated between two N atoms.
If two ketone groups are added, duloxetine might resemble the isoalloxazine
group of FAD and FMN. As such it is a quinone, which can be used for electron
shuttling switching between quinone and quinol states similar to ubiquinone.
PyrD has a FMN binding site and preliminary experiments show a binding of
duloxetine to PyrD (Vladimir Rybin (EMBL), personal communication). Docking
studies suggest that duloxetine does bind in the FMN pocket (Vinita Periwal (Patil
group, EMBL), personal communication). The enriched pathway co-member

113
PyrF is a carboxylase and could potentially activate the naphthol structure of
duloxetine. In the heterologous overexpression both of them sequester duloxetine.
However, before modification duloxetine does not possess similar chemical
properties to NAD or FAD. Besides the amine group close to the click chemistry
linker it does not consist of any nitrogen. It is hydrophobic whereas nucleotides
are highly hydrophilic. Under anaerobic conditions it is hard to modify, as it is
energetically unfavorable (Meckenstock et al. 2016), although naphthene
modification by gut bacteria have been described (Van de Wiele et al. 2005).
Additionally, as mentioned before the discovered binding might only occur in less
competitive in vitro environments. And finally, I found no evidence that
duloxetine is biotransformed in C. saccharolyticum. Thus, duloxetine might bind
in the suggested redox cofactor binding sites, but not be modified. A low affinity
for duloxetine and strong occupation of the binding site by the native redox
cofactors might explain why little growth defects occur in vivo.
5.3.4 Alternative explanations
Duloxetine might act in a complete different way as described here. One of the
enzymes enriched was a xanthine dehydrogenase, which also showed a divergent
alignment correlating with duloxetine response in E. coli. Clostridiales have been
shown to be able to ferment purines (Durre & Andreesen 1983). The xanthine
dehydrogenase is the first step in purine fermentation, and has been show to be
relatively promiscuous (Coughlan 1980). Another idea is that duloxetine blocks
not the NADH or quinone binding sites of NADH:quinone dehydrogenase but a
potential sodium pump function (Reyes-Prieto et al. 2014). Duloxetine could be
considered a sodium pump blocker as the serotonin and noradrenaline
transporters it inhibits in the mammalian brain are sodium dependent.
5.3.5 Conclusion
The protein pull down and following overexpression showed that duloxetine
binds a diverse set of proteins, often associated with the purine pathway or in
general with nucleotide or nucleoside binding. The strongest enrichment was seen

114
for a NADH:quinone dehydrogenase and duloxetine might act as an inhibitor of
its electron transport function, which in turn affects oxidative phosphorylation
and other downstream pathways like purine metabolism. A more detailed
investigation into the structure of duloxetine binding proteins and metabolic
consequences of enzyme inhibition through duloxetine should follow.
5.4 Clarification of Contribution
I designed the pull down experiment and organized the implementation. Felix
Hövelmann (Schultz group, EMBL) synthesized duloxetine bound to
desthiobiotin with a click chemistry enabled linker. Thomas Bock (Beck group,
EMBL) conducted the pull down experiment, while I provided the bacterial lysate.
Marie-Therese Mackmull (Beck group, EMBL) measured the samples with mass
spectrometry and performed the peptide matching and data imputation step. I did
statistical analysis and further bioinformatics.
For homologous overexpression I had help from Lucia Herrera (Typas group,
EMBL) for cloning overexpression plasmids from a clone library into the ΔtolC
background strain. Otherwise I designed and implemented the homologous and
heterologous overexpression and accompanying duloxetine depletion analysis
myself.

115
6 Discussion and Outlook
I will first give a short summary of all findings in this thesis, and then discuss potential implications in the context of the contemporary state of research on gut bacterial drug interactions. When discussing a specific point, I will also suggest additional paths of investigations. Finally I will give a conclusion of the findings from my PhD work. All following parts are structured by the two main thoughts behind this work: i) prevalence of drug interactions of gut bacteria and their relevance in the (host) microbiota context, and ii) mechanistic elucidation of duloxetine interactions and its effects on bacterial physiology.
6.1 Summary of Results
6.1.1 Bioaccumulation of xenobiotics is a wide-spread characteristic of the human gut bacteria and affects community dynamics
Our knowledge of the biochemical capabilities of gut bacteria to interact with
or metabolize therapeutic drugs is largely incomplete (Sousa et al. 2008; Koppel &
Balskus 2016). Towards filling this gap, I planned and conducted a systematic in
vitro screen of xenobiotic-microbial interactions elucidating how wide-spread
bacterial drug bioaccumulation or biotransformation is across therapeutic drugs
or the gut microbiota. I tested, under anaerobic conditions, 450 drug-bacteria
interactions covering 25 metabolically diverse gut bacteria and 18 structurally
diverse FDA-approved drugs. This revealed almost 50 novel bioaccumulation or
biotransformation links between 19 bacterial species and 10 drugs (Figure 11 on
page 52). The implicated bacteria are phylogenetically diverse, including
commensals, probiotics and bacteria associated with diseases. The affected drugs
span diverse indication areas, from asthma (montelukast) to depression
(duloxetine and aripiprazole). Among the identified interactions, around 20 could
be classified as bioaccumulation and seven as potential biotransformations. Drugs

116
like duloxetine and montelukast showed a strong tendency to get bioaccumulated
by several bacteria. Drugs like levamisole and donepezil are likely biotransformed.
Interestingly, bacteria, which deplete drug compounds from the medium, are
usually not affected in their growth by those compounds (at the screening
concentration of 50µM). However, drugs like loperamide and duloxetine do affect
a broader bacteria spectrum in their growth, and act both as inhibitor and
promoter of bacterial growth in a strain dependent manner. Considering up to
1000 gut bacterial strains and a few thousand existing host-targeted drugs, I only
tested a small part of all possible bacteria-drug interactions, and that too at only
one drug concentration. Even in this limited sampling space, the number of hits
found is quite high. As both the bacterial species and the affected drugs span a
wide diversity, these results suggest that bioaccumulation of drugs is a common
and hitherto underappreciated mode of bacteria-drug interactions.
As a case in point, the results from this bacteria-drug interaction study are
followed upon in more details through investigation of interactions involving
duloxetine – a widely used antidepressant. I found that duloxetine induces higher
diversity in synthetic bacterial communities, and its bioaccumulation by
community members affects the community dynamics (Figure 15 on page 66).
The shift in community composition upon duloxetine exposure cannot be fully
explained by the observed growth defects of bacterial species in monoculture as
derived from duloxetine IC50 estimations. Duloxetine-depleting bacteria
additionally alter the dynamics of this shift, as duloxetine concentration is lower
in communities consisting of more duloxetine depleting bacteria.
6.1.2 Bacterial NADH:quinone dehydrogenase and purine metabolism are likely affected by duloxetine
As I found gut bacteria-duloxetine interactions to be common in vitro and
having an impact on bacterial community assembly, I aimed to investigate the
underlying mechanisms. Using an untargeted metabolomics approach to
characterize extracellular metabolites, I found that duloxetine affects the native
metabolism of B. uniformis and C. saccharolyticum, in particular the purine

117
metabolism (Table 4 on page 88). These effects might in turn influence bacterial
behavior in a community. To find the direct protein targets of duloxetine in C.
saccharolyticum, I used click chemistry-based methods and proteomics. Two of
the five strongly enriched duloxetine-binding proteins are part of a
NADH:quinone dehydrogenase complex (Table 6 on page 102). Other moderately
enriched proteins are part of the purine pathway (Table 7 on page 104). Figure 29
summarizes findings in the purine pathway from both metabolomics and
proteomics experiments for C. saccharolyticum. Enriched enzymes in the purine
pathway are AIR synthase, adenine phosphoribosyltransferase (ARPT), xanthine
dehydrogenase (Xdh) and nucleoside-triphosphatase. Additionally, one protein of
the xanthine dehydrogenase (XdhB homolog) showed a divergent sequence
homology in E. coli strains corresponding to their divergent duloxetine response
(Figure 25 on page 101). Metabolites that are products of enriched proteins like
AIR or otherwise closely connected in the pathway like guanosine or pentose
phosphates are enriched too. Thus, duloxetine is likely to affect bacterial
metabolism in the purine pathway by directly binding to nucleotide or nucleoside
binding proteins like xanthine dehydrogenase as well as by inhibiting the
NADH:quinone dehydrogenase directly.

Figure 29: Enriched m
etabolites and enzymes in purine pathway of C. saccharolyticum
. KEG
G pathway m
ap for purine metabolism
. Enzymes present in C. saccharolyticum
as derived from its genom
e sequence are highlighted in green, enzymes and m
etabolites enriched in the respective independent experim
ents in this study are highlighted in red.

119
6.2 Discussion
For a more detailed discussion on effects of specific drugs see the respective
discussion 2.3 on page 53. Here I will focus on more general effects and highlight
implications for pharmacokinetics and gut microbiome ecology. I will mention
interesting findings from other drugs but in general focus more on the case of
duloxetine and depression as it has been intensively investigated in this PhD work.
For each discussion point, I will also suggest further experimental approaches to
test the discussed effects or mechanisms.
Albeit in general, as gut bacteria are neither functionally nor biochemically
well characterized yet in comparison to model organisms like E. coli or B. subtilis
and the found bacteria-drug interactions are likely sensitive to media and oxygen
differences, any follow-up study will suffer from a limitation of tools. For example,
genetic tools like generation of knockouts or overexpression mutants are often not
easily transferable to bacteria from environmental isolates. Defined or minimal
media to efficiently characterize the metabolic state of bacteria using tracer
methods have not been described yet or many bacteria-drug interactions were
sensitive to a change in media condition when tested. Thus, in many cases further
investigations will require the adaptation of molecular biological methods to the
respective investigated bacterial strain, or even strain-drug interaction.
6.2.1 Side effects of host-targeted drugs are mediated through
the gut microbiota
In recent years the connection between microbiota and drug side effects has
often been discussed and many links and examples have been found
(Spanogiannopoulos et al. 2016; Sousa et al. 2008; Wilson & Nicholson 2016;
Swanson 2015). In a few cases, drug dosages or drug side effects could be linked to
bacterial drug bioaccumulation or metabolism (Hashim et al. 2014; Wallace et al.
2010). In other cases, comorbidity due to an induced shift in gut microbiota
composition seems likely (Bahr et al. 2015; Bahra et al. 2015). Furthermore, the

120
gut microbiota can influence hepatic host drug metabolism directly (Claus et al.
2011; Selwyn et al. 2015) and indirectly through bile acid metabolism (Klaassen &
Cui 2015; Sun et al. 2016).
Here, I showed that gut microbial bacteria specifically sequester drugs in
many cases, and that they are affected in growth in other, often different cases.
However, differences between bioaccumulation and an effect on bacterial growth
might be concentration dependent as seen for duloxetine. Thus, a gut microbiota-
mediated sponge-like effect altering drug dosage might occur already before a
direct antimicrobial effect is observed. Furthermore, bioaccumulation did change
bacterial native metabolism and community composition dynamics suggesting
that drug side effects might occur through a change in microbiota composition
already at comparatively low drug concentrations. It should be noted that bacteria
considered probiotic like Bifidobacteria show the same tendencies for
bioaccumulation as normal commensals. If we assume that gut microbiota-drug
interactions are the norm rather than exception as potentially indicated by my
study, then bioaccumulation is the basic bacteria-drug interaction mode and
xenobiotic metabolic biotransformation of drugs are potentially more severe but
also more exceptional cases.
Side effects like increased risk of heart attacks cannot always be linked to a
shift in gut microbiota composition only. Often the native gut microbiota
metabolism directly plays a role as is the case of bacterial trimethyl amine
production from dietary choline and subsequent conversion to pro-
atherosclerotic metabolite TMAO by the host (Wang et al. 2011). As
bioaccumulation of drugs can lead to a change in bacterial metabolism, as shown
in this study for the case of duloxetine, it can consequently cause long lasting but
hard to detect side effects. Most of the tested drug compounds in this study treat
chronic diseases like arteriosclerosis, asthma, or depression and patients use them
for years at a time. Thus, implications of drug bioaccumulation in bacteria on
development of heart diseases, obesity and other metabolic disorders in patients
should be considered carefully.

121
As only 3 out of 12 growth affected bacteria are gram-negative, the bacteria-
drug interaction screen indicates that gram-negative bacteria are better protected
from growth defects than gram-positive bacteria. Of the two major phyla in the
gut microbiome, Bacteroidetes is gram-negative, and Firmicutes is gram-positive.
Thus, upon regular drug exposure a shift towards Bacteriodetes might occur in the
gut microbiome of patients. However, as observed in the synthetic community
assembly upon duloxetine exposure in this study, community dynamics can
overrule expectations, and instead lead to rise in gram-positive bacteria. A high
ratio of Firmicutes to Bacteroides has been associated with unfavorable
developments like metabolic syndrome or obesity, and mouse models and one
human case study suggests that this is causative (Musso et al. 2011; Alang & Kelly
2015). In many cases however, there is still conclusive evidence missing that a
change in microbiome composition is a cause for rather than a consequence of
disease development in humans. In vitro studies might help to point to
mechanisms through which the gut microbiota interacts with the host.
For potential xenometabolic interactions like R. gnavus with montelukast or
B. thetaiotaomicron and duloxetine, an untargeted metabolomics study of a time
course experiment would be needed to identify bacterial drug metabolites and
potential reaction mechanisms. With mutagenesis assays like the Ames test
(Mortelmans & Zeiger 2000; Gatehouse 2012), cell viability assays (Hansen &
Bross 2010) or Caco2 cell permeability assays (Press 2011), crude extracellular
metabolite mixes of bacteria-drug interactions or specific bacterial drug
metabolites once identified can be tested for host toxicity. Also effects on the
protective mucus layer should be investigated in vitro (Liu et al. 2014; Li et al.
2015). Drug compounds with indications for strong deleterious effects in in vitro
assays can then be further tested in in vivo mouse models to investigate host
immune system-gut microbiota feedback interactions (Claus et al. 2011).
Additionally, the same assays can be used to investigate if a shift in bacterial native
metabolism or microbial community composition as caused by bioaccumulation
is associated with production of toxic or otherwise unfavorable compounds.

122
6.2.2 Duloxetine influences depression symptoms through
impact on gut microbiota
Recent research suggest that the gut microbiome is able to influence the
development of depression through the immune system and the hypothalamo-
pituitary-adrenocortical (HPA) axis (Kelly et al. 2015; Foster & McVey Neufeld
2013). Kelly et al. (2015) suggest a weakening of the gut barrier, respective low-
grade inflammation and its influence on the HPA axis as causative in some
instances of depression. Probiotics have been shown to improve barrier function
and lighten mood (Kelly et al. 2015). Additionally, a diverse set of bacteria have
been shown to increase production of serotonin, a major regulator in mood
disorders like depression, especially by spore forming bacteria like Clostridiales
species (Ridaura & Belkaid 2015).
In my study, duloxetine favored the rise of Eubacterium rectale in the bacterial
community assembly. This bacterium is associated with short chain fatty acid
production and consequently with increase in barrier function (Kelly et al. 2015;
Swanson 2015). Furthermore, side effects of duloxetine like decreased appetite or
constipation might be caused by a change in bacterial metabolism, which control
or produce hormones controlling appetite and gut motility in the host (O’Mahony
et al. 2015; Clarke et al. 2014). Side effects of antidepressants like weight gain have
already been linked to a change in microbiota composition (Bahra et al. 2015).
While it is possible that duloxetine directly influences serotonin production in
host cells, it is also possible that duloxetine indirectly modulates serotonin levels
through influencing the metabolism of Clostridiales species producing serotonin
(O’Mahony et al. 2015). Thus, it is likely that duloxetine not only directly mediates
relief from depression by inhibition of the serotonin reuptake in the brain, but
also indirectly through the microbiota composition, which in turn can alleviate
depression. In conclusion, the therapeutic targeting of the gut microbiota to
alleviate depression symptoms, for example as suggested by O’Mahony et al.
(2015), might already be one of the mechanisms underlying the mode of action of
the antidepressants in current use. Further research in this area including

123
population cohort studies and placebo-controlled intervention trials as well as
more mechanistic approaches in mice will likely clarify the impact of the gut
microbiota on depression and respectively the impact of antidepressants on the
gut microbiota in the near future.
6.2.3 Deprotonated, negatively charged drugs are less likely to be sequestered
The bacteria-drug interaction screen showed a broad potential of gut bacteria
to sequester drugs from the medium. At the same time, only comparatively few
bacteria were found to be affected in growth. In particular, gram-positive bacteria
were more often affected (9 out of 12 affected bacteria) than gram-negative
bacteria (3 out of 12 affected). It has been shown before that gram-negative
bacteria are often protected from antibiotics because they possess two cell
membranes instead of one like the gram-positive bacteria (Delcour 2009).
Additionally, gram-negative bacteria tend to have many efflux pumps increasing
their resilience (Nikaido 1996). Many of the drugs have a higher pKa than the pH
of the medium in the bacteria-drug interaction screen. This means that one or
several functional groups of the drug compounds are protonated in the screen and
possess a positive charge. Bacterial cells walls on the other hand possess negative
charge due to the deprotonation of their teichoic acids or LPS compounds. The
positive charge of the drugs might facilitate binding to the negatively charged
bacteria cell wall. All drugs that are not sequestered and do not affect growth in
the bacteria-drug interaction screen (rosuvastatin, tolmetin, tenofovir) are likely
deprotonated and thus at least partially negatively charged in screening
conditions. As most drugs are also lipophilic, once they are attached to the cell
wall they might easily pass into or even through the cell membrane. In gram-
positive bacteria, this means that drugs reached the cytoplasm and might interfere
with essential cellular functions. In gram-negative bacteria, they are more likely to
get stuck in the periplasm, due to the second membrane (Delcour 2009).
Additionally, gram-negative bacteria tend to have more efflux pumps increasing
their resilience (Nikaido 1996). However, this balance might be overcome with a

124
higher concentration of the respective drug and pushed towards growth arrest in
gram-negative bacteria as well. In support of this idea, IC50 values would be
expected, on average for a specific drug respectively, to be higher in gram-negative
bacteria than in gram-positive bacteria, but bioaccumulation should be equally
strong across all affected bacteria as long as they grow equally well. Tendencies of
this mechanism were found for duloxetine in this study, but the idea is speculative
so far. Other experiments like testing for drug sequestration through cell-free LPS
or teichoic acids in different pH conditions could clarify the relevance of this idea
beforehand.
6.2.4 Potential of host-targeted drugs as antibiotic adjuvants
Many compounds in the bacteria-drug interaction screen have growth
inhibitory effects on specific bacterial strains. Potentially, also many drugs that are
sequestered can have growth inhibitory effects in a higher concentration on the
same species as demonstrated for the case of duloxetine and B. uniformis (Figure
13 on page 64). Others, like montelukast might not influence the growth of
bacteria at physiological concentrations at all, but still have an effect on bacterial
physiology as they are sequestered. These compounds could potentially aid
antibiotics to overcome resistant bacteria, target antibiotics more specifically to
certain strains, and have additionally the advantage of being already tried and
tested for use as pharmaceuticals.
This potential has long been realized (Kristiansen & Amaral 1997) and has
recently amidst the antibiotic crisis come more into focus of research again (Ejim
et al. 2011; Wright 2016). Currently, other screens in our institute are aimed at
finding how prevalent gut bacterial growth defects through a wide-range of host-
targeted drugs are or how prevalent their antibiotic adjuvant effects are (personal
communication, Typas group, EMBL). For loperamide, an antibiotic adjuvant
effect has already been described, and the underlying mechanism is likely the
disruption of electron potential across bacterial membranes, which facilitates
uptake and effect of antibiotics (Ejim et al. 2011). A good adjuvant should induce
little to no growth defect itself as to avoid adaption and evolution of resistance

125
mechanisms in bacteria (Wright 2016). Under aerobic conditions, loperamide
induced growth defects only at concentrations in the upper mM range fulfilling
the proclaimed property (Ejim et al. 2011). In anaerobic conditions however, it
affects the growth of many bacteria already at a low concentration of 50 µM
(Figure 11 on page 52), giving potentially leeway to development of resistance
when not used in combination with antibiotics. Nevertheless, it might also
increase its efficiency as antibiotic adjuvant when used to target species in the gut.
Interestingly, duloxetine affects similar species as loperamide, but in contrast
to loperamide it is also sequestered from the medium. Thus, it is possible that
duloxetine has a similar destabilizing effect on the bacterial cell membrane but
caused by a different mechanism than in loperamide. Indeed I could show that
duloxetine potentially binds the NADH:quinone dehydrogenase, a key enzyme
responsible for the establishment of proton motive force across the bacterial
membrane. In this case, duloxetine might also work as an antibiotic adjuvant just
like loperamide. Other antipsychotics have already been shown to have potential
as antibiotic adjuvant (Jeyaseeli et al. 2012; Munoz-Bellido et al. 2000). To explore
such possibilities, duloxetine and other candidates like montelukast should be
tested in combination with antibiotics, and their effects on growth should
determined for individual bacterial strains. Then, it would be interesting to test
the combinatorial effect of adjuvant and antibiotic in a synthetic community
assembly experiment to investigate if specific bacteria can be targeted in a
community.
Additionally, the bacteria-drug interaction screen indicates that bacteria,
which are resistant to a certain compound, are potentially less so under anaerobic
conditions. Thus, besides being a reservoir for antibiotic resistance (Penders et al.
2013), the gut microbiota is potentially also an active site for the development of
bacterial resistance, which might explain its high diversity of resistance genes.

126
6.2.5 Duloxetine inhibits bacterial NADH:quinone dehydrogenase and affects purine metabolism
As described in the discussion of the respective chapter 5.3 on page 108 in
more detail, I suggested two potential binding sites for duloxetine on the bacterial
NADH:quinone dehydrogenase at the quinone binding site or the NADH binding
site. Inhibiting the electron transport chain commonly occurs at the quinone-
binding site (Fato et al. 2008; Singer & Ramsay 1994), and a knockout does lead to
a feedback into the purine pathway and excretion of those metabolites in bacterial
species (Minato et al. 2014). Indeed, duloxetine with its naphthol group shows
some similarity to a known inhibitor of the quinone-binding site (Dykens et al.
2008). Thus, it would also explain the findings from the untargeted metabolomics
experiment. However, not proteins of the potential quinone-binding site of the
dehydrogenase complex in the membrane were enriched in the pull-down, but
proteins of the respective cytosolic NADH-binding site. Furthermore, other redox
factor binding proteins like AIR synthase, xanthine dehydrogenase (Xdh) and
adenine ribosylphosphotransferase (ARPT), key players of the purine pathway,
were also enriched in the pull-down. Additionally, homologs of Xdh but not
NADH:quinone dehydrogenase show divergent sequence similarity in E. coli
strains divergently responding to duloxetine. Xdh is comparatively promiscuous;
several inhibitors at the active site have been synthesized so far (B-Rao et al. 2012;
Takano et al. 2005). Deficiency in Xdh leads to accumulation of adenine (Kojima
et al. 1984), deficiency of APRT to accumulation of adenine or 2,8-
dihydroxyadenine (Terai et al. 1995). Adenine was not strongly enriched in C.
saccharolyticum in the untargeted metabolomics experiments, but was enriched in
B. uniformis.
A targeted quantitative metabolomics study of intracellular and extracellular
metabolites in C. saccharolyticum to reveal which part of the purine metabolism is
strongly affected could support these ideas, and potentially differentiate between
the two explanations pointing to the primary (bacterial) target of duloxetine. Also
metabolites like 2,8-dihydroxyadenine, which is produced upon inhibition of
ARPT, and other indicative non-standard metabolites can be found with this

127
method. The metabolomics data could be used to build a metabolic model
describing the expected effects of NADH:quinone dehydrogenase or purine
pathway members inhibition and rearrangements in the metabolic fluxes in the
downstream pathways.
Additionally, after a stringent and detailed comparison of gene homology, an
improved assay of gene knockout and overexpression of C. saccharolyticum
homologs of NADH:quinone dehydrogenase or purine pathway members in E.
coli could give indications of binding. Overexpression mutants for proteins
inhibited by duloxetine, might escape growth defects induced by duloxetine as
inhibition is titrated out. If bioaccumulation is protein dependent as well,
knockout mutants of proteins causative for bioaccumulation should deplete less
duloxetine from the medium as non-causative protein knockout mutants.
Furthermore, protein candidates from C. saccharolyticum can be overexpressed
and purified and their duloxetine binding affinity and further biochemically
properties can be characterized directly. For in vivo relevance, duloxetine needs to
be able to bind in competition to or at least in presence of the native substrate,
which can be tested in a competition assay on the purified enzyme.
6.3 Conclusion
In my PhD work, I identified almost 50 novel gut bacteria-drug interactions
suggesting that similar interactions are likely to be more prevalent than expected
so far. For most of the identified interactions, the drugs were bioaccumulated
rather then biotransformed. Bioaccumulation is thus potentially a widespread but
so far underappreciated mode of bacteria-drug interaction. My study also shows
that drug bioaccumulation can impact bacterial metabolism without strong or
even no effect on bacterial growth. Within a bacterial community the
consequences of these effects, bioaccumulation and growth defects, are hard to
predict from monoculture growth alone. For example, exposure to Duloxetine, a
widely used antidepressant, led, unexpectedly, to a higher diversity in a synthetic
community. As bacteria can affect the effective dose of a host-targeted drug

128
through bioaccumulation, and/or change its activity spectrum through
biotransformation, the findings from this study have broad and far-reaching
relevance for drug dosage decisions and personalized medicine. Consequently,
potential bacterial off-target effects as cause for drug side effects also need to be
taken into account during drug design and clinical trials.

129
7 Materials and Methods
7.1 Growth conditions and media
Unless otherwise indicated, all bacteria were grown as liquid cultures in Gut
Microbiota Medium (GMM) (Goodman et al. 2011). Cultivations were carried out
in a Vinyl Anaerobic Chamber (COY, USA) at 37°C with oxygen below 20ppm,
15% carbon dioxide and 1.8-2% hydrogen. Main gas in the anaerobic chamber is
nitrogen. All experimental cultures were started from the second passage culture
after inoculation from a glycerol or DMSO stock. Depending on the bacterial
species, one passage might take up to 48h to grow. The recipe for GMM can be
found in Table 8. All media, buffer, glass and plastic ware used had been exposed
to anaerobic conditions at least 12h prior usage. Table 8: Gut Microbiota Medium (GMM)
Component Amount/L Concentration Comments Tryptone Peptone 2 g 0.2%
Yeast Extract 1 g 0.1% D-glucose 0.4 g 2.2 mM L-cysteine 0.5 g 3.2 mM Cellobiose 1 g 2.9 mM Maltose 1 g 2.8 mM Fructose 1 g 2.2 mM Meat Extract 5 g 0.5% KH2PO4 100 mL 100 mM 1M stock solution pH 7.2
MgSO4-7H20 0.002 g 0.008 mM NaHCO3 0.4 g 4.8 mM NaCl2 0.08 g 1.37 mM CaCl2 1 mL 0.80% 0.8g/100mL stock
Vitamin K (menadione) 1 mL 5.8 mM 1 mg/mL stock solution FeSO4 1 mL 1.44 mM 0.4 mg FeSO4/mL stock solution Histidine Hematin Solution 1 mL 0.1% 1.2 mg hematin/mL in 0.2M histidine Tween 80 2 mL 0.05% 25% stock solution ATCC Vitamin Mix 10 mL 1%
ATCC Trace Mineral Mix 10 mL 1% Acetic acid 1.7 mL 30 mM Isovaleric acid 0.1 mL 1 mM Propionic acid 2 mL 8 mM Butyric acid 2 mL 4 mM Resazurin 4 mL 4 mM 0.25 mg/mL stock solution
pH 7.2 corrected with 10M KCl

130
For conjugation of overexpression plasmids bacteria were grown in LB liquid
medium or on LB agar plates (2% w/v). LB recipe can be found in Table 9. Table 9: Recipe for LB medium.
LB medium 1% (w/v) Bacto tryptone 0.5 % (w/v) Bacto yeast extract 0.5 % (w/v) NaCl
7.2 UPLC methods
7.2.1 UPLC-UV methods
Liquid chromatography is a method widely used to separate specific
compounds from a mixture and identify them based on comparisons to standards.
The methods used here use UV absorption and elution time for identification. To
be able to measure all selected drugs within one screen with the available
instrument, chromatographic conditions needed to be optimized using a
maximum of 4 different mobile phases, while two of them needed to be water and
an organic phase respectively. Another parameter for optimization was time. For
optimal separation of compounds a longer chromatography with a less steep
gradient is usually preferable. However, this would increase the measurement time
for the whole screen strongly since approximately 6000 injections were to be
expected. Once established, the same methods were used throughout the whole
study.
All liquid chromatography methods are run on a Waters Acquity UPLC H-
Class instrument with a PDA detector and a quaternary solvent system. All
established methods are 5 minutes long, have a flow rate of 0.5ml/min and run on
a CSH C18 column (Waters, Part number 186005297) in reverse mode. The
column is heated to 40°C and samples are kept at 6°C. All methods use 50%
acetonitrile (Biosolve, ULC grade) for washing buffer, and 50% methanol
(Biosolve, ULC grade) for purging buffer. As organic mobile phase acetonitrile
was used. The assay was optimized using only two buffers besides water as
hydrophilic mobile phase: 5mM formic acid (Biosolve, ULC grade) of pH 3.2 and

131
5mM ammonium formate (Ammonium hydroxide, ACS grade, Sigma) with pH
adjusted to 8.3 using the formic acid buffer. Table 10 lists the five different
chromatographic methods established for the different drugs. The specific
chromatographic method used for identification of each drug compound can be
found in Table 11.
Table 10: UPLC methods.
From min To min Acetonitrile Formic Acid Buffer
Ammonium Formate Buffer Water
Method A 0 1.5 5% 0% 65% 30% 2.5 3 60% 0% 40% 0% 3.5 5 5% 0% 65% 30% Method B 0 1.5 5% 65% 0% 30% 2.5 3 60% 40% 0% 0% 3.5 5 5% 65% 0% 30% Method C 0 1.5 20% 60% 0% 20% 2.5 3 80% 20% 0% 0% 3.5 5 20% 60% 0% 20% Method D 0 1.5 5% 0% 95% 0% 2.5 3 50% 0% 50% 0% 3.5 5 5% 0% 95% 0% Method E 0 1.5 40% 60% 0% 0% 2.5 3 95% 5% 0% 0% 3.5 5 40% 60% 0% 0% Table 11: UPLC method description by drug
Drug compound
UV absorption (nm)
Second channel (nm)
UPLC Method
Peak elution time (min)
Caffeine elution time (min)
Acetaminophen 244 - A 1.5 3 Aripiprazole 255 - B 3.3 3 Donepezil 268 - B 3.2 3 Duloxetine 230 - B 3.3 3 Digoxin 220 - B 3.5 3 Ezetimibe 234 - C 3.5 0.7 Loperamide 220 - B 3.5 3 Metformin 234 - D 0.7 3.1 Montelukast 344 274 E 3.8 0.5 Metronidazole 330 274 A 1.9 3 Levamisole 225 - A 3.5 3 Ranitidine 313 274 A 3.3 3 Roflumilast 245 - C 3.6 0.7 Rosiglitazone 247 - B 3.1 3 Rosuvastatin 241 - C 3.3 0.7 Simvastatin 247 - E 3.7 0.5 Sulfasalazine 254 - C 3.7 0.7 Tenofovir 260 - B 3.4 3 Tolmetin 320 274 C 3.4 0.7

132
7.2.2 Data analysis
A general approach to analysis data from UPLC methods is described here. If
not indicated otherwise, all chromatographic data is handled this way. For data
analysis of the bacteria-drug interaction screen, see respective method 7.3.3.
All chromatograms are annotated with the vendor specific program Empower
3, and manually curated for peak identification. Readout for all chromatograms is
baseline corrected area under the curve of the drug peak and the internal standard
peak respectively. This raw data is further analyzed using statistics softwar
environment R and respective packages.
Each drug peak is normalized by the respective caffeine peak (used as internal
standard) from the same chromatogram. If a new peak appeared in the drug-free
bacteria control, which is coeluting with the drug peak, the mean of the
normalized values from the control was subtracted from the mean of the
normalized values from the experimental samples. Corrected normalized means
of the experiment samples were then compared to the mean of the respective
bacteria-free drug control and a Student’s t-test was used to assess if they are
significantly different. If more than 10 interactions were tested in one assay, the
false discovery rate was controlled at alpha level 0.05 using Benjamini-Hochbergs
method (Benjamini & Hochberg 1995).
If samples from different experimental batches or different UPLC runs were
compared with each other, all samples were normalized by the mean of the
bacteria-free control from the respective batch. This allows statistical testing
comparisons by keeping the relative mean and variation of the respective batch,
but adjusting for differences in absolute means caused by methodological
differences.

133
7.3 Bacteria-Drug Interaction Screen
7.3.1 Drug Selection
As a starting point I used the SIDER database (Kuhn et al. 2010), listing 4492
unique side effects for 996 medical drugs as accessed on 7.2.2014. The SIDER
database extracts these side effects from publicly available websites and patient
information leaflets. I defined two sets of side effects: one loosely associated with
symptoms related to the gut or gut microbiome including symptoms like
“Vitamin B deficiency” or “Atherosclerosis” (190 terms in Appendix A), the other
one more strict only focusing on terms directly related to the gut like “Flatulence”
or “Weight fluctuations” (36 terms in Appendix A). For 121 of the 996 drugs,
more than 10% of their respective side effects were loosely associated with the gut,
and for 93 drugs more than 5% of their respective side effects were strictly
associated with the gut. 63 drugs fulfilled both conditions, and were further
scrutinized.
I enriched the list with drugs that have a high sales volume (indicative of
clinical relevance), drugs that had been withdrawn from the market for side effects
that might involve the microbiome as a cause, and drugs that are on the WHO list
of essential medicine (World Health Organization 2015). Additionally, drugs that
had already been shown to impact the gut microbiome as collected by the
Pharmacomicrobiomics database (Saad et al. 2012) were considered for the screen.
I manually curated this list of approximately 120 drugs, and annotated it with data
from CHEMBL (Bento et al. 2014) and DrugBank (Law et al. 2014).
From these compounds I selected only drugs that are administered orally to
the patient. This could increase the chance of exposure of the gut microbiome to
the drug before first pass metabolism, especially if the drug is poorly absorbed in
the stomach. Thus, I prioritized drugs with a long biological half-life and low
bioavailability. I excluded antibodies or other peptide-like drugs as I assumed a
high likelihood of them being metabolized as nutritional source. Also drugs with a
molecular weight higher than 500 Dalton were generally excluded to focus on
small molecule drugs. The resulting roughly 60 drugs were manually curated and

134
selected for availability from vendors and implementation of UPLC methods
within a screening context. For the 18 drugs listed in Table 2 on page 40 I
established reliable chromatographic methods as described in the previous
method section 7.2.
7.3.2 Experimental setup
For all drugs, I used a fixed concentration of 50 µM, which in most cases
approximates the concentration of one pill (0.02-3 mmol) diluted in the volume of
the gut (approx. 2.5 L). As shown in the plate outline in Figure 30, I used one
bacteria-free control per plate and drug, but triplicates for each bacteria-drug
interaction. The screen was carried out under anaerobic conditions in 96-well
plates (Nunclon Delta Surface 163320, NUNC) with 150 µl GMM as the growth
medium sealed with a Breathe-Easy® sealing membrane (Z380059, Sigma-
Aldrich). Plates containing 100 µl of the medium and 75 µM of the drug were
prepared beforehand, stored at -20°C and used as needed.
Figure 30: Outline of bacteria-drug interaction screening plates. Each sample involving the growth of bacteria is tested in triplicates per plate. Drug controls, which are bacteria-free, are tested in singlets per plate. Per plate one bacterium is tested with all drugs in the screen.
Frozen plates were introduced into the anaerobic chamber the evening before
inoculation. Wells were inoculated with 50 µl of a second overnight culture with
an end OD578 of 0.01. Growth was monitored with measurements of the optical
density at 578 nm using an Eon Microplate Spectrophotometer (BioTek)
approximately every 2h for the first 10h, then approximately every 6h. After 48h,

135
plates were removed from the anaerobic chamber and the bacteria spinned down
(4000 rpm, 10 min). Then, 100 µl of the supernatant was extracted in 300 µl ice
cold acetonitrile:methanol (Biosolve, ULC grade) in 500 µl polypropylene plates
(Corning Costar 3957) to remove compounds interfering with liquid
chromatography. Plates were closed with a lid (Corning, storage mat 3080) and
after shaking and 15 minutes incubation at 4°C, samples were centrifuged at 4000
rpm for 10 min at 4°C and 300 µl of the supernatant were transferred to a new
plate (Corning Costar 3362). All liquid handling outside of anaerobic chamber
was done using a liquid handling robot (FXp, Biomek). Sample plates were then
left overnight in a chemical hood to evaporate the organic phase, before being
stored at -20°C. For estimating the drug concentration in the samples with the
UPLC, samples were reconstituted in 50 µl 20% acetonitrile solution containing
250 µM caffeine (Sigma) as an internal standard. The bacteria-drug interaction
screen was conducted with two biological replicates. Table 1 contains a list of
bacteria in the screen.
Under the same conditions I tested also two different mixes of five bacteria
each. One mix consisting of bacteria depleting many drugs: C. saccharolyticum, C.
ramosum, B. uniformis, B. animalis lactis, and F. nucleatum; the other mix
consisting of bacteria not depleting drugs: L. plantarum, L. paracasei, B. fragilis,
L.lactis, and B. vulgatus. Second overnight cultures from those bacterial strains
were mixed before inoculation, and wells were inoculated with 50 µl of the premix
resulting in an end OD578 of 0.01 for each bacterium. Otherwise, mixes were
treated as described above for monocultures.
7.3.3 Data analysis
For dug depletion analysis, area under the curve (AUC) from drug peak was
normalized by AUC from the internal standard caffeine (corresponding peak of
the same chromatogram). Then for the triplicates for each bacteria-drug
interaction the mean was compared to the bacteria-free control from the same
plate. If the bacteria-free control was contaminated for that interaction, the
triplicates were compared to the median of controls from the same column batch

136
(all plates measured on the same LC column). If for both biological replicates the
difference was 30% or more, the interaction was considered a hit. For each hit the
mean depletion from both biological replicates was then calculated.
For growth effect analysis, growth curves were manually annotated with
maximum OD reached, to correct for irreproducible “overgrowing” for certain
species of bacteria. Triplicates of bacteria-drug samples were then compared to
triplicates of solvent control with Student’s t-test, and if differences were
significant in both biological replicates, the interaction was considered a hit. For
each hit, the mean of the differences of maximum OD from both biological
replicates was then calculated as the effect size.
7.4 Community Assembly Assay
7.4.1 Experimental Setup
Two different species mixes were prepared, one with B. uniformis and one
without. Other species in the mix were B. thetaiotaomicron, E. rectale, L. gasseri, R.
torques and S. salivarius. Overnight cultures of the bacteria were diluted to OD578
0.5 and 500 µl of each species culture was mixed in a 5ml eppendorf tube
(5+GMM or 6 species respectively). A 10 mM working solution of duloxetine and
DMSO in PBS was prepared to be used throughout the assay. 5 mL polystyrene
tubes (round bottom, Falcon, Corning Mexico) were prepared with 1950 µl GMM
plus 10 µl drug/DMSO solution plus 40 µl species mixture for each transfer
respectively. Tubes were incubated for 48h non-shaken anaerobically at 37°C.
After the first inoculation, the transferred species mix was from the end point of
the earlier cultivation. For DNA extraction, 1mL of the remaining culture was
centrifuged for 10 min 14.000 rpm in 1.5 mL eppendorf tube. 200 µl supernatant
was transferred to a new 1.5 ml eppendorf tube, rest of supernatant was removed
and then the bacteria pellet was frozen at -80°C until DNA extraction. For drug
extraction 600 µl of cold ACN:MethOH was added to supernatant and incubated
for 15 min in fridge. Then samples were centrifuged for 10 min 14.000 rpm 4°C,

137
700 µl of sample was transferred to new tube and then samples were dried in a
speedvac (Eppendorf Vacuum Concentrator Plus) for 5h at 30°C at V-AL mode.
For UPLC measurement samples were reconstituted in 116 µl 20% ACN
containing 250 µM caffeine.
7.4.2 DNA extraction and 16S barcode sequencing library
preparation
Bacteria pellets were dissolved in lysis buffer and transferred into a 96
Polypropylene Deep Well plate (3959, Corning). An in-house protocol was used
for DNA extraction. The GNOME DNA isolation Kit (MP Biomedicals) was
adapted to be used with the Biomek® FXp Liquid Handling Automation
Workstation (Beckman). Subsequently, purified DNA was obtained using ZR-96
DNA Clean & Concentrator™-5 (D4024, Zymo Research).
After the integrity of the DNA was verified by agarose gel electrophoresis,
DNA concentration of the samples was determined using the Qubit dsDNA BR
assay kit (Q32850, life technologies) in combination with the Infinite® M1000
PRO plate reader (Tecan). The 16S V4 amplicons were generated using an
Illumina-compatible 2-step PCR protocol: In a first PCR the 16S V4 region was
amplified with the primers F515/R806 (Caporaso et al. 2011) and then in a second
PCR barcode sequences were introduced using the NEXTflex 16S V4 Amplicon-
Seq Kit (4201-05, Bioo Scientific).
After multiplexing equal volumes of PCR products from each sample,
SPRIselect reagent kit (B23318, Beckman Coulter) was used for left-side size
selection. Prior to Illumina sequencing the quality of the library was controlled
using the 2100 BioAnalyzer (Agilent Technologies) and the DNA concentration
was determined using the Qubit dsDNA HS assay kit.
Sequencing was performed using a 250 bp paired-end sequencing protocol on
the Illumina MiSeq platform (Illumina, San Diego, USA) at the Genomics Core
Facility (EMBL Heidelberg).

138
7.4.3 16S barcode sequencing analysis
The raw Illumina paired-end reads were quality trimmed and length filtered
using CUTADAPT with quality threshold of 30 and length cutoff of 150 bp
(Martin 2011). The forward and reverse pairs were subsequently merged using
Paired End 138ead MergerR with minimum overlap of 20 bp (Zhang et al. 2014).
The merged amplicon sequences were compared to the 16S rRNA gene of the
species mixed for coculture using UCLUST (Edgar 2010). Only those that have
minimum 98% identity were clustered into the operational taxonomic units
(OTUs). The species abundance was normalized by the 16S rRNA gene copy
numbers. Data was visualized using the plotly library (Dimitrov 2014).
7.5 Other in vitro assays
7.5.1 Depletion-mode assay
The bacteria-drug interaction screen is designed to find potential drug
interactions by screening for depletion of the drug from the medium. However,
since in the screen the bacteria are removed before the extraction this leaves the
question whether the drug is bound to or accumulated by the bacteria or if it is
also biotransformed or metabolized. To distinguish between these two
possibilities, bioaccumulation and xenometabolism, and also to further confirm
the screening hits, I designed a depletion-mode assay.
Bacteria from an overnight culture are inoculated with an OD578 of 0.01 in 1
mL GMM containing 50 µM drug of interest in 2 mL eppendorf tubes and
incubated for 48h while shaking. After finishing growth, the cultures were
removed from the anaerobic chamber. 800 µl of each sample was transferred to a
new eppendorf tube, while the remaining 200 µl were directly extracted by adding
600 µl ice-cold acetonitrile:methanol solution and incubated for 15 min at 4°C.
For the indirect extraction, the transferred culture was centrifuged for 5 min at
14.000 rpm to pellet the bacteria, and 200 µl of the bacteria-free supernatant was
extracted in a new eppendorf tube respectively. After the 15 min 4°C incubation

139
period, all samples were centrifuged for 10min, 14.000rpm at 4°C and 700µl of the
supernatant was transferred to a new eppendorf tube. Samples were dried for 5-7h
at 30°C in a speedvac (Eppendorf Vacuum Concentrator Plus, V-AL mode) and
stored at -20°C until used for UPLC measurement. Samples were reconstituted in
116µl 20% acetonitrile containing 250µM caffeine. All interactions and controls
were tested in triplicates.
7.5.2 Growth curves for IC50 determination
A dilution curve of duloxetine ranging from 1mM to 5mM was prepared in
DMSO and then added to GMM. End concentration of DMSO was 1%. Bacteria
from second overnight culture were diluted to an OD578 of 0.5. 100 µL of medium
was distributed in 96 well plates (Nunclon Delta Surface 163320, NUNC),
inoculated with 1 µl to a final OD578 of 0.005 and sealed with a Breathe-Easy®
sealing membrane (Z380059, Sigma-Aldrich). Growth was monitored every hour
for 24h using an Eon Microplate Spectrophotometer (BioTek) equipped with
BioStack Microplate Stacker (BioTek) and a surrounding self-designed incubator.
For IC50 calculation a local regression curve was fitted to data from triplicates
using R’s loess function with a span parameter of 0.5. From this half the maximum
OD was inferred. Then the closest time point was selected were bacteria growth
first passed half the maximum OD, being a close estimate to the turning point of
the exponential growth phase. For this time point the fitted ODs from the
duloxetine dilution curve were used for estimation of 50% of total the
concentration inhibiting 50% of the growth (IC50).
7.5.3 Resting Cell and Lysate assay
For further characterization of hits from the bacteria-drug interaction screen
with metabolomics and proteomics methods, interactions were tested in media-
free conditions. The use of media-free conditions allowed reducing the complexity
due to media components and highly active endogenous bacterial metabolism.
Bacteria were grown in a volume of 30 mL or more in standard conditions to
maximum OD578, approaching or reaching stationary phase. Cultures were pooled

140
in 50 mL falcons and pelleted by centrifugation (2000-4000 rpm, 10 min). Media
was discarded; cells were resuspended in 2 mL buffer and transferred to an
eppendorf tube. Cells were washed 2 more times in 2 mL buffer (centrifugation
9.000 rpm, 5 min, 4°C) before used further.
For a resting cell assay, cells were resuspended in buffer, and exposed to
experimental conditions as indicted. At the end of the experiment, all samples
were extracted indirectly in a ratio of 1:3 sample:organic phase, as described in
the depletion-mode assay method 7.5.1.
For a lysate assay, up to 1mL cell suspension was added to 500µl 300µm
glassbeads in a screw cap tube and cells were lysed for 1min at 4°C using a bead
beater. Then, cell debris and beads were spinned down (14.000 rpm, 5min). The
cell lysate was then exposed to experimental conditions as indicated.
While all transfers were anaerobic, centrifugation, bead beating and
ultrasound steps had to be implemented outside the anaerobic chamber.
Eppendorf and screw cap tubes close tight enough for minimal oxygen exposure
during these steps.
7.5.4 Duloxetine pull down assay
To enable a pull down of proteins interacting with duloxetine we decided in
collaboration with Schultz group at EMBL to introduce an alkyne group at the
methyl group of duloxetine. Felix Hövelmann (Schultz group, EMBL) synthesized
the molecule. After synthesis and clean up, he linked the functionalized duloxetine
to desthiobiotin using a click-chemistry enabled reaction. In collaboration with
Thomas Bock (Beck group, EMBL) we could consequently captured the
functionalized desthiobiotin-duloxetine on streptavidin magnetic beads.
Bacterial suspensions of Clostridium saccharolyticum (1 ml, anaerobic
conditions) were lysed by bead disruption (lysate preparation see method 7.5.3)
and additional sonication at 4 C (two times at 75% amplitude/0.5 s cycle for one
minute, Hielscher sonicator). Supernatant after centrifugation at 20000 x g at 4 C
for 10 minutes containing protein lysate was recovered and protease inhibitors
(aprotinin 10 μg/mL, leupeptin 5 μg/mL) were added.

141
For all duloxetine-protein pull-downs, Strep-Tactin® Sepharose® 50%
suspension (#2-1201-025, IBA) was used. For each sample, 400 µl Strep-Tactin
Sepharose (50% suspension) was pre-washed three times using 400 µl PBS (pH=7)
at room temperature. Beads were bound to duloxetine before addition of the
protein lysate by resuspension in 400 µl PBS containing 50 µM duloxetine
(control) or 50 µM duloxetine linked to desthiobiotin (for pull-down) on a
rotating wheel at room temperature for 30 minutes. Unbound drug was removed
by three PBS wash cycles (400 µl each).
Protein lysates were incubated with drug-bound beads on a rotating wheel at
4°C over night. Unbound proteins were removed by washing the beads with cold
PBS. Bound proteins were recovered by competitive elution using PBS containing
5 mM Biotin. After an SDS gel using stain-free SDS-PAGE imaging technology
(BioRad) showed protein integrity, samples were further processed for mass
spectrometry-based protein identification. The pull down was conducted in
quadruplicates for each treated and control sample.
7.5.5 Homologous overexpression of protein candidates
First, selected strains from an overexpression plasmid library were conjugated
into E. coli BW25113 ΔtolC::aphT background. The low copy expression plasmid
clone library (Transbac library (Otsuka et al. 2015)) in the diaminopimelic acid
(DAP) auxotrophic BW38029 (Hfr by CIP8) background was grown on LB agar
plates supplemented with 10 μg ml-1 tetracycline and 0.3 mM DAP. The selected
donor strains were manually picked from the library and arrayed in 96-format
onto one LB agar plate.
The receiver strain (BW25113 ΔtolC::aphT) was grown to stationary phase,
diluted to an OD578 of 1 and streaked out on a mating plate (LB supplemented
with DAP). Plates were dried for 1 hour at 37°C and the donor strains were
pinned on top of the donor strain layer using a Singer robot. Conjugation was
carried out at 37°C for 5 – 6 hours. After conjugation mixtures were pinned on LB
plates supplemented with tetracycline. Three selection rounds ensured successful
mating events. For glycerol stocks conjugated bacteria were inoculated in 100 µl

142
LB supplemented with 10 μg ml-1 tetracycline in a 96 well plate and after overnight
incubation at 37°C 20µl of a sterile 80% glycerol solution was added. Glycerol
stocks were kept at -80°C.
Overexpression was conducted in 96-well plates (Nunclon Delta Surface
163320, NUNC) in 100µl GMM supplemented with 10µg/ml tatracycline. Bacteria
from second pre-culture in GMM supplemented with 10µg/ml tetracycline and
200µM IPTG were inoculated with a final OD578 of approximately 0.01 and plates
were sealed with a Breathe-Easy® sealing membrane (Z380059, Sigma-Aldrich).
After 8h incubation at 37°C membranes were removed, 50µl of the same media
additionally containing 50µM duloxetine or respective amount of DMSO as
control was added and plates were sealed again for a further 43h incubation. Plates
were then extracted and further treated as described for the bacteria-drug
interaction screen, method section 7.3.2.
For data analysis after normalization by caffeine internal standard, samples
were normalized by mean of bacteria-free drug control from the respective plates
and then compared using student’s t-test with an alpha level below 0.05.
7.5.6 Heterologous overexpression of protein candidates
E. coli TOP10 strains with a pET151/D-TOPO plasmid containing the codon-
optimized gene for the respective C. saccharolyticum protein candidate were
designed at and ordered from Geneart (Thermo Scientific). Plasmids encoded for
ampicillin resistance. Overexpression was conducted in 96-well plates (Nunclon
Delta Surface 163320, NUNC) in 150 µl GMM supplemented with 100 µg/ml
ampicillin. Bacteria from second pre-culture in GMM supplemented with 100
µg/ml ampicillin and 50 µM duloxetine were inoculated with a final OD578 of 0.01
and plates were sealed with a Breathe-Easy® sealing membrane (Z380059, Sigma-
Aldrich). After 5h incubation at 37°C membranes were removed, 1.5 µl 20 mM
IPTG solution added to induce overexpression and plates were sealed again for a
further 43h incubation. Plates were then extracted and further treated as described
for the bacteria-drug interaction screen, method section 7.3.2.

143
For data analysis after normalization by caffeine internal standard, samples
were normalized by mean of bacteria-free drug control from the respective plates
and then compared using Student’s t-test with an alpha level below 0.05.
7.6 Untargeted Metabolomics with NMR
For NMR spectroscopy I performed two different experiments. First, I tested
one specific interaction, that of duloxetine with B. uniformis. Samples were
collected from resting cell assays (method 7.5.3), and duloxetine concentration
was 100 µM. Samples were exposed for 4h before further processed. Secondly, I
tested the depletion of duloxetine in a mixture of 6 bacteria (B. longum longum, B.
uniformis, C. bolteae, C. ramosum, C. saccharolyticum, F. nucleatum). For this
resting cell assay PBS buffer was supplemented with 1 mM MgCl2 and pH was
adjusted to 6.5 using 1 M HCl. For the bacteria mix, bacteria were grown to end of
exponential phase/beginning of stationary phase before preparing the resting cell
assay. For this cells were diluted and mixed in the same ratio at a final OD578 of
3.75 before exposed to experimental conditions of 1 mM duloxetine for 4h and
further processed.
All experiments were resting cell assays (see Methods 7.5.3) with duloxetine
or respective amount of DMSO in control, comparing bacteria treated with
duloxetine to bacteria not treated with duloxetine and a bacteria-free control
containing only duloxetine. To record a one-dimensional proton spectrum of
duloxetine, proton containing water molecules, which make up almost 100% of
the sample, need to be replaced by deuterated, heavy water with no protons. After
drying in a speedvac (Eppendorf Vacuum Concentrator Plus), all samples were
reconstituted in a mixture of 80% D2O and 20% deuterated acetonitrile with half
the original volume, thus doubling the concentration. 1D proton NMR spectra for
all samples were then recorded on a 500 MHz Bruker DRX at 27 degrees or
equivalent.

144
7.7 Untargeted Metabolomics with LC-MS/MS
7.7.1 Experimental setup
I tested the depletion of duloxetine and change in the metabolome of
Clostridium saccharolyticum and Bacteroides uniformis upon addition of the drug.
Bacteria from a 20 mL overnight culture were washed and prepared for a resting
cell and lysate assay as described in the method section 7.5.3. For the resting cell
assay bacteria were reconstituted in 3.6 mL PBS, pH 6.5 containing 1 mM MgCl2,
sample volume was 600 µl. For the lysate assay, bacteria were reconstituted in 1
mL PBS, lysed, and then 360 µl of the recovered lysate was diluted with 1080 µl
PBS. Thus, finale sample volume for each lysate replicate was 240 µl. Resting cells
were incubated for 2h, lysates were incubated for 30 min with duloxetine or with
DMSO as control respectively. As another control, buffer with duloxetine was
incubated for the respective time in the respective sample volume. Duloxetine
concentration was 1 mM for both assay, and all interactions were tested in
triplicates. Extraction buffer contained 10 µM amitriptyline as internal standard,
and all extractions were indirect, meaning cells/lysate was centrifuged (14.000
rpm, 10 min, 4°C) and only the supernatant was extracted. Resting cell samples
were reconstituted in 225 µl reconstitution buffer, doubling the respective
concentration of small molecules in comparison to the original sample. Lysate
samples were reconstituted in 187.5 µl, concentration in comparison to the
original culture remained constant.
7.7.2 Mass spectrometry method
Samples were measured on a Q Exactive Plus-Orbitrap Mass Spectrometer
(Thermo Fisher) in positive mode using a Kinetex C18 column for LC. The LC
method used was 35 min long, and used acetonitrile and 5 mM formic acid as
liquid phase. Gradient were. Injection volume was 5 µl, samples were injected in
three rounds representing three technical replicates including washing injection
every ten injections.

145
Scan mode was FTMS + p ESI Full ms and scan range was from 60-800 m/z.
Resolution was set to 70.000, AGC target to 1.000.000 ions, maximum IT to 150
ms. For secondary MS resolution was set to 17.500, AGC target to 100.000 ions,
and maximum IT to 60 ms, allowing 5 secondary scans ranging from 200-2000
m/z per full scan at a collision energy of 35. In any case unknown charges or
charges higher than 2 were excluded from analysis.
7.7.3 Data analysis
Data analysis was aimed at comparing the two bacteria C. saccharolyticum and
B. uniformis in two different experimental condition and trying to investigate if a
potential drug metabolite is generated in the presence of bacteria and drug. After
no potential drug metabolite could be isolated, data analysis switched to
identifying mass features.
Raw data was converted from ThermoFisher .raw format into the open
mzXML format using RawConverter program (He et al. 2015). For feature
selection, peak alignment, grouping and retention time shift correction from the
raw data the XCMS R package was used. Parameters for first round of density
grouping of peaks were bw=30, minfrac=0.5, minsamp=3, mzwid=0.025, max=50.
For retention time correction parameters were family="symmetric",
plottype="mdevden"; Lysates were corrected with span = .4 instead of default
value. For second round of grouping parameters were bw=10, minfrac=0.5,
minsamp=3, mzwid=0.025, max=50. Then missing peaks were filled using
“chrom” method. Samples for lysate and extracellular fraction have been
processed independently. One technical injection replicate was excluded as strong
difference to other two injections was observed, potentially based on less washing
injections between sample injection. Thus, following statistical analysis was based
on three biological replicates with two technical replicates each.
Statistical analysis was loosely based on Vinaixa et al. 2012 and Ortmayr et al.
2017. Vinaixa et al. describe a general approach how to analyze untargeted
metabolomics data focusing on statistical pitfalls and general workflow. Ortmayr
et al. describe an alternative approach to the common Student’s t-test or variance

146
analysis approach, taking the uncertainty in fold change calculation into account.
All data analysis and scripting was done in R.
Using PATHOS (Leader et al. 2011) or other tools like MBROLE (Lopez-
Ibanez et al. 2016) for data exploration comparisons to databases like METLIN
(Smith et al. 2005), Biocyc (Caspi et al. 2016) or KEGG (Tanabe & Kanehisa 2012)
were based on 5ppm accuracy. As reference/background, C. saccharolyticum or B.
uniformis was used if possible. Otherwise C. saccharobutilyticum or B.
thetaiotaomicron was used respectively. If none of the options were given for data
comparison, E. coli was used. For KEGG pathway enrichment using PATHOS I
allowed all 12 ACN or H adducts to be formed, and compared to E. coli as a
background for statistical tests (Fisher’s exact test). I further analyzed the data by
annotating the mass features with species-specific metabolites. Data was kindly
provided by Daniel Sevin (Cellzome). He generated lists of species-specific
metabolites by building genome-scale models for all organisms available in
KEGG, and predicting their potential metabolome from the model. For adduct-
formation I used a stricter cutoff as with PATHOS, only allowing H+ and
ACN+H+ adducts to be formed to annotate a mass with its potential KEGG
metabolite.
7.8 Proteomics
7.8.1 Sample preparation
For the identification of recovered proteins by mass spectrometry, protein
eluates were rebuffered into 4 M urea/0.2% rapigest (final concentration) and
sonicated in a vial tweeter (Hielscher) for two times 30 seconds (100%/0.5 seconds
cycle). Disulfide bridges between cysteins were disrupted by reduction with 10
mM DTT at 37 C for 30 minutes. Following that, free cysteins were alkylated
using 15 mM iodoacetamide at room temperature in the dark for 30 minutes.
Protein digestion was performed using 1:100 (w/w) Lys-C endoproteinase (Wako
Chemicals GmbH, Germany) at 37 °C for 4 hours and then finalized (after the
urea concentration was diluted to 1.6 M) with 1:50 (w/w) trypsin (Promega

147
GmbH, Germany) at 37 °C over night. Rapigest was cleaved by acidification below
pH=3 using 10% (v/v) TFA at room temperature for 30 minutes and removed by
desalting of the peptide mixture using C18 spin columns (Harvard Apparatus,
USA) according to the manufacturers procedures. Desalted peptides were vacuum
dried and stored at -20 C until further use.
7.8.2 Mass spectrometry method and protein identification
For shot-gun experiments, samples were analyzed using a nanoAcquity UPLC
system (Waters GmbH) connected online to a LTQ-Orbitrap Velos Pro
instrument (Thermo Fisher Scientific GmbH). Peptides were separated on a
BEH300 C18 (75 µm x 250 mm, 1.7 µm) nanoAcquity UPLC column (Waters
GmbH) using a stepwise 90 min gradient between 3 and 85% (v/v) ACN in 0.1%
(v/v) FA. Data acquisition was performed by collision-induced dissociation using
a TOP-20 strategy with standard parameters. Charge states 1 and unknown were
rejected.
For the quantitative label-free analysis, raw files from the Orbitrap were
analyzed using MaxQuant (version 1.5.3.28) (Cox & Mann 2008). MS/MS spectra
were searched against the Clostridium saccharolyticum (strain ATCC 35040 /
DSM 2544 / NRCC 2533 / WM1) entries of the Uniprot KB (database release
2016_04, 7212 entries) using the Andromeda search engine (Cox et al. 2011).
The search criteria were set as follows: full tryptic specificity was required
(cleavage after lysine or arginine residues, unless followed by proline); 2 missed
cleavages were allowed; carbamidomethylation (C) was set as fixed modification;
oxidation (M) and acetylation (protein N-term) were applied as variable
modifications, if applicable; mass tolerance of 20 ppm (precursor) and 0.5 Da
(fragments). The reversed sequences of the target database were used as decoy
database. Peptide and protein hits were filtered at a false discovery rate of 1%
using a target-decoy strategy (Elias & Gygi 2007). Additionally, only proteins
identified by at least 2 unique peptides were retained. Only proteins identified in

148
at least 2 replicates were considered when comparing protein abundances between
control and drug treatment.
7.8.3 Data analysis
To reduce technical variation, data was quantile-normalized using the
preprocessCore library (Gentleman et al. 2004). Protein differential expression
was evaluated using the limma package. Differences in protein abundances were
statistically determined using the Student’s t-test moderated by Benjamini-
Hochberg’s method (Benjamini & Hochberg 1995) at alpha level of 0.05.
Significant regulated proteins were defined by a cut-off of log2 fold change ≥ 2
and p-value ≤ 0.1.
For gene ontology term and pathway enrichment analysis, significantly
changed proteins were annotated using Blast2GO (Conesa et al. 2005) with default
parameters using the NCBI blast search. GO term enrichment can be done within
Blast2GO and significantly enriched (FDR corrected p-value<0.05) most specific
GO terms were listed. For KEGG pathway enrichment analysis EC numbers from
Blast2Go annotation were extracted and the EC2KEGG tool (Porollo 2014) was
used to annotate respective species specific KEGG pathways and perform
enrichment analysis (uncorrected p-value < 0.05).

149
References
Abubucker, S. et al., 2012. Metabolic reconstruction for metagenomic data and its application to the human microbiome. PLoS Comput. Biol., 8(6), p.e1002358.
Alang, N. & Kelly, C.R., 2015. Weight Gain After Fecal Microbiota Transplantation. Open Forum Infectious Diseases, 2(1), p.ofv004-ofv004.
Allison, K., Brynildsen, M. & Collins, J., 2011. Metabolite-enabled eradication of bacterial persisters by aminoglycosides. Nature, 473(7346), pp.216–220.
Alonso, A., Marsal, S. & Julià, A., 2015. Analytical methods in untargeted metabolomics: state of the art in 2015. Frontiers in bioengineering and biotechnology, 3(March), p.23.
Aura, A.-M. et al., 2011. Drug metabolome of the simvastatin formed by human intestinal microbiota in vitro. Molecular bioSystems, 7(2), pp.437–446.
Ayaz, M. et al., 2015. Sertraline enhances the activity of antimicrobial agents against pathogens of clinical relevance. Journal of biological research (Thessalonike, Greece), 22(1), p.4.
Azad Khan, A.K. et al., 1983. Tissue and bacterial splitting of sulphasalazine. Clin. Sci., 64(3), pp.349–54.
B-Rao, C. et al., 2012. Identification of novel isocytosine derivatives as xanthine oxidase inhibitors from a set of virtual screening hits. Bioorganic and Medicinal Chemistry, 20(9), pp.2930–2939.
Bahr, S.M. et al., 2015. Use of the second-generation antipsychotic, risperidone, and secondary weight gain are associated with an altered gut microbiota in children. Translational Psychiatry, 5(9), p.e652.
Bahra, S.M. et al., 2015. Risperidone-induced weight gain is mediated through shifts in the gut microbiome and suppression of energy expenditure. EBioMedicine, 2(11), pp.1725–34.
Balani, S.K. et al., 1997. Metabolic profiles of montelukast sodium (singulair), a potent cysteinyl leukotriene1 receptor antagonist, in human plasma and bile. Drug Metabolism and Disposition, 25(11), pp.1282–1287.
Basit, A.W. & Lacey, L.F., 2001. Colonic metabolism of ranitidine: implications for its delivery and absorption. International journal of pharmaceutics, 227(1–2), pp.157–65.
Belenky, P. et al., 2015. Bactericidal Antibiotics Induce Toxic Metabolic Perturbations that Lead to Cellular Damage. Cell Reports, 13(5), pp.968–980.
Benjamini, Y. & Hochberg, Y., 1995. Controlling the False Discovery Rate: A Practical and Powerful Approach to Multiple Testing. Journal of the Royal Statistical Society. Series B (Methodological), 57(1), pp.289–300.
Bennett, B.D. et al., 2009. Absolute metabolite concentrations and implied enzyme active site occupancy in Escherichia coli. Nature chemical biology, 5(8), pp.593–599.
Bento, A.P. et al., 2014. The ChEMBL bioactivity database: An update. Nucleic Acids Research, 42(D1).

150
Berger, M., Gray, J.A. & Roth, B.L., 2009. The expanded biology of serotonin. Annual Review of Medicine, 60(August 2016), pp.355–366.
Björkholm, B. et al., 2009. Intestinal microbiota regulate xenobiotic metabolism in the liver. PloS One, 4(9), p.e6958.
Blaser, M. et al., 2013. The microbiome explored: recent insights and future challenges. Nat. Rev. Microbiol., 11(3), pp.213–7.
Bohnert, J.A. et al., 2011. Efflux inhibition by selective serotonin reuptake inhibitors in Escherichia coli. The Journal of antimicrobial chemotherapy, 66(9), pp.2057–60.
Booijink, C.C.G.M. et al., 2010. Metatranscriptome analysis of the human fecal microbiota reveals subject-specific expression profiles, with genes encoding proteins involved in carbohydrate metabolism being dominantly expressed. Appl. Environ. Microbiol., 76(16), pp.5533–40.
Booth, S.C., Weljie, A.M. & Turner, R.J., 2013. Computational Tools for the Secondary Analysis of Metabolomics Experiments. Computational and Structural Biotechnology Journal, 4(5), pp.1–13.
Brandt, K. & Müller, V., 2015. Hybrid rotors in F1Fo ATP synthases: subunit composition, distribution, and physiological significance. Biological Chemistry, 396(9–10), pp.1031–42.
Brandt, U., 2006. Energy converting NADH:quinone oxidoreductase (complex I). Annual Review of Biochemistry, 75(Complex I), pp.69–92.
Burris, K.D. et al., 2002. Aripiprazole, a novel antipsychotic, is a high-affinity partial agonist at human dopamine D2 receptors. The Journal of pharmacology and experimental therapeutics, 302(1), pp.381–389.
Cai, J. et al., 2015. The Anti-Oxidant Drug Tempol Promotes Functional Metabolic Changes in the Gut Microbiota. Journal of proteome research, 15(2), pp.563–71.
Caporaso, J.G. et al., 2011. An Introduction to Illumina Next-Generation Sequencing Technology for Microbiologists Welcome to Next-Generation Sequencing. Proc Natl Acad Sci U S A., (108), pp.4516–4522.
Carmody, R.N. & Turnbaugh, P.J., 2014. Host-microbial interactions in the metabolism of therapeutic and diet-derived xenobiotics. The Journal of clinical investigation, 124(10), pp.4173–81.
Caspi, R. et al., 2016. The MetaCyc database of metabolic pathways and enzymes and the BioCyc collection of pathway/genome databases. Nucleic Acids Research, 44(D1), pp.D471–D480.
Catry, E. et al., 2015. Ezetimibe and simvastatin modulate gut microbiota and expression of genes related to cholesterol metabolism. Life Sciences, 132, pp.77–84.
Cecil, A. et al., 2011. Modeling antibiotic and cytotoxic effects of the dimeric isoquinoline IQ-143 on metabolism and its regulation in Staphylococcus aureus, Staphylococcus epidermidis and human cells. Genome biology, 12(3), p.R24.
Chhabra, R.S., 1979. Intestinal absorption and metabolism of xenobiotics. Environ Health Perspect., 33, pp.61–9.
Chiu, H.-C., Levy, R. & Borenstein, E., 2014. Emergent Biosynthetic Capacity in

151
Simple Microbial Communities C. A. Ouzounis, ed. PLoS Computational Biology, 10(7), p.e1003695.
Cimperman, L. et al., 2011. A randomized, double-blind, placebo-controlled pilot study of Lactobacillus reuteri ATCC 55730 for the prevention of antibiotic-associated diarrhea in hospitalized adults. J. Clin. Gastroenterol., 45(9), pp.785–9.
Clarke, G. et al., 2014. Minireview: Gut Microbiota: The Neglected Endocrine Organ. Molecular Endocrinology, 28(8), pp.1221–1238.
Claus, S.P.S. et al., 2011. Colonization-induced host-gut microbial metabolic interaction. MBio, 2(2), p.8.
Clayton, T.A. et al., 2006. Pharmaco-metabonomic phenotyping and personalized drug treatment. Nature, 440(7087), pp.1073–7.
Clayton, T.A. et al., 2009. Pharmacometabonomic identification of a significant host-microbiome metabolic interaction affecting human drug metabolism. Proc. Natl. Acad. Sci. U.S.A., 106(34), pp.14728–33.
Collins, S.M. & Bercik, P., 2009. The Relationship Between Intestinal Microbiota and the Central Nervous System in Normal Gastrointestinal Function and Disease. Gastroenterology, 136(6), pp.2003–2014.
Conesa, A. et al., 2005. Blast2GO: A universal tool for annotation, visualization and analysis in functional genomics research. Bioinformatics, 21(18), pp.3674–3676.
Costello, E. & Stagaman, K., 2012. The application of ecological theory toward an understanding of the human microbiome. Science, 336(6086), pp.1255–1262.
Coughlan, M.P., 1980. Aldehyde Oxidase, Xanthine Oxidase and Xanthine Dehydrogenase. In M. P. Coughlan, ed. Molybdenum and Molybdenum-Containing Enzymes. Pergamon Press, pp. 139–140.
Cox, J. et al., 2011. Andromeda: A peptide search engine integrated into the MaxQuant environment. Journal of Proteome Research, 10(4), pp.1794–1805.
Cox, J. & Mann, M., 2008. MaxQuant enables high peptide identification rates, individualized p.p.b.-range mass accuracies and proteome-wide protein quantification. Nature biotechnology, 26(12), pp.1367–72.
Czyż, D.M. et al., 2014. Host-directed antimicrobial drugs with broad-spectrum efficacy against intracellular bacterial pathogens. mBio, 5(4), pp.e01534–e01514.
Das, A. et al., 2016. Xenobiotic metabolism and gut microbiomes. PLoS ONE, 11(10), p.e0163099.
Davey, K.J. et al., 2013. Antipsychotics and the gut microbiome: olanzapine-induced metabolic dysfunction is attenuated by antibiotic administration in the rat. Translational psychiatry, 3, p.e309.
Delcour, A.H., 2009. Outer membrane permeability and antibiotic resistance. Biochimica et biophysica acta, 1794(5), pp.808–16.
Dent, R. et al., 2012. Changes in body weight and psychotropic drugs: A systematic synthesis of the literature S. Alessi-Severini, ed. PLoS ONE, 7(6), p.e36889.
Deris, Z.Z. et al., 2014. A secondary mode of action of polymyxins against Gram-negative bacteria involves the inhibition of NADH-quinone oxidoreductase

152
activity. The Journal of Antibiotics, 67(2), pp.147–151. Dimitrov, A., 2014. Plotly graphs in IPython Notebook. Undocumented Matlab.
Available at: http://undocumentedmatlab.com/blog/plotly-graphs-in-ipython-notebook.
Donaldson, G.P., Lee, S.M. & Mazmanian, S.K., 2015. Gut biogeography of the bacterial microbiota. Nature Reviews Microbiology, 14(1).
Dragosits, M. & Mattanovich, D., 2013. Adaptive laboratory evolution--principles and applications for biotechnology. Microbial cell factories, 12(1), p.64.
Dunne, C., 2001. Adaptation of bacteria to the intestinal niche: probiotics and gut disorder. Inflamm. Bowel Dis., 7(2), pp.136–45.
Durre, P. & Andreesen, J.R., 1983. Purine and glycine metabolism by purinolytic clostridia. Journal of Bacteriology, 154(1), pp.192–199.
van Duynhoven, J. et al., 2011. Metabolic fate of polyphenols in the human superorganism. Proc. Natl. Acad. Sci. U.S.A., 108 Suppl, pp.4531–8.
Dykens, J.A. et al., 2008. In vitro assessment of mitochondrial dysfunction and cytotoxicity of nefazodone, trazodone, and buspirone. Toxicological Sciences, 103(2), pp.335–345.
Edgar, R.C., 2010. Search and clustering orders of magnitude faster than BLAST. Bioinformatics, 26(19), pp.2460–2461.
Ejim, L. et al., 2011. Combinations of antibiotics and nonantibiotic drugs enhance antimicrobial efficacy. Nature chemical biology, 7(6), pp.348–50.
Ekins, S., 2004. Predicting undesirable drug interactions with promiscuous proteins in silico. Drug Discov. Today, 9(6), pp.276–85.
Elias, J.E. & Gygi, S.P., 2007. Target-decoy search strategy for increased confidence in large-scale protein identifications by mass spectrometry. Nature Methods, 4(3), pp.207–214.
Falcony, G. et al., 2016. Population-level analysis of gut microbiome variation. Science, 352(6285), pp.560–564.
Fato, R. et al., 2008. Mitochondrial production of reactive oxygen species: role of complex I and quinone analogues. BioFactors (Oxford, England), 32(1–4), pp.31–39.
FDA, 1997. FDA Pharmacology Review for Montelukast (Singulair), Finley, S., Broadbelt, L. & Hatzimanikatis, V., 2009. Computational framework for
predictive biodegradation. Biotechnology & genetic engineering reviews, 104(6), pp.1086–1097.
Forslund, K. et al., 2015. Disentangling type 2 diabetes and metformin treatment signatures in the human gut microbiota. Nature, 528(7581), pp.262–266.
Foster, J.A. & McVey Neufeld, K.-A., 2013. Gut-brain axis: how the microbiome influences anxiety and depression. Trends in neurosciences, 36(5), pp.305–12.
de Freitas, M.C.R. et al., 2016. Exploratory Investigation of Bacteroides fragilis Transcriptional Response during In vitro Exposure to Subinhibitory Concentration of Metronidazole. Frontiers in microbiology, 7, p.1465.
Fuhrer, T. & Zamboni, N., 2015. High-throughput discovery metabolomics. Current Opinion in Biotechnology, 31, pp.73–78.
Gad, S.C. ed., 2007. Toxicology of the Gastrointestinal Tract, CRC Press. Gao, J., Ellis, L.B.M. & Wackett, L.P., 2011. The University of Minnesota Pathway

153
Prediction System: multi-level prediction and visualization. Nucleic Acids Res., 39(Web Server issue), pp.W406-11.
Gatehouse, D., 2012. Bacterial mutagenicity assays: Test methods. Methods in Molecular Biology, 817, pp.21–34.
Gauffin Cano, P. et al., 2012. Bacteroides uniformis CECT 7771 ameliorates metabolic and immunological dysfunction in mice with high-fat-diet induced obesity. PLoS ONE, 7(7).
Gentleman, R.C. et al., 2004. Bioconductor: open software development for computational biology and bioinformatics. Genome Biology, 5(10), p.R80.
Goldman, P., Peppercorn, M.A. & Goldin, B.R., 1974. Metabolism of drugs by microorganisms in the intestine. Am. J. Clin. Nutr., 27(11), pp.1348–55.
Goodman, A.L. et al., 2011. Extensive personal human gut microbiota culture collections characterized and manipulated in gnotobiotic mice. Proceedings of the National Academy of Sciences of the United States of America, 108(15), pp.6252–7.
Gu, Q. et al., 2014. Prescription Cholesterol-lowering Medication Use in Adults Aged 40 and Over: United States, 2003–2012 Key findings Data from the National Health and Nutrition Examination Survey. NCHS Data Brief, 177.
Guo, A.C. et al., 2013. ECMDB: The E. coli Metabolome Database. Nucleic Acids Research, 41(D1).
Haddock, B.A. & Jones, C.W., 1977. Bacterial respiration. Bacteriological reviews, 41(1), pp.47–99.
Haiser, H.J. et al., 2014. Mechanistic insight into digoxin inactivation by Eggerthella lenta augments our understanding of its pharmacokinetics. Gut microbes, 5(2), pp.233–8.
Haiser, H.J. et al., 2013. Predicting and manipulating cardiac drug inactivation by the human gut bacterium Eggerthella lenta. Science, 341(6143), pp.295–8.
Haiser, H.J. & Turnbaugh, P.J., 2013. Developing a metagenomic view of xenobiotic metabolism. Pharmacol. Res., 69(1), pp.21–31.
Hansen, J. & Bross, P., 2010. A Cellular Viability Assay to Monitor Drug Toxicity. In Methods in molecular biology (Clifton, N.J.). pp. 303–311.
Hanukoglu, I., 2015. Proteopedia: Rossmann fold: A beta-alpha-beta fold at dinucleotide binding sites. Biochemistry and Molecular Biology Education, 43(3), pp.206–209.
Hao, W.-L. & Lee, Y.-K., 2004. Microflora of the gastrointestinal tract: a review. Methods Mol. Biol., 268, pp.491–502.
Hashim, H. et al., 2014. Eradication of Helicobacter pylori Infection Improves Levodopa Action, Clinical Symptoms and Quality of Life in Patients with Parkinson’s Disease T. M. Doherty, ed. PLoS ONE, 9(11), p.e112330.
He, L. et al., 2015. Extracting Accurate Precursor Information for Tandem Mass Spectra by RawConverter. Analytical Chemistry, 87(22), pp.11361–11367.
Heijtz, R., Wang, S. & Anuar, F., 2011. Normal gut microbiota modulates brain development and behavior. Proceedings of the …, 108(7), pp.3047–3052.
Hibbing, M.E. et al., 2010. Bacterial competition: surviving and thriving in the microbial jungle. Nature reviews. Microbiology, 8(1), pp.15–25.
Hickson, M., 2011. Probiotics in the prevention of antibiotic-associated diarrhoea

154
and Clostridium difficile infection. Therap Adv Gastroenterol, 4(3), pp.185–97.
Hoerr, V. et al., 2016. Characterization and prediction of the mechanism of action of antibiotics through NMR metabolomics. BMC Microbiology, 16(1), p.82.
Holzhütter, H.-G. et al., 2012. The virtual liver: a multidisciplinary, multilevel challenge for systems biology. Wiley Interdiscip Rev Syst Biol Med, 4(3), pp.221–35.
Hooper, L., Littman, D. & Macpherson, A., 2012. Interactions between the microbiota and the immune system. Science, 336(6086), pp.1268–1273.
Human Microbiome Project Consortium., 2012. Structure, function and diversity of the healthy human microbiome. Nature, 486(7402), pp.207–14.
Jackson, M.A. et al., 2016. Proton pump inhibitors alter the composition of the gut microbiota. Gut, 65(5), pp.749–56.
Jacobs, D.M. et al., 2008. (1)H NMR metabolite profiling of feces as a tool to assess the impact of nutrition on the human microbiome. NMR Biomed, 21(6), pp.615–26.
Jakoby, W.B. & Ziegler, D.M., 1990. The enzymes of detoxication. J. Biol. Chem., 265(34), pp.20715–8.
Jeyaseeli, L. et al., 2006. Antimicrobial potentiality of the thioxanthene flupenthixol through extensive in vitro and in vivo experiments. International Journal of Antimicrobial Agents, 27(1), pp.58–62.
Jeyaseeli, L. et al., 2012. Evidence of significant synergism between antibiotics and the antipsychotic, antimicrobial drug flupenthixol. European Journal of Clinical Microbiology & Infectious Diseases, 31(6), pp.1243–1250.
Jiang, H. et al., 2015. Altered fecal microbiota composition in patients with major depressive disorder. Brain, behavior, and immunity.
Johnson, C.H. et al., 2012. Xenobiotic metabolomics: major impact on the metabolome. Annu. Rev. Pharmacol. Toxicol., 52, pp.37–56.
Kalaycı, S., Demirci, S. & Sahin, F., 2015. Antimicrobial Properties of Various Psychotropic Drugs Against Broad Range Microorganisms. Current Psychopharmacology, 3(3), pp.195–202.
Kaminsky, L.S. & Zhang, Q.-Y., 2003. The small intestine as a xenobiotic-metabolizing organ. Drug Metab Dispos., 31(12), pp.1520–5.
Kanehisa, M. et al., 2014. Data, information, knowledge and principle: back to metabolism in KEGG. Nucleic acids research, 42(Database issue), pp.D199-205.
Kanehisa, M. et al., 2012. KEGG for integration and interpretation of large-scale molecular data sets. Nucleic Acids Res., 40(Database issue), pp.D109-14.
Kang, A. et al., 2013. Systems-level characterization and engineering of oxidative stress tolerance in Escherichia coli under anaerobic conditions. Molecular bioSystems, 9(2), pp.285–95.
Kaufman, J. & Griffiths, T., 2009. Effects of mesalamine (5â€!aminosalicylic acid) on bacterial gene expression. Inflammatory bowel …, 15(7), pp.985–996.
Kelly, J.R. et al., 2015. Breaking down the barriers: the gut microbiome, intestinal permeability and stress-related psychiatric disorders. Frontiers in cellular neuroscience, 9, p.392.

155
Khersonsky, O. & Tawfik, D.S., 2010. Enzyme promiscuity: a mechanistic and evolutionary perspective. Annu. Rev. Biochem., 79, pp.471–505.
Khoury, P. et al., 2006. Effect of montelukast on bacterial sinusitis in allergic mice. Annals of allergy, asthma & immunology!: official publication of the American College of Allergy, Asthma, & Immunology, 97(3), pp.329–35.
Klaassen, C.D. & Cui, J.Y., 2015. Review: Mechanisms of How the Intestinal Microbiota Alters the Effects of Drugs and Bile Acids. Drug metabolism and disposition: the biological fate of chemicals, 43(10), pp.1505–21.
Klünemann, M., Schmid, M. & Patil, K.R., 2014. Computational tools for modeling xenometabolism of the human gut microbiota. Trends in biotechnology, 32(3), pp.157–65.
Kojima, T. et al., 1984. Biochemical studies on the purine metabolism of four cases with hereditary xanthinuria. Clinica chimica acta; international journal of clinical chemistry, 137(2), pp.189–98.
Kolmeder, C.A. et al., 2012. Comparative metaproteomics and diversity analysis of human intestinal microbiota testifies for its temporal stability and expression of core functions. PLoS ONE, 7(1), p.e29913.
Koppel, N. & Balskus, E.P., 2016. Exploring and Understanding the Biochemical Diversity of the Human Microbiota. Cell Chemical Biology, 23(1), pp.18–30.
Kristiansen, J.E. & Amaral, L., 1997. The potential management of resistant infections with non-antibiotics. Journal of Antimicrobial Chemotherapy, 40(3), pp.319–327.
Kuhn, M. et al., 2010. A side effect resource to capture phenotypic effects of drugs. Molecular systems biology, 6, p.343.
Kuhn, M. et al., 2016. The SIDER database of drugs and side effects. Nucleic Acids Research, 44(D1), pp.D1075–D1079.
Kuo, F. et al., 2004. Synthesis and biological activity of some known and putative duloxetine metabolites. Bioorganic and Medicinal Chemistry Letters, 14(13), pp.3481–3486.
Lantz, R.J. et al., 2003. Metabolism, excretion, and pharmacokinetics of duloxetine in healthy human subjects. Drug Metabolism and Disposition, 31(9), pp.1142–1150.
Law, V. et al., 2014. DrugBank 4.0: Shedding new light on drug metabolism. Nucleic Acids Research, 42(D1).
Lawrence, D. et al., 2012. Species interactions alter evolutionary responses to a novel environment. PLoS biology, 10(5), p.e1001330.
Leader, D.P. et al., 2011. Pathos: A web facility that uses metabolic maps to display experimental changes in metabolites identified by mass spectrometry. Rapid Communications in Mass Spectrometry, 25(22), pp.3422–3426.
Lee, H. et al., 2010. Bacterial charity work leads to population-wide resistance. Nature, 467(7311), pp.82–85.
Lenski, R.E. et al., 1991. Long-Term Experimental Evolution in Escherichia coli . I . Adaptation and Divergence During. The American Naturalist, 138, pp.1315–1341.
Li, H. et al., 2013. Shifting Species Interaction in Soil Microbial Community and Its Influence on Ecosystem Functions Modulating. Microbial Ecology, 65(3),

156
pp.700–708. Li, H. et al., 2015. The outer mucus layer hosts a distinct intestinal microbial
niche. Nature communications, 6(May), p.8292. Li, J. et al., 2014. An integrated catalog of reference genes in the human gut
microbiome. Nat Biotech, advance on(8), pp.834–41. Liu, M. et al., 2014. Developments of mucus penetrating nanoparticles. Asian
Journal of Pharmaceutical Sciences, 10(4), pp.275–282. Lopez-Ibanez, J., Pazos, F. & Chagoyen, M., 2016. MBROLE 2.0-functional
enrichment of chemical compounds. Nucleic Acids Research, 44(W1), pp.W201–W204.
Maestre, F.T. et al., 2009. Refining the stress-gradient hypothesis for competition and facilitation in plant communities. Journal of Ecology, 97(2), pp.199–205.
Mahieu, N.G., Genenbacher, J.L. & Patti, G.J., 2016. A roadmap for the XCMS family of software solutions in metabolomics. Current Opinion in Chemical Biology, 30, pp.87–93.
Mahmood, S. et al., 2015. Detoxification of azo dyes by bacterial oxidoreductase enzymes. Critical Reviews in Biotechnology, 36(4), pp.1–13.
Malkinson, D. & Tielbörger, K., 2010. What does the stress-gradient hypothesis predict? Resolving the discrepancies. Oikos, 119(10), pp.1546–1552.
Martin, M., 2011. Cutadapt removes adapter sequences from high-throughput sequencing reads. EMBnet.journal, 17(1), pp.10–12.
Martin, M. et al., 2016. Laboratory evolution of microbial interactions in bacterial biofilms. Journal of Bacteriology, 198(19), pp.2564–2571.
Maurice, C.F., Haiser, H.J. & Turnbaugh, P.J., 2013. Xenobiotics shape the physiology and gene expression of the active human gut microbiome. Cell, 152(1–2), pp.39–50.
Meckenstock, R.U. et al., 2016. Anaerobic degradation of benzene and polycyclic aromatic hydrocarbons. Journal of Molecular Microbiology and Biotechnology, 26(1–3), pp.92–118.
Meckenstock, R.U. & Mouttaki, H., 2011. Anaerobic degradation of non-substituted aromatic hydrocarbons. Current Opinion in Biotechnology, 22(3), pp.406–414.
Mihelcic, J.R. & Luthy, R.G., 1988. Degradation of polycyclic aromatic hydrocarbon compounds under various redox conditions in soil-water systems. Applied and Environmental Microbiology, 54(5), pp.1182–1187.
Minato, Y. et al., 2014. Roles of the sodium-translocating NADH:Quinone oxidoreductase (Na +-NQR) on Vibrio cholerae metabolism, motility and osmotic stress resistance J. H. Weiner, ed. PLoS ONE, 9(5), p.e97083.
Morgan, A.P. et al., 2014. The Antipsychotic Olanzapine Interacts with the Gut Microbiome to Cause Weight Gain in Mouse M. M. Heimesaat, ed. PLoS ONE, 9(12), p.e115225.
Mortelmans, K. & Zeiger, E., 2000. The Ames Salmonella/microsome mutagenicity assay. Mutation Research - Fundamental and Molecular Mechanisms of Mutagenesis, 455(1–2), pp.29–60.
Moses, V. & Sharp, P.B., 1972. Intermediary Metabolite Levels in Escherichia coli. Microbiology, 71(1), pp.181–190.

157
Mouttaki, H., Johannes, J.J. & Meckenstock, R.U., 2012. Identification of naphthalene carboxylase as a prototype for the anaerobic activation of non-substituted aromatic hydrocarbons. Environmental Microbiology, 14(10), pp.2770–2774.
Munoz-Bellido, J.., Munoz-Criado, S. & Garcıa-Rodrıguez, J.., 2000. Antimicrobial activity of psychotropic drugs: Selective serotonin reuptake inhibitors. International Journal of Antimicrobial Agents, 14(3), pp.177–180.
Musso, G., Gambino, R. & Cassader, M., 2011. Interactions between gut microbiota and host metabolism predisposing to obesity and diabetes. Annual review of medicine, 62(1), pp.361–80.
Nguyen, D. et al., 2011. Active starvation responses mediate antibiotic tolerance in biofilms and nutrient-limited bacteria. Science (New York, N.Y.), 334(6058), pp.982–6.
Nichols, R.G. et al., 2016. Omics Approaches To Probe Microbiota and Drug Metabolism Interactions. Chemical Research in Toxicology, p.acs.chemrestox.6b00236.
Nicholson, J., 2002. Understanding’global’systems biology: metabonomics and the continuum of metabolism. Nat Rev Drug Discov, 2(8), pp.668–676.
Niehues, M. & Hensel, A., 2009. In-vitro interaction of L-dopa with bacterial adhesins of <I>Helicobacter pylori:</I> an explanation for clinicial differences in bioavailability? Journal of Pharmacy and Pharmacology, 61(10), pp.1303–1307.
Nikaido, H., 1996. Multidrug efflux pumps of gram-negative bacteria. Journal of bacteriology, 178(20), pp.5853–9.
O’Mahony, S.M. et al., 2015. Serotonin, tryptophan metabolism and the brain-gut-microbiome axis. Behavioural Brain Research, 277, pp.32–48.
Oguri, K., 1994. Regiochemistry of Cytochrome P450 Isozymes. Annu. Rev. Pharmacol. Toxicol., 34(1), pp.251–279.
Ortmayr, K. et al., 2016. Uncertainty budgeting in fold change determination and implications for non-targeted metabolomics studies in model systems. The Analyst.
Otsuka, Y. et al., 2015. GenoBase: comprehensive resource database of Escherichia coli K-12. Nucleic acids research, 43(Database issue), pp.D606-17.
Patterson, A.D. & Turnbaugh, P.J., 2014. Microbial Determinants of Biochemical Individuality and Their Impact on Toxicology and Pharmacology. Cell metabolism, 20(5), pp.761–768.
Penders, J. et al., 2013. The human microbiome as a reservoir of antimicrobial resistance. Frontiers in Microbiology, 4(APR).
Pérez-Cobas, A.E. et al., 2013. Gut microbiota disturbance during antibiotic therapy: a multi-omic approach. Gut, 62(11), pp.1591–601.
Pierantozzi, M. et al., 2006. Helicobacter pylori eradication and L-dopa absorption in patients with PD and motor fluctuations. Neurology, 66(12), pp.1824–1829.
PMLive, 2015. Top 50 pharmaceutical products by global sales. Available at: http://www.pmlive.com/top_pharma_list/Top_50_pharmaceutical_products_by_global_sales [Accessed December 7, 2016].

158
Ponomarova, O. & Patil, K.R., 2015. Metabolic interactions in microbial communities: Untangling the Gordian knot. Current Opinion in Microbiology, 27, pp.37–44.
Porollo, A., 2014. EC2KEGG: a command line tool for comparison of metabolic pathways. Source code for biology and medicine, 9(1), p.19.
Press, B., 2011. Optimization of the Caco-2 permeability assay to screen drug compounds for intestinal absorption and efflux. Methods in Molecular Biology, 763, pp.139–154.
Qin, J. et al., 2010. A human gut microbial gene catalogue established by metagenomic sequencing. Nature, 464(7285), pp.59–65.
Ravcheev, D.A. & Thiele, I., 2016. Genomic analysis of the human gut microbiome suggests novel enzymes involved in quinone biosynthesis. Frontiers in Microbiology, 7(FEB), p.128.
Reaves, M.L. & Rabinowitz, J.D., 2011. Metabolomics in systems microbiology. Current opinion in biotechnology, 22(1), pp.17–25.
Rey, F.E. et al., 2013. Metabolic niche of a prominent sulfate-reducing human gut bacterium. Proc. Natl. Acad. Sci. U.S.A., 110(33), pp.13582–7.
Reyes-Prieto, A., Barquera, B. & Juárez, O., 2014. Origin and evolution of the sodium -pumping NADH: Ubiquinone oxidoreductase G. Greub, ed. PLoS ONE, 9(5), p.e96696.
Ridaura, V. & Belkaid, Y., 2015. Gut Microbiota: The Link to Your Second Brain. Cell, 161(2), pp.193–194.
Riley, M. & Wertz, J., 2002. Bacteriocins: evolution, ecology, and application. Annu. Rev. Microbiol., 56(1), pp.117–37.
Saad, R., Rizkallah, M.R. & Aziz, R.K., 2012. Gut Pharmacomicrobiomics: the tip of an iceberg of complex interactions between drugs and gut-associated microbes. Gut Pathog, 4(1), p.16.
Schmidt, K. et al., 2014. Prebiotic intake reduces the waking cortisol response and alters emotional bias in healthy volunteers. Psychopharmacology.
Schomburg, I. et al., 2013. BRENDA in 2013: integrated reactions, kinetic data, enzyme function data, improved disease classification: new options and contents in BRENDA. Nucleic Acids Res., 41(Database issue), pp.D764-72.
Segata, N. et al., 2013. Computational meta’omics for microbial community studies. Mol. Syst. Biol., 9(666), p.666.
Selwyn, F.P., Cui, J.Y. & Klaassen, C.D., 2015. RNA-seq quantification of hepatic drug processing genes in germ-free mice. Drug Metabolism and Disposition, 43(10), pp.1572–1580.
Sharon, G. et al., 2016. The Central Nervous System and the Gut Microbiome. Cell, 167(4), pp.915–932.
Shu, Y.Z. et al., 1991. Metabolism of levamisole, an anti-colon cancer drug, by human intestinal bacteria. Xenobiotica, 21(6), pp.737–50.
Singer, T.P. & Ramsay, R.R., 1994. The reaction sites of rotenone and ubiquinone with mitochondrial NADH dehydrogenase. BBA - Bioenergetics, 1187(2), pp.198–202.
Sinha, V.R., Kumria, R. & Bhinge, J.R., 2009. Stress degradation studies on duloxetine hydrochloride and development of an RP-HPLC method for its

159
determination in capsule formulation. Journal of chromatographic science, 47(7), pp.589–593.
Smith, C.A. et al., 2005. METLIN A Metabolite Mass Spectral Database. Proceedings of the 9Th International Congress of Therapeutic Drug Monitoring & Clinical Toxicology, 27(6), pp.747–751.
Soni C Banerjee, P.U., 2005. Biotransformations for the production of the chiral drug (S)-Duloxetine catalyzed by a novel isolate of Candida tropicalis. Appl Microbiol Biotechnol, 67, pp.771–777.
Sorg, R.A. et al., 2014. Collective Resistance in Microbial Communities by Intracellular Antibiotic Deactivation. PLOS Biology, 14(12), p.e2000631.
Sousa, T. et al., 2008. The gastrointestinal microbiota as a site for the biotransformation of drugs. Int J Pharm, 363(1–2), pp.1–25.
Sowada, J. et al., 2014. Degradation of benzo[a]pyrene by bacterial isolates from human skin. FEMS microbiology ecology, 88(1), pp.129–39.
Spanogiannopoulos, P. et al., 2016. The microbial pharmacists within us: a metagenomic view of xenobiotic metabolism. Nature Reviews Microbiology, 14(5).
Stadie, J. et al., 2013. Metabolic activity and symbiotic interactions of lactic acid bacteria and yeasts isolated from water kefir. Food Microbiology, 35(2), pp.92–98.
Sun, R. et al., 2016. Orally administered berberine modulates hepatic lipid metabolism by altering microbial bile acid metabolism and the intestinal FXR signaling pathway. Molecular Pharmacology.
Swanson, H.I., 2015. Drug Metabolism by the Host and Gut Microbiota: A Partnership or Rivalry? Drug metabolism and disposition: the biological fate of chemicals, 43(10), pp.1499–504.
Szklarczyk, D. et al., 2016. STITCH 5: Augmenting protein-chemical interaction networks with tissue and affinity data. Nucleic Acids Research, 44(D1), pp.D380–D384.
Takano, Y. et al., 2005. Selectivity of febuxostat, a novel non-purine inhibitor of xanthine oxidase/xanthine dehydrogenase. Life Sciences, 76(16), pp.1835–1847.
Tamura, M., Hoshi, C. & Hori, S., 2013. Xylitol affects the intestinal microbiota and metabolism of daidzein in adult male mice. International journal of molecular sciences, 14(12), pp.23993–4007.
Tanabe, M. & Kanehisa, M., 2012. Using the KEGG database resource. Current protocols in bioinformatics / editoral board, Andreas D. Baxevanis ... [et al.], Chapter 1, p.Unit1.12.
Terai, C. et al., 1995. Adenine phosphoribosyltransferase deficiency identified by urinary sediment analysis: cellular and molecular confirmation. Clinical genetics, 48(5), pp.246–250.
Tillisch, K. et al., 2013. Consumption of fermented milk product with probiotic modulates brain activity. Gastroenterology, 144(7).
Tkachenko, A.G. et al., 2012. Polyamines reduce oxidative stress in Escherichia coli cells exposed to bactericidal antibiotics. Research in Microbiology, 163(2), pp.83–91.

160
Turnbaugh, P.J. et al., 2009. The effect of diet on the human gut microbiome: a metagenomic analysis in humanized gnotobiotic mice. Science translational medicine, 1(6), p.6ra14.
Valerio, L.G. & Long, A., 2010. The in silico prediction of human-specific metabolites from hepatotoxic drugs. Curr Drug Discov Technol, 7(3), pp.170–87.
Vernocchi, P., Del Chierico, F. & Putignani, L., 2016. Gut Microbiota Profiling: Metabolomics Based Approach to Unravel Compounds Affecting Human Health. Frontiers in Microbiology, 7.
Vinaixa, M. et al., 2012. A Guideline to Univariate Statistical Analysis for LC/MS-Based Untargeted Metabolomics-Derived Data. Metabolites, 2(4), pp.775–795.
Wallace, B. et al., 2010. Alleviating cancer drug toxicity by inhibiting a bacterial enzyme. Science, 330(6005), pp.831–835.
Wang, J.H. et al., 2014. Sigma S-dependent antioxidant defense protects stationary-phase Escherichia coli against the bactericidal antibiotic gentamicin. Antimicrobial Agents and Chemotherapy, 58(10), pp.5964–5975.
Wang, Z. et al., 2011. Gut flora metabolism of phosphatidylcholine promotes cardiovascular disease. Nature, 472(7341), pp.57–63.
Wernicke, J.F. et al., 2005. Safety and adverse event profile of duloxetine. Expert opinion on drug safety, 4(6), pp.987–93.
Wexler, P., 2001. TOXNET: an evolving web resource for toxicology and environmental health information. Toxicology, 157(1–2), pp.3–10.
Van de Wiele, T. et al., 2005. Human colon microbiota transform polycyclic aromatic hydrocarbons to estrogenic metabolites. Environmental health perspectives, 113(1), pp.6–10.
Wikoff, W. & Anfora, A., 2009. Metabolomics analysis reveals large effects of gut microflora on mammalian blood metabolites. Proc. Natl. Acad. Sci. U.S.A., 106(10), pp.3698–3703.
Wilson, I.D. & Nicholson, J.K., 2016. Gut microbiome interactions with drug metabolism, efficacy, and toxicity. Translational Research.
World Health Organization, 2015. 19th WHO Model List of Essential Medicines. Http://Www.Who.Int/Medicines/Publications/Essentialmedicines/En, (April), pp.1–43.
Wright, G.D., 2016. Antibiotic Adjuvants: Rescuing Antibiotics from Resistance. Trends in Microbiology, 24(11), pp.862–871.
Wu, S., Zhang, L. & Chen, J., 2012. Paracetamol in the environment and its degradation by microorganisms. Appl. Microbiol. Biotechnol., 96(4), pp.875–84.
Xu, H. et al., 2007. Anaerobic metabolism of 1-amino-2-naphthol-based azo dyes (Sudan dyes) by human intestinal microflora. Applied and Environmental Microbiology, 73(23), pp.7759–7762.
Yang, H. et al., 2005. Niche heterogeneity determines bacterial community structure in the termite gut (Reticulitermes santonensis). Environ. Microbiol., 7(7), pp.916–32.
Zgurskaya, H.I. et al., 2011. Mechanism and function of the outer membrane

161
channel TolC in multidrug resistance and physiology of enterobacteria, Zhang, J. et al., 2014. PEAR: A fast and accurate Illumina Paired-End reAd
mergeR. Bioinformatics, 30(5), pp.614–620. Zheng, P. et al., 2016. Gut microbiome remodeling induces depressive-like
behaviors through a pathway mediated by the host’s metabolism. Molecular psychiatry, (February), pp.1–11.
Zheng, X. et al., 2013. Melamine-induced renal toxicity is mediated by the gut microbiota. Sci Transl Med, 5(172), p.172ra22.
Zhernakova, A. et al., 2016. Population-based metagenomics analysis reveals markers for gut microbiome composition and diversity. Science, 352(6285), pp.565–569.

162
Appendix
A. Side effect keywords
Table 12: Indirect gut related side effects from SIDER database. "Abdominal bloating", "Abdominal colic", "Abdominal cramps", "Abdominal discomfort", "Abdominal distension", "Abdominal distension gaseous", "Abdominal distress", "Abdominal infection", "Abdominal pain", "Abdominal pain generalised", "Abdominal pain lower", "Abdominal pain upper", "Abdominal rigidity", "Abdominal symptom", "Abdominal tenderness", "Abnormal bowel sounds", "Abnormal faeces", "Abnormal weight gain", "Acne", "Acne fulminans", "Acne infantile", "Acneiform eruption", "Acquired megacolon", "Acute abdomen", "Acute gastroenteritis", "Acute interstitial nephritis", "Aminoaciduria", "Anaemia vitamin B12 deficiency", "Anal atresia", "Anal discomfort", "Anal inflammation", "Anal pruritus", "Anorectal discomfort", "Anorectal disorder", "Anorexia", "Anus disorder", "Arterial stenosis", "Arterial thrombosis", "Arterial thrombosis limb", "Arteriosclerosis", "Arteriosclerosis coronary artery", "Arthritis bacterial", "Arthritis infective", "Atherosclerosis", "Atypical mycobacterial infection", "Avitaminosis", "Bacterial infection", "Bacterial prostatitis", "Bacteriuria", "Bloated feeling", "Blood gastrin increased", "Blood glucose abnormal", "Blood glucose decreased", "Blood glucose increased", "Body odor", "Borborygmi", "Bowel sounds decreased", "Bowel spasm", "Caecitis", "Carbohydrate craving", "Carbohydrate tolerance decreased", "Carotid bruit", "Central obesity", "Cerebral arteriosclerosis", "Change of bowel habit", "Cholangitis", "Cholangitis sclerosing", "Clostridial infection", "Clostridium colitis", "Clostridium difficile colitis", "Colicky", "Colitis", "Colitis ischaemic", "Colitis microscopic", "Colitis ulcerative", "Colon atonic", "Colonic obstruction", "Colonic pseudo-obstruction", "Constipation", "Constipation chronic", "Coronary artery occlusion", "Crohn's disease", "Defaecation urgency", "Delayed gastric emptying", "Diarrhoea", "Diarrhoea haemorrhagic", "Diarrhoea, Clostridium difficile", "Digestion impaired", "Discomfort rectal", "Distress gastrointestinal", "Diverticulitis", "Diverticulum", "Diverticulum intestinal", "Dysentery", "Encopresis", "Enlargement abdomen", "Enteritis", "Enterocolitis", "Epigastric discomfort", "Epigastric distress", "Epigastric fullness", "Epigastric pain", "Excessive flatulence", "Faecal incontinence", "Faecalith", "Faecaloma", "Faeces discoloured", "Faeces hard", "Flatulence", "Gas", "Gas in stomach", "Gas pain", "Gastric dilatation", "Gastric disorder", "Gastric erosions", "Gastric flu", "Gastric irritation", "Gastric pH decreased", "Gastric ulcer", "Gastric ulcer haemorrhage", "Gastric ulcer perforation", "Gastrin increased", "Gastrinoma", "Gastritis", "Gastritis erosive", "Gastritis haemorrhagic", "Gastroduodenitis", "Gastroenteritis", "Gastroenteritis bacterial", "Gastrointestinal candidiasis", "Gastrointestinal discomfort", "Gastrointestinal disorder", "Gastrointestinal infection", "Gastrointestinal obstruction", "Gastrointestinal pain", "Gastrointestinal sounds abnormal", "Gastrointestinal stoma complication", "Gastrointestinal symptom NOS", "Gastrointestinal toxicity", "Gastrointestinal tract irritation", "Gastrointestinal ulcer", "Helicobacter gastritis", "Helicobacter infection", "Hypovitaminosis", "Impaired gastric emptying", "Infection susceptibility increased", "Infrequent bowel movements", "Intestinal obstruction", "Intestinal stoma complication", "Intestinal ulcer", "Irritable bowel syndrome", "Large intestinal obstruction", "Lymphocytic colitis", "Malabsorption", "Malnutrition", "Markedly reduced dietary intake", "Megacolon", "Megacolon toxic", "Melaena", "Metabolic acidosis", "Metabolic alkalosis", "Metabolic disorder", "Mucous stools", "Neutropenic colitis", "Neutropenic enterocolitis", "Obesity", "Obstipation", "Pneumatosis", "Pneumatosis cystoides intestinalis", "Pneumatosis intestinalis", "Post procedural diarrhoea", "Proctocolitis", "Protein-losing gastroenteropathy", "Pseudomembranous colitis", "Pseudomembranous enterocolitis", "Serum gastrin increased", "Steatorrhoea", "Stools watery", "Tarry stools", "Ulcerative enterocolitis", "Unspecified disorder of intestine", "Vitamin B complex deficiency", "Vitamin B12 deficiency", "Vitamin B6 deficiency", "Vitamin D deficiency", "Vitamin K deficiency", "Watery diarrhoea", "Weight decreased", "Weight fluctuation", "Weight increased"

163
Table 13: Direct gut related side effects from SIDER database. "Abdominal bloating", "Abdominal distension gaseous", "Abnormal bowel sounds", "Abnormal faeces", "Bloated feeling", "Borborygmi", "Bowel sounds decreased", "Change of bowel habit", "Constipation", "Defaecation urgency", "Diarrhoea", "Diarrhoea, Clostridium difficile", "Digestion impaired", "Distress gastrointestinal", "Excessive flatulence", "Faecal incontinence", "Faeces discoloured", "Faeces hard", "Flatulence", "Gas", "Gas in stomach", "Gastrointestinal sounds abnormal", "Impaired gastric emptying", "Infection susceptibility increased", "Infrequent bowel movements", "Intestinal obstruction", "Malabsorption", "Malnutrition", "Obstipation", "Steatorrhoea", "Stools watery", "Tarry stools", "Watery diarrhoea", "Weight decreased", "Weight fluctuation", "Weight increased"
B. Bacteria-Drug Interactions
Table 14: Drug depletion in bacteria-drug interaction screen. Depleting bacteria Depleted drug Mean depletion in percent Escherichia coli ED1a Acetaminophen 100 Fusobacterium nucleatum nucleatum Acetaminophen 100 Bacteroides uniformis Aripiprazole 44.27540983 Clostridium saccharolyticum Aripiprazole 41.06687518 Escherichia coli iAi1 Aripiprazole 41.15933652 Eggerthella lenta Digoxin 100 Fusobacterium nucleatum nucleatum Donepezil 39.22195301 Bacteroides uniformis Duloxetine 51.53810786 Clostridium bolteae Duloxetine 48.68194393 Clostridium saccharolyticum Duloxetine 53.84738298 Coprococcus comes Duloxetine 37.43557749 Escherichia coli iAi1 Duloxetine 40.60557131 Lactobacillus paracasei Duloxetine 52.11007663 Lactobacillus plantarum Duloxetine 44.54516384 Ruminococcus gnavus Duloxetine 57.22155512 Bifidobacterium animalis lactis Ezetimibe 57.34494054 Clostridium ramosum Ezetimibe 62.76817906 Mix Degrad Ezetimibe 66.779273 Mix No Ezetimibe 50.61135839 Bacteroides uniformis Levamisole 68.47070953 Bacteroides uniformis HM716 Levamisole 74.79411704 Bifidobacterium animalis lactis Levamisole 43.84127641 Bifidobacterium longum infantis Levamisole 55.62754501 Clostridium bolteae Levamisole 48.05907875 Clostridium saccharolyticum Levamisole 58.2917914 Coprococcus comes Levamisole 62.47539067 Fusobacterium nucleatum nucleatum Levamisole 87.38600047 Bacteroides vulgatus Metronidazole 100 Bifidobacterium animalis lactis Metronidazole 98.69099719 Clostridium bolteae Metronidazole 100 Escherichia coli ED1a Metronidazole 100 Escherichia coli iAi1 Metronidazole 100 Lactobacillus plantarum Metronidazole 100 Lactococcus lactis Metronidazole 100 Mix Degrad Metronidazole 100 Mix No Metronidazole 100 Streptococcus salivarius Metronidazole 100 Bacteroides uniformis HM715 Montelukast 39.14008877 Bifidobacterium animalis lactis Montelukast 47.83326001 Bifidobacterium longum infantis Montelukast 45.68743593 Clostridium bolteae Montelukast 49.09396904 Coprococcus comes Montelukast 43.2711665 Fusobacterium nucleatum nucleatum Montelukast 42.07705466 Lactobacillus plantarum Montelukast 43.4526419 Mix Degrad Montelukast 46.00337988

164
Ruminococcus gnavus Montelukast 66.10601682 Clostridium bolteae Ranitidine 39.85594525 Eggerthella lenta Ranitidine 100 Escherichia coli iAi1 Ranitidine 39.82398937 Fusobacterium nucleatum nucleatum Ranitidine 32.7098203 Lactobacillus gasseri Ranitidine 42.91659306 Ruminococcus gnavus Ranitidine 45.6331274 Fusobacterium nucleatum nucleatum Roflumilast 39.05930242 Lactococcus lactis Roflumilast 79.83320576 Mix No Roflumilast 53.1968065 Ruminococcus gnavus Roflumilast 44.25472109 Bacteroides thetaiotaomicron Rosiglitazone 35.28432013 Bifidobacterium animalis lactis Rosiglitazone 44.48883462 Fusobacterium nucleatum nucleatum Rosiglitazone 35.23351925 Lactobacillus paracasei Rosiglitazone 41.88601157 Bacteroides thetaiotaomicron Simvastatin 74.84471371 Bacteroides uniformis Simvastatin 76.86857365 Bacteroides vulgatus Simvastatin 69.9565144 Bifidobacterium animalis lactis Simvastatin 69.83734966 Clostridium bolteae Simvastatin 52.52299585 Clostridium ramosum Simvastatin 66.26821933 Clostridium saccharolyticum Simvastatin 56.35281086 Eggerthella lenta Simvastatin 44.58606123 Fusobacterium nucleatum nucleatum Simvastatin 54.77585933 Lactobacillus plantarum Simvastatin 74.33695501 Mix Degrad Simvastatin 54.37546604 Bacteroides uniformis Sulfasalazine 100 Bacteroides uniformis HM715 Sulfasalazine 100 Bifidobacterium animalis lactis Sulfasalazine 100 Bifidobacterium longum infantis Sulfasalazine 100 Clostridium bolteae Sulfasalazine 100 Clostridium ramosum Sulfasalazine 100 Eggerthella lenta Sulfasalazine 100 Escherichia coli iAi1 Sulfasalazine 100 Fusobacterium nucleatum nucleatum Sulfasalazine 100 Lactobacillus gasseri Sulfasalazine 100 Lactococcus lactis Sulfasalazine 100 Mix Degrad Sulfasalazine 99.64278195 Mix No Sulfasalazine 100 Streptococcus salivarius Sulfasalazine 100
Table 15: Growth effects from bacteria-drug interaction screen. Drug Affected bacteria log2 fold change Aripiprazole E. coli IAI1 0.376486125 Aripiprazole L. gasseri 0.229201218 Digoxin E. coli IAI1 0.300498375 Digoxin E. lenta 0.27439148 Digoxin R. torques 0.764346284 Duloxetine C. saccharolyticum 0.129106874 Duloxetine E. coli IAI1 0.451924994 Duloxetine E. rectale lethal Levamisole L. lactis 0.114455594 Loperamide B. longum subsp. infantis lethal Loperamide E. coli IAI1 0.304640652 Loperamide E. lenta lethal Loperamide E. rectale lethal Loperamide L. lactis 0.746548355 Metronidazole B. fragilis lethal Metronidazole B. longum subsp. infantis lethal Metronidazole B. thetaiotaomicron lethal

165
Metronidazole B. uniformis lethal Metronidazole B. uniformis HM715 lethal Metronidazole B. uniformis HM716 lethal Metronidazole C. ramosum lethal Metronidazole C. saccharolyticum lethal Metronidazole E. lenta lethal Metronidazole E. rectale lethal Metronidazole F. nucleatum subsp. nucleatum lethal Montelukast B. uniformis HM715 0.167807495 Ranitidine E. coli IAI1 0.4156723 Rosiglitazone E. coli IAI1 0.365450851 Rosuvastatin B. vulgatus 0.136144383 Simvastatin B. uniformis HM716 0.286360254 Sulfasalazine C. ramosum 0.297975223 Sulfasalazine R. torques 1.239805299 Tolmetin L. plantarum 0.11056823 Tolmetin R. torques 0.25022290
Table 16: Drug depletion in depletion-mode assay. Batch Extraction Drugs Bacteria Difference to Ctrl p-value 2 dir aripiprazole B. uniformis -31.30972752 0.006731675 3 dir aripiprazole C. bolteae -54.84344883 0.006634478 3 ind aripiprazole C. bolteae -21.70746985 0.070838531 3 dir digoxin E. lenta -19.75243723 0.013396957 5 ind digoxin E. lenta -10.96501077 0.003940423 1 dir donepezil F. nucleatum -22.97478742 0.000865049 3 ind donepezil F. nucleatum -5.304484226 0.001339369 2 dir duloxetine B. thetaiotaomicron -62.43641652 1.13E-05 4 dir duloxetine B. thetaiotaomicron -46.26443258 0.000322 5 dir duloxetine C. comes -6.048205727 0.002312058 2 ind duloxetine B. thetaiotaomicron -38.54924883 1.08E-06 3 ind duloxetine B. thetaiotaomicron -42.16501325 4.04E-05 4 ind duloxetine B. thetaiotaomicron -62.78030703 5.27E-08 2 ind duloxetine C. bolteae -10.65210459 0.056749628 3 ind duloxetine C. bolteae -39.05784799 0.043926718 5 ind duloxetine C. comes -31.77858065 3.53E-09 2 ind duloxetine C. saccharolyticum -26.28156478 4.77E-05 2 ind duloxetine R. gnavus -16.76114904 5.17E-05 2 ind duloxetine S. salivarius -14.99328111 0.000827831 3 dir ezetimibe B. animalis lactis -18.33791 0.000143792 3 ind ezetimibe B. animalis lactis -14.63941392 0.002263293 3 dir levamisole B. animalis lactis -70.63291266 0.001432845 3 dir levamisole B. longum infantis -75.93690931 0.00109915 4 dir levamisole B. longum infantis -74.15933736 1.85E-05 3 dir levamisole B. uniformis -52.03567202 0.005418941 1 dir levamisole C. comes -60.28240374 4.40E-08 2 dir levamisole C. ramosum -52.09290375 0.001769814 1 dir levamisole L. gasseri -42.75016138 4.81E-07 3 ind levamisole B. animalis lactis -69.33489689 1.37E-06 3 ind levamisole B. longum infantis -100 1.98E-06 4 ind levamisole B. longum infantis -72.6262388 2.84E-07 3 ind levamisole B. uniformis -46.70492127 5.34E-05 1 ind levamisole C. comes -64.86468501 0.042616736 2 dir montelukast B. longum infantis -46.99429855 3.18E-05 3 dir montelukast C. bolteae -6.944421862 0.052709981 1 dir montelukast C. comes -12.47607532 0.017622857 1 dir montelukast E. rectale -28.2121751 0.002900849 3 dir montelukast R. gnavus -32.73632476 1.50E-05 5 dir montelukast R. gnavus -33.6912125 0.000223934 3 dir montelukast S. salivarius -50.93947424 1.82E-07

166
3 ind montelukast B. animalis lactis -12.01544874 0.0018339 2 ind montelukast B. longum infantis -37.33852858 4.15E-08 3 ind montelukast B. longum infantis -20.95413808 0.014405127 2 ind montelukast C. bolteae -35.22644616 5.89E-10 3 ind montelukast C. bolteae -29.39436175 8.68E-07 2 ind montelukast C. saccharolyticum -7.725129365 0.00295472 2 ind montelukast R. gnavus -33.66419854 2.57E-06 3 ind montelukast R. gnavus -33.72466057 2.90E-06 5 ind montelukast R. gnavus -20.88527317 0.000556889 2 ind montelukast S. salivarius -20.63055213 0.000367701 3 ind montelukast S. salivarius -44.09876523 1.13E-07 1 dir ranitidine F. nucleatum -33.18924222 0.000182851 2 dir roflumilast S. salivarius -34.57741768 0.043745799 3 dir roflumilast S. salivarius -49.94386202 0.002985216 3 ind roflumilast F. nucleatum -32.32253541 4.37E-05 2 ind roflumilast S. salivarius -60.05588551 0.010742064 3 ind roflumilast S. salivarius -39.46763637 1.18E-06 5 ind roflumilast S. salivarius -32.14895808 0.000185274 2 ind rosiglitazone B. thetaiotaomicron -28.36986 1.80E-06 2 ind rosiglitazone C. ramosum -15.67899709 3.30E-05 2 dir sulfasalazine B. thetaiotaomicron -100 3.01E-09 2 dir sulfasalazine B. uniformis -100 3.01E-09 2 dir sulfasalazine C. bolteae -100 3.01E-09 2 dir sulfasalazine C. ramosum -100 3.01E-09 2 dir sulfasalazine C. saccharolyticum -100 3.01E-09 2 dir sulfasalazine E. coli IAI1 -100 3.01E-09 1 dir sulfasalazine F. nucleatum -100 5.31E-09 1 dir sulfasalazine L. gasseri -100 5.31E-09 2 dir sulfasalazine S. salivarius -100 3.01E-09 2 ind sulfasalazine B. thetaiotaomicron -100 5.46E-06 2 ind sulfasalazine B. uniformis -100 5.46E-06 2 ind sulfasalazine C. bolteae -100 5.46E-06 2 ind sulfasalazine C. ramosum -100 5.46E-06 2 ind sulfasalazine C. saccharolyticum -100 5.46E-06 2 ind sulfasalazine E. coli IAI1 -100 5.46E-06 1 ind sulfasalazine F. nucleatum -100 8.03E-10 1 ind sulfasalazine L. gasseri -85.63467369 0.000211314 2 ind sulfasalazine S. salivarius -100 5.46E-06

167
C. C. saccharolyticum growth curves and IC50
Figure 31: Growth curves of C. saccharolyticum exposed to a dilution series of duloxetine. 24h growth curves in GMM with respective concentration of duloxetine with 1% DMSO as solvent. Curves fitted for triplicates with local regression using R’s loess function.
Figure 32: Duloxetine IC50 determination for C. saccharolyticum. Dilution series of duloxetine in 1% DMSO. Underlying growth curves taken for 24h in GMM in triplicates. OD at half maximum OD time point of control used as effect response. Dashed line indicates 50% of half-maximum OD, to estimate corresponding inhibitory concentration (IC50). Curves are fitted with R function “loess”, span parameter equals 0.5.
Related Documents