First Workshop on End-User Software Engineering WEUSE 2005

Welcome message from author
This document is posted to help you gain knowledge. Please leave a comment to let me know what you think about it! Share it to your friends and learn new things together.
Transcript
First Workshop onEnd-User Software Engineering
WEUSE 2005

Proceedings of the
First Workshop onEnd-User Software Engineering
WEUSE 2005
In conjunction with ICSE 2005
May 21st, 2005
Saint Louis, MO, USA

Table of Contents
Message from the Chairs . . . . . . . . . . . . . . . . . . . . . . . . . . . . . . . . . . . . . . . . . . . . . . . . . . . . . . . . . . . . . . . . . . . . . . . . . . . . . . . . viiConference Organization . . . . . . . . . . . . . . . . . . . . . . . . . . . . . . . . . . . . . . . . . . . . . . . . . . . . . . . . . . . . . . . . . . . . . . . . . . . . . . . viii
Papers
An Approach for Categorizing End User Programmers to Guide Software Engineering Research . . . . . . 1Christopher Scaffidi, Mary Shaw, and Brad Myers
Naming Page Elements in End-User Web Automation . . . . . . . . . . . . . . . . . . . . . . . . . . . . . . . . . . . . . . . . . . . . . . . . . 6Michael Bolin and Robert Miller
Heuristics for the Automatic Identification of Irregularities in Spreadsheets . . . . . . . . . . . . . . . . . . . . . . . . . 11Markus Clermont
Fault Patterns in Matlab . . . . . . . . . . . . . . . . . . . . . . . . . . . . . . . . . . . . . . . . . . . . . . . . . . . . . . . . . . . . . . . . . . . . . . . . . . . . . . 17Fidel Nkwocha and Sebastian Elbaum
An Effective Testing Method for End-User Programmers . . . . . . . . . . . . . . . . . . . . . . . . . . . . . . . . . . . . . . . . . . . . . 21T.Y. Chen - Swinburne, F.-C. Kuo, and Zhi Quan Zhou
End-User Tools for Grid Computing . . . . . . . . . . . . . . . . . . . . . . . . . . . . . . . . . . . . . . . . . . . . . . . . . . . . . . . . . . . . . . . . . . 26Francisco Hernandez, Purushotham Bangalore, and Kevin Reilly
Market Forces and End-User Programming for Mission-Critical Systems . . . . . . . . . . . . . . . . . . . . . . . . . . . . . 31Lutz Prechelt and Daniel Hutzel
Old Issues, New Eyes . . . . . . . . . . . . . . . . . . . . . . . . . . . . . . . . . . . . . . . . . . . . . . . . . . . . . . . . . . . . . . . . . . . . . . . . . . . . . . . . . 35Michael Pickard
Two Principles of End-User Software Engineering Research . . . . . . . . . . . . . . . . . . . . . . . . . . . . . . . . . . . . . . . . . . 38Judith Segal
Evaluating the Costs and Benefits of End-User Development . . . . . . . . . . . . . . . . . . . . . . . . . . . . . . . . . . . . . . . . . 43Alistair Sutcliffe
The EUSES Spreadsheet Corpus: A Shared Resource for Supporting Experimentation with SpreadsheetDependability Mechanisms . . . . . . . . . . . . . . . . . . . . . . . . . . . . . . . . . . . . . . . . . . . . . . . . . . . . . . . . . . . . . . . . . . . . . . . . . . . 47
Marc Fisher II and Gregg Rothermel
How to Communicate Unit Error Messages in Spreadsheets . . . . . . . . . . . . . . . . . . . . . . . . . . . . . . . . . . . . . . . . . . 52Robin Abraham and Martin Erwig
Six Challenges in Supporting End-User Debugging . . . . . . . . . . . . . . . . . . . . . . . . . . . . . . . . . . . . . . . . . . . . . . . . . . 57Joseph Ruthruff and Margaret Burnett
Human Factors Affecting Dependability in End-User Programming . . . . . . . . . . . . . . . . . . . . . . . . . . . . . . . . . . 62Andrew Ko and Brad Myers

Message from the Chairs
Welcome to the First Workshop on End-User Software Engineering. WEUSE is a one-day workshop in-
tended to focus on the challenges that we face in helping end-user programmers create dependable soft-
ware, with a particular emphasis on the interdisciplinary aspects of the problems involved.
This first WEUSE is structured around four themes. These themes correspond to the major topics present
in fourteen short papers that were accepted to the workshop, and that are, in our judgement, of greatest
importance and interest to the workshop attendees. The four themes are:
1. Software Engineering versus End User Software Engineering
2. End User Software Engineering Paradigms and Techniques
3. End Users in End-User Software Engineering: Where HCI Cross Cuts SE
4. Empirically Assessing End User Software Engineering Techniques
Each theme will be introduced by a lead speaker who will set forth his or her vision in the theme area,
taking into account relevent papers. Following the presentations there will be ample time for discussion.
We believe that this workshop structure will allow us to explore the challenges and opportunities that are
most significant for researchers who wish to contribute in the vital area addressed by this workshop.
We would like to thank the WEUSE program committee members for helping review the submitted
workshop papers, and we thank Shriram Krishnamurthi for leading the review process for papers on which
we had conflicts. We also thank our invited speakers for helping lead the session discussions, and we thank
the authors and attendees for help making the workshop possible.
We hope you find WEUSE to be fruitful.
Sebastian Elbaum and Gregg Rothermel,
University of Nebraska - Lincoln
Conference Organization
Chairs
Sebastian Elbaum, University of Nebraska - LincolnGregg Rothermel, University of Nebraska - Lincoln
Program Committee
Alan Blackwell, University of CambridgeMargaret Burnett, Oregon State UniversityJeffrey Carver, Mississippi State University
Prem Devanbu, University of California, DavisShriram Krishnamurthi, Brown University
Rob Miller, Massachusetts Institute of TechnologyBrad Myers, Carnegie Mellon UniversityOrna Raz, Carnegie Mellon University
An Approach for Categorizing End User Programmers to Guide Software Engineering Research
Christopher Scaffidi
Institute for Software Research Intl. School of Computer Science Carnegie Mellon University
+1-412-268-3564 www.cs.cmu.edu/~cscaffid
Mary Shaw
Sloan Software Industry Center & School of Computer Science Carnegie Mellon University
+1-412-268-2589 www.cs.cmu.edu/~shaw
Brad Myers
Human-Computer Interaction Institute School of Computer Science Carnegie Mellon University
+412-268-5150 www-2.cs.cmu.edu/~bam/
ABSTRACT
Over 64 million Americans used computers at work in 1997, and we estimate this number will grow to 90 million in 2012, including over 55 million spreadsheet and database users and 13 million self-reported programmers. Existing characterizations of this end user population based on software usage provide minimal guidance on how to help end user programmers practice better software engineering. We describe an enhanced method of characterizing the end user population, based on categorizing end users according to the ways they represent abstractions. Since the use of abstraction can facilitate or impede achieving key software engineering goals (such as improving reusability and maintainability), this categorization promises an improved ability to highlight niches of end users with special software engineering capabilities or struggles. We have incorporated this approach into an in-progress survey of end user programming practices.
Categories and Subject Descriptors
D.2.6 [Software Engineering]: Programming Environments – interactive environments, graphical environments, integrated
environment; D.2.11 [Software Engineering]: Software
Architectures – data abstraction; K.8.1 [Personal Computing]: Application Packages – database processing, spreadsheets.
General Terms Design
Keywords
end user software engineering, end user programming, abstraction
1. INTRODUCTION As reported in 1995 [6], and widely disseminated in 2000 [7], Boehm et. al. estimated that end user programmers would number 55 million in 2005, compared to fewer than 3 million professional programmers.
We examined the context and method that generated this “55 million” estimate and discovered that it actually constitutes an estimate of Americans using computers at work—rather than end user programmers, per se [25]. Here, we seek to distinguish end user programmers from non-programmers in a way that goes beyond just a single number and helps guide the design of tools to support end user software engineering.
Specifically, a simple binary division of “end user programmers” from “end user non-programmers” provides inadequate insight into end user behavior to guide future research and tool development. Instead, we argue that end users exhibit a variety of practices ranging from programming-like to non-programming-like, and we believe that we can fruitfully characterize this distribution on the basis of how end users represent abstractions. (While we argue for this approach on the basis of its relevance to software engineering research, Blackwell has made similar arguments from the standpoint of studying the cognitive aspects of programming [2].)
In Section 2, we describe how previous research has attempted to categorize end users based on software usage, and we highlight this method's inadequacies. In Section 3, we detail a categorization of end users based on how they represent abstractions, and we describe an in-progress survey that incorporates this abstraction-oriented approach.
2. PROBLEM BACKGROUND
2.1 The End User Population’s Size Boehm estimated that end users in American workplaces would number 55 million in 2005 [6], but in fact the end user population already exceeded 64 million in 1997 and continues to grow [25]. This realization prompted us in a previous report [25] to extend Boehm’s “55 million” estimate with fresh data and a richer model accounting for rising computer usage rates among workers. Using survey results and projections from the Bureau of Labor Statistics (BLS), we estimated that over 90 million Americans will use a computer at work in 2012 (the year for which BLS published occupational projections), including over 55 million spreadsheet and database users and 13 million self-reported programmers, compared to fewer than 3 million professional programmers [25]. Thus, the potential pool of end user programmers will significantly exceed the population of professional programmers for the foreseeable future.
Permission to make digital or hard copies of all or part of this work forpersonal or classroom use is granted without fee provided that copies arenot made or distributed for profit or commercial advantage, and that copiesbear this notice and the full citation on the first page. To copy otherwise, torepublish, to post on servers or to redistribute to lists, requires prior specificpermission and/or a fee.First Workshop on End-User Software Engineering (WEUSE I).May 212005, Saint Louis, Missouri, USA.Copyright ACM 1-59593-131-7/05/0005$5.00.
1
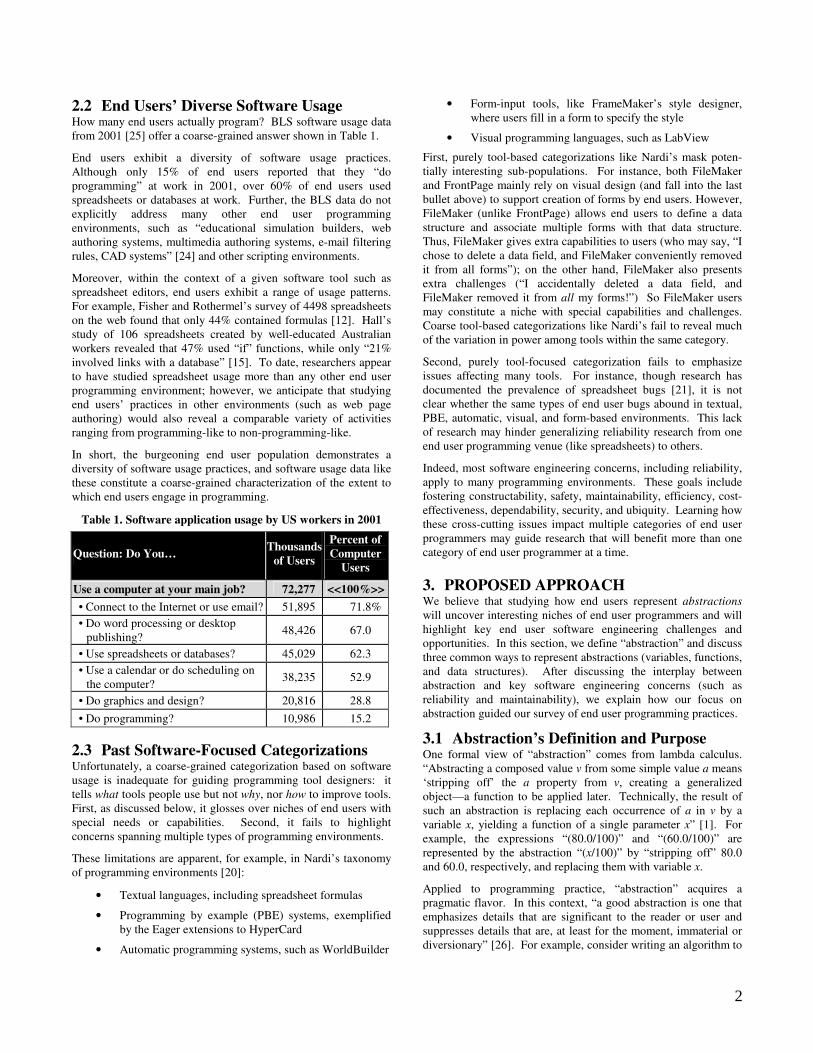
2.2 End Users’ Diverse Software Usage How many end users actually program? BLS software usage data from 2001 [25] offer a coarse-grained answer shown in Table 1.
End users exhibit a diversity of software usage practices. Although only 15% of end users reported that they “do programming” at work in 2001, over 60% of end users used spreadsheets or databases at work. Further, the BLS data do not explicitly address many other end user programming environments, such as “educational simulation builders, web authoring systems, multimedia authoring systems, e-mail filtering rules, CAD systems” [24] and other scripting environments.
Moreover, within the context of a given software tool such as spreadsheet editors, end users exhibit a range of usage patterns. For example, Fisher and Rothermel’s survey of 4498 spreadsheets on the web found that only 44% contained formulas [12]. Hall’s study of 106 spreadsheets created by well-educated Australian workers revealed that 47% used “if” functions, while only “21% involved links with a database” [15]. To date, researchers appear to have studied spreadsheet usage more than any other end user programming environment; however, we anticipate that studying end users’ practices in other environments (such as web page authoring) would also reveal a comparable variety of activities ranging from programming-like to non-programming-like.
In short, the burgeoning end user population demonstrates a diversity of software usage practices, and software usage data like these constitute a coarse-grained characterization of the extent to which end users engage in programming.
2.3 Past Software-Focused Categorizations Unfortunately, a coarse-grained categorization based on software usage is inadequate for guiding programming tool designers: it tells what tools people use but not why, nor how to improve tools. First, as discussed below, it glosses over niches of end users with special needs or capabilities. Second, it fails to highlight concerns spanning multiple types of programming environments.
These limitations are apparent, for example, in Nardi’s taxonomy of programming environments [20]:
• Textual languages, including spreadsheet formulas
• Programming by example (PBE) systems, exemplified by the Eager extensions to HyperCard
• Automatic programming systems, such as WorldBuilder
• Form-input tools, like FrameMaker’s style designer, where users fill in a form to specify the style
• Visual programming languages, such as LabView
First, purely tool-based categorizations like Nardi’s mask poten-tially interesting sub-populations. For instance, both FileMaker and FrontPage mainly rely on visual design (and fall into the last bullet above) to support creation of forms by end users. However, FileMaker (unlike FrontPage) allows end users to define a data structure and associate multiple forms with that data structure. Thus, FileMaker gives extra capabilities to users (who may say, “I chose to delete a data field, and FileMaker conveniently removed it from all forms”); on the other hand, FileMaker also presents extra challenges (“I accidentally deleted a data field, and FileMaker removed it from all my forms!”) So FileMaker users may constitute a niche with special capabilities and challenges. Coarse tool-based categorizations like Nardi’s fail to reveal much of the variation in power among tools within the same category.
Second, purely tool-focused categorization fails to emphasize issues affecting many tools. For instance, though research has documented the prevalence of spreadsheet bugs [21], it is not clear whether the same types of end user bugs abound in textual, PBE, automatic, visual, and form-based environments. This lack of research may hinder generalizing reliability research from one end user programming venue (like spreadsheets) to others.
Indeed, most software engineering concerns, including reliability, apply to many programming environments. These goals include fostering constructability, safety, maintainability, efficiency, cost-effectiveness, dependability, security, and ubiquity. Learning how these cross-cutting issues impact multiple categories of end user programmers may guide research that will benefit more than one category of end user programmer at a time.
3. PROPOSED APPROACH We believe that studying how end users represent abstractions will uncover interesting niches of end user programmers and will highlight key end user software engineering challenges and opportunities. In this section, we define “abstraction” and discuss three common ways to represent abstractions (variables, functions, and data structures). After discussing the interplay between abstraction and key software engineering concerns (such as reliability and maintainability), we explain how our focus on abstraction guided our survey of end user programming practices.
3.1 Abstraction’s Definition and Purpose One formal view of “abstraction” comes from lambda calculus. “Abstracting a composed value v from some simple value a means ‘stripping off’ the a property from v, creating a generalized object—a function to be applied later. Technically, the result of such an abstraction is replacing each occurrence of a in v by a variable x, yielding a function of a single parameter x” [1]. For example, the expressions “(80.0/100)” and “(60.0/100)” are represented by the abstraction “(x/100)” by “stripping off” 80.0 and 60.0, respectively, and replacing them with variable x.
Applied to programming practice, “abstraction” acquires a pragmatic flavor. In this context, “a good abstraction is one that emphasizes details that are significant to the reader or user and suppresses details that are, at least for the moment, immaterial or diversionary” [26]. For example, consider writing an algorithm to
Table 1. Software application usage by US workers in 2001
Question: Do You… Thousands
of Users
Percent of
Computer
Users
Use a computer at your main job? 72,277 <<100%>>
• Connect to the Internet or use email? 51,895 71.8%
• Do word processing or desktop publishing?
48,426 67.0
• Use spreadsheets or databases? 45,029 62.3
• Use a calendar or do scheduling on the computer?
38,235 52.9
• Do graphics and design? 20,816 28.8
• Do programming? 10,986 15.2
2
convert percentages to decimal fractions. The algorithm implementer mainly focuses on dividing by 100; in contrast, the algorithm users mainly focus on specifying percentages to convert. Representing the abstract algorithm as a function cleanly separates implementer concerns and user concerns.
Abstractions hold value (in part) because they facilitate focusing on the general aspects of a problem and reusing the solution on many instances of that problem. For example, an accountant might define a calcInterest function to calculate total interest on an arbitrary loan and then apply this function to specific loans. In short, representing an abstract generalization may facilitate reuse across problem instances.
3.2 Abstraction as a Focus of Past Research Researchers have developed tools that facilitate representing abstractions as variables, functions, and data structures.
3.2.1 Variables Variables constitute the simplest programming representation of abstraction. They separate value generation (when some variable V is set equal to some expression E) from value usage (when V’s value is retrieved for use in some later computation C0).
Unfortunately, a coder may skip defining V and embed E directly inside C0 and other computations C1, C2, and CN, resulting in less maintainable code. For example, if he uses a 6% interest rate to compute the total owed on a $200 loan and the interest accrued, he may skip defining temporary variables, instead coding:
print("Total="); print(200*exp(1+6/100)); print(", Interest="); print(200*exp(1+6/100)-200);
Note that the failure to define temporary variables led to wasteful replication of expressions, resulting in less efficient, maintainable, and reusable code. Hence, researchers have provided tools that a professional programmer can use (after code is written as in the example above) to automatically extract expression E from each computation Ci, replacing each usage with a variable V initialized once from E and reused in each Ci [14]. Supporting abstraction
with variables is particularly valuable, since variables participate in other representations, such as functions and data structures.
3.2.2 Functions Functions represent algorithmic abstractions. They existed since the invention of macros and assemblers in the 1950’s [26] (and, of course, in mathematics since Leibniz coined the term in 1694). More sophisticated types of functions now exist, including spreadsheet macros, JavaScript event handlers, and stored procedures. Functions encompass what Blackwell refers to as “abstraction over time” [3], where a user records behavior for playback; however, since functions accept parametric variables, they separate behavior concerns from data concerns, in addition to separating behavior concerns from time of execution.
Many research prototypes of end user programming environments provide a means for end users to represent algorithmic abstractions (see Table 2). Conversely, in the “real world,” spreadsheet tools provide little or no support for defining and reusing functions, yet these tools constitute the most widely used type of end user programming environment [16].
Though researchers have extended spreadsheets to ease definition of formulas [16], the disparity between functional abstraction research and practice raises a number of questions: Do end users often define functions in tools that support functional abstraction? If not, is it because of tool deficiencies, learning barriers, or simply because representing new algorithmic abstractions holds little value for end users? We will return to such questions below.
3.2.3 Data structures Finally, many abstractions involve composing pieces of data into a structured whole. Various end user programming environments support representation of such abstractions (see Table 2). Data structures offer a fairly simple concrete representation of what Blackwell terms “abstraction over a class of entities” [3], though in the software engineering literature, structured data research dovetailed into more advanced innovations: abstract data types, generic types, and inheritance (see [26] for a survey). It is unclear
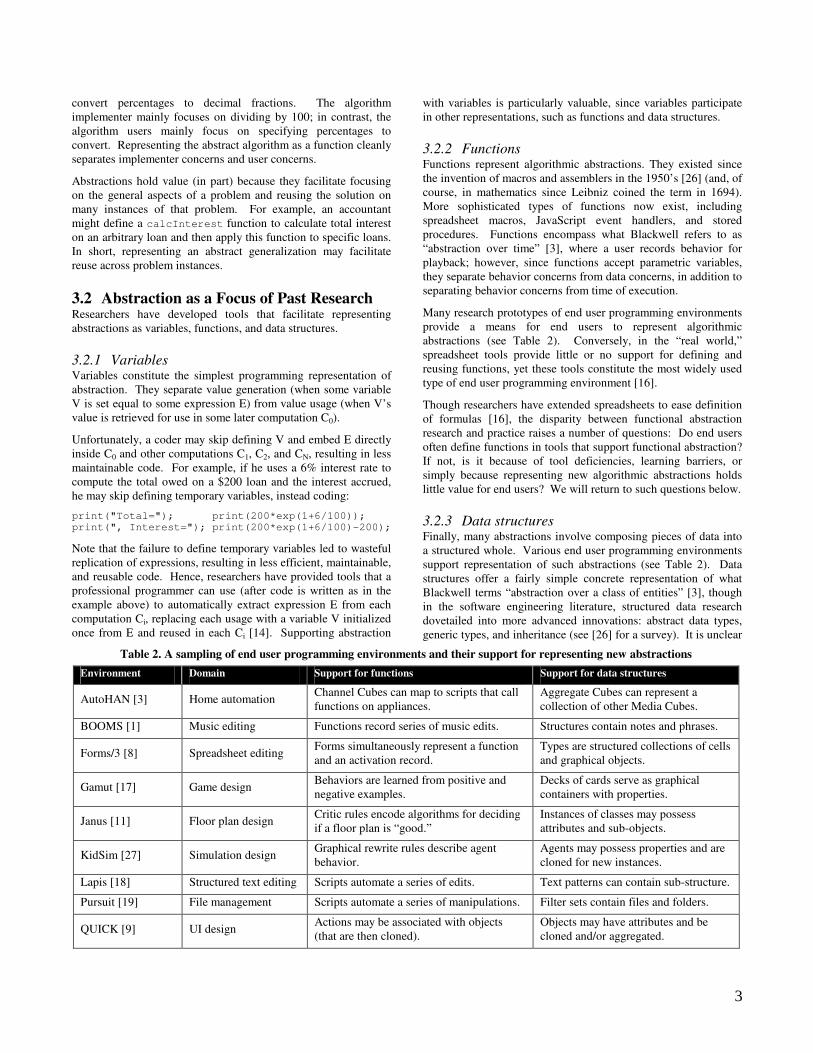
Table 2. A sampling of end user programming environments and their support for representing new abstractions
Environment Domain Support for functions Support for data structures
AutoHAN [3] Home automation Channel Cubes can map to scripts that call functions on appliances.
Aggregate Cubes can represent a collection of other Media Cubes.
BOOMS [1] Music editing Functions record series of music edits. Structures contain notes and phrases.
Forms/3 [8] Spreadsheet editing Forms simultaneously represent a function and an activation record.
Types are structured collections of cells and graphical objects.
Gamut [17] Game design Behaviors are learned from positive and negative examples.
Decks of cards serve as graphical containers with properties.
Janus [11] Floor plan design Critic rules encode algorithms for deciding if a floor plan is “good.”
Instances of classes may possess attributes and sub-objects.
KidSim [27] Simulation design Graphical rewrite rules describe agent behavior.
Agents may possess properties and are cloned for new instances.
Lapis [18] Structured text editing Scripts automate a series of edits. Text patterns can contain sub-structure.
Pursuit [19] File management Scripts automate a series of manipulations. Filter sets contain files and folders.
QUICK [9] UI design Actions may be associated with objects (that are then cloned).
Objects may have attributes and be cloned and/or aggregated.
3
whether end users utilize any of these more advanced representations of abstraction, nor how researchers might enhance existing tools to provide better support in this area.
3.3 Abstraction and Software Engineering The use of abstraction can significantly affect key software qualities such as maintainability and reliability.
On one hand, abstraction can increase the quality of software. For example, high notation viscosity (the difficulty of making local changes) can damage software maintainability, but it is known that “viscosity can be reduced by increasing the number of abstractions” [13]. Of course, simply adding more abstraction does not automatically reduce viscosity. Abstractions must be selected prudently in order to encapsulate features that are likely to change in the future; this prevents local changes from cascading into other sections of the application. Though this maintainability-enhancing design principle first appeared in the software engineering literature over thirty years ago [23], it seems likely that it has not yet significantly impacted actual end user programming practice.
Likewise, researchers realized long ago that comprehensive testing requires modular code for several reasons. First, modular structures tend to exhibit much lower complexity, thereby reducing the number of tests required to achieve adequate confidence in code correctness. Second, if a system is built by combining smaller abstraction “building blocks,” then each abstraction’s module may ideally be tested independently of the others, further simplifying the testing task. Finally, the opportunity to reuse modules may save coding time, which the programmer may then invest in other activities, such as testing. For all these reasons, abstraction-centric, modularized code has the potential to exhibit high correctness and reliability [10] [22].
On the other hand, “increasing abstractions tends to create hidden dependencies” because “quite often abstractions themselves bring problems of visibility” [13]. In other words, abstractions can hinder changing the system without introducing bugs. Thus, used incorrectly, abstraction can degrade maintainability and reliability. Tool designers cannot simply provide support for representing abstractions and assume this will alone improve maintainability and reliability; instead, tools must also provide guidance to help programmers effectively create and comprehend abstractions. Achieving this requires understanding whether, when, and how end user programmers create and understand abstractions.
Abstraction can benefit or harm a wide variety of other software quality attributes, each of which involves many categories of programmer and programming environment. Thus, studying end user abstraction representation promises insight into the software engineering challenges and opportunities facing end users today.
3.4 Abstraction as the Focus of Our Survey Based on these considerations, we tailored our data collection to emphasize abstraction representation by end users. We created a survey that first asks users about their software usage and then about usage of features related to the representation of abstraction.
Our survey was fielded in Information Week magazine beginning in February 2005 (using a questionnaire posted on their web site), and we will have results by May 2005. We will follow this with
an updated survey on a targeted, scientific sample. Based on discussions with researchers, we identified the following popular end user programming tools in the business context:
• Spreadsheets
• Word processors and presentation tools
• Web page editing tools
• Web server scripting languages
• Databases
• Reporting tools / business intelligence
For each type of software, our survey asks about features that end users might utilize for representing abstractions. Different programming environments represent abstractions differently, and we have worded our questions accordingly. For example, to test for function-like representations of algorithmic abstractions, we ask spreadsheet users about recording macros, as well as creating or editing macros in the macro editor; for databases, we ask about creating stored procedures.
The survey also contains several questions related to programming practices. For example, we ask spreadsheet users whether they test their spreadsheets. We ask all respondents several questions about documentation habits, how they use the web during programming, and their knowledge of programming terminology. We also ask about background information for use as independent variables.
We expect to launch a web-based survey of 2500 marketing professionals in 2005. We selected this population because preliminary discussions with marketing professionals suggested that they perform a wide variety of programming activities, ranging from manipulating numerical data to publishing web pages. In a sense, marketing professionals may represent an “upper-bound” on the amount and diversity of end user programming in the workplace.
3.5 Building on the Survey Results Our surveys will likely show that each abstraction representation is used less often in some programming environments than in others. For example, we may discover that end users frequently represent functional abstractions in web pages (using JavaScript functions) but only rarely in spreadsheet environments (through macros) and databases (through stored procedures). Relatively low usage rates raise an important question: Do users rarely utilize a given abstraction representation in certain environments because it is not useful in those contexts, or would they like to use the representation but fail due to inadequate tool support? Although our surveys will not answer this question directly, they will highlight areas where the question applies.
A related question concerns how well end users understand abstraction and the extent to which they want to represent new abstractions. This issue influences what type of assistance the environment must provide. For example, using the terminology of Bloom’s taxonomy in the cognitive domain [5], suppose an end user currently manipulates abstractions at the Knowledge level of understanding (perhaps he has memorized that a script needs to be wrapped with Tcl keywords, as in Lapis [18]). In such a case, it would not be reasonable for the tool to require Synthesis of multiple scripts in order to achieve useful work, since synthesis involves a much higher level of understanding within Bloom’s
4
taxonomy. This mismatch between user and system requirements exemplifies the pitfall of excessive “abstraction-hunger” [13].
Answering these questions will require interviews and observational studies of end users at work. Combining the results from these future studies with our survey data will provide guidance for how to improve tools to better support end users’ programming goals.
4. ACKNOWLEDGEMENTS We thank Andrew Ko for comments on drafts. This work has been funded in part by the EUSES Consortium via the National Science Foundation (ITR-0325273), by the National Science Foundation under Grant CCF-0438929, by the Sloan Software Industry Center at Carnegie Mellon, and by the High De-pendability Computing Program from NASA Ames cooperative agreement NCC-2-1298. Any opinions, findings, and conclusions or recommendations expressed in this material are those of the authors and do not necessarily reflect the views of the sponsors.
5. REFERENCES [1] Balaban, M., Barzilay, E., and Elhadad, M. Abstraction as a
Means for End User Computing in Creative Applications. IEEE Transactions on Systems, Man and Cybernetics, Part
A, 32, 6 (Nov. 2002), 640-653.
[2] Blackwell, A. First Steps in Programming: A Rationale for Attention Investment Models. In Proceedings of the IEEE
2002 Symposia on Human Centric Computing Languages
and Environments, 2002, 2-10.
[3] Blackwell, A., and Hague, R. AutoHAN: An Architecture for Programming the Home. In Proceedings of the IEEE 2001
Symposia on Human Centric Computing Languages and
Environments, 2001, 150-157.
[5] Bloom, B., Mesia, B., and Krathwohl, D. Taxonomy of
Educational Objectives. David McKay Publishers, New York, NY, 1964.
[6] Boehm, B., et al. Cost Models for Future Software Life Cycle Processes: COCOMO 2.0. Annals of Software
Engineering Special Volume on Software Process and
Product Measurement, J.C. Baltzer AG Science Publishers, Amsterdam, The Netherlands, 1995.
[7] Boehm, B., et al. Software Cost Estimation with COCOMO
II. Prentice-Hall, 2000.
[8] Burnett, M., et al. Forms/3: A First-Order Visual Language to Explore the Boundaries of the Spreadsheet Paradigm. Journal of Functional Programming, 11, 2 (Mar. 2001), 155-206.
[9] Douglas, S., Doerry, E., and Novick, D. Quick: A User-Interface Design Kit for Non-Programmers. In Proceedings
of the 3rd Annual ACM SIGGRAPH Symposium on User
Interface Software and Technology, 1990, 47-56.
[10] Edwards, N. The Effect of Certain Modular Design Principles on Testability. In Proceedings of the International
Conference on Reliable Software, 1975, 401-410.
[11] Fischer, G., and Girgensohn, A. End User Modifiability in Design Environments. In Proceedings of the SIGCHI
Conference on Human Factors in Computing Systems, 1990, 183-192.
[12] Fisher II, M., and Rothermel, G. The EUSES Spreadsheet Corpus: A Shared Resource for Supporting Experimentation with Spreadsheet Dependability Mechanisms. Technical Report 04-12-03, University of Nebraska--Lincoln, Lincoln, NE, Dec. 2004.
[13] Green, T., and Petre, M. Usability Analysis of Visual Programming Environments: A Cognitive Dimensions Framework. Journal of Visual Languages and Computing, 7, 2 (June 1996), 131–174.
[14] Griswold, W., and Notkin, D. Automated Assistance for Program Restructuring. ACM Transactions on Software
Engineering Methodology, 2, 3 (July 1993), 228-269.
[15] Hall, J.. A Risk and Control-Oriented Study of the Practices of Spreadsheet Application Developers. In Proceedings of
the 29th Hawaii International Conference on System
Sciences, 1996, 364-373.
[16] Jones, S., Blackwell, A., and Burnett, M. A User-Centred Approach to Functions in Excel. In Proceedings of the 8th
ACM SIGPLAN International Conference on Functional
Programming, 2003, 165-176.
[17] McDaniel, R., and Myers, B. Getting More Out of Programming-By-Demonstration. In Proceedings of the
SIGCHI Conference on Human Factors in Computing
Systems, 1999, 442-449.
[18] Miller, R., and Myers, B. LAPIS: Smart Editing with Text Structure. In CHI '02 Extended Abstracts on Human Factors
in Computing Systems, 2002, 496-497.
[19] Modugno, F., and Myers, B. Pursuit: Graphically Representing Programs in a Demonstrational Visual Shell. In Proceedings of the CHI '94 Conference Companion on
Human Factors in Computing Systems, 1994, 455-456.
[20] Nardi, B. A Small Matter of Programming, MIT Press, Cambridge, MA, 1993.
[21] Panko, R. What we know about spreadsheet errors. Journal
of End User Computing, 10, 2 (Spring 1998), 15-21.
[22] Parnas, D. The Influence of Software Structure on Reliability. In Proceedings of the International Conference
on Reliable Software, 1975, 358-362.
[23] Parnas, D. On the Criteria to Be Used in Decomposing Systems into Modules. Communications of the ACM, 15, 12
(Dec. 1972), 1053-1058.
[24] Ruthruff, J., et al. Debugging and Finding Faults: End User Software Visualizations for Fault Localization. In Proceedings of the 2003 ACM Symposium on Software
Visualization, 2003, 123-132.
[25] Scaffidi, C., Shaw, M., and Myers, B. The “55M End User Programmers” Estimate Revisited. Technical Report CMU-ISRI-05-100, Carnegie Mellon University, Pittsburgh, PA, 2005.
[26] Shaw, M. Abstraction Techniques in Modern Programming Languages. IEEE Software, 1, 4 (Oct.1984), 10-26.
[27] Smith, D., Cypher, A., and Spohrer, J. KidSim: Programming Agents without a Programming Language. Communications of ACM, 37, 7 (July 1994), 54-67.
5
Naming Page Elements in End-User Web Automation
Michael Bolin and Robert C. Miller MIT CSAIL 32 Vassar St
Cambridge, MA 02139 USA {rcm,mbolin}@mit.edu
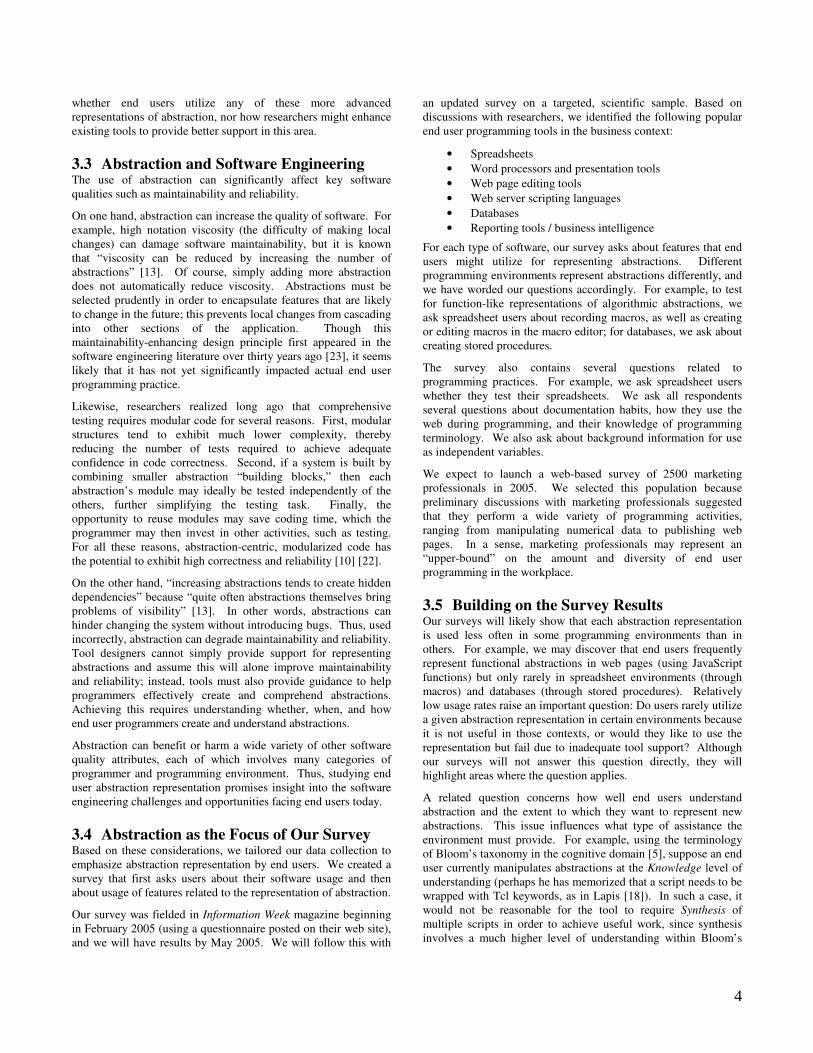
ABSTRACT The names of commands and objects are vital to the usability of a programming system. We are developing a web automation system in which users need to identify web page elements, such as hyperlinks and form fields, in pages written by other designers. Using a survey of 40 users asking them to provide names for page elements, we found that users' names varied widely. However, when names were restricted to using only visible words from the web page, we were able to develop name resolution techniques that automatically find the desired page element given the user's name for it, striking a balance between usability and the precision required by the programming system.
Categories and Subject Descriptors D.3.3 [Programming Languages]: Language Constructs and Features; D.2.6 [Programming Environments]: Interactive environments; H.5.2 [User Interfaces]: User-centered design.
General Terms Algorithms, Experimentation, Human Factors, Languages.
Keywords End-user web automation, web browsers.
1. INTRODUCTION The names given to software components – such as variables, functions, classes, and commands – are an important part of the user interface of an end-user programming system. Choice of names, whether made by the system's designers or by end-user programmers themselves, can affect learnability, recall, readability, and maintainability of programs. Professional programmers recognize the importance of names, and naming conventions are the result (e.g., �[3],�[10]). But a classic study of naming by Furnas et al. �[2] showed that command names chosen by different people were unlikely to be consistent. The solution proposed by Furnas et al. was unlimited aliasing, allowing "many, many alternate verbal routes" to the same functionality.
In this paper, we discuss how we have applied unlimited aliasing in the design of an end-user programming system for automating and customizing interaction with the Web. The main question we
consider is how a user should refer to elements on a web page (such as hyperlinks and form fields) in customization or scripting, particularly when the web page was authored by another designer.
In the next section (section 2), we discuss a number of design principles that interact in the choice of a name. In section 3, we describe Chickenfoot, the end-user web automation system we are developing. In section 4, we present a pilot study we conducted to learn how users might name web page elements. Finally, in section 5, we outline a name resolution algorithm that implements a form of automatic aliasing that performs well on the kinds of names we discovered in the study.
2. DESIGN PRINCIPLES The goal of a name, whether used in programming or in natural language, is to identify a thing, so that both the writer and the reader agree about which thing is under discussion. Unlike natural languages, however, programming languages have two kinds of readers with very different needs: software and humans. In this section, we discuss some of the properties of names that are relevant to programming, and how they matter to these two kinds of readers.
Precision. To software tools, such as compilers or interpreters, the most important property of a name is precision. A precise name identifies exactly one thing. Naming systems in software are generally designed to minimize ambiguity, rejecting attempts to introduce names that would be imprecise. For example, file systems generally refuse to allow two files of the same name in the same directory. In Java, two variables in the same scope may not share the same name, and two classes with the same name may not be imported simultaneously. For a software tool, name collisions are the worst kind of failure that can occur, since they leave the software unable to resolve references to the name.
Precision is not as important to people, since humans are more tolerant of ambiguity. One way people resolve ambiguity is by appealing to context. For example, in a discussion of Java collection classes, List probably means the collection class java.util.List, not the user interface widget java.awt.List. Another way to resolve ambiguity is to engage in a dialogue ("Which List do you mean?"), but this is only feasible when the communication is interactive.
Robustness. Since software engineering is also concerned with the correctness of a program over its entire lifecycle (maintainability) and in other contexts (reuse and extensibility), a well-chosen name in a well-designed naming system should remain precise as a program is modified and combined with code written by other programmers. The need for precision over time and space is what drives naming systems to introduce scoping and
Permission to make digital or hard copies of all or part of this work forpersonal or classroom use is granted without fee provided that copies arenot made or distributed for profit or commercial advantage, and that copiesbear this notice and the full citation on the first page. To copy otherwise, torepublish, to post on servers or to redistribute to lists, requires prior specificpermission and/or a fee.First Workshop on End-User Software Engineering (WEUSE I).May 212005, Saint Louis, Missouri, USA.Copyright ACM 1-59593-131-7/05/0005$5.00.
6
package mechanisms, in order to isolate one module's names from another's. When names chosen by different programmers must coexist, naming conventions are developed that reduce the chance of a collision, usually by referring to an external source of unique identifiers. For example, Java programmers are encouraged to prefix their package names with their organization's domain name, such as com.sun.*, since the uniqueness of domain names is guaranteed by domain name registrars �[9]. An extreme form of this approach is the use of universally unique identifiers (UUIDs), constructed from a network card's MAC address and the current clock time. UUIDs are used in Microsoft COM to name classes and interfaces, and in RDF to name objects and properties.
Suggestiveness. If every name were a UUID, precision and robustness would be satisfied, and complicated scoping and namespace rules would be unnecessary. (Indeed, many source code analysis tools internally rename all the user's messy names with fresh unique identifiers to simplify managing these rules.) Human programmers, on the other hand, would find this intolerable, since they depend on other properties of a name. The most important of these properties is suggestiveness, the extent to which a name describes the content, use, and type of the thing it identifies. A variable named radius is more suggestive than one named r. Suggestiveness depends strongly on shared experience between the writer of the code and its reader, and also on the context of the code. In code dealing with polar coordinates, r may be just as suggestive as radius.
Suggestiveness lies behind recommendations to use long identifiers, including whole words and multiple words, and avoiding unnecessary abbreviations. Suggestiveness drives the naming conventions used in many languages and APIs. In Java, for example, case distinctions are conventionally used to suggest whether a name refers to a variable (string), a class (String) or a constant (STRING). Hungarian notation �[9], first articulated by Charles Simonyi and widely used in the Microsoft Windows API, uses short prefixes to encode the type of a variable in the name. For example, in lpszFirstName, the prefix lpsz means long pointer to string terminated by zero. Hungarian notation can make finer distinctions in type and usage than the C/C++ type system is capable of expressing. For example, ichFirstName and cchFirstName are both integer variables, but the former should be used an index into a character array, while the latter represents the count of the characters in the array.
Names have other properties that are important for human readers. Some of these properties can be derived from well-known usability design heuristics �[6]:
Consistency means using similar names for similar things, and dissimilar names for dissimilar things. For example, a human reader can more readily recognize an idiom like for (int i=0; i<n; ++i) when the loop control variable is consistently named i. Conversely, using s1 to name a string and s2 for a stream in the same function is ripe for confusion. Naming conventions help improve consistency.
Efficiency means that (all other properties equal) a shorter name is better than a longer name. Shorter names are simply faster to use, whether the user is typing them, reading them, or speaking them. Efficiency often forces a tradeoff with suggestiveness, since shorter names have fewer suggestive cues.
Error prevention is also desirable. A good name should not be prone to misspelling or misreading. For example, weird may be easily misspelled as wierd or misread as wired. We noticed this effect in developing a text pattern language which used containing as a pattern operator. So many users mistyped it as containg – even we, the system's developers, made the same mistake – that we eventually added containg to the grammar as an alias, as well as the less error-prone contains.
Pronunciation. Although names in computer systems are primarily used in written form (typed on a keyboard or read on a screen or on paper), pronunciation also matters, since people often talk about the names. In software development, this may happen in design discussions, code reviews, classes, or in pair programming. Unpronounceable names like m_lprgchName seriously inhibit this kind of communication. URLs were not designed with pronunciation in mind: http://www is so hard to say that most speakers simply omit it, and web browsers wisely tolerate the omission. (Tim Berners-Lee reads www as "wuh-wuh-wuh," but that hasn't caught on.)
3. CHICKENFOOT We have encountered some of these naming issues in the design of Chickenfoot, an end-user programming system integrated into a web browser.
The primary goal of Chickenfoot is to give the user a platform for automating and customizing their interaction with the Web. Although web browsers have a long history of built-in scripting languages, these languages are not designed for the end user of a web site. Instead, languages like JavaScript, Java, and Curl �[7] are aimed at designers of web sites. Granted, many web designers lack a traditional programming background, so they may be considered end-user programmers in that respect. But the needs of a designer, building a web application from whole cloth, differ significantly from the needs of a user looking to tailor or script an existing web site. Current web scripting languages do not serve the needs of web automation.
A second goal of Chickenfoot is to allow the end user to automate and customize web sites using a familiar interface, namely the web site's user interface. Existing approaches to web automation use a scripting language that dwells outside the web browser, such as Perl, Python, screen-scraper �[1], and WebL �[4]. For an end-user, the distinction is significant. Cookies, authentication, session identifiers, plugins, user agents, client-side scripting, and proxies can all conspire to make the Web look significantly different to a script running outside the web browser. But perhaps the most telling difference, and the most intimidating one for an end user, is the simple fact that outside a web browser, a web page is just raw HTML. Even the most familiar web portal looks frighteningly complicated when viewed as HTML source. So the challenge for Chickenfoot can be simply stated: a user should never have to view the HTML source of a web site in order to customize or automate it.
Chickenfoot is targeted mainly at three kinds of automation:
Automating repetitive operations. For example, many conferences now use a web site to receive papers, distribute them to reviewers, and collect the reviews. A reviewer assigned 10 papers to read and review faces a lot of repetitive web browsing to download each paper, print it, and later upload a review. Tedious
7
repetition is a strong argument for automation. Other examples include submitting multiple search queries and comparing the results, and collecting multiple pages of search results into a single page for sorting, filtering, or printing.
Integrating multiple web sites. Some web sites already provide some level of integration with other sites. For example, many retailers use MapQuest to display their store locations and provide driving directions. But end-users have no control over this integration. For example, before buying a book from an online bookstore, a user may want to know whether it is available in the local library—a question that can be answered by submitting a query to the library’s online catalog interface. Yet the online bookstore is unlikely to provide this kind of integration, not only because it may lose sales, but because the choice of library is inherently local and personalized to the user.
Transforming a web site's appearance. Examples of this kind of customization include changing defaults for form fields, filtering or rearranging web page content, and changing fonts, colors, or element sizes. Web sites that use Cascading Style Sheets (CSS) have the potential to give the end user substantial control over how the site is displayed, since the user can override the presentation with personal stylesheet rules. With the exception of font preferences, however, current web browsers do not expose this capability in any usable way.
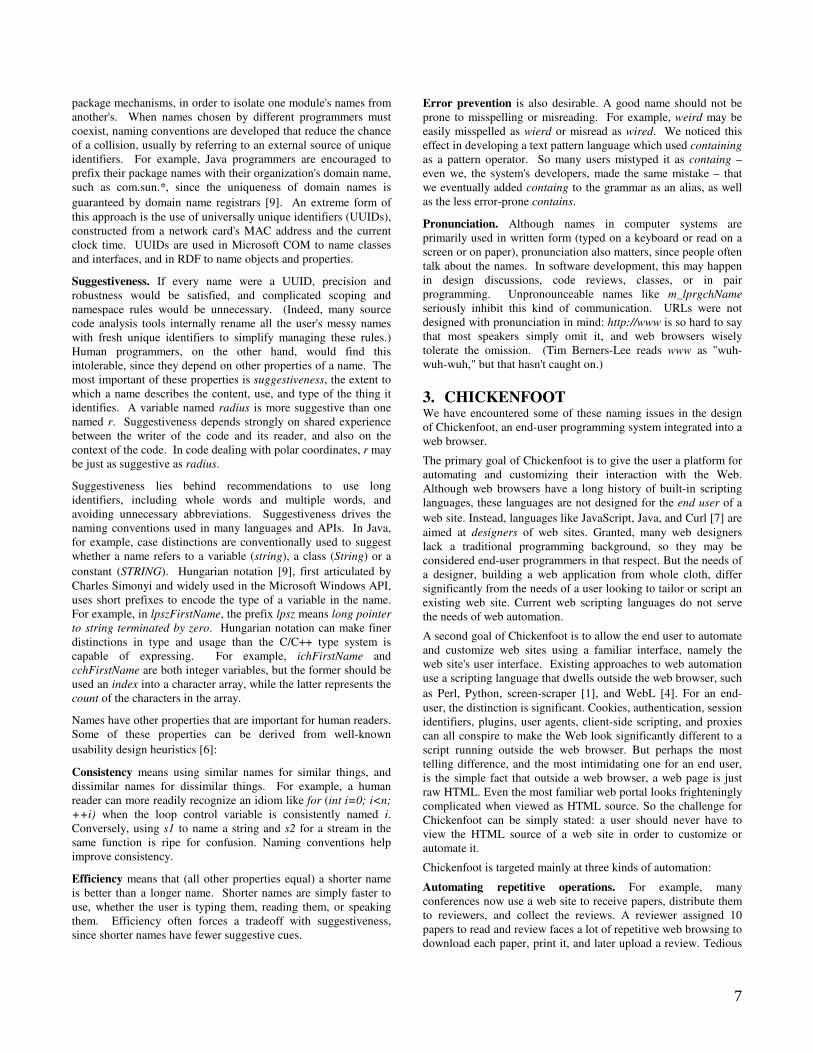
3.1 Design Chickenfoot is being developed as an extension to the Mozilla Firefox web browser. Chickenfoot's design has two parts: (1) a development environment that allows users to enter and test Chickenfoot programs, and (2) a library that extends the browser's built-in Javascript language with new commands for web automation.
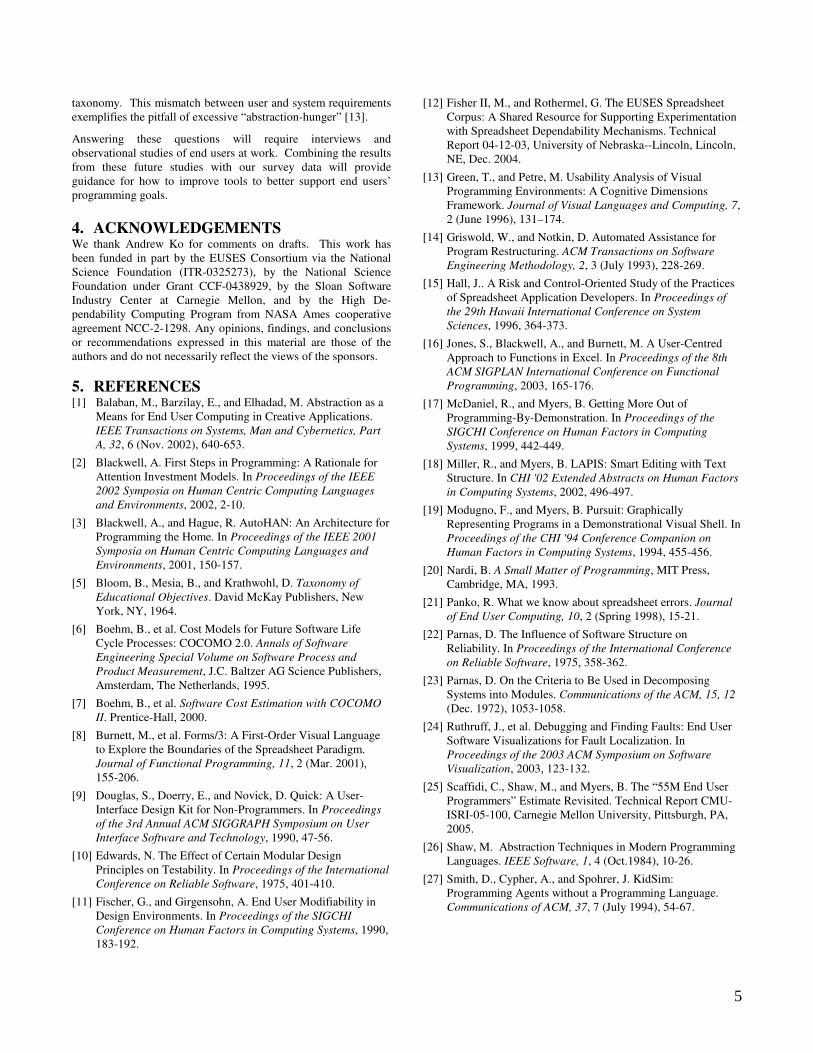
Figure 1 shows a screenshot of the development environment presented by the current Chickenfoot prototype, which appears as a sidebar in Firefox. At the top of the sidebar is a text editor which accepts a Javascript program, which may be merely a single expression or command to execute, or a larger program with function and class definitions. The bottom of the sidebar is a console output window, which displays error messages, printed output, and the result of evaluating the Javascript code (i.e., the value of the last expression). This interface, though minimal, goes a long way toward making the Javascript interpreter embedded in every web browser actually accessible to the end-user. Previously, there were only two ways to run Javascript in a
web browser: by embedding it in a web page (generally impossible if the page is fetched from a remote web site, since the user can't edit it), or by using a javascript: URL, which requires the entire program to be written on a single line.
A Javascript program running in the Chickenfoot sidebar operates on the web page shown in the main part of the window. Unlike most Javascript, Chickenfoot scripts run with no security restrictions, since they are developed and run by the end-user, not downloaded from a potentially malicious remote site. A Chickenfoot script is therefore free to interact with web pages from arbitrary sites and examine any aspect of the web browser's history or user interface.
Chickenfoot extends the standard client-side Javascript with a number of commands to simplify web automation. Some of these commands simulate actions that a web user can perform on the hyperlinks and forms of a web page: click (link-or-button) enter (textbox, value) pick (menu-or-list, option) check (checkbox-or-radiobutton) uncheck (checkbox) These commands raise the question at the heart of this paper: what name should we use for the page object (link, button, or other widget) that a command should act on?
For a form widget, like a textbox or a checkbox, one possibility is the name assigned to the widget by the web page designer. This is the name used by Javascript embedded in the web page, and in the HTTP request sent back to the web server when the form is submitted. One key drawback of this name is that it isn't readily available to a web user without examining the HTML source, which contradicts one of the goals of Chickenfoot. The Chickenfoot development environment could solve this problem (e.g., by making form field names visible in the page on command). But these names have a second problem: since they are not chosen by the web user nor intended to be seen by the web user, they are not likely to be suggestive. For example, Google forms use names like as_q, as_qdr, and as_occt; MapQuest fields look like 2c and 2s. These names are virtually opaque to a user.
Another possibility is to use pointing to identify a page object, rather than a textual name. Indeed, this approach makes a lot of sense when the user is developing a new script, and our future plans include creating a programming-by-demonstration system on top of Chickenfoot, so that the user's clicks and keystrokes are translated automatically into Chickenfoot statements. But even if the user points at page objects to generate Chickenfoot code, there remains the question of what names to display in the generated code. Although visual representations of the code are possible (e.g. �[5],�[6]), a compact textual name would be more efficient of screen real estate and more pronounceable.
We chose to explore a third option: using visible labels in the page to identify page objects. For example, hyperlinks and buttons typically contain a visible text label that can be used with the click command: click("Google Search") Other form widgets, such as textboxes and lists, have captions adjacent to the widget that can be used with other commands: enter("User name", "[email protected]") enter("Password", "bri56ght") click("Sign In")
Figure 1. Chickenfoot development environment running
inside the Firefox web browser.
8
Visible labels are very likely to be suggestive names, because they are chosen by a web site designer to be read and understood by a user, and also because the user is likely to be familiar with them from manually interacting with the web site. One challenge for this technique is the use of inline images for labeling hyperlinks and buttons. Fortunately, well-designed web sites offer ALT text for these images, intended to help visually-impaired users with screen readers, but which can help Chickenfoot as well. For images with no ALT text, we must fall back to other naming methods, such as internal page names.
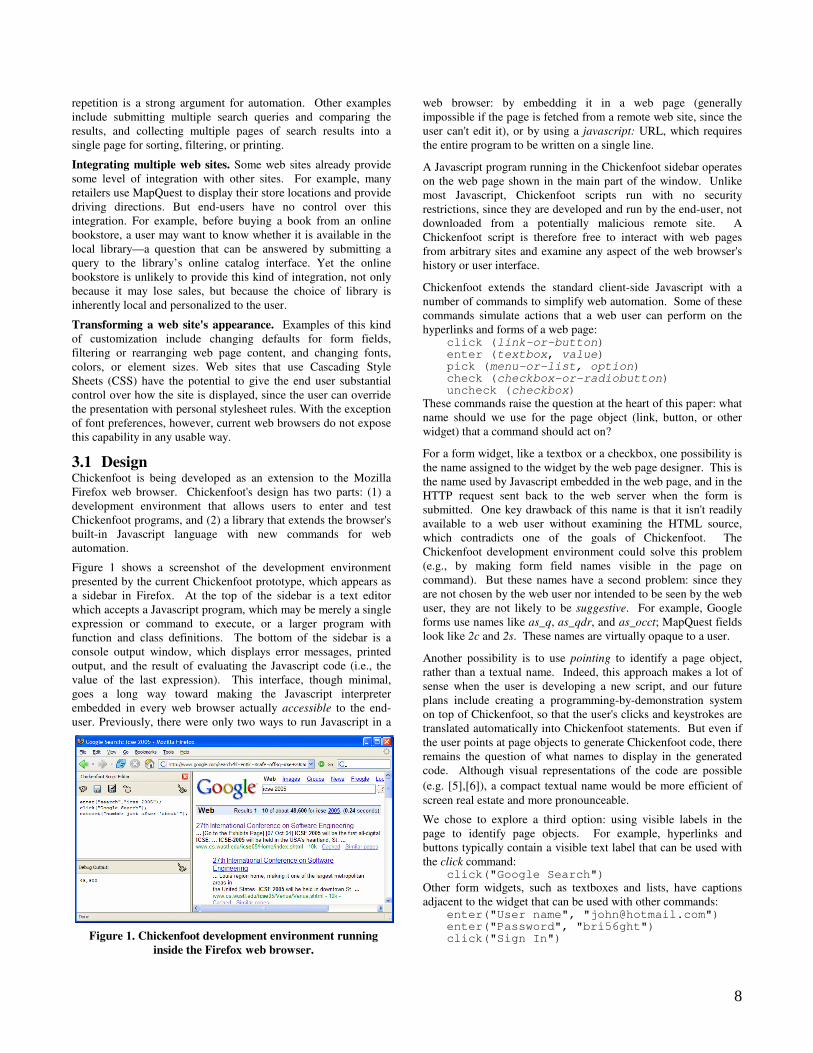
4. NAMING SURVEY To explore the usability of visible labels as names, we conducted a small pilot survey to find out what kinds of names users would generate for form fields, and whether they could comprehend names based on visible labels. Our survey focused on textboxes, which are probably the most common form field on the Web.
4.1 Method The survey was presented entirely over the Web. It consisted of three parts, always in the same sequence. Part 1 explored freeform generation of names: given no constraints, what names would users generate? Each task in Part 1 showed a screenshot of a web page with one textbox highlighted in red, and asked the user to supply a name that "uniquely identified" the highlighted textbox. Users were explicitly told that spaces in names were acceptable. Part 2 tested comprehension of names that we generated from visible labels. Each task in Part 2 presented a name and a screenshot of a web page, and asked the user to click on the textbox identified by the given name. Part 3 repeated Part 1 (using fresh web pages), but also required the name to be composed only of "words you see in the picture" or "numbers" (so that ambiguous names could be made unique by counting, e.g. "2nd Month").
The whole survey used 20 web pages: 6 pages in Part 1, 8 in Part 2, and 6 in Part 3. The web pages were taken from popular sites, such as the Wall Street Journal, the Weather Channel, Google, AOL, MapQuest, and Amazon. Pages were selected to reflect the diversity of textbox labeling seen across the Web, including simple captions (Figure 2a), wordy captions (Figure 2b), captions displayed as default values for the textbox (Figure 2c), and missing captions (Figure 2d). Several of the pages also posed ambiguity problems, such as multiple textboxes with similar or identical captions.
Subjects were unpaid volunteers recruited from the university campus by mailing lists. Forty subjects took the pilot survey (20 females, 20 males), including both programmers and nonprogrammers (24 reported their programming experience as "some" or "lots", 15 as "little" or "none", meaning at most one
programming class). All but one subject were experienced web users, reporting web usage at least several times a week.
4.2 Results We analyzed Part 1 by classifying each name generated by a user into one of four categories: (1) visible if the name used only words that were visible somewhere on the web page (e.g., "User name" for Figure 2a); (2) semantic if at least one word in the name was not found on the page, but was semantically relevant to the domain (e.g., "login name"); (3) layout if the name referred to the textbox's position on the page rather than its semantics (e.g., "top box right hand side"); and (4) example if the user used an example of a possible value for the textbox (e.g. "johnsmith056"). About a third of the names included words describing the type of the page object, such as "field", "box", "entry", and "selection"; we ignored these when classifying a name.
Two users consistently used example names throughout Part 1; no other users did. (It is possible these users misunderstood the directions, but since the survey was conducted anonymously over the Web, it was hard to ask them.) Similarly, one user used layout names consistently in Part 1, and no others did. The remaining 37 users generated either visible or semantic names. When the textbox had an explicit, concise caption, visible names dominated strongly (e.g., 31 out of 40 names for Figure 2a were visible). When the textbox had a wordy caption, users tended to seek a more concise name (so only 6 out of 40 names for Figure 2b were visible). Even when a caption was missing, however, the words on the page exerted some effect on users' naming (so 12 out of 40 names for Figure 2d were visible).
Part 2 found that users could flawlessly find the textbox associated with a visible name when the name was unambiguous. When a name was potentially ambiguous, users tended to resolve the ambiguity by choosing the first likely match found in a visual scan of the page. When the ambiguity was caused by both visible matching and semantic matching, however, users tended to prefer the visible match: given "City" as the target name for Go.com, 36 out of 40 users chose one of the two textboxes explicitly labeled "City"; the remaining 4 users chose the "Zip code" textbox, a semantic match that appears higher on the page. The user's visual scan also did not always proceed from top to bottom; given "First Search" as the target name for eBay.com, most users picked the search box in the middle of the page, rather than the search box tucked away in the upper right corner.
Part 3's names were almost all visible (235 names out of 240), since the directions requested only words from the page. Even in visible naming, however, users rarely reproduced a caption exactly; they would change capitalization, transpose words (writing "web search" when the caption read "Search the Web"), and mistype words. Some Part 3 answers also included the type of the page object ("box", "entry", "field"). When asked to name a textbox which had an ambiguous caption (e.g. "Search" on a page with more than one search form), most users noticed the ambiguity and tried to resolve it with one of two approaches: either counting occurrences ("search 2") or referring to other nearby captions, such as section headings ("search products").
5. AUTOMATIC NAME RESOLUTION We have used the names from Part 3 of the survey to develop a heuristic algorithm for resolving names to textboxes in
Figure 2. Sample textboxes used in the web survey.
(b)
(d) (c)
(a)
9
Chickenfoot. Given a name and a web page, the output of the algorithm is one of the following: (1) a textbox on the page that best matches that name; (2) ambiguous match if two or more textboxes are considered equally good matches; or (3) no match if no suitable match can be found.
The first step is to identify the text labels in the page that approximately match the provided name, where a label is a visible string of content delimited by block-level tags (e.g. <P>, <BR>, <TD>). Button labels and ALT attributes on images are also treated as visible labels. Before comparison, both the name and the visible labels are normalized by eliminating capitalization, punctuation, and white space. Then each label is searched for an approximate occurrence of the name, using a conventional edit distance algorithm to tolerate typos and omitted words. Matching labels are ranked by edit distance, so that closer matches are ranked higher.
For each matching label, we search the web page for textboxes for which it might be a label. Any textbox that is roughly aligned with the label (so that extending the textbox area horizontally or vertically would intersect the label's bounding box) is paired with the label to produce a candidate (label,textbox) pair.
These pairs are further scored by several heuristics that measure the degree of association between the label and the textbox. First is pixel distance: if the label is too far from the textbox, the pair is eliminated from consideration. Currently, we use a vertical threshold of 1.5 times the height of the textbox, but no horizontal threshold, since tabular form layouts often create large horizontal gaps between captions and their textboxes. The second heuristic is relative position: if the label appears below or to the right of the textbox, the rank of the pair is decreased, since these are unusual places for a caption. We don't completely rule them out, though, because users sometimes use the label of a nearby button, such as "Search", to describe a textbox, and the button may be below or to the right of the textbox. The final heuristic is distance in the document tree: each (label,textbox) is scored by the length of the minimum path from the label node to the textbox node in the document's element tree. Thus labels and textboxes that are siblings in the tree have the highest degree of association.
The result is a ranked list of (label, textbox) pairs. The algorithm returns the textbox of the highest-ranked pair, unless the top two pairs have the same score, in which case it returns ambiguous match. If the list of pairs is empty, it returns no match.
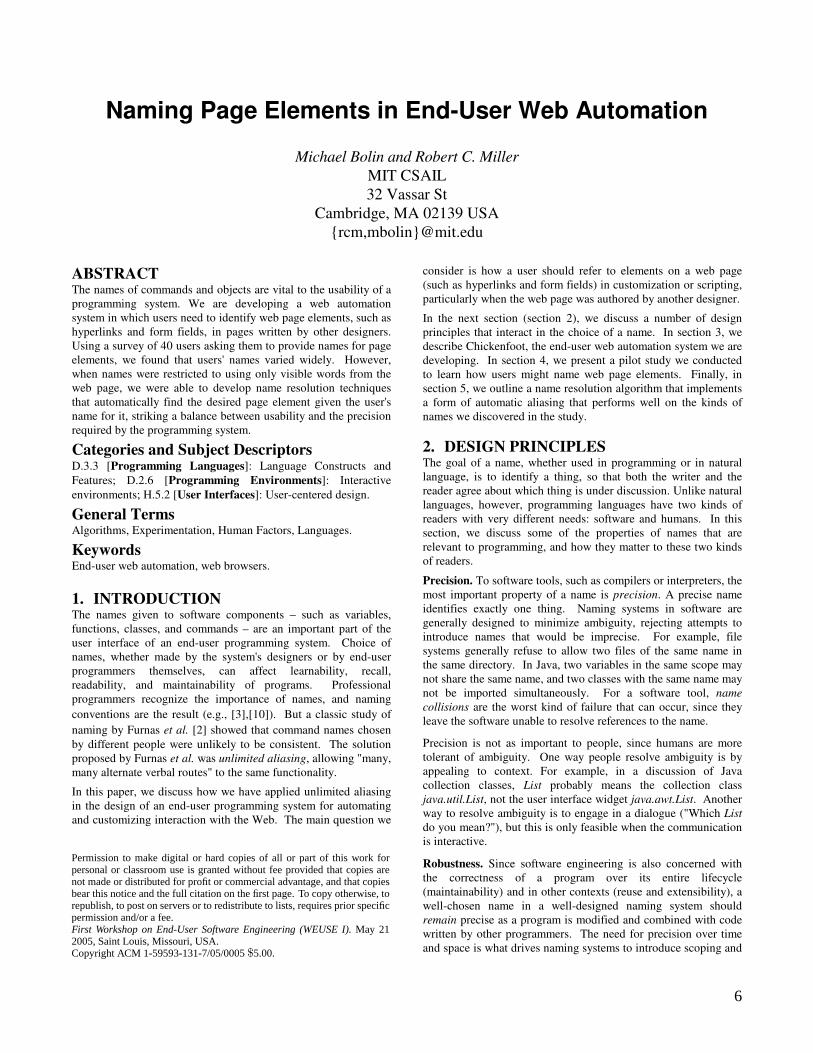
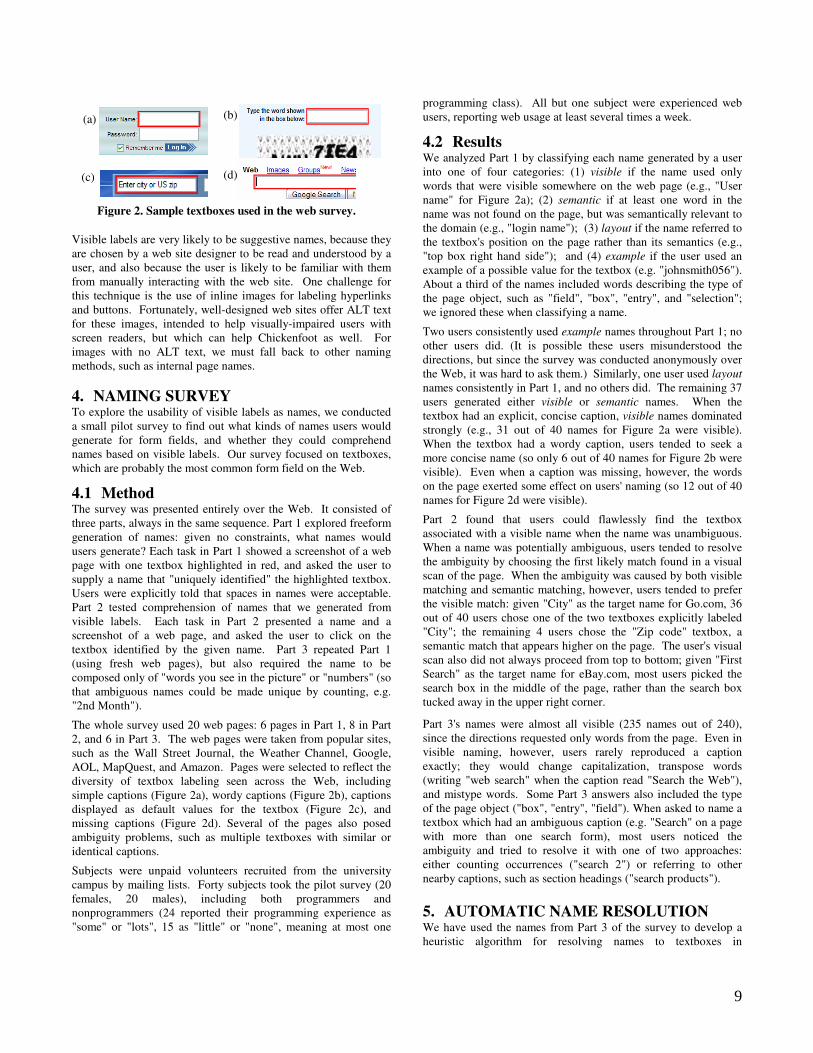
The performance of this algorithm is shown in Figure 3, tested on the 240 names (40 for each of the 6 pages) from Part 3 of the survey. For each name, the algorithm had three possible results: finding the right textbox (Match), reporting an ambiguous match
(Ambiguous), or finding the wrong textbox (Mismatch). Precision is high for 5 of the 6 pages. Performance is poor on the MIT page because it involved an ambiguous caption, and our heuristic algorithm does not yet recognize the disambiguation strategies used for this caption (counting and section headings). This evaluation is only preliminary, but it suggests that names derived from visible labels can be automatically resolved with high precision.
6. CONCLUSION We have shown preliminary results that visible naming (unlimited aliasing that uses words that are visible in the page) is a promising strategy for identifying elements in web pages. Web pages are just one kind of user interface that can be customized and automated. We anticipate that these results will generalize to other user interfaces that include textual labeling.
Future work includes improving the Chickenfoot development environment so that ambiguous names can be disambiguated during code entry, which allows for an ambiguity resolution dialog between the user and the system that wouldn't be sensible at runtime. We are also looking at the robustness of syntactic names against change in web sites. Dealing with web sites that change without warning is a challenge for web automation, but as yet no one has adequately characterized the kinds of changes that occur.
7. ACKNOWLEDGMENTS We thank all the pilot users who took our web survey, as well as Maya Dobuzhskaya, Vineet Sinha, Philip Rha, and other members of the LAPIS group who provided valuable feedback on the ideas in this paper. This work was supported in part by the National Science Foundation under award number IIS-0447800. Any opinions, findings, conclusions or recommendations expressed in this publication are those of the authors and do not necessarily reflect the views of the National Science Foundation.
8. REFERENCES [1] Ekiwi, LLC. screen-scraper: solutions for web data extraction.
http://www.screen-scraper.com/ [2] Furnas, G.W., Landauer, T.K., Gomez, L.M., and Dumais, S.T. "The
vocabulary problem in human-system communication." Commun. ACM, 30, 11 (Nov 1987).
[3] Green, R. "How To Write Unmaintainable Code." http://mindprod.com/unmain.html
[4] Kistler, T. and Marais, H. "WebL – a programming language for the Web." Proc. WWW7, 1998.
[5] Kurlander, D. "Chimera: Example-based graphical editing." In Cypher, A., ed., Watch What I Do: Programming By Demonstration, pp 271–292. MIT Press, 1993.
[6] Modugno, F., Corbett, A.T., and Myers, B.A. "Graphical Representation of Programs in a Demonstrational Visual Shell - An Empirical Evaluation." ACM TOCHI, 4, 3, pp 276-308.
[7] Müffke, F. "The Curl programming environment." Dr. Dobb’s Journal, Sept. 2001.
[8] Nielsen, J. Usability Engineering. Academic Press, 1993. [9] Simonyi, C. and Heller, M. "The Hungarian Revolution," BYTE, 16,
8 (Aug. 1991). [10] Sun Microsystems. "Code Conventions for the Java Programming
Language." http://java.sun.com/docs/codeconv
0%10%
20%30%
40%50%
60%70%
80%90%
100%
Yahoo Expedia Amazon MIT Vivisimo Google
Mismatch
Ambiguous
Match`
Figure 3. Precision of automatic name resolution.
10
Heuristics for the Automatic Identification of Irregularitiesin Spreadsheets
Markus ClermontSoftware Quality Research Laboratory
University of LimerickIRELAND
ABSTRACTSpreadsheet programs turned out to be the most popular end-userprogramming environment that has ever been released. Importantdecisions are based on the results of spreadsheet programs and thelist of known errors with large impact is growing daily- although itsurely is only the top of an iceberg.
One way out of the crisis might be the introduction of softwareengineering techniques into spreadsheet development. Suggestionsfor the improvement of spreadsheet development range back as faras into the late eighties, but none has been successful yet. We ar-gue this is either because not enough effort is put into the roll-outof the technique to the users and, mainly, because they neglect thefact that spreadsheet programmers are end-users, not willing or notable to spend any time on learning software engineering methods.We found out that most end users are willing to verify their spread-sheets, but only view have the time and skills to do really systematictesting of spreadsheets.
We developed an approach to generate two orthogonal abstractrepresentations of spreadsheet programs that are then displayed tothe user by different visualisation techniques to support the audit-ing process. Usually, irregularities in the visualisation point outhot-spots on the spreadsheet with a high likelihood of erroneousformulas. In this paper we present new heuristics for identifyinghot spots that are very efficient for large spreadsheet programs.
Categories and Subject DescriptorsH.4.1 [Information Systems Applications]: Office Automation-Spreadsheets; D.2.5 [Software]: Software EngineeringTesting andDebugging
General TermsAlgorithms
KeywordsProgram Analysis, Spreadsheet Visualization, End User Program-ming
1. INTRODUCTIONIt has been shown, that spreadsheets are used by a vast majority
of people in the upper- and middle management of today’s busi-ness world [18, 5]. Hence, it is no surprise that many importantdecisions are based on the results of spreadsheet programs.
For a software engineer a spreadsheet program is obviously soft-ware and thus should be developed obeying some systematic ap-proach and then be carefully tested. For the typical spreadsheetuser, who is not a software engineer but usually an expert in the ap-plication domain, a spreadsheet program is not considered as soft-ware. For them it is a tool for performing calculations and for-matting their results. Spreadsheets are often considered as a word-processor for numbers, and not as the highly complex data flowprogram that they really are. Hence, it is not surprising that the endusers shy away from software engineering approaches. And thatthere is a long list of well document spreadsheet-error horror sto-ries, e.g. at the web-page of the European Spreadsheet Risk InterestGroup [17].
Although there are already a couple of possible methods to ei-ther enforce a systematic development of spreadsheets, accordingto software engineering principles (see [4, 14, 22, 15] or to reducethe error rate of already existing spreadsheets, by testing (see [1,23, 21]) or auditing (see [3, 24] and other commercially distributedtools), they are still not widely accepted. One reason for the pooracceptance of approaches that require a systematic development ofspreadsheet programs is the nature of the spreadsheet as a prototyp-ing tool itself. Another reason for the failure of many testing andauditing approaches is the sheer size of the spreadsheets that arecommon in industry. In [16] we report of a field study auditing thespreadsheets of a large international company. We examined78spreadsheets, with the average spreadsheet containing more than2400 non-empty cells. Testing the whole spreadsheet, even withthe support of current tools and techniques, still remains a tedioustask.
These facts are not new, and it was found out earlier by Panko(see [20]) that checking a spreadsheet is a time consuming and ex-pensive task. Thus, we argue similar to Butler [3], if time is scarcesystematic auditing or testing should be limited to the crucial partsof spreadsheets that are most likely to be to be erroneous. However,it is not trivial to identify these parts in a quick and efficient way.There are some methods that operate on user assessment of the riskand the impact of an error in a certain region of the spreadsheet(see [3]), but they are subject to the auditors attitude and might notmap to the actual erroneous areas of spreadsheet programs. Thevisualisation approach discussed in [9, 7, 6] offers already an ap-proach to identify certain irregularities of the spreadsheet by meansof an comprehensible abstract visualisation of the audited spread-
Permission to make digital or hard copies of all or part of this work forpersonal or classroom use is granted without fee provided that copies arenot made or distributed for profit or commercial advantage, and that copiesbear this notice and the full citation on the first page. To copy otherwise, torepublish, to post on servers or to redistribute to lists, requires prior specificpermission and/or a fee.First Workshop on End-User Software Engineering (WEUSE I).May 212005, Saint Louis, Missouri, USA.Copyright ACM 1-59593-131-7/05/0005$5.00.
11
sheet that is always connected with the spreadsheet system’s userinterface that is familiar to the spreadsheet programmer [10, 8].
In this paper we want to introduce four new heuristics based onthe technique mentioned above, to automatically discover hot-spotsin spreadsheet programs where errors are likely to appear. There-fore, we will briefly introduce our abstraction technique in the nextsection and point out the heuristics to detect hot-spots known so far.In Section 3 we will introduce the four new heuristics, and finallywe will shortly discuss the limits of our approach.
2. LOGICAL AREAS, SEMANTIC CLASSESAND DATA MODULES
Basically we developed two strategies to generate abstract repre-sentations of spreadsheet programs- the first one, semantic classes[9], is based on the cell’s contents, i.e. the formulas, and their place-ment on the spreadsheet, whereas the second one, data modules [6],takes only cell dependencies into account. We will give only a verybrief and informal introduction here, for a more detailed discussionwe refer to the sources cited above or to [7].
2.1 Logical AreasSemantic classes are an extension of the concept of logical areas
that were first introduced in [2]. Logical areas are an attempt toconstruct an abstract presentation of a given spreadsheet programby considering only the cells contents and grouping cells based onthe similarity of their contents into equivalence classes. In contrastto other techniques that group cells based on their contents, e.g.[24], there are two main differences:
1. The spatial location of cells on the spreadsheet is not takeninto account, and
2. there are different degrees of similarity, namely copy, logicaland structural equivalence between formulas.
The three degrees of equivalence are:
Copy Equivalence: Two formulas are considered copy equivalent,if they are the same, as if they resulted from a copy and pasteoperation1. Of course, retyping could deliver a similar result.
Logical Equivalence: Two formulas are logical equivalent, if theydiffer only in absolute cell references or constants. Logi-cal equivalence is quite frequent for what-if analysis, and wefound out that it often results from copy-paste and modifyoperations.
Structural Equivalence: Two formulas are structural equivalent,if they differ in absolute, relative cell references or constants.Hence, for two formulas to be structural equivalent, it is re-quired that they apply the same functions in the same order todifferent arguments. For people used to procedural program-ming, structural equivalence might resemble to macros2.
1In order to compare cell references in formulas we use theR1C1style to specify them. The number after theR denotes how manyrows to move up or down from the referencing cell, whereas theCcomponents denotes how many columns to go to the left or right.E.g. the relative referenceR-3C2 in the cellD5 points to cellF2,in the cellB4 it would referenceD1. This notation was the oneoriginally used in Visicalc and is still used as the internal represen-tation in many modern spreadsheet systems.2We use the termmacrohere not in the spreadsheet context, but inthe context of procedural languages, e.g. a macro inC
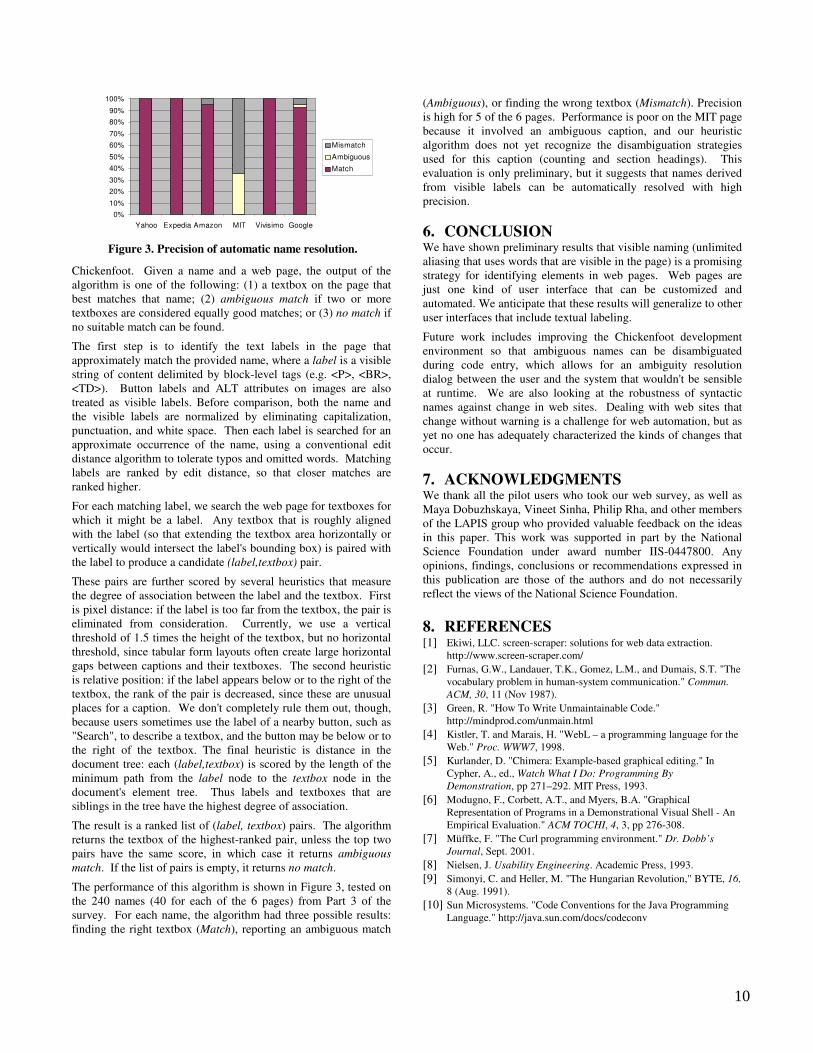
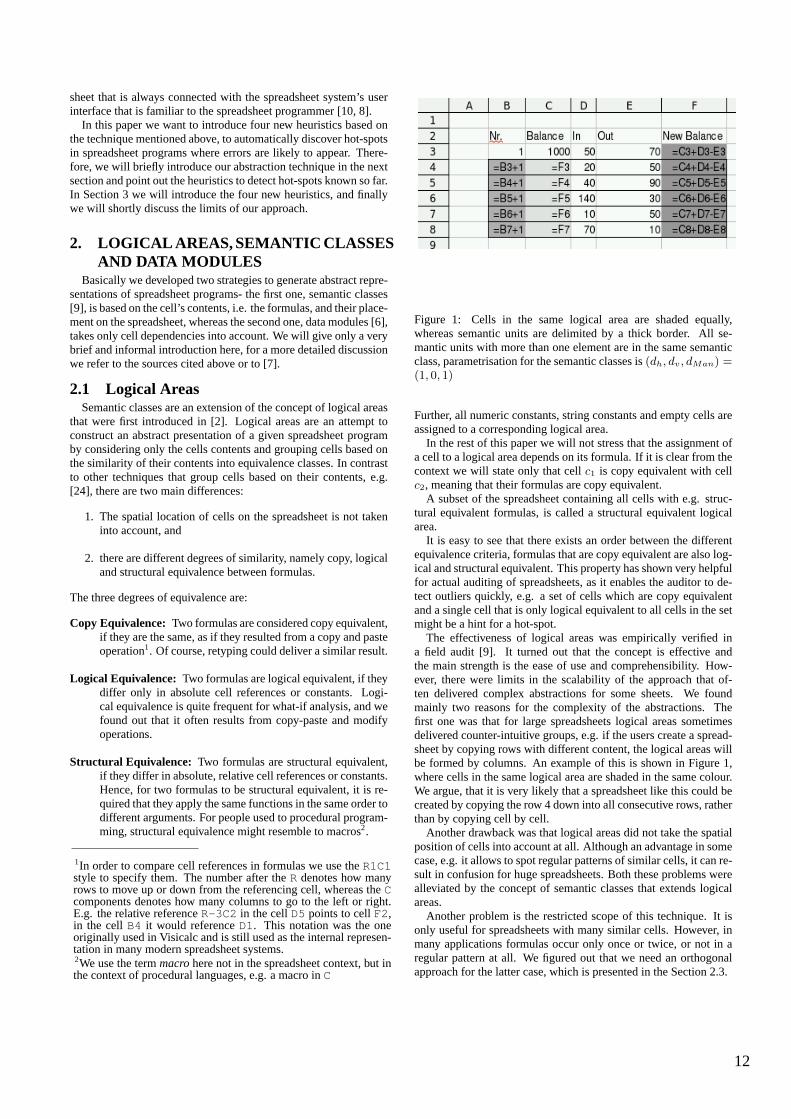
Figure 1: Cells in the same logical area are shaded equally,whereas semantic units are delimited by a thick border. All se-mantic units with more than one element are in the same semanticclass, parametrisation for the semantic classes is(dh, dv, dMan) =(1, 0, 1)
Further, all numeric constants, string constants and empty cells areassigned to a corresponding logical area.
In the rest of this paper we will not stress that the assignment ofa cell to a logical area depends on its formula. If it is clear from thecontext we will state only that cellc1 is copy equivalent with cellc2, meaning that their formulas are copy equivalent.
A subset of the spreadsheet containing all cells with e.g. struc-tural equivalent formulas, is called a structural equivalent logicalarea.
It is easy to see that there exists an order between the differentequivalence criteria, formulas that are copy equivalent are also log-ical and structural equivalent. This property has shown very helpfulfor actual auditing of spreadsheets, as it enables the auditor to de-tect outliers quickly, e.g. a set of cells which are copy equivalentand a single cell that is only logical equivalent to all cells in the setmight be a hint for a hot-spot.
The effectiveness of logical areas was empirically verified ina field audit [9]. It turned out that the concept is effective andthe main strength is the ease of use and comprehensibility. How-ever, there were limits in the scalability of the approach that of-ten delivered complex abstractions for some sheets. We foundmainly two reasons for the complexity of the abstractions. Thefirst one was that for large spreadsheets logical areas sometimesdelivered counter-intuitive groups, e.g. if the users create a spread-sheet by copying rows with different content, the logical areas willbe formed by columns. An example of this is shown in Figure 1,where cells in the same logical area are shaded in the same colour.We argue, that it is very likely that a spreadsheet like this could becreated by copying the row 4 down into all consecutive rows, ratherthan by copying cell by cell.
Another drawback was that logical areas did not take the spatialposition of cells into account at all. Although an advantage in somecase, e.g. it allows to spot regular patterns of similar cells, it can re-sult in confusion for huge spreadsheets. Both these problems werealleviated by the concept of semantic classes that extends logicalareas.
Another problem is the restricted scope of this technique. It isonly useful for spreadsheets with many similar cells. However, inmany applications formulas occur only once or twice, or not in aregular pattern at all. We figured out that we need an orthogonalapproach for the latter case, which is presented in the Section 2.3.
12
2.2 Semantic ClassesA semantic class can be described as a re-occurring block where
cells on the same relative position in the block are in the same log-ical area.
Blocks with similar cells on the same relative positions, con-secutively called semantic units, have to satisfy certain geometricconditions that can restrict their horizontal and vertical extension aswell as the size of gaps in these blocks. Originally, the geometricalconditions had to be supplied by the users by means of three param-eters:dh , dv anddMan . The first two specific the maximal size ofgaps in the semantic unit, either horizontally (dh) or vertically (dv).Thus, by settingdh to 1 anddv to0 users can require semantic unitsto consist of horizontally adjacent cells. Settingdh to 2 anddv to 0allows semantic units to consist of horizontally adjacent cells, withgaps spanning at most one cell. In [11, 12] a more advanced ap-proach is presented that uses layout information and labels to makeguided guesses about the geometrical shape and extent of semanticunits and, hence, the parametrisation is not necessary anymore.
In order to group a couple of semantic units into a semantic class,they are required to be similar. Two semantic units are consideredsimilar, if they have an identical geometrical shape and extent, andall the cells on same relative positions in the semantic units are inthe same logical area.
Semantic classes have the advantage that can deal very good withregular large spreadsheets, and small effects, e.g. a single deviat-ing cell, will cause an effect on the final abstraction. In discussionswith end users we figured out the further advantage, that this ab-straction technique will result in abstract units that correspond tothe way the users actually created the spreadsheet, i.e. copyingrows will result in semantic units that consist of the actual row, notthe other way round as it might happen with logical areas. In Figure1 the semantic units are framed with a thick border.
The remaining disadvantage is the required parametrisation. Usershave to have a basic understanding of the structure of the spread-sheet in advance, before they even apply this technique. We foundout that users have to be taught in this concept before they can suc-cessfully use it. This was not the case with logical areas. However,a recent master thesis [11] overcame some of these limitations andautomated the creation of semantic classes based on some heuris-tics.
2.2.1 Detecting Hot SpotsThere are basically three known heuristics to detect hot spots
of a spreadsheet program based on this abstraction[10]. The moststraight-forward one is to look for a regular pattern of distribu-tion of semantic units belonging to the same semantic class on thespreadsheet. Wherever that pattern, if any exists, is disrupted, acloser investigation is necessary.
A second strategy relies on the fact, that most errors are rathersmall deviations from a correct formula, e.g. a mis-reference or awrong constant. Thus, if there is a group of semantic units that is,for instance copy-equivalent, but there are a few outliers, that areonly logical-equivalent, it has to be investigated, whether an erroris the source of this difference.
The third strategy relies on the inspection of the so-calledSRGSC .TheSRGSC is a directed graph of dependencies between seman-tic classes. Each node in theSRGSC is a semantic class, and thereis an edge from one node to another, if a cell, that belongs to asemantic unit that is in the first semantic class (represented by thetarget node) references a cell in a semantic unit of the semanticclass that is represented by the source node. This graph reflects thecell dependencies of the original spreadsheet, but on a higher levelof abstraction. In [10, 7] we suggest a fish-eye view approach to
auditing based on theSRGSC . Some of the new auditing heuris-tics presented in Section 3 make use of theSRGSC as well, but, incontrast to the existing approaches, the ones suggested here can becarried out automatically.
2.3 Data ModulesSpreadsheet programs have some basic characteristics of data
flow programs and of graph-reduction programs, too (see [13]).Thus, the data-dependency graph, subsequently calledDDG, ofa spreadsheet program has an important role for its execution. TheDDG is a directed, acyclic graph, where every node represents acell of the spreadsheet program. There is an edge between twonodes, if the cell represented by the target node is referencing thecell represented by the source node. Vertices that are not the sourceof any edge are called sink nodes.
To grasp the idea, one can assume that a data module is a setof cells with a distinguished result cell, that is transitively depen-dent on all cells in the data module. Cells that are outside the datamodule may only reference its result cell. Broadly speaking, a datamodule is a subgraph of theDDG, that has only a single sink node,namely its result cell. The result cell of such a data module is ei-ther a sink node of theDDG, i.e. a result cell of the spreadsheetprogram, or a node that is connected to more than one data mod-ule. For a formal definition and algorithms to recover data modulesfrom existing spreadsheets, see [6]
Spreadsheet programmers are not forced to follow a certain de-sign paradigm and identify data-modules, but we try to identifydata modules by analysing the finished spreadsheet. Cells that arenot part of a specific data module may reference only its result cell.Obviously, this definition is recursive, but because of the hierarchi-cal organisation of aDDG and its finiteness, this is not a problem.As the data modules are not a-priori known, we have developed away to recover them out of the spreadsheet’sDDG. The recoveryof data modules will start assuming the spreadsheet’s result cellsto be data modules and adds all cells that are only referenced byone data module to the referencing data module. A cell that tran-sitively contributes to more than one data module is assumed to bethe starting point of a new data module and will be treated in thesame way.
Before theDDG can be partitioned into such data modules, theresult cells have to be identified. Obviously, not all sink nodes ofthe DDG have the semantics of a result of the spreadsheet pro-gram, e.g. check-sums. In contrast to conventional programmingwhere intermediate results are not displayed and each subroutinehas a well defined result, in a spreadsheet each intermediate resultis visible to the user and to all the other formulas. Sometimes, cal-culations are deliberately formulated in a more complicated way inorder to obtain some desired intermediate results.
Cells of a spreadsheet program are either auxiliary, intermedi-ate or result cells. For sure, cells that are not further referencedby other cells can be considered result cells, because we know thatusers place them on the spreadsheet, because they want to see theircontents. If they would not like to see the displayed value, they hadnot introduced this cell. Therefore, it seems legitimate to considerDDG sink nodes as result cells, and start constructing data mod-ules by searching cells, that influence a specific result. As a matterof fact, it is often the case, that sink nodes in theDDG are not thereal results, but check-sums. In this case, the check-sums have tobe removed manually, and the remainingDDG is then analysed.
2.3.1 Detecting Hot SpotsData modules are particularly useful to identify errors due to
mis-references. If a planned cell reference is not part of a formula,
13
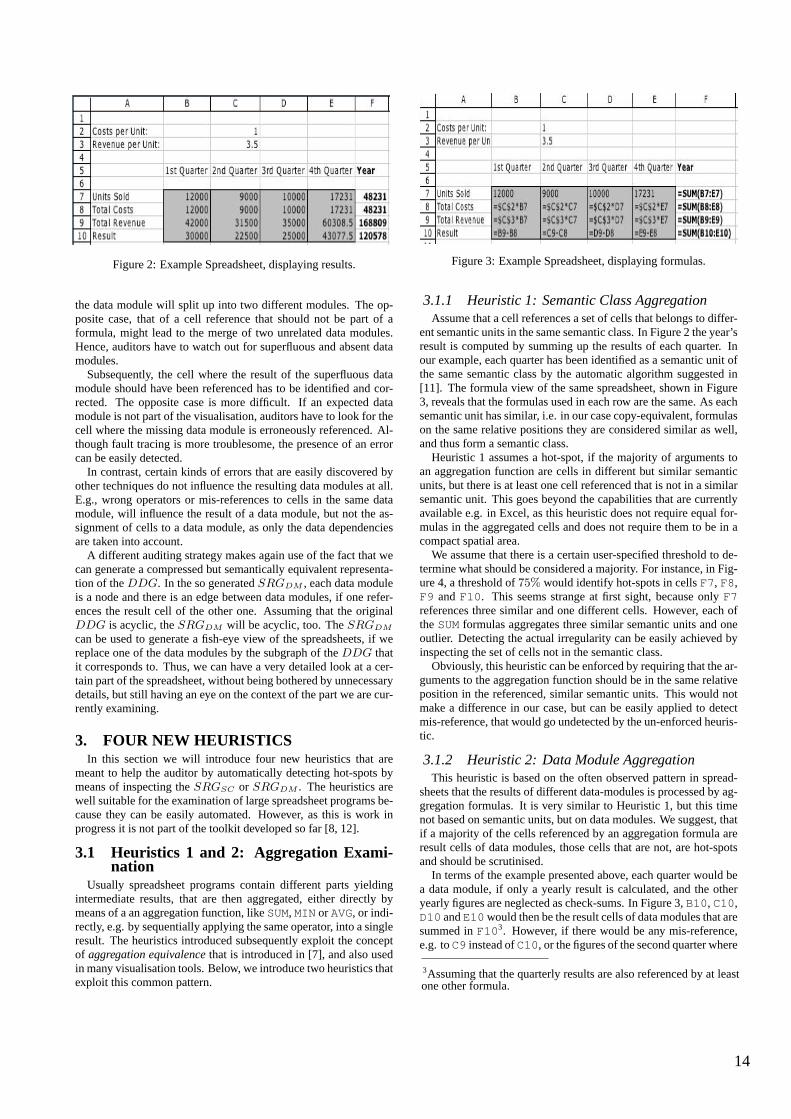
Figure 2: Example Spreadsheet, displaying results.
the data module will split up into two different modules. The op-posite case, that of a cell reference that should not be part of aformula, might lead to the merge of two unrelated data modules.Hence, auditors have to watch out for superfluous and absent datamodules.
Subsequently, the cell where the result of the superfluous datamodule should have been referenced has to be identified and cor-rected. The opposite case is more difficult. If an expected datamodule is not part of the visualisation, auditors have to look for thecell where the missing data module is erroneously referenced. Al-though fault tracing is more troublesome, the presence of an errorcan be easily detected.
In contrast, certain kinds of errors that are easily discovered byother techniques do not influence the resulting data modules at all.E.g., wrong operators or mis-references to cells in the same datamodule, will influence the result of a data module, but not the as-signment of cells to a data module, as only the data dependenciesare taken into account.
A different auditing strategy makes again use of the fact that wecan generate a compressed but semantically equivalent representa-tion of theDDG. In the so generatedSRGDM , each data moduleis a node and there is an edge between data modules, if one refer-ences the result cell of the other one. Assuming that the originalDDG is acyclic, theSRGDM will be acyclic, too. TheSRGDM
can be used to generate a fish-eye view of the spreadsheets, if wereplace one of the data modules by the subgraph of theDDG thatit corresponds to. Thus, we can have a very detailed look at a cer-tain part of the spreadsheet, without being bothered by unnecessarydetails, but still having an eye on the context of the part we are cur-rently examining.
3. FOUR NEW HEURISTICSIn this section we will introduce four new heuristics that are
meant to help the auditor by automatically detecting hot-spots bymeans of inspecting theSRGSC or SRGDM . The heuristics arewell suitable for the examination of large spreadsheet programs be-cause they can be easily automated. However, as this is work inprogress it is not part of the toolkit developed so far [8, 12].
3.1 Heuristics 1 and 2: Aggregation Exami-nation
Usually spreadsheet programs contain different parts yieldingintermediate results, that are then aggregated, either directly bymeans of a an aggregation function, likeSUM, MIN or AVG, or indi-rectly, e.g. by sequentially applying the same operator, into a singleresult. The heuristics introduced subsequently exploit the conceptof aggregation equivalencethat is introduced in [7], and also usedin many visualisation tools. Below, we introduce two heuristics thatexploit this common pattern.
Figure 3: Example Spreadsheet, displaying formulas.
3.1.1 Heuristic 1: Semantic Class AggregationAssume that a cell references a set of cells that belongs to differ-
ent semantic units in the same semantic class. In Figure 2 the year’sresult is computed by summing up the results of each quarter. Inour example, each quarter has been identified as a semantic unit ofthe same semantic class by the automatic algorithm suggested in[11]. The formula view of the same spreadsheet, shown in Figure3, reveals that the formulas used in each row are the same. As eachsemantic unit has similar, i.e. in our case copy-equivalent, formulason the same relative positions they are considered similar as well,and thus form a semantic class.
Heuristic 1 assumes a hot-spot, if the majority of arguments toan aggregation function are cells in different but similar semanticunits, but there is at least one cell referenced that is not in a similarsemantic unit. This goes beyond the capabilities that are currentlyavailable e.g. in Excel, as this heuristic does not require equal for-mulas in the aggregated cells and does not require them to be in acompact spatial area.
We assume that there is a certain user-specified threshold to de-termine what should be considered a majority. For instance, in Fig-ure 4, a threshold of75% would identify hot-spots in cellsF7, F8,F9 andF10. This seems strange at first sight, because onlyF7references three similar and one different cells. However, each oftheSUMformulas aggregates three similar semantic units and oneoutlier. Detecting the actual irregularity can be easily achieved byinspecting the set of cells not in the semantic class.
Obviously, this heuristic can be enforced by requiring that the ar-guments to the aggregation function should be in the same relativeposition in the referenced, similar semantic units. This would notmake a difference in our case, but can be easily applied to detectmis-reference, that would go undetected by the un-enforced heuris-tic.
3.1.2 Heuristic 2: Data Module AggregationThis heuristic is based on the often observed pattern in spread-
sheets that the results of different data-modules is processed by ag-gregation formulas. It is very similar to Heuristic 1, but this timenot based on semantic units, but on data modules. We suggest, thatif a majority of the cells referenced by an aggregation formula areresult cells of data modules, those cells that are not, are hot-spotsand should be scrutinised.
In terms of the example presented above, each quarter would bea data module, if only a yearly result is calculated, and the otheryearly figures are neglected as check-sums. In Figure 3,B10, C10,D10 andE10 would then be the result cells of data modules that aresummed inF103. However, if there would be any mis-reference,e.g. toC9 instead ofC10, or the figures of the second quarter where
3Assuming that the quarterly results are also referenced by at leastone other formula.
14
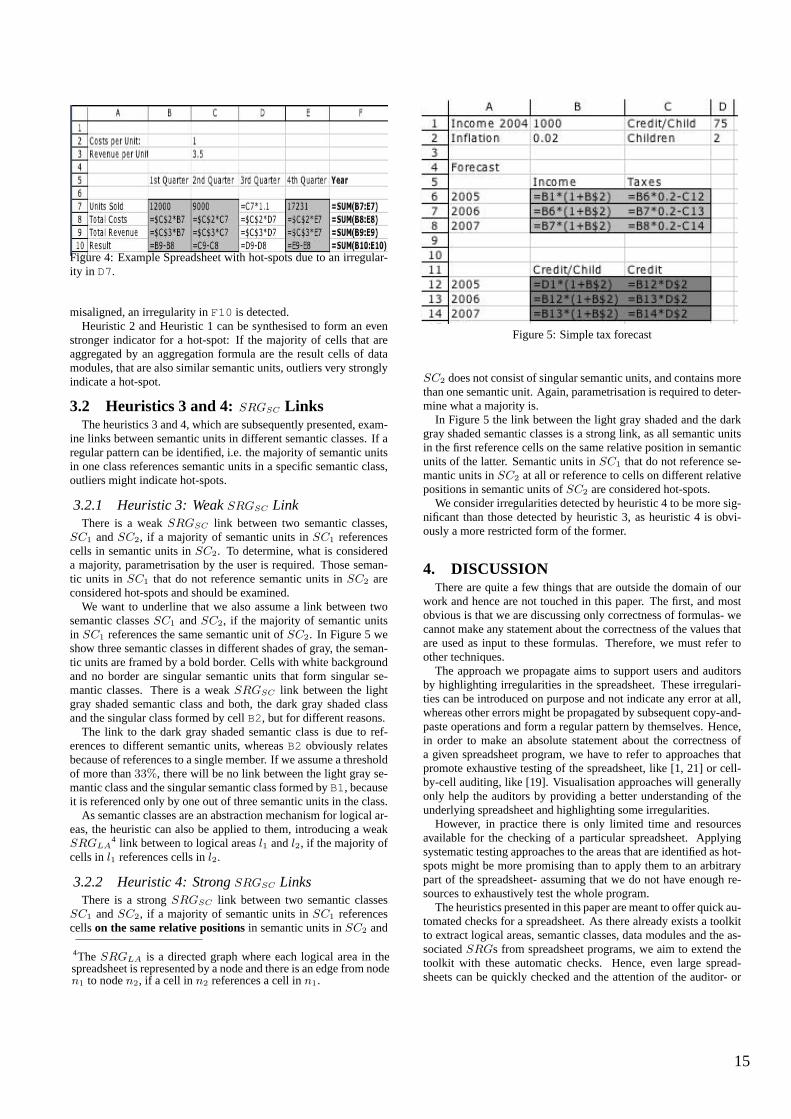
Figure 4: Example Spreadsheet with hot-spots due to an irregular-ity in D7.
misaligned, an irregularity inF10 is detected.Heuristic 2 and Heuristic 1 can be synthesised to form an even
stronger indicator for a hot-spot: If the majority of cells that areaggregated by an aggregation formula are the result cells of datamodules, that are also similar semantic units, outliers very stronglyindicate a hot-spot.
3.2 Heuristics 3 and 4:SRGSC LinksThe heuristics 3 and 4, which are subsequently presented, exam-
ine links between semantic units in different semantic classes. If aregular pattern can be identified, i.e. the majority of semantic unitsin one class references semantic units in a specific semantic class,outliers might indicate hot-spots.
3.2.1 Heuristic 3: WeakSRGSC LinkThere is a weakSRGSC link between two semantic classes,
SC1 andSC2, if a majority of semantic units inSC1 referencescells in semantic units inSC2. To determine, what is considereda majority, parametrisation by the user is required. Those seman-tic units in SC1 that do not reference semantic units inSC2 areconsidered hot-spots and should be examined.
We want to underline that we also assume a link between twosemantic classesSC1 andSC2, if the majority of semantic unitsin SC1 references the same semantic unit ofSC2. In Figure 5 weshow three semantic classes in different shades of gray, the seman-tic units are framed by a bold border. Cells with white backgroundand no border are singular semantic units that form singular se-mantic classes. There is a weakSRGSC link between the lightgray shaded semantic class and both, the dark gray shaded classand the singular class formed by cellB2, but for different reasons.
The link to the dark gray shaded semantic class is due to ref-erences to different semantic units, whereasB2 obviously relatesbecause of references to a single member. If we assume a thresholdof more than33%, there will be no link between the light gray se-mantic class and the singular semantic class formed byB1, becauseit is referenced only by one out of three semantic units in the class.
As semantic classes are an abstraction mechanism for logical ar-eas, the heuristic can also be applied to them, introducing a weakSRGLA
4 link between to logical areasl1 andl2, if the majority ofcells inl1 references cells inl2.
3.2.2 Heuristic 4: StrongSRGSC LinksThere is a strongSRGSC link between two semantic classes
SC1 andSC2, if a majority of semantic units inSC1 referencescellson the same relative positionsin semantic units inSC2 and
4The SRGLA is a directed graph where each logical area in thespreadsheet is represented by a node and there is an edge from noden1 to noden2, if a cell in n2 references a cell inn1.
Figure 5: Simple tax forecast
SC2 does not consist of singular semantic units, and contains morethan one semantic unit. Again, parametrisation is required to deter-mine what a majority is.
In Figure 5 the link between the light gray shaded and the darkgray shaded semantic classes is a strong link, as all semantic unitsin the first reference cells on the same relative position in semanticunits of the latter. Semantic units inSC1 that do not reference se-mantic units inSC2 at all or reference to cells on different relativepositions in semantic units ofSC2 are considered hot-spots.
We consider irregularities detected by heuristic 4 to be more sig-nificant than those detected by heuristic 3, as heuristic 4 is obvi-ously a more restricted form of the former.
4. DISCUSSIONThere are quite a few things that are outside the domain of our
work and hence are not touched in this paper. The first, and mostobvious is that we are discussing only correctness of formulas- wecannot make any statement about the correctness of the values thatare used as input to these formulas. Therefore, we must refer toother techniques.
The approach we propagate aims to support users and auditorsby highlighting irregularities in the spreadsheet. These irregulari-ties can be introduced on purpose and not indicate any error at all,whereas other errors might be propagated by subsequent copy-and-paste operations and form a regular pattern by themselves. Hence,in order to make an absolute statement about the correctness ofa given spreadsheet program, we have to refer to approaches thatpromote exhaustive testing of the spreadsheet, like [1, 21] or cell-by-cell auditing, like [19]. Visualisation approaches will generallyonly help the auditors by providing a better understanding of theunderlying spreadsheet and highlighting some irregularities.
However, in practice there is only limited time and resourcesavailable for the checking of a particular spreadsheet. Applyingsystematic testing approaches to the areas that are identified as hot-spots might be more promising than to apply them to an arbitrarypart of the spreadsheet- assuming that we do not have enough re-sources to exhaustively test the whole program.
The heuristics presented in this paper are meant to offer quick au-tomated checks for a spreadsheet. As there already exists a toolkitto extract logical areas, semantic classes, data modules and the as-sociatedSRGs from spreadsheet programs, we aim to extend thetoolkit with these automatic checks. Hence, even large spread-sheets can be quickly checked and the attention of the auditor- or
15
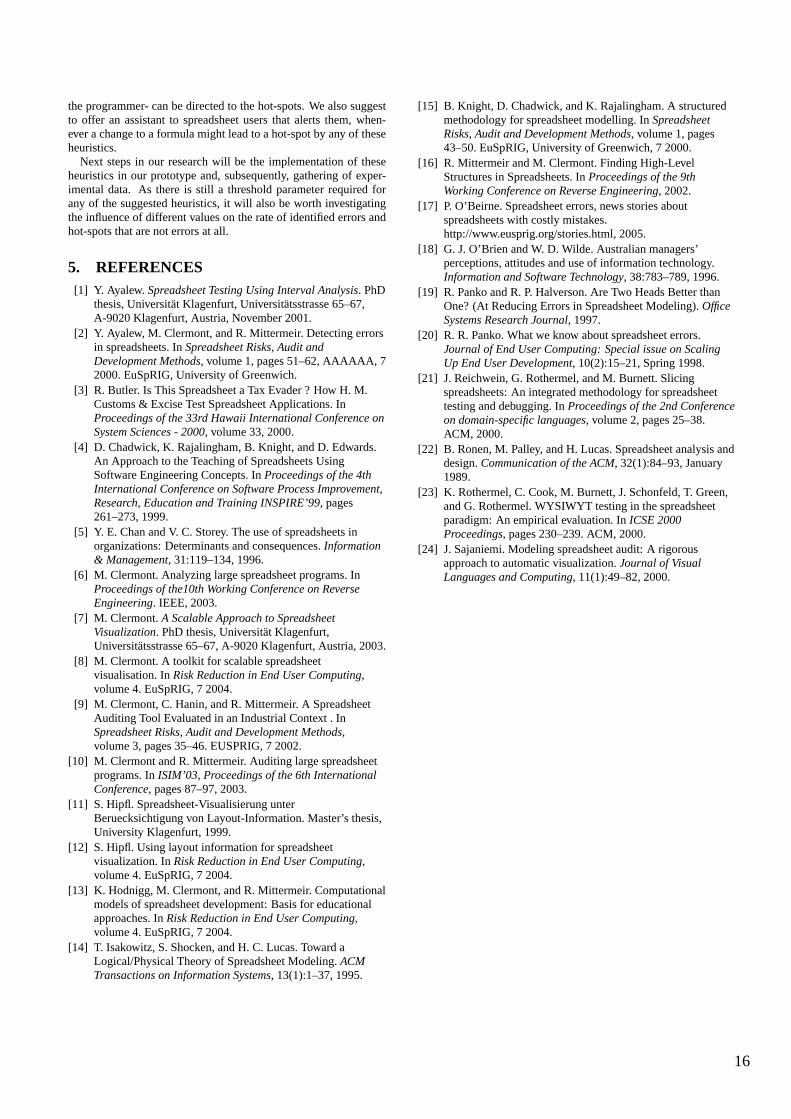
the programmer- can be directed to the hot-spots. We also suggestto offer an assistant to spreadsheet users that alerts them, when-ever a change to a formula might lead to a hot-spot by any of theseheuristics.
Next steps in our research will be the implementation of theseheuristics in our prototype and, subsequently, gathering of exper-imental data. As there is still a threshold parameter required forany of the suggested heuristics, it will also be worth investigatingthe influence of different values on the rate of identified errors andhot-spots that are not errors at all.
5. REFERENCES[1] Y. Ayalew. Spreadsheet Testing Using Interval Analysis. PhD
thesis, Universitat Klagenfurt, Universitatsstrasse 65–67,A-9020 Klagenfurt, Austria, November 2001.
[2] Y. Ayalew, M. Clermont, and R. Mittermeir. Detecting errorsin spreadsheets. InSpreadsheet Risks, Audit andDevelopment Methods, volume 1, pages 51–62, AAAAAA, 72000. EuSpRIG, University of Greenwich.
[3] R. Butler. Is This Spreadsheet a Tax Evader ? How H. M.Customs & Excise Test Spreadsheet Applications. InProceedings of the 33rd Hawaii International Conference onSystem Sciences - 2000, volume 33, 2000.
[4] D. Chadwick, K. Rajalingham, B. Knight, and D. Edwards.An Approach to the Teaching of Spreadsheets UsingSoftware Engineering Concepts. InProceedings of the 4thInternational Conference on Software Process Improvement,Research, Education and Training INSPIRE’99, pages261–273, 1999.
[5] Y. E. Chan and V. C. Storey. The use of spreadsheets inorganizations: Determinants and consequences.Information& Management, 31:119–134, 1996.
[6] M. Clermont. Analyzing large spreadsheet programs. InProceedings of the10th Working Conference on ReverseEngineering. IEEE, 2003.
[7] M. Clermont.A Scalable Approach to SpreadsheetVisualization. PhD thesis, Universitat Klagenfurt,Universitatsstrasse 65–67, A-9020 Klagenfurt, Austria, 2003.
[8] M. Clermont. A toolkit for scalable spreadsheetvisualisation. InRisk Reduction in End User Computing,volume 4. EuSpRIG, 7 2004.
[9] M. Clermont, C. Hanin, and R. Mittermeir. A SpreadsheetAuditing Tool Evaluated in an Industrial Context . InSpreadsheet Risks, Audit and Development Methods,volume 3, pages 35–46. EUSPRIG, 7 2002.
[10] M. Clermont and R. Mittermeir. Auditing large spreadsheetprograms. InISIM’03, Proceedings of the 6th InternationalConference, pages 87–97, 2003.
[11] S. Hipfl. Spreadsheet-Visualisierung unterBeruecksichtigung von Layout-Information. Master’s thesis,University Klagenfurt, 1999.
[12] S. Hipfl. Using layout information for spreadsheetvisualization. InRisk Reduction in End User Computing,volume 4. EuSpRIG, 7 2004.
[13] K. Hodnigg, M. Clermont, and R. Mittermeir. Computationalmodels of spreadsheet development: Basis for educationalapproaches. InRisk Reduction in End User Computing,volume 4. EuSpRIG, 7 2004.
[14] T. Isakowitz, S. Shocken, and H. C. Lucas. Toward aLogical/Physical Theory of Spreadsheet Modeling.ACMTransactions on Information Systems, 13(1):1–37, 1995.
[15] B. Knight, D. Chadwick, and K. Rajalingham. A structuredmethodology for spreadsheet modelling. InSpreadsheetRisks, Audit and Development Methods, volume 1, pages43–50. EuSpRIG, University of Greenwich, 7 2000.
[16] R. Mittermeir and M. Clermont. Finding High-LevelStructures in Spreadsheets. InProceedings of the 9thWorking Conference on Reverse Engineering, 2002.
[17] P. O’Beirne. Spreadsheet errors, news stories aboutspreadsheets with costly mistakes.http://www.eusprig.org/stories.html, 2005.
[18] G. J. O’Brien and W. D. Wilde. Australian managers’perceptions, attitudes and use of information technology.Information and Software Technology, 38:783–789, 1996.
[19] R. Panko and R. P. Halverson. Are Two Heads Better thanOne? (At Reducing Errors in Spreadsheet Modeling).OfficeSystems Research Journal, 1997.
[20] R. R. Panko. What we know about spreadsheet errors.Journal of End User Computing: Special issue on ScalingUp End User Development, 10(2):15–21, Spring 1998.
[21] J. Reichwein, G. Rothermel, and M. Burnett. Slicingspreadsheets: An integrated methodology for spreadsheettesting and debugging. InProceedings of the 2nd Conferenceon domain-specific languages, volume 2, pages 25–38.ACM, 2000.
[22] B. Ronen, M. Palley, and H. Lucas. Spreadsheet analysis anddesign.Communication of the ACM, 32(1):84–93, January1989.
[23] K. Rothermel, C. Cook, M. Burnett, J. Schonfeld, T. Green,and G. Rothermel. WYSIWYT testing in the spreadsheetparadigm: An empirical evaluation. InICSE 2000Proceedings, pages 230–239. ACM, 2000.
[24] J. Sajaniemi. Modeling spreadsheet audit: A rigorousapproach to automatic visualization.Journal of VisualLanguages and Computing, 11(1):49–82, 2000.
16
Fault Patterns in Matlab
Fidel Nkwocha and Sebastian ElbaumComputer Science and Engineering Department,
University of Nebraska-Lincoln,Lincoln, Nebraska, USA,
{fnkwocha, elbaum}@cse.unl.edu
ABSTRACTFault patterns are code idioms that may constitute faults.Software engineers have various program analysis techniquesand tools to assist them in the detection of such patterns, re-sulting in increased software quality. End user programmers,however, often lack such support. In this paper we take afirst step to address this limitation in the context of Matlab.First, we adapt fault patterns commonly used in other pro-gramming languages to Matlab. Second, we present a toolto detect such patterns in fifteen popular Matlab programs.Our results reveal that these simple and quickly identifiablepatterns are commonly found in Matlab programs developedby end users and shared across the large Matlab communityof end user programmers.
Categories and Subject Descriptors:D.2.5 [SoftwareEngineering]:Testing and Debugging, D.2.6 [Software En-gineering]: Programming Environments.
General Terms: Languages, Reliability, Verification.
Keywords: End-user software engineering, static analysis.
1. INTRODUCTIONSoftware engineers perform multiple fault detection activi-ties. These activities are often supported by tools that makethem more cost-effective. Fault pattern recognition tools areamong the most popular to support fault finding activitieson source code.
Fault patterns are code idioms that may constitute faults.Software engineers have many tools at their disposal to helpthem recognize such patterns [2, 4]. Although the complex-ity and power of these tools vary, they consist primarily ofan analyzer which examines the code or a particular abstrac-tion of the code to identify fault patterns.
Tools to recognize fault patterns are appealing because theyare able to provide quick feedback about potential faultswithout requiring program execution. However, the effec-
tiveness of this type of tool is limited by the library ofsearched patterns, the analysis efficiency, and the false warn-ings caused by poor programming practices that reflect faultpatterns but are not always faults.
The concept of fault pattern recognition is particularly in-teresting to end user programmers because: 1) fault patterndetection can be performed quickly, with minimum disrup-tion of the end user regular activities, 2) fault patterns areparticularly effective to detect language constructs misusewhich is a common scenario for end user programmers, and3) tools to recognize fault patterns are not prevalent in enduser programming environments.
In this paper we present a prototype tool to perform faultpattern recognition in the context of Matlab, a software de-velopment environment oriented towards scientists and en-gineers. Section 2 introduces our first set of Matlab faultpatterns. Section 3 presents a study showing how prevalentthese simple fault patterns are in some of the most popularopen Matlab modules available. Section 4 summarizes re-lated work, and Section 5 discusses potential improvementsfor a more seamless incorporation of fault pattern recogni-tion into the Matlab environment.
2. MATLAB FAULT PATTERNSMatlab, which stands for “Matrix Laboratory”, is a commer-cial software package originally intended to provide compu-tation support for matrix manipulation. As Matlab evolved,not only its libraries became more powerful, but it alsostarted to incorporate visualization and programming sup-port capabilities. The current Matlab version (Matlab 7.0)offers an environment that even includes debugging and pro-filing features.
The Matlab programming language is a high level languageoften characterized as a scripting language. However, Mat-lab has evolved into a complex language that, for example,incorporates the concept of type objects while still acceptingdeclarations without explicit types.
Programs written in Matlab are generally interpreted 1 andcan be executed in interactive or batch mode. In interactive
1Users can build stand alone applications through wrapperclasses that are then linked to shared Matlab libraries avail-able in C and C++. However, such stand alone applicationscover just a subset of the functionality that can be includedin interpreted mode.
Permission to make digital or hard copies of all or part of this work forpersonal or classroom use is granted without fee provided that copies arenot made or distributed for profit or commercial advantage, and that copiesbear this notice and the full citation on the first page. To copy otherwise, torepublish, to post on servers or to redistribute to lists, requires prior specificpermission and/or a fee.First Workshop on End-User Software Engineering (WEUSE I).May 212005, Saint Louis, Missouri, USA.Copyright ACM 1-59593-131-7/05/0005$5.00.
17
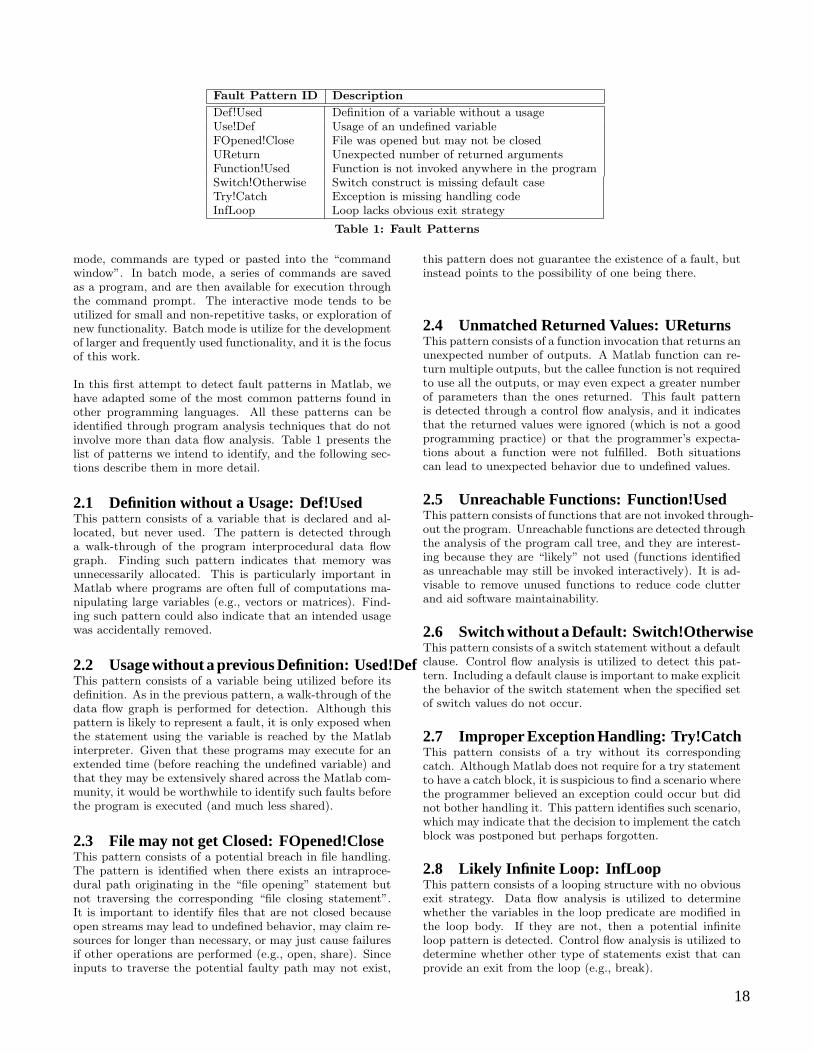
Fault Pattern ID Description
Def!Used Definition of a variable without a usageUse!Def Usage of an undefined variableFOpened!Close File was opened but may not be closedUReturn Unexpected number of returned argumentsFunction!Used Function is not invoked anywhere in the programSwitch!Otherwise Switch construct is missing default caseTry!Catch Exception is missing handling codeInfLoop Loop lacks obvious exit strategy
Table 1: Fault Patterns
mode, commands are typed or pasted into the “commandwindow”. In batch mode, a series of commands are savedas a program, and are then available for execution throughthe command prompt. The interactive mode tends to beutilized for small and non-repetitive tasks, or exploration ofnew functionality. Batch mode is utilize for the developmentof larger and frequently used functionality, and it is the focusof this work.
In this first attempt to detect fault patterns in Matlab, wehave adapted some of the most common patterns found inother programming languages. All these patterns can beidentified through program analysis techniques that do notinvolve more than data flow analysis. Table 1 presents thelist of patterns we intend to identify, and the following sec-tions describe them in more detail.
2.1 Definition without a Usage: Def!UsedThis pattern consists of a variable that is declared and al-located, but never used. The pattern is detected througha walk-through of the program interprocedural data flowgraph. Finding such pattern indicates that memory wasunnecessarily allocated. This is particularly important inMatlab where programs are often full of computations ma-nipulating large variables (e.g., vectors or matrices). Find-ing such pattern could also indicate that an intended usagewas accidentally removed.
2.2 Usage without a previous Definition: Used!DefThis pattern consists of a variable being utilized before itsdefinition. As in the previous pattern, a walk-through of thedata flow graph is performed for detection. Although thispattern is likely to represent a fault, it is only exposed whenthe statement using the variable is reached by the Matlabinterpreter. Given that these programs may execute for anextended time (before reaching the undefined variable) andthat they may be extensively shared across the Matlab com-munity, it would be worthwhile to identify such faults beforethe program is executed (and much less shared).
2.3 File may not get Closed: FOpened!CloseThis pattern consists of a potential breach in file handling.The pattern is identified when there exists an intraproce-dural path originating in the “file opening” statement butnot traversing the corresponding “file closing statement”.It is important to identify files that are not closed becauseopen streams may lead to undefined behavior, may claim re-sources for longer than necessary, or may just cause failuresif other operations are performed (e.g., open, share). Sinceinputs to traverse the potential faulty path may not exist,
this pattern does not guarantee the existence of a fault, butinstead points to the possibility of one being there.
2.4 Unmatched Returned Values: UReturnsThis pattern consists of a function invocation that returns anunexpected number of outputs. A Matlab function can re-turn multiple outputs, but the callee function is not requiredto use all the outputs, or may even expect a greater numberof parameters than the ones returned. This fault patternis detected through a control flow analysis, and it indicatesthat the returned values were ignored (which is not a goodprogramming practice) or that the programmer’s expecta-tions about a function were not fulfilled. Both situationscan lead to unexpected behavior due to undefined values.
2.5 Unreachable Functions: Function!UsedThis pattern consists of functions that are not invoked through-out the program. Unreachable functions are detected throughthe analysis of the program call tree, and they are interest-ing because they are “likely” not used (functions identifiedas unreachable may still be invoked interactively). It is ad-visable to remove unused functions to reduce code clutterand aid software maintainability.
2.6 Switch without a Default: Switch!OtherwiseThis pattern consists of a switch statement without a defaultclause. Control flow analysis is utilized to detect this pat-tern. Including a default clause is important to make explicitthe behavior of the switch statement when the specified setof switch values do not occur.
2.7 Improper Exception Handling: Try!CatchThis pattern consists of a try without its correspondingcatch. Although Matlab does not require for a try statementto have a catch block, it is suspicious to find a scenario wherethe programmer believed an exception could occur but didnot bother handling it. This pattern identifies such scenario,which may indicate that the decision to implement the catchblock was postponed but perhaps forgotten.
2.8 Likely Infinite Loop: InfLoopThis pattern consists of a looping structure with no obviousexit strategy. Data flow analysis is utilized to determinewhether the variables in the loop predicate are modified inthe loop body. If they are not, then a potential infiniteloop pattern is detected. Control flow analysis is utilized todetermine whether other type of statements exist that canprovide an exit from the loop (e.g., break).
18
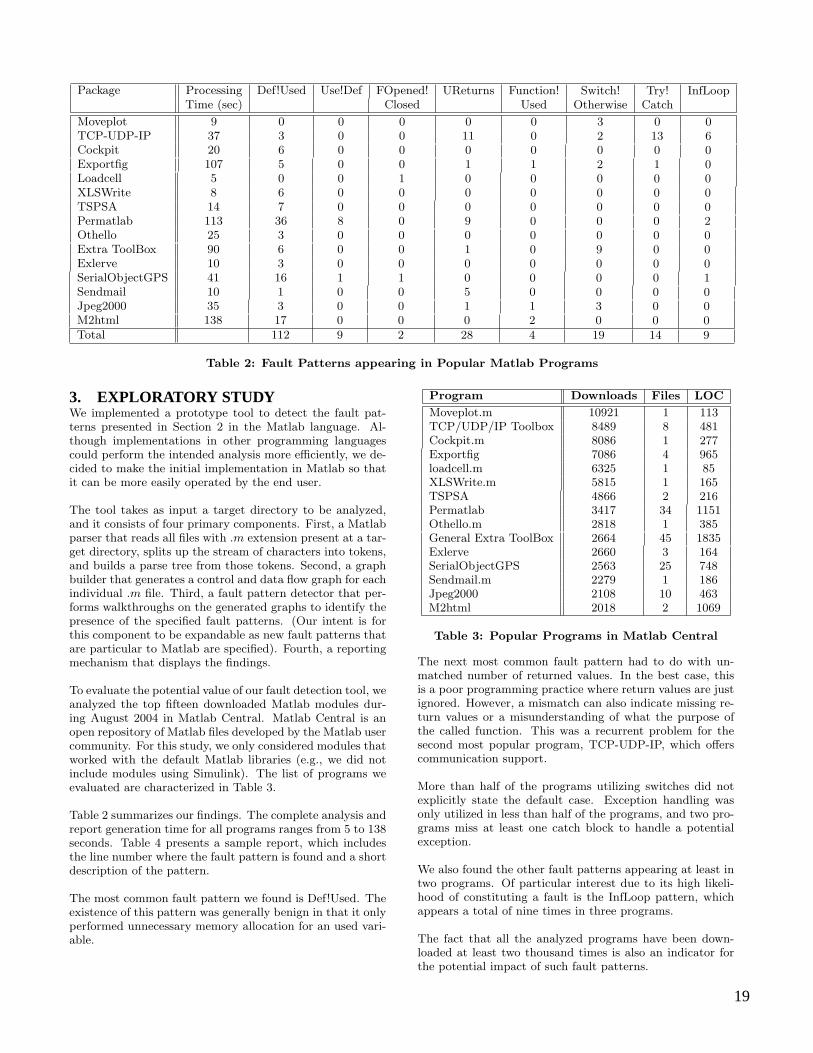
Package Processing Def!Used Use!Def FOpened! UReturns Function! Switch! Try! InfLoopTime (sec) Closed Used Otherwise Catch
Moveplot 9 0 0 0 0 0 3 0 0TCP-UDP-IP 37 3 0 0 11 0 2 13 6Cockpit 20 6 0 0 0 0 0 0 0Exportfig 107 5 0 0 1 1 2 1 0Loadcell 5 0 0 1 0 0 0 0 0XLSWrite 8 6 0 0 0 0 0 0 0TSPSA 14 7 0 0 0 0 0 0 0Permatlab 113 36 8 0 9 0 0 0 2Othello 25 3 0 0 0 0 0 0 0Extra ToolBox 90 6 0 0 1 0 9 0 0Exlerve 10 3 0 0 0 0 0 0 0SerialObjectGPS 41 16 1 1 0 0 0 0 1Sendmail 10 1 0 0 5 0 0 0 0Jpeg2000 35 3 0 0 1 1 3 0 0M2html 138 17 0 0 0 2 0 0 0Total 112 9 2 28 4 19 14 9
Table 2: Fault Patterns appearing in Popular Matlab Programs
3. EXPLORATORY STUDYWe implemented a prototype tool to detect the fault pat-terns presented in Section 2 in the Matlab language. Al-though implementations in other programming languagescould perform the intended analysis more efficiently, we de-cided to make the initial implementation in Matlab so thatit can be more easily operated by the end user.
The tool takes as input a target directory to be analyzed,and it consists of four primary components. First, a Matlabparser that reads all files with .m extension present at a tar-get directory, splits up the stream of characters into tokens,and builds a parse tree from those tokens. Second, a graphbuilder that generates a control and data flow graph for eachindividual .m file. Third, a fault pattern detector that per-forms walkthroughs on the generated graphs to identify thepresence of the specified fault patterns. (Our intent is forthis component to be expandable as new fault patterns thatare particular to Matlab are specified). Fourth, a reportingmechanism that displays the findings.
To evaluate the potential value of our fault detection tool, weanalyzed the top fifteen downloaded Matlab modules dur-ing August 2004 in Matlab Central. Matlab Central is anopen repository of Matlab files developed by the Matlab usercommunity. For this study, we only considered modules thatworked with the default Matlab libraries (e.g., we did notinclude modules using Simulink). The list of programs weevaluated are characterized in Table 3.
Table 2 summarizes our findings. The complete analysis andreport generation time for all programs ranges from 5 to 138seconds. Table 4 presents a sample report, which includesthe line number where the fault pattern is found and a shortdescription of the pattern.
The most common fault pattern we found is Def!Used. Theexistence of this pattern was generally benign in that it onlyperformed unnecessary memory allocation for an used vari-able.
Program Downloads Files LOC
Moveplot.m 10921 1 113TCP/UDP/IP Toolbox 8489 8 481Cockpit.m 8086 1 277Exportfig 7086 4 965loadcell.m 6325 1 85XLSWrite.m 5815 1 165TSPSA 4866 2 216Permatlab 3417 34 1151Othello.m 2818 1 385General Extra ToolBox 2664 45 1835Exlerve 2660 3 164SerialObjectGPS 2563 25 748Sendmail.m 2279 1 186Jpeg2000 2108 10 463M2html 2018 2 1069
Table 3: Popular Programs in Matlab Central
The next most common fault pattern had to do with un-matched number of returned values. In the best case, thisis a poor programming practice where return values are justignored. However, a mismatch can also indicate missing re-turn values or a misunderstanding of what the purpose ofthe called function. This was a recurrent problem for thesecond most popular program, TCP-UDP-IP, which offerscommunication support.
More than half of the programs utilizing switches did notexplicitly state the default case. Exception handling wasonly utilized in less than half of the programs, and two pro-grams miss at least one catch block to handle a potentialexception.
We also found the other fault patterns appearing at least intwo programs. Of particular interest due to its high likeli-hood of constituting a fault is the InfLoop pattern, whichappears a total of nine times in three programs.
The fact that all the analyzed programs have been down-loaded at least two thousand times is also an indicator forthe potential impact of such fault patterns.
19
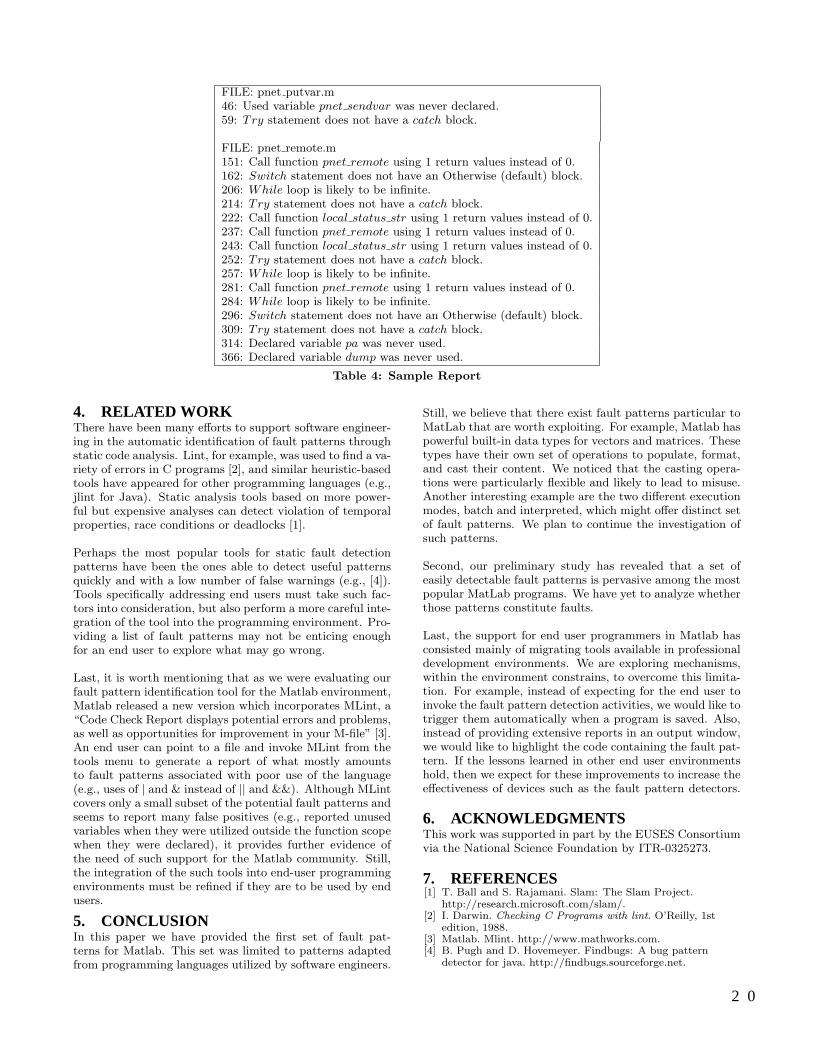
FILE: pnet putvar.m46: Used variable pnet sendvar was never declared.59: Try statement does not have a catch block.
FILE: pnet remote.m151: Call function pnet remote using 1 return values instead of 0.162: Switch statement does not have an Otherwise (default) block.206: While loop is likely to be infinite.214: Try statement does not have a catch block.222: Call function local status str using 1 return values instead of 0.237: Call function pnet remote using 1 return values instead of 0.243: Call function local status str using 1 return values instead of 0.252: Try statement does not have a catch block.257: While loop is likely to be infinite.281: Call function pnet remote using 1 return values instead of 0.284: While loop is likely to be infinite.296: Switch statement does not have an Otherwise (default) block.309: Try statement does not have a catch block.314: Declared variable pa was never used.366: Declared variable dump was never used.
Table 4: Sample Report
4. RELATED WORKThere have been many efforts to support software engineer-ing in the automatic identification of fault patterns throughstatic code analysis. Lint, for example, was used to find a va-riety of errors in C programs [2], and similar heuristic-basedtools have appeared for other programming languages (e.g.,jlint for Java). Static analysis tools based on more power-ful but expensive analyses can detect violation of temporalproperties, race conditions or deadlocks [1].
Perhaps the most popular tools for static fault detectionpatterns have been the ones able to detect useful patternsquickly and with a low number of false warnings (e.g., [4]).Tools specifically addressing end users must take such fac-tors into consideration, but also perform a more careful inte-gration of the tool into the programming environment. Pro-viding a list of fault patterns may not be enticing enoughfor an end user to explore what may go wrong.
Last, it is worth mentioning that as we were evaluating ourfault pattern identification tool for the Matlab environment,Matlab released a new version which incorporates MLint, a“Code Check Report displays potential errors and problems,as well as opportunities for improvement in your M-file” [3].An end user can point to a file and invoke MLint from thetools menu to generate a report of what mostly amountsto fault patterns associated with poor use of the language(e.g., uses of | and & instead of || and &&). Although MLintcovers only a small subset of the potential fault patterns andseems to report many false positives (e.g., reported unusedvariables when they were utilized outside the function scopewhen they were declared), it provides further evidence ofthe need of such support for the Matlab community. Still,the integration of the such tools into end-user programmingenvironments must be refined if they are to be used by endusers.
5. CONCLUSIONIn this paper we have provided the first set of fault pat-terns for Matlab. This set was limited to patterns adaptedfrom programming languages utilized by software engineers.
Still, we believe that there exist fault patterns particular toMatLab that are worth exploiting. For example, Matlab haspowerful built-in data types for vectors and matrices. Thesetypes have their own set of operations to populate, format,and cast their content. We noticed that the casting opera-tions were particularly flexible and likely to lead to misuse.Another interesting example are the two different executionmodes, batch and interpreted, which might offer distinct setof fault patterns. We plan to continue the investigation ofsuch patterns.
Second, our preliminary study has revealed that a set ofeasily detectable fault patterns is pervasive among the mostpopular MatLab programs. We have yet to analyze whetherthose patterns constitute faults.
Last, the support for end user programmers in Matlab hasconsisted mainly of migrating tools available in professionaldevelopment environments. We are exploring mechanisms,within the environment constrains, to overcome this limita-tion. For example, instead of expecting for the end user toinvoke the fault pattern detection activities, we would like totrigger them automatically when a program is saved. Also,instead of providing extensive reports in an output window,we would like to highlight the code containing the fault pat-tern. If the lessons learned in other end user environmentshold, then we expect for these improvements to increase theeffectiveness of devices such as the fault pattern detectors.
6. ACKNOWLEDGMENTSThis work was supported in part by the EUSES Consortiumvia the National Science Foundation by ITR-0325273.
7. REFERENCES[1] T. Ball and S. Rajamani. Slam: The Slam Project.
http://research.microsoft.com/slam/.[2] I. Darwin. Checking C Programs with lint. O’Reilly, 1st
edition, 1988.[3] Matlab. Mlint. http://www.mathworks.com.[4] B. Pugh and D. Hovemeyer. Findbugs: A bug pattern
detector for java. http://findbugs.sourceforge.net.
2 0
An Effective Testing Method for End-User Programmers
T. Y. ChenFaculty of Information and
Communication Technologies,Swinburne University of
Technology,Hawthorn VIC 3122, Australia
F.-C. KuoFaculty of Information and
Communication Technologies,Swinburne University of
Technology,Hawthorn VIC 3122, Australia
Zhi Quan Zhou∗
Faculty of Information andCommunication Technologies,
Swinburne University ofTechnology,
Hawthorn VIC 3122, Australia
ABSTRACTEnd-user programmers do not have extensive knowledge of varioussoftware testing methodologies used by professional testers. Whilethey are creating the vast majority of software today, errors arepervasive in the programs due to the lack of testing techniquesreadily adoptable by end-user programmers. In this article we arguethat the technique of metamorphic testing is both practical andeffective for end-user programmers.
Categories and Subject DescriptorsD.2.5 [Software Engineering]: Testing and Debugging
General TermsReliability, Verification, Human factors
KeywordsEnd-user software engineering, software testing, metamorphic test-ing
1. INTRODUCTIONIt has become the most common form of programming today thatend-users write the program code themselves [6]. It is estimatedthat the number of end-user programmers in the United States willreach 55 million in 2005, 20 times greater than that of professionalprogrammers. End-users create software in a wide range of areasincluding spreadsheet and database applications, web applications,scientific simulations, etc. Evidence has suggested, however, thaterrors are pervasive in software created by end-users and entailserious consequences, including loss of millions of US dollars [18].This is because, unlike professional programmers, end-user pro-grammers do not have adequate training on software quality as-surance, such as deep debugging, testing, line-by-line code inspec-tion, etc. Various professional software testing methodologies andcoverage criteria are not readily understood by end-users. It is
∗Corresponding author.
therefore urgent to introduce simple and effective software testingmethods/tools to end-user programmers [19, 7].
In this article we advocate the Metamorphic Testing (MT) methodthat is suitable and practical for end-user programmers. In Sec-tion 2, we shall introduce the basic concepts of MT and its appli-cations to end-user software testing. In Section 3, we shall explainthe reason why MT is suitable for end-user software engineering.Section 4 will conclude the paper.
2. METAMORPHIC TESTING2.1 Basic conceptsThe Metamorphic Testing (MT) method was introduced as a simpleand cost-effective approach to utilize the useful information carriedin successful test cases (that is, test cases that reveal no failure) togenerate follow-up test cases [8]. Furthermore, MT also providesan automated means that alleviates the oracle problem [9, 11, 12,16, 15, 10].
MT may be used in conjunction with other test case selection strate-gies. Let p be a program implementing function f on domain D.To test p, suppose the tester has adopted S as the test case selectionstrategy. S can be, for example, branch coverage testing, domaintesting, data flow testing, or just random testing [2]. According toS, a test set T = {t1, t2, . . . , tn} ⊂ D will be generated, wheren ≥ 1. If the outputs p(t1), p(t2), . . . , p(tn) do not detect anyfailure, then T is called a set of successful test cases.
At this stage MT can be performed by going one step further tomake use of T — this is a great difference from conventional test-ing, where successful test cases have been considered useless [17]and discarded. MT employs the successful test cases by makingreference to certain properties called metamorphic relations (MR)of the target function f . A “metamorphic relation” is any relationamong the inputs and the outcomes of multiple executions of thetarget program. As an example, let p(G, a, b) be a program cal-culating the length of the shortest path from vertex a to vertex b inan undirected weighted graph G. It is not easy to verify the outputswhen the test cases are nontrivial. Nevertheless, we can identifymetamorphic relations known by the user, such as p(G, a, b) =p(G′, a′, b′), where G′ is an isomorphic graph of G and (a′, b′)in G′ correspond to (a, b) in G. Let (H, u, v) be a test caseand, after running it, p(H, u, v) reveals no failure. Now MTis carried out to generate one or more follow-up test cases, thatis, isomorphic graph(s) of H, and check whether p(H, u, v) =p(H ′, u′, v′). Note that MT can be conducted even when the
Permission to make digital or hard copies of all or part of this work forpersonal or classroom use is granted without fee provided that copies arenot made or distributed for profit or commercial advantage, and that copiesbear this notice and the full citation on the first page. To copy otherwise, torepublish, to post on servers or to redistribute to lists, requires prior specificpermission and/or a fee.First Workshop on End-User Software Engineering (WEUSE I).May 212005, Saint Louis, Missouri, USA.Copyright ACM 1-59593-131-7/05/0005$5.00.
2 1
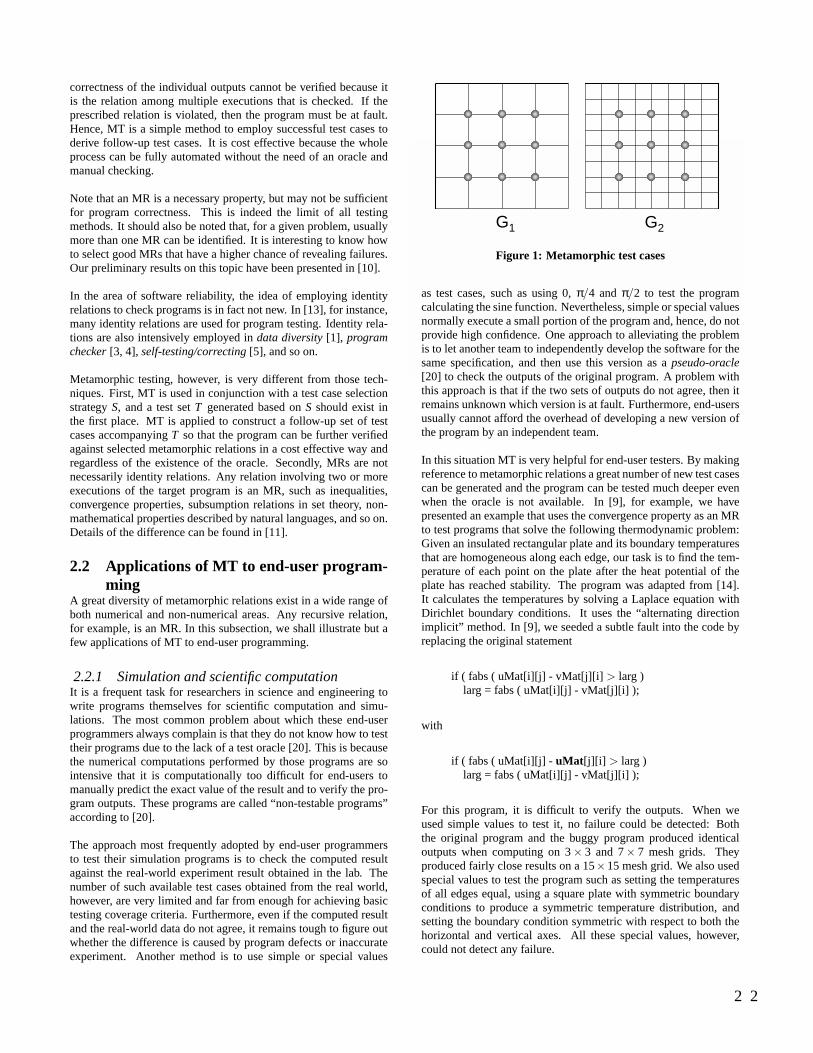
correctness of the individual outputs cannot be verified because itis the relation among multiple executions that is checked. If theprescribed relation is violated, then the program must be at fault.Hence, MT is a simple method to employ successful test cases toderive follow-up test cases. It is cost effective because the wholeprocess can be fully automated without the need of an oracle andmanual checking.
Note that an MR is a necessary property, but may not be sufficientfor program correctness. This is indeed the limit of all testingmethods. It should also be noted that, for a given problem, usuallymore than one MR can be identified. It is interesting to know howto select good MRs that have a higher chance of revealing failures.Our preliminary results on this topic have been presented in [10].
In the area of software reliability, the idea of employing identityrelations to check programs is in fact not new. In [13], for instance,many identity relations are used for program testing. Identity rela-tions are also intensively employed in data diversity [1], programchecker [3, 4], self-testing/correcting [5], and so on.
Metamorphic testing, however, is very different from those tech-niques. First, MT is used in conjunction with a test case selectionstrategy S, and a test set T generated based on S should exist inthe first place. MT is applied to construct a follow-up set of testcases accompanying T so that the program can be further verifiedagainst selected metamorphic relations in a cost effective way andregardless of the existence of the oracle. Secondly, MRs are notnecessarily identity relations. Any relation involving two or moreexecutions of the target program is an MR, such as inequalities,convergence properties, subsumption relations in set theory, non-mathematical properties described by natural languages, and so on.Details of the difference can be found in [11].
2.2 Applications of MT to end-user program-ming
A great diversity of metamorphic relations exist in a wide range ofboth numerical and non-numerical areas. Any recursive relation,for example, is an MR. In this subsection, we shall illustrate but afew applications of MT to end-user programming.
2.2.1 Simulation and scientific computationIt is a frequent task for researchers in science and engineering towrite programs themselves for scientific computation and simu-lations. The most common problem about which these end-userprogrammers always complain is that they do not know how to testtheir programs due to the lack of a test oracle [20]. This is becausethe numerical computations performed by those programs are sointensive that it is computationally too difficult for end-users tomanually predict the exact value of the result and to verify the pro-gram outputs. These programs are called “non-testable programs”according to [20].
The approach most frequently adopted by end-user programmersto test their simulation programs is to check the computed resultagainst the real-world experiment result obtained in the lab. Thenumber of such available test cases obtained from the real world,however, are very limited and far from enough for achieving basictesting coverage criteria. Furthermore, even if the computed resultand the real-world data do not agree, it remains tough to figure outwhether the difference is caused by program defects or inaccurateexperiment. Another method is to use simple or special values
G1 G2
Figure 1: Metamorphic test cases
as test cases, such as using 0, π/4 and π/2 to test the programcalculating the sine function. Nevertheless, simple or special valuesnormally execute a small portion of the program and, hence, do notprovide high confidence. One approach to alleviating the problemis to let another team to independently develop the software for thesame specification, and then use this version as a pseudo-oracle[20] to check the outputs of the original program. A problem withthis approach is that if the two sets of outputs do not agree, then itremains unknown which version is at fault. Furthermore, end-usersusually cannot afford the overhead of developing a new version ofthe program by an independent team.
In this situation MT is very helpful for end-user testers. By makingreference to metamorphic relations a great number of new test casescan be generated and the program can be tested much deeper evenwhen the oracle is not available. In [9], for example, we havepresented an example that uses the convergence property as an MRto test programs that solve the following thermodynamic problem:Given an insulated rectangular plate and its boundary temperaturesthat are homogeneous along each edge, our task is to find the tem-perature of each point on the plate after the heat potential of theplate has reached stability. The program was adapted from [14].It calculates the temperatures by solving a Laplace equation withDirichlet boundary conditions. It uses the “alternating directionimplicit” method. In [9], we seeded a subtle fault into the code byreplacing the original statement
if ( fabs ( uMat[i][j] - vMat[j][i] > larg )larg = fabs ( uMat[i][j] - vMat[j][i] );
with
if ( fabs ( uMat[i][j] - uMat[j][i] > larg )larg = fabs ( uMat[i][j] - vMat[j][i] );
For this program, it is difficult to verify the outputs. When weused simple values to test it, no failure could be detected: Boththe original program and the buggy program produced identicaloutputs when computing on 3 × 3 and 7 × 7 mesh grids. Theyproduced fairly close results on a 15×15 mesh grid. We also usedspecial values to test the program such as setting the temperaturesof all edges equal, using a square plate with symmetric boundaryconditions to produce a symmetric temperature distribution, andsetting the boundary condition symmetric with respect to both thehorizontal and vertical axes. All these special values, however,could not detect any failure.
2 2
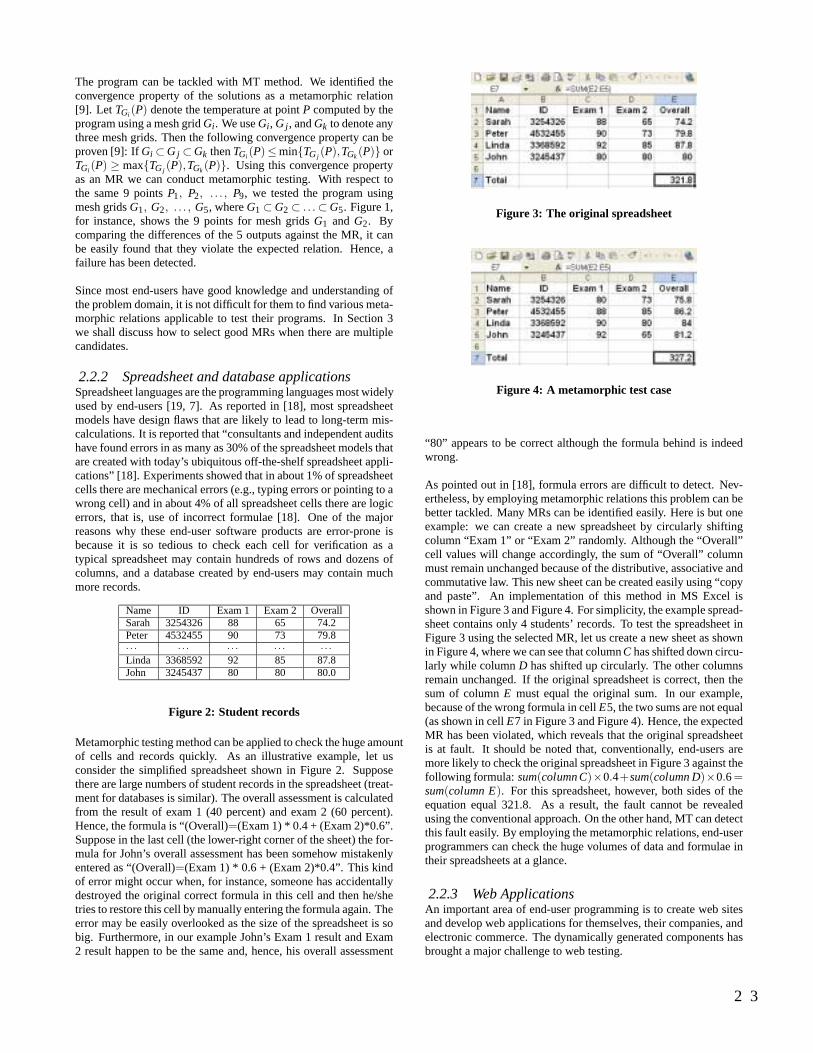
The program can be tackled with MT method. We identified theconvergence property of the solutions as a metamorphic relation[9]. Let TGi(P) denote the temperature at point P computed by theprogram using a mesh grid Gi. We use Gi, G j , and Gk to denote anythree mesh grids. Then the following convergence property can beproven [9]: If Gi ⊂G j ⊂Gk then TGi(P)≤min{TGj (P),TGk (P)} orTGi(P) ≥ max{TGj (P),TGk (P)}. Using this convergence propertyas an MR we can conduct metamorphic testing. With respect tothe same 9 points P1, P2, . . . , P9, we tested the program usingmesh grids G1, G2, . . . , G5, where G1 ⊂ G2 ⊂ . . .⊂ G5. Figure 1,for instance, shows the 9 points for mesh grids G1 and G2. Bycomparing the differences of the 5 outputs against the MR, it canbe easily found that they violate the expected relation. Hence, afailure has been detected.
Since most end-users have good knowledge and understanding ofthe problem domain, it is not difficult for them to find various meta-morphic relations applicable to test their programs. In Section 3we shall discuss how to select good MRs when there are multiplecandidates.
2.2.2 Spreadsheet and database applicationsSpreadsheet languages are the programming languages most widelyused by end-users [19, 7]. As reported in [18], most spreadsheetmodels have design flaws that are likely to lead to long-term mis-calculations. It is reported that “consultants and independent auditshave found errors in as many as 30% of the spreadsheet models thatare created with today’s ubiquitous off-the-shelf spreadsheet appli-cations” [18]. Experiments showed that in about 1% of spreadsheetcells there are mechanical errors (e.g., typing errors or pointing to awrong cell) and in about 4% of all spreadsheet cells there are logicerrors, that is, use of incorrect formulae [18]. One of the majorreasons why these end-user software products are error-prone isbecause it is so tedious to check each cell for verification as atypical spreadsheet may contain hundreds of rows and dozens ofcolumns, and a database created by end-users may contain muchmore records.
Name ID Exam 1 Exam 2 OverallSarah 3254326 88 65 74.2Peter 4532455 90 73 79.8· · · · · · · · · · · · · · ·Linda 3368592 92 85 87.8John 3245437 80 80 80.0
Figure 2: Student records
Metamorphic testing method can be applied to check the huge amountof cells and records quickly. As an illustrative example, let usconsider the simplified spreadsheet shown in Figure 2. Supposethere are large numbers of student records in the spreadsheet (treat-ment for databases is similar). The overall assessment is calculatedfrom the result of exam 1 (40 percent) and exam 2 (60 percent).Hence, the formula is “(Overall)=(Exam 1) * 0.4 + (Exam 2)*0.6”.Suppose in the last cell (the lower-right corner of the sheet) the for-mula for John’s overall assessment has been somehow mistakenlyentered as “(Overall)=(Exam 1) * 0.6 + (Exam 2)*0.4”. This kindof error might occur when, for instance, someone has accidentallydestroyed the original correct formula in this cell and then he/shetries to restore this cell by manually entering the formula again. Theerror may be easily overlooked as the size of the spreadsheet is sobig. Furthermore, in our example John’s Exam 1 result and Exam2 result happen to be the same and, hence, his overall assessment
Figure 3: The original spreadsheet
Figure 4: A metamorphic test case
“80” appears to be correct although the formula behind is indeedwrong.
As pointed out in [18], formula errors are difficult to detect. Nev-ertheless, by employing metamorphic relations this problem can bebetter tackled. Many MRs can be identified easily. Here is but oneexample: we can create a new spreadsheet by circularly shiftingcolumn “Exam 1” or “Exam 2” randomly. Although the “Overall”cell values will change accordingly, the sum of “Overall” columnmust remain unchanged because of the distributive, associative andcommutative law. This new sheet can be created easily using “copyand paste”. An implementation of this method in MS Excel isshown in Figure 3 and Figure 4. For simplicity, the example spread-sheet contains only 4 students’ records. To test the spreadsheet inFigure 3 using the selected MR, let us create a new sheet as shownin Figure 4, where we can see that column C has shifted down circu-larly while column D has shifted up circularly. The other columnsremain unchanged. If the original spreadsheet is correct, then thesum of column E must equal the original sum. In our example,because of the wrong formula in cell E5, the two sums are not equal(as shown in cell E7 in Figure 3 and Figure 4). Hence, the expectedMR has been violated, which reveals that the original spreadsheetis at fault. It should be noted that, conventionally, end-users aremore likely to check the original spreadsheet in Figure 3 against thefollowing formula: sum(column C)×0.4+sum(column D)×0.6 =sum(column E). For this spreadsheet, however, both sides of theequation equal 321.8. As a result, the fault cannot be revealedusing the conventional approach. On the other hand, MT can detectthis fault easily. By employing the metamorphic relations, end-userprogrammers can check the huge volumes of data and formulae intheir spreadsheets at a glance.
2.2.3 Web ApplicationsAn important area of end-user programming is to create web sitesand develop web applications for themselves, their companies, andelectronic commerce. The dynamically generated components hasbrought a major challenge to web testing.
2 3
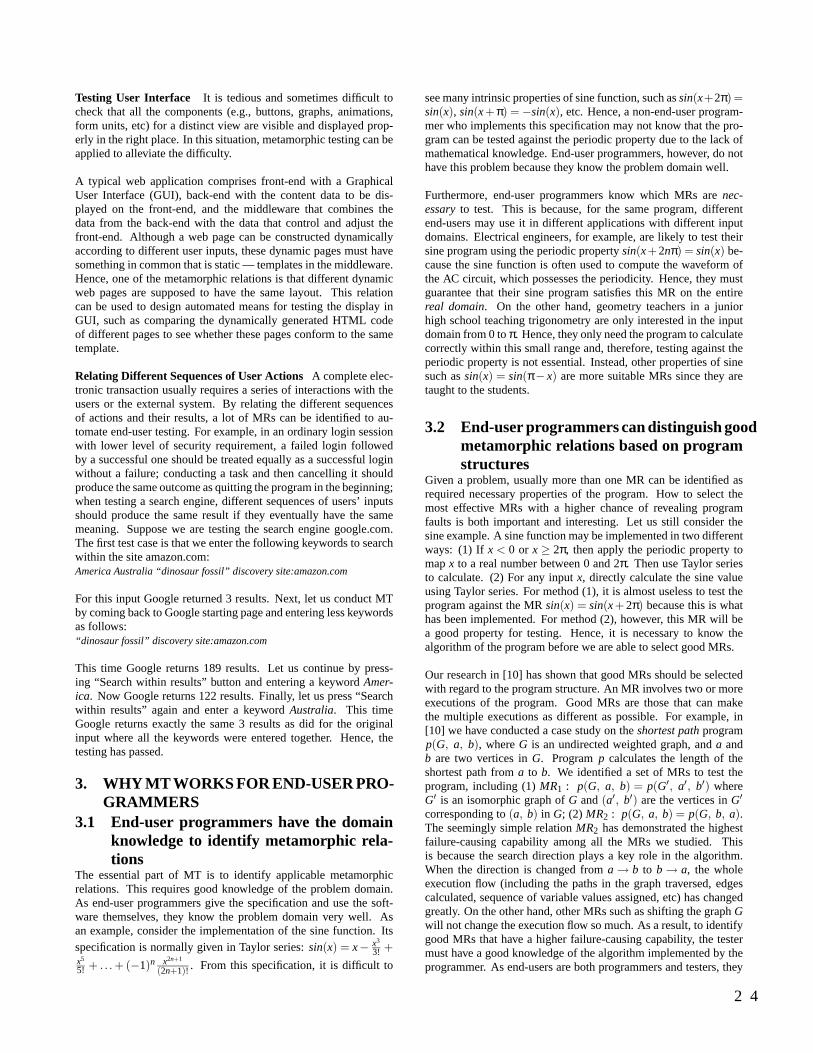
Testing User Interface It is tedious and sometimes difficult tocheck that all the components (e.g., buttons, graphs, animations,form units, etc) for a distinct view are visible and displayed prop-erly in the right place. In this situation, metamorphic testing can beapplied to alleviate the difficulty.
A typical web application comprises front-end with a GraphicalUser Interface (GUI), back-end with the content data to be dis-played on the front-end, and the middleware that combines thedata from the back-end with the data that control and adjust thefront-end. Although a web page can be constructed dynamicallyaccording to different user inputs, these dynamic pages must havesomething in common that is static — templates in the middleware.Hence, one of the metamorphic relations is that different dynamicweb pages are supposed to have the same layout. This relationcan be used to design automated means for testing the display inGUI, such as comparing the dynamically generated HTML codeof different pages to see whether these pages conform to the sametemplate.
Relating Different Sequences of User Actions A complete elec-tronic transaction usually requires a series of interactions with theusers or the external system. By relating the different sequencesof actions and their results, a lot of MRs can be identified to au-tomate end-user testing. For example, in an ordinary login sessionwith lower level of security requirement, a failed login followedby a successful one should be treated equally as a successful loginwithout a failure; conducting a task and then cancelling it shouldproduce the same outcome as quitting the program in the beginning;when testing a search engine, different sequences of users’ inputsshould produce the same result if they eventually have the samemeaning. Suppose we are testing the search engine google.com.The first test case is that we enter the following keywords to searchwithin the site amazon.com:America Australia “dinosaur fossil” discovery site:amazon.com
For this input Google returned 3 results. Next, let us conduct MTby coming back to Google starting page and entering less keywordsas follows:“dinosaur fossil” discovery site:amazon.com
This time Google returns 189 results. Let us continue by press-ing “Search within results” button and entering a keyword Amer-ica. Now Google returns 122 results. Finally, let us press “Searchwithin results” again and enter a keyword Australia. This timeGoogle returns exactly the same 3 results as did for the originalinput where all the keywords were entered together. Hence, thetesting has passed.
3. WHY MT WORKS FOR END-USER PRO-GRAMMERS
3.1 End-user programmers have the domainknowledge to identify metamorphic rela-tions
The essential part of MT is to identify applicable metamorphicrelations. This requires good knowledge of the problem domain.As end-user programmers give the specification and use the soft-ware themselves, they know the problem domain very well. Asan example, consider the implementation of the sine function. Itsspecification is normally given in Taylor series: sin(x) = x− x3
3! +x5
5! + . . . + (−1)n x2n+1
(2n+1)! . From this specification, it is difficult to
see many intrinsic properties of sine function, such as sin(x+2π) =sin(x), sin(x +π) = −sin(x), etc. Hence, a non-end-user program-mer who implements this specification may not know that the pro-gram can be tested against the periodic property due to the lack ofmathematical knowledge. End-user programmers, however, do nothave this problem because they know the problem domain well.
Furthermore, end-user programmers know which MRs are nec-essary to test. This is because, for the same program, differentend-users may use it in different applications with different inputdomains. Electrical engineers, for example, are likely to test theirsine program using the periodic property sin(x+2nπ) = sin(x) be-cause the sine function is often used to compute the waveform ofthe AC circuit, which possesses the periodicity. Hence, they mustguarantee that their sine program satisfies this MR on the entirereal domain. On the other hand, geometry teachers in a juniorhigh school teaching trigonometry are only interested in the inputdomain from 0 to π. Hence, they only need the program to calculatecorrectly within this small range and, therefore, testing against theperiodic property is not essential. Instead, other properties of sinesuch as sin(x) = sin(π− x) are more suitable MRs since they aretaught to the students.
3.2 End-user programmers can distinguish goodmetamorphic relations based on programstructures
Given a problem, usually more than one MR can be identified asrequired necessary properties of the program. How to select themost effective MRs with a higher chance of revealing programfaults is both important and interesting. Let us still consider thesine example. A sine function may be implemented in two differentways: (1) If x < 0 or x ≥ 2π, then apply the periodic property tomap x to a real number between 0 and 2π. Then use Taylor seriesto calculate. (2) For any input x, directly calculate the sine valueusing Taylor series. For method (1), it is almost useless to test theprogram against the MR sin(x) = sin(x + 2π) because this is whathas been implemented. For method (2), however, this MR will bea good property for testing. Hence, it is necessary to know thealgorithm of the program before we are able to select good MRs.
Our research in [10] has shown that good MRs should be selectedwith regard to the program structure. An MR involves two or moreexecutions of the program. Good MRs are those that can makethe multiple executions as different as possible. For example, in[10] we have conducted a case study on the shortest path programp(G, a, b), where G is an undirected weighted graph, and a andb are two vertices in G. Program p calculates the length of theshortest path from a to b. We identified a set of MRs to test theprogram, including (1) MR1 : p(G, a, b) = p(G′, a′, b′) whereG′ is an isomorphic graph of G and (a′, b′) are the vertices in G′corresponding to (a, b) in G; (2) MR2 : p(G, a, b) = p(G, b, a).The seemingly simple relation MR2 has demonstrated the highestfailure-causing capability among all the MRs we studied. Thisis because the search direction plays a key role in the algorithm.When the direction is changed from a → b to b → a, the wholeexecution flow (including the paths in the graph traversed, edgescalculated, sequence of variable values assigned, etc) has changedgreatly. On the other hand, other MRs such as shifting the graph Gwill not change the execution flow so much. As a result, to identifygood MRs that have a higher failure-causing capability, the testermust have a good knowledge of the algorithm implemented by theprogrammer. As end-users are both programmers and testers, they
2 4
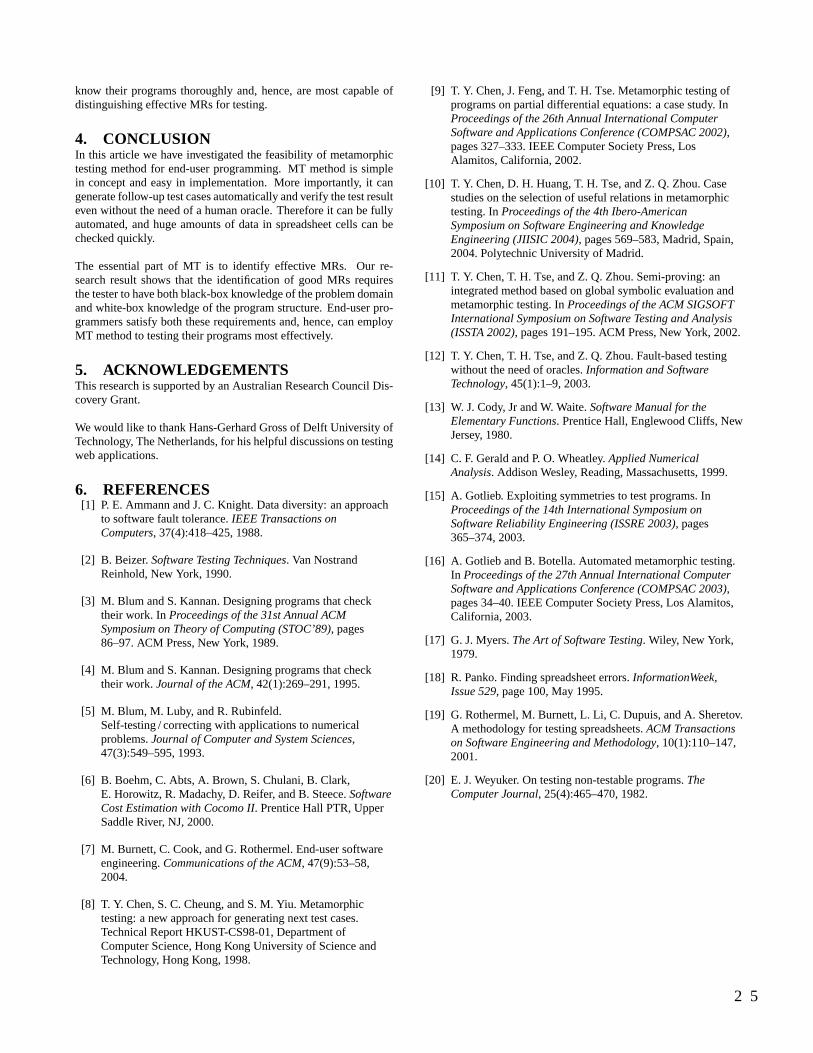
know their programs thoroughly and, hence, are most capable ofdistinguishing effective MRs for testing.
4. CONCLUSIONIn this article we have investigated the feasibility of metamorphictesting method for end-user programming. MT method is simplein concept and easy in implementation. More importantly, it cangenerate follow-up test cases automatically and verify the test resulteven without the need of a human oracle. Therefore it can be fullyautomated, and huge amounts of data in spreadsheet cells can bechecked quickly.
The essential part of MT is to identify effective MRs. Our re-search result shows that the identification of good MRs requiresthe tester to have both black-box knowledge of the problem domainand white-box knowledge of the program structure. End-user pro-grammers satisfy both these requirements and, hence, can employMT method to testing their programs most effectively.
5. ACKNOWLEDGEMENTSThis research is supported by an Australian Research Council Dis-covery Grant.
We would like to thank Hans-Gerhard Gross of Delft University ofTechnology, The Netherlands, for his helpful discussions on testingweb applications.
6. REFERENCES[1] P. E. Ammann and J. C. Knight. Data diversity: an approach
to software fault tolerance. IEEE Transactions onComputers, 37(4):418–425, 1988.
[2] B. Beizer. Software Testing Techniques. Van NostrandReinhold, New York, 1990.
[3] M. Blum and S. Kannan. Designing programs that checktheir work. In Proceedings of the 31st Annual ACMSymposium on Theory of Computing (STOC’89), pages86–97. ACM Press, New York, 1989.
[4] M. Blum and S. Kannan. Designing programs that checktheir work. Journal of the ACM, 42(1):269–291, 1995.
[5] M. Blum, M. Luby, and R. Rubinfeld.Self-testing / correcting with applications to numericalproblems. Journal of Computer and System Sciences,47(3):549–595, 1993.
[6] B. Boehm, C. Abts, A. Brown, S. Chulani, B. Clark,E. Horowitz, R. Madachy, D. Reifer, and B. Steece. SoftwareCost Estimation with Cocomo II. Prentice Hall PTR, UpperSaddle River, NJ, 2000.
[7] M. Burnett, C. Cook, and G. Rothermel. End-user softwareengineering. Communications of the ACM, 47(9):53–58,2004.
[8] T. Y. Chen, S. C. Cheung, and S. M. Yiu. Metamorphictesting: a new approach for generating next test cases.Technical Report HKUST-CS98-01, Department ofComputer Science, Hong Kong University of Science andTechnology, Hong Kong, 1998.
[9] T. Y. Chen, J. Feng, and T. H. Tse. Metamorphic testing ofprograms on partial differential equations: a case study. InProceedings of the 26th Annual International ComputerSoftware and Applications Conference (COMPSAC 2002),pages 327–333. IEEE Computer Society Press, LosAlamitos, California, 2002.
[10] T. Y. Chen, D. H. Huang, T. H. Tse, and Z. Q. Zhou. Casestudies on the selection of useful relations in metamorphictesting. In Proceedings of the 4th Ibero-AmericanSymposium on Software Engineering and KnowledgeEngineering (JIISIC 2004), pages 569–583, Madrid, Spain,2004. Polytechnic University of Madrid.
[11] T. Y. Chen, T. H. Tse, and Z. Q. Zhou. Semi-proving: anintegrated method based on global symbolic evaluation andmetamorphic testing. In Proceedings of the ACM SIGSOFTInternational Symposium on Software Testing and Analysis(ISSTA 2002), pages 191–195. ACM Press, New York, 2002.
[12] T. Y. Chen, T. H. Tse, and Z. Q. Zhou. Fault-based testingwithout the need of oracles. Information and SoftwareTechnology, 45(1):1–9, 2003.
[13] W. J. Cody, Jr and W. Waite. Software Manual for theElementary Functions. Prentice Hall, Englewood Cliffs, NewJersey, 1980.
[14] C. F. Gerald and P. O. Wheatley. Applied NumericalAnalysis. Addison Wesley, Reading, Massachusetts, 1999.
[15] A. Gotlieb. Exploiting symmetries to test programs. InProceedings of the 14th International Symposium onSoftware Reliability Engineering (ISSRE 2003), pages365–374, 2003.
[16] A. Gotlieb and B. Botella. Automated metamorphic testing.In Proceedings of the 27th Annual International ComputerSoftware and Applications Conference (COMPSAC 2003),pages 34–40. IEEE Computer Society Press, Los Alamitos,California, 2003.
[17] G. J. Myers. The Art of Software Testing. Wiley, New York,1979.
[18] R. Panko. Finding spreadsheet errors. InformationWeek,Issue 529, page 100, May 1995.
[19] G. Rothermel, M. Burnett, L. Li, C. Dupuis, and A. Sheretov.A methodology for testing spreadsheets. ACM Transactionson Software Engineering and Methodology, 10(1):110–147,2001.
[20] E. J. Weyuker. On testing non-testable programs. TheComputer Journal, 25(4):465–470, 1982.
2 5
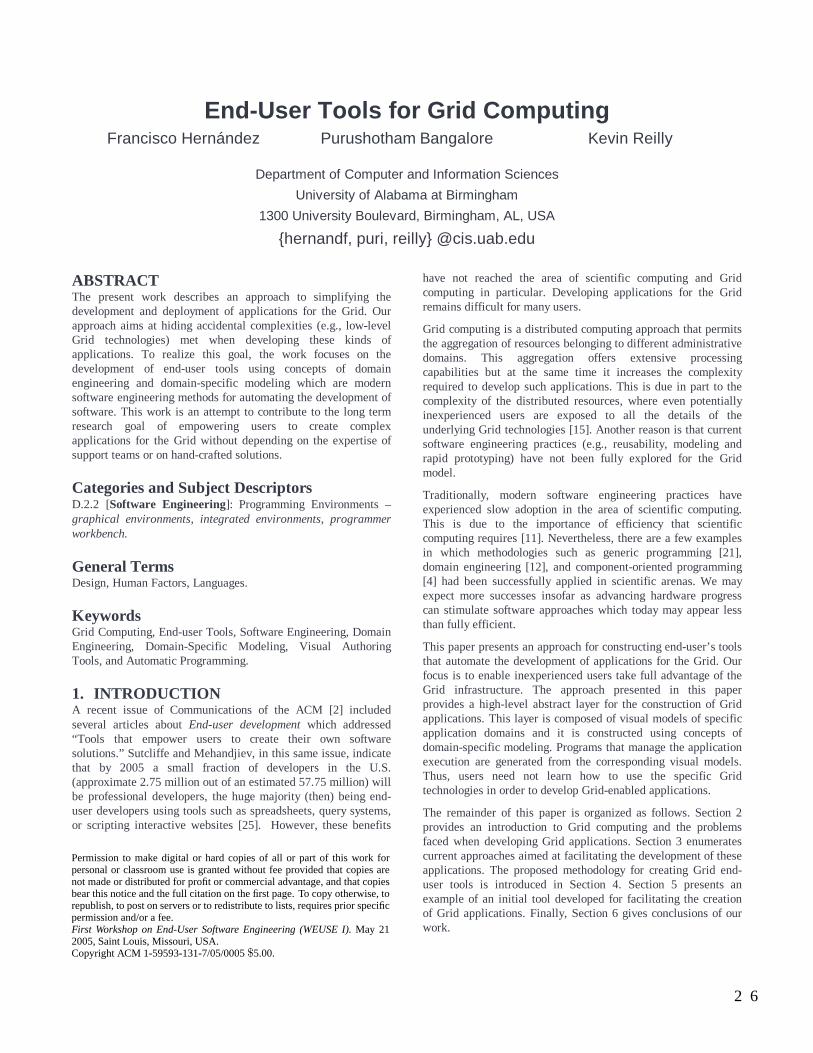
End-User Tools for Grid Computing Francisco Hernández Purushotham Bangalore Kevin Reilly
Department of Computer and Information Sciences
University of Alabama at Birmingham
1300 University Boulevard, Birmingham, AL, USA
{hernandf, puri, reilly} @cis.uab.edu
ABSTRACT The present work describes an approach to simplifying the development and deployment of applications for the Grid. Our approach aims at hiding accidental complexities (e.g., low-level Grid technologies) met when developing these kinds of applications. To realize this goal, the work focuses on the development of end-user tools using concepts of domain engineering and domain-specific modeling which are modern software engineering methods for automating the development of software. This work is an attempt to contribute to the long term research goal of empowering users to create complex applications for the Grid without depending on the expertise of support teams or on hand-crafted solutions.
Categories and Subject Descriptors D.2.2 [Software Engineering]: Programming Environments – graphical environments, integrated environments, programmer workbench.
General Terms Design, Human Factors, Languages.
Keywords Grid Computing, End-user Tools, Software Engineering, Domain Engineering, Domain-Specific Modeling, Visual Authoring Tools, and Automatic Programming.
1. INTRODUCTION A recent issue of Communications of the ACM [2] included several articles about End-user development which addressed “Tools that empower users to create their own software solutions.” Sutcliffe and Mehandjiev, in this same issue, indicate that by 2005 a small fraction of developers in the U.S. (approximate 2.75 million out of an estimated 57.75 million) will be professional developers, the huge majority (then) being end-user developers using tools such as spreadsheets, query systems, or scripting interactive websites [25]. However, these benefits
have not reached the area of scientific computing and Grid computing in particular. Developing applications for the Grid remains difficult for many users.
Grid computing is a distributed computing approach that permits the aggregation of resources belonging to different administrative domains. This aggregation offers extensive processing capabilities but at the same time it increases the complexity required to develop such applications. This is due in part to the complexity of the distributed resources, where even potentially inexperienced users are exposed to all the details of the underlying Grid technologies [15]. Another reason is that current software engineering practices (e.g., reusability, modeling and rapid prototyping) have not been fully explored for the Grid model.
Traditionally, modern software engineering practices have experienced slow adoption in the area of scientific computing. This is due to the importance of efficiency that scientific computing requires [11]. Nevertheless, there are a few examples in which methodologies such as generic programming [21], domain engineering [12], and component-oriented programming [4] had been successfully applied in scientific arenas. We may expect more successes insofar as advancing hardware progress can stimulate software approaches which today may appear less than fully efficient.
This paper presents an approach for constructing end-user’s tools that automate the development of applications for the Grid. Our focus is to enable inexperienced users take full advantage of the Grid infrastructure. The approach presented in this paper provides a high-level abstract layer for the construction of Grid applications. This layer is composed of visual models of specific application domains and it is constructed using concepts of domain-specific modeling. Programs that manage the application execution are generated from the corresponding visual models. Thus, users need not learn how to use the specific Grid technologies in order to develop Grid-enabled applications.
The remainder of this paper is organized as follows. Section 2 provides an introduction to Grid computing and the problems faced when developing Grid applications. Section 3 enumerates current approaches aimed at facilitating the development of these applications. The proposed methodology for creating Grid end-user tools is introduced in Section 4. Section 5 presents an example of an initial tool developed for facilitating the creation of Grid applications. Finally, Section 6 gives conclusions of our work.
Permission to make digital or hard copies of all or part of this work forpersonal or classroom use is granted without fee provided that copies arenot made or distributed for profit or commercial advantage, and that copiesbear this notice and the full citation on the first page. To copy otherwise, torepublish, to post on servers or to redistribute to lists, requires prior specificpermission and/or a fee.First Workshop on End-User Software Engineering (WEUSE I).May 212005, Saint Louis, Missouri, USA.Copyright ACM 1-59593-131-7/05/0005$5.00.
2 6
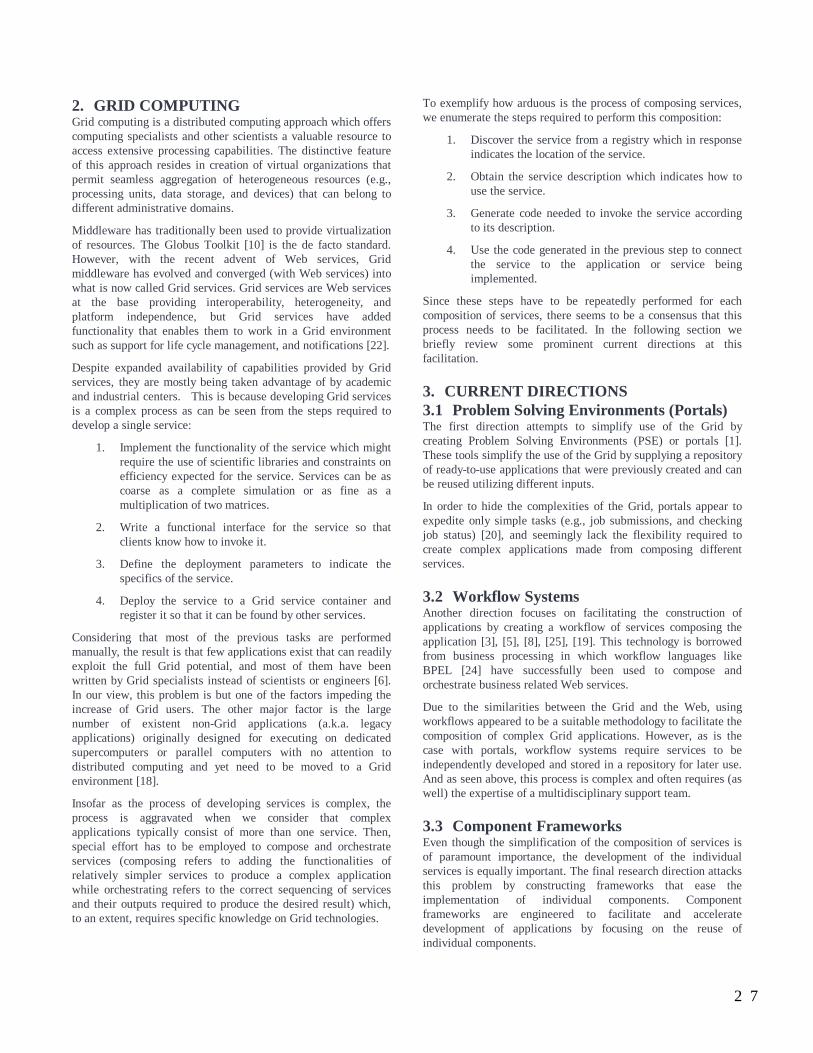
2. GRID COMPUTING Grid computing is a distributed computing approach which offers computing specialists and other scientists a valuable resource to access extensive processing capabilities. The distinctive feature of this approach resides in creation of virtual organizations that permit seamless aggregation of heterogeneous resources (e.g., processing units, data storage, and devices) that can belong to different administrative domains.
Middleware has traditionally been used to provide virtualization of resources. The Globus Toolkit [10] is the de facto standard. However, with the recent advent of Web services, Grid middleware has evolved and converged (with Web services) into what is now called Grid services. Grid services are Web services at the base providing interoperability, heterogeneity, and platform independence, but Grid services have added functionality that enables them to work in a Grid environment such as support for life cycle management, and notifications [22].
Despite expanded availability of capabilities provided by Grid services, they are mostly being taken advantage of by academic and industrial centers. This is because developing Grid services is a complex process as can be seen from the steps required to develop a single service:
1. Implement the functionality of the service which might require the use of scientific libraries and constraints on efficiency expected for the service. Services can be as coarse as a complete simulation or as fine as a multiplication of two matrices.
2. Write a functional interface for the service so that clients know how to invoke it.
3. Define the deployment parameters to indicate the specifics of the service.
4. Deploy the service to a Grid service container and register it so that it can be found by other services.
Considering that most of the previous tasks are performed manually, the result is that few applications exist that can readily exploit the full Grid potential, and most of them have been written by Grid specialists instead of scientists or engineers [6]. In our view, this problem is but one of the factors impeding the increase of Grid users. The other major factor is the large number of existent non-Grid applications (a.k.a. legacy applications) originally designed for executing on dedicated supercomputers or parallel computers with no attention to distributed computing and yet need to be moved to a Grid environment [18].
Insofar as the process of developing services is complex, the process is aggravated when we consider that complex applications typically consist of more than one service. Then, special effort has to be employed to compose and orchestrate services (composing refers to adding the functionalities of relatively simpler services to produce a complex application while orchestrating refers to the correct sequencing of services and their outputs required to produce the desired result) which, to an extent, requires specific knowledge on Grid technologies.
To exemplify how arduous is the process of composing services, we enumerate the steps required to perform this composition:
1. Discover the service from a registry which in response indicates the location of the service.
2. Obtain the service description which indicates how to use the service.
3. Generate code needed to invoke the service according to its description.
4. Use the code generated in the previous step to connect the service to the application or service being implemented.
Since these steps have to be repeatedly performed for each composition of services, there seems to be a consensus that this process needs to be facilitated. In the following section we briefly review some prominent current directions at this facilitation.
3. CURRENT DIRECTIONS 3.1 Problem Solving Environments (Portals) The first direction attempts to simplify use of the Grid by creating Problem Solving Environments (PSE) or portals [1]. These tools simplify the use of the Grid by supplying a repository of ready-to-use applications that were previously created and can be reused utilizing different inputs.
In order to hide the complexities of the Grid, portals appear to expedite only simple tasks (e.g., job submissions, and checking job status) [20], and seemingly lack the flexibility required to create complex applications made from composing different services.
3.2 Workflow Systems Another direction focuses on facilitating the construction of applications by creating a workflow of services composing the application [3], [5], [8], [25], [19]. This technology is borrowed from business processing in which workflow languages like BPEL [24] have successfully been used to compose and orchestrate business related Web services.
Due to the similarities between the Grid and the Web, using workflows appeared to be a suitable methodology to facilitate the composition of complex Grid applications. However, as is the case with portals, workflow systems require services to be independently developed and stored in a repository for later use. And as seen above, this process is complex and often requires (as well) the expertise of a multidisciplinary support team.
3.3 Component Frameworks Even though the simplification of the composition of services is of paramount importance, the development of the individual services is equally important. The final research direction attacks this problem by constructing frameworks that ease the implementation of individual components. Component frameworks are engineered to facilitate and accelerate development of applications by focusing on the reuse of individual components.
2 7
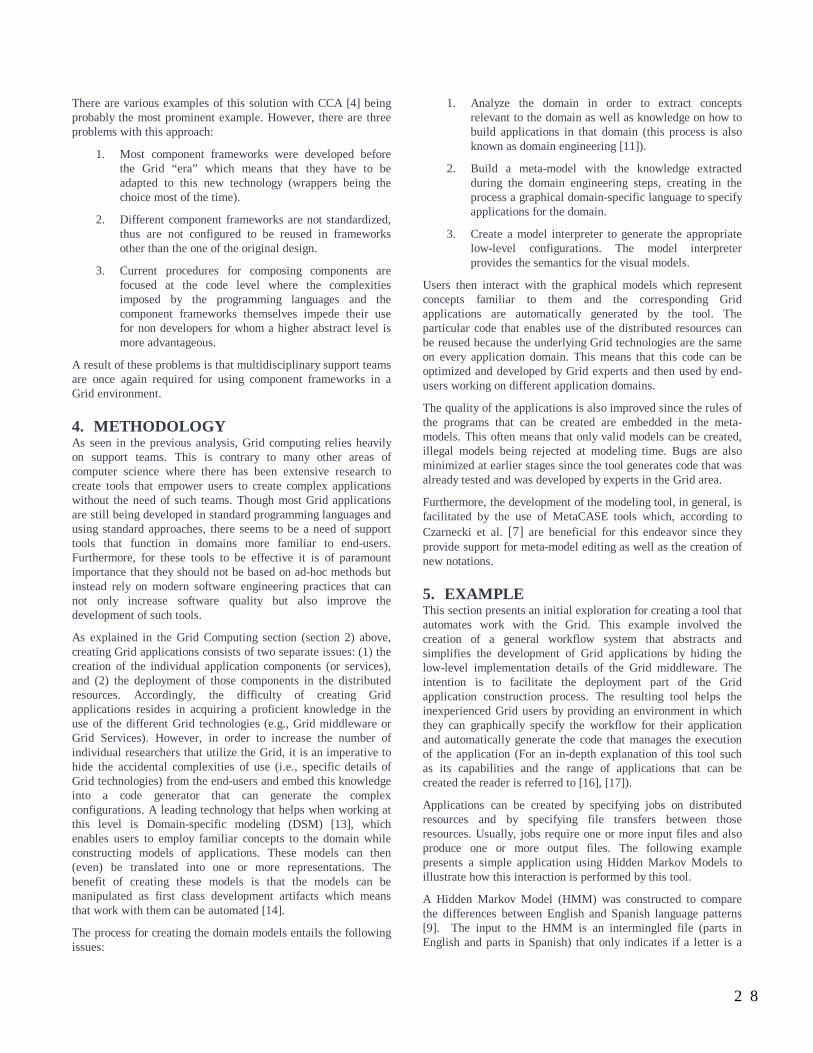
There are various examples of this solution with CCA [4] being probably the most prominent example. However, there are three problems with this approach:
1. Most component frameworks were developed before the Grid “era” which means that they have to be adapted to this new technology (wrappers being the choice most of the time).
2. Different component frameworks are not standardized, thus are not configured to be reused in frameworks other than the one of the original design.
3. Current procedures for composing components are focused at the code level where the complexities imposed by the programming languages and the component frameworks themselves impede their use for non developers for whom a higher abstract level is more advantageous.
A result of these problems is that multidisciplinary support teams are once again required for using component frameworks in a Grid environment.
4. METHODOLOGY As seen in the previous analysis, Grid computing relies heavily on support teams. This is contrary to many other areas of computer science where there has been extensive research to create tools that empower users to create complex applications without the need of such teams. Though most Grid applications are still being developed in standard programming languages and using standard approaches, there seems to be a need of support tools that function in domains more familiar to end-users. Furthermore, for these tools to be effective it is of paramount importance that they should not be based on ad-hoc methods but instead rely on modern software engineering practices that can not only increase software quality but also improve the development of such tools.
As explained in the Grid Computing section (section 2) above, creating Grid applications consists of two separate issues: (1) the creation of the individual application components (or services), and (2) the deployment of those components in the distributed resources. Accordingly, the difficulty of creating Grid applications resides in acquiring a proficient knowledge in the use of the different Grid technologies (e.g., Grid middleware or Grid Services). However, in order to increase the number of individual researchers that utilize the Grid, it is an imperative to hide the accidental complexities of use (i.e., specific details of Grid technologies) from the end-users and embed this knowledge into a code generator that can generate the complex configurations. A leading technology that helps when working at this level is Domain-specific modeling (DSM) [13], which enables users to employ familiar concepts to the domain while constructing models of applications. These models can then (even) be translated into one or more representations. The benefit of creating these models is that the models can be manipulated as first class development artifacts which means that work with them can be automated [14].
The process for creating the domain models entails the following issues:
1. Analyze the domain in order to extract concepts relevant to the domain as well as knowledge on how to build applications in that domain (this process is also known as domain engineering [11]).
2. Build a meta-model with the knowledge extracted during the domain engineering steps, creating in the process a graphical domain-specific language to specify applications for the domain.
3. Create a model interpreter to generate the appropriate low-level configurations. The model interpreter provides the semantics for the visual models.
Users then interact with the graphical models which represent concepts familiar to them and the corresponding Grid applications are automatically generated by the tool. The particular code that enables use of the distributed resources can be reused because the underlying Grid technologies are the same on every application domain. This means that this code can be optimized and developed by Grid experts and then used by end-users working on different application domains.
The quality of the applications is also improved since the rules of the programs that can be created are embedded in the meta-models. This often means that only valid models can be created, illegal models being rejected at modeling time. Bugs are also minimized at earlier stages since the tool generates code that was already tested and was developed by experts in the Grid area.
Furthermore, the development of the modeling tool, in general, is facilitated by the use of MetaCASE tools which, according to Czarnecki et al. [7] are beneficial for this endeavor since they provide support for meta-model editing as well as the creation of new notations.
5. EXAMPLE This section presents an initial exploration for creating a tool that automates work with the Grid. This example involved the creation of a general workflow system that abstracts and simplifies the development of Grid applications by hiding the low-level implementation details of the Grid middleware. The intention is to facilitate the deployment part of the Grid application construction process. The resulting tool helps the inexperienced Grid users by providing an environment in which they can graphically specify the workflow for their application and automatically generate the code that manages the execution of the application (For an in-depth explanation of this tool such as its capabilities and the range of applications that can be created the reader is referred to [16], [17]).
Applications can be created by specifying jobs on distributed resources and by specifying file transfers between those resources. Usually, jobs require one or more input files and also produce one or more output files. The following example presents a simple application using Hidden Markov Models to illustrate how this interaction is performed by this tool.
A Hidden Markov Model (HMM) was constructed to compare the differences between English and Spanish language patterns [9]. The input to the HMM is an intermingled file (parts in English and parts in Spanish) that only indicates if a letter is a
2 8
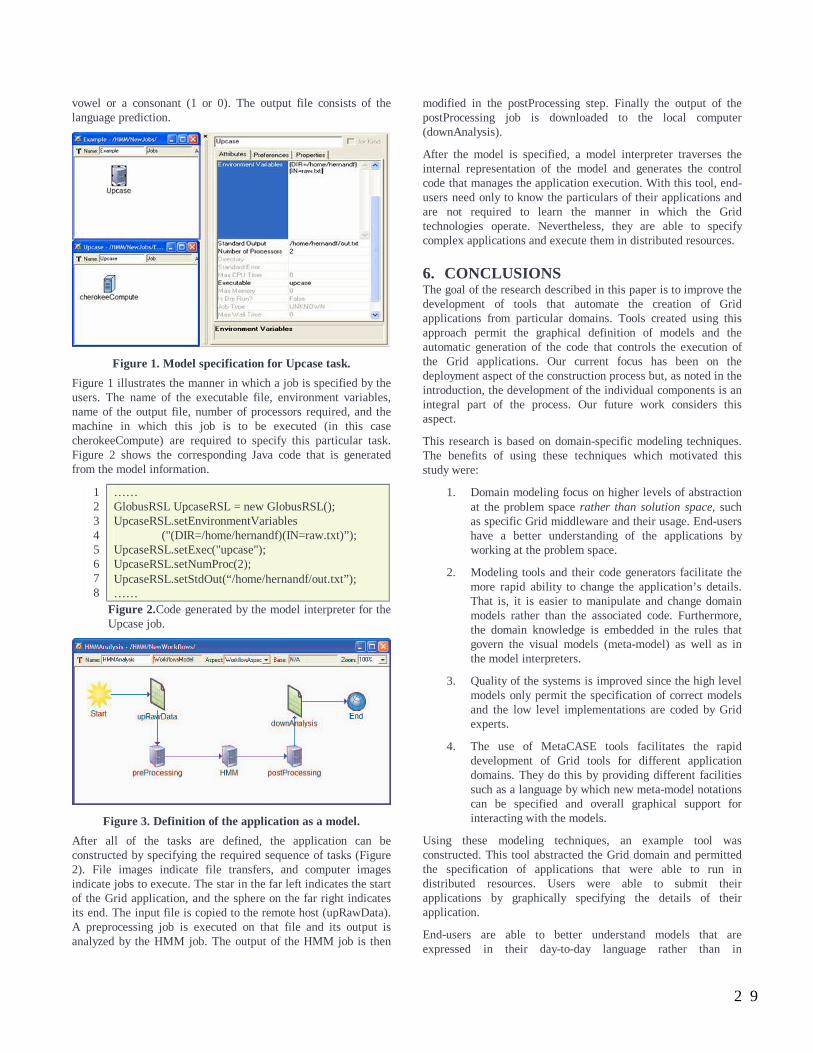
vowel or a consonant (1 or 0). The output file consists of the language prediction.
Figure 1. Model specification for Upcase task.
Figure 1 illustrates the manner in which a job is specified by the users. The name of the executable file, environment variables, name of the output file, number of processors required, and the machine in which this job is to be executed (in this case cherokeeCompute) are required to specify this particular task. Figure 2 shows the corresponding Java code that is generated from the model information.
1 2 3 4 5 6 7 8
…… GlobusRSL UpcaseRSL = new GlobusRSL(); UpcaseRSL.setEnvironmentVariables ("(DIR=/home/hernandf)(IN=raw.txt)”); UpcaseRSL.setExec("upcase"); UpcaseRSL.setNumProc(2); UpcaseRSL.setStdOut(“/home/hernandf/out.txt”); ……
Figure 2.Code generated by the model interpreter for the Upcase job.
Figure 3. Definition of the application as a model.
After all of the tasks are defined, the application can be constructed by specifying the required sequence of tasks (Figure 2). File images indicate file transfers, and computer images indicate jobs to execute. The star in the far left indicates the start of the Grid application, and the sphere on the far right indicates its end. The input file is copied to the remote host (upRawData). A preprocessing job is executed on that file and its output is analyzed by the HMM job. The output of the HMM job is then
modified in the postProcessing step. Finally the output of the postProcessing job is downloaded to the local computer (downAnalysis).
After the model is specified, a model interpreter traverses the internal representation of the model and generates the control code that manages the application execution. With this tool, end-users need only to know the particulars of their applications and are not required to learn the manner in which the Grid technologies operate. Nevertheless, they are able to specify complex applications and execute them in distributed resources.
6. CONCLUSIONS The goal of the research described in this paper is to improve the development of tools that automate the creation of Grid applications from particular domains. Tools created using this approach permit the graphical definition of models and the automatic generation of the code that controls the execution of the Grid applications. Our current focus has been on the deployment aspect of the construction process but, as noted in the introduction, the development of the individual components is an integral part of the process. Our future work considers this aspect.
This research is based on domain-specific modeling techniques. The benefits of using these techniques which motivated this study were:
1. Domain modeling focus on higher levels of abstraction at the problem space rather than solution space, such as specific Grid middleware and their usage. End-users have a better understanding of the applications by working at the problem space.
2. Modeling tools and their code generators facilitate the more rapid ability to change the application’s details. That is, it is easier to manipulate and change domain models rather than the associated code. Furthermore, the domain knowledge is embedded in the rules that govern the visual models (meta-model) as well as in the model interpreters.
3. Quality of the systems is improved since the high level models only permit the specification of correct models and the low level implementations are coded by Grid experts.
4. The use of MetaCASE tools facilitates the rapid development of Grid tools for different application domains. They do this by providing different facilities such as a language by which new meta-model notations can be specified and overall graphical support for interacting with the models.
Using these modeling techniques, an example tool was constructed. This tool abstracted the Grid domain and permitted the specification of applications that were able to run in distributed resources. Users were able to submit their applications by graphically specifying the details of their application.
End-users are able to better understand models that are expressed in their day-to-day language rather than in
2 9
cumbersome and often extraneous programming languages. This kind of tools will help enable end-user developers to gain access to the processing capabilities of the Grid without depending on the expertise of support teams resulting in end-users’ ability to create complex applications by themselves.
7. REFERENCES [1] Special Issue: Grid Computing Environments. Concurrency
and Computation: Practice and Experience, 14:1035-1593, 2002.
[2] End-user development: tools that empower users to create their own software solutions. Communications of the ACM, 47(9), September 2004.
[3] E. Akarsu, F. Fox, W. Furmanski, and T. Haupt. WebFlow – high level programming environment and visual authoring toolkit for high performance distributed computing. In Proceedings of the 1998 ACM/IEEE Conference on Supercomputing, pages 1-7, 1998.
[4] R. Armstrong, D. Gannon, A. Geist, K. Keahey, S. Kohn, L. McInnes, S. Parker, and B. Smolinski. Toward a common component architecture for high performance scientific computing. In Proceedings of the 8th. IEEE International Symposium on High Performance Distributed Computing, 1999.
[5] H. Bivens. Grid Workflow. Grid Computing Environments Working Group Document, 2001. http://zuni.cs.vt.edu/grid-computing/papers/draft-bivens-grid-workflow.pdf. [February 8, 2005].
[6] C. Boeres and V. Rebello. EasyGrid: Towards a framework for the automatic grid enabling of legacy mpi applications. Concurrency and Computation: Practice and Experience, 16(5):425-432, April 2004.
[7] K. Czarnecki, T. Bednasch, P. Unger, and U. Eisenecker. Generative programming for embedded software: An industrial experience report. In D. Batory, C. Consel, and W. Taha, editors, Proceedings of ACM SIGPLAN/SIGSOFT Conference, GPCE 2002, volume 2487 of LNCS, pages 156-172. Springer-Verlag, 2002.
[8] E. Deelman, J. Blythe, Y. Gil, C. Kesselman, G. Mehta, K. Vahi, K. Blackburn, A. Lazzarini, A. Arbree, R. Cavanaugh, and S. Koranda. Mapping abstract complex workflows onto grid environments. Journal of Grid Computing, 1:25-39, 2003.
[9] J. Fisher, F. Hernandez, and A. Sprague. Language patterns: Comparison and prediction using hidden markov models. In Proceedings of the 41st Annual ACM Southeast Conference, pages 246-250, 2003.
[10] I. Foster and C. Kesselman. Globus: A metacomputing infrastructure toolkit. International Journal of Supercomputing Applications, 11:115-128, 1997.
[11] J. Gerlach. Domain Engineering and Generic Programming for Parallel Scientific Computing. Elektrotechnik und Informatik, Doktor der Ingenieurwissenschaften, Technishen Universitat Berlin, Berlin, Germany, 2002.
[12] E. Giloi, M. Kessler, and A. Schramm. PROMOTER: A high level object-parallel programming language. In Proceedings of International Conference on High Performance Computing, 1995.
[13] J. Gray, T. Bapty, S. Neema, and J. Tuck. Handling crosscutting constraints in domain-specific modeling. Communications of the ACM, 44(10):87-93, October 2001.
[14] J. Greenfield and K. Short. Software Factories: Assembling Applications with Patterns, Models, Frameworks, and Tools. Wiley Publishing, Inc., 2004.
[15] T. Haupt, P. Bangalore, and G. Henley. Mississippi computational web portal. Concurrency and Computation: Practice and Experience, 14:1275-1287, 2002.
[16] F. Hernández, P. Bangalore, J. Gray, Z. Guan, and K. Reilly. GAUGE: Grid automation and generative environment. Concurrency and Computation: Practice and Experience, to appear. 2005.
[17] F. Hernández, P. Bangalore, J. Gray, and K. Reilly. A graphical modeling environment for the generation of workflows for the globus toolkit. In V. Getov and T. Kielman, editors, Component Models and Systems for Grid Applications. Proceedings of the Workshop on Component Models and Systems for Grid Applications held June 26, 2004 in Saint Malo, France, pages 79-96. Springer, 2005.
[18] P. Kacsuk, A. Goyeneche, T. Delaitre, T. Kiss, Z. Farkas, and T. Boczko. High-level grid application environment to use legacy codes as ogsa grid services. In Proceedings of the 5th IEEE/ACM International Workshop on Grid Computing, 2004.
[19] M. Lorch and D. Kafura. Symphony – A java-based composition and manipulation framework for computational grids. In Proceedings of the 2nd IEEE/ACM International Symposium on Cluster Computing and the Grid (CCGrid2002), pages 136-143, 2002.
[20] J. Novotny. The grid portal development kit. Concurrency and Computation: Practice and Experience, 14:1129-1144, 2002.
[21] J. Siek and A. Lumsdaine. The matrix template library: A generic programming approach to high performance numerical algebra. In Proceedings of ISCOPE 1998, volume 1505 of LNCS, pages 59-70. Springer-Verlag, Santa Fe, NM, 1998.
[22] B. Sotomayor. The globus toolkit 3 programmer’s tutorial. http://gdp.globus.org/gt3-tutorial/. [February 8, 2005].
[23] A. Sutcliffe and N. Mehandjiev. Introduction. Communications of the ACM, 47(9):31-32, 2004.
[24] S. Thatte. Business Process Execution Language for Web Services.http://www106.ibm.com/developerworks/webservices/library/ws-bpel/. [February 8, 2005], May 2003.
[25] G. von Laszewski, K. Amin, M. Hategan, N. Zaluzec, S. Hampton, and A. Rossi. Gridant: A client-controllable grid workflow system. In Proceedings of the 37th Hawaii International Conference on System Science, pages 210-219, 2004.
3 0
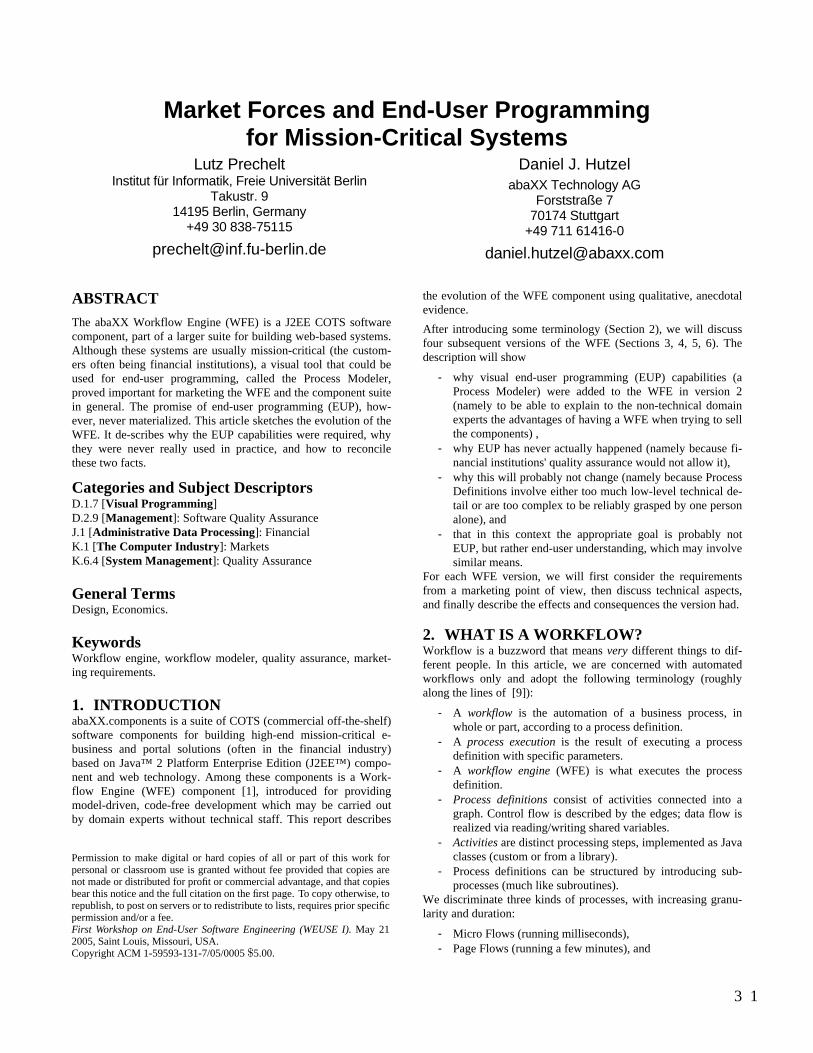
Market Forces and End-User Programming for Mission-Critical Systems
Lutz Prechelt Institut für Informatik, Freie Universität Berlin
Takustr. 9 14195 Berlin, Germany
+49 30 838-75115
Daniel J. Hutzel abaXX Technology AG
Forststraße 7 70174 Stuttgart
+49 711 61416-0
ABSTRACT
The abaXX Workflow Engine (WFE) is a J2EE COTS software component, part of a larger suite for building web-based systems. Although these systems are usually mission-critical (the custom-ers often being financial institutions), a visual tool that could be used for end-user programming, called the Process Modeler, proved important for marketing the WFE and the component suite in general. The promise of end-user programming (EUP), how-ever, never materialized. This article sketches the evolution of the WFE. It de-scribes why the EUP capabilities were required, why they were never really used in practice, and how to reconcile these two facts.
Categories and Subject Descriptors D.1.7 [Visual Programming] D.2.9 [Management]: Software Quality Assurance J.1 [Administrative Data Processing]: Financial K.1 [The Computer Industry]: Markets K.6.4 [System Management]: Quality Assurance
General Terms Design, Economics.
Keywords Workflow engine, workflow modeler, quality assurance, market-ing requirements.
1. INTRODUCTION abaXX.components is a suite of COTS (commercial off-the-shelf) software components for building high-end mission-critical e-business and portal solutions (often in the financial industry) based on Java™ 2 Platform Enterprise Edition (J2EE™) compo-nent and web technology. Among these components is a Work-flow Engine (WFE) component [1], introduced for providing model-driven, code-free development which may be carried out by domain experts without technical staff. This report describes
the evolution of the WFE component using qualitative, anecdotal evidence. After introducing some terminology (Section 2), we will discuss four subsequent versions of the WFE (Sections 3, 4, 5, 6). The description will show
- why visual end-user programming (EUP) capabilities (a Process Modeler) were added to the WFE in version 2 (namely to be able to explain to the non-technical domain experts the advantages of having a WFE when trying to sell the components) ,
- why EUP has never actually happened (namely because fi-nancial institutions' quality assurance would not allow it),
- why this will probably not change (namely because Process Definitions involve either too much low-level technical de-tail or are too complex to be reliably grasped by one person alone), and
- that in this context the appropriate goal is probably not EUP, but rather end-user understanding, which may involve similar means.
For each WFE version, we will first consider the requirements from a marketing point of view, then discuss technical aspects, and finally describe the effects and consequences the version had.
2. WHAT IS A WORKFLOW? Workflow is a buzzword that means very different things to dif-ferent people. In this article, we are concerned with automated workflows only and adopt the following terminology (roughly along the lines of [9]):
- A workflow is the automation of a business process, in whole or part, according to a process definition.
- A process execution is the result of executing a process definition with specific parameters.
- A workflow engine (WFE) is what executes the process definition.
- Process definitions consist of activities connected into a graph. Control flow is described by the edges; data flow is realized via reading/writing shared variables.
- Activities are distinct processing steps, implemented as Java classes (custom or from a library).
- Process definitions can be structured by introducing sub-processes (much like subroutines).
We discriminate three kinds of processes, with increasing granu-larity and duration:
- Micro Flows (running milliseconds), - Page Flows (running a few minutes), and
Permission to make digital or hard copies of all or part of this work forpersonal or classroom use is granted without fee provided that copies arenot made or distributed for profit or commercial advantage, and that copiesbear this notice and the full citation on the first page. To copy otherwise, torepublish, to post on servers or to redistribute to lists, requires prior specificpermission and/or a fee.First Workshop on End-User Software Engineering (WEUSE I).May 212005, Saint Louis, Missouri, USA.Copyright ACM 1-59593-131-7/05/0005$5.00.
3 1
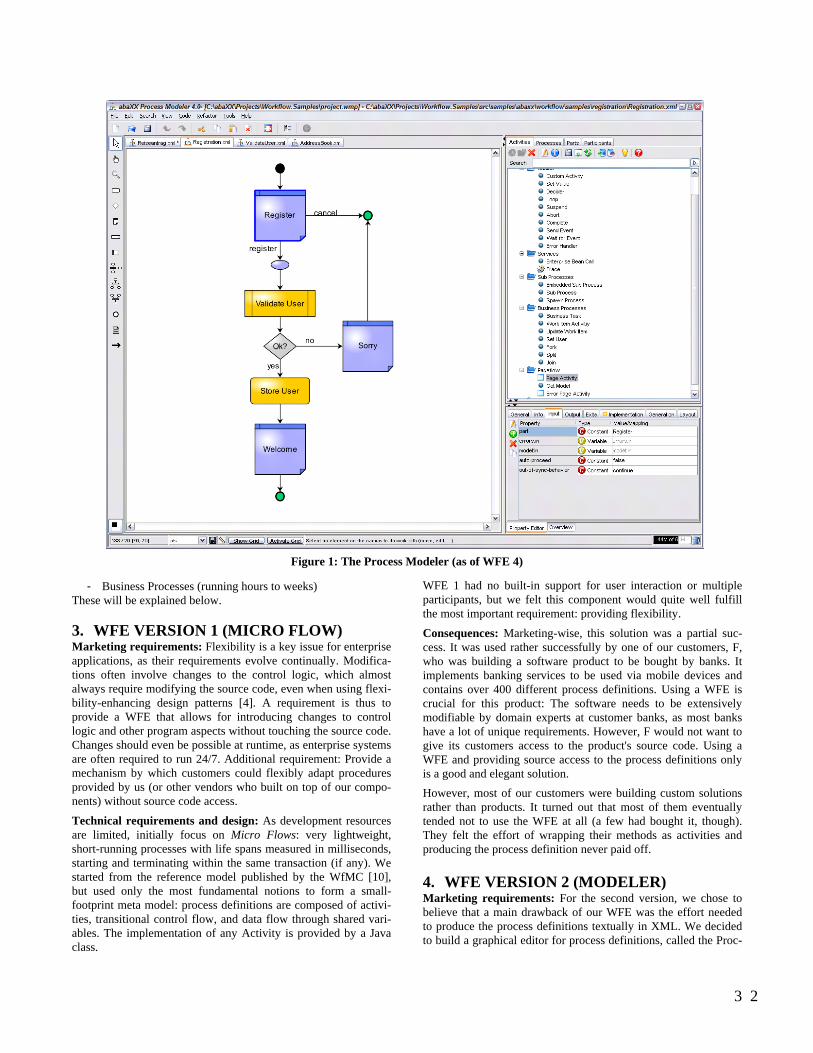
- Business Processes (running hours to weeks) These will be explained below.
3. WFE VERSION 1 (MICRO FLOW) Marketing requirements: Flexibility is a key issue for enterprise applications, as their requirements evolve continually. Modifica-tions often involve changes to the control logic, which almost always require modifying the source code, even when using flexi-bility-enhancing design patterns [4]. A requirement is thus to provide a WFE that allows for introducing changes to control logic and other program aspects without touching the source code. Changes should even be possible at runtime, as enterprise systems are often required to run 24/7. Additional requirement: Provide a mechanism by which customers could flexibly adapt procedures provided by us (or other vendors who built on top of our compo-nents) without source code access.
Technical requirements and design: As development resources are limited, initially focus on Micro Flows: very lightweight, short-running processes with life spans measured in milliseconds, starting and terminating within the same transaction (if any). We started from the reference model published by the WfMC [10], but used only the most fundamental notions to form a small-footprint meta model: process definitions are composed of activi-ties, transitional control flow, and data flow through shared vari-ables. The implementation of any Activity is provided by a Java class.
WFE 1 had no built-in support for user interaction or multiple participants, but we felt this component would quite well fulfill the most important requirement: providing flexibility.
Consequences: Marketing-wise, this solution was a partial suc-cess. It was used rather successfully by one of our customers, F, who was building a software product to be bought by banks. It implements banking services to be used via mobile devices and contains over 400 different process definitions. Using a WFE is crucial for this product: The software needs to be extensively modifiable by domain experts at customer banks, as most banks have a lot of unique requirements. However, F would not want to give its customers access to the product's source code. Using a WFE and providing source access to the process definitions only is a good and elegant solution. However, most of our customers were building custom solutions rather than products. It turned out that most of them eventually tended not to use the WFE at all (a few had bought it, though). They felt the effort of wrapping their methods as activities and producing the process definition never paid off.
4. WFE VERSION 2 (MODELER) Marketing requirements: For the second version, we chose to believe that a main drawback of our WFE was the effort needed to produce the process definitions textually in XML. We decided to build a graphical editor for process definitions, called the Proc-
Figure 1: The Process Modeler (as of WFE 4)
3 2
ess Modeler, though not everybody believed this would be the right choice. Our decision was mainly driven by market forces. We needed to sell our components (which are typically sold as a suite and bought in the context of specific projects) not only to technical people, but also to domain experts, who are almost without excep-tion non-programmers. To them, the idea of the WFE 1 had been extremely abstract and it had been hard to convince them that it was worthwhile. We believed the Modeler would change that: It made program designs and modifications visual, would give the domain experts a means to talk about the system to the technical people at eye-level, and would hence increase the domain experts' technical confidence and be a great selling proposition. We also intended to sell the Modeler as an end-user programming tool: Changes to process definitions that relied only on previously existing activities could be performed by domain specialists alone, much like editors change a web site through a content management system.
Technical requirements and design: The Process Modeler was implemented as a stand-alone program, a Swing application. It allowed to graphically design process definitions in familiar activ-ity-flow diagrams by selecting pre-defined activities from a gal-lery, dropping them as nodes on the diagram and wiring them into a control flow by drawing edges from declared exits of an activity to successor activities. The existing base of the WFE (the process definition language, the framework, and the runtime system) hardly changed, except that we added meta information for Activity implementations (BeanInfo).
Consequences: Marketing-wise, WFE 2 was a success. The Mod-eler was indeed instrumental in convincing the domain experts of the usefulness of a WFE which so became an important selling point for our component suite. Technically, however, it turned out that the Modeler hardly added to the practical value of the WFE:
- From the programmers' point of view: Although the usabil-ity of the Modeler was quite acceptable, most programmers found it quicker to write the XML process definitions with a text editor.
- From the domain experts' point of view: Whatever solution they were building, with the processes being Micro Flows, most of what they did still tended to be rather internal to the software and hence still quite abstract. The gains from hav-ing a visual representation were relevant in only few cases.
Even the aforementioned customer F decided not to use our Proc-ess Modeler, although in principle such a tool was obviously an important contribution to the value of their product. Rather, they decided – despite the rather large effort involved – to build a simi-lar tool themselves, because they required massive customizabil-ity, which our Modeler did not provide. Overall, it turned out our original assumptions had been mostly wrong; the actual usage conditions often crippled the usefulness of having a Micro Flow WFE:
- Dynamic behavior changes at runtime were often as unac-ceptable as was end-user programming: The quality assur-ance processes of many of our customers (many of whom
are financial institutions) demanded a full-fledged IT pro-ject even for changes where modifying only process defini-tions could have done the job.
- Many changes were not confined to the process definition: Much of the time, the intended change would require intro-ducing a new Activity or modifying an existing one.
- The vast majority of code in custom solutions goes into web user interfaces. Consequently, modifications in re-sponse to evolving requirements would quite frequently af-fect user interface logic and the flow of web pages, which was not covered by the WFE in versions 1 and 2 at all.
A WFE that supported only Micro Flows was clearly not as useful as we had hoped.
5. WFE VERSION 3 (PAGEFLOW) Marketing requirements: At this point, however, we recognized that our WFE would become very useful if it supported the type of process we call Page Flow: Page Flows describe user interactions spanning several dialog steps of the same user within a web application. They usually have a medium duration (minutes). Page Flows repeatedly do the following: execute some application logic, then display a page, then wait for the user to send the next request. Page Flows cen-tralize the control flow of a web application, which otherwise tends to be widely scattered over many files and rather hard to understand and modify. We decided to extend the WFE to cover Page Flows.
Technical requirements and design: The Modeler was enhanced by a Page Gallery that displays the pages available in a web ap-plication. Dropping such a page to a process diagram adds a page activity to the process definition with control flow exits reflecting the page’s declared web events. Like in version 2, the required changes to the WFE were purely incremental. First, a generic Page Activity was introduced, instances of which represent web pages within a process definition. Its implementa-tion displays the assigned page and suspends the process. Second, the run-time system's Page Flow Interceptor plugs into the web framework [2], [6], [8], intercepts an incoming request (if it refers to a Page Flow process instance), maps it to the corresponding exit of a page activity, and resumes the process.
Consequences: By and large, this third version of the WFE was a big success, both technically and marketing-wise. Most of the expected benefits were realized:
- While defining a dialog sequence, the visualization pro-vided by the Process Modeler much simplified the commu-nication both among domain experts as well as between domain experts and programmers.
- This was true not just for the initial implementation of a dialog sequence, but also during incremental improvement cycles later on.
- At the same time, the centralization of control flow aided and accelerated frequent changes during the development process, which made rapid prototyping much more realistic.
- Understanding an existing implementation became much easier for the programmers: Normally in a web application, control flow and data flow are scattered horribly across dozens of files (JSP pages and controller Java classes). In
3 3
contrast, a Page Flow definition now provided a nice, co-herent "big picture" while suppressing the details.
In terms of end-user programming, the addition of Page Flows allowed business experts to quickly change the course of user interactions in certain cases. Overall, however, the situation did not change much compared to that we found for WFE 2:
- Modifying (let alone creating) a Page Flow still usually re-quired too much technical background knowledge (about the behavior of the Activities involved) to be possible for a pure domain expert
- and the prescribed quality assurance processes would not have allowed it anyways.
Nevertheless, our customers now started using the WFE heavily and not before long the obvious and unavoidable thing happened: They wanted to go beyond single-participant page flows towards long-running, multi-participant business process automation.
6. WFE VERSION 4 (BUSINESS PROCESS) Marketing requirements: Thus, the next goal clearly had to be supporting the next level of processes, too: Business Processes. Business Processes are workflows with a long duration (hours to weeks) and multiple participating users. Most of the time they pause with their state information persisted, waiting for an exter-nal event – typically a user re-activating the process by triggering its next step after selecting it as a task from a work list, but often also technical kinds of trigger stemming from other software sys-tems. This requires functionality for modeling participant roles and support for parallelism.
Technical requirements and design: We added that support basically by introducing new generic activities. This was mainly the Work Item Activity which represents a transition from one participant to another (during which the process is sus-pended/passivated) as well as Split and Join Activities which allow for parallel control flow paths. In addition, we provided pre-fabricated user interface compo-nents, such as the Worklist Portlet which displays a user’s list of pending work items and allows him/her to pick an item for further processing. On the Modeler side, we introduced a Participants Gallery, which reflects organizational roles in a hierarchy. An open XML inter-face allows customers to put their own organizational model into this gallery. An entry from the Participants Gallery can be dropped to a process diagram and associated with a Work Item Activity, with the effect that the work item created at runtime will be assigned to all users who have the respective organizational role. Consequences: At the time of writing, version 4 of the WFE has only just appeared on the market, so we do not yet have much actual experience with its consequences. It is obvious, however, that the extended functionality does not make end-user program-ming any easier:
- the previous stumbling blocks are still relevant, - the complexity of concurrent, multiple-participant proc-
esses is much higher (deadlock, escalation, substitution, etc).
7. LESSONS LEARNED & CONCLUSION Past and present: As we introduced the Process Modeler, we did not make a conscious decision whether it would primarily be tar-geted to end-users or primarily to software engineers. We are still not sure whether the EUP claims1 we made helped more than they hampered in convincing potential customers to buy our compo-nent suite. But we have meanwhile understood this much: as un-realistic as actual end-user programming by means of the Process Modeler may be in our setting, the Modeler's contribution towards both convincing (before buy) and empowering (after buy) the domain experts is substantial and relevant – the Modeler is not just some arbitrary non-end-user software engineering tool.
Future: Further development of the WFE will likely be in the field of web-service-based process collaboration and orchestra-tion, maybe using a standardized notation such as the BPEL (Business Process Execution Language, [5]) or BPML (Business Process Modeling Language, [3]), plus the underlying somewhat extended paradigm [7]. This will further increase the complexity faced by people creating Process Definitions and will make end-user programming still less likely to occur. This is probably a trend valid for all potential mission-critical EUP in enterprise applications: The complexity of the require-ments handled by these applications increases in such a way that end-user programming becomes increasingly unlikely because multi-person teams (which can then include a software engineer) are needed anyways – independent of the actual tools or tech-niques used.
Conclusion: Sometimes end-user programming may be one half the right idea and one half a red herring: end-user understanding may be the goal to go for.
8. REFERENCES [1] abaXX Technology AG, abaXX.components Workflow En-
gine User Guide V4.0, Stuttgart, 2004. [2] abaXX Technology AG, abaXX.components WebApp
Framework User Guide V4.0, Stuttgart, 2004. [3] Business Process Management Initiative, Business Process
Modeling Language BPML V1.0 Specification, www.bpmi.org, 2002.
[4] E. Gamma, R. Helm, R. Johnson, J. Vlissides, Design Pat-terns: Elements of Reusable Object-Oriented Software, Ad-dison-Wesley, 1995.
[5] OASIS, Business Process Execution Language for Web Ser-vices Version 1.1, www.oasis-open.org, 2003.
[6] H.M.L. Ship, Tapestry in Action, Manning Publications, Greenwich, CT, 2004.
[7] H. Smith, P. Fingar, Workflow is just a Pi process, BPTrends, www.bptrends.com, January 2004.
[8] J. Turner, K. Bedell, Struts Kick Start, SAMS, 2002. [9] Workflow Management Coalition, Terminology and Glos-
sary, WFMC TC 1011 v.3, www.wfmc.org, Feb 1999. [10] Workflow Management Coalition, The Workflow Reference
Model, WFMC TC 1003 v.1.1, www.wfmc.org, Jan 1995. 1 Better: claimlets, as they were never really loud.
3 4
Old Issues, New Eyes Michael M. Pickard
Stephen F. Austin State University Box 13063
Nacogdoches, TX 75962 936-468-2508
ABSTRACT
This paper considers end user development (EUD) from the
perspective of a veteran software professional. Many of the issues
currently discussed in relation to EUD have existed almost from
the dawn of computing. However, there are some modern trends
that have the potential to affect both end user computing and
professional software development.
Categories and Subject Descriptors
D.2.6 [Software Engineering]: Programming Environments.
K.6.3 [Management of Computing and Information Systems]:
Software Management - software development.
General Terms
Management, Documentation, Economics, Human Factors..
Keywords
End user development, information technology, end user software
engineering.
1. INTRODUCTION In [9] Sutcliffe and Mehandjiev stated that end user development
(EUD) arose as an issue with the advent of personal computers
and BASIC. Warren Harrison more accurately characterized EUD
as an activity that has been around almost as long as computers
[4]. I have been involved in computing for more than thirty-five
years. One of the benefits of growing older is that I’ve become a
walking repository of historical facts, some of which are actually
useful. As a witness to history, I agree with Harrison.
However, one might argue that EUD didn’t really become all that
problematic until computing became more widely available to the
masses through data communications and timesharing services.
For example, as a consultant working in the late 1970’s I found
myself retained by a bank to investigate and document working
applications that had been developed by users with no assistance
from the bank’s information technology (IT) staff. This situation
.
developed as a result of the bank’s divestiture of a unit that had
provided timesharing and other data processing services to
external customers as well as to internal bank users. When the
bank decided to sell the timesharing provider, its IT department
found itself responsible for supporting the user applications that
had been transferred from the provider’s system.
This engagement provided a number of lessons. Some users had
very simple, small applications using, typically, BASIC programs.
However, a number of relatively large, complex systems had been
cobbled together that employed multiple BASIC and FORTRAN
programs as well as system utilities to generate reports and to
create data that were regularly used in the user’s functional area.
Few of the user applications were accompanied by
documentation. Typically, a savvy end-user had put it all together
and carried all or most of the knowledge about the application in
his head. There seemed to be no appreciation for the benefits of
controlling changes, controlling access to programs, and
documenting interfaces. I can well imagine any of those users
saying, “Configuration management? What’s that?”
Although the users in this example were polite and forthcoming
(because my inquiries had the backing of senior bank
management), they obviously resented my meddling. They were
frustrated and afraid that their perfectly good (in their eyes)
computer solutions would be taken away. “It’s fine as it is,” one
such user said rather testily.
2. INHERENT CONFLICTS The related issues of EUD and the support of end users by IT have
been discussed in the literature numerous times through the years,
usually with trepidation, if not alarm [1][5][8]
2.1 User Domain Knowledge versus Technical
Know-how Obviously, the users are expected to be experts in their own
functional world while members of the IT staff are expected to be
experts in technology. Rarely, one encounters a citizen of one of
these worlds who also has strong knowledge of the other. The
rareness of these encounters is reason for existence of systems
analysts and other such people. Those who can help bridge this
gap between the worlds have historically been much appreciated
(if not always well paid). In deed, much of my twenty-year career
before academia involved direct interaction with end users.
More recently, efforts have been to reduce this “expertise tension”
by means of tools and environments as described in [2], while
others seek to provide domain-oriented paradigms for EUD [6].
Permission to make digital or hard copies of all or part of this work forpersonal or classroom use is granted without fee provided that copies arenot made or distributed for profit or commercial advantage, and that copiesbear this notice and the full citation on the first page. To copy otherwise, torepublish, to post on servers or to redistribute to lists, requires prior specificpermission and/or a fee.First Workshop on End-User Software Engineering (WEUSE I).May 212005, Saint Louis, Missouri, USA.Copyright ACM 1-59593-131-7/05/0005$5.00.
3 5
2.2 Central Control versus Local Autonomy Gone are the days of a priesthood of computer people who are
regarded with awe and whose pronouncements are deemed
unequivocal certainties. However, many enterprises still have
staff who are primarily responsible for user support, software and
hardware acquisition, and, perhaps, development.
2.2.1 Efficiency With central control of software and hardware assets, certain
tasks, such as ensuring efficient use of resources, are more easily
accomplished.
From the user’s view, though, organizational desire for efficiency
often conflicts with the user’s need for freely available computing
resources.
2.2.2 Controls Controls on data input, data access, and information security in
general, are also more easily achieved with centrally provided
computing. On the other hand, users see central control as an
obstacle delaying achievement of their goals.
In fact, at least one of the applications that were the subject of my
investigation had been cited by the bank’s internal auditor as
needing audit trails on transactions, better controls on changes in
data, improved balancing procedures, full documentation of the
application according to the bank’s standards, standard
procedures for program changes, inclusion of all program source
files in a controlled source library, and separation of duties (the
same user directly updated files, executed programs, and balanced
totals).
3. Evolution
3.1 Delivery of Computing Advances in hardware and consequent changes in delivery of
computing have brought us from the early main-frame, primitive
operating system “tar pit,” when concurrently running multiple
applications was impossible, through the provision of computing
resources to many through timesharing capability; the advent of
distributed computing using first minicomputers and, later,
microcomputers; and most recently to networked computing. This
evolution of computing resources delivery has brought more
computing capability within the grasp of more end users.
Some industry pioneers and experts have famously miscalculated
the speed and magnitude of the spread of computing capability to
the general population.
3.2 Increased Sophistication of End Users As computers have permeated our society and people have
become more comfortable with them, users have become
increasingly braver about working directly with them. Computer
phobia is no longer commonplace.
3.3 Easier Development Getting the computer to produce a solution to different problems
has steadily progressed from the days of plugging in wires in a
different pattern to increasingly more abstract methods of
traversing the gap between the intellectual solution and an
algorithm physically implemented on a concrete machine.
In some cases, the means of expressing a solution is custom-
designed for a specific functional area, i.e., for a user holding a
limited, focused perspective. Other ways of providing computer
solutions have involved more general abstractions. Perhaps the
best known example is the ingenious, ubiquitous spreadsheet.
3.4 Packaged Solutions Over the years, the continually growing supply of commercial off-
the-shelf software (COTS) available for purchase for a ever-
widening circle of computer applications has affected the need for
in-house developers.
3.5 New Issues Notwithstanding the title of this paper, there are new phenomena
that bear on the issue of EUD. One of these is the increased use
of off-shore development, which is reducing the need for in-house
computing and development expertise in enterprises. If one of the
effects of off-shore development and some of the evolutionary
trends mentioned is to reduce the number of technical experts that
are readily available as a source of direct assistance for end users,
then users are more likely to resort to EUD.
Another issue, probably influenced by off-shore development, is
the declining enrollment in computer science programs that many
institutions face. At the same time that this is happening, there is
an increasing interest in many quarters in information technology
majors.
The November 22 2004 draft version of Computing Curricula
2004 contains an excellent set of illustrations of the coverage of
topics within computer science, information systems, software
engineering, computer engineering, and information technology
major programs. The computer science and information
technology curricula are illustrated as almost the inverse of one
another, in that computer science covers a broad base of
theoretical topics while information technology (IT) emphasizes
applied computing [7]. Some IT curricula require or encourage
coursework that provides knowledge of an application domain.
Could this be a trend that reflects increasing need in the business
world for “super-users?”
3.6 Conjectures This paper has no conclusions, only open questions.
As development becomes possible at higher levels of abstraction
while users become more sophisticated, will EUD and PD
(professional development) begin to converge?
Will the only difference between the two become their degree of
specialization in a functional domain?
If professional developers in the U.S. become increasingly rare,
who will write and maintain the applications that allow an end
user to solve problems at a very high level of abstraction?
Who will write the COTS applications?
I can validate some of the concerns expressed by Harrison, who
writes, “Can it be true that software manipulating my credit
history could have been written by an accountant with no concept
of software testing or development processes? [4]” Experience
tells me the answer is “Yes!”
3 6
It is heartening to know that some are concerned about developing
a software engineering environment for EUD that has the
daunting aim of helping users to develop software that is more
dependable [3]. In my mind, that is a more vital quest than
making EUD easier.
4. REFERENCES [1] Bucher, J. The way we were: Twenty-five years of end user
computing support in higher education. In Proceedings of
the SIGUCCS user services conference (SIGUCCS ’02)
(Providence, Rhode Island, USA, Nov. 20-23, 2002) ACM
Press, New York, NY, 2002, 13-16.
[2] Beringer, J. Reducing expertise tension. IEEE Software
(Jul/Aug 2004), 39-40.
[3] Burnett, M., Cook C. and Rothermel, G. End-user software
engineering. Communications of the ACM , 47, 9 (Sep.
2004), 53-58.
[4] Harrison W. The dangers of end-user programming. IEEE
Software (Jul/Aug 2004), 5-7.
[5] Kwan, S. and Curley, K. Corporate MIS/DP and end user
computing: the emergence of a new partnership. DATA
BASE (Summer 1989), 31-35.
[6] Repenning, A. and Ioannidou, A. Agent-based end-user
development. Communications of the ACM , 47, 9 (Sep.
2004), 41-46.
[7] Shackelford, R., et al. Computing Curricula 2004 Overview
Report (22 Nov 2004), 1-48.
http://www.acm.org/education/curricula.html.
[8] Sumner, M. and Klepper, R. End-user application
development: practices, policies, and organizations impacts.
In Proceedings of the twenty-second annual conference on
computer personnel research (Calgary, Canada, 1986). ACM
Press, New York, NY, 1986, 102-116).
[9] Sutcliffe A. and Mehandjiev, N. End-user development.
Communications of the ACM , 47, 9 (Sep. 2004), 31-32.
3 7
Two Principles of End-User Software Engineering Research Judith Segal
Department of Computing Faculty of Mathematics and Computing
The Open University Walton Hall
Milton Keynes MK7 6AA
UK +44 (0)1908 659793
ABSTRACT This paper argues the importance of two principles for end-user software engineering research. The first of these is that not all end-user developers are the same. The second is that research must be grounded in field studies of actual end-user development practice. In keeping with this second principle, our arguments are based on data from our own field studies of practice. These field studies involve a class of end user developer, whom we term ‘professional end user developers’ and who include scientists, mathematicians and engineers.
Categories and Subject Descriptors K 8.3.[Personal computing] Management and maintenance
General Terms Human factors.
Keywords Professional end user developers; field studies; software development practice.
1. INTRODUCTION This paper argues for the importance of two principles for
end-user software engineering research. The first of these is that not all end-user developers are the same. The second is that research must be grounded in field studies of actual end-user development practice. In keeping with this second principle, our arguments are supported by data from our own field studies of practice ([15], [16], [18]). These studies focus on an important class of developers whom we term ‘professional end user developers’.
This class, which includes mathematicians, scientists and engineers, constantly use formal languages such as mathematics in their professional life, and so it is reasonable to suppose that, unlike for many end users, coding per se poses few difficulties for them. This supposition is borne out by our field studies, as we shall see.
Many end-user developers baulk at the thought of coding in a general purpose programming language and grappling with a formal syntax and semantics. It is thus entirely reasonable that much research on end-user software development should concentrate on development environments which gently lead the end-user towards achieving his/her goals, perhaps by the use of metaphors based on well-known tools, such as forms or spreadsheets ([11], [19], [3]). Professional end user developers, on the other hand, have been doing their own programming since the inception of FORTRAN, far predating the advent of the PC. Given their facility with formal languages and their long tradition of software development, we believe that customized development environments have little to offer them. Their facility with coding does not, however, mean that they have no problems with software development. The purpose of our studies is to investigate the nature of these problems and consider how they might be alleviated.
In section 2 of this paper, we briefly describe our field studies, of a financial consultancy and a research institute, from which our data arose. In the light of these data, in section 3, we discuss how professional end user developers differ from professional software developers and the nature of their problems with software development. In section 4, again in the light of our field study data, we evaluate some suggestions in the literature for supporting end user software development, and make some suggestions of our own. Finally, in section 5, we summarize our arguments.
2. OUR FIELD STUDIES We conducted two field studies, one of financial consultants ([15], [18]), and one of research scientists ([16], [18]). In [13], we argue for the importance of field studies in empirical software engineering research. Ideally, such field studies should include some ethnographic elements; some immersion of the researcher in the context of study. Because of issues with commercial confidentiality and difficulties with coordination, we were not able to achieve this ideal in our studies. Instead, the principal source of our data is 37 individual interviews, 16 in the financial consultancy, 19 in the research institute and 2 of a professional
Permission to make digital or hard copies of all or part of this work forpersonal or classroom use is granted without fee provided that copies arenot made or distributed for profit or commercial advantage, and that copiesbear this notice and the full citation on the first page. To copy otherwise, torepublish, to post on servers or to redistribute to lists, requires prior specificpermission and/or a fee.First Workshop on End-User Software Engineering (WEUSE I).May 212005, Saint Louis, Missouri, USA.Copyright ACM 1-59593-131-7/05/0005$5.00.
3 8
software engineer who worked closely with the research scientists. Each of these interviews was between 30 minutes and an hour in duration. They involved people at all levels in each organization, as detailed in [18]. Over half the interviews were audio-taped and transcribed; the rest were fully noted. In addition, we made many phone calls and emails to clarify or enlarge on specific issues. Having analyzed our data by chunking them into related themes, we performed ‘member checking’, as advocated in [14], to confirm with our interviewees that our perceptions ‘rang true’.
3. PROFESSIONAL END USER DEVELOPERS: A CLASS APART In section 1 above, we argued that professional end user developers (mathematicians, scientists, engineers etcetera) are distinguished from other classes of end user developer in that, given their experience with manipulating formal languages, they have few problems with coding per se. The question thus arises as to whether they can be considered to be the same as professional software engineers. The answer to this is an emphatic ‘no’, as we shall now justify. The primary aim of a professional end-user organization is not to produce software. In our studies, the primary aim of the financial consultancy was to provide advice for large, frequently multi-national, financial services companies; that of the research institute, to investigate the physics and chemistry of outer space. Software was produced in order to promote these aims. This software consisted of financial models, in the case of the consultancy, and software to drive instruments and analyze the resulting data, in the case of the research institute. In both cases, the risk of incorrect software is potentially disastrous. In the financial consultancy, an incorrect software model might, in the worst case scenario, result in the organization being sued to the point of bankruptcy by a disgruntled client; in the case of the research institute, incorrect software might seriously compromise the research. Despite the importance of correct software, in neither organization were software development skills and knowledge valued to anything like the extent of domain knowledge (financial mathematics; physics; chemistry; space science). This value differential appeared more marked in the research institute than in the consultancy. In the former, a person appointed to a post with the term ‘Programmer’ in the title had, in fact, no experience of software development; people spoke of perceptions of software development as not being ‘real work’ and of software as something that could just be ‘spun up’ in half an hour over a lunch break ([18]). There was no evidence of software development not being afforded enough time in the consultancy. However, both organisations shared the belief that software development was something anybody in the organization could do if necessary, and was part of everyone’s secondary generic skill set. So here we have the essential difference between professional end user developers and professional software developers. For the former as opposed to for the latter, software development is secondary to their primary aims; the effort, skills and knowledge required to develop such software does not appear to be adequately recognized and neither does the effort and resources necessary to acquire the necessary skills and knowledge.
Let us now consider software development knowledge. In our studies, coding – the actual implementation of the software – did not appear to be a problem: the research scientists, on the whole, were happy to use programming languages they had learned at University; the financial consultants were given a course on using the in-house development environment. This is consistent with our earlier comments on facility with formal languages such as mathematics being associated with facility with coding. However, there’s a lot more to software development than merely producing some software that appears fit for purpose. There’s testing to confirm that the software is, indeed, fit for purpose; there’s constructing the code so that it is comprehensible for future maintainers (this was an important issue for the research scientists, where, in some cases, code had to be maintained by different people over a period of many years [16]), and there are issues to do with increasing productivity and dependability. These latter might be partially solved by the provision of well-engineered and well-tested reusable components. The literature is clear that the quality of end user developed software is a matter of concern for organisations (see for example, [19] [12], [8]): only attention to these meta-level software engineering issues will address this concern. One question is how these meta-level issues can be attended to in organizations which ascribe relatively little value to software development. Another question is how software development knowledge can be acquired and shared within such organizations. We should note here that exacerbating the problem of software development knowledge acquisition and sharing, is the particular fragility of the community of practice of software developers within end user organizations. A community of practice is a community of colleagues working together who create and share knowledge communally [2]. Our field studies demonstrate that software is typically developed by professional end users near the beginning of their careers: they aspire to gain reputations in their professional domain (for example, in science or financial mathematics) and rise up the career ladder to the point where they can instruct others to develop software for them. As they ascend the ladder, they take their software development knowledge with them.
4. PROFESSIONAL END USER DEVELOPERS AND WELL-ENGINEERED SOFTWARE In this section, we illustrate our second principle, the importance of grounding research in field studies of practice, by using our data to evaluate suggestions as to how software engineers might best support professional end user developers in producing well-engineered software. We begin by arguing that support mechanisms which require extra resources and/or changes in organizational culture and/or changes in working practices, are unlikely to be effective in the context of a professional end user organization. In the light of this argument, we then consider the potential of software reuse and of knowledge management tools. Finally, we evaluate some suggestions made in the literature in the light of our field studies.
3 9
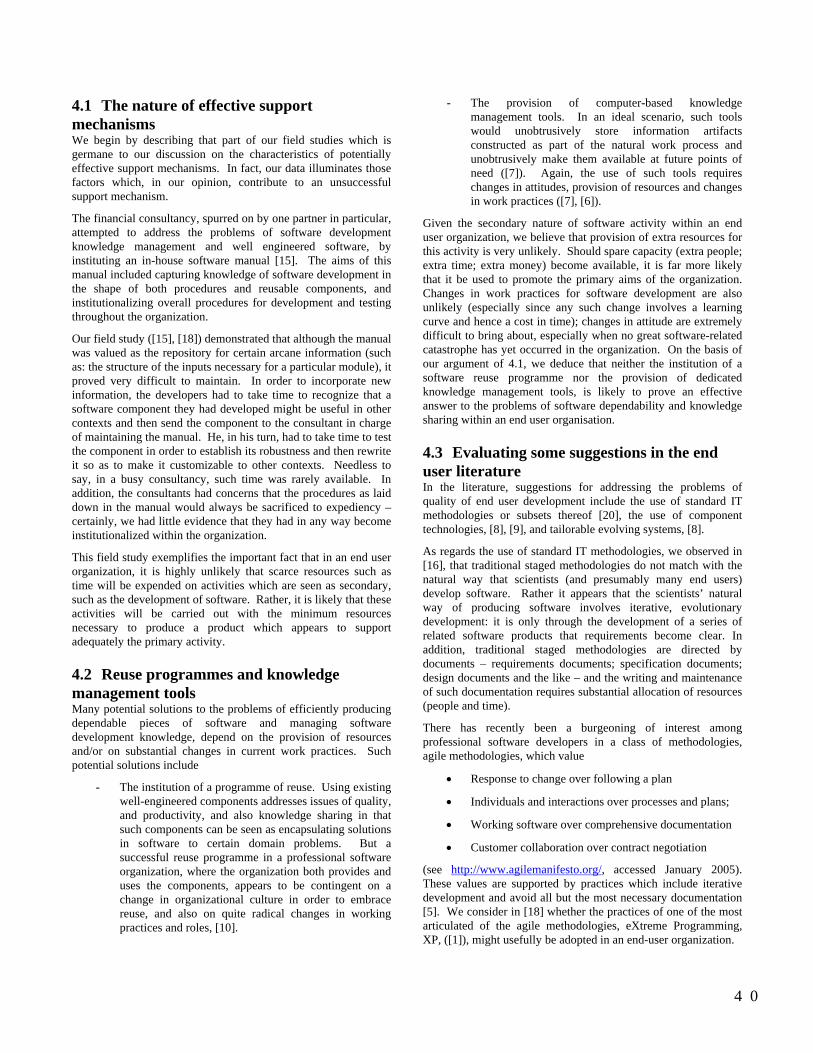
4.1 The nature of effective support mechanisms We begin by describing that part of our field studies which is germane to our discussion on the characteristics of potentially effective support mechanisms. In fact, our data illuminates those factors which, in our opinion, contribute to an unsuccessful support mechanism.
The financial consultancy, spurred on by one partner in particular, attempted to address the problems of software development knowledge management and well engineered software, by instituting an in-house software manual [15]. The aims of this manual included capturing knowledge of software development in the shape of both procedures and reusable components, and institutionalizing overall procedures for development and testing throughout the organization.
Our field study ([15], [18]) demonstrated that although the manual was valued as the repository for certain arcane information (such as: the structure of the inputs necessary for a particular module), it proved very difficult to maintain. In order to incorporate new information, the developers had to take time to recognize that a software component they had developed might be useful in other contexts and then send the component to the consultant in charge of maintaining the manual. He, in his turn, had to take time to test the component in order to establish its robustness and then rewrite it so as to make it customizable to other contexts. Needless to say, in a busy consultancy, such time was rarely available. In addition, the consultants had concerns that the procedures as laid down in the manual would always be sacrificed to expediency – certainly, we had little evidence that they had in any way become institutionalized within the organization.
This field study exemplifies the important fact that in an end user organization, it is highly unlikely that scarce resources such as time will be expended on activities which are seen as secondary, such as the development of software. Rather, it is likely that these activities will be carried out with the minimum resources necessary to produce a product which appears to support adequately the primary activity.
4.2 Reuse programmes and knowledge management tools Many potential solutions to the problems of efficiently producing dependable pieces of software and managing software development knowledge, depend on the provision of resources and/or on substantial changes in current work practices. Such potential solutions include
- The institution of a programme of reuse. Using existing well-engineered components addresses issues of quality, and productivity, and also knowledge sharing in that such components can be seen as encapsulating solutions in software to certain domain problems. But a successful reuse programme in a professional software organization, where the organization both provides and uses the components, appears to be contingent on a change in organizational culture in order to embrace reuse, and also on quite radical changes in working practices and roles, [10].
- The provision of computer-based knowledge management tools. In an ideal scenario, such tools would unobtrusively store information artifacts constructed as part of the natural work process and unobtrusively make them available at future points of need ([7]). Again, the use of such tools requires changes in attitudes, provision of resources and changes in work practices ([7], [6]).
Given the secondary nature of software activity within an end user organization, we believe that provision of extra resources for this activity is very unlikely. Should spare capacity (extra people; extra time; extra money) become available, it is far more likely that it be used to promote the primary aims of the organization. Changes in work practices for software development are also unlikely (especially since any such change involves a learning curve and hence a cost in time); changes in attitude are extremely difficult to bring about, especially when no great software-related catastrophe has yet occurred in the organization. On the basis of our argument of 4.1, we deduce that neither the institution of a software reuse programme nor the provision of dedicated knowledge management tools, is likely to prove an effective answer to the problems of software dependability and knowledge sharing within an end user organisation.
4.3 Evaluating some suggestions in the end user literature In the literature, suggestions for addressing the problems of quality of end user development include the use of standard IT methodologies or subsets thereof [20], the use of component technologies, [8], [9], and tailorable evolving systems, [8].
As regards the use of standard IT methodologies, we observed in [16], that traditional staged methodologies do not match with the natural way that scientists (and presumably many end users) develop software. Rather it appears that the scientists’ natural way of producing software involves iterative, evolutionary development: it is only through the development of a series of related software products that requirements become clear. In addition, traditional staged methodologies are directed by documents – requirements documents; specification documents; design documents and the like – and the writing and maintenance of such documentation requires substantial allocation of resources (people and time).
There has recently been a burgeoning of interest among professional software developers in a class of methodologies, agile methodologies, which value
• Response to change over following a plan
• Individuals and interactions over processes and plans;
• Working software over comprehensive documentation
• Customer collaboration over contract negotiation
(see http://www.agilemanifesto.org/, accessed January 2005). These values are supported by practices which include iterative development and avoid all but the most necessary documentation [5]. We consider in [18] whether the practices of one of the most articulated of the agile methodologies, eXtreme Programming, XP, ([1]), might usefully be adopted in an end-user organization.
4 0
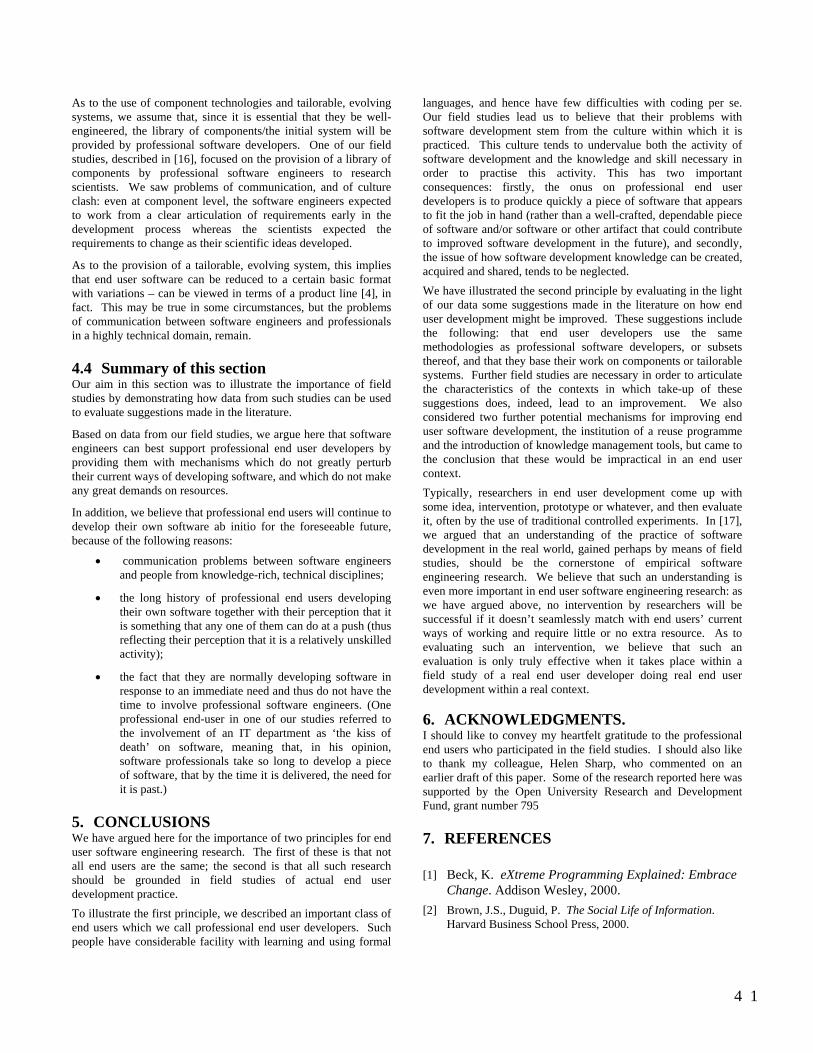
As to the use of component technologies and tailorable, evolving systems, we assume that, since it is essential that they be well-engineered, the library of components/the initial system will be provided by professional software developers. One of our field studies, described in [16], focused on the provision of a library of components by professional software engineers to research scientists. We saw problems of communication, and of culture clash: even at component level, the software engineers expected to work from a clear articulation of requirements early in the development process whereas the scientists expected the requirements to change as their scientific ideas developed.
As to the provision of a tailorable, evolving system, this implies that end user software can be reduced to a certain basic format with variations – can be viewed in terms of a product line [4], in fact. This may be true in some circumstances, but the problems of communication between software engineers and professionals in a highly technical domain, remain.
4.4 Summary of this section Our aim in this section was to illustrate the importance of field studies by demonstrating how data from such studies can be used to evaluate suggestions made in the literature.
Based on data from our field studies, we argue here that software engineers can best support professional end user developers by providing them with mechanisms which do not greatly perturb their current ways of developing software, and which do not make any great demands on resources.
In addition, we believe that professional end users will continue to develop their own software ab initio for the foreseeable future, because of the following reasons:
• communication problems between software engineers and people from knowledge-rich, technical disciplines;
• the long history of professional end users developing their own software together with their perception that it is something that any one of them can do at a push (thus reflecting their perception that it is a relatively unskilled activity);
• the fact that they are normally developing software in response to an immediate need and thus do not have the time to involve professional software engineers. (One professional end-user in one of our studies referred to the involvement of an IT department as ‘the kiss of death’ on software, meaning that, in his opinion, software professionals take so long to develop a piece of software, that by the time it is delivered, the need for it is past.)
5. CONCLUSIONS We have argued here for the importance of two principles for end user software engineering research. The first of these is that not all end users are the same; the second is that all such research should be grounded in field studies of actual end user development practice. To illustrate the first principle, we described an important class of end users which we call professional end user developers. Such people have considerable facility with learning and using formal
languages, and hence have few difficulties with coding per se. Our field studies lead us to believe that their problems with software development stem from the culture within which it is practiced. This culture tends to undervalue both the activity of software development and the knowledge and skill necessary in order to practise this activity. This has two important consequences: firstly, the onus on professional end user developers is to produce quickly a piece of software that appears to fit the job in hand (rather than a well-crafted, dependable piece of software and/or software or other artifact that could contribute to improved software development in the future), and secondly, the issue of how software development knowledge can be created, acquired and shared, tends to be neglected. We have illustrated the second principle by evaluating in the light of our data some suggestions made in the literature on how end user development might be improved. These suggestions include the following: that end user developers use the same methodologies as professional software developers, or subsets thereof, and that they base their work on components or tailorable systems. Further field studies are necessary in order to articulate the characteristics of the contexts in which take-up of these suggestions does, indeed, lead to an improvement. We also considered two further potential mechanisms for improving end user software development, the institution of a reuse programme and the introduction of knowledge management tools, but came to the conclusion that these would be impractical in an end user context. Typically, researchers in end user development come up with some idea, intervention, prototype or whatever, and then evaluate it, often by the use of traditional controlled experiments. In [17], we argued that an understanding of the practice of software development in the real world, gained perhaps by means of field studies, should be the cornerstone of empirical software engineering research. We believe that such an understanding is even more important in end user software engineering research: as we have argued above, no intervention by researchers will be successful if it doesn’t seamlessly match with end users’ current ways of working and require little or no extra resource. As to evaluating such an intervention, we believe that such an evaluation is only truly effective when it takes place within a field study of a real end user developer doing real end user development within a real context.
6. ACKNOWLEDGMENTS. I should like to convey my heartfelt gratitude to the professional end users who participated in the field studies. I should also like to thank my colleague, Helen Sharp, who commented on an earlier draft of this paper. Some of the research reported here was supported by the Open University Research and Development Fund, grant number 795
7. REFERENCES
[1] Beck, K. eXtreme Programming Explained: Embrace Change. Addison Wesley, 2000.
[2] Brown, J.S., Duguid, P. The Social Life of Information. Harvard Business School Press, 2000.
4 1
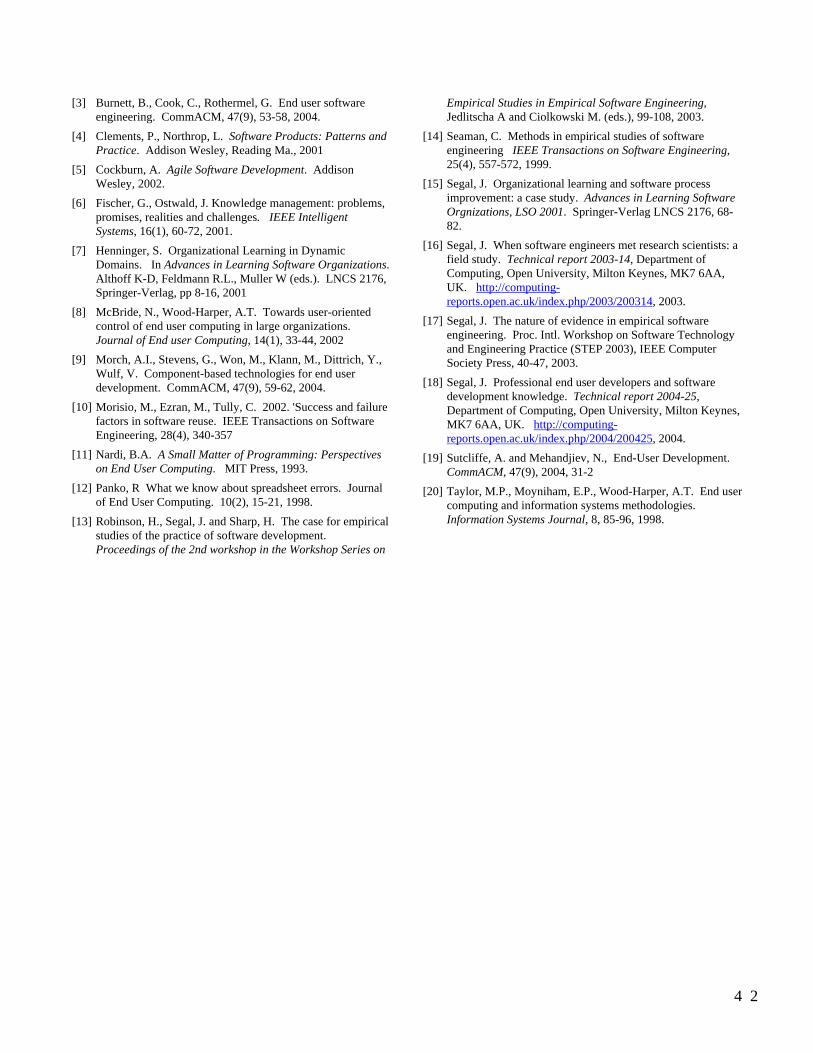
[3] Burnett, B., Cook, C., Rothermel, G. End user software engineering. CommACM, 47(9), 53-58, 2004.
[4] Clements, P., Northrop, L. Software Products: Patterns and Practice. Addison Wesley, Reading Ma., 2001
[5] Cockburn, A. Agile Software Development. Addison Wesley, 2002.
[6] Fischer, G., Ostwald, J. Knowledge management: problems, promises, realities and challenges. IEEE Intelligent Systems, 16(1), 60-72, 2001.
[7] Henninger, S. Organizational Learning in Dynamic Domains. In Advances in Learning Software Organizations. Althoff K-D, Feldmann R.L., Muller W (eds.). LNCS 2176, Springer-Verlag, pp 8-16, 2001
[8] McBride, N., Wood-Harper, A.T. Towards user-oriented control of end user computing in large organizations. Journal of End user Computing, 14(1), 33-44, 2002
[9] Morch, A.I., Stevens, G., Won, M., Klann, M., Dittrich, Y., Wulf, V. Component-based technologies for end user development. CommACM, 47(9), 59-62, 2004.
[10] Morisio, M., Ezran, M., Tully, C. 2002. 'Success and failure factors in software reuse. IEEE Transactions on Software Engineering, 28(4), 340-357
[11] Nardi, B.A. A Small Matter of Programming: Perspectives on End User Computing. MIT Press, 1993.
[12] Panko, R What we know about spreadsheet errors. Journal of End User Computing. 10(2), 15-21, 1998.
[13] Robinson, H., Segal, J. and Sharp, H. The case for empirical studies of the practice of software development. Proceedings of the 2nd workshop in the Workshop Series on
Empirical Studies in Empirical Software Engineering, Jedlitscha A and Ciolkowski M. (eds.), 99-108, 2003.
[14] Seaman, C. Methods in empirical studies of software engineering IEEE Transactions on Software Engineering, 25(4), 557-572, 1999.
[15] Segal, J. Organizational learning and software process improvement: a case study. Advances in Learning Software Orgnizations, LSO 2001. Springer-Verlag LNCS 2176, 68-82.
[16] Segal, J. When software engineers met research scientists: a field study. Technical report 2003-14, Department of Computing, Open University, Milton Keynes, MK7 6AA, UK. http://computing-reports.open.ac.uk/index.php/2003/200314, 2003.
[17] Segal, J. The nature of evidence in empirical software engineering. Proc. Intl. Workshop on Software Technology and Engineering Practice (STEP 2003), IEEE Computer Society Press, 40-47, 2003.
[18] Segal, J. Professional end user developers and software development knowledge. Technical report 2004-25, Department of Computing, Open University, Milton Keynes, MK7 6AA, UK. http://computing-reports.open.ac.uk/index.php/2004/200425, 2004.
[19] Sutcliffe, A. and Mehandjiev, N., End-User Development. CommACM, 47(9), 2004, 31-2
[20] Taylor, M.P., Moyniham, E.P., Wood-Harper, A.T. End user computing and information systems methodologies. Information Systems Journal, 8, 85-96, 1998.
4 2
Evaluating the Costs and Benefits of End-User Development
Alistair Sutcliffe
Centre for HCI Design School of Informatics
University of Manchester, PO Box 88, Manchester M60 1QD, UK
ABSTRACT This paper describes a cost benefit modelling approach to introducing EUD technology. Costs are incurred in configuring and learning the technology then in developing and debugging applications. These are set against the perceived and actual benefits of producing better applications that fit end user requirements. The approach is illustrated with a case study of a web Content Management System. Categories and Subject Descriptors D2.1 Requirements and Specifications, Methodologies General Terms Design, Theory Keywords End user development, cost benefit analysis
1. INTRODUCTION In spite of some advances in end-user development (EUD) since the concept was launched in the early 1980s [3], EUD products are not commonplace. In our previous work we proposed a framework for classifying EUD tools and approaches [4], [7] and assessing the probable success of introducing EUD technology into a particular user/organisation context. This paper describes development of that framework with a cost-benefit analysis and its application to a case study of the introduction of a web content management system in the University of Manchester. The following section outlines the cost-benefit analysis technique while section 3 briefly describes the case study.
2. COST-BENEFIT MODELLING EUD EUD essentially out-sources development effort to the end user. Hence one element of the cost is the additional design time expended. Another cost is learning. This is a critical cost in EUD because end users are busy people for whom programming is not their primary task. They only tolerate development activity as a means towards the end that they wish to achieve; for instance, creating a simulation, experimenting with a design, building a prototype. Learning to use an EUD environment is an up-front cost that has to be motivated with a perceived reward in improved efficiency or empowered work practice. Cost of errors is a significant penalty for EUD users both in operation and learning. Cost of EUD to the user can be assessed in terms of the time taken to learn to use the EUD product and possibly its language, the requirements or specification effort entailed in refining general ideas into specific instructions, the programming effort, followed by time for testing and correcting from errors. The trade-offs between effort and reward can be summarised as a set of motivating principles for EUD: The aim for all design is to achieve an optimal fit between the product and the requirements of the customer population, with minimal cost. Generally, the better the fit between users’ needs and application functionality, the greater the users’ satisfaction; however, product fit will be a function of the generality/specialisation dimension of an application. This can be summarised in the principle of user motivation:
• The user motivation to accept an EUD technology will be inversely proportional to product complexity and variability in the user population.
The consequences of this law are that EUD will consume more effort with a heterogeneous user population, because getting the right fit for each sub-group of individuals becomes progressively more challenging and expensive. The second consequence is that larger scale and more complex applications will be more difficult to develop; people have a larger learning burden with complex products. The second follows on from the first principle, in that general technologies may not motivate us to expend development effort because the utility they deliver is less than a perceived reward from satisfying our specific requirements:
• User motivation to customise and learn EUD software will be proportional to the perceived utility of the software delivering usable and useful applications.
Permission to make digital or hard copies of all or part of this work forpersonal or classroom use is granted without fee provided that copies arenot made or distributed for profit or commercial advantage, and that copiesbear this notice and the full citation on the first page. To copy otherwise, torepublish, to post on servers or to redistribute to lists, requires prior specificpermission and/or a fee.First Workshop on End-User Software Engineering (WEUSE I).May 212005, Saint Louis, Missouri, USA.Copyright ACM 1-59593-131-7/05/0005$5.00.
4 3
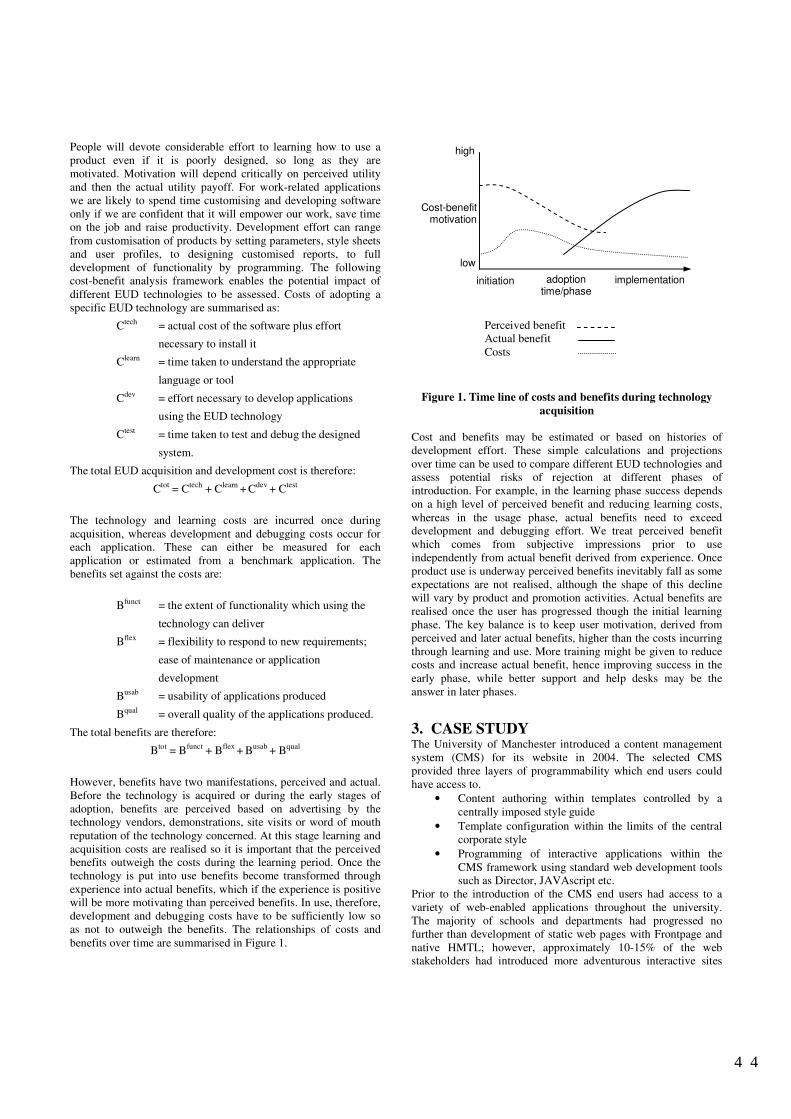
People will devote considerable effort to learning how to use a product even if it is poorly designed, so long as they are motivated. Motivation will depend critically on perceived utility and then the actual utility payoff. For work-related applications we are likely to spend time customising and developing software only if we are confident that it will empower our work, save time on the job and raise productivity. Development effort can range from customisation of products by setting parameters, style sheets and user profiles, to designing customised reports, to full development of functionality by programming. The following cost-benefit analysis framework enables the potential impact of different EUD technologies to be assessed. Costs of adopting a specific EUD technology are summarised as:
Ctech = actual cost of the software plus effort
necessary to install it
Clearn = time taken to understand the appropriate
language or tool
Cdev = effort necessary to develop applications
using the EUD technology
Ctest = time taken to test and debug the designed
system.
The total EUD acquisition and development cost is therefore:
Ctot = Ctech + Clearn + Cdev + Ctest
The technology and learning costs are incurred once during acquisition, whereas development and debugging costs occur for each application. These can either be measured for each application or estimated from a benchmark application. The benefits set against the costs are:
Bfunct = the extent of functionality which using the
technology can deliver
Bflex = flexibility to respond to new requirements;
ease of maintenance or application
development
Busab = usability of applications produced
Bqual = overall quality of the applications produced.
The total benefits are therefore:
Btot = Bfunct + Bflex + Busab + Bqual
However, benefits have two manifestations, perceived and actual. Before the technology is acquired or during the early stages of adoption, benefits are perceived based on advertising by the technology vendors, demonstrations, site visits or word of mouth reputation of the technology concerned. At this stage learning and acquisition costs are realised so it is important that the perceived benefits outweigh the costs during the learning period. Once the technology is put into use benefits become transformed through experience into actual benefits, which if the experience is positive will be more motivating than perceived benefits. In use, therefore, development and debugging costs have to be sufficiently low so as not to outweigh the benefits. The relationships of costs and benefits over time are summarised in Figure 1.
Figure 1. Time line of costs and benefits during technology acquisition
Cost and benefits may be estimated or based on histories of development effort. These simple calculations and projections over time can be used to compare different EUD technologies and assess potential risks of rejection at different phases of introduction. For example, in the learning phase success depends on a high level of perceived benefit and reducing learning costs, whereas in the usage phase, actual benefits need to exceed development and debugging effort. We treat perceived benefit which comes from subjective impressions prior to use independently from actual benefit derived from experience. Once product use is underway perceived benefits inevitably fall as some expectations are not realised, although the shape of this decline will vary by product and promotion activities. Actual benefits are realised once the user has progressed though the initial learning phase. The key balance is to keep user motivation, derived from perceived and later actual benefits, higher than the costs incurring through learning and use. More training might be given to reduce costs and increase actual benefit, hence improving success in the early phase, while better support and help desks may be the answer in later phases.
3. CASE STUDY The University of Manchester introduced a content management system (CMS) for its website in 2004. The selected CMS provided three layers of programmability which end users could have access to.
• Content authoring within templates controlled by a centrally imposed style guide
• Template configuration within the limits of the central corporate style
• Programming of interactive applications within the CMS framework using standard web development tools such as Director, JAVAscript etc.
Prior to the introduction of the CMS end users had access to a variety of web-enabled applications throughout the university. The majority of schools and departments had progressed no further than development of static web pages with Frontpage and native HMTL; however, approximately 10-15% of the web stakeholders had introduced more adventurous interactive sites
high
low
Cost-benefit motivation
initiation adoption time/phase
implementation
Perceived benefit Actual benefit Costs
4 4
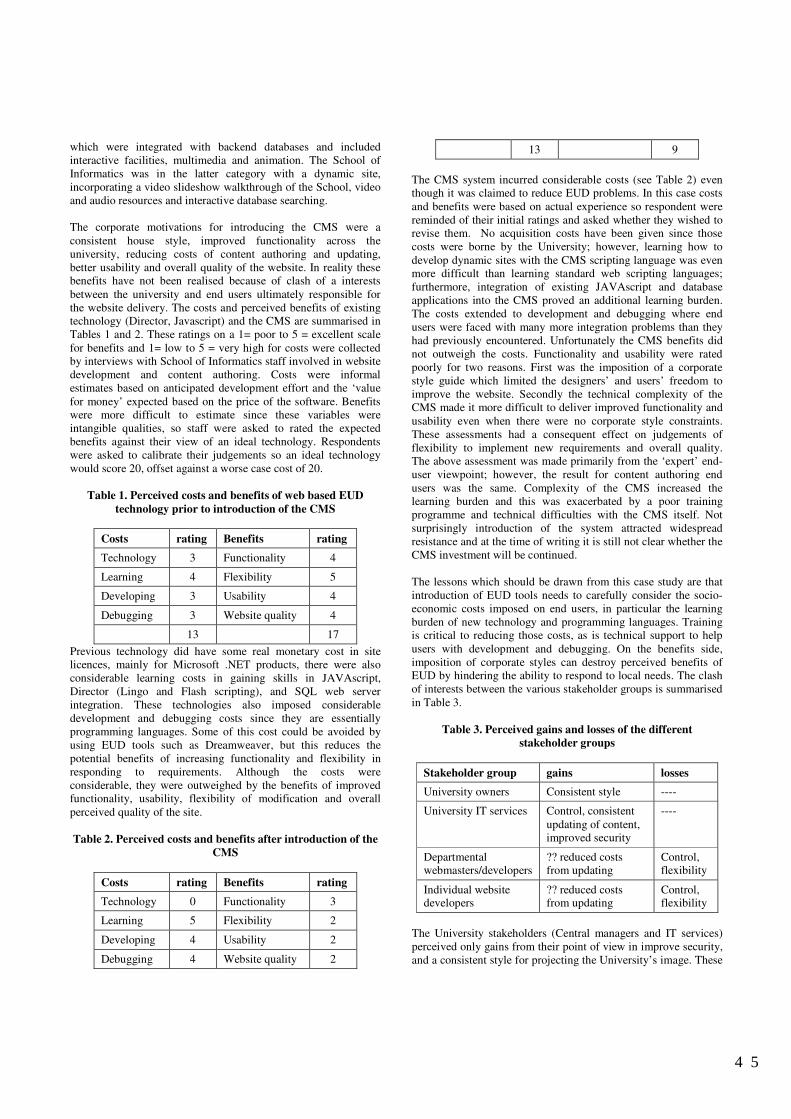
which were integrated with backend databases and included interactive facilities, multimedia and animation. The School of Informatics was in the latter category with a dynamic site, incorporating a video slideshow walkthrough of the School, video and audio resources and interactive database searching. The corporate motivations for introducing the CMS were a consistent house style, improved functionality across the university, reducing costs of content authoring and updating, better usability and overall quality of the website. In reality these benefits have not been realised because of clash of a interests between the university and end users ultimately responsible for the website delivery. The costs and perceived benefits of existing technology (Director, Javascript) and the CMS are summarised in Tables 1 and 2. These ratings on a 1= poor to 5 = excellent scale for benefits and 1= low to 5 = very high for costs were collected by interviews with School of Informatics staff involved in website development and content authoring. Costs were informal estimates based on anticipated development effort and the ‘value for money’ expected based on the price of the software. Benefits were more difficult to estimate since these variables were intangible qualities, so staff were asked to rated the expected benefits against their view of an ideal technology. Respondents were asked to calibrate their judgements so an ideal technology would score 20, offset against a worse case cost of 20.
Table 1. Perceived costs and benefits of web based EUD technology prior to introduction of the CMS
Costs rating Benefits rating
Technology 3 Functionality 4
Learning 4 Flexibility 5
Developing 3 Usability 4
Debugging 3 Website quality 4
13 17 Previous technology did have some real monetary cost in site licences, mainly for Microsoft .NET products, there were also considerable learning costs in gaining skills in JAVAscript, Director (Lingo and Flash scripting), and SQL web server integration. These technologies also imposed considerable development and debugging costs since they are essentially programming languages. Some of this cost could be avoided by using EUD tools such as Dreamweaver, but this reduces the potential benefits of increasing functionality and flexibility in responding to requirements. Although the costs were considerable, they were outweighed by the benefits of improved functionality, usability, flexibility of modification and overall perceived quality of the site. Table 2. Perceived costs and benefits after introduction of the
CMS
Costs rating Benefits rating
Technology 0 Functionality 3
Learning 5 Flexibility 2
Developing 4 Usability 2
Debugging 4 Website quality 2
13 9 The CMS system incurred considerable costs (see Table 2) even though it was claimed to reduce EUD problems. In this case costs and benefits were based on actual experience so respondent were reminded of their initial ratings and asked whether they wished to revise them. No acquisition costs have been given since those costs were borne by the University; however, learning how to develop dynamic sites with the CMS scripting language was even more difficult than learning standard web scripting languages; furthermore, integration of existing JAVAscript and database applications into the CMS proved an additional learning burden. The costs extended to development and debugging where end users were faced with many more integration problems than they had previously encountered. Unfortunately the CMS benefits did not outweigh the costs. Functionality and usability were rated poorly for two reasons. First was the imposition of a corporate style guide which limited the designers’ and users’ freedom to improve the website. Secondly the technical complexity of the CMS made it more difficult to deliver improved functionality and usability even when there were no corporate style constraints. These assessments had a consequent effect on judgements of flexibility to implement new requirements and overall quality. The above assessment was made primarily from the ‘expert’ end-user viewpoint; however, the result for content authoring end users was the same. Complexity of the CMS increased the learning burden and this was exacerbated by a poor training programme and technical difficulties with the CMS itself. Not surprisingly introduction of the system attracted widespread resistance and at the time of writing it is still not clear whether the CMS investment will be continued. The lessons which should be drawn from this case study are that introduction of EUD tools needs to carefully consider the socio-economic costs imposed on end users, in particular the learning burden of new technology and programming languages. Training is critical to reducing those costs, as is technical support to help users with development and debugging. On the benefits side, imposition of corporate styles can destroy perceived benefits of EUD by hindering the ability to respond to local needs. The clash of interests between the various stakeholder groups is summarised in Table 3.
Table 3. Perceived gains and losses of the different stakeholder groups
Stakeholder group gains losses University owners Consistent style ----
University IT services Control, consistent updating of content, improved security
----
Departmental webmasters/developers
?? reduced costs from updating
Control, flexibility
Individual website developers
?? reduced costs from updating
Control, flexibility
The University stakeholders (Central managers and IT services) perceived only gains from their point of view in improve security, and a consistent style for projecting the University’s image. These
4 5
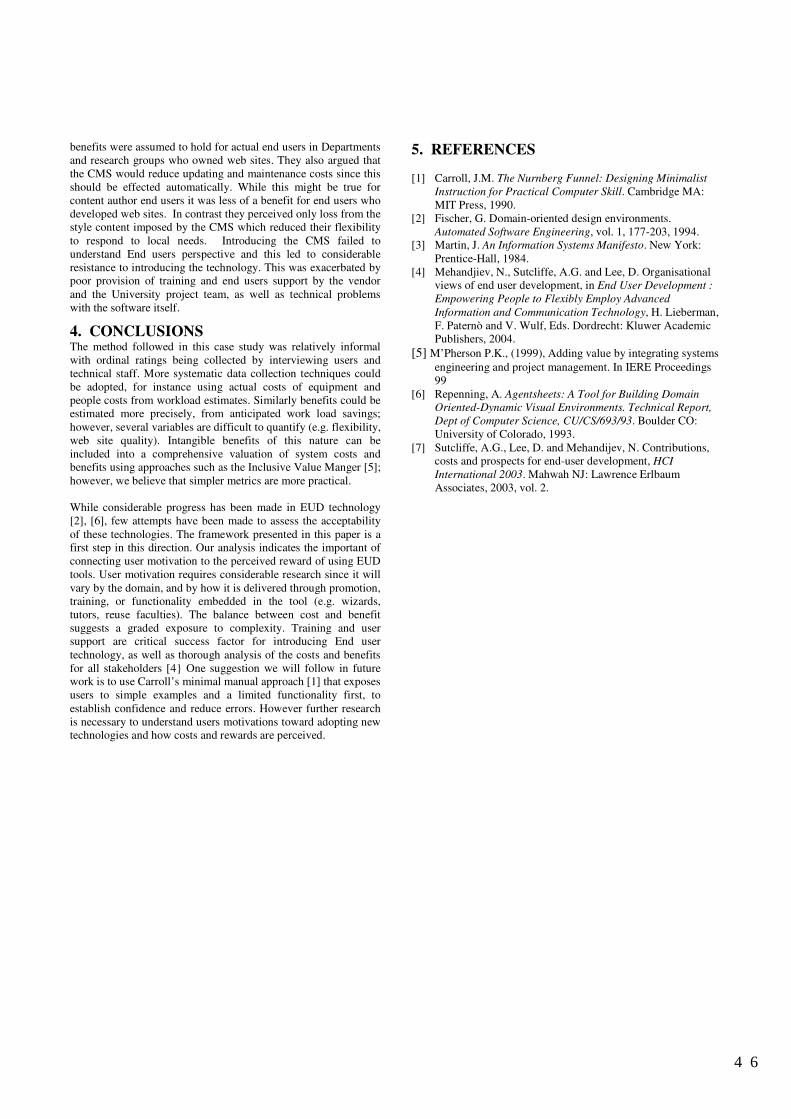
benefits were assumed to hold for actual end users in Departments and research groups who owned web sites. They also argued that the CMS would reduce updating and maintenance costs since this should be effected automatically. While this might be true for content author end users it was less of a benefit for end users who developed web sites. In contrast they perceived only loss from the style content imposed by the CMS which reduced their flexibility to respond to local needs. Introducing the CMS failed to understand End users perspective and this led to considerable resistance to introducing the technology. This was exacerbated by poor provision of training and end users support by the vendor and the University project team, as well as technical problems with the software itself.
4. CONCLUSIONS The method followed in this case study was relatively informal with ordinal ratings being collected by interviewing users and technical staff. More systematic data collection techniques could be adopted, for instance using actual costs of equipment and people costs from workload estimates. Similarly benefits could be estimated more precisely, from anticipated work load savings; however, several variables are difficult to quantify (e.g. flexibility, web site quality). Intangible benefits of this nature can be included into a comprehensive valuation of system costs and benefits using approaches such as the Inclusive Value Manger [5]; however, we believe that simpler metrics are more practical. While considerable progress has been made in EUD technology [2], [6], few attempts have been made to assess the acceptability of these technologies. The framework presented in this paper is a first step in this direction. Our analysis indicates the important of connecting user motivation to the perceived reward of using EUD tools. User motivation requires considerable research since it will vary by the domain, and by how it is delivered through promotion, training, or functionality embedded in the tool (e.g. wizards, tutors, reuse faculties). The balance between cost and benefit suggests a graded exposure to complexity. Training and user support are critical success factor for introducing End user technology, as well as thorough analysis of the costs and benefits for all stakeholders [4} One suggestion we will follow in future work is to use Carroll’s minimal manual approach [1] that exposes users to simple examples and a limited functionality first, to establish confidence and reduce errors. However further research is necessary to understand users motivations toward adopting new technologies and how costs and rewards are perceived.
5. REFERENCES [1] Carroll, J.M. The Nurnberg Funnel: Designing Minimalist
Instruction for Practical Computer Skill. Cambridge MA: MIT Press, 1990.
[2] Fischer, G. Domain-oriented design environments. Automated Software Engineering, vol. 1, 177-203, 1994.
[3] Martin, J. An Information Systems Manifesto. New York: Prentice-Hall, 1984.
[4] Mehandjiev, N., Sutcliffe, A.G. and Lee, D. Organisational views of end user development, in End User Development : Empowering People to Flexibly Employ Advanced Information and Communication Technology, H. Lieberman, F. Paternò and V. Wulf, Eds. Dordrecht: Kluwer Academic Publishers, 2004.
[5] M’Pherson P.K., (1999), Adding value by integrating systems engineering and project management. In IERE Proceedings 99
[6] Repenning, A. Agentsheets: A Tool for Building Domain Oriented-Dynamic Visual Environments. Technical Report, Dept of Computer Science, CU/CS/693/93. Boulder CO: University of Colorado, 1993.
[7] Sutcliffe, A.G., Lee, D. and Mehandijev, N. Contributions, costs and prospects for end-user development, HCI International 2003. Mahwah NJ: Lawrence Erlbaum Associates, 2003, vol. 2.
4 6
The EUSES Spreadsheet Corpus:A Shared Resource for Supporting Experimentation
with Spreadsheet Dependability Mechanisms
Marc Fisher II and Gregg RothermelDepartment of Computer Science and Engineering
University of Nebraska-Lincoln{mfisher,grother}@cse.unl.edu
ABSTRACTIn recent years several tools and methodologies have beendeveloped to improve the dependability of spreadsheets. How-ever, there has been little evaluation of these dependabilitydevices on spreadsheets in actual use by end users. To as-sist in the process of evaluating these methodologies, wehave assembled a corpus of spreadsheets from a variety ofsources. We have ensured that these spreadsheets are suit-able for evaluating dependability devices in Microsoft Ex-cel (the most commonly used commercial spreadsheet envi-ronment) and have measured a variety of feature of thesespreadsheets to aid researchers in selecting subsets of thecorpus appropriate to their needs.
Categories and Subject DescriptorsD.2.8 [Software Engineering]: Metrics—Complexity Mea-sures; H.4.1 [Information Systems]: Information SystemsApplications—Spreadsheets
General Termsexperimentation, measurement
Keywordsend-user software engineering, end-user programming
1. INTRODUCTIONRecently there has been a great deal of interest in the
domain of spreadsheet programming, with many ongoingprojects attempting to provide tools and methodologies tohelp users create more dependable spreadsheets. These pro-jects have used various methods for evaluating their effec-tiveness. Rothermel, et al. have developed the WYSIWYT(What You See Is What You Test) family of methodologiesthat provide immediate incremental feedback to assist users
with testing and debugging spreadsheets [6, 7, 9, 10, 12,13, 14, 15], and have evaluated these methodologies withinthe context of Forms/3 with a variety of spreadsheets theyhave created, some based on spreadsheets created by Excelusers. Ayalew, et al. have developed testing and debug-ging methodologies in Excel [4, 5], but have not publishedresults evaluating their methodologies’ effectiveness. Sev-eral researchers have developed unit inference mechanismsfor Excel [1, 2, 3]. These techniques have been validatedagainst a small collection of spreadsheets from a book onusing spreadsheets in science and engineering [8], and, inone case, against a small number of spreadsheets created bystudents in an introductory computer science course.
The studies just described have yielded some understand-ing of the methodologies studied; however, none of thesestudies has performed validation against a wide range ofspreadsheets in use by real users. There are many possi-ble reasons why such validation has not occurred, but onelikely reason is that assembling a large collection of “real-world” spreadsheets is an expensive task. Therefore, wehave undertaken the task of assembling and maintaining acorpus of spreadsheets suitable for evaluating these wide-ranging methodologies for helping end users develop depend-able spreadsheets.
2. SPREADSHEETSTo obtain a large sample of spreadsheets created by a
wide variety of users, we used a Java-based interface to theGoogle search engine. This interface lets users specify searchphrases and filetypes, along with a number of desired results.The engine then retrieves results, attempting to filter outduplicates, as a series of urls appropriate for use by an appli-cation such as wget. We performed six Google searches onsimple single keywords (“database”, “financial”, “grades”,“homework”, “inventory”, and “modeling”) that are com-monly associated with spreadsheets, and requested 1000 re-sults for each of these keywords. To these results we alsoadded 26 spreadsheets previously collected by the Forms/3group of researchers at Oregon State University, 45 spread-sheets presented in [8] and used to validate methodologiesin [1, 2, 3], 13 spreadsheets presented in [11], 9 spreadsheetscreated by students in a computer literacy course at Ore-gon State University and used to validate methodologies in[1], and 5 spreadsheets created and used by the first author.Table 1 (column 2) indicates how many spreadsheets wereinitially found for each of the sources.
Permission to make digital or hard copies of all or part of this work forpersonal or classroom use is granted without fee provided that copies arenot made or distributed for profit or commercial advantage, and that copiesbear this notice and the full citation on the first page. To copy otherwise, torepublish, to post on servers or to redistribute to lists, requires prior specificpermission and/or a fee.First Workshop on End-User Software Engineering (WEUSE I).May 212005, Saint Louis, Missouri, USA.Copyright ACM 1-59593-131-7/05/0005$5.00.
4 7
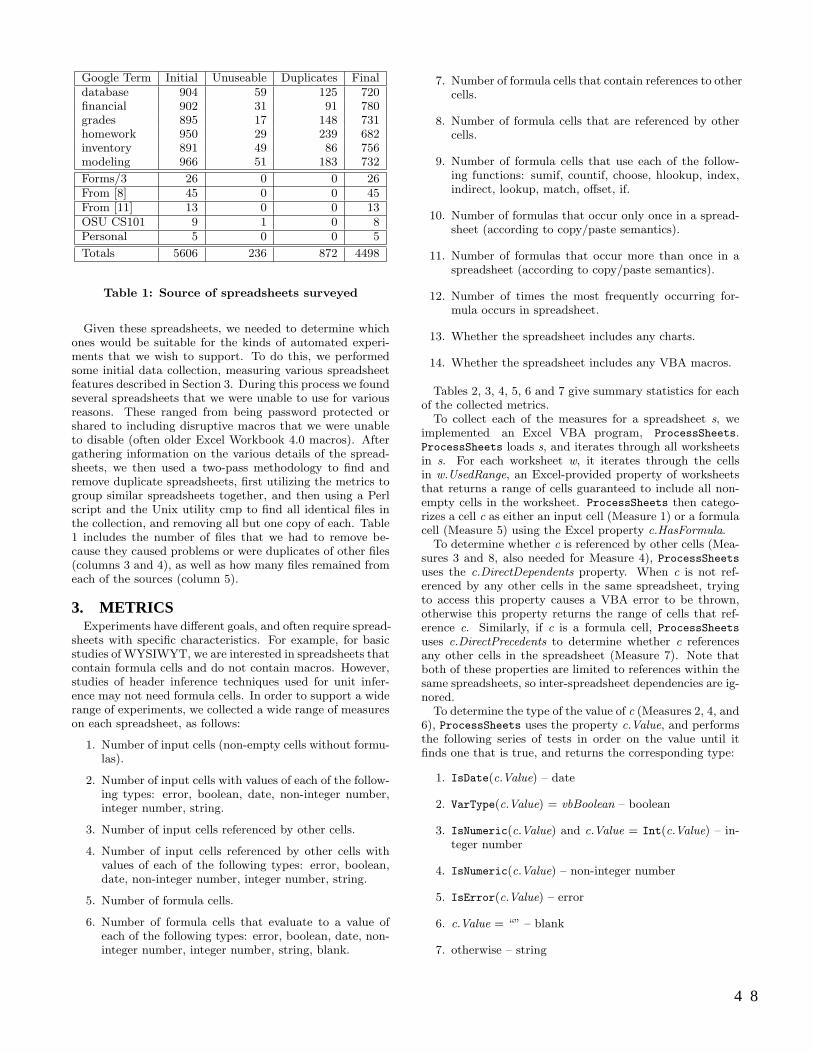
Google Term Initial Unuseable Duplicates Finaldatabase 904 59 125 720financial 902 31 91 780grades 895 17 148 731homework 950 29 239 682inventory 891 49 86 756modeling 966 51 183 732
Forms/3 26 0 0 26From [8] 45 0 0 45From [11] 13 0 0 13OSU CS101 9 1 0 8Personal 5 0 0 5
Totals 5606 236 872 4498
Table 1: Source of spreadsheets surveyed
Given these spreadsheets, we needed to determine whichones would be suitable for the kinds of automated experi-ments that we wish to support. To do this, we performedsome initial data collection, measuring various spreadsheetfeatures described in Section 3. During this process we foundseveral spreadsheets that we were unable to use for variousreasons. These ranged from being password protected orshared to including disruptive macros that we were unableto disable (often older Excel Workbook 4.0 macros). Aftergathering information on the various details of the spread-sheets, we then used a two-pass methodology to find andremove duplicate spreadsheets, first utilizing the metrics togroup similar spreadsheets together, and then using a Perlscript and the Unix utility cmp to find all identical files inthe collection, and removing all but one copy of each. Table1 includes the number of files that we had to remove be-cause they caused problems or were duplicates of other files(columns 3 and 4), as well as how many files remained fromeach of the sources (column 5).
3. METRICSExperiments have different goals, and often require spread-
sheets with specific characteristics. For example, for basicstudies of WYSIWYT, we are interested in spreadsheets thatcontain formula cells and do not contain macros. However,studies of header inference techniques used for unit infer-ence may not need formula cells. In order to support a widerange of experiments, we collected a wide range of measureson each spreadsheet, as follows:
1. Number of input cells (non-empty cells without formu-las).
2. Number of input cells with values of each of the follow-ing types: error, boolean, date, non-integer number,integer number, string.
3. Number of input cells referenced by other cells.
4. Number of input cells referenced by other cells withvalues of each of the following types: error, boolean,date, non-integer number, integer number, string.
5. Number of formula cells.
6. Number of formula cells that evaluate to a value ofeach of the following types: error, boolean, date, non-integer number, integer number, string, blank.
7. Number of formula cells that contain references to othercells.
8. Number of formula cells that are referenced by othercells.
9. Number of formula cells that use each of the follow-ing functions: sumif, countif, choose, hlookup, index,indirect, lookup, match, offset, if.
10. Number of formulas that occur only once in a spread-sheet (according to copy/paste semantics).
11. Number of formulas that occur more than once in aspreadsheet (according to copy/paste semantics).
12. Number of times the most frequently occurring for-mula occurs in spreadsheet.
13. Whether the spreadsheet includes any charts.
14. Whether the spreadsheet includes any VBA macros.
Tables 2, 3, 4, 5, 6 and 7 give summary statistics for eachof the collected metrics.
To collect each of the measures for a spreadsheet s, weimplemented an Excel VBA program, ProcessSheets.ProcessSheets loads s, and iterates through all worksheetsin s. For each worksheet w, it iterates through the cellsin w.UsedRange, an Excel-provided property of worksheetsthat returns a range of cells guaranteed to include all non-empty cells in the worksheet. ProcessSheets then catego-rizes a cell c as either an input cell (Measure 1) or a formulacell (Measure 5) using the Excel property c.HasFormula.
To determine whether c is referenced by other cells (Mea-sures 3 and 8, also needed for Measure 4), ProcessSheetsuses the c.DirectDependents property. When c is not ref-erenced by any other cells in the same spreadsheet, tryingto access this property causes a VBA error to be thrown,otherwise this property returns the range of cells that ref-erence c. Similarly, if c is a formula cell, ProcessSheets
uses c.DirectPrecedents to determine whether c referencesany other cells in the spreadsheet (Measure 7). Note thatboth of these properties are limited to references within thesame spreadsheets, so inter-spreadsheet dependencies are ig-nored.
To determine the type of the value of c (Measures 2, 4, and6), ProcessSheets uses the property c.Value, and performsthe following series of tests in order on the value until itfinds one that is true, and returns the corresponding type:
1. IsDate(c.Value) – date
2. VarType(c.Value) = vbBoolean – boolean
3. IsNumeric(c.Value) and c.Value = Int(c.Value) – in-teger number
4. IsNumeric(c.Value) – non-integer number
5. IsError(c.Value) – error
6. c.Value = “” – blank
7. otherwise – string
4 8
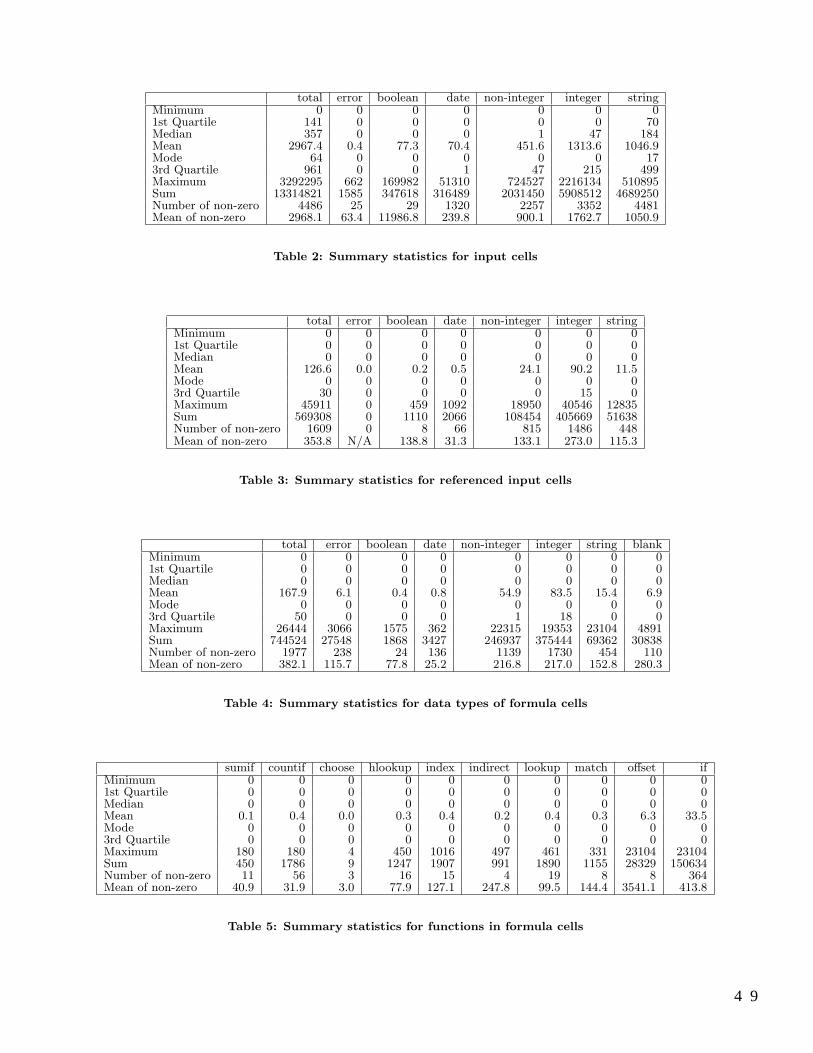
total error boolean date non-integer integer stringMinimum 0 0 0 0 0 0 01st Quartile 141 0 0 0 0 0 70Median 357 0 0 0 1 47 184Mean 2967.4 0.4 77.3 70.4 451.6 1313.6 1046.9Mode 64 0 0 0 0 0 173rd Quartile 961 0 0 1 47 215 499Maximum 3292295 662 169982 51310 724527 2216134 510895Sum 13314821 1585 347618 316489 2031450 5908512 4689250Number of non-zero 4486 25 29 1320 2257 3352 4481Mean of non-zero 2968.1 63.4 11986.8 239.8 900.1 1762.7 1050.9
Table 2: Summary statistics for input cells
total error boolean date non-integer integer stringMinimum 0 0 0 0 0 0 01st Quartile 0 0 0 0 0 0 0Median 0 0 0 0 0 0 0Mean 126.6 0.0 0.2 0.5 24.1 90.2 11.5Mode 0 0 0 0 0 0 03rd Quartile 30 0 0 0 0 15 0Maximum 45911 0 459 1092 18950 40546 12835Sum 569308 0 1110 2066 108454 405669 51638Number of non-zero 1609 0 8 66 815 1486 448Mean of non-zero 353.8 N/A 138.8 31.3 133.1 273.0 115.3
Table 3: Summary statistics for referenced input cells
total error boolean date non-integer integer string blankMinimum 0 0 0 0 0 0 0 01st Quartile 0 0 0 0 0 0 0 0Median 0 0 0 0 0 0 0 0Mean 167.9 6.1 0.4 0.8 54.9 83.5 15.4 6.9Mode 0 0 0 0 0 0 0 03rd Quartile 50 0 0 0 1 18 0 0Maximum 26444 3066 1575 362 22315 19353 23104 4891Sum 744524 27548 1868 3427 246937 375444 69362 30838Number of non-zero 1977 238 24 136 1139 1730 454 110Mean of non-zero 382.1 115.7 77.8 25.2 216.8 217.0 152.8 280.3
Table 4: Summary statistics for data types of formula cells
sumif countif choose hlookup index indirect lookup match offset ifMinimum 0 0 0 0 0 0 0 0 0 01st Quartile 0 0 0 0 0 0 0 0 0 0Median 0 0 0 0 0 0 0 0 0 0Mean 0.1 0.4 0.0 0.3 0.4 0.2 0.4 0.3 6.3 33.5Mode 0 0 0 0 0 0 0 0 0 03rd Quartile 0 0 0 0 0 0 0 0 0 0Maximum 180 180 4 450 1016 497 461 331 23104 23104Sum 450 1786 9 1247 1907 991 1890 1155 28329 150634Number of non-zero 11 56 3 16 15 4 19 8 8 364Mean of non-zero 40.9 31.9 3.0 77.9 127.1 247.8 99.5 144.4 3541.1 413.8
Table 5: Summary statistics for functions in formula cells
4 9
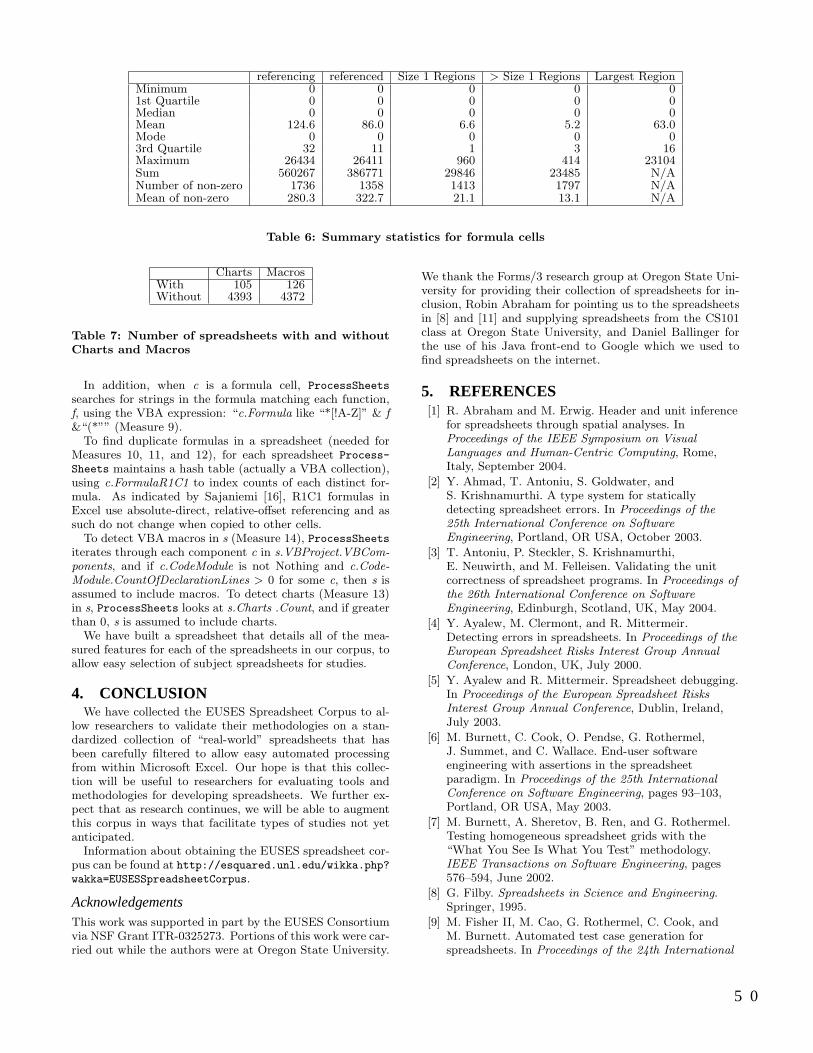
referencing referenced Size 1 Regions > Size 1 Regions Largest RegionMinimum 0 0 0 0 01st Quartile 0 0 0 0 0Median 0 0 0 0 0Mean 124.6 86.0 6.6 5.2 63.0Mode 0 0 0 0 03rd Quartile 32 11 1 3 16Maximum 26434 26411 960 414 23104Sum 560267 386771 29846 23485 N/ANumber of non-zero 1736 1358 1413 1797 N/AMean of non-zero 280.3 322.7 21.1 13.1 N/A
Table 6: Summary statistics for formula cells
Charts MacrosWith 105 126Without 4393 4372
Table 7: Number of spreadsheets with and withoutCharts and Macros
In addition, when c is a formula cell, ProcessSheets
searches for strings in the formula matching each function,f, using the VBA expression: “c.Formula like “*[!A-Z]” & f&“(*”” (Measure 9).
To find duplicate formulas in a spreadsheet (needed forMeasures 10, 11, and 12), for each spreadsheet Process-
Sheets maintains a hash table (actually a VBA collection),using c.FormulaR1C1 to index counts of each distinct for-mula. As indicated by Sajaniemi [16], R1C1 formulas inExcel use absolute-direct, relative-offset referencing and assuch do not change when copied to other cells.
To detect VBA macros in s (Measure 14), ProcessSheetsiterates through each component c in s.VBProject.VBCom-ponents, and if c.CodeModule is not Nothing and c.Code-Module.CountOfDeclarationLines > 0 for some c, then s isassumed to include macros. To detect charts (Measure 13)in s, ProcessSheets looks at s.Charts .Count, and if greaterthan 0, s is assumed to include charts.
We have built a spreadsheet that details all of the mea-sured features for each of the spreadsheets in our corpus, toallow easy selection of subject spreadsheets for studies.
4. CONCLUSIONWe have collected the EUSES Spreadsheet Corpus to al-
low researchers to validate their methodologies on a stan-dardized collection of “real-world” spreadsheets that hasbeen carefully filtered to allow easy automated processingfrom within Microsoft Excel. Our hope is that this collec-tion will be useful to researchers for evaluating tools andmethodologies for developing spreadsheets. We further ex-pect that as research continues, we will be able to augmentthis corpus in ways that facilitate types of studies not yetanticipated.
Information about obtaining the EUSES spreadsheet cor-pus can be found at http://esquared.unl.edu/wikka.php?wakka=EUSESSpreadsheetCorpus.
AcknowledgementsThis work was supported in part by the EUSES Consortiumvia NSF Grant ITR-0325273. Portions of this work were car-ried out while the authors were at Oregon State University.
We thank the Forms/3 research group at Oregon State Uni-versity for providing their collection of spreadsheets for in-clusion, Robin Abraham for pointing us to the spreadsheetsin [8] and [11] and supplying spreadsheets from the CS101class at Oregon State University, and Daniel Ballinger forthe use of his Java front-end to Google which we used tofind spreadsheets on the internet.
5. REFERENCES[1] R. Abraham and M. Erwig. Header and unit inference
for spreadsheets through spatial analyses. InProceedings of the IEEE Symposium on VisualLanguages and Human-Centric Computing, Rome,Italy, September 2004.
[2] Y. Ahmad, T. Antoniu, S. Goldwater, andS. Krishnamurthi. A type system for staticallydetecting spreadsheet errors. In Proceedings of the25th International Conference on SoftwareEngineering, Portland, OR USA, October 2003.
[3] T. Antoniu, P. Steckler, S. Krishnamurthi,E. Neuwirth, and M. Felleisen. Validating the unitcorrectness of spreadsheet programs. In Proceedings ofthe 26th International Conference on SoftwareEngineering, Edinburgh, Scotland, UK, May 2004.
[4] Y. Ayalew, M. Clermont, and R. Mittermeir.Detecting errors in spreadsheets. In Proceedings of theEuropean Spreadsheet Risks Interest Group AnnualConference, London, UK, July 2000.
[5] Y. Ayalew and R. Mittermeir. Spreadsheet debugging.In Proceedings of the European Spreadsheet RisksInterest Group Annual Conference, Dublin, Ireland,July 2003.
[6] M. Burnett, C. Cook, O. Pendse, G. Rothermel,J. Summet, and C. Wallace. End-user softwareengineering with assertions in the spreadsheetparadigm. In Proceedings of the 25th InternationalConference on Software Engineering, pages 93–103,Portland, OR USA, May 2003.
[7] M. Burnett, A. Sheretov, B. Ren, and G. Rothermel.Testing homogeneous spreadsheet grids with the“What You See Is What You Test” methodology.IEEE Transactions on Software Engineering, pages576–594, June 2002.
[8] G. Filby. Spreadsheets in Science and Engineering.Springer, 1995.
[9] M. Fisher II, M. Cao, G. Rothermel, C. Cook, andM. Burnett. Automated test case generation forspreadsheets. In Proceedings of the 24th International
5 0
Conference on Software Engineering, pages 241–251,Orlando, FL USA, May 2002.
[10] M. Fisher II, D. Jin, G. Rothermel, and M. Burnett.Test reuse in the spreadsheet paradigm. In Proceedingsof the International Symposium on SoftwareReliability Engineering, pages 257–268, Annapolis,MD USA, November 2002.
[11] M. Jackson and M. Staunton. Advanced Modeling inFinance Using Excel and VBA. John Wiley & Sons,Ltd., Chichester, West Sussex, UK, 2001.
[12] J. Reichwein, G. Rothermel, and M. Burnett. Slicingspreadsheets: An integrated methodology forspreadsheet testing and debugging. In Proceedings ofthe 2nd Conference on Domain Specific Languages,pages 25–38, Austin, TX USA, October 1999.
[13] G. Rothermel, M. Burnett, L. Li, C. DuPuis, andA. Sheretov. A methodology for testing spreadsheets.
ACM Transaction on Software Engineering andMaintenance, pages 110–147, January 2001.
[14] K. Rothermel, C. Cook, M. Burnett, J. Schonfeld,T. Green, and G. Rothermel. WYSIWYT testing inthe spreadsheet paradigm: An empirical evaluation. InProceedings of the 22nd International Conference onSoftware Engineering, Limerick, Ireland, June 2000.
[15] J. Ruthruff, E. Creswick, M. Burnett, C. Cook,S. Prabhakararao, M. Fisher II, and M. Main.End-user software visualizations for fault localization.In Proceedings of the ACM Symposium on SoftwareVisualization, pages 123–132, San Diego, CA USA,June 2003.
[16] J. Sajaniemi. Modeling spreadsheet audit: A rigorousapproach to automatic visualization. Journal of VisualLanguages and Computing, 11(1):49–82, February2000.
5 1
How to Communicate Unit Error Messages inSpreadsheets ?
Robin Abraham and Martin ErwigSchool of Electrical Engineering and Computer Science
Oregon State University
[abraharo|erwig]@eecs.oregonstate.edu
ABSTRACTIn previous work we have designed and implemented an automaticreasoning system for spreadsheets, called UCheck, that infers unitinformation for cells in a spreadsheet. Based on this unit infor-mation, UCheck can identify cells in the spreadsheet that containerroneous formulas. However, the information about an erroneouscell is reported to the user currently in a rather crude way by simplycoloring the cell, which does not tell anything about the nature oferror and thus offers no help to the user as to how to fix it.
In this paper we describe an extension of UCheck, called UFix,which improves the error messages reported to the spreadsheet userdramatically. The approach essentially consists of three steps: First,we identify different categories of spreadsheet errors from an end-user’s perspective. Second, we map units that indicate erroneousformulas to these error categories. Finally, we create customizederror messages from the unit information and the identified errorcategory. In many cases, these error messages also provide sugges-tions on how to fix the reported errors.
Categories and Subject DescriptorsD.2.4 [Software Engineering]: Software/Program Verification; D.2.5[Software Engineering]: Testing and Debugging; H.4 [InformationSystems Applications]: Miscellaneous
Keywords: Spreadsheet, Program Analysis, Error Messages, End-User Software Engineering
1. INTRODUCTIONSpreadsheet systems like Excel are without doubt the most widelyused programming systems. Since spreadsheets are also very likelyto contain errors—some studies report that 90% or more of real-world spreadsheets contain errors [8], methods that can improvethe level of correctness for spreadsheets can have an enormous pos-itive impact. These methods may aim at detecting errors [2, 3, 4],
∗This work is supported by the National Science Foundation underthe grant ITR-0325273 and by the EUSES Consortium [1].
correcting them [7, 9], or even preventing them [5]. In any case,it is important that these methods can be integrated smoothly intothe process of spreadsheet programming, because otherwise theywould risk being not accepted by end users.
TheUChecksystem can automatically detect errors in spreadsheetformulas. UCheck works in three phases: First, a spatial analysisdeterminesheader informationfor the cells in a spreadsheet [2].This header information associates labels in the spreadsheet withother cells in the spreadsheet. Based on this header information, arule system assigns in a second step units to all cells in the spread-sheet [6]. Units can be simple base units that are given by headers,that is, labels of the spreadsheet, but they can also be more com-plex unit expressions representingand, or, anddependentunits. Ina final step, UCheck tries to transform the units derived by the rulesystem into a normal form. This transformation is driven by a setof equivalences of unit expressions. The error-detection capabilityof UCheck results from the fact that a cell whose unit expressioncannot be simplified to a normal form contains an erroneous for-mula.
Since UCheck is invoked by simply pressing a button, it requiresonly minimal effort from the user to obtain a diagnosis about pos-sible errors in a spreadsheet. Moreover, initial tests have indicatedthat the UCheck system performs accurately in practice [2]. How-ever, a problem of the current UCheck system is that it reports errormessages to the user only by coloring cells. Even though primaryerrors are distinguished from dependent errors1 by using differentcolors to focus the user’s attention to the important problems in thespreadsheet, no information about the nature of the error is com-municated to the user. Thus, even though we can effectively spoterroneous cells, it is not easy for the user to discern what exactlythe problem is and how to fix the formulas.
Fortunately, the unit information that has been derived for an erro-neous cell contains enough information to reveal more details aboutthe problem of the cell’s formula. This fact offers an opportunityto exploit the structure of the derived units to create meaningfulerror messages that are more helpful to the user than a plain errorcoloring and may guide her or him in fixing the spreadsheet.
Our approach to derive error messages consists of the followingthree steps:
1All dependent errors will disappear from the spreadsheet when allprimary errors are corrected.
Permission to make digital or hard copies of all or part of this work forpersonal or classroom use is granted without fee provided that copies arenot made or distributed for profit or commercial advantage, and that copiesbear this notice and the full citation on the first page. To copy otherwise, torepublish, to post on servers or to redistribute to lists, requires prior specificpermission and/or a fee.First Workshop on End-User Software Engineering (WEUSE I).May 212005, Saint Louis, Missouri, USA.Copyright ACM 1-59593-131-7/05/0005$5.00.
5 2
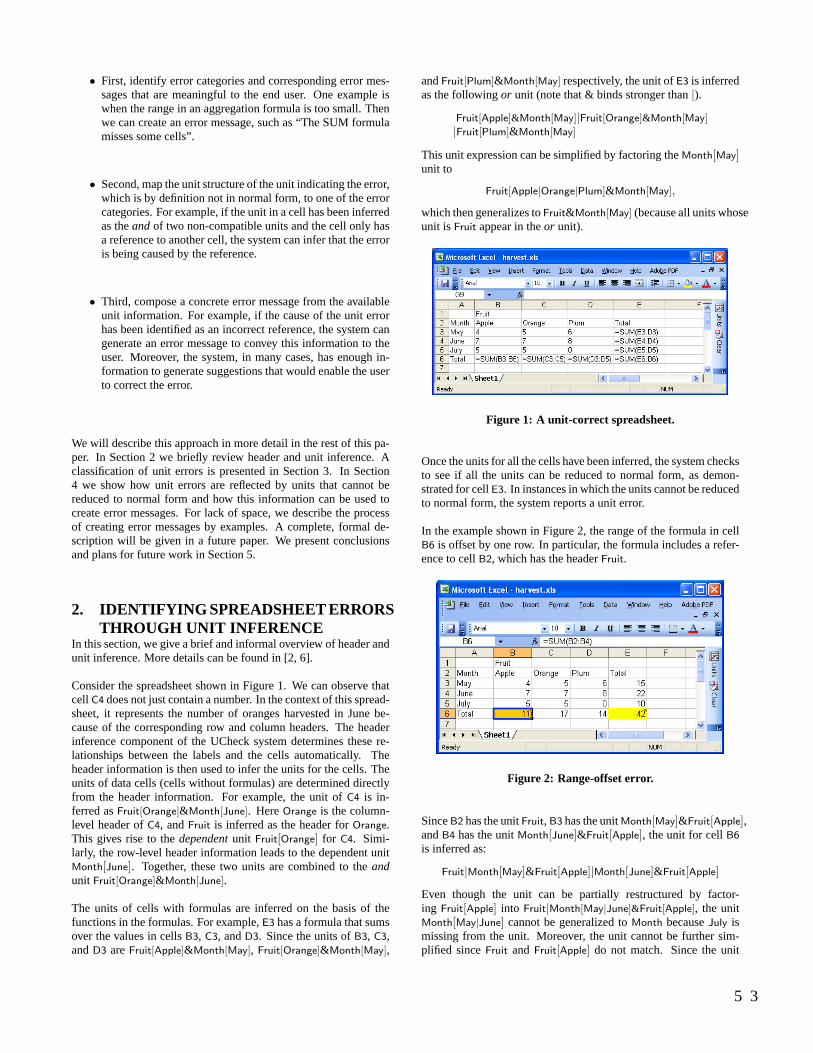
• First, identify error categories and corresponding error mes-sages that are meaningful to the end user. One example iswhen the range in an aggregation formula is too small. Thenwe can create an error message, such as “The SUM formulamisses some cells”.
• Second, map the unit structure of the unit indicating the error,which is by definition not in normal form, to one of the errorcategories. For example, if the unit in a cell has been inferredas theandof two non-compatible units and the cell only hasa reference to another cell, the system can infer that the erroris being caused by the reference.
• Third, compose a concrete error message from the availableunit information. For example, if the cause of the unit errorhas been identified as an incorrect reference, the system cangenerate an error message to convey this information to theuser. Moreover, the system, in many cases, has enough in-formation to generate suggestions that would enable the userto correct the error.
We will describe this approach in more detail in the rest of this pa-per. In Section 2 we briefly review header and unit inference. Aclassification of unit errors is presented in Section 3. In Section4 we show how unit errors are reflected by units that cannot bereduced to normal form and how this information can be used tocreate error messages. For lack of space, we describe the processof creating error messages by examples. A complete, formal de-scription will be given in a future paper. We present conclusionsand plans for future work in Section 5.
2. IDENTIFYING SPREADSHEET ERRORSTHROUGH UNIT INFERENCE
In this section, we give a brief and informal overview of header andunit inference. More details can be found in [2, 6].
Consider the spreadsheet shown in Figure 1. We can observe thatcellC4 does not just contain a number. In the context of this spread-sheet, it represents the number of oranges harvested in June be-cause of the corresponding row and column headers. The headerinference component of the UCheck system determines these re-lationships between the labels and the cells automatically. Theheader information is then used to infer the units for the cells. Theunits of data cells (cells without formulas) are determined directlyfrom the header information. For example, the unit ofC4 is in-ferred asFruit[Orange]&Month[June]. HereOrange is the column-level header ofC4, andFruit is inferred as the header forOrange.This gives rise to thedependentunit Fruit[Orange] for C4. Simi-larly, the row-level header information leads to the dependent unitMonth[June]. Together, these two units are combined to theandunit Fruit[Orange]&Month[June].
The units of cells with formulas are inferred on the basis of thefunctions in the formulas. For example,E3 has a formula that sumsover the values in cellsB3, C3, andD3. Since the units ofB3, C3,andD3 areFruit[Apple]&Month[May], Fruit[Orange]&Month[May],
andFruit[Plum]&Month[May] respectively, the unit ofE3 is inferredas the followingor unit (note that & binds stronger than|).
Fruit[Apple]&Month[May]|Fruit[Orange]&Month[May]|Fruit[Plum]&Month[May]
This unit expression can be simplified by factoring theMonth[May]unit to
Fruit[Apple|Orange|Plum]&Month[May],
which then generalizes toFruit&Month[May] (because all units whoseunit isFruit appear in theor unit).
Figure 1: A unit-correct spreadsheet.
Once the units for all the cells have been inferred, the system checksto see if all the units can be reduced to normal form, as demon-strated for cellE3. In instances in which the units cannot be reducedto normal form, the system reports a unit error.
In the example shown in Figure 2, the range of the formula in cellB6 is offset by one row. In particular, the formula includes a refer-ence to cellB2, which has the headerFruit.
Figure 2: Range-offset error.
SinceB2 has the unitFruit, B3 has the unitMonth[May]&Fruit[Apple],andB4 has the unitMonth[June]&Fruit[Apple], the unit for cellB6
is inferred as:
Fruit|Month[May]&Fruit[Apple]|Month[June]&Fruit[Apple]
Even though the unit can be partially restructured by factor-ing Fruit[Apple] into Fruit|Month[May|June]&Fruit[Apple], the unitMonth[May|June] cannot be generalized toMonth becauseJuly ismissing from the unit. Moreover, the unit cannot be further sim-plified sinceFruit and Fruit[Apple] do not match. Since the unit
5 3
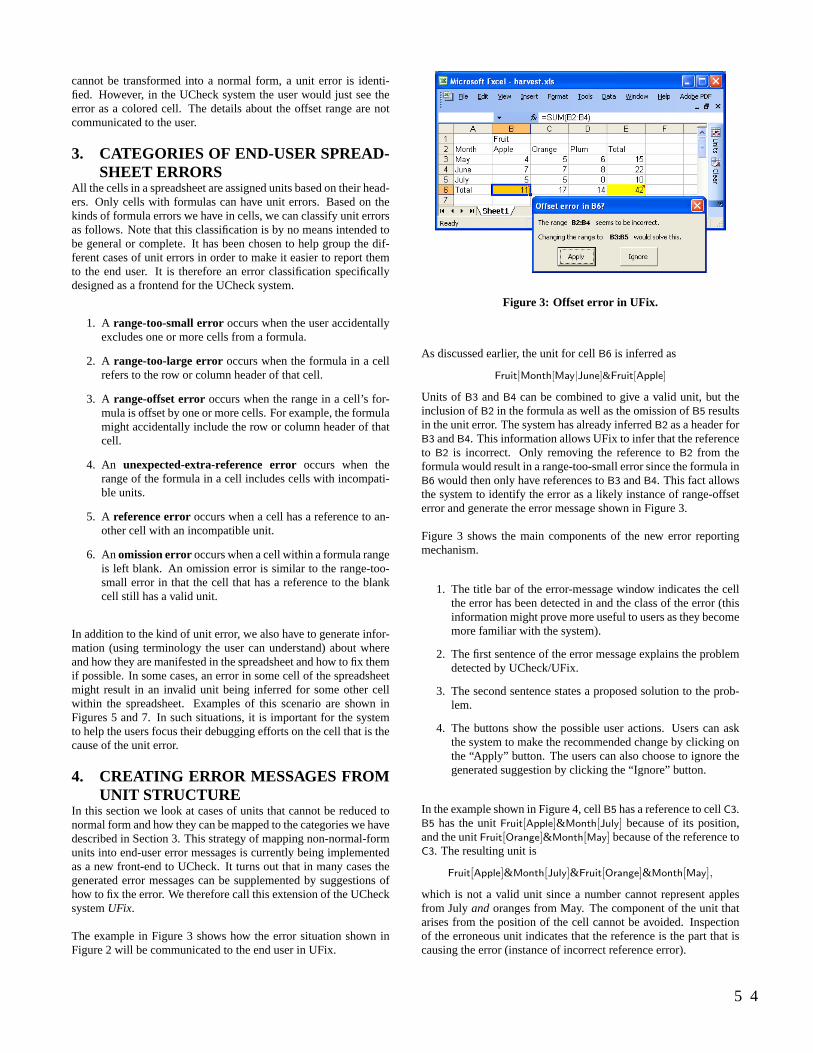
cannot be transformed into a normal form, a unit error is identi-fied. However, in the UCheck system the user would just see theerror as a colored cell. The details about the offset range are notcommunicated to the user.
3. CATEGORIES OF END-USER SPREAD-SHEET ERRORS
All the cells in a spreadsheet are assigned units based on their head-ers. Only cells with formulas can have unit errors. Based on thekinds of formula errors we have in cells, we can classify unit errorsas follows. Note that this classification is by no means intended tobe general or complete. It has been chosen to help group the dif-ferent cases of unit errors in order to make it easier to report themto the end user. It is therefore an error classification specificallydesigned as a frontend for the UCheck system.
1. A range-too-small error occurs when the user accidentallyexcludes one or more cells from a formula.
2. A range-too-large error occurs when the formula in a cellrefers to the row or column header of that cell.
3. A range-offset error occurs when the range in a cell’s for-mula is offset by one or more cells. For example, the formulamight accidentally include the row or column header of thatcell.
4. An unexpected-extra-reference error occurs when therange of the formula in a cell includes cells with incompati-ble units.
5. A reference error occurs when a cell has a reference to an-other cell with an incompatible unit.
6. Anomission erroroccurs when a cell within a formula rangeis left blank. An omission error is similar to the range-too-small error in that the cell that has a reference to the blankcell still has a valid unit.
In addition to the kind of unit error, we also have to generate infor-mation (using terminology the user can understand) about whereand how they are manifested in the spreadsheet and how to fix themif possible. In some cases, an error in some cell of the spreadsheetmight result in an invalid unit being inferred for some other cellwithin the spreadsheet. Examples of this scenario are shown inFigures 5 and 7. In such situations, it is important for the systemto help the users focus their debugging efforts on the cell that is thecause of the unit error.
4. CREATING ERROR MESSAGES FROMUNIT STRUCTURE
In this section we look at cases of units that cannot be reduced tonormal form and how they can be mapped to the categories we havedescribed in Section 3. This strategy of mapping non-normal-formunits into end-user error messages is currently being implementedas a new front-end to UCheck. It turns out that in many cases thegenerated error messages can be supplemented by suggestions ofhow to fix the error. We therefore call this extension of the UChecksystemUFix.
The example in Figure 3 shows how the error situation shown inFigure 2 will be communicated to the end user in UFix.
Figure 3: Offset error in UFix.
As discussed earlier, the unit for cellB6 is inferred as
Fruit|Month[May|June]&Fruit[Apple]
Units of B3 andB4 can be combined to give a valid unit, but theinclusion ofB2 in the formula as well as the omission ofB5 resultsin the unit error. The system has already inferredB2 as a header forB3 andB4. This information allows UFix to infer that the referenceto B2 is incorrect. Only removing the reference toB2 from theformula would result in a range-too-small error since the formula inB6 would then only have references toB3 andB4. This fact allowsthe system to identify the error as a likely instance of range-offseterror and generate the error message shown in Figure 3.
Figure 3 shows the main components of the new error reportingmechanism.
1. The title bar of the error-message window indicates the cellthe error has been detected in and the class of the error (thisinformation might prove more useful to users as they becomemore familiar with the system).
2. The first sentence of the error message explains the problemdetected by UCheck/UFix.
3. The second sentence states a proposed solution to the prob-lem.
4. The buttons show the possible user actions. Users can askthe system to make the recommended change by clicking onthe “Apply” button. The users can also choose to ignore thegenerated suggestion by clicking the “Ignore” button.
In the example shown in Figure 4, cellB5 has a reference to cellC3.B5 has the unitFruit[Apple]&Month[July] because of its position,and the unitFruit[Orange]&Month[May] because of the reference toC3. The resulting unit is
Fruit[Apple]&Month[July]&Fruit[Orange]&Month[May],
which is not a valid unit since a number cannot represent applesfrom Julyand oranges from May. The component of the unit thatarises from the position of the cell cannot be avoided. Inspectionof the erroneous unit indicates that the reference is the part that iscausing the error (instance of incorrect reference error).
5 4
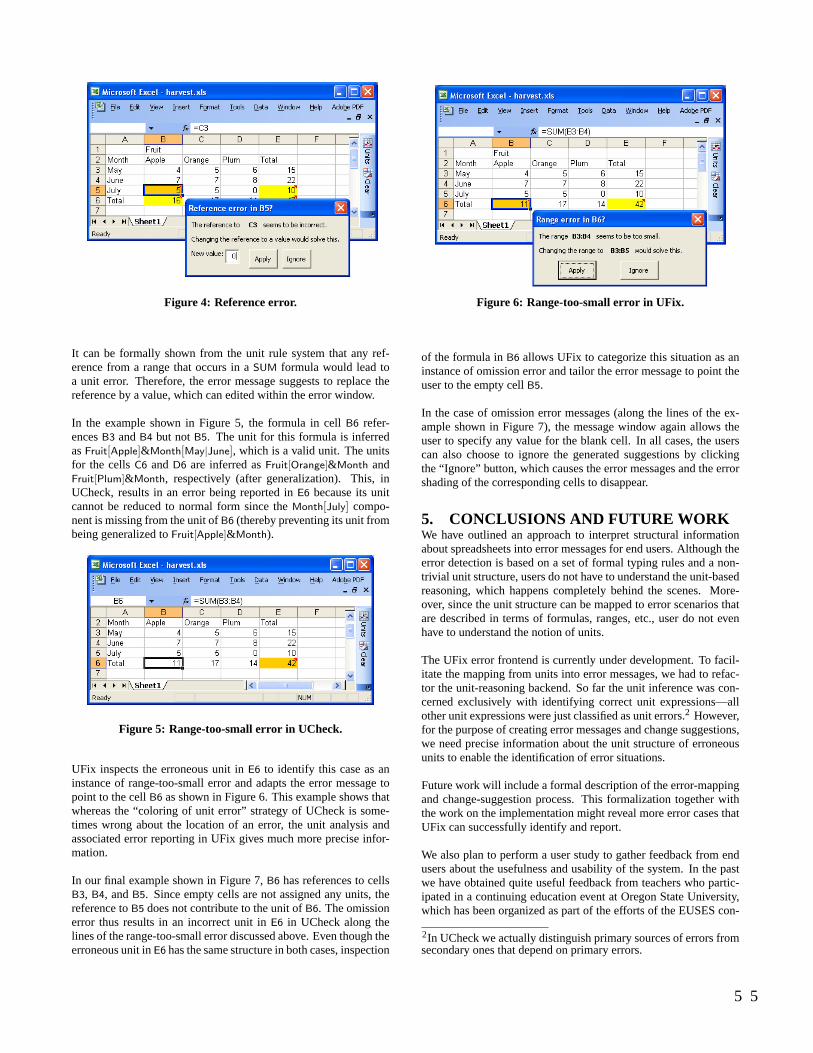
Figure 4: Reference error.
It can be formally shown from the unit rule system that any ref-erence from a range that occurs in aSUM formula would lead toa unit error. Therefore, the error message suggests to replace thereference by a value, which can edited within the error window.
In the example shown in Figure 5, the formula in cellB6 refer-encesB3 andB4 but notB5. The unit for this formula is inferredasFruit[Apple]&Month[May|June], which is a valid unit. The unitsfor the cellsC6 andD6 are inferred asFruit[Orange]&Month andFruit[Plum]&Month, respectively (after generalization). This, inUCheck, results in an error being reported inE6 because its unitcannot be reduced to normal form since theMonth[July] compo-nent is missing from the unit ofB6 (thereby preventing its unit frombeing generalized toFruit[Apple]&Month).
Figure 5: Range-too-small error in UCheck.
UFix inspects the erroneous unit inE6 to identify this case as aninstance of range-too-small error and adapts the error message topoint to the cellB6 as shown in Figure 6. This example shows thatwhereas the “coloring of unit error” strategy of UCheck is some-times wrong about the location of an error, the unit analysis andassociated error reporting in UFix gives much more precise infor-mation.
In our final example shown in Figure 7,B6 has references to cellsB3, B4, andB5. Since empty cells are not assigned any units, thereference toB5 does not contribute to the unit ofB6. The omissionerror thus results in an incorrect unit inE6 in UCheck along thelines of the range-too-small error discussed above. Even though theerroneous unit inE6 has the same structure in both cases, inspection
Figure 6: Range-too-small error in UFix.
of the formula inB6 allows UFix to categorize this situation as aninstance of omission error and tailor the error message to point theuser to the empty cellB5.
In the case of omission error messages (along the lines of the ex-ample shown in Figure 7), the message window again allows theuser to specify any value for the blank cell. In all cases, the userscan also choose to ignore the generated suggestions by clickingthe “Ignore” button, which causes the error messages and the errorshading of the corresponding cells to disappear.
5. CONCLUSIONS AND FUTURE WORKWe have outlined an approach to interpret structural informationabout spreadsheets into error messages for end users. Although theerror detection is based on a set of formal typing rules and a non-trivial unit structure, users do not have to understand the unit-basedreasoning, which happens completely behind the scenes. More-over, since the unit structure can be mapped to error scenarios thatare described in terms of formulas, ranges, etc., user do not evenhave to understand the notion of units.
The UFix error frontend is currently under development. To facil-itate the mapping from units into error messages, we had to refac-tor the unit-reasoning backend. So far the unit inference was con-cerned exclusively with identifying correct unit expressions—allother unit expressions were just classified as unit errors.2 However,for the purpose of creating error messages and change suggestions,we need precise information about the unit structure of erroneousunits to enable the identification of error situations.
Future work will include a formal description of the error-mappingand change-suggestion process. This formalization together withthe work on the implementation might reveal more error cases thatUFix can successfully identify and report.
We also plan to perform a user study to gather feedback from endusers about the usefulness and usability of the system. In the pastwe have obtained quite useful feedback from teachers who partic-ipated in a continuing education event at Oregon State University,which has been organized as part of the efforts of the EUSES con-
2In UCheck we actually distinguish primary sources of errors fromsecondary ones that depend on primary errors.
5 5
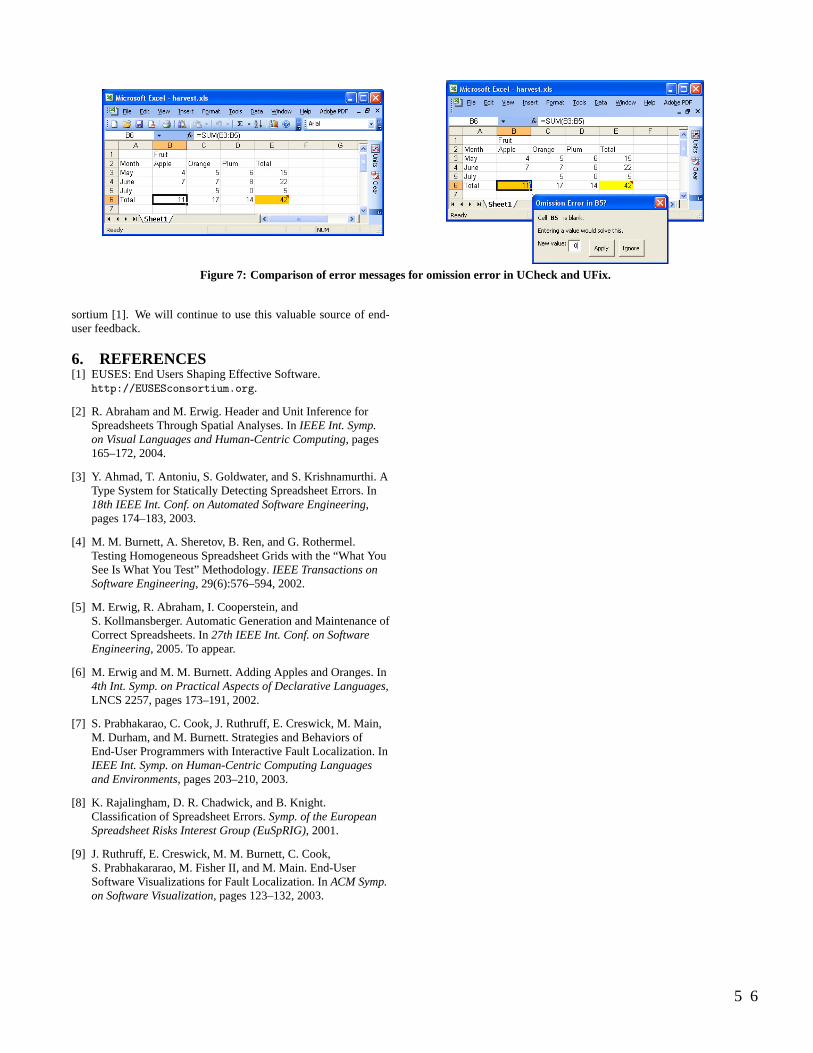
Figure 7: Comparison of error messages for omission error in UCheck and UFix.
sortium [1]. We will continue to use this valuable source of end-user feedback.
6. REFERENCES[1] EUSES: End Users Shaping Effective Software.
http://EUSESconsortium.org.
[2] R. Abraham and M. Erwig. Header and Unit Inference forSpreadsheets Through Spatial Analyses. InIEEE Int. Symp.on Visual Languages and Human-Centric Computing, pages165–172, 2004.
[3] Y. Ahmad, T. Antoniu, S. Goldwater, and S. Krishnamurthi. AType System for Statically Detecting Spreadsheet Errors. In18th IEEE Int. Conf. on Automated Software Engineering,pages 174–183, 2003.
[4] M. M. Burnett, A. Sheretov, B. Ren, and G. Rothermel.Testing Homogeneous Spreadsheet Grids with the “What YouSee Is What You Test” Methodology.IEEE Transactions onSoftware Engineering, 29(6):576–594, 2002.
[5] M. Erwig, R. Abraham, I. Cooperstein, andS. Kollmansberger. Automatic Generation and Maintenance ofCorrect Spreadsheets. In27th IEEE Int. Conf. on SoftwareEngineering, 2005. To appear.
[6] M. Erwig and M. M. Burnett. Adding Apples and Oranges. In4th Int. Symp. on Practical Aspects of Declarative Languages,LNCS 2257, pages 173–191, 2002.
[7] S. Prabhakarao, C. Cook, J. Ruthruff, E. Creswick, M. Main,M. Durham, and M. Burnett. Strategies and Behaviors ofEnd-User Programmers with Interactive Fault Localization. InIEEE Int. Symp. on Human-Centric Computing Languagesand Environments, pages 203–210, 2003.
[8] K. Rajalingham, D. R. Chadwick, and B. Knight.Classification of Spreadsheet Errors.Symp. of the EuropeanSpreadsheet Risks Interest Group (EuSpRIG), 2001.
[9] J. Ruthruff, E. Creswick, M. M. Burnett, C. Cook,S. Prabhakararao, M. Fisher II, and M. Main. End-UserSoftware Visualizations for Fault Localization. InACM Symp.on Software Visualization, pages 123–132, 2003.
5 6
Six Challenges in Supporting End-User Debugging
Joseph R. RuthruffDepartment of Computer Science
and EngineeringUniversity of Nebraska-Lincoln
Lincoln, Nebraska, [email protected]
Margaret BurnettSchool of Electrical Engineering
and Computer ScienceOregon State UniversityCorvallis, Oregon, USA
ABSTRACTThis paper summarizes six challenges in end-user programmingthat can impact the debugging efforts of end users. These chal-lenges have been derived through our experiences and empirical in-vestigation of interactive fault localization techniques in the spread-sheet paradigm. Our contributions reveal several insights into de-bugging techniques for end-user programmers, particularly fault lo-calization techniques, that can help guide the direction of futureend-user software engineering research.
Categories and Subject DescriptorsD.2.5 [Software Engineering]: Testing and Debugging—debug-ging aids, testing tools; D.2.6 [Software Engineering]: Program-ming Environments—interactive environments; H.4.1 [Informa-tion Systems Applications]: Office Automation—spreadsheets
General TermsExperimentation, Verification
Keywordsend-user software engineering, end-user programming, debugging,fault localization
1. INTRODUCTIONEnd-user programming has become the most common form of
programming today: it is estimated that, in 2005 in the UnitedStates alone, 55 million end users, compared to only 2.75 mil-lion “professional” programmers [4], will be creating software us-ing diverse software environments such as educational simulationbuilders, web authoring systems, multimedia authoring systems, e-mail filtering rules, CAD systems, and spreadsheet environments.(Although new research [20] has revealed flaws with the methodol-ogy used to produce this estimate, this new research indicates thatin fact the number of end-user programmers is even higher thanreported by Boehm et al. [4].)
Yet despite this trend, evidence suggests that end-user program-mers do not have adequate support for their software developmentefforts. Boehm and Basili [5] observe that 40–50% of the softwarecreated by end users contains non-trivial faults. These faults canbe serious, costing millions of dollars in some cases (e.g., [10, 14,16]).
To help provide needed software development support to endusers, we have been working on a vision we call end-user soft-ware engineering [7], which we have prototyped in the spreadsheetparadigm because it is so widespread in practice. The concept ofend-user software engineering is a holistic approach to the facetsof software development in which end users engage. Its goal is tobring some of the gains from the software engineering communityto end-user programming environments — without requiring train-ing, knowledge, or even interest in traditional software engineeringtheory or practices. The aspect of end-user software engineeringthat is of interest in this paper is debugging.
This paper outlines six challenges that we have encountered insupporting end-user debugging through fault localization tech-niques. Some of these challenges are brought about due to inher-ent characteristics of most end-user programming environments,while other challenges are directly tied to the end users themselves.While our challenges are most directly applicable to the area ofend-user debugging, all have potential ramifications to researchbringing any software development support to end-user program-mers.
The remainder of this paper is organized as follows: Section 2briefly describes the interactive fault localization support in ourown end-user software engineering environment; Section 3 dis-cusses the challenges that we have encountered in bringing suchdebugging support to end users, including the ramifications of thesechallenges to other researchers; and Section 4 concludes the paper.
2. BACKGROUNDOur debugging support through fault localization is prototyped in
the spreadsheet paradigm in conjunction with our “What You SeeIs What You Test” (WYSIWYT) testing methodology [17], so webriefly describe that methodology first in order to provide a contextfor our experiences.
2.1 End-User Testing via WYSIWYTFigure 1 presents an example of WYSIWYT in Forms/3 [6], a
spreadsheet language utilizing “free-floating” cells in addition totraditional spreadsheet grids. In WYSIWYT, untested spreadsheetcells that have non-constant formulas are given a red border (lightgray in this paper). The borders of such cells remain red until theybecome more “tested”.
Permission to make digital or hard copies of all or part of this work forpersonal or classroom use is granted without fee provided that copies arenot made or distributed for profit or commercial advantage, and that copiesbear this notice and the full citation on the first page. To copy otherwise, torepublish, to post on servers or to redistribute to lists, requires prior specificpermission and/or a fee.First Workshop on End-User Software Engineering (WEUSE I).May 212005, Saint Louis, Missouri, USA.Copyright ACM 1-59593-131-7/05/0005$5.00.
5 7
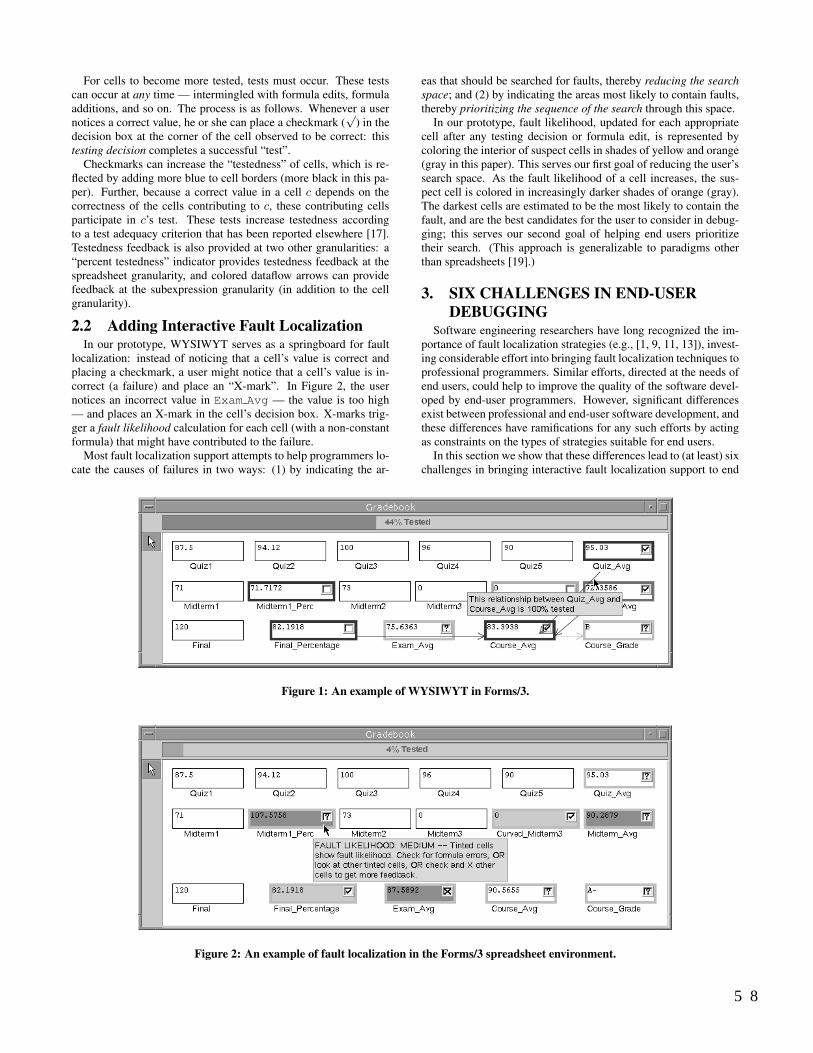
For cells to become more tested, tests must occur. These testscan occur at any time — intermingled with formula edits, formulaadditions, and so on. The process is as follows. Whenever a usernotices a correct value, he or she can place a checkmark (
√
) in thedecision box at the corner of the cell observed to be correct: thistesting decision completes a successful “test”.
Checkmarks can increase the “testedness” of cells, which is re-flected by adding more blue to cell borders (more black in this pa-per). Further, because a correct value in a cell c depends on thecorrectness of the cells contributing to c, these contributing cellsparticipate in c’s test. These tests increase testedness accordingto a test adequacy criterion that has been reported elsewhere [17].Testedness feedback is also provided at two other granularities: a“percent testedness” indicator provides testedness feedback at thespreadsheet granularity, and colored dataflow arrows can providefeedback at the subexpression granularity (in addition to the cellgranularity).
2.2 Adding Interactive Fault LocalizationIn our prototype, WYSIWYT serves as a springboard for fault
localization: instead of noticing that a cell’s value is correct andplacing a checkmark, a user might notice that a cell’s value is in-correct (a failure) and place an “X-mark”. In Figure 2, the usernotices an incorrect value in Exam Avg — the value is too high— and places an X-mark in the cell’s decision box. X-marks trig-ger a fault likelihood calculation for each cell (with a non-constantformula) that might have contributed to the failure.
Most fault localization support attempts to help programmers lo-cate the causes of failures in two ways: (1) by indicating the ar-
eas that should be searched for faults, thereby reducing the searchspace; and (2) by indicating the areas most likely to contain faults,thereby prioritizing the sequence of the search through this space.
In our prototype, fault likelihood, updated for each appropriatecell after any testing decision or formula edit, is represented bycoloring the interior of suspect cells in shades of yellow and orange(gray in this paper). This serves our first goal of reducing the user’ssearch space. As the fault likelihood of a cell increases, the sus-pect cell is colored in increasingly darker shades of orange (gray).The darkest cells are estimated to be the most likely to contain thefault, and are the best candidates for the user to consider in debug-ging; this serves our second goal of helping end users prioritizetheir search. (This approach is generalizable to paradigms otherthan spreadsheets [19].)
3. SIX CHALLENGES IN END-USERDEBUGGING
Software engineering researchers have long recognized the im-portance of fault localization strategies (e.g., [1, 9, 11, 13]), invest-ing considerable effort into bringing fault localization techniques toprofessional programmers. Similar efforts, directed at the needs ofend users, could help to improve the quality of the software devel-oped by end-user programmers. However, significant differencesexist between professional and end-user software development, andthese differences have ramifications for any such efforts by actingas constraints on the types of strategies suitable for end users.
In this section we show that these differences lead to (at least) sixchallenges in bringing interactive fault localization support to end
Figure 1: An example of WYSIWYT in Forms/3.
Figure 2: An example of fault localization in the Forms/3 spreadsheet environment.
5 8
users in order to support end-user debugging activities. These chal-lenges are most directly applicable to end-user debugging; how-ever, all have potential ramifications to any end-user programmingresearch.
3.1 Lack of Software Engineering KnowledgeA first challenge pertains to knowledge of software engineering
theory and practices. Unlike professional programmers, end usersrarely have such knowledge, and are unlikely to take the time toacquire it. This impacts fault localization techniques because, tra-ditionally, such techniques often require at least partial knowledgeof such theory to (1) properly employ the technique, (2) compre-hend the technique’s feedback, or (3) understand why the techniqueis producing particular fault localization feedback. (As research [2,8] explains, understanding is critical to trust, which in turn is criti-cal to users actually believing a system’s output and acting on it.)
For example, critical slicing [9] uses mutation-based testing, astrategy of which end-user programmers are unlikely to have anyprior knowledge. This lack of knowledge could hinder end users’ability to understand why critical slicing is producing particularfault localization feedback, which in turn can result in a loss oftrust in the feedback.
We believe that researchers should be particularly concernedabout whether end users require previous software engineeringknowledge to understand why techniques produce particular feed-back. End users are unlikely to blindly follow any feedback duringdebugging unless they are comfortable doing so, and this comfortlevel can be hindered by prerequisites placed upon end users bydebugging techniques.
A first challenge for researchers, then, is to developtechniques that support debugging without unrealisticprerequisites such as knowledge of software engineer-ing practices.
3.2 Modeless and Interactive EnvironmentsA second challenge pertains to the manner of interaction between
the software developer and the programming environment. End-user programming environments are usually modeless and highlyinteractive: users incrementally experiment with their software andsee how the results seem to be working out after every change, us-ing techniques such as the automatic recalculation feature ofspreadsheet environments. Most professional programming envi-ronments, however, are modal — featuring separate code, compile,link, and execute modes, and separate techniques for tasks such asfault localization. The lack of interaction in these environmentshas allowed many fault localization techniques to perform a batchprocessing of information before displaying feedback.
For example, χslice [1] uses preexisting execution traces frompredetermined passed and failed test cases to produce feedback.Unfortunately, if either the suite of test cases or the program sourcecode changes, the testing and execution slicing information wouldhave to be recreated. This process would have to be performed inbatch — before any fault localization feedback could be provided.
Because end users tend to interactively debug in parallel withincremental software development, they are likely to expect debug-ging techniques, such as fault localization support, to be availableat any point in the development or debugging process, resulting inimmediate feedback.
A second challenge for researchers, then, is to developinteractive debugging techniques for end users, astechniques that perform batch processing are at bestunsuited, and at worst incompatible, with interactiveend-user environments.
3.3 Lack of Organized Testing InfrastructureA third challenge pertains to the amount of testing information
available in professional versus end-user software development en-vironments. End users do not usually have suites of organized testcases, so large bases of testing information, which are commonlyused by debugging techniques, are rarely available. However, largebases of testing information are precisely what is required for somedebugging techniques to operate effectively.
For example, TARANTULA [11] uses a set of failed and passedtests, and coverage information indicating the program points con-tributing to each test, to calculate (1) a color representing the partic-ipation of every statement (in the source code) in testing, and (2) thetechnique’s confidence in the correctness of each color. However,in order to calculate accurate colorizations for every statement inthe program, the technique not only requires a test for every state-ment (i.e., a test suite with 100% coverage), but enough tests cov-ering each statement to serve as data points for the confidence ofeach colorization.
Complicating this type of situation for researchers is the previ-ously described interactive nature of end-user debugging: end usersmay observe a failure and start the debugging process early — notjust after some long batch of tests — at which time the system mayhave very little information with which to provide feedback. De-bugging techniques, therefore, must be able to report feedback atpoints other than those of “maximal system reasoning potential”— when the technique has the greatest amount of available infor-mation with which to provide feedback.
A third challenge for researchers, then, is to developtechniques that do not require large bases of testinginformation, as such techniques may be inappropriatein end-user programming settings.
3.4 Unreliability of Testing InformationA fourth challenge pertains to a common assumption in software
engineering techniques created for professional programmers: thatthe accuracy of the information provided to the techniques is reli-able. Researchers have rarely considered the possibility that infor-mation, such as the results of certain test cases in a test suite, maybe inaccurate — yet evidence [18, 19] suggests that this dilemmais likely to face researchers seeking to bring debugging techniquessuch as fault localization support to end users. (Professional pro-grammers err too, of course, but their understanding of testing pro-cesses may render them less error-prone than end users.)
For example, in one of our own formative studies [19], whichwas conducted to investigate end-user debugging strategies, wefound that 4.3% of the testing decisions by the end-user participantswere incorrect, and that these incorrect decisions affected 60% ofthe participants’ success rates when searching for faults. A morerecent study [18] provided even more disturbing evidence: nearly25% of the participants’ testing decisions were incorrect, and theyaffected 74% of the debugging efforts by participants. More evi-dence can be found in an observational study conducted by Ko andMyers [12], where 29 breakdowns — problems with knowledge,amount or direction of attention, or strategies [15] — occurred dur-ing debugging activities.
Unfortunately, many fault localization techniques have no safe-guards to provide the technique with robustness in the presence ofsuch unreliable information, and other strategies, such as programdicing [13], simply cannot operate reliability in these settings. It isclearly necessary to provide accurate debugging feedback to userseven in these settings so that the technique fulfills its purpose.
5 9
A fourth challenge for researchers, then, is to provideend users with debugging techniques that do not re-quire a high degree of reliability in the data in order toprovide useful feedback.
3.5 Evaluation of Debugging FeedbackA fifth challenge pertains to evaluating interactive debugging
techniques for end users. Many traditional techniques report feed-back only at the end of a batch processing of information. Thispoint of maximal system reasoning potential — when the systemhas its best (and only) chance of producing correct feedback — istherefore the appropriate point to measure these techniques. Giventhe interactive nature of end-user environments, however, debug-ging occurs not just at the end of testing, but throughout the testingprocess in incremental stages. Measuring debugging techniques’effectiveness only at the end of testing would thus ignore most ofthe reporting being done by the interactive technique.
It is therefore necessary for researchers to measure feedback atmultiple stages throughout the multiple debugging “sessions” thatend users are likely to engage in during their incremental softwaredevelopment. There are many ways in which a researcher couldperform these measurements. For example, if the researcher is in-terested in the effectiveness of one technique’s feedback, it may beappropriate to evaluate feedback immediately whenever the feed-back changes (e.g., due to a change in the program’s logic or theaddition, or removal, of testing information). Likewise, if the re-searcher is interested in comparing the effectiveness of multipletechniques’ feedback, then measurements should be taken at all in-cremental feedback points that are reached often enough to supportstatistical comparisons.
A fifth challenge for researchers, then, is to incorpo-rate measures for evaluating debugging techniquesthat consider interactive feedback.
3.6 Attention InvestmentA sixth challenge pertains to a question that is not often asked
by researchers creating programming techniques for professionalprogrammers: “If we build it, will they come?” A common as-sumption made by researchers is that software engineers will usea debugging technique because they are already familiar with suchtechniques, and the benefits of their use are clear to them (assum-ing that the technique provides accurate feedback). However, thebenefits of using such techniques may not be immediately clear toend-user programmers, especially if the end users have little expe-rience using such techniques.
In fact, Blackwell’s model of attention investment [3] is onemodel of user problem-solving behavior predicting that users willnot want to use any programming technique unless the benefits ofdoing so are clear to them. The model considers the costs, bene-fits, and risks that users weigh in deciding how to complete a task.For example, if the ultimate goal is to forecast a budget using aspreadsheet, then using a relatively unknown feature such as a faultlocalization technique has a cost, benefit, and risk. The costs arefiguring out when and where to use the technique, and thinkingabout the resulting feedback. The benefit of finding faults may notbe clear after only one use of the technique; in fact, the user mayhave to expend even more costs (i.e., use the technique more thanonce) for benefits to become clear. The risks are that going downthis path will be a waste of time or worse, will mislead the user intolooking for faults in the correct formulas instead of the incorrectones.
The implications of this model to researchers are considerable,and we will not attempt to enumerate all of them in this paper. Two
implications, however, are (1) the need for mechanisms to convinceend users to use debugging techniques for the very first time giventhe perceived costs, benefits, and risks of doing so; and (2) theneed for mechanisms to regularly deliver to end users the promisedbenefits as they use the technique, thus demonstrating benefits thatoutweigh the costs and risks if they continue to use the technique.
In our own prototype, we address this problem using a “Surprise-Explain-Reward” strategy [21]. This strategy (1) entices users touse a technique for the first time by arousing their curiosity aboutthe technique through the element of surprise, and (2) encouragesthem, through explanations and rewards, to continue using the tech-nique. We believe that researchers need to incorporate similarstrategies to address the attention investment considerations thatend users will make at any point in their software development.
A sixth challenge for researchers, then, is to accountfor the attention investment considerations of end usersby ensuring that users are enticed to use debuggingtechniques for the first time, and then continue to usethe techniques.
4. CONCLUSIONSResearch is gradually emerging to bring debugging techniques
directly to end-user programmers. However, many challenges faceresearchers attempting to bring this debugging support to this soft-ware engineering domain. Using our experiences with fault local-ization techniques in an end-user software engineering approach,we have outlined six particular challenges that are likely to faceresearchers attempting to support end-user debugging, and evenother software development tasks, in end-user programming envi-ronments. We hope that our contributions can help guide the direc-tion of future end-user software engineering research by assistingin the creation of techniques that are better-equipped to support theneeds of end-user programmers.
5. ACKNOWLEDGMENTSThis work was supported in part by the EUSES Consortium via
NSF grant ITR-0325273. The opinions and conclusions in this pa-per are those of the authors and do not necessarily represent thoseof the National Science Foundation.
6. REFERENCES[1] H. Agrawal, J. Horgan, S. London, and W. Wong. Fault
localization using execution slices and dataflow tests. InProceedings of the Sixth IEEE International Symposium onSoftware Reliability Engineering, pages 143–151, Toulouse,France, October 1995.
[2] N. Belkin. Helping people find what they don’t know.Communications of the ACM, 41(8):58–61, August 2000.
[3] A. Blackwell. First steps in programming: A rationale forattention investment models. In Proceedings of the IEEESymposium on Human-Centric Computing Languages andEnvironments, pages 2–10, Arlington, Virginia, USA,September 2002.
[4] B. Boehm, C. Abts, A. Brown, and S. Chulani. Software CostEstimation with COCOMO II. Prentice Hall PTR, UpperSaddle River, New Jersey, USA, 2000.
[5] B. Boehm and V. Basili. Software defect reduction Top 10list. Computer, 34(1):135–137, January 2001.
[6] M. Burnett, J. Atwood, R. Djang, H. Gottfried, J. Reichwein,and S. Yang. Forms/3: A first-order visual language to
6 0
explore the boundaries of the spreadsheet paradigm. Journalof Functional Programming, 11(2):155–206, March 2001.
[7] M. Burnett, C. Cook, and G. Rothermel. End-user softwareengineering. Communications of the ACM, 47(9):53–58,September 2004.
[8] C. Corritore, B. Kracher, and S. Wiedenbeck. Trust in theonline environment. In HCI International, volume 1, pages1548–1552, New Orleans, Louisiana, USA, August 2001.
[9] R. DeMillo, H. Pan, and E. Spafford. Critical slicing forsoftware fault localization. In Proceedings of theInternational Symposium on Software Testing and Analysis,pages 121–134, San Diego, California, USA, January 1996.
[10] D. Hilzenrath. Finding errors a plus, fannie says; mortgagegiant tries to soften effect of $1 billion in mistakes. TheWashington Post, October 31, 2003.
[11] J. Jones, M. Harrold, and J. Stasko. Visualization of testinformation to assist fault localization. In Proceedings of the24
th International Conference on Software Engineering,pages 467–477, Orlando, Florida, USA, May 2002.
[12] A. Ko and B. Myers. Development and evaluation of a modelof programming errors. In Proceedings of the IEEESymposium on Human-Centric Computing Languages andEnvironments, pages 7–14, Auckland, New Zealand, October2003.
[13] J. Lyle and M. Weiser. Automatic program bug location byprogram slicing. In Proceedings of the 2
nd InternationalConference on Computers and Applications, pages 877–883,1987.
[14] R. Panko. Finding spreadsheet errors: Most spreadsheeterrors have design flaws that may lead to long-termmiscalculation. Information Week, page 100, May 1995.
[15] J. Reason. Human Error. Cambridge University Press,Cambridge, England, 1990.
[16] G. Robertson. Officials red-faced by $24m gaffe: Error incontract bid hits bottom line of TransAlta Corp. OttawaCitizen, June 5, 2003.
[17] G. Rothermel, M. Burnett, L. Li, C. Dupuis, and A. Sheretov.A methodology for testing spreadsheets. ACM Transactionson Software Engineering and Methodology, 10(1):110–147,January 2001.
[18] J. Ruthruff, M. Burnett, and G. Rothermel. An empiricalstudy of fault localization for end-user programmers. InProceedings of the 27
th International Conference onSoftware Engineering, St. Louis, Missouri, USA, May 2005(to appear).
[19] J. Ruthruff, S. Prabhakararao, J. Reichwein, C. Cook,E. Creswick, and M. Burnett. Interactive, visual faultlocalization support for end-user programmers. Journal ofVisual Languages and Computing, 16(1–2):3–40,February/April 2005.
[20] C. Scaffidi, M. Shaw, and B. Myers. The ‘55m end-userprogrammers’ estimate revisited. Technical ReportCMU-ISRI-05-100, Carnegie Mellon University, Pittsburgh,Pennsylvania, USA, February 2005.
[21] A. Wilson, M. Burnett, L. Beckwith, O. Granatir,L. Casburn, C. Cook, M. Durham, and G. Rothermel.Harnessing curiosity to increase correctness in end-userprogramming. In Proceedings of the ACM Conference onHuman Factors in Computing Systems, pages 305–312, FortLauderdale, Florida, USA, April 2003.
6 1
Human Factors Affecting Dependability in End-User Programming
Andrew J. Ko and Brad A. Myers Human-Computer Interaction Institute
Carnegie Mellon University 5000 Forbes Ave, Pittsburgh, PA 15213
[email protected], [email protected]
ABSTRACT Human factors affecting the dependability of end user’s programs are discussed in the context of controlled and observational studies of both professional and end-user programmers. These factors include the influence of the types of behaviors that end users wish to implement, end user’s fundamental cognitive biases, barriers in the languages, environments, libraries, and other tools used by end users, and end users’ difficulties with understanding their code’s meaning and execution.
Categories and Subject Descriptors D.2.6 [Programming Environments]: Integrated environments.
General Terms Design, Human Factors.
Keywords End-user programming, human factors.
1. INTRODUCTION The goal of project Marmalade (www.cs.cmu.edu/~NatProg) is to design innovative programming environments, tools, and interaction techniques that significantly lower the barriers to successful programming. An important part of achieving this goal has been to better understand the barriers in programming systems that make it difficult for both professional and end-user programmers to be successful. This has involved several empirical studies of programmers, both observational [3, 4] and controlled [5, 6], using various programming systems including Alice [2], Visual Basic.NET, and Macromedia Flash and Director. In this paper we would like to share some of our more general insights from these studies in the hopes of fostering discussion about some of the central factors affecting the dependability of end users’ programs. In summary, these factors include:
• What end users want their programs to do;
• Fundamental cognitive biases that can cause end users to introduce errors into code;
• The languages, environments, libraries, and tools used by end users to create their programs;
• The code that end users create; and, • The errors in the code that end users create.
We will end our discussion with some insights on the implications for the design of end-user programming environments.
2. What End Users Want Programs to Do One factor that influenced end-user programmers’ success in our studies was the behaviors that they wanted their programs to perform. In many cases, our participants found that the algorithm they desired was in many ways more complicated than the code required to implement it. For example, when participants were required to implement their own sorting algorithm for a list of names, it was the algorithm itself, and not the code that they had to write to implement the algorithm, that caused them the most difficulties and the most errors.
In other cases, end-user programmers’ expected a particular behavior to be straightforward to implement, but found that several other things had to be implemented in order to achieve the behavior they desired. For example, in our study of Visual Basic.NET [7], we observed one student try to create an alarm clock that would play digital music. After a few hours of simply trying to get a timer to count seconds, he decided to abandon the digital music idea, and just focus on getting the alarm clock to work.
We have also observed that end-user programmers sometimes found that the behavior they desired was beyond the scope of the programming system’s abstractions. When this occurred, they were forced to either solve a problem in a very cumbersome and unintuitive way, frequently leading to errors, or else find a different programming system that offered more suitable abstractions. For example, many of the participants in our study of Visual Basic.NET wanted to create animations, but found that its support for animations was minimal. Many programmers, rather than move to a programming system tailored towards animation such as Flash, instead tried to find workarounds for animation by searching on the Internet. Programmers reported that they had already invested so much into one programming system that learning another would not be worth their time.
Permission to make digital or hard copies of all or part of this work forpersonal or classroom use is granted without fee provided that copies arenot made or distributed for profit or commercial advantage, and that copiesbear this notice and the full citation on the first page. To copy otherwise, torepublish, to post on servers or to redistribute to lists, requires prior specificpermission and/or a fee.First Workshop on End-User Software Engineering (WEUSE I).May 212005, Saint Louis, Missouri, USA.Copyright ACM 1-59593-131-7/05/0005$5.00.
6 2
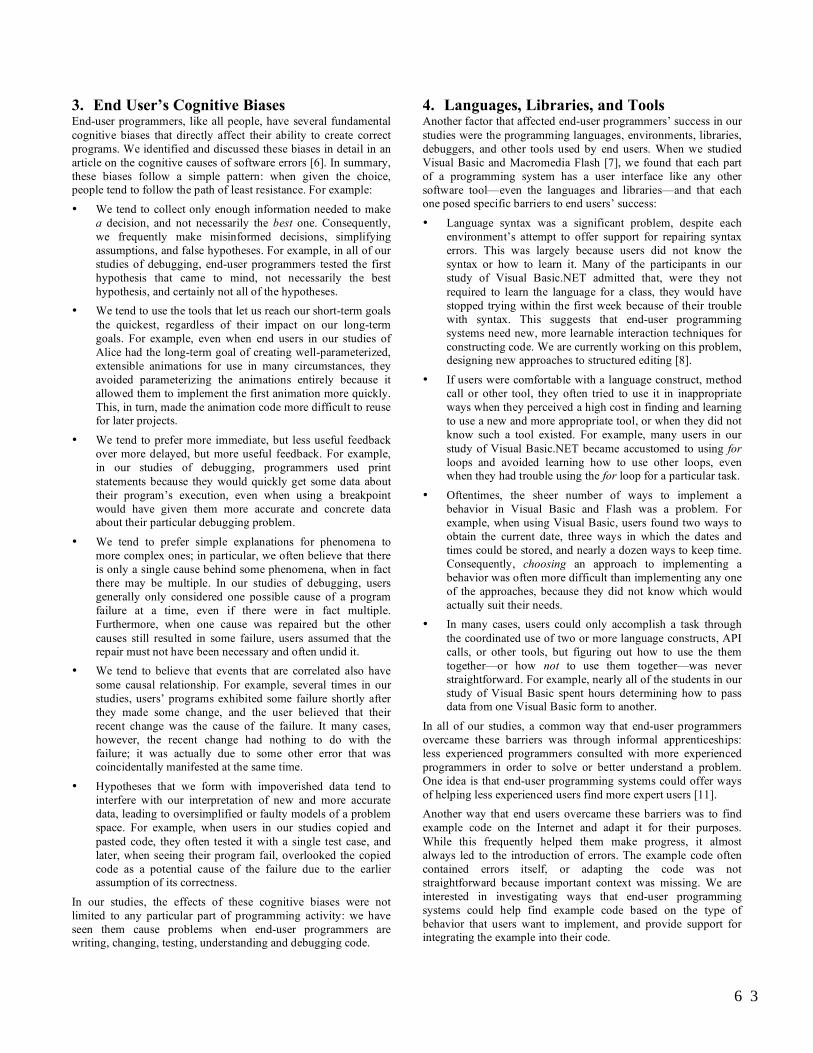
3. End User’s Cognitive Biases End-user programmers, like all people, have several fundamental cognitive biases that directly affect their ability to create correct programs. We identified and discussed these biases in detail in an article on the cognitive causes of software errors [6]. In summary, these biases follow a simple pattern: when given the choice, people tend to follow the path of least resistance. For example:
• We tend to collect only enough information needed to make a decision, and not necessarily the best one. Consequently, we frequently make misinformed decisions, simplifying assumptions, and false hypotheses. For example, in all of our studies of debugging, end-user programmers tested the first hypothesis that came to mind, not necessarily the best hypothesis, and certainly not all of the hypotheses.
• We tend to use the tools that let us reach our short-term goals the quickest, regardless of their impact on our long-term goals. For example, even when end users in our studies of Alice had the long-term goal of creating well-parameterized, extensible animations for use in many circumstances, they avoided parameterizing the animations entirely because it allowed them to implement the first animation more quickly. This, in turn, made the animation code more difficult to reuse for later projects.
• We tend to prefer more immediate, but less useful feedback over more delayed, but more useful feedback. For example, in our studies of debugging, programmers used print statements because they would quickly get some data about their program’s execution, even when using a breakpoint would have given them more accurate and concrete data about their particular debugging problem.
• We tend to prefer simple explanations for phenomena to more complex ones; in particular, we often believe that there is only a single cause behind some phenomena, when in fact there may be multiple. In our studies of debugging, users generally only considered one possible cause of a program failure at a time, even if there were in fact multiple. Furthermore, when one cause was repaired but the other causes still resulted in some failure, users assumed that the repair must not have been necessary and often undid it.
• We tend to believe that events that are correlated also have some causal relationship. For example, several times in our studies, users’ programs exhibited some failure shortly after they made some change, and the user believed that their recent change was the cause of the failure. It many cases, however, the recent change had nothing to do with the failure; it was actually due to some other error that was coincidentally manifested at the same time.
• Hypotheses that we form with impoverished data tend to interfere with our interpretation of new and more accurate data, leading to oversimplified or faulty models of a problem space. For example, when users in our studies copied and pasted code, they often tested it with a single test case, and later, when seeing their program fail, overlooked the copied code as a potential cause of the failure due to the earlier assumption of its correctness.
In our studies, the effects of these cognitive biases were not limited to any particular part of programming activity: we have seen them cause problems when end-user programmers are writing, changing, testing, understanding and debugging code.
4. Languages, Libraries, and Tools Another factor that affected end-user programmers’ success in our studies were the programming languages, environments, libraries, debuggers, and other tools used by end users. When we studied Visual Basic and Macromedia Flash [7], we found that each part of a programming system has a user interface like any other software tool—even the languages and libraries—and that each one posed specific barriers to end users’ success:
• Language syntax was a significant problem, despite each environment’s attempt to offer support for repairing syntax errors. This was largely because users did not know the syntax or how to learn it. Many of the participants in our study of Visual Basic.NET admitted that, were they not required to learn the language for a class, they would have stopped trying within the first week because of their trouble with syntax. This suggests that end-user programming systems need new, more learnable interaction techniques for constructing code. We are currently working on this problem, designing new approaches to structured editing [8].
• If users were comfortable with a language construct, method call or other tool, they often tried to use it in inappropriate ways when they perceived a high cost in finding and learning to use a new and more appropriate tool, or when they did not know such a tool existed. For example, many users in our study of Visual Basic.NET became accustomed to using for loops and avoided learning how to use other loops, even when they had trouble using the for loop for a particular task.
• Oftentimes, the sheer number of ways to implement a behavior in Visual Basic and Flash was a problem. For example, when using Visual Basic, users found two ways to obtain the current date, three ways in which the dates and times could be stored, and nearly a dozen ways to keep time. Consequently, choosing an approach to implementing a behavior was often more difficult than implementing any one of the approaches, because they did not know which would actually suit their needs.
• In many cases, users could only accomplish a task through the coordinated use of two or more language constructs, API calls, or other tools, but figuring out how to use the them together—or how not to use them together—was never straightforward. For example, nearly all of the students in our study of Visual Basic spent hours determining how to pass data from one Visual Basic form to another.
In all of our studies, a common way that end-user programmers overcame these barriers was through informal apprenticeships: less experienced programmers consulted with more experienced programmers in order to solve or better understand a problem. One idea is that end-user programming systems could offer ways of helping less experienced users find more expert users [11]. Another way that end users overcame these barriers was to find example code on the Internet and adapt it for their purposes. While this frequently helped them make progress, it almost always led to the introduction of errors. The example code often contained errors itself, or adapting the code was not straightforward because important context was missing. We are interested in investigating ways that end-user programming systems could help find example code based on the type of behavior that users want to implement, and provide support for integrating the example into their code.
6 3
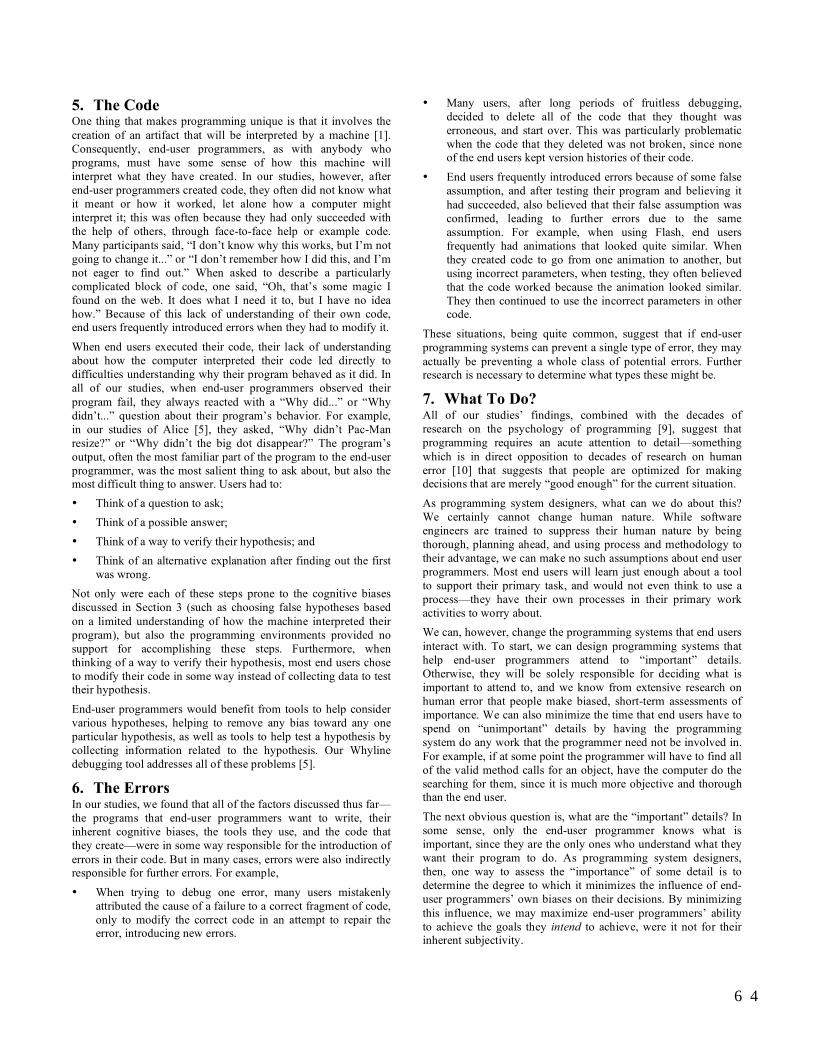
5. The Code One thing that makes programming unique is that it involves the creation of an artifact that will be interpreted by a machine [1]. Consequently, end-user programmers, as with anybody who programs, must have some sense of how this machine will interpret what they have created. In our studies, however, after end-user programmers created code, they often did not know what it meant or how it worked, let alone how a computer might interpret it; this was often because they had only succeeded with the help of others, through face-to-face help or example code. Many participants said, “I don’t know why this works, but I’m not going to change it...” or “I don’t remember how I did this, and I’m not eager to find out.” When asked to describe a particularly complicated block of code, one said, “Oh, that’s some magic I found on the web. It does what I need it to, but I have no idea how.” Because of this lack of understanding of their own code, end users frequently introduced errors when they had to modify it.
When end users executed their code, their lack of understanding about how the computer interpreted their code led directly to difficulties understanding why their program behaved as it did. In all of our studies, when end-user programmers observed their program fail, they always reacted with a “Why did...” or “Why didn’t...” question about their program’s behavior. For example, in our studies of Alice [5], they asked, “Why didn’t Pac-Man resize?” or “Why didn’t the big dot disappear?” The program’s output, often the most familiar part of the program to the end-user programmer, was the most salient thing to ask about, but also the most difficult thing to answer. Users had to: • Think of a question to ask; • Think of a possible answer; • Think of a way to verify their hypothesis; and • Think of an alternative explanation after finding out the first
was wrong. Not only were each of these steps prone to the cognitive biases discussed in Section 3 (such as choosing false hypotheses based on a limited understanding of how the machine interpreted their program), but also the programming environments provided no support for accomplishing these steps. Furthermore, when thinking of a way to verify their hypothesis, most end users chose to modify their code in some way instead of collecting data to test their hypothesis.
End-user programmers would benefit from tools to help consider various hypotheses, helping to remove any bias toward any one particular hypothesis, as well as tools to help test a hypothesis by collecting information related to the hypothesis. Our Whyline debugging tool addresses all of these problems [5].
6. The Errors In our studies, we found that all of the factors discussed thus far—the programs that end-user programmers want to write, their inherent cognitive biases, the tools they use, and the code that they create—were in some way responsible for the introduction of errors in their code. But in many cases, errors were also indirectly responsible for further errors. For example,
• When trying to debug one error, many users mistakenly attributed the cause of a failure to a correct fragment of code, only to modify the correct code in an attempt to repair the error, introducing new errors.
• Many users, after long periods of fruitless debugging, decided to delete all of the code that they thought was erroneous, and start over. This was particularly problematic when the code that they deleted was not broken, since none of the end users kept version histories of their code.
• End users frequently introduced errors because of some false assumption, and after testing their program and believing it had succeeded, also believed that their false assumption was confirmed, leading to further errors due to the same assumption. For example, when using Flash, end users frequently had animations that looked quite similar. When they created code to go from one animation to another, but using incorrect parameters, when testing, they often believed that the code worked because the animation looked similar. They then continued to use the incorrect parameters in other code.
These situations, being quite common, suggest that if end-user programming systems can prevent a single type of error, they may actually be preventing a whole class of potential errors. Further research is necessary to determine what types these might be.
7. What To Do? All of our studies’ findings, combined with the decades of research on the psychology of programming [9], suggest that programming requires an acute attention to detail—something which is in direct opposition to decades of research on human error [10] that suggests that people are optimized for making decisions that are merely “good enough” for the current situation.
As programming system designers, what can we do about this? We certainly cannot change human nature. While software engineers are trained to suppress their human nature by being thorough, planning ahead, and using process and methodology to their advantage, we can make no such assumptions about end user programmers. Most end users will learn just enough about a tool to support their primary task, and would not even think to use a process—they have their own processes in their primary work activities to worry about. We can, however, change the programming systems that end users interact with. To start, we can design programming systems that help end-user programmers attend to “important” details. Otherwise, they will be solely responsible for deciding what is important to attend to, and we know from extensive research on human error that people make biased, short-term assessments of importance. We can also minimize the time that end users have to spend on “unimportant” details by having the programming system do any work that the programmer need not be involved in. For example, if at some point the programmer will have to find all of the valid method calls for an object, have the computer do the searching for them, since it is much more objective and thorough than the end user.
The next obvious question is, what are the “important” details? In some sense, only the end-user programmer knows what is important, since they are the only ones who understand what they want their program to do. As programming system designers, then, one way to assess the “importance” of some detail is to determine the degree to which it minimizes the influence of end-user programmers’ own biases on their decisions. By minimizing this influence, we may maximize end-user programmers’ ability to achieve the goals they intend to achieve, were it not for their inherent subjectivity.
6 4
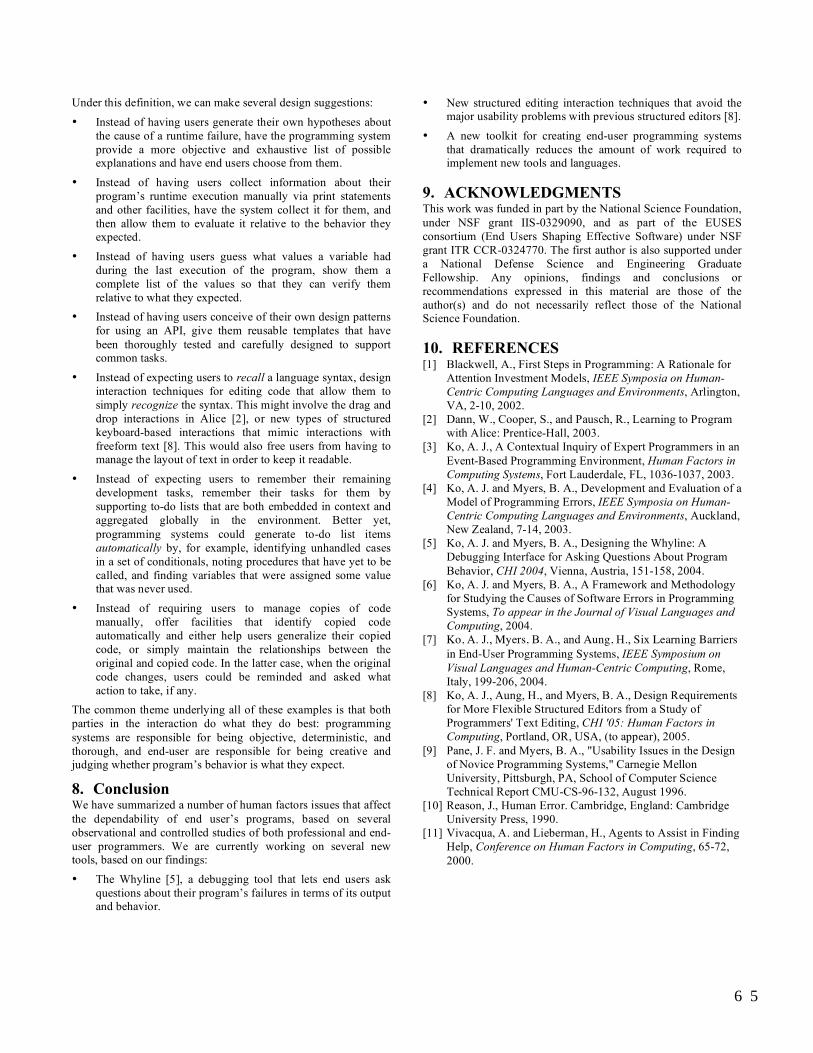
Under this definition, we can make several design suggestions:
• Instead of having users generate their own hypotheses about the cause of a runtime failure, have the programming system provide a more objective and exhaustive list of possible explanations and have end users choose from them.
• Instead of having users collect information about their program’s runtime execution manually via print statements and other facilities, have the system collect it for them, and then allow them to evaluate it relative to the behavior they expected.
• Instead of having users guess what values a variable had during the last execution of the program, show them a complete list of the values so that they can verify them relative to what they expected.
• Instead of having users conceive of their own design patterns for using an API, give them reusable templates that have been thoroughly tested and carefully designed to support common tasks.
• Instead of expecting users to recall a language syntax, design interaction techniques for editing code that allow them to simply recognize the syntax. This might involve the drag and drop interactions in Alice [2], or new types of structured keyboard-based interactions that mimic interactions with freeform text [8]. This would also free users from having to manage the layout of text in order to keep it readable.
• Instead of expecting users to remember their remaining development tasks, remember their tasks for them by supporting to-do lists that are both embedded in context and aggregated globally in the environment. Better yet, programming systems could generate to-do list items automatically by, for example, identifying unhandled cases in a set of conditionals, noting procedures that have yet to be called, and finding variables that were assigned some value that was never used.
• Instead of requiring users to manage copies of code manually, offer facilities that identify copied code automatically and either help users generalize their copied code, or simply maintain the relationships between the original and copied code. In the latter case, when the original code changes, users could be reminded and asked what action to take, if any.
The common theme underlying all of these examples is that both parties in the interaction do what they do best: programming systems are responsible for being objective, deterministic, and thorough, and end-user are responsible for being creative and judging whether program’s behavior is what they expect.
8. Conclusion We have summarized a number of human factors issues that affect the dependability of end user’s programs, based on several observational and controlled studies of both professional and end-user programmers. We are currently working on several new tools, based on our findings:
• The Whyline [5], a debugging tool that lets end users ask questions about their program’s failures in terms of its output and behavior.
• New structured editing interaction techniques that avoid the major usability problems with previous structured editors [8].
• A new toolkit for creating end-user programming systems that dramatically reduces the amount of work required to implement new tools and languages.
9. ACKNOWLEDGMENTS This work was funded in part by the National Science Foundation, under NSF grant IIS-0329090, and as part of the EUSES consortium (End Users Shaping Effective Software) under NSF grant ITR CCR-0324770. The first author is also supported under a National Defense Science and Engineering Graduate Fellowship. Any opinions, findings and conclusions or recommendations expressed in this material are those of the author(s) and do not necessarily reflect those of the National Science Foundation.
10. REFERENCES [1] Blackwell, A., First Steps in Programming: A Rationale for
Attention Investment Models, IEEE Symposia on Human-Centric Computing Languages and Environments, Arlington, VA, 2-10, 2002.
[2] Dann, W., Cooper, S., and Pausch, R., Learning to Program with Alice: Prentice-Hall, 2003.
[3] Ko, A. J., A Contextual Inquiry of Expert Programmers in an Event-Based Programming Environment, Human Factors in Computing Systems, Fort Lauderdale, FL, 1036-1037, 2003.
[4] Ko, A. J. and Myers, B. A., Development and Evaluation of a Model of Programming Errors, IEEE Symposia on Human-Centric Computing Languages and Environments, Auckland, New Zealand, 7-14, 2003.
[5] Ko, A. J. and Myers, B. A., Designing the Whyline: A Debugging Interface for Asking Questions About Program Behavior, CHI 2004, Vienna, Austria, 151-158, 2004.
[6] Ko, A. J. and Myers, B. A., A Framework and Methodology for Studying the Causes of Software Errors in Programming Systems, To appear in the Journal of Visual Languages and Computing, 2004.
[7] Ko, A. J., Myers, B. A., and Aung, H., Six Learning Barriers in End-User Programming Systems, IEEE Symposium on Visual Languages and Human-Centric Computing, Rome, Italy, 199-206, 2004.
[8] Ko, A. J., Aung, H., and Myers, B. A., Design Requirements for More Flexible Structured Editors from a Study of Programmers' Text Editing, CHI '05: Human Factors in Computing, Portland, OR, USA, (to appear), 2005.
[9] Pane, J. F. and Myers, B. A., "Usability Issues in the Design of Novice Programming Systems," Carnegie Mellon University, Pittsburgh, PA, School of Computer Science Technical Report CMU-CS-96-132, August 1996.
[10] Reason, J., Human Error. Cambridge, England: Cambridge University Press, 1990.
[11] Vivacqua, A. and Lieberman, H., Agents to Assist in Finding Help, Conference on Human Factors in Computing, 65-72, 2000.
6 5

Related Documents